Embed Size (px)
Citation preview

Jointly published by Elsevier Science Ltd, Oxford
and Akad~miai Kiad6, Budapest
Scientometrics,
Vol. 36, No. 1 (1996) 97-107
A V E R A G E A N D G L O B A L I M P A C T O F A S E T O F J O U R N A L S
L. EGGHE, R. ROUSSEAU
Limburgs Universitair Centrum (LUC), Universitaire Campus, B-3590, Diepenbeek (Belgium) and
Informatie- en Bibliotheekwetenschap, Universitaire Instelling Antwerpen (UIA), Universiteitsplein 1, B-2610 Wilrijk (Belgium)
(Received January 22, 1996)
In this note we clarify some notions concerning citations, publications, and their quotients: impact and indifference (a measure of invisibility, introduced in this article). In particular, we show that the slope of the regression line of the impact as a function of the number of publications is positive if and only if the global impact, i.e. the impact of the set of all journals under consideration, is larger than the average impact of all journals.
Introduction: average and global impact
The Science Citation Index/Journal Citation Reports | (SCI/JCR) and the Social
Science Citation Index/Journal Citation Reports | (SSCI/JCR) classify covered
journals into subject categories. Part IV of the JCR | gives a listing of journals ranked
by impact factor within category. Using these lists, it is not difficult to compute the
average impact factor of ISI-journals of a subject category. Yet, it is of more importance to know the impact factor of a whole subject category, i.e. the global impact factor. Indeed, a comparison between the observed impact and the average
impact of those subcategories in which a research group is active, is one of the most
representative indicators in the evaluation of research groups [1], [2]. If every journal would publish the same number of articles the average impact factor would clearly be
the same as the global impact factor. Yet, in [3], see also [4], we have shown that this
is usually not the,case. Indeed, [4] is, to the best of our knowledge, the first article
which expl~'citly drew attention to the difference between the average impact factor of a subfield and its global impact factor.
Furtheron in this article we will use the notions 'subfied' and ' impact' in a general
sense. Subfields do not have to coincide with subcategories of the JCR | (although, of
course, this is one of the important applications) and the impact is not necessarily the
'official' Garfield impact factor. It could as well be a generalized impact factor in the sense of [5], [6]. So, by the term ' impact ' , denoted as I, we will mean the quotient of
0138-9130/96/US $15. O0 Copyright �9 1996 Akad~miai Kiad6, Budapest
All rights reserved

L. EGGHE, R. ROUSSEAU: IMPACT OF A SET OF JOURNALS
a number of citations, denoted as C, by the corresponding number of publications, denoted as P (over a well-def'med period). If we want to stress the fact that citations are a function of publications, we write C(P), and similarly for the impact:
C(P) I(P) = - - (1)
P
Note that C(P) is an increasing function of P. The set of all journals under consideration (the 'subfield ') is called a meta-journal [3], [5]. The impact of the i-th journal of this recta-journal is then denoted as I i. The average impact factor, denoted as AIF, of a meta-journal consisting of n journals is defined as:
n l+Ci =lZl i (2) AIF = n ~=l Pi n i : x
The global impact factor of this same meta-journal, denoted as GIF, is then defined as"
n
G I F - ~]i=I ci _ ~'l'c
where ~t C is the average number of citations:
(3)
" C E i = I i ~t c = (4)
n
and ~p is the average number of publications:
n ~p : E i= I P/ (5)
n
Finally, the ratio GIF/AIF will be denoted as p:
GIF = p (6)
A1F
The relation between p -- GIF/AIF and the number of published articles per journal
In [3] we stated that if journals that publish a lot of articles have a larger impact than those which publish little, than the ratio GIF/AIF of the meta-journal must be
98 Scienwmetrics 36 (1996)

L. EGGHE, R. ROUSSEAU: IMPACT OF A SET OF JOURNALS
larger than 1 (this is case II in [3]). Against the hypothesi s that journals that publish a lot have the highest impact, we placed the opposite hypothesis that selectively publishing journals - in the sense that these journals publish little - have the highest impact. A consequence of this second hypothesis is that the ratio GIF/AIF would be smaller than one (case I in [3]). In [3] we showed that in practice GIF/AIF is usually larger than one. We did not formally prove these assertions, but only made them plausible, based on an artificial example ([3], Tables 1 and 2). We will next formally prove these implications.
Theorem 1 (/) I f l(P) is decreasing in P, .then 9 < 1. (ii) If l(P) is increasing in P, then 19 > 1.
Proof. (i) We have to show that 19 < 1, or GIF < AIF. Now,
AIF--GIF : ~ I Ci n Ci (7)
or,
tl �9
A1F- GIF = ~_~ -C-i- i ~ l Pt
where we pu~
1 P, n z--~j=l /
Consequently,
tl
A I F - GIF = ~ liot ~ i=1
with
1, =c , /P ,
J = l
(8)
(9)
(10)
(11)
Scientometrics 36 (1996) 99

L. EGGHE, R. ROUSSEAU: IMPACT OF A SET OF JOURNALS
Note that ~-"7=lc~i = 0 . Now, we put K 1 = {i:cr i > 0} and K 2 = {i:a i <_ 0}. Then,
we see that for all i ~ K 1 and a l l j ~ K2:
P~ < P: (12)
and hence, as I is decreasing in P:
I i > l j (13)
Fu r the r,
n
o--Z-,-- Z-,+Z-j i=1 iEK I j e g 2
(14)
= Z ~i - E ~j (15) ieK I jeK 2
This yields:
n
Z li(gi ~" Z Iio~i + Z I jo~j ( 1 6 ) i=1 ieK l j eK 2
> y ~ ( m i n ~ ) a i - ~ (maxlj) aj by (13) ieK 1 ieK1 j~K 2 jeK2
j~K2 i j~K 2
(17)
(18)
Hence
n
Z l i o L i > 0 (19) i=1
or: A I F > G I F ( 2 0 )
The proof of part (ii) is completely analogous to that of part (i) and is omitted. Note that if I(P) is constant, 19 = 1.
Of course, the inverse relations do not hold. It is quite possible that 19 > 1 and that for the meta-journal under consideration, I(P) is not increasing in P. We present an example of this situation in Table 1.
100 Scientometrics 36 (1996)

L. EGGHE, R. ROUSSEAU: IMPACT OF A SET OF JOURNALS
Table 1
An example where 9 > 1, but I(P) is not increasing in P
J P C I
J1 2 2 1
J2 3 18 6
J3 4 8 2
J4 5 20 4
AIF = 3.25
14 48
J: journals of meta-journal P: number of published articles C: number of citations I: impact = C/P
The next section sheds some more light on this.
3.43 = GIF
The relation between P = G I F / A I F and the slope of the regression line of I (P) over P
In [3] we have informally checked the fact that I(P) is in real situations generally
increasing in P, by calculating the regression line of I(P) over P. Now, we will show that an increasing regression line is equivalent with p > 1, and conversely, p < 1 is
equivalent with a decreasing regression line. We first note the following interesting relations.
Definition
We denote the relative share of the citations of the i-th journal with respect to the average number of citations in the meta-journal as
= c,. ( 2 1 ) gc
Similarly, we define the relative share of the publications in the i-th journal with respect to the average number of publications of the meta-journal as
~* = ~ (22) btv
Scientometrics 36 (1996) 101

L, EGGHE, R. ROUSSEAU: IMPACT OF A SET OF JOURNALS
Proposition 1
I _ A I F I~C___ i p ~ n ~ P/* (23)
i.e. 1/p is the average of the distribution {Ci*/Pi*; i = 1 ..... n,} The simple proof is left to the reader. The following result shows that whether or not p is larger than one, is completely
determined by the slope of the regression line of I(P) over P.
Theorem 2 I f rp denotes the slope of the regression line of I(P) over P, then
r e > 0 <:~ p > 1 (24)
and also:
r e = 0 r 13 : 1 (25)
Proof. We will only show (24).
9 > 1 (26)
<=> < n . - - ~tc (27) i=l li ~tp
On the other hand, the slope rp, of the regression line of I(P) over P is larger than 0
<=> n~-'~ P/. C--2/- / ~-'~ ~ ] / ~-" C/] > 0 (28) t.;:, 97,.)
see e.g. ([7], p. 66)
r ~t c > ~t l " n ~= l Pi (29)
~ G ~ac r ~ - - < n . - - (30) i=l P/ ~.p
QED This result yields a new, and independent, proof of Theorem 1
102 Scientometrics 36 (1996)

L. EGGHE, R. ROUSSEAU: IMPACT OF A SET OF JOURNALS
Corol lary 1 (i) I f l(P) is decreasing in P, then p < 1 Oi) I f l(P) is increasing in P, then p > 1
Proof. (i) If I(P) is decreasing in P, and if we take any finite set of points (at least two!)
on the graph of I(P), we have a decreasing scatterplot, i.e. a set of points (xi, Yi) such
that x i < xj ~ Yi > Yj. It is now obvious, although not easy to prove (see Appendix), that a linear regression line through these points has a negative slope. By the previous
theorem we conclude that p < 1. The proof of (ii) follows in a similar way.
Indifference
Definition
In the same way as the impact factor is a measure of visibility, we define its
opposite, called indifference and denoted as D, as a measure o f invisibility. We call this variable 'indifference' because for fixed P, it becomes larger with smaller C (D is
even infinite for C = 0), hence the more the scientific community reacts to a
publication with indifference the larger D. This explains its name. (A referee suggested
to use the name ' tcapmi' as a more neutral term.) Formally:
1 P(C) D(C) - - (31)
I C
Indifference is a trivial notion for a single journal, as it is just the reciprocal of the
impact. However, as the reciprocal of a sum is not the sum of the reciprocals, D is not
a trivial notion for a meta-journal. Note also that if C is a monotone function of P -
which is a natural condition - then P is also a monotone function of C.
Indifference factor of a meta-journal
The average indifference factor, denoted as ADF, of a meta-journal is defined as:
is A D F = -- Pi n i = l C i
and the global indifference factor defined as:
(32)
of this same meta-journal, denoted as GDF, is
Scientometrics 36 (1996) 103
L. EGGHE, R. ROUSSEAU: IMPACT OF A SET OF JOURNALS
Goe-- Zi , e, _ -
n
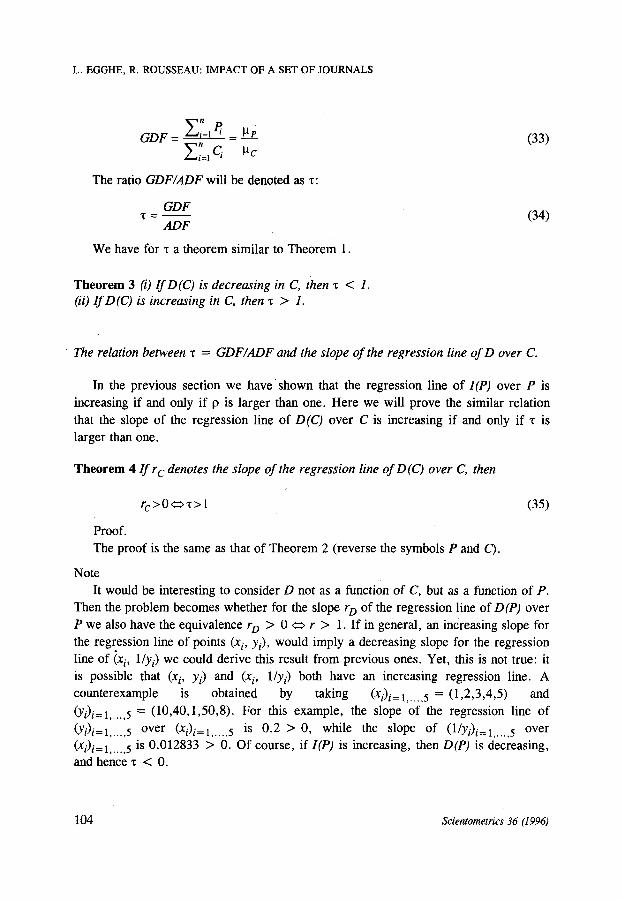
The ratio GDF/ADF will be denoted as x:
(33)
GDF x - (34)
ADF
We have for x a theorem similar to Theorem 1.
Theorem 3 (i) I f D(C) is decreasing in C, then x < 1. (ii) I f D(C) is increasing in C, then x > 1.
The relation between x = GDF/ADF and the slope of the regression line of D over C.
In the previous section we h a v e s h o w n that the regression line of I(P) over P is
increasing if and only if 9 is larger than one. Here we will prove the similar relation
that the slope of the regression line of D(C) over C is increasing if and only if x is
larger than one.
Theorem 4 l f r c denotes the slope of the regression line of D(C) over C, then
rc >O<=> x > l (35)
Proof.
The proof is the same as that of Theorem 2 (reverse the symbols P and C).
Note
It would be interesting to consider D not as a function of C, but as a function of P.
Then the problem becomes whether for the slope r D of the regression line of D(P) over
P we also have the equivalence r D > 0 <:::> r > 1. If in general, an increasing slope for
the regression line of points (x i, Yi), would imply a decreasing slope for the regression
line of (x i, 1/Yi) we could derive this result from previous ones. Yet, this is not true: it
is possible that (xi, Yi) and (x i, I/Yi) both have an increasing regression line. A
counterexample is obtained by taking (Xi)i= 1 . . . . . 5 = (1,2,3,4,5) and
( Y i ) i = I . . . . . 5 = (10,40,1,50,8). For this example, the slope of the regression line of
( Y i ) i = I . . . . . 5 o v e r (xi)i= 1 . . . . . 5 is 0.2 > 0, while the slope of (1/Yi)i= 1 . . . . . 5 over (xi)i=l ..... 5 is 0.012833 > 0. Of course, if I(P) is increasing, then D(P) is decreasing, and hence x < 0.
104 Scientometrics 36 (1996)

L. EGGHE, R. ROUSSEAU: IMPACT OF A SET OF JOURNALS
Conclusion
In this note we have clarified some notions concerning citations, publications, and their quotients: impact and indifference. In particular, we have shown that the slope of the regression line of the impact as a function of the number of publications is positive if and only if the global impact, i.e. the impact of the meta-journal is larger than the average impact of all journals of which the meta-journal consists. Considered from a mathematical point of view, this is a result on the relation between a simple arithmetic mean and a weighted arithmetic mean. Further, we have introduced the notion of indifference as an opposite of impact and have derived some results about this new parameter. We have continued our investigations of these notions in [8].
References
1. R. E. DE BRUIN, H. F. MOED, E. SPRUYT, Antwerpse analyses. Rapport ten behoeve van de bestuursorganen van de Universiteit Antwerpen (1993).
2. R. ROUSSEAU, A scientometric study of the scientific publications of LUC. Report, 1995. 3. R. ROUSSEAU, G. VAN HOOYDONK, Journal production and journal impact factors. Journal of the
American Society for Information Science (to appear: 1996). 4. G. VAN HOOYDONK, R. GEVAERT, G. MILIS-PROOST, H. VAN DE SOMPEL, K. DEBACKERE, A
bibliotheconomic analysis of, the impact factors of scientific disciplines, Scientometrics, 30 (1994) 65 -81.
5. R. ROUSSEAU, Citation distribution of pure mathematics journals. In: Informetrics 87/88, L. EGGHE, R. ROUSSEAU, rEds), Amsterdam, Elsevier, 1988, 249-262.
6. R. ROUSSEAU, A note on maximum impact factors. In: Information as a Global Commodi~. Communication, Processing and Use, CAIS/ACSI '93, 21st Annual Conference, 11--14 July 1993, 120-125.
7. L. EGGHE, R. ROUSSEAU, Introduction to lnformetrics. Quantitative Methods in Library, Documentation and Information Science, Elsevier, Amsterdam, 1990.
8. L. EGGHE, R. ROUSSEAU, Averaging and globalizing quotients of informetric and scientometric data, Journal of Information Science, 22 (1996) 165-170.
9. W. H. PRESS, B. P. FLANNERY, S. A. TEUKOLSKY, W. T. VE'ITERLING, Numerical Recipes, Cambridge University Press, Cambridge (UK), 1986.
Scientometrics 36 (1996) 105

L. EGGHE, R. ROUSS~U: IMPACT OF A SET OF JOURNALS
A p p e n d i x
In this appendix we will show that if w e fit - in the least squares sense - a
polynomial of the form bxP+a through an increasing scatterplot, i.e. a set of points
(xt, Yi) such thai x i < xj ~ Yi < Yj, then the coefficient b is positive. Similarly, if the scatterplot is decreasing, the b is negative.
Theorem 5 Given an increasing scatterplot (xi, Yi), i = I ..... n, then the coefficient b of a best fitting shifled power function of the form bxP +a, p > O, is positive.
Proof.
We have to solve, the overdetermined system of equations bxfl+a = Yi; i = 1 .. . . . n in the least squares sense. Recall that an overdetermined system of equations is defined as one having more linearly independent equations than unknowns. It can not be solved in the regular sense, but has a unique solution in the least squares sense. If A denotes the (n,2)-matrix, with the xfl in the first column and a constant second column equal to 1, then this system can be rewritten as AB = Y, where B denotes the vector of unknowns (b a) t and Y is the vector of the yi s. It is well known (see e.g. [9], p. 510) that the unknowns b and a can be found by solving the normal equations AtAB = Aty. Here AtA is the (2,2)-matrix:
and Aty is the (2,1)-colurnn vector:
[ ~xiPYi]
2 Y i )
Then, using Cramer 's rule, we find:
b=
2 xPYi ~",Yi ~n XiP
Ex/ ' Exr ~-~X//' n I
(36)
106 Scientometrics 36 (1996)

L. EGGHE, R. ROUSSEAU: IMPACT OF A SETOF JOURNALS
We will next show that the denominator and the numerator are positive,/,~of,that b > 0. The denominator is positive if
n~_xe iP- (~_xF) 2 > 0 (37)
n
This follows immediately by the Cauchy-Schwarz inequality. On the other hand,
the numerator is positive if
n~" x F Yi - ( E xF ) ( E yi) > 0 (39)
Now,
n n - I n
n E x f y i = ~_,~_,(xfy i + x~yj)+ E ( x f Y i ) (40) i=1 i=1 j>i i=1
and
xi p Yi = ~_~(xFyj +xffyi)+ E(xfy,) (41) i=1 i=1 j>i i=1
Finally, as the scatterplot is increasing, this means that (xj-xi)(yj-Yi) > 0 for every i ~ j , hence also (x~ - x f ) ( y T y i) > 0 and thus: xFy i + x f y i > xfyi + x f y j . Using (40) and (41) this proves (39).
Corollary 2 Given an increasing scatterplot (x i, Yi), i = 1 . . . . . n, then the coefficient b of a best fitting regression line y = bx +a is positive.
Note that an elementary direct proof of this corollary can be given using induction on the number of points.
Remark that it easy to show, by changing the appropriate inequality signs in the previous theorem, that for a decreasing scatterplot the coefficient b of a best fitting shifted power function of the form bxP+a, p > 0, is negative.
Scientometrics 36 (1996) 107