Embed Size (px)
Citation preview
Avaya Cajun
Device Management
Supports Management Module SM-AVA1000
D e v i c e M a n a g e m e n t Page 2 A v a y a C a j u n
Copyright NoticeDocument 5107. Copyright © 2002 - present by Aprisma Management Technologies, Inc. All rights reserved worldwide. Use, duplication, or disclosure by the United States government is subject to the restrictions set forth in DFARS 252.227-7013(c)(1)(ii) and FAR 52.227-19.
Liability DisclaimerAprisma Management Technologies, Inc. (“Aprisma”) reserves the right to make changes in specifications and other information contained in this document without prior notice. In all cases, the reader should contact Aprisma to inquire if any changes have been made.The hardware, firmware, or software described in this manual is subject to change without notice.IN NO EVENT SHALL APRISMA, ITS EMPLOYEES, OFFICERS, DIRECTORS, AGENTS, OR AFFILIATES BE LIABLE FOR ANY INCIDENTAL, INDIRECT, SPECIAL, OR CONSEQUENTIAL DAMAGES WHATSOEVER (INCLUDING BUT NOT LIMITED TO LOST PROFITS) ARISING OUT OF OR RELATED TO THIS MANUAL OR THE INFORMATION CONTAINED IN IT, EVEN IF APRISMA HAS BEEN ADVISED OF, HAS KNOWN, OR SHOULD HAVE KNOWN, THE POSSIBILITY OF SUCH DAMAGES.Trademark, Service Mark, and Logo InformationSPECTRUM, IMT, and the SPECTRUM IMT/VNM logo are registered trademarks of Aprisma Management Technologies, Inc., or its affiliates. APRISMA, APRISMA MANAGEMENT TECHNOLOGIES, the APRISMA MANAGEMENT TECHNOLOGIES logo, MANAGE WHAT MATTERS, DCM, VNM, SpectroGRAPH, SpectroSERVER, Inductive Modeling Technology, Device Communications Manager, SPECTRUM Security Manager, and Virtual Network Machine are unregistered trademarks of Aprisma Management Technologies, Inc., or its affiliates. For a complete list of Aprisma trademarks, service marks, and trade names, go tohttp://www.aprisma.com/manuals/trademark-list.htm.All referenced trademarks, service marks, and trade names identified in this document, whether registered or unregistered, are the intellectual property of their respective owners. No rights are granted by Aprisma Management Technologies, Inc., to use such marks, whether by implication, estoppel, or otherwise. If you have comments or concerns
about trademark or copyright references, please send an e-mail to [email protected]; we will do our best to help.Restricted Rights Notice(Applicable to licenses to the United States government only.)
This software and/or user documentation is/are provided with RESTRICTED AND LIMITED RIGHTS. Use, duplication, or disclosure by the government is subject to restrictions as set forth in FAR 52.227-14 (June 1987) Alternate III(g)(3) (June 1987), FAR 52.227-19 (June 1987), or DFARS 52.227-7013(c)(1)(ii) (June 1988), and/or in similar or successor clauses in the FAR or DFARS, or in the DOD or NASA FAR Supplement, as applicable. Contractor/manufacturer is Aprisma Management Technologies, Inc. In the event the government seeks to obtain the software pursuant to standard commercial practice, this software agreement, instead of the noted regulatory clauses, shall control the terms of the government's license.
Virus DisclaimerAprisma makes no representations or warranties to the effect that the licensed software is virus-free.Aprisma has tested its software with current virus-checking technologies. However, because no antivirus system is 100 percent effective, we strongly recommend that you write-protect the licensed software and verify (with an antivirus system in which you have confidence) that the licensed software, prior to installation, is virus-free.Contact InformationAprisma Management Technologies, Inc.273 Corporate DrivePortsmouth, NH 03801Phone: 603-334-2100U.S. toll-free: 877-468-1448Web site: http://www.aprisma.com
D e v i c e M a n a g e m e n t Page 3 A v a y a C a j u n
ContentsINTRODUCTION 5
Purpose and Scope ........................................................5Required Reading ...........................................................5Supported Devices..........................................................6The SPECTRUM Model ..................................................6
TASKS 8
DEVICE VIEW 9
Interface Icons ..............................................................10Interface Icon Subviews Menu......................................11Secondary Address Panel ............................................12Chassis Device View ....................................................12Avaya Cajun Chassis Module Icon ...............................13
Module Labels ...........................................................13Module Icon Subviews Menu .............................13
Module Detail View ................................................14Environment View ..................................................14
Power Supply Table ...........................................15Temperature Table .............................................15
Module Interface Icons ..............................................16Interface Labels .........................................................16
DEVICE TOPOLOGY VIEW 17
Chassis Device Topology View.....................................18
ONLINE HELP OPTION 19
VLAN FAULT ISOLATION VIEW 20
APPLICATION VIEWS 21
Main Application View................................................... 21Supported Applications ................................................. 22
Common Applications ............................................... 22Device-Specific MIBs ................................................ 23
Lucent Prominet Application View ................................ 24Agent View ................................................................ 25
Agent Community Table..................................... 25Module Hardware View .............................................26
Module Table......................................................26Environment Views.................................................... 27
Power Systems View .............................................27Power Supply Table ...........................................27Power Control Table...........................................28
Temperature View ................................................. 28Inventory View........................................................... 29Port Management Views ...........................................30
Port Table View ..................................................... 30Port Flow Control Table View ................................ 32Port Duplex Table View ......................................... 33Port Speed Table View .......................................... 33Port Rate Limit Table View .................................... 34
C o n t e n t s C o n t e n t s
D e v i c e M a n a g e m e n t Page 4 A v a y a C a j u n
Port Pace Priority Table View ................................34Port Category Table View ......................................35Port Auto-Negotiation Table View..........................35Port Remote Fault Table View ...............................36
Buffer Table View ......................................................36Switch Management Views .......................................38
Switch Configuration View .....................................38Switch Port Table View ..........................................39Hunt Group Table View..........................................42Port Mirroring Table View ......................................43
Bridge Management Views........................................44Bridge Table View..................................................44Bridge Port Table View ..........................................46
L2 Address Management Views................................47L2 Address Table View ..........................................48L2 Address Change Table View ............................48
L2 Address Change Table..................................49L2 Address Summary Table View..........................49
VLAN Management Views.........................................50VLAN Table View...................................................503Com Mapping Table View....................................513Com VLAN Mapping Table View .........................52VTP Snooping Switch View ...................................52Virtual Switch Port Table View...............................53Virtual Module Port Table View..............................54
Event Management Views.........................................55Event Table View ...................................................55Event Log Table View ............................................55
Event Log Table .................................................56Event Shutdown Log Table View ...........................57
Event Shutdown Log Table................................ 57Event Trap Management View .............................. 58
Active Alarm Table View........................................... 60Alarm Table ....................................................... 60
PERFORMANCE VIEWS 62
CONFIGURATION VIEWS 63
Device Configuration View ........................................... 63
MODEL INFORMATION VIEW 65
INDEX 66
D e v i c e M a n a g e m e n t Page 5 A v a y a C a j u n
Introduction
This section introduces the SPECTRUM Device Management documentation for Avaya Cajun P580/882 Switch devices.
This introduction contains the following topics:
• Purpose and Scope
• Required Reading
• Supported Devices (Page 6)
• The SPECTRUM Model (Page 6)
Purpose and ScopeUse this document as a guide for managing the Avaya Cajun P580/882 Multiservice Switch devices described on Page 6 with SPECTRUM management module SM-AVA1000. This document describes the icons, menus, and views that enable you to remotely monitor, configure, and troubleshoot Avaya Cajun devices through software models in your SPECTRUM database.
Information specific to SM-AVA1000 is what is primarily included in this document. For general information about device management using SPECTRUM and explanations of SPECTRUM
functionality and navigation techniques, refer to the topics listed under Required Reading.
Required ReadingTo use this documentation effectively, you must be familiar with the information covered by the other SPECTRUM online documents listed below.
• Getting Started with SPECTRUM for Operators
• Getting Started with SPECTRUM for Administrators
• How to Manage Your Network with SPECTRUM
• SPECTRUM Views
• SPECTRUM Menus
• SPECTRUM Icons
• SPECTRUM Software Release Notice
I n t r o d u c t i o n S u p p o r t e d D e v i c e s
D e v i c e M a n a g e m e n t Page 6 A v a y a C a j u n
Supported DevicesSPECTRUM management module SM-AVA1000 currently lets you model the Avaya Cajun P580/882 that runs on NT or Unix systems. The following devices are supported:
• Avaya Cajun P580 MultiService SwitchChassis with 6 slots that accept Avaya 50-Series and 80-Series media modules. Maximum port density is 48 ports per module. Backplane capacity of 55 Gbps. Up to 288 10/100 Ethernet ports. Up to 144 fibre Fast Ethernet ports. Up to 48 full-duplex Gigabit Ethernet ports. Supports VLAN and QoS.Layer 2 Switching and Layer 3 Routing.
• Avaya Cajun P882 MultiService Switch Chassis with 16 slots that accept Avaya 50-Series and 80-Series media modules. Maximum port density is 48 ports per module. Up to 139 Gbps switching/routing performance. Up to 768 10/100 Ethernet ports. Up to 128 Gigabit Ethernet ports. Up to 384 100BASE-FX ports. Supports VLAN and QoS. Data, voice and video application capabilities.
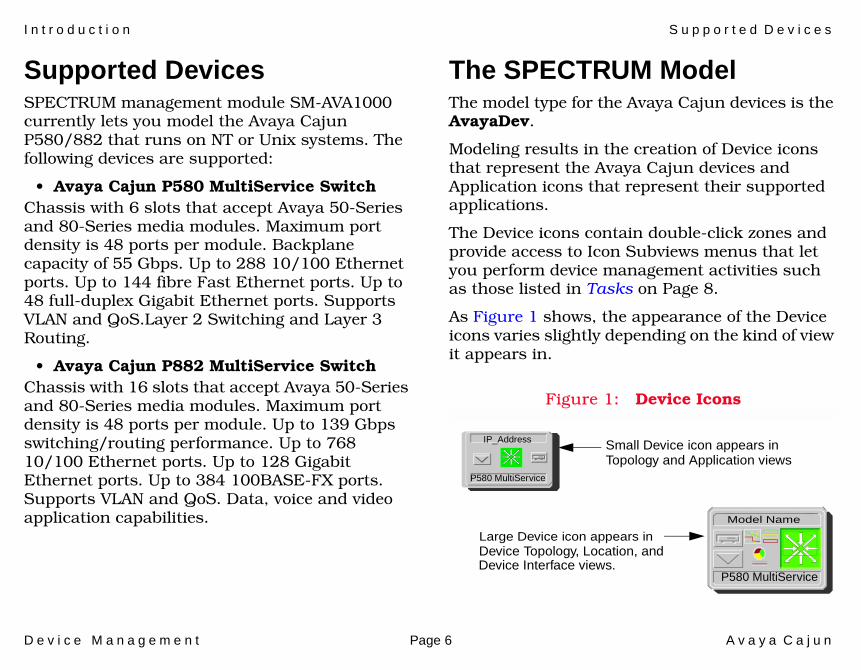
The SPECTRUM ModelThe model type for the Avaya Cajun devices is the AvayaDev.
Modeling results in the creation of Device icons that represent the Avaya Cajun devices and Application icons that represent their supported applications.
The Device icons contain double-click zones and provide access to Icon Subviews menus that let you perform device management activities such as those listed in Tasks on Page 8.
As Figure 1 shows, the appearance of the Device icons varies slightly depending on the kind of view it appears in.
Figure 1: Device Icons
Model Name
Small Device icon appears inTopology and Application views
Large Device icon appears inDevice Topology, Location, andDevice Interface views.
IP_Address
P580 MultiService
P580 MultiService
I n t r o d u c t i o n T h e S P E C T R U M M o d e l
D e v i c e M a n a g e m e n t Page 7 A v a y a C a j u n
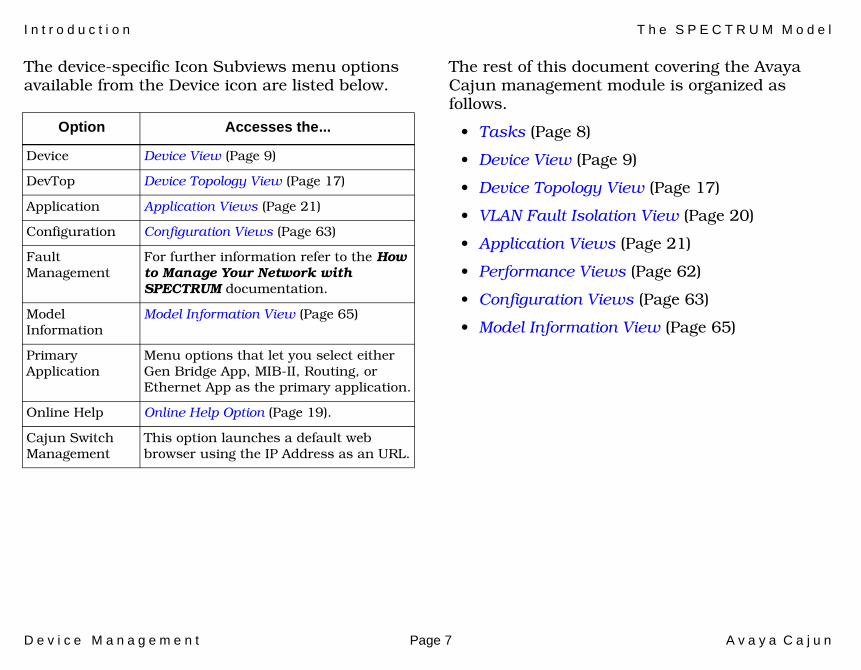
The device-specific Icon Subviews menu options available from the Device icon are listed below.
The rest of this document covering the Avaya Cajun management module is organized as follows.
• Tasks (Page 8)
• Device View (Page 9)
• Device Topology View (Page 17)
• VLAN Fault Isolation View (Page 20)
• Application Views (Page 21)
• Performance Views (Page 62)
• Configuration Views (Page 63)
• Model Information View (Page 65)
Option Accesses the...
Device Device View (Page 9)
DevTop Device Topology View (Page 17)
Application Application Views (Page 21)
Configuration Configuration Views (Page 63)
Fault Management
For further information refer to the How to Manage Your Network with SPECTRUM documentation.
Model Information
Model Information View (Page 65)
Primary Application
Menu options that let you select either Gen Bridge App, MIB-II, Routing, or Ethernet App as the primary application.
Online Help Online Help Option (Page 19).
Cajun Switch Management
This option launches a default web browser using the IP Address as an URL.
D e v i c e M a n a g e m e n t Page 8 A v a y a C a j u n
Tasks
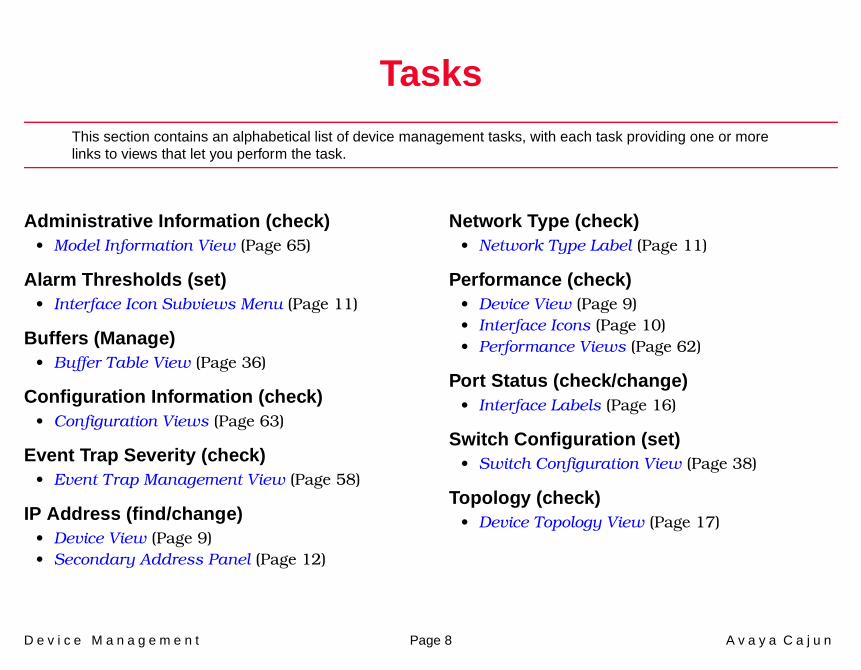
This section contains an alphabetical list of device management tasks, with each task providing one or more links to views that let you perform the task.
Administrative Information (check)• Model Information View (Page 65)
Alarm Thresholds (set)• Interface Icon Subviews Menu (Page 11)
Buffers (Manage)• Buffer Table View (Page 36)
Configuration Information (check)• Configuration Views (Page 63)
Event Trap Severity (check)• Event Trap Management View (Page 58)
IP Address (find/change)• Device View (Page 9)• Secondary Address Panel (Page 12)
Network Type (check)• Network Type Label (Page 11)
Performance (check)• Device View (Page 9)• Interface Icons (Page 10)• Performance Views (Page 62)
Port Status (check/change)• Interface Labels (Page 16)
Switch Configuration (set)• Switch Configuration View (Page 38)
Topology (check)• Device Topology View (Page 17)
D e v i c e M a n a g e m e n t Page 9 A v a y a C a j u n
Device View
This section describes the Device views and subviews available for models of Avaya Cajun P580/882 devices in SPECTRUM.
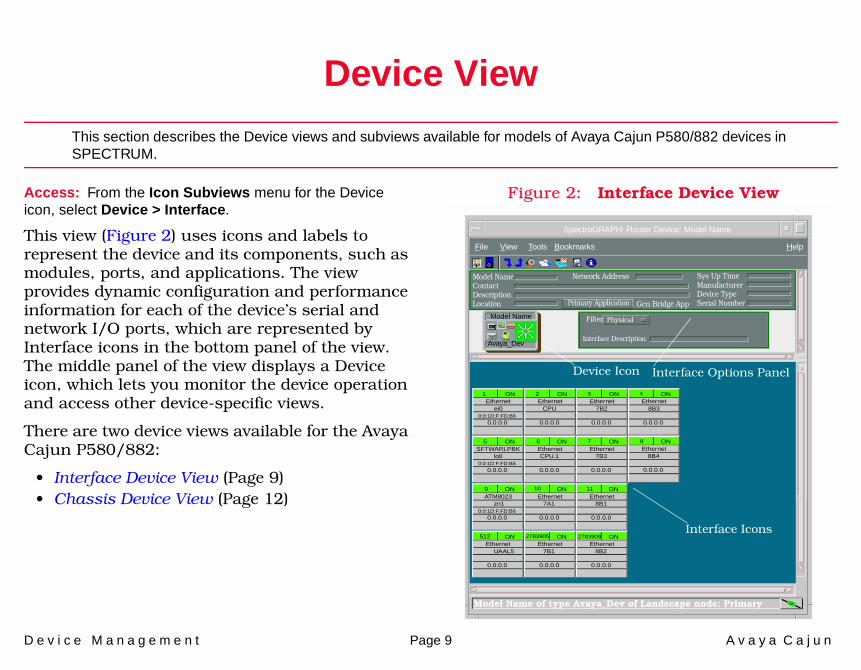
Access: From the Icon Subviews menu for the Device icon, select Device > Interface.
This view (Figure 2) uses icons and labels to represent the device and its components, such as modules, ports, and applications. The view provides dynamic configuration and performance information for each of the device’s serial and network I/O ports, which are represented by Interface icons in the bottom panel of the view. The middle panel of the view displays a Device icon, which lets you monitor the device operation and access other device-specific views.
There are two device views available for the Avaya Cajun P580/882:
• Interface Device View (Page 9)• Chassis Device View (Page 12)
Figure 2: Interface Device View
SpectroGRAPH: Router Device: Model Name
File View HelpTools
Model NameContactDescriptionLocation
Sys Up TimeManufacturerDevice TypeSerial Number
Network Address
Interface Description
Filter Physical
Interface Options PanelDevice Icon
Model Name
1Ethernet
0:0:1D:F:FD:B6
ei0
0.0.0.0
ON
5SFTWARLPBK
0:0:1D:F:FD:B6
lo0
0.0.0.0
ON
9ATM8023
0:0:1D:F:FD:B6
zn1
0.0.0.0
ON
512Ethernet
UAAL5
0.0.0.0
ON
2Ethernet
CPU
0.0.0.0
ON
6EthernetCPU.1
0.0.0.0
ON
Ethernet7A1
0.0.0.0
ON
Ethernet7B1
0.0.0.0
ON
Ethernet7B2
0.0.0.0
ON
Ethernet7B3
0.0.0.0
ON
Ethernet8B1
0.0.0.0
ON
Ethernet8B2
0.0.0.0
ON
Ethernet8B3
0.0.0.0
ON
Ethernet8B4
0.0.0.0
ON
10
2783905 2783909
11
7
3 4
8
Interface Icons
Bookmarks
Model Name of type Avaya_Dev of Landscape node: Primary
Primary Application Gen Bridge App
Avaya_Dev
D e v i c e V i e w I n t e r f a c e I c o n s
D e v i c e M a n a g e m e n t Page 10 A v a y a C a j u n
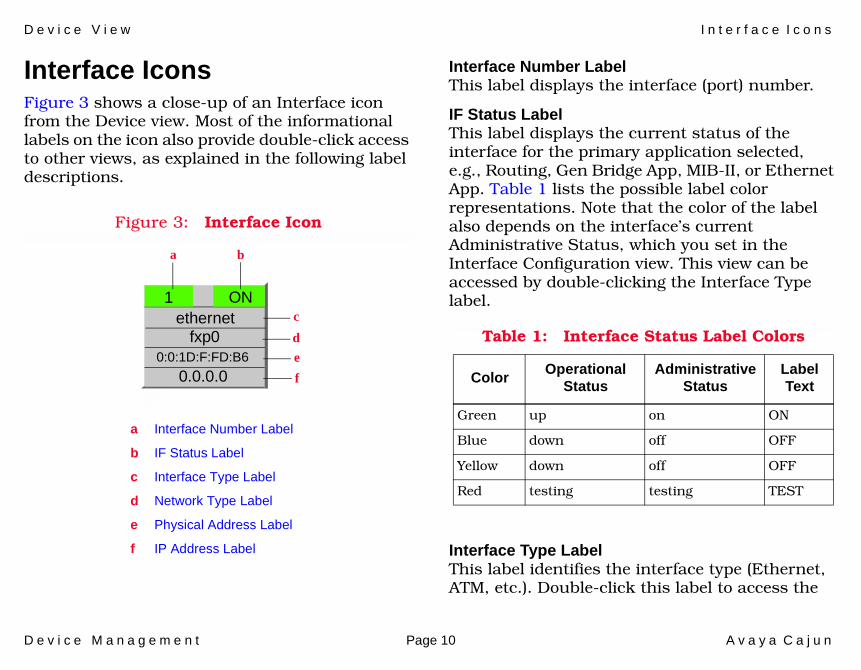
Interface IconsFigure 3 shows a close-up of an Interface icon from the Device view. Most of the informational labels on the icon also provide double-click access to other views, as explained in the following label descriptions.
Figure 3: Interface Icon
Interface Number LabelThis label displays the interface (port) number.
IF Status LabelThis label displays the current status of the interface for the primary application selected, e.g., Routing, Gen Bridge App, MIB-II, or Ethernet App. Table 1 lists the possible label color representations. Note that the color of the label also depends on the interface’s current Administrative Status, which you set in the Interface Configuration view. This view can be accessed by double-clicking the Interface Type label.
Interface Type LabelThis label identifies the interface type (Ethernet, ATM, etc.). Double-click this label to access the
c
f
b
1ethernet
0:0:1D:F:FD:B6
a
a Interface Number Label
b IF Status Label
c Interface Type Label
d Network Type Label
e Physical Address Label
f IP Address Label
fxp0
0.0.0.0
d
e
ON
Table 1: Interface Status Label Colors
Color OperationalStatus
AdministrativeStatus
LabelText
Green up on ON
Blue down off OFF
Yellow down off OFF
Red testing testing TEST
D e v i c e V i e w I n t e r f a c e I c o n S u b v i e w s M e n u
D e v i c e M a n a g e m e n t Page 11 A v a y a C a j u n
Interface Configuration view, see the SPECTRUM Views documentation.
Network Type LabelThis label identifies the type of network to which the interface is connected. Double-click the label to open the Model Information view for the interface.
Physical Address LabelThis label displays the physical (MAC) address of the interface. Double-click this label to open the Address Translation Table (AT).
IP Address LabelThis label displays the IP address for the interface. Double-click this label to open the Secondary Address Panel (Page 12), which lets you change the address and mask for the interface.
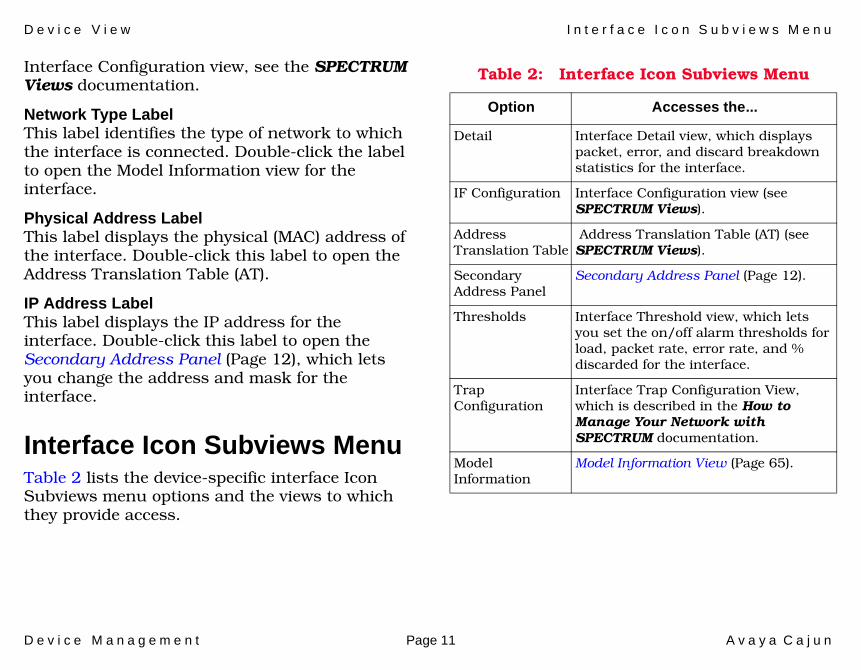
Interface Icon Subviews MenuTable 2 lists the device-specific interface Icon Subviews menu options and the views to which they provide access.
Table 2: Interface Icon Subviews Menu
Option Accesses the...
Detail Interface Detail view, which displays packet, error, and discard breakdown statistics for the interface.
IF Configuration Interface Configuration view (see SPECTRUM Views).
Address Translation Table
Address Translation Table (AT) (see SPECTRUM Views).
Secondary Address Panel
Secondary Address Panel (Page 12).
Thresholds Interface Threshold view, which lets you set the on/off alarm thresholds for load, packet rate, error rate, and % discarded for the interface.
Trap Configuration
Interface Trap Configuration View, which is described in the How to Manage Your Network with SPECTRUM documentation.
Model Information
Model Information View (Page 65).
D e v i c e V i e w S e c o n d a r y A d d r e s s P a n e l
D e v i c e M a n a g e m e n t Page 12 A v a y a C a j u n
Secondary Address PanelAccess: From the Icon Subviews menu for the Interface icon in the Device view, select Secondary Address Panel.
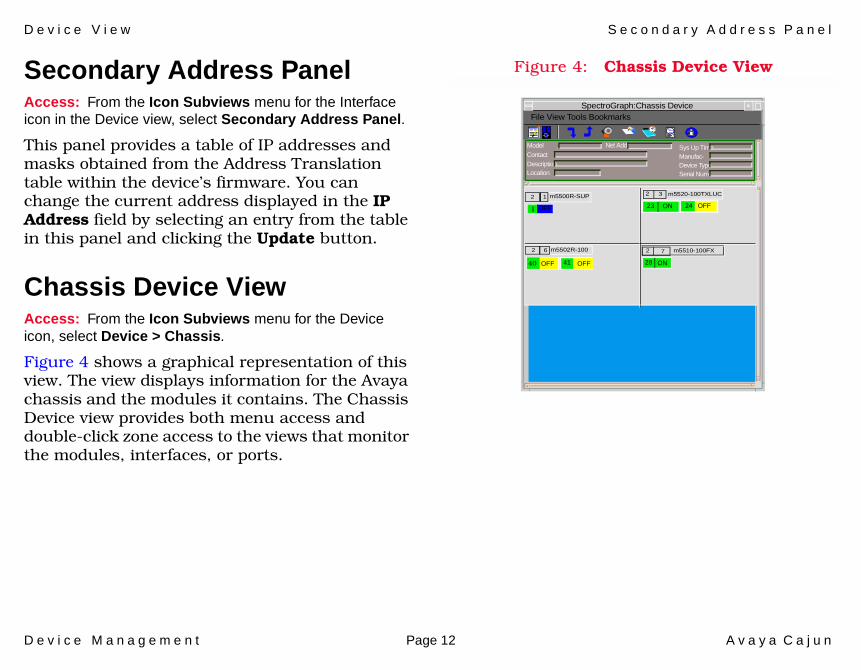
This panel provides a table of IP addresses and masks obtained from the Address Translation table within the device’s firmware. You can change the current address displayed in the IP Address field by selecting an entry from the table in this panel and clicking the Update button.
Chassis Device ViewAccess: From the Icon Subviews menu for the Device icon, select Device > Chassis.
Figure 4 shows a graphical representation of this view. The view displays information for the Avaya chassis and the modules it contains. The Chassis Device view provides both menu access and double-click zone access to the views that monitor the modules, interfaces, or ports.
Figure 4: Chassis Device View
Model ContactDescriptionLocation
Net Addr Sys Up TimeManufac-Device TypeSerial Num-
File View Tools BookmarksSpectroGraph:Chassis Device
2 1 m5500R-SUP
2 6 m5502R-100
2 3 m5520-100TXLUC
2 7 m5510-100FX
1 OFF
40 OFF 41 OFF
23 ON 24 OFF
28 ON
D e v i c e V i e w A v a y a C a j u n C h a s s i s M o d u l e I c o n
D e v i c e M a n a g e m e n t Page 13 A v a y a C a j u n
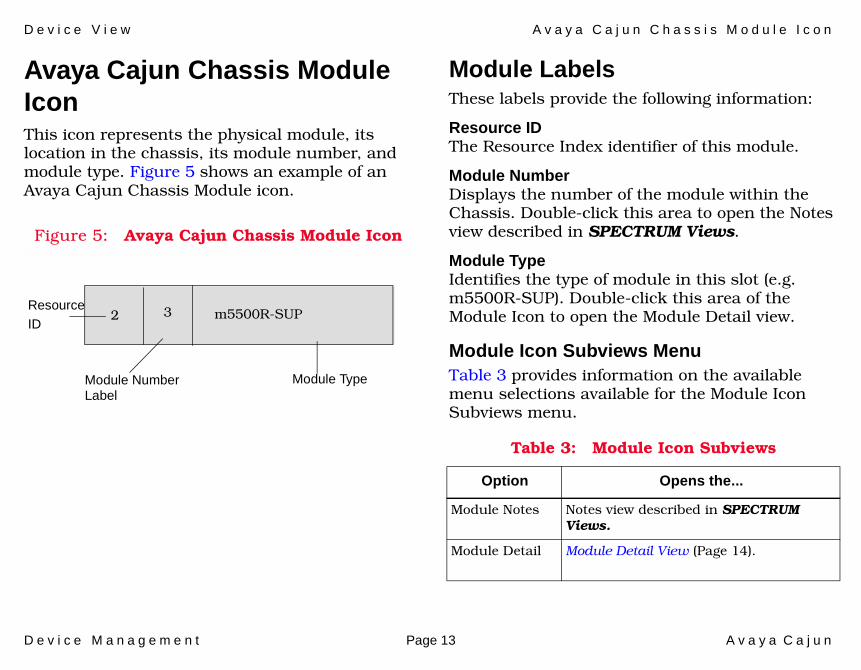
Avaya Cajun Chassis Module IconThis icon represents the physical module, its location in the chassis, its module number, and module type. Figure 5 shows an example of an Avaya Cajun Chassis Module icon.
Figure 5: Avaya Cajun Chassis Module Icon
Module LabelsThese labels provide the following information:
Resource IDThe Resource Index identifier of this module.
Module NumberDisplays the number of the module within the Chassis. Double-click this area to open the Notes view described in SPECTRUM Views.
Module Type Identifies the type of module in this slot (e.g. m5500R-SUP). Double-click this area of the Module Icon to open the Module Detail view.
Module Icon Subviews MenuTable 3 provides information on the available menu selections available for the Module Icon Subviews menu.
Module NumberLabel
2 3 m5500R-SUP
Module Type
ResourceID
Table 3: Module Icon Subviews
Option Opens the...
Module Notes Notes view described in SPECTRUM Views.
Module Detail Module Detail View (Page 14).
D e v i c e V i e w A v a y a C a j u n C h a s s i s M o d u l e I c o n
D e v i c e M a n a g e m e n t Page 14 A v a y a C a j u n
Module Detail View Access: From the Icon Subviews menu for the Module Icon, select Detail.
IndexAn index that uniquely identifies this module. This index corresponds to the Resource Index associated with module type resources.
NameA user-assignable name for this module.
TypeAn enumerated integer that is unique for each module model.
Base TypeThe base type of this module. This field is used to describe the core functions of the module. Often, base designs are derived into multiple module types which are typically just packaging variations (e.g. changing the connector types).
The value of this field corresponds to the value of Resource Base Type.
Slot WidthThe number of slots that this module occupies.
Slot OffsetThe slot offset (one based) that identifies, along with the slot width and slot location, the actual slots that this module occupies. The offset identifies which slot within the width of the module that this module reports as its slot number.
PortsThe total number of ports associated with this module.
Environment ViewAccess: From the Icon Subviews menu for the Module Icon, select Environment.
Total CapacityThe total capacity in Watts of power available currently in the system.
Total Power UsedThe total power in Watts currently being consumed in the system.
Module Hardware
Module Hardware View (Page 26).
Environment Environment View (Page 14).
Table 3: Module Icon Subviews (Continued)
Option Opens the...

D e v i c e V i e w A v a y a C a j u n C h a s s i s M o d u l e I c o n
D e v i c e M a n a g e m e n t Page 15 A v a y a C a j u n
Power Supply TableInformation in this table includes the status of the power supply and how much power this supply generates. Double-clicking on an entry in this table displays the Power Supply Detail view.
Index This index corresponds to the Resource Index of the power supply type resource.
TypeAn enumerated integer describing the type of power supply.
StatusThe status of the power supply. Okay indicates the power supply is operating properly. Faulty indicates that the power supply is not functioning properly. In this case, more information can be determined from the other power supply attributes.
Input StatusThe status of the input power feed (e.g. the AC power cord) to this power supply.
Output StatusThe status of the output power from this power supply.
Output CapacityThe total capacity of power supplied by this supply in Watts.
Temperature TableA table of information related to the temperature within the system. Double-clicking on an entry in this table displays the Temperature Detail View.
This table contains the following information.
IndexThis index corresponds to the Resource Index for temperature probe type resources.
ValueThe current temperature reading of this temperature probe in degrees Celsius.
Upper LimitThe upper temperature limit of this temperature probe in degrees Celsius.
Upper WarningThe upper temperature warning of this temperature probe in degrees Celsius.
Lower WarningThe lower temperature warning of this temperature probe in degrees Celsius.
D e v i c e V i e w A v a y a C a j u n C h a s s i s M o d u l e I c o n
D e v i c e M a n a g e m e n t Page 16 A v a y a C a j u n
Lower LimitThe lower temperature limit of this temperature probe in degrees Celsius.
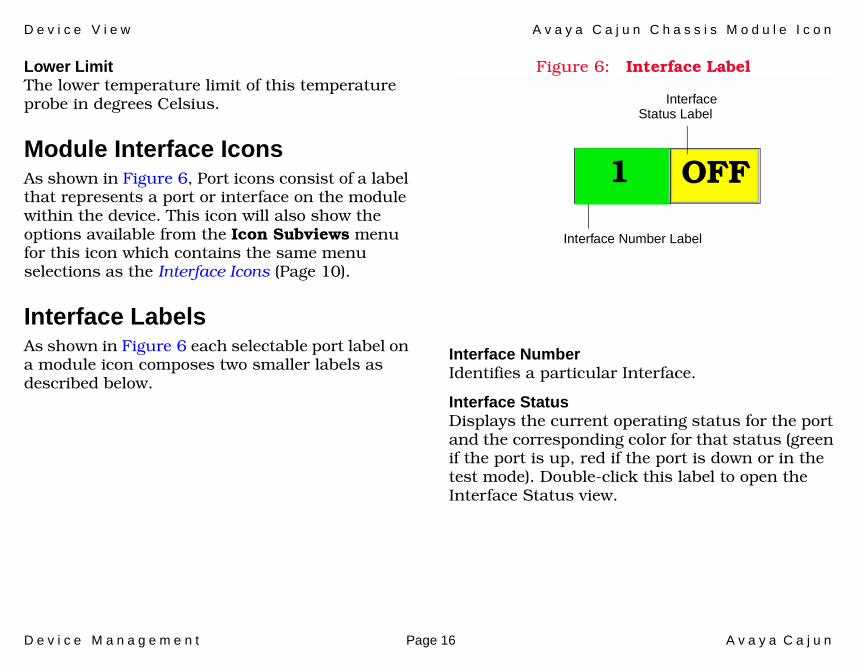
Module Interface IconsAs shown in Figure 6, Port icons consist of a label that represents a port or interface on the module within the device. This icon will also show the options available from the Icon Subviews menu for this icon which contains the same menu selections as the Interface Icons (Page 10).
Interface LabelsAs shown in Figure 6 each selectable port label on a module icon composes two smaller labels as described below.
Figure 6: Interface Label
Interface Number Identifies a particular Interface.
Interface Status Displays the current operating status for the port and the corresponding color for that status (green if the port is up, red if the port is down or in the test mode). Double-click this label to open the Interface Status view.
InterfaceStatus Label
Interface Number Label
1 OFF
D e v i c e M a n a g e m e n t Page 17 A v a y a C a j u n
Device Topology View
This section describes the Device Topology views available for models of the Avaya Cajun P580/882 devices.
Access: From the Icon Subviews menu for the Device icon, select DevTop > Interface.
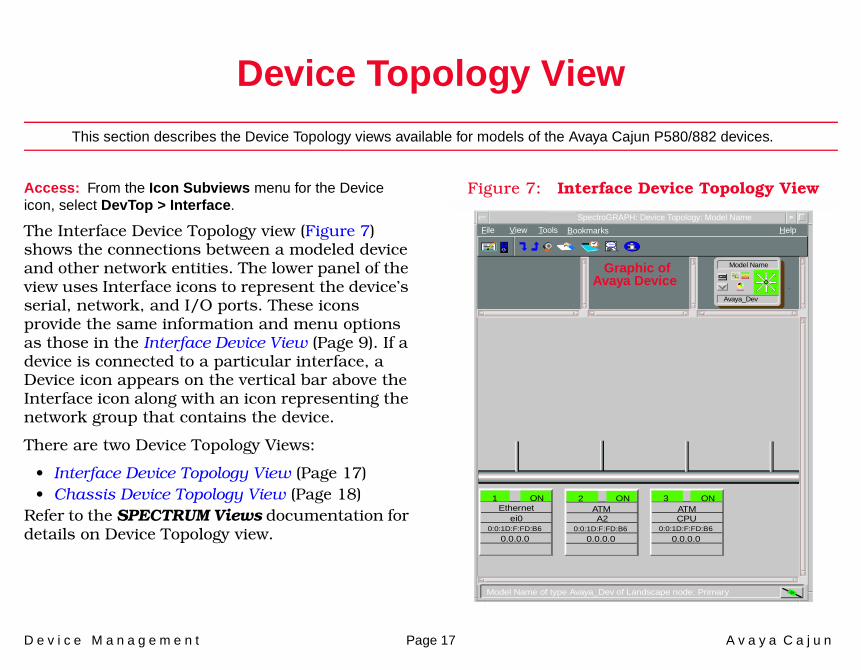
The Interface Device Topology view (Figure 7) shows the connections between a modeled device and other network entities. The lower panel of the view uses Interface icons to represent the device’s serial, network, and I/O ports. These icons provide the same information and menu options as those in the Interface Device View (Page 9). If a device is connected to a particular interface, a Device icon appears on the vertical bar above the Interface icon along with an icon representing the network group that contains the device.
There are two Device Topology Views:
• Interface Device Topology View (Page 17)• Chassis Device Topology View (Page 18)
Refer to the SPECTRUM Views documentation for details on Device Topology view.
Figure 7: Interface Device Topology View
File View HelpTools
1Ethernet
0:0:1D:F:FD:B6ei0
0.0.0.0
ON 2ATM
0:0:1D:F:FD:B6A2
0.0.0.0
ON 3ATM
0:0:1D:F:FD:B6CPU
0.0.0.0
ON
Avaya_Dev
Model Name
Bookmarks
SpectroGRAPH: Device Topology: Model Name
Graphic of Avaya Device
Model Name of type Avaya_Dev of Landscape node: Primary
D e v i c e T o p o l o g y V i e w C h a s s i s D e v i c e T o p o l o g y V i e w
D e v i c e M a n a g e m e n t Page 18 A v a y a C a j u n
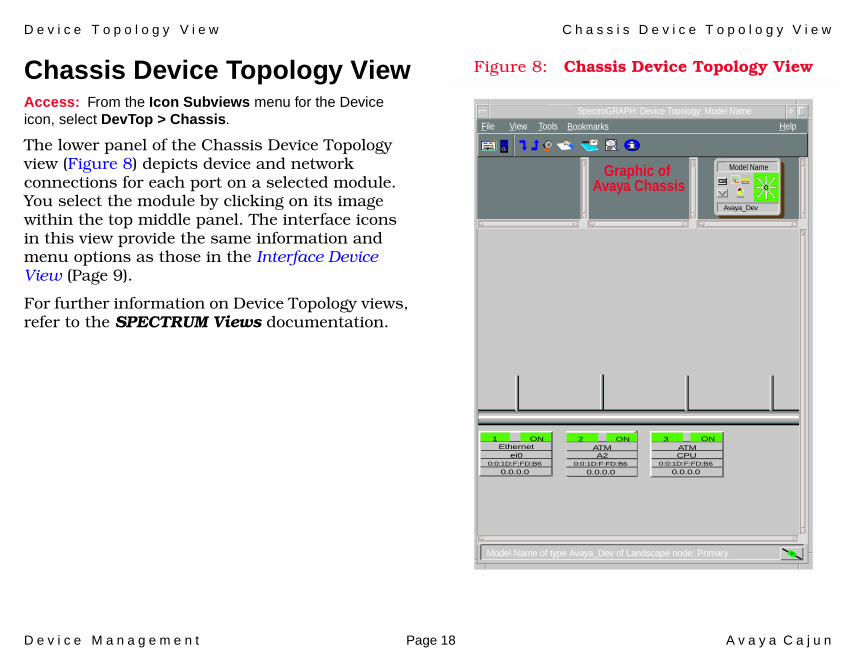
Chassis Device Topology ViewAccess: From the Icon Subviews menu for the Device icon, select DevTop > Chassis.
The lower panel of the Chassis Device Topology view (Figure 8) depicts device and network connections for each port on a selected module. You select the module by clicking on its image within the top middle panel. The interface icons in this view provide the same information and menu options as those in the Interface Device View (Page 9).
For further information on Device Topology views, refer to the SPECTRUM Views documentation.
Figure 8: Chassis Device Topology View
File View HelpTools
1Ethernet
0:0:1D:F:FD:B6ei0
0.0.0.0
ON 2ATM
0:0:1D:F:FD:B6A2
0.0.0.0
ON 3ATM
0:0:1D:F:FD:B6CPU
0.0.0.0
ON
Avaya_Dev
Model Name
Bookmarks
SpectroGRAPH: Device Topology: Model Name
Graphic of Avaya Chassis
Model Name of type Avaya_Dev of Landscape node: Primary
D e v i c e M a n a g e m e n t Page 19 A v a y a C a j u n
Online Help Option
This section describes how to activate the Avaya Online Help.
Access: From the Icon Subviews menu for the Device icon, select Online Help.
The menu selection will launch a default web browser using the URL from the Web Server URL entry in the Agent View. Do the following in order to activate this option:
1 Navigate to the Application view.
2 Right click on the LcntPromiApp Icon.
3 Select Agent Information.
4 Enter a valid URL in Web Server URL and ‘Save All Changes.’
D e v i c e M a n a g e m e n t Page 20 A v a y a C a j u n
VLAN Fault Isolation View
This section briefly describes the VLAN Fault Isolation view available for models of Avaya Cajun P580/882 devices in SPECTRUM.
Access: From within the Topology view of a LAN containing the device model, select View > VLAN List...
In order to see VLAN Fault Isolation View for the Avaya Cajun devices in SPECTRUM, you must first complete the following steps:
In $SPECROOT/SS/.vnmrc, set enable_vlan_config to TRUE.
The DataRelayClass attribute for the device must be either 2 or 4. In some cases, you must manually set this attribute.
Model the device within a LAN.
For more information about the VLAN Fault Isolation View, see the VLAN Management User Guide.
D e v i c e M a n a g e m e n t Page 21 A v a y a C a j u n
Application Views
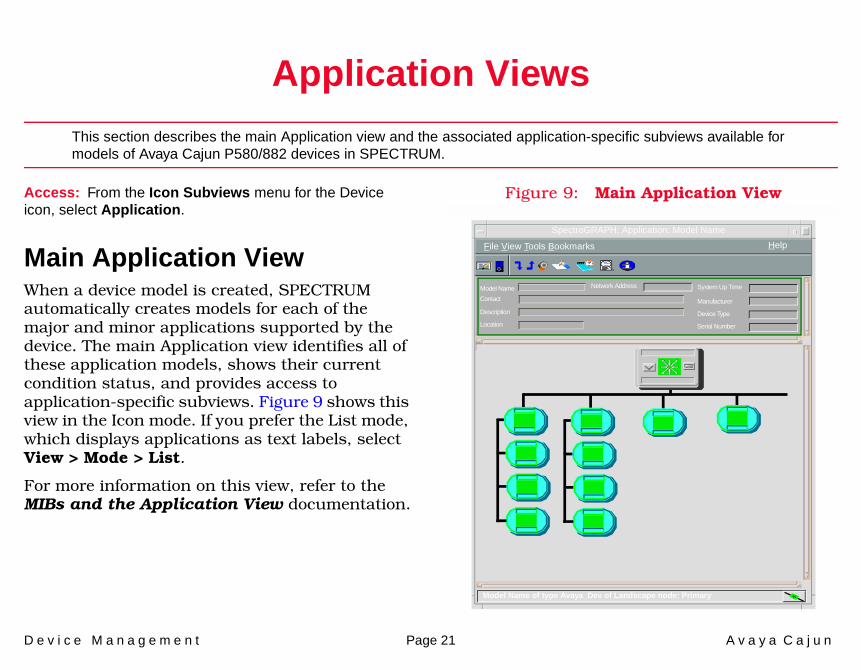
This section describes the main Application view and the associated application-specific subviews available for models of Avaya Cajun P580/882 devices in SPECTRUM.
Access: From the Icon Subviews menu for the Device icon, select Application.
Main Application ViewWhen a device model is created, SPECTRUM automatically creates models for each of the major and minor applications supported by the device. The main Application view identifies all of these application models, shows their current condition status, and provides access to application-specific subviews. Figure 9 shows this view in the Icon mode. If you prefer the List mode, which displays applications as text labels, select View > Mode > List.
For more information on this view, refer to the MIBs and the Application View documentation.
Figure 9: Main Application View
SpectroGRAPH: Application: Model Name
Model Name
Contact
Description
Location
Network Address System Up Time
Manufacturer
Device Type
Serial Number
Model Name
6E132_25
Model Name
Empire_UnixAp
File View Tools Bookmarks
Model Name of type Avaya_Dev of Landscape node: Primary
Help
A p p l i c a t i o n V i e w s S u p p o r t e d A p p l i c a t i o n s
D e v i c e M a n a g e m e n t Page 22 A v a y a C a j u n
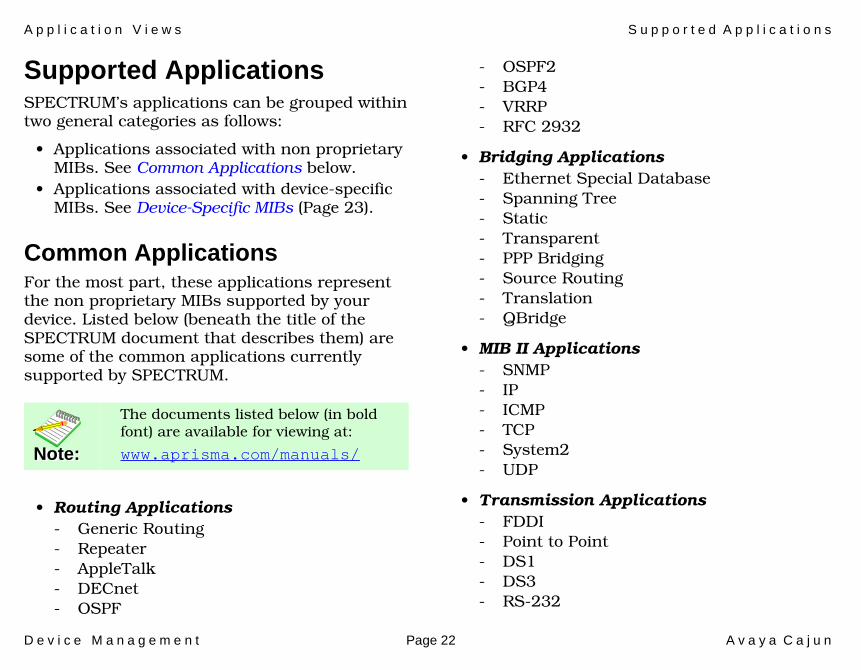
Supported ApplicationsSPECTRUM’s applications can be grouped within two general categories as follows:
• Applications associated with non proprietary MIBs. See Common Applications below.
• Applications associated with device-specific MIBs. See Device-Specific MIBs (Page 23).
Common ApplicationsFor the most part, these applications represent the non proprietary MIBs supported by your device. Listed below (beneath the title of the SPECTRUM document that describes them) are some of the common applications currently supported by SPECTRUM.
• Routing Applications- Generic Routing- Repeater- AppleTalk- DECnet- OSPF
- OSPF2- BGP4- VRRP- RFC 2932
• Bridging Applications- Ethernet Special Database- Spanning Tree- Static- Transparent- PPP Bridging- Source Routing- Translation- QBridge
• MIB II Applications- SNMP- IP- ICMP- TCP- System2- UDP
• Transmission Applications- FDDI- Point to Point- DS1- DS3- RS-232
Note:Note:
The documents listed below (in bold font) are available for viewing at:
www.aprisma.com/manuals/
A p p l i c a t i o n V i e w s S u p p o r t e d A p p l i c a t i o n s
D e v i c e M a n a g e m e n t Page 23 A v a y a C a j u n
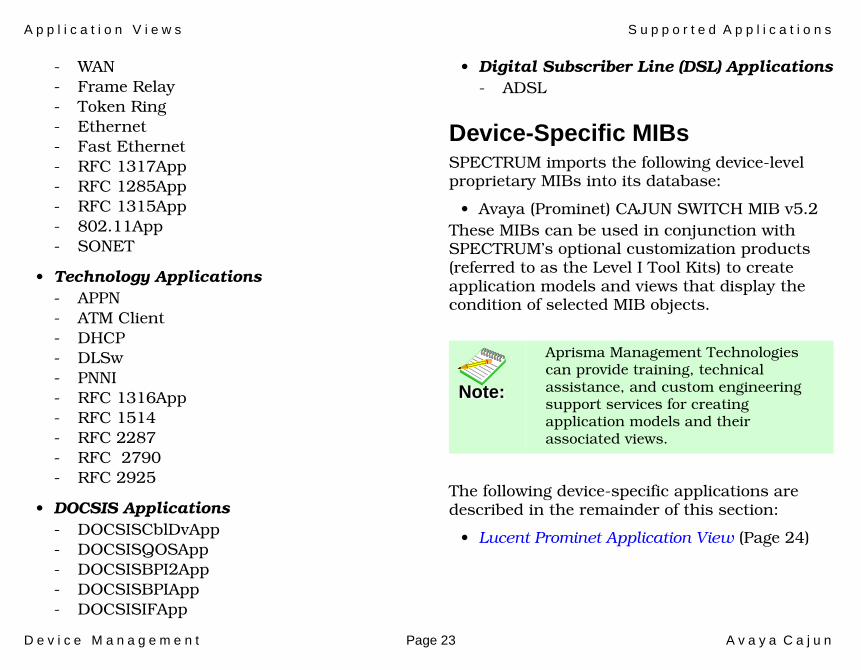
- WAN- Frame Relay- Token Ring- Ethernet- Fast Ethernet- RFC 1317App- RFC 1285App- RFC 1315App- 802.11App- SONET
• Technology Applications- APPN- ATM Client- DHCP- DLSw- PNNI- RFC 1316App- RFC 1514- RFC 2287- RFC 2790- RFC 2925
• DOCSIS Applications- DOCSISCblDvApp - DOCSISQOSApp- DOCSISBPI2App - DOCSISBPIApp - DOCSISIFApp
• Digital Subscriber Line (DSL) Applications- ADSL
Device-Specific MIBsSPECTRUM imports the following device-level proprietary MIBs into its database:
• Avaya (Prominet) CAJUN SWITCH MIB v5.2These MIBs can be used in conjunction with SPECTRUM’s optional customization products (referred to as the Level I Tool Kits) to create application models and views that display the condition of selected MIB objects.
The following device-specific applications are described in the remainder of this section:
• Lucent Prominet Application View (Page 24)
Note:Note:
Aprisma Management Technologies can provide training, technical assistance, and custom engineering support services for creating application models and their associated views.
A p p l i c a t i o n V i e w s L u c e n t P r o m i n e t A p p l i c a t i o n V i e w
D e v i c e M a n a g e m e n t Page 24 A v a y a C a j u n
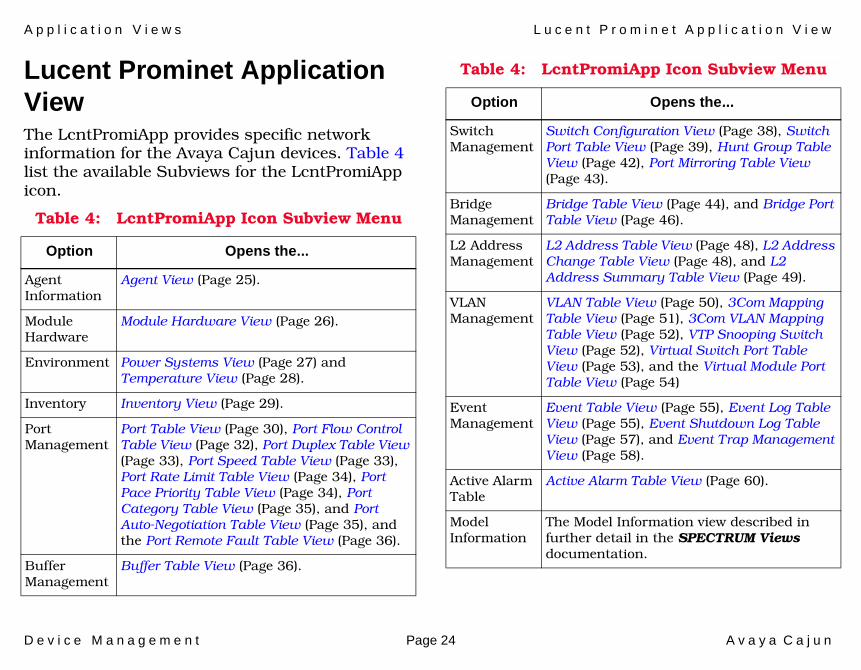
Lucent Prominet Application ViewThe LcntPromiApp provides specific network information for the Avaya Cajun devices. Table 4 list the available Subviews for the LcntPromiApp icon.
Table 4: LcntPromiApp Icon Subview Menu
Option Opens the...
Agent Information
Agent View (Page 25).
Module Hardware
Module Hardware View (Page 26).
Environment Power Systems View (Page 27) and Temperature View (Page 28).
Inventory Inventory View (Page 29).
Port Management
Port Table View (Page 30), Port Flow Control Table View (Page 32), Port Duplex Table View (Page 33), Port Speed Table View (Page 33), Port Rate Limit Table View (Page 34), Port Pace Priority Table View (Page 34), Port Category Table View (Page 35), and Port Auto-Negotiation Table View (Page 35), and the Port Remote Fault Table View (Page 36).
Buffer Management
Buffer Table View (Page 36).
Switch Management
Switch Configuration View (Page 38), Switch Port Table View (Page 39), Hunt Group Table View (Page 42), Port Mirroring Table View (Page 43).
Bridge Management
Bridge Table View (Page 44), and Bridge Port Table View (Page 46).
L2 AddressManagement
L2 Address Table View (Page 48), L2 Address Change Table View (Page 48), and L2 Address Summary Table View (Page 49).
VLAN Management
VLAN Table View (Page 50), 3Com Mapping Table View (Page 51), 3Com VLAN Mapping Table View (Page 52), VTP Snooping Switch View (Page 52), Virtual Switch Port Table View (Page 53), and the Virtual Module Port Table View (Page 54)
Event Management
Event Table View (Page 55), Event Log Table View (Page 55), Event Shutdown Log Table View (Page 57), and Event Trap Management View (Page 58).
Active Alarm Table
Active Alarm Table View (Page 60).
Model Information
The Model Information view described in further detail in the SPECTRUM Views documentation.
Table 4: LcntPromiApp Icon Subview Menu
Option Opens the...
A p p l i c a t i o n V i e w s L u c e n t P r o m i n e t A p p l i c a t i o n V i e w
D e v i c e M a n a g e m e n t Page 25 A v a y a C a j u n
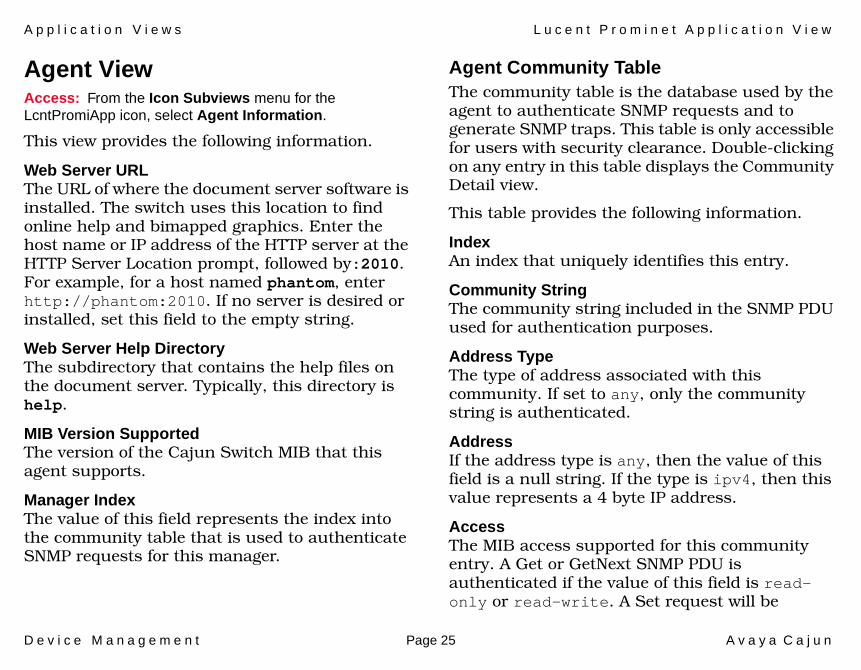
Agent ViewAccess: From the Icon Subviews menu for the LcntPromiApp icon, select Agent Information.
This view provides the following information.
Web Server URLThe URL of where the document server software is installed. The switch uses this location to find online help and bimapped graphics. Enter the host name or IP address of the HTTP server at the HTTP Server Location prompt, followed by:2010. For example, for a host named phantom, enter http://phantom:2010. If no server is desired or installed, set this field to the empty string.
Web Server Help DirectoryThe subdirectory that contains the help files on the document server. Typically, this directory is help.
MIB Version SupportedThe version of the Cajun Switch MIB that this agent supports.
Manager IndexThe value of this field represents the index into the community table that is used to authenticate SNMP requests for this manager.
Agent Community TableThe community table is the database used by the agent to authenticate SNMP requests and to generate SNMP traps. This table is only accessible for users with security clearance. Double-clicking on any entry in this table displays the Community Detail view.
This table provides the following information.
IndexAn index that uniquely identifies this entry.
Community StringThe community string included in the SNMP PDU used for authentication purposes.
Address TypeThe type of address associated with this community. If set to any, only the community string is authenticated.
AddressIf the address type is any, then the value of this field is a null string. If the type is ipv4, then this value represents a 4 byte IP address.
AccessThe MIB access supported for this community entry. A Get or GetNext SNMP PDU is authenticated if the value of this field is read-only or read-write. A Set request will be
A p p l i c a t i o n V i e w s L u c e n t P r o m i n e t A p p l i c a t i o n V i e w
D e v i c e M a n a g e m e n t Page 26 A v a y a C a j u n
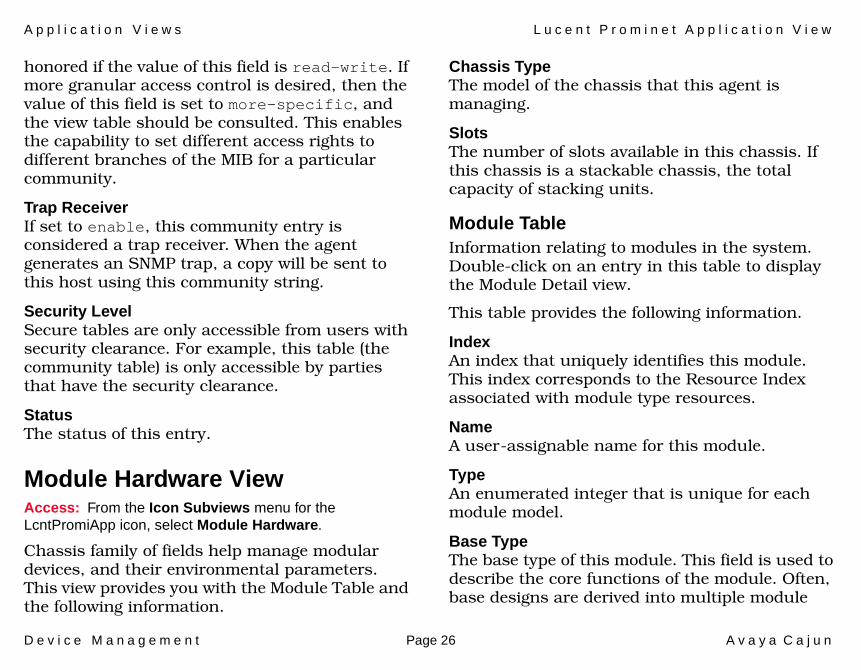
honored if the value of this field is read-write. If more granular access control is desired, then the value of this field is set to more-specific, and the view table should be consulted. This enables the capability to set different access rights to different branches of the MIB for a particular community.
Trap ReceiverIf set to enable, this community entry is considered a trap receiver. When the agent generates an SNMP trap, a copy will be sent to this host using this community string.
Security LevelSecure tables are only accessible from users with security clearance. For example, this table (the community table) is only accessible by parties that have the security clearance.
StatusThe status of this entry.
Module Hardware ViewAccess: From the Icon Subviews menu for the LcntPromiApp icon, select Module Hardware.
Chassis family of fields help manage modular devices, and their environmental parameters. This view provides you with the Module Table and the following information.
Chassis TypeThe model of the chassis that this agent is managing.
SlotsThe number of slots available in this chassis. If this chassis is a stackable chassis, the total capacity of stacking units.
Module TableInformation relating to modules in the system. Double-click on an entry in this table to display the Module Detail view.
This table provides the following information.
IndexAn index that uniquely identifies this module. This index corresponds to the Resource Index associated with module type resources.
NameA user-assignable name for this module.
TypeAn enumerated integer that is unique for each module model.
Base TypeThe base type of this module. This field is used to describe the core functions of the module. Often, base designs are derived into multiple module

A p p l i c a t i o n V i e w s L u c e n t P r o m i n e t A p p l i c a t i o n V i e w
D e v i c e M a n a g e m e n t Page 27 A v a y a C a j u n
types which are typically just packaging variations (e.g. changing the connector types). The value of this field corresponds to the value of Resource Base Type.
Slot WidthThe number of slots that this module occupies.
Slot OffsetThe slot offset (one based) that identifies, along with the slot width and slot location, the actual slots that this module occupies. The offset identifies which slot within the width of the module that this module reports as its slot number.
PortsThe total number of ports associated with this module.
Environment ViewsThe views below provide you with environmental details about this device. The following views are available:
• Power Systems View (Page 27)• Temperature View (Page 28)
Power Systems ViewAccess: From the Icon Subviews menu for the LcntPromiApp icon, select Environment > Power Systems.
This view contains the Power Supply Table and Power Control Table providing information about each power supply.
This view provides the following information.
Total CapacityThe total capacity in Watts of power available currently in the system.
Total Power UsedThe total power (in Watts) currently being consumed in the system.
Power Supply TableInformation in this table includes the status of the power supply and how much power this supply generates. Double-clicking on any entry in this table displays the Power Supply Detail view.
This table provides the following information.
Index This index corresponds to the Resource Index of the power supply type resource.
Type An enumerated integer describing the type of power supply.
A p p l i c a t i o n V i e w s L u c e n t P r o m i n e t A p p l i c a t i o n V i e w
D e v i c e M a n a g e m e n t Page 28 A v a y a C a j u n
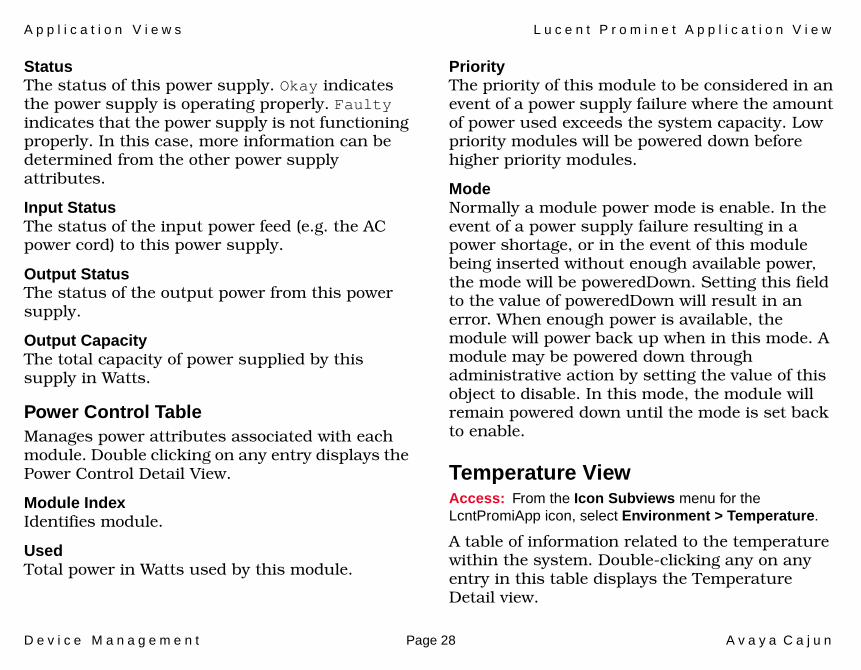
StatusThe status of this power supply. Okay indicates the power supply is operating properly. Faulty indicates that the power supply is not functioning properly. In this case, more information can be determined from the other power supply attributes.
Input StatusThe status of the input power feed (e.g. the AC power cord) to this power supply.
Output StatusThe status of the output power from this power supply.
Output CapacityThe total capacity of power supplied by this supply in Watts.
Power Control TableManages power attributes associated with each module. Double clicking on any entry displays the Power Control Detail View.
Module IndexIdentifies module.
UsedTotal power in Watts used by this module.
PriorityThe priority of this module to be considered in an event of a power supply failure where the amount of power used exceeds the system capacity. Low priority modules will be powered down before higher priority modules.
ModeNormally a module power mode is enable. In the event of a power supply failure resulting in a power shortage, or in the event of this module being inserted without enough available power, the mode will be poweredDown. Setting this field to the value of poweredDown will result in an error. When enough power is available, the module will power back up when in this mode. A module may be powered down through administrative action by setting the value of this object to disable. In this mode, the module will remain powered down until the mode is set back to enable.
Temperature ViewAccess: From the Icon Subviews menu for the LcntPromiApp icon, select Environment > Temperature.
A table of information related to the temperature within the system. Double-clicking any on any entry in this table displays the Temperature Detail view.
A p p l i c a t i o n V i e w s L u c e n t P r o m i n e t A p p l i c a t i o n V i e w
D e v i c e M a n a g e m e n t Page 29 A v a y a C a j u n
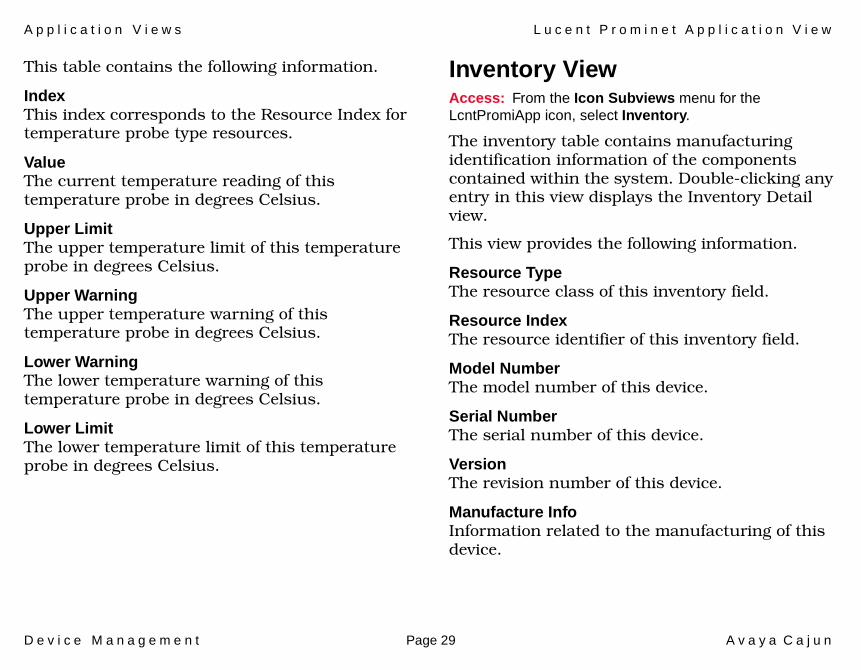
This table contains the following information.
Index This index corresponds to the Resource Index for temperature probe type resources.
ValueThe current temperature reading of this temperature probe in degrees Celsius.
Upper LimitThe upper temperature limit of this temperature probe in degrees Celsius.
Upper WarningThe upper temperature warning of this temperature probe in degrees Celsius.
Lower WarningThe lower temperature warning of this temperature probe in degrees Celsius.
Lower LimitThe lower temperature limit of this temperature probe in degrees Celsius.
Inventory ViewAccess: From the Icon Subviews menu for the LcntPromiApp icon, select Inventory.
The inventory table contains manufacturing identification information of the components contained within the system. Double-clicking any entry in this view displays the Inventory Detail view.
This view provides the following information.
Resource TypeThe resource class of this inventory field.
Resource IndexThe resource identifier of this inventory field.
Model NumberThe model number of this device.
Serial NumberThe serial number of this device.
VersionThe revision number of this device.
Manufacture InfoInformation related to the manufacturing of this device.
A p p l i c a t i o n V i e w s L u c e n t P r o m i n e t A p p l i c a t i o n V i e w
D e v i c e M a n a g e m e n t Page 30 A v a y a C a j u n
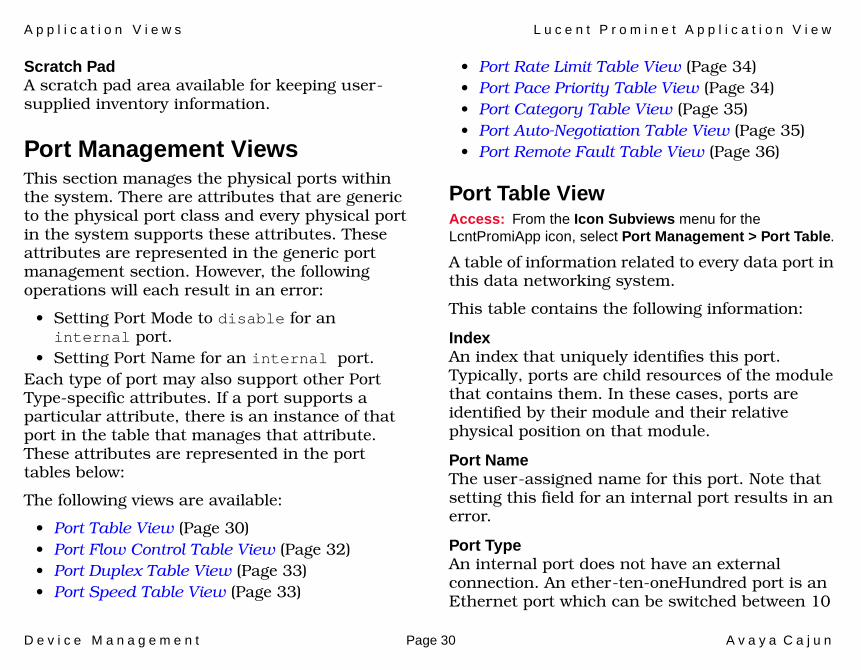
Scratch PadA scratch pad area available for keeping user-supplied inventory information.
Port Management ViewsThis section manages the physical ports within the system. There are attributes that are generic to the physical port class and every physical port in the system supports these attributes. These attributes are represented in the generic port management section. However, the following operations will each result in an error:
• Setting Port Mode to disable for an internal port.
• Setting Port Name for an internal port.Each type of port may also support other Port Type-specific attributes. If a port supports a particular attribute, there is an instance of that port in the table that manages that attribute. These attributes are represented in the port tables below:
The following views are available:
• Port Table View (Page 30)• Port Flow Control Table View (Page 32)• Port Duplex Table View (Page 33)• Port Speed Table View (Page 33)
• Port Rate Limit Table View (Page 34)• Port Pace Priority Table View (Page 34)• Port Category Table View (Page 35)• Port Auto-Negotiation Table View (Page 35)• Port Remote Fault Table View (Page 36)
Port Table ViewAccess: From the Icon Subviews menu for the LcntPromiApp icon, select Port Management > Port Table.
A table of information related to every data port in this data networking system.
This table contains the following information:
IndexAn index that uniquely identifies this port. Typically, ports are child resources of the module that contains them. In these cases, ports are identified by their module and their relative physical position on that module.
Port NameThe user-assigned name for this port. Note that setting this field for an internal port results in an error.
Port TypeAn internal port does not have an external connection. An ether-ten-oneHundred port is an Ethernet port which can be switched between 10
A p p l i c a t i o n V i e w s L u c e n t P r o m i n e t A p p l i c a t i o n V i e w
D e v i c e M a n a g e m e n t Page 31 A v a y a C a j u n
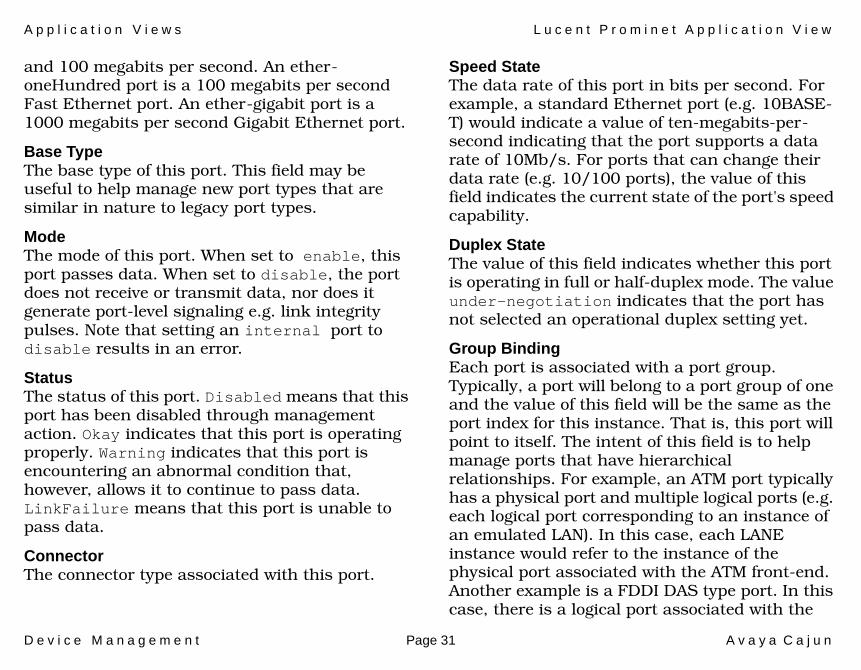
and 100 megabits per second. An ether-oneHundred port is a 100 megabits per second Fast Ethernet port. An ether-gigabit port is a 1000 megabits per second Gigabit Ethernet port.
Base TypeThe base type of this port. This field may be useful to help manage new port types that are similar in nature to legacy port types.
ModeThe mode of this port. When set to enable, this port passes data. When set to disable, the port does not receive or transmit data, nor does it generate port-level signaling e.g. link integrity pulses. Note that setting an internal port to disable results in an error.
StatusThe status of this port. Disabled means that this port has been disabled through management action. Okay indicates that this port is operating properly. Warning indicates that this port is encountering an abnormal condition that, however, allows it to continue to pass data. LinkFailure means that this port is unable to pass data.
ConnectorThe connector type associated with this port.
Speed StateThe data rate of this port in bits per second. For example, a standard Ethernet port (e.g. 10BASE-T) would indicate a value of ten-megabits-per-second indicating that the port supports a data rate of 10Mb/s. For ports that can change their data rate (e.g. 10/100 ports), the value of this field indicates the current state of the port's speed capability.
Duplex StateThe value of this field indicates whether this port is operating in full or half-duplex mode. The value under-negotiation indicates that the port has not selected an operational duplex setting yet.
Group BindingEach port is associated with a port group. Typically, a port will belong to a port group of one and the value of this field will be the same as the port index for this instance. That is, this port will point to itself. The intent of this field is to help manage ports that have hierarchical relationships. For example, an ATM port typically has a physical port and multiple logical ports (e.g. each logical port corresponding to an instance of an emulated LAN). In this case, each LANE instance would refer to the instance of the physical port associated with the ATM front-end. Another example is a FDDI DAS type port. In this case, there is a logical port associated with the
A p p l i c a t i o n V i e w s L u c e n t P r o m i n e t A p p l i c a t i o n V i e w
D e v i c e M a n a g e m e n t Page 32 A v a y a C a j u n
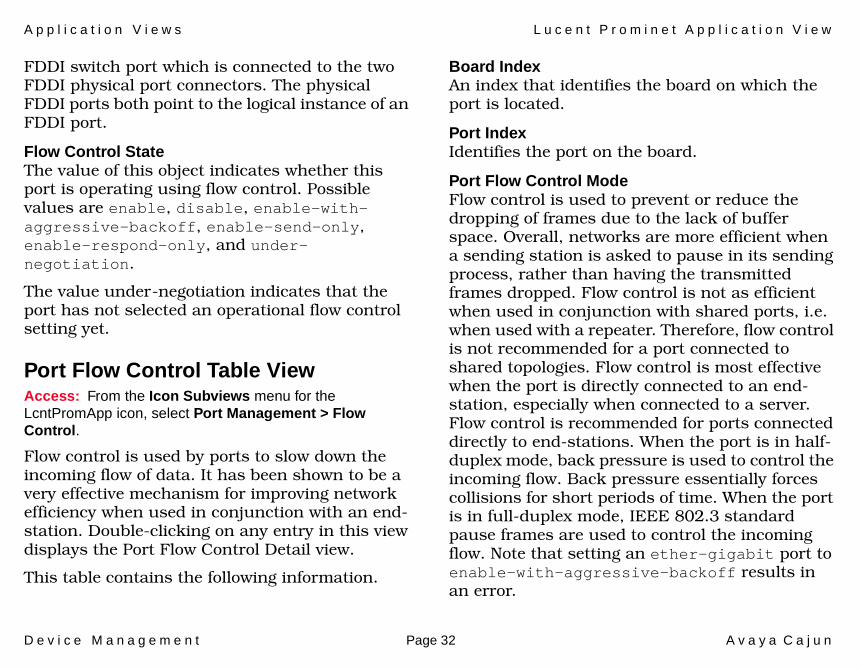
FDDI switch port which is connected to the two FDDI physical port connectors. The physical FDDI ports both point to the logical instance of an FDDI port.
Flow Control StateThe value of this object indicates whether this port is operating using flow control. Possible values are enable, disable, enable-with-aggressive-backoff, enable-send-only, enable-respond-only, and under-negotiation.
The value under-negotiation indicates that the port has not selected an operational flow control setting yet.
Port Flow Control Table ViewAccess: From the Icon Subviews menu for the LcntPromApp icon, select Port Management > Flow Control.
Flow control is used by ports to slow down the incoming flow of data. It has been shown to be a very effective mechanism for improving network efficiency when used in conjunction with an end-station. Double-clicking on any entry in this view displays the Port Flow Control Detail view.
This table contains the following information.
Board IndexAn index that identifies the board on which the port is located.
Port IndexIdentifies the port on the board.
Port Flow Control ModeFlow control is used to prevent or reduce the dropping of frames due to the lack of buffer space. Overall, networks are more efficient when a sending station is asked to pause in its sending process, rather than having the transmitted frames dropped. Flow control is not as efficient when used in conjunction with shared ports, i.e. when used with a repeater. Therefore, flow control is not recommended for a port connected to shared topologies. Flow control is most effective when the port is directly connected to an end-station, especially when connected to a server. Flow control is recommended for ports connected directly to end-stations. When the port is in half-duplex mode, back pressure is used to control the incoming flow. Back pressure essentially forces collisions for short periods of time. When the port is in full-duplex mode, IEEE 802.3 standard pause frames are used to control the incoming flow. Note that setting an ether-gigabit port to enable-with-aggressive-backoff results in an error.
A p p l i c a t i o n V i e w s L u c e n t P r o m i n e t A p p l i c a t i o n V i e w
D e v i c e M a n a g e m e n t Page 33 A v a y a C a j u n
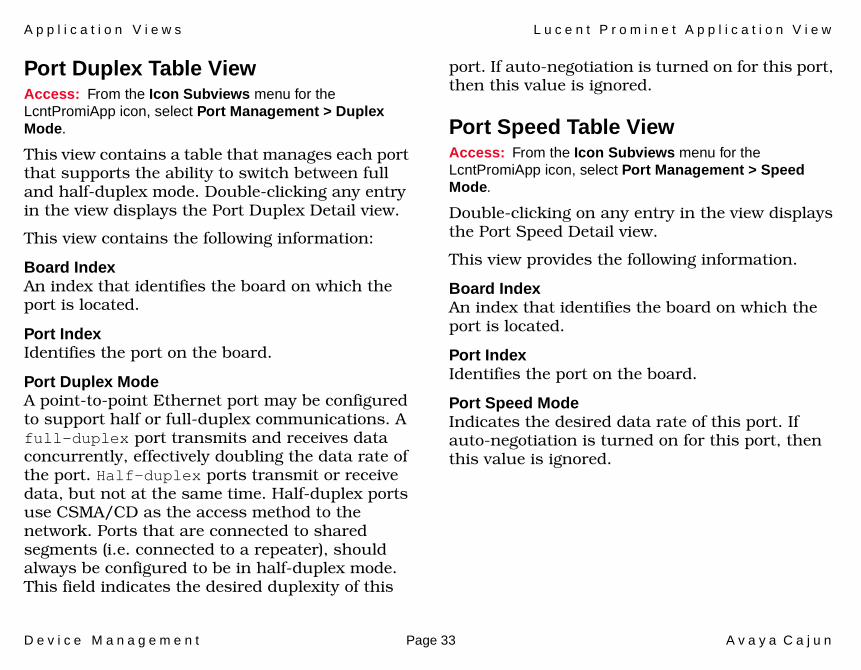
Port Duplex Table ViewAccess: From the Icon Subviews menu for the LcntPromiApp icon, select Port Management > Duplex Mode.
This view contains a table that manages each port that supports the ability to switch between full and half-duplex mode. Double-clicking any entry in the view displays the Port Duplex Detail view.
This view contains the following information:
Board IndexAn index that identifies the board on which the port is located.
Port IndexIdentifies the port on the board.
Port Duplex ModeA point-to-point Ethernet port may be configured to support half or full-duplex communications. A full-duplex port transmits and receives data concurrently, effectively doubling the data rate of the port. Half-duplex ports transmit or receive data, but not at the same time. Half-duplex ports use CSMA/CD as the access method to the network. Ports that are connected to shared segments (i.e. connected to a repeater), should always be configured to be in half-duplex mode. This field indicates the desired duplexity of this
port. If auto-negotiation is turned on for this port, then this value is ignored.
Port Speed Table ViewAccess: From the Icon Subviews menu for the LcntPromiApp icon, select Port Management > Speed Mode.
Double-clicking on any entry in the view displays the Port Speed Detail view.
This view provides the following information.
Board IndexAn index that identifies the board on which the port is located.
Port IndexIdentifies the port on the board.
Port Speed ModeIndicates the desired data rate of this port. If auto-negotiation is turned on for this port, then this value is ignored.
A p p l i c a t i o n V i e w s L u c e n t P r o m i n e t A p p l i c a t i o n V i e w
D e v i c e M a n a g e m e n t Page 34 A v a y a C a j u n
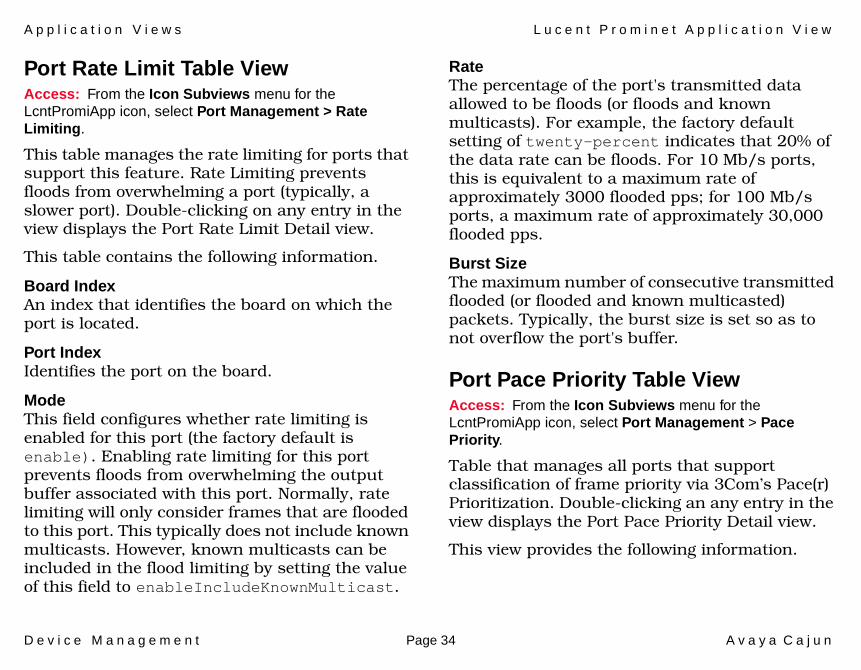
Port Rate Limit Table ViewAccess: From the Icon Subviews menu for the LcntPromiApp icon, select Port Management > Rate Limiting.
This table manages the rate limiting for ports that support this feature. Rate Limiting prevents floods from overwhelming a port (typically, a slower port). Double-clicking on any entry in the view displays the Port Rate Limit Detail view.
This table contains the following information.
Board IndexAn index that identifies the board on which the port is located.
Port IndexIdentifies the port on the board.
ModeThis field configures whether rate limiting is enabled for this port (the factory default is enable). Enabling rate limiting for this port prevents floods from overwhelming the output buffer associated with this port. Normally, rate limiting will only consider frames that are flooded to this port. This typically does not include known multicasts. However, known multicasts can be included in the flood limiting by setting the value of this field to enableIncludeKnownMulticast.
RateThe percentage of the port's transmitted data allowed to be floods (or floods and known multicasts). For example, the factory default setting of twenty-percent indicates that 20% of the data rate can be floods. For 10 Mb/s ports, this is equivalent to a maximum rate of approximately 3000 flooded pps; for 100 Mb/s ports, a maximum rate of approximately 30,000 flooded pps.
Burst SizeThe maximum number of consecutive transmitted flooded (or flooded and known multicasted) packets. Typically, the burst size is set so as to not overflow the port's buffer.
Port Pace Priority Table ViewAccess: From the Icon Subviews menu for the LcntPromiApp icon, select Port Management > Pace Priority.
Table that manages all ports that support classification of frame priority via 3Com’s Pace(r) Prioritization. Double-clicking an any entry in the view displays the Port Pace Priority Detail view.
This view provides the following information.
A p p l i c a t i o n V i e w s L u c e n t P r o m i n e t A p p l i c a t i o n V i e w
D e v i c e M a n a g e m e n t Page 35 A v a y a C a j u n
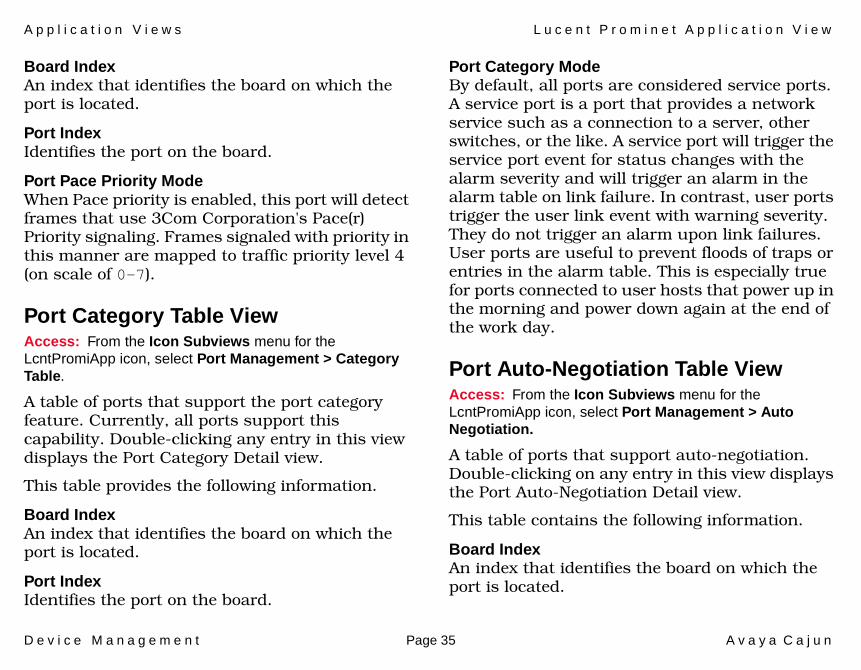
Board IndexAn index that identifies the board on which the port is located.
Port IndexIdentifies the port on the board.
Port Pace Priority ModeWhen Pace priority is enabled, this port will detect frames that use 3Com Corporation's Pace(r) Priority signaling. Frames signaled with priority in this manner are mapped to traffic priority level 4 (on scale of 0-7).
Port Category Table ViewAccess: From the Icon Subviews menu for the LcntPromiApp icon, select Port Management > Category Table.
A table of ports that support the port category feature. Currently, all ports support this capability. Double-clicking any entry in this view displays the Port Category Detail view.
This table provides the following information.
Board IndexAn index that identifies the board on which the port is located.
Port IndexIdentifies the port on the board.
Port Category ModeBy default, all ports are considered service ports. A service port is a port that provides a network service such as a connection to a server, other switches, or the like. A service port will trigger the service port event for status changes with the alarm severity and will trigger an alarm in the alarm table on link failure. In contrast, user ports trigger the user link event with warning severity. They do not trigger an alarm upon link failures. User ports are useful to prevent floods of traps or entries in the alarm table. This is especially true for ports connected to user hosts that power up in the morning and power down again at the end of the work day.
Port Auto-Negotiation Table ViewAccess: From the Icon Subviews menu for the LcntPromiApp icon, select Port Management > Auto Negotiation.
A table of ports that support auto-negotiation. Double-clicking on any entry in this view displays the Port Auto-Negotiation Detail view.
This table contains the following information.
Board IndexAn index that identifies the board on which the port is located.
A p p l i c a t i o n V i e w s L u c e n t P r o m i n e t A p p l i c a t i o n V i e w
D e v i c e M a n a g e m e n t Page 36 A v a y a C a j u n
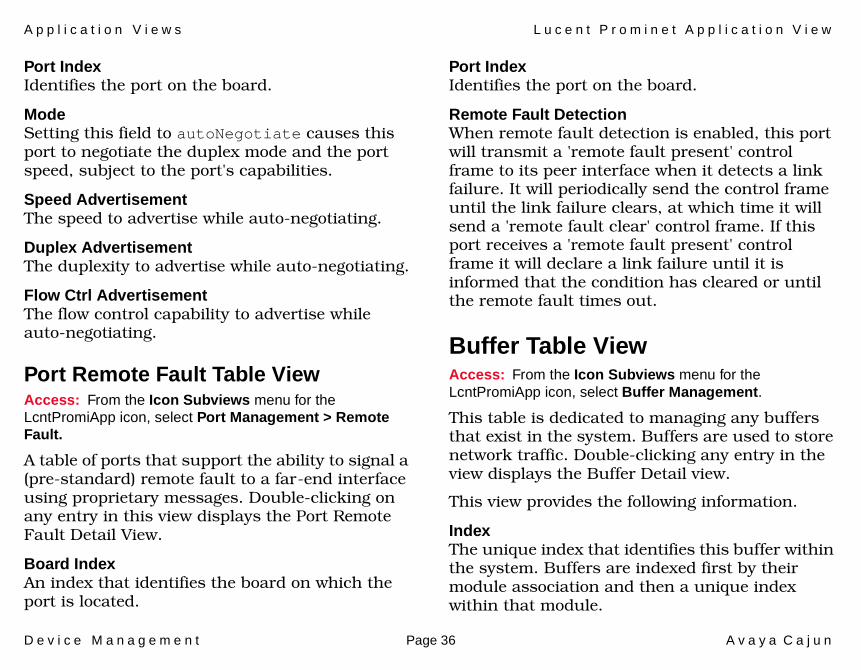
Port IndexIdentifies the port on the board.
ModeSetting this field to autoNegotiate causes this port to negotiate the duplex mode and the port speed, subject to the port's capabilities.
Speed AdvertisementThe speed to advertise while auto-negotiating.
Duplex AdvertisementThe duplexity to advertise while auto-negotiating.
Flow Ctrl AdvertisementThe flow control capability to advertise while auto-negotiating.
Port Remote Fault Table ViewAccess: From the Icon Subviews menu for the LcntPromiApp icon, select Port Management > Remote Fault.
A table of ports that support the ability to signal a (pre-standard) remote fault to a far-end interface using proprietary messages. Double-clicking on any entry in this view displays the Port Remote Fault Detail View.
Board IndexAn index that identifies the board on which the port is located.
Port IndexIdentifies the port on the board.
Remote Fault DetectionWhen remote fault detection is enabled, this port will transmit a 'remote fault present' control frame to its peer interface when it detects a link failure. It will periodically send the control frame until the link failure clears, at which time it will send a 'remote fault clear' control frame. If this port receives a 'remote fault present' control frame it will declare a link failure until it is informed that the condition has cleared or until the remote fault times out.
Buffer Table ViewAccess: From the Icon Subviews menu for the LcntPromiApp icon, select Buffer Management.
This table is dedicated to managing any buffers that exist in the system. Buffers are used to store network traffic. Double-clicking any entry in the view displays the Buffer Detail view.
This view provides the following information.
IndexThe unique index that identifies this buffer within the system. Buffers are indexed first by their module association and then a unique index within that module.
A p p l i c a t i o n V i e w s L u c e n t P r o m i n e t A p p l i c a t i o n V i e w
D e v i c e M a n a g e m e n t Page 37 A v a y a C a j u n
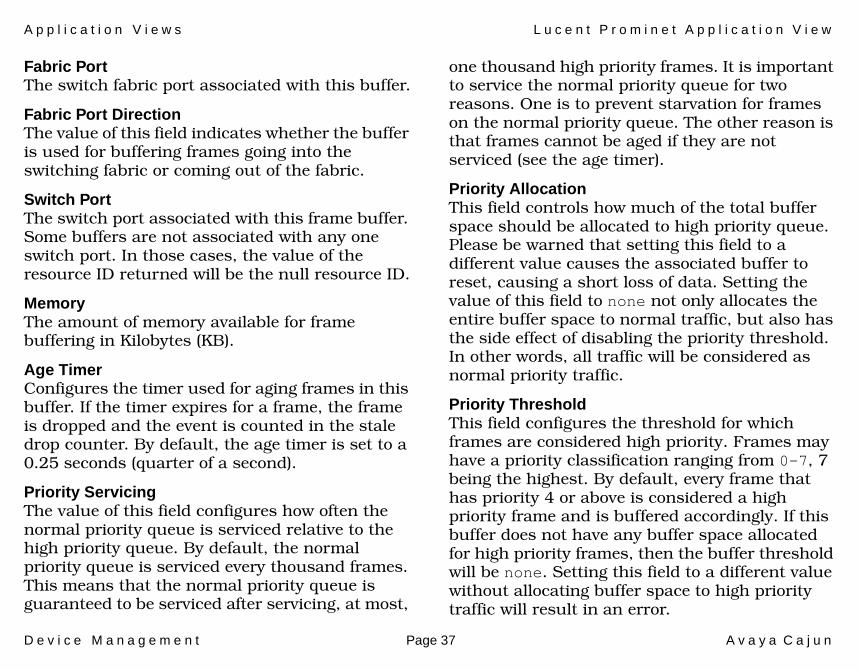
Fabric PortThe switch fabric port associated with this buffer.
Fabric Port DirectionThe value of this field indicates whether the buffer is used for buffering frames going into the switching fabric or coming out of the fabric.
Switch PortThe switch port associated with this frame buffer. Some buffers are not associated with any one switch port. In those cases, the value of the resource ID returned will be the null resource ID.
MemoryThe amount of memory available for frame buffering in Kilobytes (KB).
Age TimerConfigures the timer used for aging frames in this buffer. If the timer expires for a frame, the frame is dropped and the event is counted in the stale drop counter. By default, the age timer is set to a 0.25 seconds (quarter of a second).
Priority ServicingThe value of this field configures how often the normal priority queue is serviced relative to the high priority queue. By default, the normal priority queue is serviced every thousand frames. This means that the normal priority queue is guaranteed to be serviced after servicing, at most,
one thousand high priority frames. It is important to service the normal priority queue for two reasons. One is to prevent starvation for frames on the normal priority queue. The other reason is that frames cannot be aged if they are not serviced (see the age timer).
Priority AllocationThis field controls how much of the total buffer space should be allocated to high priority queue. Please be warned that setting this field to a different value causes the associated buffer to reset, causing a short loss of data. Setting the value of this field to none not only allocates the entire buffer space to normal traffic, but also has the side effect of disabling the priority threshold. In other words, all traffic will be considered as normal priority traffic.
Priority ThresholdThis field configures the threshold for which frames are considered high priority. Frames may have a priority classification ranging from 0-7, 7 being the highest. By default, every frame that has priority 4 or above is considered a high priority frame and is buffered accordingly. If this buffer does not have any buffer space allocated for high priority frames, then the buffer threshold will be none. Setting this field to a different value without allocating buffer space to high priority traffic will result in an error.
A p p l i c a t i o n V i e w s L u c e n t P r o m i n e t A p p l i c a t i o n V i e w
D e v i c e M a n a g e m e n t Page 38 A v a y a C a j u n
CongestionThis field indicates whether this buffer is in a congested state.
High Overflow DropsThe count of the number of high priority frames dropped due to the high priority queue overflowing.
Low Overflow DropsThe count of the number of low priority frames dropped due to the low priority queue overflowing.
High Stale DropsThe count of the number of high priority frames dropped due to being in the high priority queue too long (the frame aged out).
Low Stale DropsThe count of the number of low priority frames dropped due to being in the low priority queue too long (the frame aged out).
Congestion DropsThe count of the number of frames dropped due to the destination (output) buffer being congested.
Switch Management ViewsThe following views are described below:
• Switch Configuration View (Page 38)• Switch Port Table View (Page 39)• Hunt Group Table View (Page 42)• Port Mirroring Table View (Page 43)
Switch Configuration ViewAccess: From the Icon Subviews menu for the LcntPromiApp icon, select Switch Management > Configuration.
This view provides the following information.
STP ConfigurationWhen set to ieee8021dStp, the switch executes spanning tree conformant to the IEEE 802.1D bridging standard. The switch runs one instance of spanning tree. When set to stpPerVlan, the switch executes a separate instance of spanning tree for each virtual LAN. This configuration conforms to the model that instances of virtual LANs within the switch are separate virtual bridging functions. This method may not work well with bridge/routers that are also running spanning tree. When set to twoLayerStp, the switch executes a two-layer spanning tree to prevent loops. Two layer spanning tree creates a higher 'plane' of spanning tree between VLAN
A p p l i c a t i o n V i e w s L u c e n t P r o m i n e t A p p l i c a t i o n V i e w
D e v i c e M a n a g e m e n t Page 39 A v a y a C a j u n
devices. This method of running spanning tree is 'plug and play' with bridge/router type devices and also scales better than the other two methods for large environments. When set to disable, spanning tree is disabled in the switch.
Aging TimeThe timeout period in seconds for aging dynamically learned forwarding information. A default of 300 seconds is recommended. An aged entry is marked invalid, but is not removed from the Address Forwarding Table, because it is assumed that it will be relearned to the same location within the table.
Super Aging TimeThe timeout period in days for removing stale invalid entries from the Address Forwarding Table. A superaged entry is removed completely from the Address Forwarding Table, because it is assumed that the entry will never be relearned.
Switch Port Table ViewAccess: From the Icon Subviews menu for the LcntPromiApp icon, select Switch Management > Switch Port Table.
The switch port table manages the configuration and status of each switch port. Double-clicking on any entry of this view displays the Switch Port Detail view.
This view provides the following information.
IndexA unique index that identifies this switch port. The value of this index corresponds to the value of the Resource Index for switch ports.
STAP ModeDisabling spanning tree on a switch port prevents the switch port from participating in the spanning tree process. When disabled, this port will neither generate BPDUs, nor process received BPDUs. Also, the port will always start in the forwarding state. A port configured in this mode will not be able to detect network loops involving this port. The factory default is to enable spanning tree on all ports.
Convert To StaticWhen this field is set to convertToStatic, all addresses learned on this port will be added to the non-volatile version of the static address table. Typically, this object will be used to perform a crude form of address database update where the address activity associated with this port is collected as static (i.e. permanent) addresses while the value of this field is set to convertToStatic. Following this usually short period of time (perhaps a week of activity), the value of this object is restored back to its default value of learnasDynamic and learning for this
A p p l i c a t i o n V i e w s L u c e n t P r o m i n e t A p p l i c a t i o n V i e w
D e v i c e M a n a g e m e n t Page 40 A v a y a C a j u n
port is disabled. It is important that the user verify the address database to verify that only the desired addresses were made permanent.
Learning ModeDisable learning on a bridge port to prevent new addresses from being added to the address database. Used in combination with static (permanent) address entries, disabling address learning is an effective security feature to prevent new hosts from appearing on the network, or to prevent hosts from moving to different locations in the network. The default is enable.
Hunt GroupHunt groups provide the capability to logically bind multiple switch ports into one switch port. This provides a way of balancing the load of multiple links between like-configured switches. Care must be taken to configure the hunt groups properly to prevent accidental network looping. Use this field to bind this port to a specific hunt group. When not configured to a specific hunt group, set the value of this field to zero.
Physical PortThe physical port resource bound to this switch port.
Known ModeEnabling known mode for this switch port causes the port to safely discard frames flooded because they are unknown unicast frames. This mode greatly enhances the efficiency of the port's output buffer since space is not wasted for frames not meant for this port. Enabling this feature disables learning for this port. Addresses associated for this port should be entered statically. The default is disable.
Mapping MethodThe frame mapping method of this switch port. When set to port-based (the factory default), all non-tagged frames are classified to the VLAN associated with this switch port.
Trunking ModeThe trunking mode of this port. All frames transmitted out of this switch port are translated to the appropriate trunking format:
• Clear: Ethernet or IEEE 802.3 frame format. This is the default.
• IEEE 802.1Q: The original frame with a new Ethernet Type (Protocol = 0xXXXX) and the VLAN ID inserted following the original Source Address. Also, the CRC is recalculated.
A p p l i c a t i o n V i e w s L u c e n t P r o m i n e t A p p l i c a t i o n V i e w
D e v i c e M a n a g e m e n t Page 41 A v a y a C a j u n
• Multi-level: The original frame is encapsulated in an IEEE 802.3 legal frame proprietary to a major networking equipment vendor.
• 3Com LinkSwitch: The original frame has the VLAN ID added to the front of the frame (before the Destination Address). Trunking format is proprietary to 3Com Corporation.
Vlan Binding MethThe VLAN binding method of a switch port specifies the way in which the port can be a member of the egress lists of VLANs other than the port default VLAN specified by Switch Port Vlan ID:
• static: A Virtual Switch Port must be statically created for each VLAN/port combination.
• persistent: A Virtual Switch Port is automatically created for each VLAN known to the switch (i.e., the port is a member of the egress lists of all VLANs).
• dynamic: A Virtual Switch Port is automatically created for each VLAN when the associated VLAN ID is used as a tag in an IEEE 802.1Q or Multi-level tagged frame received on the port (i.e., the port is a member of the egress lists of the VLANs from frames received on the port).
The default is static.
Ignore TagEach switch port is capable of ignoring the VLAN Tag associated with a frame in a trunking format. When ignored, the tag is used as the default in the event that a VLAN classification based on the switch's policy(s) cannot be made. This feature is useful for connecting layer 2 VLANs and layer 3 VLANs. The default is useTag.
Vlan IDWhen this switch port is configured in port-based VLAN mode, all non-tagged frames received on this port are bound to this VLAN. Otherwise, non-tagged frames are classified to this VLAN as the default if a VLAN binding cannot be otherwise determined. The factory default is 1, which is the VLAN ID of the Default VLAN.
3Com Mapping Table The 3Com VLAN mapping table associated with this switch port. The default is 1, which indicates the default mapping table.
Auto Vlan CreationEnabling auto VLAN creation for this switch port causes the port to dynamically create a VLAN whenever an IEEE 802.1Q or Multi-level tagged frame is received on the port with a tag value which does not correspond to a known VLAN. All
A p p l i c a t i o n V i e w s L u c e n t P r o m i n e t A p p l i c a t i o n V i e w
D e v i c e M a n a g e m e n t Page 42 A v a y a C a j u n
switch ports with a trunking mode of IEEE 802.1Q or Multi-level are bound to this created VLAN. The default is disable.
Mirror ModeWhen set to enable, this field indicates that the port is defined as a mirror port through the Port Mirroring table. A mirror port duplicates frames received at one or more source ports.
If IndexEach switch port is associated with an interface. Provides a mechanism to map switch ports to bridge ports.
Fast StartWhen this field is set to enable, bridge ports on this switch port transitions right from blocking to forwarding, skipping the listening and learning states. The user should be warned that using the fast start feature greatly increases the likelihood of unintended network loops that would otherwise be prevented by participating in the normal spanning tree algorithm.
Vtp SnoopingWhen this object is set to enable, this switch port attempts to learn VLANs from a major networking equipment vendor if the switch port's trunking mode is IEEE 802.1Q Format or Multi-level
Format. The factory default value for this object is enable.
Intrus TrpEnabling intrusion trap for this switch port causes the traps to be generated when unknown MAC frames are received and port is configured to receive only statically configured MAC frames and learning and flooding are disabled. The default is disable.
Intrus Trp TimerDefines the time that elapses between consecutive intrusion traps sent when unknown MAC frames are received and port is configured to receive only statically configured MAC frames and learning and flooding are disabled. The default is 1800 seconds.
Hunt Group Table ViewAccess: From the Icon Subviews menu for the LcntPromiApp icon, Select Switch Management > Hunt Group Table.
A hunt group logically binds together multiple switch ports so that they act as one switch port. This feature enables the ports within the hunt group to load share the network traffic. The hunt group feature is targeted for a restricted topology where two switches are connected together by multiple lines of the same bandwidth. Hunt
A p p l i c a t i o n V i e w s L u c e n t P r o m i n e t A p p l i c a t i o n V i e w
D e v i c e M a n a g e m e n t Page 43 A v a y a C a j u n
groups require that both switches be configured identically to the other. Each hunt group requires a base port. The hunt group assumes the characteristics of the base port where all the managed information (configuration & statistics) of any of the switch ports in the hunt group is only available from the base port instance. Double-clicking on any entry in this view displays the Hunt Group Detail view.
This view provides the following information.
IndexAn index that uniquely identifies this hunt group. This index corresponds to the value of Resource Index for resources of the hunt group type.
Group NameThe name assigned to a group of ports.
Base PortThe switch port index that serves as the base port for this hunt group. Each hunt group requires a base port. In lieu of a specific configuration, the hunt group will inherit the first switch port bound to the hunt group as its base port. The base port serves as the management focus for the hunt group. That is, a hunt group is managed as one switch port whose instance is provided by the base switch port. All configuration (e.g. spanning tree information) and statistics related to switch
ports are meaningful only through the instance of the base port.
Number Of PortsThe current number of ports that belong to this hunt group.
Load SharingThe current status of the load sharing function.
StatusThe current status of this group.
Port Mirroring Table ViewAccess: From the Icon Subviews menu for the LcntPromiApp icon, select Switch Management > Port Mirroring.
Port Mirroring is used to duplicate packets received on one or more ports on another port so that the mirror port can be monitored, for example with a RMON probe. Port Mirroring allows either all packets received on the source port, or a periodic sample, to be duplicated on the mirror port. Double-clicking on any entry in this view displays the Port Mirroring Detail view.
This view provides the following information.
IndexThe unique index that identifies this entry. This index consists of a switch fabric port and the
A p p l i c a t i o n V i e w s L u c e n t P r o m i n e t A p p l i c a t i o n V i e w
D e v i c e M a n a g e m e n t Page 44 A v a y a C a j u n
index of a Packet Lookup Engine servicing this fabric port.
Source Sub PortThe frame sampler source switch subport. The source port is the port from which received traffic will be mirrored. This field identifies the switch subport only, the switch fabric port is identified in Port Mirroring Index. If set to 0, all subports associated with the Port Mirroring Index will be source ports. The default value is 0.
Sampler TypeThe type for this frame sampler. When set to enable, every frame received on the source port(s) will be mirrored at the mirror port. When set to disable, no frames received on the source port(s) will be mirrored at the mirror port. When set to periodic, frames will be mirrored at the rate defined in Port Mirroring Rate. The default value is disable.
Rate Used in conjunction with Port Mirroring Sampler Type to implement periodic sampling functionality. If Port Mirroring Sampler Type is set to periodic, this field defines the number of packets/second that will be mirrored. If Port Mirroring Sampler Type is not periodic, this field will set to 0.
Mirror PortThe Switch Port on which frames received at source port(s) will be duplicated. If no mirror port has been defined this field will return NULL.
Bridge Management ViewsThe following views are described below:
• Bridge Table View (Page 44)• Bridge Port Table View (Page 46)
Bridge Table ViewAccess: From the Icon Subviews menu for the LcntPromiApp icon, select Bridge Management > Bridge Table.
Double-clicking on any entry in this view displays the Bridge Detail view.
This view contains the following information.
Index An index that identifies this bridge.
TypeIndicates whether this is a legacy dot1d bridge consisting of all switch ports or a virtual bridge consisting of all virtual subports for a particular VLAN.
A p p l i c a t i o n V i e w s L u c e n t P r o m i n e t A p p l i c a t i o n V i e w
D e v i c e M a n a g e m e n t Page 45 A v a y a C a j u n
ModeUsed to enable or disable Spanning Tree for this bridge. When set to disable, all BPDUs are forwarded like regular multicast packets. The default value is enable.
StatusThe enable or disable status of this bridge. This field incorporates the setting of the Switch STP Config field. When Switch STP Config is set such that this bridge will not be active, Bridge Status returns disabled. If Switch STP Config is set such that this bridge will be active, and Bridge Mode is enable, this field returns enabled.
Stp PriorityThe priority value of the Bridge Identifier.
Stp Time Since TopologyThe time since the last topology change was detected.
Stp Top ChangesThe total number of topology changes.
Stp Designated RootThe bridge considered to be root by this node.
Stp Root CostThe cost of the path to the root from this node.
Stp Root PortThe port number with the lowest cost path to the root bridge.
Stp Max AgeThe maximum age used by this bridge to hold onto STP information before discarding.
Stp Hello TimeThe amount of time between configuration BPDUs.
Stp Hold TimeThe time value that indicates the interval during which no more than two configuration BPDUs will be sent by this node.
Stp Forward DelayThe amount of time that this node stays in each of the Listening and Learning states.
Stp Bridge Max AgeThe value of Max Age when this bridge is the root.
Stp Bridge Hello TimeThe value of Hello Time to use when this bridge is the root.
Stp Bridge Forward DelayThe value of Forward Delay to use when this bridge is the root.
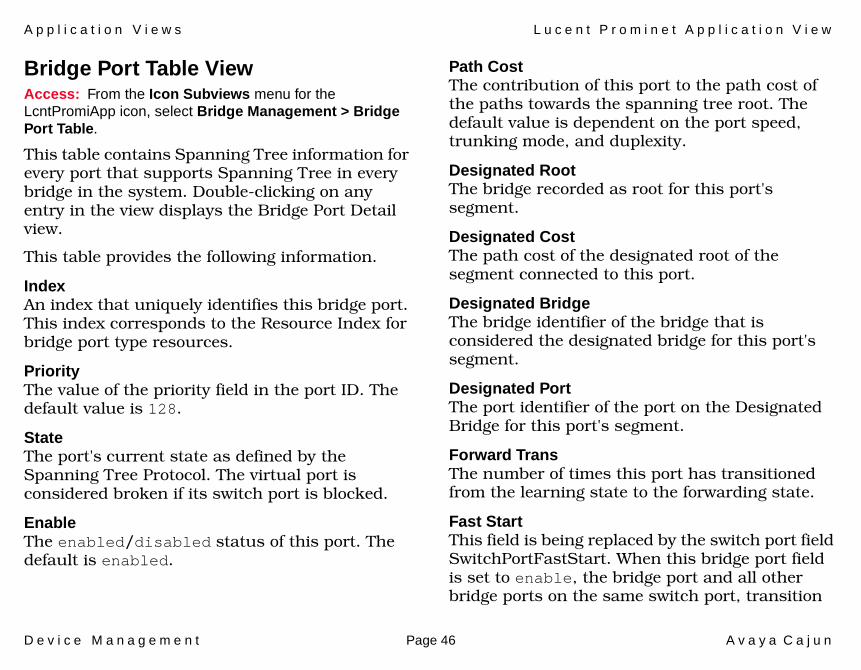
A p p l i c a t i o n V i e w s L u c e n t P r o m i n e t A p p l i c a t i o n V i e w
D e v i c e M a n a g e m e n t Page 46 A v a y a C a j u n
Bridge Port Table ViewAccess: From the Icon Subviews menu for the LcntPromiApp icon, select Bridge Management > Bridge Port Table.
This table contains Spanning Tree information for every port that supports Spanning Tree in every bridge in the system. Double-clicking on any entry in the view displays the Bridge Port Detail view.
This table provides the following information.
IndexAn index that uniquely identifies this bridge port. This index corresponds to the Resource Index for bridge port type resources.
PriorityThe value of the priority field in the port ID. The default value is 128.
StateThe port's current state as defined by the Spanning Tree Protocol. The virtual port is considered broken if its switch port is blocked.
EnableThe enabled/disabled status of this port. The default is enabled.
Path CostThe contribution of this port to the path cost of the paths towards the spanning tree root. The default value is dependent on the port speed, trunking mode, and duplexity.
Designated RootThe bridge recorded as root for this port's segment.
Designated CostThe path cost of the designated root of the segment connected to this port.
Designated BridgeThe bridge identifier of the bridge that is considered the designated bridge for this port's segment.
Designated PortThe port identifier of the port on the Designated Bridge for this port's segment.
Forward TransThe number of times this port has transitioned from the learning state to the forwarding state.
Fast StartThis field is being replaced by the switch port field SwitchPortFastStart. When this bridge port field is set to enable, the bridge port and all other bridge ports on the same switch port, transition
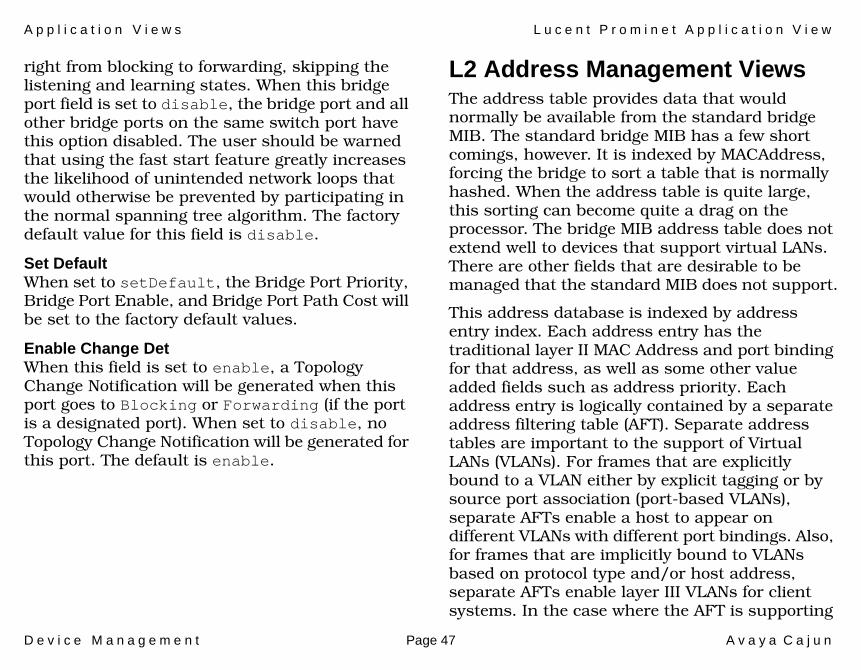
A p p l i c a t i o n V i e w s L u c e n t P r o m i n e t A p p l i c a t i o n V i e w
D e v i c e M a n a g e m e n t Page 47 A v a y a C a j u n
right from blocking to forwarding, skipping the listening and learning states. When this bridge port field is set to disable, the bridge port and all other bridge ports on the same switch port have this option disabled. The user should be warned that using the fast start feature greatly increases the likelihood of unintended network loops that would otherwise be prevented by participating in the normal spanning tree algorithm. The factory default value for this field is disable.
Set DefaultWhen set to setDefault, the Bridge Port Priority, Bridge Port Enable, and Bridge Port Path Cost will be set to the factory default values.
Enable Change DetWhen this field is set to enable, a Topology Change Notification will be generated when this port goes to Blocking or Forwarding (if the port is a designated port). When set to disable, no Topology Change Notification will be generated for this port. The default is enable.
L2 Address Management ViewsThe address table provides data that would normally be available from the standard bridge MIB. The standard bridge MIB has a few short comings, however. It is indexed by MACAddress, forcing the bridge to sort a table that is normally hashed. When the address table is quite large, this sorting can become quite a drag on the processor. The bridge MIB address table does not extend well to devices that support virtual LANs. There are other fields that are desirable to be managed that the standard MIB does not support.
This address database is indexed by address entry index. Each address entry has the traditional layer II MAC Address and port binding for that address, as well as some other value added fields such as address priority. Each address entry is logically contained by a separate address filtering table (AFT). Separate address tables are important to the support of Virtual LANs (VLANs). For frames that are explicitly bound to a VLAN either by explicit tagging or by source port association (port-based VLANs), separate AFTs enable a host to appear on different VLANs with different port bindings. Also, for frames that are implicitly bound to VLANs based on protocol type and/or host address, separate AFTs enable layer III VLANs for client systems. In the case where the AFT is supporting
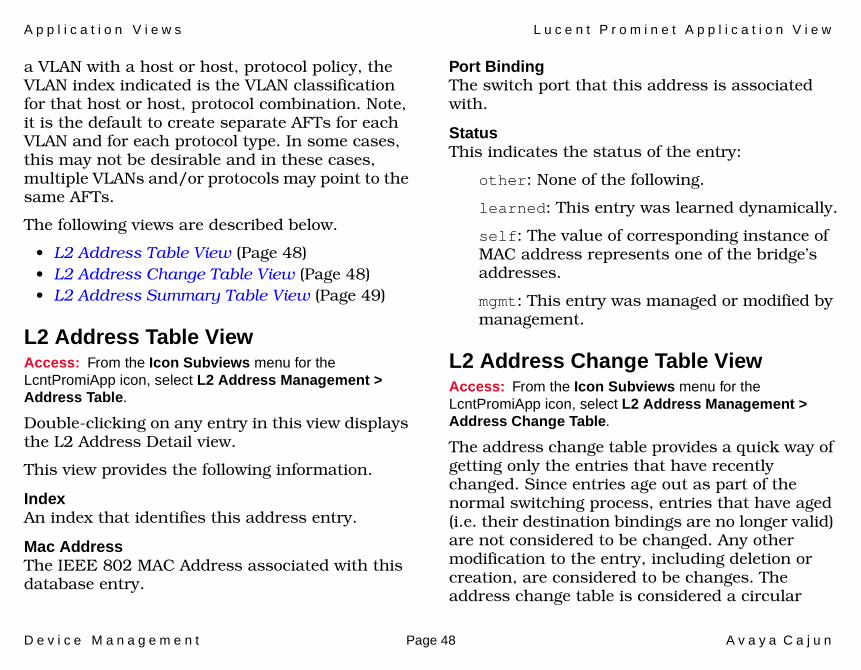
A p p l i c a t i o n V i e w s L u c e n t P r o m i n e t A p p l i c a t i o n V i e w
D e v i c e M a n a g e m e n t Page 48 A v a y a C a j u n
a VLAN with a host or host, protocol policy, the VLAN index indicated is the VLAN classification for that host or host, protocol combination. Note, it is the default to create separate AFTs for each VLAN and for each protocol type. In some cases, this may not be desirable and in these cases, multiple VLANs and/or protocols may point to the same AFTs.
The following views are described below.
• L2 Address Table View (Page 48)• L2 Address Change Table View (Page 48)• L2 Address Summary Table View (Page 49)
L2 Address Table ViewAccess: From the Icon Subviews menu for the LcntPromiApp icon, select L2 Address Management > Address Table.
Double-clicking on any entry in this view displays the L2 Address Detail view.
This view provides the following information.
IndexAn index that identifies this address entry.
Mac AddressThe IEEE 802 MAC Address associated with this database entry.
Port BindingThe switch port that this address is associated with.
StatusThis indicates the status of the entry:
other: None of the following.
learned: This entry was learned dynamically.
self: The value of corresponding instance of MAC address represents one of the bridge’s addresses.
mgmt: This entry was managed or modified by management.
L2 Address Change Table ViewAccess: From the Icon Subviews menu for the LcntPromiApp icon, select L2 Address Management > Address Change Table.
The address change table provides a quick way of getting only the entries that have recently changed. Since entries age out as part of the normal switching process, entries that have aged (i.e. their destination bindings are no longer valid) are not considered to be changed. Any other modification to the entry, including deletion or creation, are considered to be changes. The address change table is considered a circular
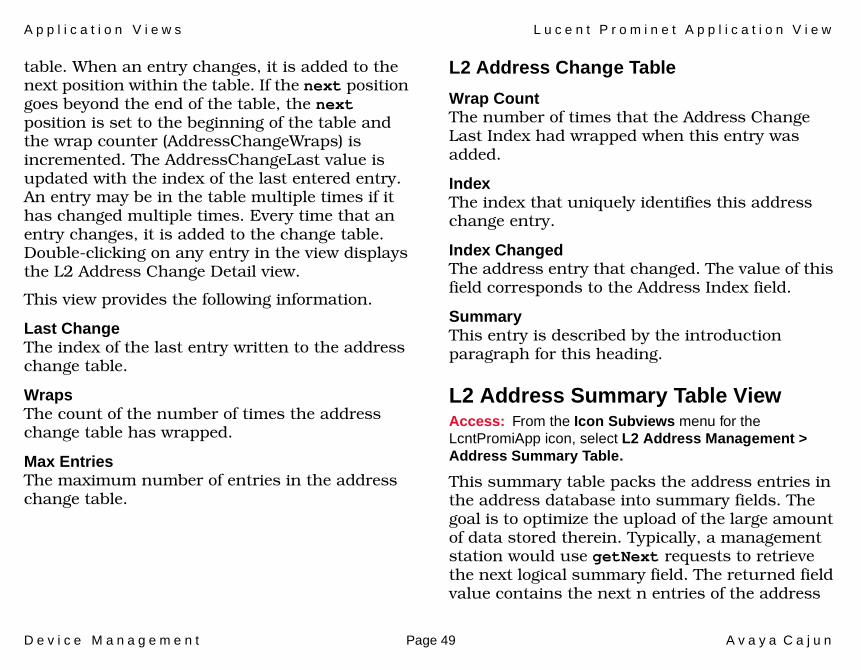
A p p l i c a t i o n V i e w s L u c e n t P r o m i n e t A p p l i c a t i o n V i e w
D e v i c e M a n a g e m e n t Page 49 A v a y a C a j u n
table. When an entry changes, it is added to the next position within the table. If the next position goes beyond the end of the table, the next position is set to the beginning of the table and the wrap counter (AddressChangeWraps) is incremented. The AddressChangeLast value is updated with the index of the last entered entry. An entry may be in the table multiple times if it has changed multiple times. Every time that an entry changes, it is added to the change table. Double-clicking on any entry in the view displays the L2 Address Change Detail view.
This view provides the following information.
Last ChangeThe index of the last entry written to the address change table.
WrapsThe count of the number of times the address change table has wrapped.
Max EntriesThe maximum number of entries in the address change table.
L2 Address Change Table
Wrap CountThe number of times that the Address Change Last Index had wrapped when this entry was added.
IndexThe index that uniquely identifies this address change entry.
Index ChangedThe address entry that changed. The value of this field corresponds to the Address Index field.
SummaryThis entry is described by the introduction paragraph for this heading.
L2 Address Summary Table ViewAccess: From the Icon Subviews menu for the LcntPromiApp icon, select L2 Address Management > Address Summary Table.
This summary table packs the address entries in the address database into summary fields. The goal is to optimize the upload of the large amount of data stored therein. Typically, a management station would use getNext requests to retrieve the next logical summary field. The returned field value contains the next n entries of the address
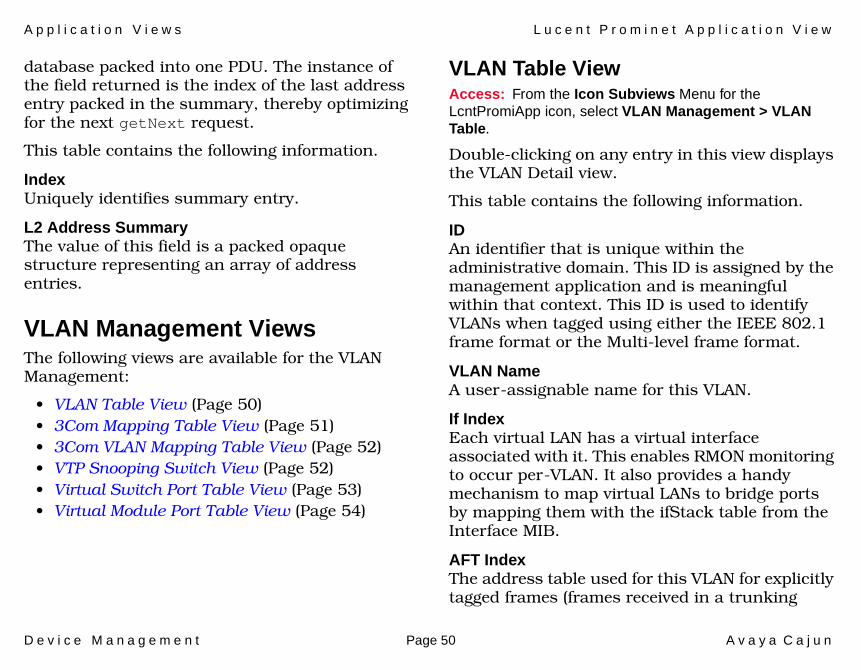
A p p l i c a t i o n V i e w s L u c e n t P r o m i n e t A p p l i c a t i o n V i e w
D e v i c e M a n a g e m e n t Page 50 A v a y a C a j u n
database packed into one PDU. The instance of the field returned is the index of the last address entry packed in the summary, thereby optimizing for the next getNext request.
This table contains the following information.
IndexUniquely identifies summary entry.
L2 Address SummaryThe value of this field is a packed opaque structure representing an array of address entries.
VLAN Management ViewsThe following views are available for the VLAN Management:
• VLAN Table View (Page 50)• 3Com Mapping Table View (Page 51)• 3Com VLAN Mapping Table View (Page 52)• VTP Snooping Switch View (Page 52)• Virtual Switch Port Table View (Page 53)• Virtual Module Port Table View (Page 54)
VLAN Table ViewAccess: From the Icon Subviews Menu for the LcntPromiApp icon, select VLAN Management > VLAN Table.
Double-clicking on any entry in this view displays the VLAN Detail view.
This table contains the following information.
IDAn identifier that is unique within the administrative domain. This ID is assigned by the management application and is meaningful within that context. This ID is used to identify VLANs when tagged using either the IEEE 802.1 frame format or the Multi-level frame format.
VLAN NameA user-assignable name for this VLAN.
If IndexEach virtual LAN has a virtual interface associated with it. This enables RMON monitoring to occur per-VLAN. It also provides a handy mechanism to map virtual LANs to bridge ports by mapping them with the ifStack table from the Interface MIB.
AFT IndexThe address table used for this VLAN for explicitly tagged frames (frames received in a trunking
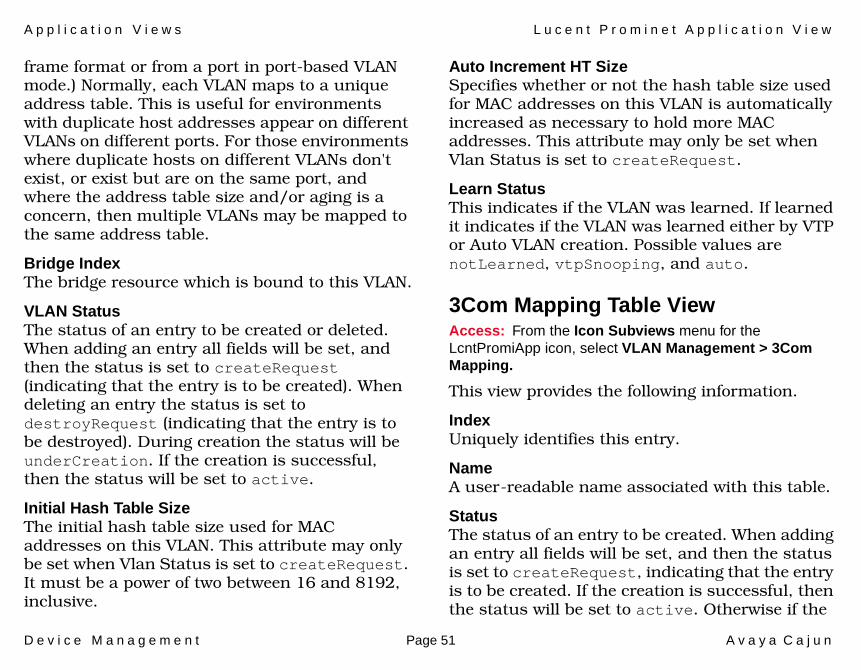
A p p l i c a t i o n V i e w s L u c e n t P r o m i n e t A p p l i c a t i o n V i e w
D e v i c e M a n a g e m e n t Page 51 A v a y a C a j u n
frame format or from a port in port-based VLAN mode.) Normally, each VLAN maps to a unique address table. This is useful for environments with duplicate host addresses appear on different VLANs on different ports. For those environments where duplicate hosts on different VLANs don't exist, or exist but are on the same port, and where the address table size and/or aging is a concern, then multiple VLANs may be mapped to the same address table.
Bridge IndexThe bridge resource which is bound to this VLAN.
VLAN StatusThe status of an entry to be created or deleted. When adding an entry all fields will be set, and then the status is set to createRequest (indicating that the entry is to be created). When deleting an entry the status is set to destroyRequest (indicating that the entry is to be destroyed). During creation the status will be underCreation. If the creation is successful, then the status will be set to active.
Initial Hash Table SizeThe initial hash table size used for MAC addresses on this VLAN. This attribute may only be set when Vlan Status is set to createRequest. It must be a power of two between 16 and 8192, inclusive.
Auto Increment HT SizeSpecifies whether or not the hash table size used for MAC addresses on this VLAN is automatically increased as necessary to hold more MAC addresses. This attribute may only be set when Vlan Status is set to createRequest.
Learn StatusThis indicates if the VLAN was learned. If learned it indicates if the VLAN was learned either by VTP or Auto VLAN creation. Possible values are notLearned, vtpSnooping, and auto.
3Com Mapping Table ViewAccess: From the Icon Subviews menu for the LcntPromiApp icon, select VLAN Management > 3Com Mapping.
This view provides the following information.
Index Uniquely identifies this entry.
NameA user-readable name associated with this table.
StatusThe status of an entry to be created. When adding an entry all fields will be set, and then the status is set to createRequest, indicating that the entry is to be created. If the creation is successful, then the status will be set to active. Otherwise if the
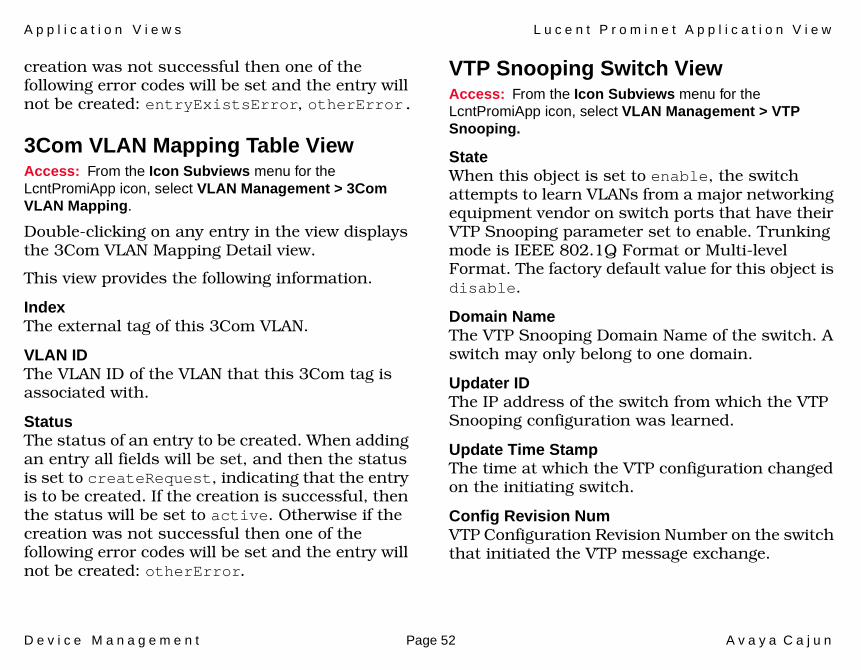
A p p l i c a t i o n V i e w s L u c e n t P r o m i n e t A p p l i c a t i o n V i e w
D e v i c e M a n a g e m e n t Page 52 A v a y a C a j u n
creation was not successful then one of the following error codes will be set and the entry will not be created: entryExistsError, otherError.
3Com VLAN Mapping Table ViewAccess: From the Icon Subviews menu for the LcntPromiApp icon, select VLAN Management > 3Com VLAN Mapping.
Double-clicking on any entry in the view displays the 3Com VLAN Mapping Detail view.
This view provides the following information.
Index The external tag of this 3Com VLAN.
VLAN IDThe VLAN ID of the VLAN that this 3Com tag is associated with.
StatusThe status of an entry to be created. When adding an entry all fields will be set, and then the status is set to createRequest, indicating that the entry is to be created. If the creation is successful, then the status will be set to active. Otherwise if the creation was not successful then one of the following error codes will be set and the entry will not be created: otherError.
VTP Snooping Switch ViewAccess: From the Icon Subviews menu for the LcntPromiApp icon, select VLAN Management > VTP Snooping.
StateWhen this object is set to enable, the switch attempts to learn VLANs from a major networking equipment vendor on switch ports that have their VTP Snooping parameter set to enable. Trunking mode is IEEE 802.1Q Format or Multi-level Format. The factory default value for this object is disable.
Domain NameThe VTP Snooping Domain Name of the switch. A switch may only belong to one domain.
Updater IDThe IP address of the switch from which the VTP Snooping configuration was learned.
Update Time StampThe time at which the VTP configuration changed on the initiating switch.
Config Revision NumVTP Configuration Revision Number on the switch that initiated the VTP message exchange.
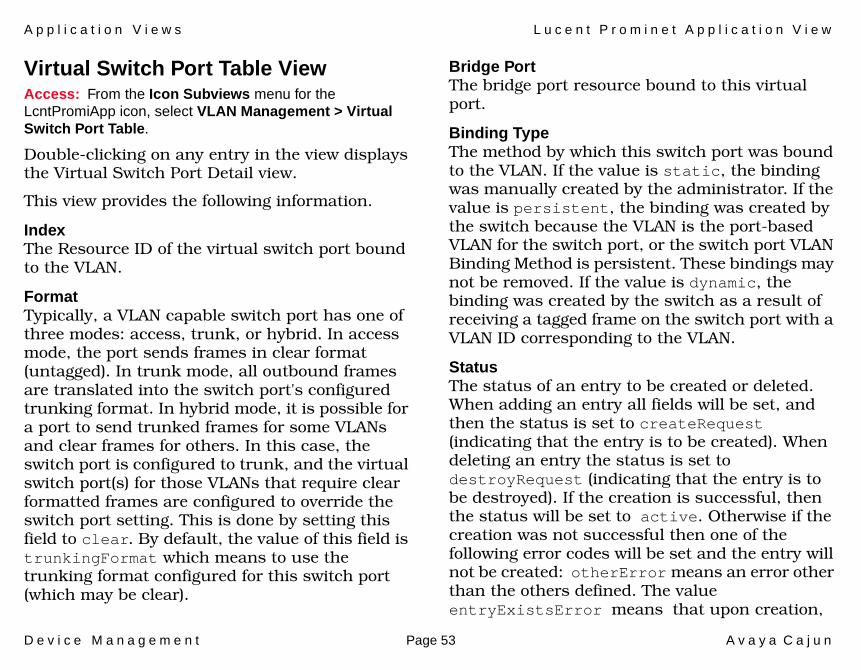
A p p l i c a t i o n V i e w s L u c e n t P r o m i n e t A p p l i c a t i o n V i e w
D e v i c e M a n a g e m e n t Page 53 A v a y a C a j u n
Virtual Switch Port Table ViewAccess: From the Icon Subviews menu for the LcntPromiApp icon, select VLAN Management > Virtual Switch Port Table.
Double-clicking on any entry in the view displays the Virtual Switch Port Detail view.
This view provides the following information.
IndexThe Resource ID of the virtual switch port bound to the VLAN.
FormatTypically, a VLAN capable switch port has one of three modes: access, trunk, or hybrid. In access mode, the port sends frames in clear format (untagged). In trunk mode, all outbound frames are translated into the switch port's configured trunking format. In hybrid mode, it is possible for a port to send trunked frames for some VLANs and clear frames for others. In this case, the switch port is configured to trunk, and the virtual switch port(s) for those VLANs that require clear formatted frames are configured to override the switch port setting. This is done by setting this field to clear. By default, the value of this field is trunkingFormat which means to use the trunking format configured for this switch port (which may be clear).
Bridge PortThe bridge port resource bound to this virtual port.
Binding TypeThe method by which this switch port was bound to the VLAN. If the value is static, the binding was manually created by the administrator. If the value is persistent, the binding was created by the switch because the VLAN is the port-based VLAN for the switch port, or the switch port VLAN Binding Method is persistent. These bindings may not be removed. If the value is dynamic, the binding was created by the switch as a result of receiving a tagged frame on the switch port with a VLAN ID corresponding to the VLAN.
StatusThe status of an entry to be created or deleted. When adding an entry all fields will be set, and then the status is set to createRequest (indicating that the entry is to be created). When deleting an entry the status is set to destroyRequest (indicating that the entry is to be destroyed). If the creation is successful, then the status will be set to active. Otherwise if the creation was not successful then one of the following error codes will be set and the entry will not be created: otherError means an error other than the others defined. The value entryExistsError means that upon creation,
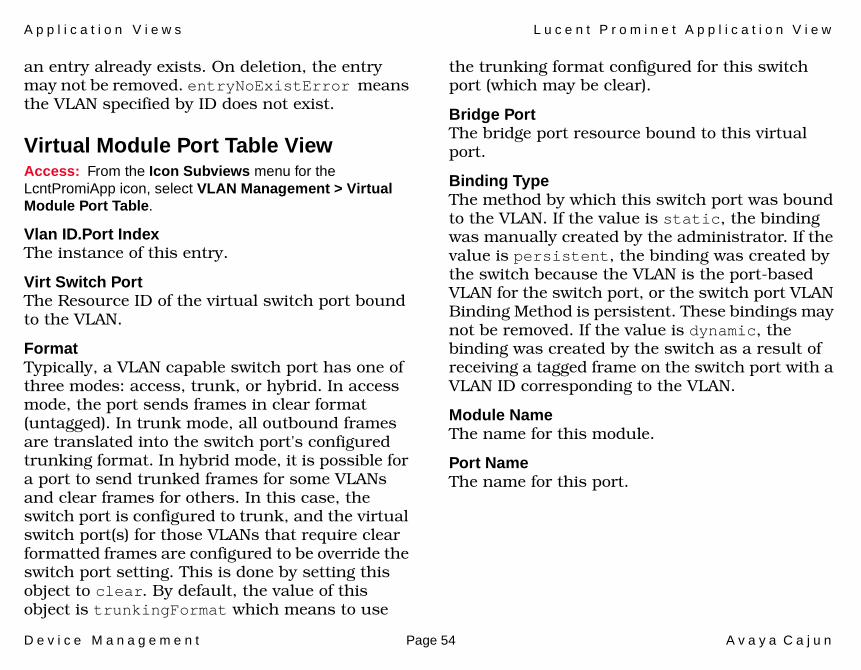
A p p l i c a t i o n V i e w s L u c e n t P r o m i n e t A p p l i c a t i o n V i e w
D e v i c e M a n a g e m e n t Page 54 A v a y a C a j u n
an entry already exists. On deletion, the entry may not be removed. entryNoExistError means the VLAN specified by ID does not exist.
Virtual Module Port Table ViewAccess: From the Icon Subviews menu for the LcntPromiApp icon, select VLAN Management > Virtual Module Port Table.
Vlan ID.Port IndexThe instance of this entry.
Virt Switch PortThe Resource ID of the virtual switch port bound to the VLAN.
FormatTypically, a VLAN capable switch port has one of three modes: access, trunk, or hybrid. In access mode, the port sends frames in clear format (untagged). In trunk mode, all outbound frames are translated into the switch port's configured trunking format. In hybrid mode, it is possible for a port to send trunked frames for some VLANs and clear frames for others. In this case, the switch port is configured to trunk, and the virtual switch port(s) for those VLANs that require clear formatted frames are configured to be override the switch port setting. This is done by setting this object to clear. By default, the value of this object is trunkingFormat which means to use
the trunking format configured for this switch port (which may be clear).
Bridge PortThe bridge port resource bound to this virtual port.
Binding TypeThe method by which this switch port was bound to the VLAN. If the value is static, the binding was manually created by the administrator. If the value is persistent, the binding was created by the switch because the VLAN is the port-based VLAN for the switch port, or the switch port VLAN Binding Method is persistent. These bindings may not be removed. If the value is dynamic, the binding was created by the switch as a result of receiving a tagged frame on the switch port with a VLAN ID corresponding to the VLAN.
Module NameThe name for this module.
Port NameThe name for this port.
A p p l i c a t i o n V i e w s L u c e n t P r o m i n e t A p p l i c a t i o n V i e w
D e v i c e M a n a g e m e n t Page 55 A v a y a C a j u n
Event Management ViewsThe following view are described below.
• Event Table View (Page 55)• Event Log Table View (Page 55)• Event Shutdown Log Table View (Page 57)• Event Trap Management View (Page 58)
Event Table ViewAccess: From the Icon Subviews menu for the LcntPromiApp icon, select Event Management > Event Table.
Double-clicking on any entry in this view displays the Event Detail view.
This table provides the following information.
IndexThis is an unique identifier for this entry.
LabelThe name of this entry.
ModeDisabling an event prevents this event from taking any actions when triggered. When set to enable to the console, the event will print the event information to the console serial port. The user can select whether to view log messages, trap messages or any event at the console.
Log ActionWhen enabled, this action will cause an event log entry to be created.
Trap ActionWhen enabled, this event will cause an SNMP trap to be generated.
Console ActionWhen enabled, this event will cause a message to be printed to the console serial port.
Event Log Table ViewAccess: From the Icon Subviews menu for the LcntPromiApp icon, select Event Management > Event Log.
Double-clicking on any entry in the view displays the Event Log Detail view.
This view provides the following information.
Table Max SizeThe maximum number of entries in the log table. Changing this value causes the existing log to be truncated and rebuilt.
Last EntryThe log index of the last entry entered in the log.
WrapsThe number of times that the last entry has wrapped from 65K back to 1.
A p p l i c a t i o n V i e w s L u c e n t P r o m i n e t A p p l i c a t i o n V i e w
D e v i c e M a n a g e m e n t Page 56 A v a y a C a j u n
Event Log Table
Event IndexThe index that uniquely identifies the event that caused this log entry.
IndexAn index that uniquely identifies this log entry.
TimeThe value of sysUpTime when this event was triggered.
DescriptionThe event log description.
TypeThe type of event that caused this log entry.
SeverityThe severity associated with this event. It is recommended that the severity be interpreted in the following manner: 0-19: Normal, 20-39: Informational, 40-59: Warning, 60-79: Alarm, 80-99: Severe Error 100: Failure.
DTMThe date and time when this log entry was made. The format is yy-Mon-dd hh:mm:ss, time is in 24 hour time.
Res TypeThe type of object (if provided) that triggered this event. If not provided, the value is equal to Invalid Resource.
Res IDThe instance of this resource that triggered this event.
Res LeafA number corresponding to the attribute associated with this resource and this event entry. It corresponds exactly to the leaf MIB number of the MIB that manages this resource. For example, if a port's mode changed, the configuration event log entry would indicate the value of 5 which is the leaf index of the Port Mode within the Port Table MIB table.
Value TypeThe data type associated with the log event value. This field indicates how to interpret the data stored in the event log value: none indicates no value returned. Integer32 indicates a 4 byte unsigned integer. Integer64 indicates 8 byte unsigned integer. DisplayString indicates a null terminated (or up to 8 characters) string. Ipv4NetworkAddress indicates a 4 byte IP version 4 network address. The value ee802MACAddress indicates a 6 byte MAC
A p p l i c a t i o n V i e w s L u c e n t P r o m i n e t A p p l i c a t i o n V i e w
D e v i c e M a n a g e m e n t Page 57 A v a y a C a j u n
Address. Timeticks indicates sysUpTime type value (4 bytes).
ValueThe value associated with the event encoded in an octet string. Refer to the Value Type for how to interpret this value. The value encoded in this string is in Big Endian order.
Epoch TimeThe number of time ticks since the epoch when this event was logged.
IDA unique index that identifies the occurrence of this event. This ID can be correlated between traps, logs and the like.
Event Shutdown Log Table ViewAccess: From the Icon Subviews menu for the LcntPromiApp icon, select Event Management > Shutdown Log.
The most recent event log entries are stored in non-volatile memory. In the event of a system restart, it may be useful to look at the last few events that were logged before the system last went down. The Shutdown Log Table stores those last events. Double-clicking on any entry in this view displays the Event Shutdown Log Detail view.
This view contains the following information.
Table Max SizeThe maximum number of entries in the non-volatile log table. Changing the value of this object changes the maximum number of entries to be stored in Shutdown.
Last EntryThe ID of the last entry made to the shutdown log.
AcknowledgedThis field is set to acknowledged the first time the Shutdown Log Table is accessed indicating that the Shutdown log has been read (at least once) since the system restarted.
Event Shutdown Log Table
Event IndexThe index that uniquely identifies the event that caused this Shutdown Log entry.
IndexAn index that uniquely identifies this ShutdownLog entry.
TimeThe value of sysUpTime when this event was triggered. Note, the value corresponds to the sysUpTime when the system was last running (i.e. before it was shutdown).
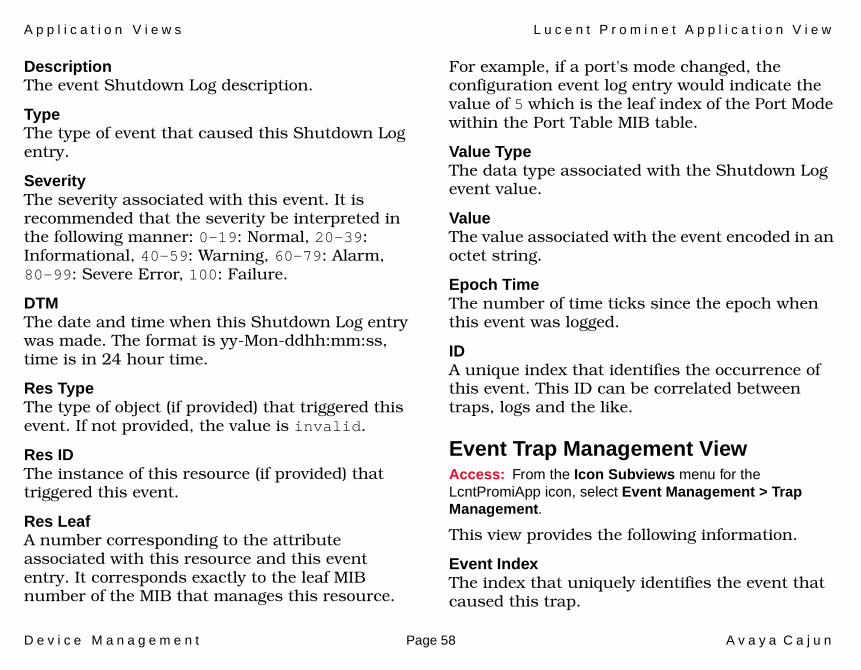
A p p l i c a t i o n V i e w s L u c e n t P r o m i n e t A p p l i c a t i o n V i e w
D e v i c e M a n a g e m e n t Page 58 A v a y a C a j u n
DescriptionThe event Shutdown Log description.
Type The type of event that caused this Shutdown Log entry.
SeverityThe severity associated with this event. It is recommended that the severity be interpreted in the following manner: 0-19: Normal, 20-39: Informational, 40-59: Warning, 60-79: Alarm, 80-99: Severe Error, 100: Failure.
DTMThe date and time when this Shutdown Log entry was made. The format is yy-Mon-ddhh:mm:ss, time is in 24 hour time.
Res TypeThe type of object (if provided) that triggered this event. If not provided, the value is invalid.
Res IDThe instance of this resource (if provided) that triggered this event.
Res LeafA number corresponding to the attribute associated with this resource and this event entry. It corresponds exactly to the leaf MIB number of the MIB that manages this resource.
For example, if a port's mode changed, the configuration event log entry would indicate the value of 5 which is the leaf index of the Port Mode within the Port Table MIB table.
Value TypeThe data type associated with the Shutdown Log event value.
ValueThe value associated with the event encoded in an octet string.
Epoch TimeThe number of time ticks since the epoch when this event was logged.
IDA unique index that identifies the occurrence of this event. This ID can be correlated between traps, logs and the like.
Event Trap Management ViewAccess: From the Icon Subviews menu for the LcntPromiApp icon, select Event Management > Trap Management.
This view provides the following information.
Event IndexThe index that uniquely identifies the event that caused this trap.
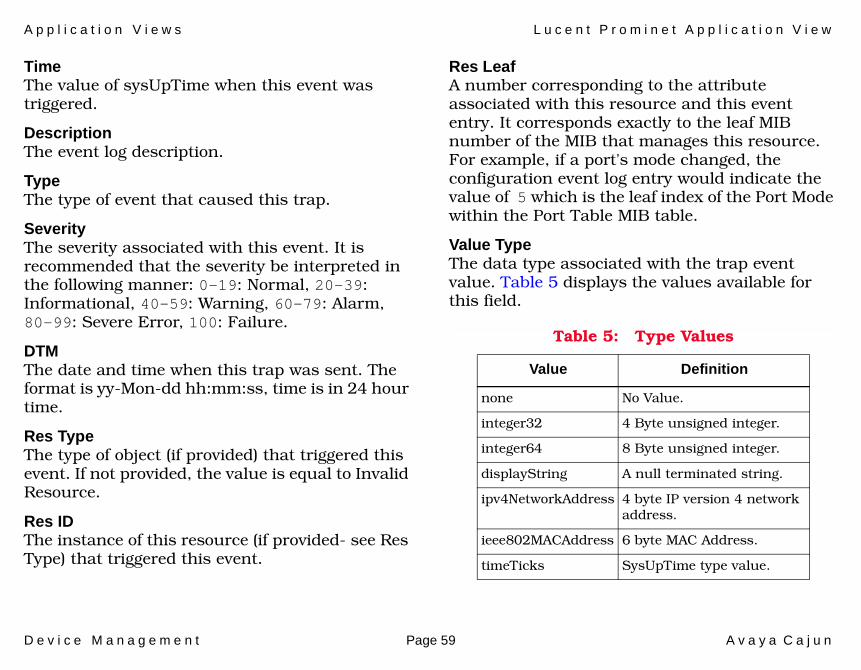
A p p l i c a t i o n V i e w s L u c e n t P r o m i n e t A p p l i c a t i o n V i e w
D e v i c e M a n a g e m e n t Page 59 A v a y a C a j u n
TimeThe value of sysUpTime when this event was triggered.
DescriptionThe event log description.
TypeThe type of event that caused this trap.
SeverityThe severity associated with this event. It is recommended that the severity be interpreted in the following manner: 0-19: Normal, 20-39: Informational, 40-59: Warning, 60-79: Alarm, 80-99: Severe Error, 100: Failure.
DTMThe date and time when this trap was sent. The format is yy-Mon-dd hh:mm:ss, time is in 24 hour time.
Res TypeThe type of object (if provided) that triggered this event. If not provided, the value is equal to Invalid Resource.
Res IDThe instance of this resource (if provided- see Res Type) that triggered this event.
Res LeafA number corresponding to the attribute associated with this resource and this event entry. It corresponds exactly to the leaf MIB number of the MIB that manages this resource. For example, if a port's mode changed, the configuration event log entry would indicate the value of 5 which is the leaf index of the Port Mode within the Port Table MIB table.
Value TypeThe data type associated with the trap event value. Table 5 displays the values available for this field.
Table 5: Type Values
Value Definition
none No Value.
integer32 4 Byte unsigned integer.
integer64 8 Byte unsigned integer.
displayString A null terminated string.
ipv4NetworkAddress 4 byte IP version 4 network address.
ieee802MACAddress 6 byte MAC Address.
timeTicks SysUpTime type value.
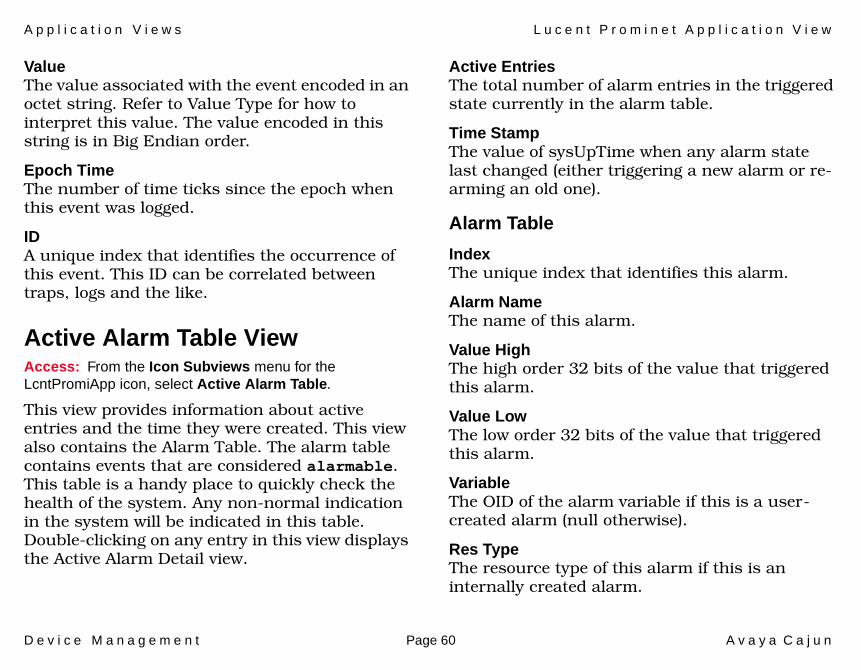
A p p l i c a t i o n V i e w s L u c e n t P r o m i n e t A p p l i c a t i o n V i e w
D e v i c e M a n a g e m e n t Page 60 A v a y a C a j u n
ValueThe value associated with the event encoded in an octet string. Refer to Value Type for how to interpret this value. The value encoded in this string is in Big Endian order.
Epoch TimeThe number of time ticks since the epoch when this event was logged.
IDA unique index that identifies the occurrence of this event. This ID can be correlated between traps, logs and the like.
Active Alarm Table ViewAccess: From the Icon Subviews menu for the LcntPromiApp icon, select Active Alarm Table.
This view provides information about active entries and the time they were created. This view also contains the Alarm Table. The alarm table contains events that are considered alarmable. This table is a handy place to quickly check the health of the system. Any non-normal indication in the system will be indicated in this table. Double-clicking on any entry in this view displays the Active Alarm Detail view.
Active EntriesThe total number of alarm entries in the triggered state currently in the alarm table.
Time StampThe value of sysUpTime when any alarm state last changed (either triggering a new alarm or re-arming an old one).
Alarm Table
IndexThe unique index that identifies this alarm.
Alarm NameThe name of this alarm.
Value HighThe high order 32 bits of the value that triggered this alarm.
Value LowThe low order 32 bits of the value that triggered this alarm.
VariableThe OID of the alarm variable if this is a user-created alarm (null otherwise).
Res TypeThe resource type of this alarm if this is an internally created alarm.
A p p l i c a t i o n V i e w s L u c e n t P r o m i n e t A p p l i c a t i o n V i e w
D e v i c e M a n a g e m e n t Page 61 A v a y a C a j u n
Res IDThe resource identifier associated with this alarm if this is an internally created alarm.
Leaf The leaf index of the MIB table used to manage this resource that is associated with this alarm, if this is an internally created alarm. For example, if this alarm was created to monitor a port's status, then the value of this field will be 6, corresponding to the leaf index of the Port Status field.
Alarm OwnerThis is the owner of the alarm.
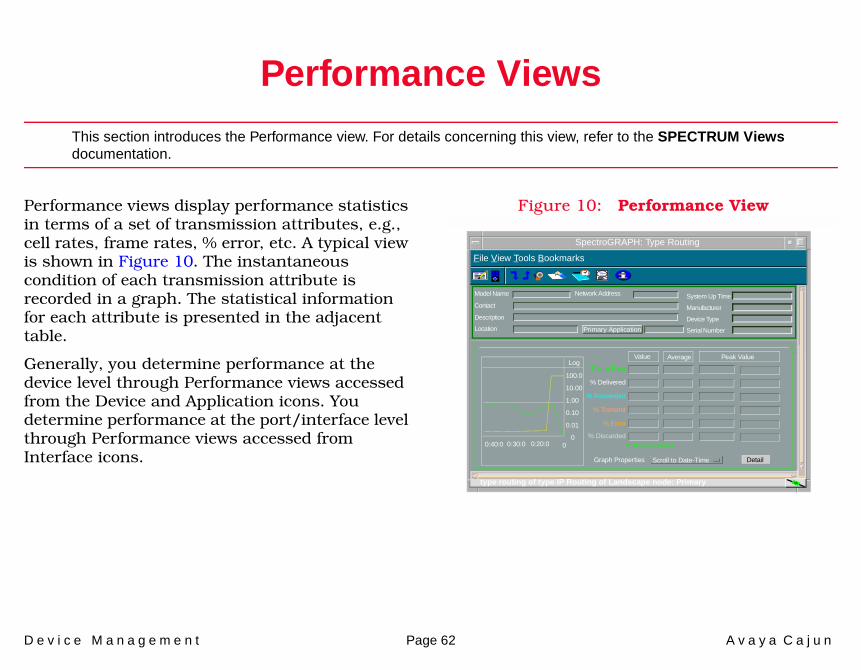
D e v i c e M a n a g e m e n t Page 62 A v a y a C a j u n
Performance Views
This section introduces the Performance view. For details concerning this view, refer to the SPECTRUM Views documentation.
Performance views display performance statistics in terms of a set of transmission attributes, e.g., cell rates, frame rates, % error, etc. A typical view is shown in Figure 10. The instantaneous condition of each transmission attribute is recorded in a graph. The statistical information for each attribute is presented in the adjacent table.
Generally, you determine performance at the device level through Performance views accessed from the Device and Application icons. You determine performance at the port/interface level through Performance views accessed from Interface icons.
Figure 10: Performance View
SpectroGRAPH: Type Routing
Model Name
Contact
Description
Location
Network Address System Up Time
Manufacturer
Device Type
Serial Number
Log
100.0
10.00
1.00
0.10
0.01
000:40:0 0:30:0 0:20:0
Value Average Peak Value
* Frame Rate
% Delivered
% Forwarded
% Transmit
% Error
DetailGraph Properties Scroll to Date-Time
File View Tools Bookmarks
% Discarded*Frames per second
type routing of type IP Routing of Landscape node: Primary
Primary Application
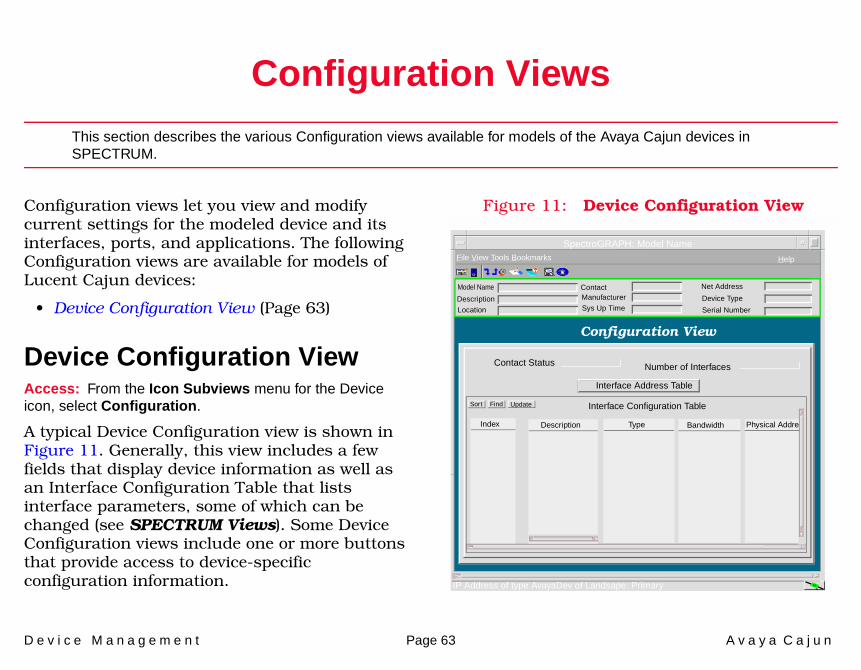
D e v i c e M a n a g e m e n t Page 63 A v a y a C a j u n
Configuration Views
This section describes the various Configuration views available for models of the Avaya Cajun devices in SPECTRUM.
Configuration views let you view and modify current settings for the modeled device and its interfaces, ports, and applications. The following Configuration views are available for models of Lucent Cajun devices:
• Device Configuration View (Page 63)
Device Configuration ViewAccess: From the Icon Subviews menu for the Device icon, select Configuration.
A typical Device Configuration view is shown in Figure 11. Generally, this view includes a few fields that display device information as well as an Interface Configuration Table that lists interface parameters, some of which can be changed (see SPECTRUM Views). Some Device Configuration views include one or more buttons that provide access to device-specific configuration information.
Figure 11: Device Configuration View
SpectroGRAPH: Model Name
Model Name
File View Tools Bookmarks Help
Description
Location
ContactManufacturer
Sys Up Time
Net Address
Device Type
Serial Number
Configuration View
Contact Status Number of Interfaces
Interface Address Table
Sort Interface Configuration Table
Index Description Type Bandwidth Physical Addre
IP Address of type AvayaDev of Landsape: Primary
Find Update
C o n f i g u r a t i o n V i e w s D e v i c e C o n f i g u r a t i o n V i e w
D e v i c e M a n a g e m e n t Page 64 A v a y a C a j u n
Refer to the SPECTRUM Views documentation.
Refer to the SPECTRUM Views documentation.
Redundancy and Model Reconfiguration Options
Interface Address Translation
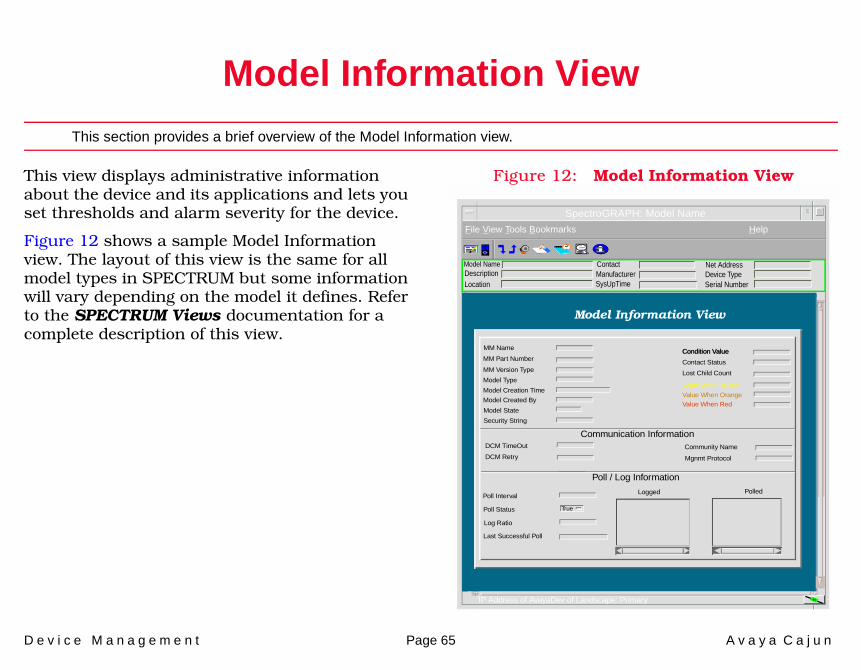
D e v i c e M a n a g e m e n t Page 65 A v a y a C a j u n
Model Information View
This section provides a brief overview of the Model Information view.
This view displays administrative information about the device and its applications and lets you set thresholds and alarm severity for the device.
Figure 12 shows a sample Model Information view. The layout of this view is the same for all model types in SPECTRUM but some information will vary depending on the model it defines. Refer to the SPECTRUM Views documentation for a complete description of this view.
Figure 12: Model Information View
Model Name ContactDescriptionLocation
SpectroGRAPH: Model Name
File View Tools Bookmarks Help
IP Address of AvayaDev of Landscape: Primary
ManufacturerSysUpTime
Net AddressDevice TypeSerial Number
Model Information View
MM Name
MM Part Number
MM Version Type
Model Type
Model Creation Time
Model Created By
Model State
Security String
Communication Information
Poll / Log Information
Condition Value
Contact Status
DCM TimeOut
DCM Retry
Lost Child Count
Value When Yellow
Value When OrangeValue When Red
Community Name
Mgnmt Protocol
Poll Interval
Poll Status
Log Ratio
Last Successful Poll
Logged Polled
True
Condition Value
D e v i c e M a n a g e m e n t Page 66 A v a y a C a j u n
Index
AAddress
Interface IP 11Physical (MAC) 11Translation 12
Admin Status 10Agent Community Table 25Agent View 25Applications 21Avaya 6, 13Avaya Cajun Module Icon 13Avaya Cajun P55OR Routing
Switch 6Avaya Cajun P882 MultiService
Switch 6
BBridge Management 44
Bridge Port Table 46Bridge Table 44
CChassis Device View 12
Chassis family 26Community String 25Configuration
Device 63Convert to Static 39
DDevice-Specific MIBs 23DevTop Views 17Documentation 5
HHardware 6Hunt Group 40
IIcon
Chassis Module 13Icons
Device 6Interface 10
Interface 10, 11
Type, Device 10Interface Labels 16Interface Number 16Interface Status 16IP 11
KKnown Mode 40
LL2 Address Management 47Lucent Cajun P550R Routing
Switch 6
MManagement Tasks 8Mapping Method 40Mask 12MIBs 23Mirror Port 44Model
Information 65
I n d e x I n d e x
D e v i c e M a n a g e m e n t Page 67 A v a y a C a j u n
Module 13Module Number Label 13Module Table 26
NNetwork 11Network I/O ports 17Network Type 11
OOnLine Help 10
PPerformance Statistics 62Physical 11Port
Auto-Negotiation Table 35Category Mode 35Category Table 35Duplex Mode 33Duplex Table 33Fabric 37Flow Control Mode 32Flow Control Table 32Index 32, 33, 34, 35, 36Management Views 30
Mirror 44Mirroring Table 43Name 30Pace Priority Table 34Physical 40Rate Limit Table 34Source Sub 44Speed Mode 33Speed Table 33Table View 30Type 30
Port Number, Device 10
SSerial ports 17Source Sub Port 44STAP Mode 39STP Configuration 38Switch Configuration
Port Mirroring Table 43Switch Management 38
Configuration 38Hunt Group Table 42Switch Port Table 39
TThreshold Information 11Time Since Topology Chance 45
Troubleshooting 8Trunking Mode 40
VVlan Binding Method 41VLAN Fault Isolation View 20VLAN Management 50
3Com Mapping Table 513Com VLAN Mapping Table 52Virtual Switch Port Table 53VLAN Table 50
WWeb Server URL 25

I n d e x I n d e x
D e v i c e M a n a g e m e n t Page 68 A v a y a C a j u n