Embed Size (px)
Citation preview
Available online www.jsaer.com
Journal of Scientific and Engineering Research
354
Journal of Scientific and Engineering Research, 2016, 3(3):354-366
Research Article
ISSN: 2394-2630
CODEN(USA): JSERBR
Application of Geophysics and Geology as Complimentary Veritable Tools to
Investigate the Subsurface Lithological Content and its Mineralization Potential
Abdulbariu Ibrahim
Geology Department, Federal University Lokoja P.M.B 1154, Lokoja, Nigeria.
Abstract Both geological and geophysical campaign was carried out in Ado-Awaiye and its environs part of
Iseyin in Oyo State, southwestern Nigeria. The work was focused on the geological mapping, study of the
different rock units and geomagnetic investigation of the subsurface in order to determine the structural
elements and mineral resources of the area. Information such as strike, dip alongside with total magnetic
intensity etc acquired on the field were used to establish field relations and geological boundaries which aided in
the deduction of origin and evolution of the different rock units and the geological history of the area.Field
traversing, rock sample collections and petrographic investigations revealed migmatite-gneiss and hornblende
granite-gneiss with some associated minor rock units such as amphibolite and pegmatite characterized by
minerals: biotite, muscovite, k-feldspar, Plagioclase feldspar, quartz, hornblende and microcline. The rocks are
also characterized by structures such as ptygmatic folds, joints, fault, foliation, mineral lineation, veins and also
bears the imprints of Pan African orogeny.
Magnetic traverses were also designed to deduce the character of buried subsurface rock and the depth to their
top aimed at revealing the subsurface basement lithology and its mineralization. Total magnetic field intensity
ranging from 30446.47nT to 33536.10nT (nanotesla) characterized the area. Regional-residual separation and
half - width methods were applied and results presented as magnetic map and profiles. Qualitative and
quantitative interpretations were made based on the maps and profiles. Differences in the magnetic data reveals
variation in the lithological and mineralogical content of the basement with the higher value corresponding
probably to the amphibolite (basic) component and the lower value corresponding to the granitic or gneissic
component of the migmatite-gneiss being higher at the west and lower at the east with basement depth ranging
from 2.5m to 15.5mwith few basement lineament, suprabasement and intrabasement block.
Keywords Geological mapping, Total magnetic intensity, Magnetic basement, Ptygmatic fold, Suprabasement,
Intrabasement.
Introduction
The Study area Ado-Awaiye and its environs is part of Iseyin Local Government Area of Oyo State and falls
within Latitudes 07O48’00’’N and 07
O54’00’’N and on the Longitudes 003
018
’00
’’E and 003
030
’00
’’E with an
approximate area of about 220sq Km. It falls within the Basement Complex of Southwestern Nigeria which are
characterized by rocks of mainly Precambrian age. Several authors had written on the general geology of this
region with no specific account on the geology of this studied area and hence the justification for the present
detailed work aimed at reviewing the past work in order to shed more light on recent geological occurrences as
they unfold over time in the area.
Basement Complex of southwestern Nigeria
The generalized geology of Nigeria and the Basement Complex of south-western Nigeria is shown in figure 1.
Field evidences and radiometric dating have shown that the Nigerian basement complex bears the imprints of
the major orogenies in the earth history dating back to 3000 Ma and it undergone its most pervasive deformation
and remobilization during the Pan African (˂ 600 Ma) [1].

Ibrahim A Journal of Scientific and Engineering Research, 2016, 3(3):354-366
Journal of Scientific and Engineering Research
355
The basement complex is believed to be polycyclic (where rocks are found in the same environment with
different age and mode of occurrence) and has responded totally to tectonic episodes with differing relics from
Achaean to Late Proterozoic (Pan African).
The review of basement geology of southwestern Nigeria was carried out by [2] and the result shows that there
are five major rock groups which have been recognized. These include:
Migmatite-Gneiss Complex which comprises of biotite-hornblende gneiss, quartzite and quartz schist and
lenses of calc-silicate rocks.
Slightly migmatizedparaschists and metaigneous rocks, which consist of pelitic schist, quartzite talcose
rock, metaconglomerate and calc-silicate rocks. The belts are among the best-studied groups of rocks in
Nigeria [3], because of the associated mineralization of gold, banded iron formation (BIF), marble,
manganese, talc, anthophyllitic asbestos etc.
Charnockitic rocks.
Older Granite, which comprises of rocks varying in composition from granodiorite to granite and
potassicsyenite.
Unmetamorphosed dolerite dykes believed to be the youngest.
The Migmatite-Gneiss Complex was also described by [4] as the most widespread rock unit in the basement
complex of Nigeria and further stated that it is a heterogeneous assemblage including migmatites, orthogneisses,
paragneisses and a series of basic and ultrabasic metamorphosed rocks. Petrographic evidence indicates that the
Pan African reworking has led to recrystallization of many of its constituent minerals by partial melting, with
most displaying medium to upper amphibolite facies metamorphism.
The term “Older Granites” was introduced by [5] who on the basis of morphology and texture distinguished the
Pan-African granitoids from the Carboniferous-Cretaceous high level anorogenic volcanic, hypabyssal,
peralkaline, “Younger Granites” of the Jos Plateau Region. The granitoids include biotite and biotite-muscovite
granites, syenites, charnockites, diorites, monzonites, serpentinites, anorthosites etc. In many places, the coarse-
grained biotite-hornblende granites have concordant foliation with the host schists.
Figure 1: Generalised geological map of Nigeria [6]

Ibrahim A Journal of Scientific and Engineering Research, 2016, 3(3):354-366
Journal of Scientific and Engineering Research
356
The aeromagnetic survey has been applied in mapping the magnetic anomalies in the earth’s magnetic field and
correlated with the underground geological structure [7]. The main purpose of the magnetic survey is to detect
minerals or rocks that have unusual magnetic properties which reveal themselves by causing anomalies in the
intensity of the earth’s magnetic field [8]. There would always be a magnetic susceptibility contrast across a
fracture zone due to oxidation of magnetite to hematite and/or infilling of fracture planes by dyke-like bodies
whose magnetic susceptibilities are different from those of their host rocks [9]. Such geological features may
appear as thin elliptical closures or nosings on magnetic map. Faults usually show up by abrupt changes or close
spacing in orientation of the contours as revealed by the magnetic anomalies. Modern high-resolution
magnetometers are able to collect data with an accuracy of 0.001nT [10]. Removal of the regional from total
field anomaly result into residual anomaly compose of positive and negative magnetic anomalies. A positive
magnetic anomaly is a reading of magnetic field strength that is higher than the regional average which can
indicate hidden ore and geologic structures, while a negative magnetic anomaly is a reading of magnetic field
strength that is lower than the regional average [11]. Basement rock is much more magnetic than the
sedimentary rock [12] and in the geophysical literature there are number of tables of magnetic susceptibility of
rocks ([13-16]). Again, among the basement rock, basic igneous rocks are usually more magnetic due to their
relatively high magnetite and mafic content. All rocks contain some magnetite from very small fractions of a
percent up to several percent, and even several tens of percent in the case of magnetic iron ore deposits.
Materials and Methods
The topographic map used was on a scale of 1: 25000 but reduced by eight (8) to scale of 1:200000 during
digitization in order to be contained on a page.
The field work was carried out with the use of topographic map, Global Positioning System (GPS), compass
clinometer, geological hammer, field notebook, and G856AX Mag TM
proton-precision magnetometer. The
mapping was carried out systematically through traversing while the magnetic profile lines were designed with
Station interval of 10m and inter-profile interval of 10m and hence a grid coverage of 10m by 10m was
maintained throughout the magnetic survey. Each station was occupied and the total magnetic field intensity in
nanotesla was taken and recorded manually and it was subjected to computer processing. Magnetic maps were
produced and profiles drawn. Line of best fit representing the regional field was superimposed on each of the
profile in order to obtain the residual fields. After necessary data processing, the result was presented in form of
magnetic map and profiles.
During the mapping exercise strike and dip value were also measured and helped to determine the geological
boundary. Laboratory work includes thin section preparation and observations under a petrological microscope
for mineral identifications and microstructures study.
Results and Discussions
Observed Lithology, Field Relationship and Petrographic Study
The mapped area, a metamorphic terrain characterized by defined and clear orientation consists of two main
rock types of slightly contrasting characteristics. They include migmatite-gneiss and hornblende granite-gneiss
with some minor rock occurrences of amphibolite schist, pegmatitic intrusions, and quartz of eldspathic veins
which occur mostly as near linear intrusions. Some of the rocks exhibit jointing and show strong mineral
lineation and foliation. The megascopic minerals observed on these outcrops include feldspar, quartz and biotite.
From the field relation, the migmatite-gneiss appears to be the oldest rock unit.
Petrographic analysis on thin sections prepared from different rock samples observed under petrographic
microscope were carried out and identification of minerals were accomplished using their diagnostics optical
characteristics. The following alphabet(s) were used to represent each mineral on the photomicrograph: H =
Hornblende, B = Biotite, P = Plagioclase, Or = Orthoclase, Q = Quartz, A = Augite, and O = Opaque Mineral.
Migmatite-Gneiss
About 60% of the outcrops in the study area is migmatite – gneiss; a mixed rock containing igneous and
metamorphic portions. This is a metamorphic rock of highest grade. It outcrops from the center to the eastern
part of the map especially in Ado-Awaiye, Oha, Adepoju, etc. Several pegmatitic intrusions, quartz veins,
fractures and faults characterized the migmatite-gneiss. Foliation, lineation and migmatitic structures which
include folds of various kinds were also observed on the outcrop (figure 2). The folds occur as normal fold, tight
fold and ptygmatic fold i.e the initial parallel bands appear to be contorted due to compressive stress that existed
during its formation.
The general orientation of the rocks is NE-SW with moderate dip. The minerals are separated into light and dark
bands, i.e. gneissosity. The rock consists of palaeosome and the neosome. The neosome divided into lighter
bands (leucosome) consist of feldspars and quartz and muscovite while the darker bands (melanosome) contain
biotite mica and hornblende.

Ibrahim A Journal of Scientific and Engineering Research, 2016, 3(3):354-366
Journal of Scientific and Engineering Research
357
Thin section observation revealed that the rock is composed of orthoclase, plagioclase, quartz, hornblende and
biotite. Accessory minerals are also present (figure 3). Plagioclase constitutes about 40%, subhedral to
euhedral,colourless with quartz inclusion and cleavage. Quartz is about 20% and is colourless, clear and some
show conchoidal fracture and undulose extinction with no pleochroism and alteration. Orthoclase is about 15%,
colourless and cloudyin plane polarized light (PPL) and show Carlsbad twinning in cross polarized light (CPL).
Biotite is about 15%, brown to green with strong pleochroism and pleochroic haloes, and also characterized by
cleavage and moderate relief. Hornblende (about 10%) is green in colour and it is characterized by cleavage
intersection of approximately 560/124
0. Opaque mineral constitutes about 5% and it is black in both Plane
Polarised Light and Cross Polarised Light.
Hornblende-Granite Gneiss
This is a crystalline metamorphic rock in which the rock is unusually rich in hornblende. It occupies about 40%
of the mapped area outcropping on the western part of the area. They trend from nearly North-South to North-
East / South-West. It shows some jointing and faulting with few being healed (filled) with the newer material
(figure 4). It is light in colour except where it is dominated by mafic alternations.
Thin section study indicates the presence of the following minerals. Quartz is about 30%, orthoclase is about
15%, hornblende is about 15%, biotite is about 5%, plagioclase is about 35%, and opaque mineral (probably
iron oxide) constitute 10%. Orthoclase undergoes extinction, show Carlsbad twining and characterized by
pethitic structure with clear define cleavage plane. Biotite is greenish to brown with strong pleochroism and
characterized by jagged edges. Hornblende is characterized by cleavage intersection. It is light yellow to green
and interference colour of second order. Opaque mineral is dark in both plane and cross polarized light (figure
5).
Amphibolite It occurs as a dyke-like structure within the migmatite-gneiss and granite-gneiss. It has a medium grain size
because of the effect of metamorphism. It appears to be schistose and either as a continuous vein parallel to the
regional trend of the rock or it shows discordant relationship with the host rock. It is predominantly
characterized by mafic mineral (figure 6).
Figure 2: Migmatite–Gneiss with characteristic
different folds. Figure 3: Photomicrograph of thin section of Migmatite-
Gneiss(Cross Polarized Light)
Figure 4: Faulted Hornblende Granite-Gneiss Figure 5: Photomicrograph of thin section of Hornblende-
Granite-Gneiss (Cross Polarized Light)

Ibrahim A Journal of Scientific and Engineering Research, 2016, 3(3):354-366
Journal of Scientific and Engineering Research
358
From the thin section observation, the rock is dominantly composed of hornblende (about 35%), plagioclase
(albite about 20%) and quartz (about 20%). Other minerals include biotite (about 18%), augite (about 3%), and
opaque mineral is about 4%. Hornblende is greenish-brown to brown characterized by cleavage plane
intersecting at nearly 560/124
0. Plagioclase is colourless to light grey and lacks pleochroism but characterized by
albite (polysynthetic) and periclase twining. Quartz is colourless to light yellow and shows no cleavage. Biotite
occurs as an elongated crystal and in form of lath. Augite is green and has cleavage intersection of nearly
perpendicular to one another (figure 7).
Pegmatite It is a very coarse grain rock with large crystal of feldspar and quartz with some micas (figure 8). It is a light-
coloured rock because of the dominance of felsic materials and it is hosted by banded gneiss. It crystallizes from
residual melt during the later stage of crystallization. This pegmatite lacks economic minerals and hence it is
barren.
Petrographic study reveals the following minerals; orthoclase (about 25%), quartz (about 20%), Plagioclase
(about 30%), biotite mica (about 10%), hornblende (about 10%) and opaque mineral (about 5%). Plagioclase
iscolourless but characterized by albite twinning and cleavage. Quartz is colourless with no cleavage and
alteration along the fractured plane. Biotite is characterized by pleochroic haloes and jagged edge. It is mostly
brown but some are also green in colour. Hornblende is green and opaque mineral is black in both plane and
cross polarized ligh t(figure 9).
Structural Features and its Interpretation
Structures are the principal sources of information on the nature of the deformational episodes as it affects the
earth and it relates to chronological sequence. It reveals the processes that produced the observed structures, the
temperature-pressure condition operating at the time of the deformation, the stress distribution at the time of
formation, the nature of the rock and as well as the environment. Geological structures are strains resulting from
the application of stress. The following structures were observed and these provided information about the
geological history of the area.
Folds
Figure 6: Amphibolite rock hosted by medium
grain gneiss.
Figure 7: Photomicrograph of thin section of Amphibolite
(Cross Polarized Light).
Figure 8: Pegmatite hosted by Gneissic rock. Figure 9: Photomicrograph of thin section of Pegmatite
(Cross Polarized Light).

Ibrahim A Journal of Scientific and Engineering Research, 2016, 3(3):354-366
Journal of Scientific and Engineering Research
359
These are bend-like structures resulting from compressional forces acting from opposite sides of a rock. It
usually leads to shortening of initially horizontal straight parallel layers and finally become contorted following
plastic / ductile deformation. Several fold types were observed on the outcrops particularly the migmatites. The
fold types observed includes simple folds, ptygmatic folds, tight folds, and open folds. Many of the quartz veins
observed have been intensely folded and were suspected to be of different ages. Ptygmatic fold (figure 10)
differs from others because it has uniform thickness at both crest, limb and trough while the other types of fold
has different thickness (figure 2).
Faults
Some of the rocks have been heavily fractured and displacement of the outcrop has been indicated by the
discontinuity in the lithology on the opposite side of the fault plane (figure 11). A few localized fault were seen
on the outcrop at some locations. It is a dextral strike-slip fault with the fault plane filled with felsic material. It
strikes at an angle of 1200. Other micro faults strikes at various angle.
Joint
This is an opening or crack within the rock with no appreciable displacement. This was found in most of the
outcrop. In some outcrop it was healed to form vein (dilational healed joint) while in some it was an open joint
(barren joint). No relative displacement between the adjacent block. Several parallel joints were observed in all
the outcrops. The migmatite-gneiss exhibits different degrees of jointing. The joints show concordant to
discordant relationship to the regional strike of the outcrop. They are oriented in different directions as shown
by the Rose diagram in which the dominant joint direction is almost NE – SW (figure 12). This is the direction
of failure mainly resulting from the Pan – African event. While those of E – W orientation, although minor may
indicate the effect of earlier orogenic episode probably that of Eburnean.
0
45
90
135
180
225
270
315
0 4 8 12
0
45
90
135
180
225
270
315
0 2 4 6 8
Figure 10: Migmatite-Gneiss Showing faulted
ptygmatic fold
Figure 11: Dextral strike-slip fault with quartz vein
as the fault plane.
Figure 12: Rose diagram for strike of joints on
outcrop.
Figure 13: Rose Diagram for Foliation and Mineral
Mineral Lineation

Ibrahim A Journal of Scientific and Engineering Research, 2016, 3(3):354-366
Journal of Scientific and Engineering Research
360
Foliation and Lineation
Several planar and linear structures occur repeatedly on the outcrops. Minerals with similar physical and
chemical properties are aligned in the same directions i.e parallel to sub-parallel alignment of inequant mineral
grains such as micas or amphiboles and the intersection of their planes. These alignments of minerals are
induced by the directional stress that characterizes the formation of many metamorphic rocks. These structures
mainly characterized both migmatite-gneiss and granite-gneiss. They are mostly N – S to NE – SW but in some
outcrop they are NW – SE to E – W. This also reveals the resultant orientation impacted by combine effect of
Pan-Africa and Eburnean orogeny. The Rose plot reveals their dominant direction. It is oriented in a NNE –
SSW (figure 13) which is an imprint of Pan – African orogeny on the basement rock being the recent orogenic
episode that affected Nigerian basement rock.
From the structural analysis of lineation, foliation, joints, fault and the rock outcrop e t c, they have orientation
aligned in the direction associated with many of these major tectonic episodes indicating that the rocks had
undergone polyphase metamorphism and series of deformation processes.
Geological, Lithological and Chronological Relations of the area
From all the lithological, petrograhical and structural studies using strikes, dips and dip directions, the mapped
area is made up of two major rock unit; the migmatite-gneiss and the hornblende granite-gneiss including
amphibolite and pegmatite as shown in the figure 14 below. Both amphibolite and pegmatite were not mappable
and hence do not appear on the geological map. The migmatite-gneiss is the oldest rock unit in the area while
pegmatite hosted by the gneiss is the youngest. Migmatite-gneiss is a composite rock consisting both
metamorphic and igneous units. It is believed to be formed under the granulite facie condition when there is
partial melting. During anatexis the light coloured minerals melt away and this corresponds to the granitic
component (the newly formed portion) of the migmatite. The remaining material is devoid of granitic
component (degranitization) and rich in granodioritecomposition (granodioritization) and this correspond to the
older parent material in metamorphic stage.
Figure 14: Geological map and cross-section of Ado-Awaiye and its environs, Part of Igangan Sheet 240,
Southwestern Nigeria[17].
Geophysical Data Presentation and Analysis
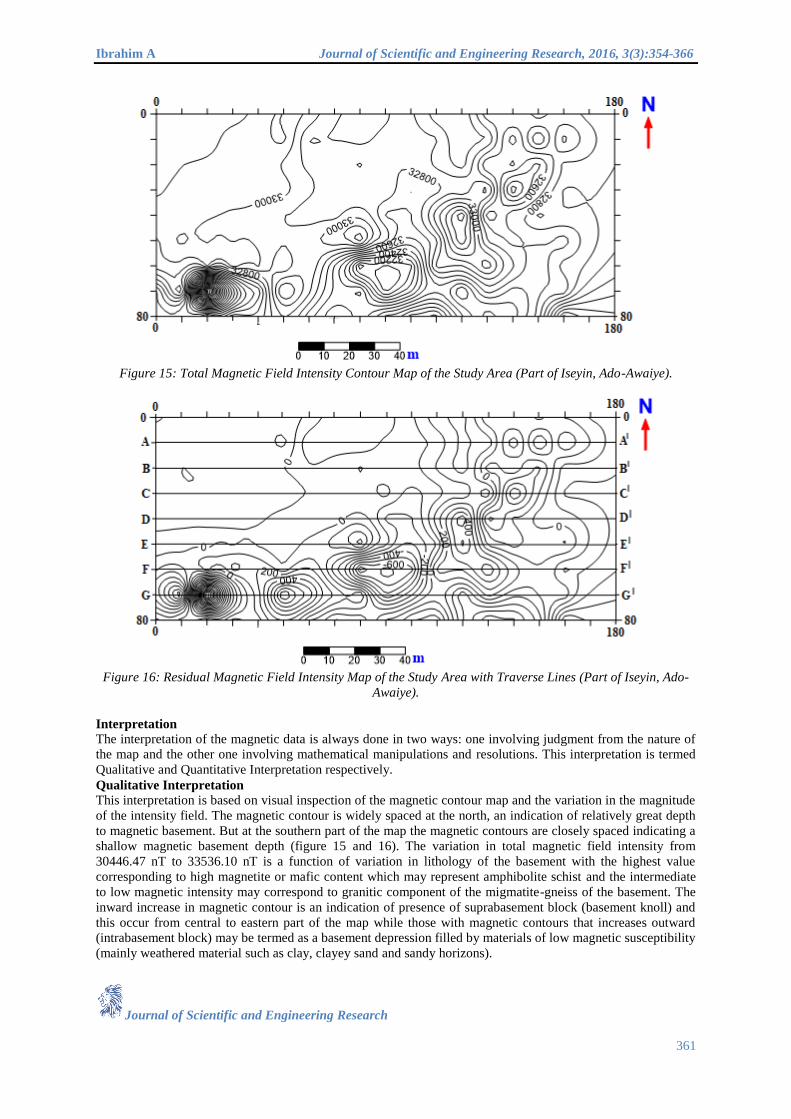
The total magnetic intensity were recorded and processed into contour maps of total intensity map (figure 15)
and residual anomaly map (figure 16) using computer software. A regional surface was superimposed on the
total field to obtain the residual upon which analysis and interpretation were made.
Ibrahim A Journal of Scientific and Engineering Research, 2016, 3(3):354-366
Journal of Scientific and Engineering Research
361
Figure 15: Total Magnetic Field Intensity Contour Map of the Study Area (Part of Iseyin, Ado-Awaiye).
Figure 16: Residual Magnetic Field Intensity Map of the Study Area with Traverse Lines (Part of Iseyin, Ado-
Awaiye).
Interpretation
The interpretation of the magnetic data is always done in two ways: one involving judgment from the nature of
the map and the other one involving mathematical manipulations and resolutions. This interpretation is termed
Qualitative and Quantitative Interpretation respectively.
Qualitative Interpretation
This interpretation is based on visual inspection of the magnetic contour map and the variation in the magnitude
of the intensity field. The magnetic contour is widely spaced at the north, an indication of relatively great depth
to magnetic basement. But at the southern part of the map the magnetic contours are closely spaced indicating a
shallow magnetic basement depth (figure 15 and 16). The variation in total magnetic field intensity from
30446.47 nT to 33536.10 nT is a function of variation in lithology of the basement with the highest value
corresponding to high magnetite or mafic content which may represent amphibolite schist and the intermediate
to low magnetic intensity may correspond to granitic component of the migmatite-gneiss of the basement. The
inward increase in magnetic contour is an indication of presence of suprabasement block (basement knoll) and
this occur from central to eastern part of the map while those with magnetic contours that increases outward
(intrabasement block) may be termed as a basement depression filled by materials of low magnetic susceptibility
(mainly weathered material such as clay, clayey sand and sandy horizons).

Ibrahim A Journal of Scientific and Engineering Research, 2016, 3(3):354-366
Journal of Scientific and Engineering Research
362
Also, the residual field intensity is characterized by both negative and positive anomaly with negative anomaly
indicating weathered material filling the basement depression.
Again, at the southern end of the map, the contours are characterized by presence of elliptical closure and nosing
which are closely spaced, linear and sub-parallel in both total magnetic intensity and residual map and this
represent geologic lineament such as fault, dyke or local fractured zones. Magnetic susceptibility contrast across
a fracture zone may be probably due to oxidation of magnetite to hematite or infilling of fracture zone by dyke-
like bodies (such as amphibolite) whose magnetic susceptibilities differ from those of their host rocks. The data
also reveals that the area is characterized by zero to low mineralization as earlier revealed from geological
mapping.
Quantitative Interpretation
The depth estimate constitutes the quantitative interpretation of magnetic data and it involves simple to complex
mathematical calculation as the case may be. The interpretation of geophysical anomalies is often based on the
analysis of data observed along traverse lines. Data having geological meaning are usually extracted and
interpreted in terms of geology.
Anomaly Depth calculation and Half-Width Method
Much is written on the variety and relative merit of methods for estimating the depth to the source of anomalies.
Knowledge of the depth of a particular formation or source may have considerable geological significance as it
determines the nature or configuration of a formation, the slope of its surface and its discontinuities.
Half-width method is the most common method of depth estimation and it makes use of the shape of the
anomaly. The basis for depth determination from anomaly width is that variation in depth affects the shape of an
anomaly (figure 17).
Figure 17: Effect of Depth on Anomaly Shape and Amplitude([modified from 18]).
For simple forms of anomaly sources, the depth to their centers is related to the half-width of the anomaly
(figure 18). Half-width can be defined as half the horizontal distance between the principal maximum (or
minimum) of the anomaly (assumed to be over the center of the source) and the point where the value is exactly
half the maximum. This rule is valid for various simple shaped forms including gently sloping surfaces such as
topography on basement bedrock which is assumed and modelled by an infinite slab.
For an infinite slab, the half-width X1/2 equals depth to the basement Z.
Figure 18: The method of calculating half-width from anomaly shape for depth estimate (modified from [18]).
The depth to various points on the surface of crystalline rock or magnetic basement allows one to map the
surface and its topography.
Below are the profiles taken mainly from west to east along each traverse line for detail qualitative
interpretation.

Ibrahim A Journal of Scientific and Engineering Research, 2016, 3(3):354-366
Journal of Scientific and Engineering Research
363
32500
32600
32700
32800
32900
33000
33100
33200
0 50 100 150 200
Tota
l M
agn
etic
Fie
ld I
nte
nsi
ty (
nT
)
Station Distance/Location (m)
Profile A-A1 Total Magnetic Field with Regional Gradient
-400
-300
-200
-100
0
100
200
300
0 50 100 150 200
Res
idu
al
Magn
etic
F
ield
In
ten
sity
(n
T)
Station Distance/Location (m)
Profile A-A1: Plot of Residual Magnetic Field
32400
32600
32800
33000
33200
0 50 100 150 200
Tota
l M
agn
etic
Fie
ld I
nte
nsi
ty (
nT
)
Station Distance/Location (m)
Profile B-B1: Total Magnetic Field with Regional Gradient
-300
-200
-100
0
100
200
300
0 50 100 150 200
Res
idu
al
Magn
etic
F
ield
In
ten
sity
(n
T)
Station Distance/Location (m)
Profile B-B1: Plot of Residual Magnetic Field
32000
32200
32400
32600
32800
33000
33200
0 50 100 150 200Tota
l M
agn
etic
Fie
ld I
nte
nsi
ty (
nT
)
Station Distance/Location (m)
Profile C-C1: Total Magnetic Field with Regional Gradient
-600
-400
-200
0
200
400
0 50 100 150 200
Res
idu
al
Magn
etic
F
ield
In
ten
sity
(n
T)
Station Distance/Location (m)
Profile C-C1: Plot of Residual Magnetic Field
32400
32600
32800
33000
33200
33400
33600
0 50 100 150 200
Tota
l M
agn
etic
Fie
ld I
nte
nsi
ty (
nT
)
Station Distance/Location (m)
Profile D-D1: Total Magnetic Field with Regional Gradient
-600
-400
-200
0
200
400
600
800
0 50 100 150 200
Res
idu
al
Magn
etic
F
ield
In
ten
sity
(n
T)
Station Distance/Location (m)
Profile D-D1: Plot of Residual Magnetic Field
Ibrahim A Journal of Scientific and Engineering Research, 2016, 3(3):354-366
Journal of Scientific and Engineering Research
364
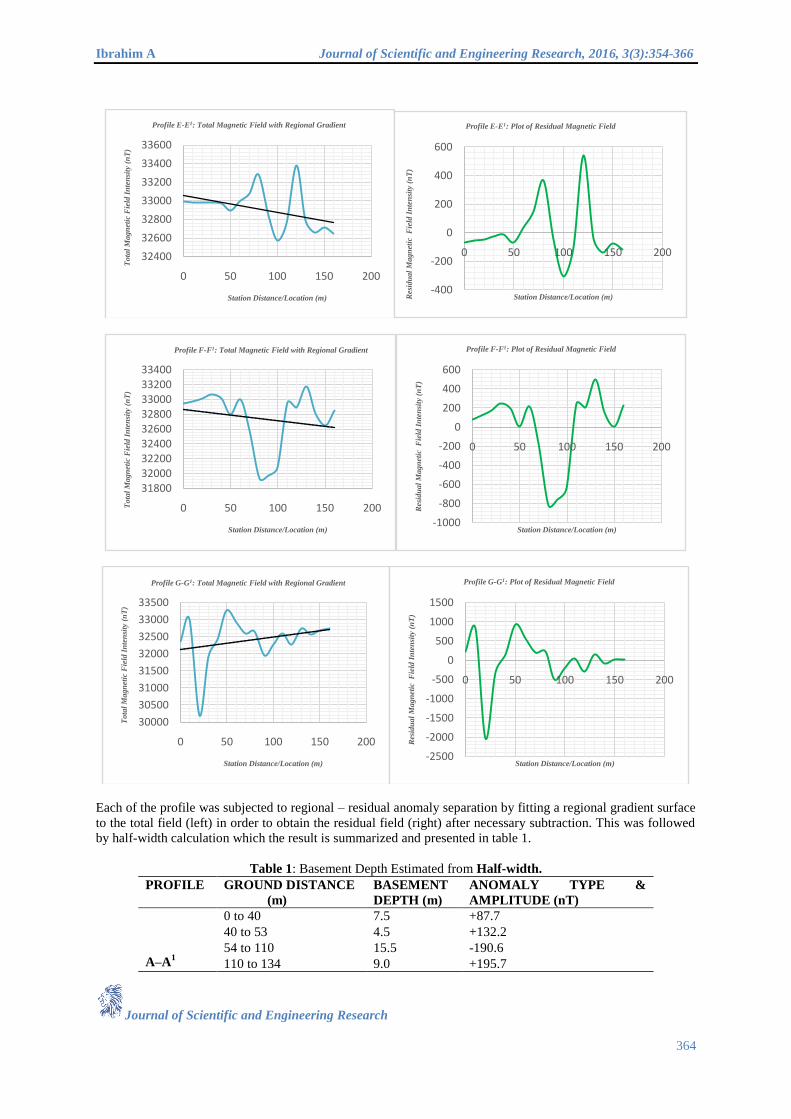
Each of the profile was subjected to regional – residual anomaly separation by fitting a regional gradient surface
to the total field (left) in order to obtain the residual field (right) after necessary subtraction. This was followed
by half-width calculation which the result is summarized and presented in table 1.
Table 1: Basement Depth Estimated from Half-width.
PROFILE GROUND DISTANCE
(m)
BASEMENT
DEPTH (m)
ANOMALY TYPE &
AMPLITUDE (nT)
A–A1
0 to 40 7.5 +87.7
40 to 53 4.5 +132.2
54 to 110 15.5 -190.6
110 to 134 9.0 +195.7
32400
32600
32800
33000
33200
33400
33600
0 50 100 150 200
Tota
l M
agn
etic
Fie
ld I
nte
nsi
ty (
nT
)
Station Distance/Location (m)
Profile E-E1: Total Magnetic Field with Regional Gradient
-400
-200
0
200
400
600
0 50 100 150 200
Res
idu
al
Magn
etic
F
ield
In
ten
sity
(n
T)
Station Distance/Location (m)
Profile E-E1: Plot of Residual Magnetic Field
318003200032200324003260032800330003320033400
0 50 100 150 200Tota
l M
agn
etic
Fie
ld I
nte
nsi
ty (
nT
)
Station Distance/Location (m)
Profile F-F1: Total Magnetic Field with Regional Gradient
-1000
-800
-600
-400
-200
0
200
400
600
0 50 100 150 200
Res
idu
al
Magn
etic
F
ield
In
ten
sity
(n
T)
Station Distance/Location (m)
Profile F-F1: Plot of Residual Magnetic Field
30000
30500
31000
31500
32000
32500
33000
33500
0 50 100 150 200
Tota
l M
agn
etic
Fie
ld I
nte
nsi
ty (
nT
)
Station Distance/Location (m)
Profile G-G1: Total Magnetic Field with Regional Gradient
-2500
-2000
-1500
-1000
-500
0
500
1000
1500
0 50 100 150 200
Res
idu
al
Magn
etic
F
ield
In
ten
sity
(n
T)
Station Distance/Location (m)
Profile G-G1: Plot of Residual Magnetic Field

Ibrahim A Journal of Scientific and Engineering Research, 2016, 3(3):354-366
Journal of Scientific and Engineering Research
365
134 to 146 3.5 -282.5
146 to 156 3.5 +241.1
156 to 170 5.0 -281.1
B–B1
28 to 50 6.5 +29.9
50 to 75 6.0 -90.5
82 to 102 6.0 -67.6
102 to 126 6.0 +265.4
126 to 140 3.5 -165.3
140 to 156 5.5 236.2
C - C1
20 to 60 7.0 +85.2
60 to 85 8.0 -91.5
85 to 93 2.5 +39.1
93 to 120 6.0 -142.9
120 to 134 4.0 +292.7
134 to 152 5.0 -530.7
D–D1
44 to 75 10.0 -100.0
83 to 106 9.0 -206.9
106 to 126 5.5 +599.0
126 to 144 4.5 -353.3
E – E1
40 to 57 5.0 -67.8
57 to 89 6.5 +368.7
89 to 111 7.5 -306.6
111 to 129 5.0 +539.9
129 to 148 4.0 -141.0
F – F1
0 to 45 11.5 +244.4
50 to 67 4.5 216.8
67 to 107 14.0 -815.0
107 to 152 13.0 +501.3
G – G1
0 to 13 4.5 +837.1
13 to 36 5.0 -2022.5
36 to 84 9.0 +940.1
84 to 106 6.3 -491.9
112 to 126 3.8 -286.6
126 to 137 3.5 +153.9
Three profiles have been selected for detailed analysis and explanation. These serve as representatives of the
others.
Profile B – B1
Along this profile line, the depth to magnetic basement is 6.5m between 28m to 50m ground distance, it is 6.0m
between 50m to 75m, 82m to 102m and 102m to 126m. It is also 3.5m between distance of 126m to 140m and
5.5m between 140m to 156m. Therefore, the minimum depth is 3.5m and maximum depth to basement is 6.5m
with a mean depth of about 5.6m. In addition to depth variation, this profile is also characterized by minimum
anomaly of -236.2nT and peak value of +265.4nT indicating intrabasement and suprabasement respectively.
Profile D–D1
From the anomaly width of the residual field, the depth to magnetic basement along this profile varies. Between
44m to 75m ground distance, the magnetic basement depth is approximately 10.0m, between 83m to 106m, it is
approximately 9.0m, between 106m to 126m, it is approximately 5.5m and between 126m to 144m it is
approximately 4.5m. Therefore the minimum depth is 4.5m and maximum depth is 10.0m with an average of
approximately 7.3m. The anomaly amplitude also ranges from -353.3nT to +599.0nT also indicating basement
depression and basement knoll respectively.
Profile F–F1
The basement depth along this traverse line varies extensively. Between 0m to 45m, the depth estimate from the
anomaly width is 11.5m, between 50m to 67m, it is 4.5 m, between 67m to 107m, it is about 14.0m and between
107m to 152m, it is 13.0m. Minimum and maximum depth is 4.5m and 14.0m respectively with an average of
approximately 10.8m. Also minimum anomaly amplitude of -815.0nT and maximum value of +501.3nT
characterize this profile signifying basement valley and basement high respectively.

Ibrahim A Journal of Scientific and Engineering Research, 2016, 3(3):354-366
Journal of Scientific and Engineering Research
366
Conclusion
The study area lies within the basement complex of southwestern Nigeria. Rocks encountered include
migmatite-gneiss, hornblende granite-gneiss and some pegmatite and amphibolite. The mineralogical
compositions of the rocks include: biotite mica, k-feldspar, Plagioclase feldspar, quartz, hornblende, augite,
opaque minerals (probably magnetite or ilmenite) etc. Also, the variation in total field ranging from 30446.50
nanotesla to 33536.10 nanotesla indicates that the magnetic basement is not uniform in composition. The
magnetic basement constitute migmatite-gneiss with associated amphibolite which is rich in opaque mineral
such as magnetite and/or ilmenite etc. This most certainly responsible for the relative high magnetic values
recorded. The basement is relatively shallow at the southern end of the map and relatively deep at the north. The
overburdenthickness ranges from 2.5m to 15.5m (table 1) and hence the basement topography is relatively
undulating characterized by few basement structures such as fracture, intrabasement and suprabasement blocks
which were inferred from the magnetic map. Both geological mapping and the ground magnetic data reveals that
the area is not mineralized and hence zero to low mineralization potential.
The rocks arealso characterized by structures such as folds, joints, fault, foliation, mineral lineation, veins, etc as
observed from the outcrop. Few barren pegmatite were encountered and hence the study area is not mineralized
but is fairly good for quarry activities.
Therefore, from this study, it is very clear that both geology and geophysics can supply veritable important
complimentary information about the lithological content and mineralization potential of an area.
References
[1]. Odeyemi, I. B. (1981). A review of the Orogenic events in the Precambrian Basement of Nigeria. Geol.
Rundesheu, 70(3): 897-900.
[2]. Rahaman, M. A.(1976). Review of the basement geology of the southwestern Nigeria.
[3]. Trustwell, J. F. and Cope, R. N.(1963). The geology of parts of Niger and Zaria Provinces, Northern
Nigeria. Geological Survey of Nigeria Bullettin,29: 52.
[4]. Rahaman. M. A.(1988). Recent advances in the study of the basement complex of Nigeria. In
Precambrian Geology of Nigeria, Geological survey of Nigeria, Kaduna South, 11-43.
[5]. Falconer, J. D.(1911).The geol. and geography of Northern Nigeria. McMillan and Co. Ltd London.
[6]. Elueze, A. A.(1982). Geochemistry of the Ilesha granite-gneiss in the basement complex of south-
western Nigeria. Precambrian. Rcs, 19: 167- 177.
[7]. Anakwuba, E. K., Onwuemesi. A. G., Chinwuko, A. I. andOnuba, L. N. (2011). The interpretation of
aeromagnetic anomalies over Maiduguri–Dikwa depression, Chad Basin Nigeria: A structural view.
Archives of Applied Science Research,3(4):499-508.
[8]. United States Geological Survey (USGS),(1997). Introduction to Potential Fields: Magnetics.
[9]. Nsikak, E. B., Nur, A. and Gabriel, I. D. (2000). Analysis of aerial photographics data over Guyuk
Area, Northeastern Nigeria. J. Min. Geol., 36(2): 145-152.
[10]. Rajaram, M., Anand, S. P, Hemant, K. andPurucker, M. E. (2009). Curie isotherm map of Indian
subcontinent from Satellite and aeromagnetic data. Earth Planet. Sci. Letts., 281: 147-158.
[11]. Onuba, L. N, Anudu, G. K., Chiaghanam, O. I andAnakwuba, E. K. (2011). Evaluation of
aeromagnetic anomalies over Okigwe Area, Southeastern, Nigeria. Research Journal of Environmental
and Earth Sciences, 3(5): 498-507.
[12]. Nettleton, L. L. (1976).Gravity and Magnetics in Oil Prospecting: McGraw-Hill Book Company Inc.,
New York; Printed in the United States of America.
[13]. Heiland, C. A. (1940).Geophysical Exploration: Prentice-Hall Inc., New York, 310-315.
[14]. Jakosky, J. J.(1950).Exploration Geophysics, 2nd ed., Trija Publishing Co., Los Angeles, California. 1st
ed., Times-Mirror Press, Los Angeles. 1940.,164-169.
[15]. Nettleton, L. L.(1940).Geophysical Prospecting for Oil: McGraw-Hill Book Company Inc., New
York,. 201.
[16]. Dorbrin, M. B. (1960).Introduction to Geophysical Prospecting 2nd
ed., McGraw-Hill Book Company
Inc., New York. 1st ed., McGraw-Hill Book Company Inc., New York. (1952), 269.
[17]. Ibrahim, A., Toyin, A. andSanni, Z. J.(2015), Geological characteristics and petrographic analysis of
rocks of Ado-Awaiye and its Environs, Southwestern Nigeria. International Journal of Applied
Sciences and Mathematical Theory, 1(4): 1-20.
[18]. Ibrahim, A.,Ayinla, H. A.and Ahmed II, J. B.(2016).Geomagnetic Signature and Depth Estimate of
Basement Rock around Iseyin Area (Ado-Awaiye), Ibadan, Southwestern Nigeria. Journal of
Geography, Environment and Earth Science International, 4(2): 1-12.