Embed Size (px)
Citation preview
J O U R N A L O F F U N C T I O N A L F O O D S 6 ( 2 0 1 4 ) 4 5 0 – 4 6 1
.sc iencedi rect .com
Avai lab le at wwwScienceDirect
journal homepage: www.elsevier .com/ locate / j f f
Intake of jaboticaba peel attenuates oxidative stressin tissues and reduces circulating saturated lipids ofrats with high-fat diet-induced obesity
1756-4646/$ - see front matter � 2013 Elsevier Ltd. All rights reserved.http://dx.doi.org/10.1016/j.jff.2013.11.011
* Corresponding author. Address: Departamento de Alimentos e Nutricao, Rua Monteiro Lobato, 80, Cidade Universitaria, CamBrazil. Tel./fax: +55 19 3521 4059.
E-mail address: [email protected] (M.R. Marostica).
Angela Giovana Batistaa, Sabrina Alves Lenquistea, Cinthia Bau Betim Cazarina, JulianaKelly da Silvaa, Anderson Luiz-Ferreirab,c, Stanislau Bogusz Jr.d, Leandro Wang Hantaod,Renato Nunes de Souzad, Fabio Augustod, Marcelo Alexandre Pradoa,Mario Roberto Marostica Jr.a,*
aSchool of Food Engineering, University of Campinas (UNICAMP), P.O. Box 6121, 13083-862 Campinas, SP, BrazilbBiology Institute, University of Campinas (UNICAMP), Campinas, SP, BrazilcBiological Sciences Department, Federal University of Goias (UFG), Catalao, GO, BrazildInstitute of Chemistry, University of Campinas and Instituto Nacional de Ciencia e Tecnologia em Bioanalıtica (INCTBio), Brazil
A R T I C L E I N F O A B S T R A C T
Article history:
Received 19 March 2013
Received in revised form
11 November 2013
Accepted 18 November 2013
Available online 28 December 2013
Keywords:
Myrciaria jaboticaba (Vell.) Berg.
Obesity
Polyphenols
Antioxidant defenses
Lipid peroxidation
Fatty acids methyl esters
The bioactive compounds of freeze-dried jaboticaba peel (FJP), serum lipids and the antiox-
idant status of rats fed high-fat diets containing different doses of FJP were evaluated.
Obesity was induced and three groups of the obese animals received high-fat diet with
1%, 2% and 4% FJP added (J1, J2 and J4, respectively). The HPLC–DAD analyses of the poly-
phenols in the FJP showed four compounds: gallic acid, cyanidin 3-glucoside, ellagic acid,
and quercetin. The serum saturated fatty acids were reduced in J1 and J4-fed animals.
The antioxidant defenses of plasma were increased in the J2 and J4-fed animals. All the
FJP diets prevented lipid peroxidation in the liver and increased its antioxidant defenses.
Lipid peroxidation in brain decreased with an increasing FJP content in the diet. The
antioxidant status of the kidneys of J2 and J4-fed animals increased. Thus, FJP could be
an alternative to minimize the high-fat diet-induced oxidative stress and circulating
saturated lipids.
� 2013 Elsevier Ltd. All rights reserved.
1. Introduction
Overweight and obesity have become major public health
problems, and the prevalence of related chronic diseases is
increasing throughout the world (WHO, 2012). Obesity may
be a state of chronic oxidative stress, which consists in an
imbalance between overproduction of reactive oxygen
species or ROS (e.g. hydrogen peroxide, peroxyl, superoxide
and hydroxyl radicals) and circulating antioxidants. Oxidative
stress is a possible mechanism underlying the development
of diabetes and cardiovascular diseases (Vincent, Innes, &
Vincent, 2007).
An excess of ROS, over-produced in obesity, can harm pro-
teins, lipids, nucleic acids and cause cell damage and even
death. In addition, obesity impairs the enzyme antioxidant
system, with depletion of the superoxide dismutase (SOD),
pinas, SP,
J O U R N A L O F F U N C T I O N A L F O O D S 6 ( 2 0 1 4 ) 4 5 0 – 4 6 1 451
catalase (CAT), glutathione reductase (GR) and glutathione
peroxidase (GPx) activities, and also impairs the non-enzy-
matic oxidative system (reduced thiol content or GSH, vita-
mins and minerals) (Noeman, Hamooda, & Baalash, 2011;
Vincent et al., 2007).
Dietary nutrients and specific foods, rich in polyphenols
(e.g. anthocyanins, flavonols), could play an important role
in the prevention and control of complications arising from
oxidative stress, increasing the circulation of antioxidant
compounds (Leite et al., 2011; Lenquiste, Batista, Marineli,
Dragano, & Marostica, 2012), since they are capable of neutral-
izing reactive species, due to their favorable number and po-
sition of hydroxyls (Mazza, Kay, Cottrell, & Holub, 2002; Prior,
2003; Vanzo, Vrhovsek, Tramer, Mattivi, & Passamonti, 2011).
These compounds are also correlated to the reduction of ser-
um and liver lipids and decreased gene expression of lipo-
genic enzymes (Tsuda, Horio, Uchida, Aoki, & Osawa, 2003).
Myrciaria jaboticaba (Vell.) Berg., popularly known as jaboti-
caba, is a Brazilian berry with a purple peel. Freeze-dried jabo-
ticaba peel (FJP) showed considerable polyphenol and
anthocyanin contents, with important in vivo antioxidant
properties (Costa, Garcia-Diaz, Jimenez, & Silva, 2013; Leite
et al., 2011). Moreover, recent studies have reported that jabo-
ticaba peel contains high contents of ellagic acid, tannins
(Abe, Lajolo, & Genovese, 2012) and some volatile compounds
(Plagemann, Krings, Berger, & Marostica Junior, 2012) that
could contribute to its antioxidant power. In addition to this
bioactive compounds, it was discovered a new depside named
jaboticabin in the Myrciaria cauliflora specie (Reynertson et al.,
2006; Wu et al., 2013b). This compounds is related to cancer
cells antiproliferative and antioxidant effects (Reynertson
et al., 2006).
The M. jaboticaba fruit has been little explored from a
scientific point of view, especially in relation to its chemical
constituents and in vivo effects, and the present study aimed
to investigate the effects of jaboticaba on oxidative stress
indicators. The authors hypothesized that the ingestion of
different FJP concentrations could protect the tissues against
oxidative stress and change the lipid profile in serum in obese
rats, due to a peculiar content of polyphenols.
2. Materials and methods
2.1. Jaboticaba peel processing
Jaboticaba fruits (M. jaboticaba (Vell.) Berg.) were bought at the
local market in Campinas, Sao Paulo State, Brazil. The fruits
were washed, manually peeled and frozen at �18 �C. The
peels were dried in a freeze-dryer (LP1010, Liobras, Sao Carlos,
Sao Paulo, Brazil) at 30 �C, 300 lm Hg for 95 h, and the freeze-
dried jaboticaba peel product (FJP powder) stored at �80 �C.
2.2. Freeze-dried jaboticaba peels (FJP) extracts andanalyses
The FJP powder was weighed (1 g) and extracted with 20 mL of
80% methanol (MeOH) at 37 �C for 3 h in a shaking water bath.
After a centrifugation (2000g, 10 min), it was filled to 25 mL
and filtered (0.45 lm) before analyses.
An hydrolysis of the glycoside flavonoids was performed in
the MeOH extract in order to facilitate the identification and
the quantification of the compounds by the HPLC method
(Port’s, Chiste, Godoy, & Prado, 2013). For hydrolysis, 13 mL
of 1 g L�1 BHT (2,6-di-tert-butyl-4-methylphenol) in HPLC
grade methanol, 12 mL ultrapure water and 10 mL 6 mol L�1
HCl were added to 15 mL MeOH extract, which was allowed
to react in water bath at 90 �C for 30 min, with refrigerated re-
flux condenser.
The total phenolic content was determined by the Folin–
Ciocalteu method, adapted from (Swain & Hillis, 1959).
The absorbance was measured at 725 nm using a spectropho-
tometer (Sinergy HT, Biotek, Winooski, VT, USA) and the
results were expressed in gallic acid equivalents (GAE mg g�1
FJP).
The total anthocyanins were also quantified in the metha-
nol extract according to the pH-differential method described
by Wrolstad (1993). The absorbance was then calculated using
Eq. (1):
A ¼ A510 nm � A700 nmð ÞpH ¼ 1:0½ �� A510 nm �A700 nmð ÞpH ¼ 4:5½ � ð1Þ
The anthocyanin content was calculated as cyanidin 3-gluco-
side using Eq. (2):
C ¼ A �MW �DF� n � 1 ð2Þ
where C = cyanidin 3-glucoside (mg 100 g�1); MW = molecular
weight (449.2); DF = dilution factor; and n = molar absorptivity
(26,900 mol L�1), 1 = pathlength (cm).
The ORAC (oxygen radical absorbance capacity) (Davalos,
Gomez-Cordoves, & Bartolome, 2004) test was carried out
adding 20 lL of samples extract or standard solutions,
120 lL of fluorescein diluted in phosphate buffer (pH 7.4),
and 60 lL of AAPH (2,2 0-azobis (2-methylpropionami-
dine) dihydrochloride) to black microplates, in the dark.
Trolox ((±)-6-hydroxy-2,5,7,8-tetramethylchromane-2-carbox-
ylic acid) was used as standard and the microplate reader
(Synergy HT, Biotek) with fluorescent filters: excitation
wavelength, 485 nm; emission wavelength, 520 nm. ORAC
values were expressed in lmol trolox equivalent (lmol TE)
per gram of FJP by using the standard curves (2.5–
80.0 lmol TE L�1) for each assay. The linearity between the
net area under the curve and the concentration was checked
for the samples and the fluorescence readings were used to
the appropriate calculations.
2.2.1. Quantification of the phenolic compounds in the FJP byHPLC–DADThe analysis of the phenolic compounds from the extracts
was carried out in a high performance liquid chromatography
(HPLC Agilent 1100 Series, Englewood, CO, USA), with manual
injection, 20 lL sample loop and ternary pump, coupled to a
diode array detector (DAD Agilent G13158). The oven (Agilent
1100) was operated at 25 ± 2 �C, and data was obtained and
processed using the software ChemStation (Hewlett Packard,
Germany). A reverse phase chromatographic column (C18
Eclips XDB (5 lm · 250 mm · 4.6 mm), Agilent, Englewood,
CO, USA) was used. The mobile phase was 1% orthophos-
phoric acid in water (v v�1) (A) and acetonitrile (B). The elution
gradient started at 95:05 (A:B) at 0.7 mL min�1. This condition
452 J O U R N A L O F F U N C T I O N A L F O O D S 6 ( 2 0 1 4 ) 4 5 0 – 4 6 1
was maintained for 5 min and then, the concentration of A
was decreased (75:25, A:B), and at 25 min it reached 60:40
(A:B) followed by a linear increase of solvent A to 95% until
35 min.
The detection was done at 210, 254, 280, 300 and 340 nm,
which allowed the simultaneous quantification and the
tentative identification of the phenolic compounds sepa-
rated by the HPLC. The comparison parameters were elu-
tion time, spectra of absorption and sample fortification.
The identification was carried out using the chromato-
grams obtained at each injection and compared with the
absorption spectra and retention time of the standards.
Co-chromatography was performed to confirm the identity
of the compounds. The concentrations of the identified
compounds were calculated from the analytical curves
obtained using commercial products under identical
chromatographic conditions.
2.3. Rat study
2.3.1. Animals and dietsThirty weaned male Sprague–Dawley rats were used in this
study following all the ethical recommendations, and the pro-
tocol (#2226-1) was approved by the UNICAMP Ethics Commit-
tee, Brazil. The rats were housed under conditions of constant
temperature (22 �C ± 2), relative humidity (60–70%) and a stan-
dard dark cycle (19–07 h), and randomized into five groups of
6 animals each: a control group (N or normal), fed a semi-
purified diet for 10 weeks (Reeves, Nielsen, & Fahey, 1993); a
high-fat control group (C), fed a high-fat diet for 10 weeks;
and the FJP groups (J1, J2 and J4) which were fed the high-
fat diet for the first 4 weeks (1st experimental phase) and then
the high-fat diet plus 1%, 2% and 4% of FJP, respectively, for
the following 6 weeks (2nd experimental phase). The doses
were based in previous reports (Dragano et al., 2013; Kalt
et al., 2008; Leite et al., 2011; Lenquiste et al., 2012). The ingre-
dients used in the normal diet (N) were: casein (15.4%); corn
starch (42.66%); maltodextrin (14.17%); sucrose (10.73%); cellu-
lose (5.0%); soybean oil (7.0%; being 58.3% polyunsaturated
fatty acids (PUFA), 26.72% monounsaturated fatty acids
(MUFA), and 14.99% saturated fatty acids (SFA) (Furlan, Mar-
ques, Marineli, & Marostica Junior, 2013)); mineral mix
(3.5%), vitamin mix (1.0%); L-cystine (0.3%); and choline bitar-
trate (0.25%) (Reeves et al., 1993). The ingredients used in the
control diet (C) were: corn starch (24.98%); maltodextrin
(8.29%), sucrose (6.29%); soybean oil (4.0%); and lard (31%;
being 18.6% PUFA, 43.66% MUFA, and 37.76% SFA (Furlan
et al., 2013). The J1, J2 and J4 diets consisted on C diet plus
1%, 2%, and 4% FJP, respectively; and the amount of cellulose
was adjusted to 4.75%, 4.5%, and 4.0% for the same groups.
The rats were given free access to water and food. The weight
gain and diet consumption were determined weekly.
2.3.2. Diet analysesCalorie values of diets were determined using Isoperibol Cal-
orimeter 1261 instrument equipped with 1108 oxygen bomb
(Parr Instrument Co, Moline, IL, USA).
The total anthocyanin contents were assayed in the FJP
diets using the pH-differential method as described
previously (Leite-Legatti et al., 2012). The results were
expressed as mg cyanidin 3-glucoside 100 g�1 diet.
The antioxidant capacity of all the diets was evaluated by
the ORAC assay using ethanolic (2:1, v/v) extract of diets, with
or without protein precipitation after addition of 0.75 mol L�1
metaphosphoric acid and centrifugation at 21,036g for 5 min
at 4 �C.
2.3.3. SamplingBlood was obtained from the fasted rats (12 h) by decapita-
tion. The blood samples were collected in tubes containing
or lacking ETDA, and centrifuged at 2000g for 20 min. Respec-
tively, the plasma and serum was collected, bubbled through
nitrogen gas and stored at �80 �C until analyzed. The spleen,
liver, kidneys, pancreas and the whole brain were removed,
washed, weighted, frozen in liquid nitrogen, and kept at
�80 �C. Tissue homogenates (pancreas, kidneys and liver)
were prepared in a ratio of about 100 mg wet tissue per
1 mL of 50 mmol L�1 phosphate buffer (pH 7.4) or 5% trichlo-
roacetic acid (TCA) solution using a homogenizer (MA102/
Mini, Marconi, Piracicaba – SP, Brazil). The homogenates were
used in the antioxidant enzyme and GSH assays. The liver
and kidneys were also freeze-dried, as also the spleen and
whole brain. The organs were manually ground and kept at
�80 �C until analyzed for lipid peroxidation and antioxidant
capacity.
2.4. Serum FAME from triglycerides and phospholipids
2.4.1. Analytical standardsAll reagents used were at least analytical grade. Additionally,
the method of choice for the derivatization of the lipids into
their respective fatty acid methyl esters (FAME) was base-cat-
alyzed methanolysis with sodium hydroxide as catalyst
(NaOMe) (Sigma–Aldrich, Bellefonte, PA, USA). The identity
of the analytes was confirmed with the FAME mixture of
C8–C25, 37 components and methyl docosahexaenoic acid
(DHA) analytical standards (Sigma–Aldrich, Bellefonte, PA,
USA).
2.4.2. Chromatographic conditionsFor the separation and quantification of the fatty acid methyl
esters (FAME) an Agilent HP gas chromatograph model 6890N
with a liquid auto-injector was used (Wilmington, DE, USA).
This equipment was fitted with a split/splitless injector and
FID detector. The separation was performed in a DB-5 (95%
poly(dimethylsiloxane)/5% diphenylsiloxane) capillary col-
umn (10 m length, 0.10 mm i.d. and 0.10 lm film thickness)
(Agilent Technologies, Wilmington, DE, USA). The injector,
was operated in splitless mode, and the detection port were
held at 250 �C, while the column oven was programmed from
120 �C to 350 �C at a rate of 20 �C min�1. The carrier gas was
hydrogen at a constant linear velocity of 77 cm s�1.
For the chromatographic analysis 75 lL of serum was
transferred to a 200 lL conical vial; 50 lL of iso-octane and
100 lL of a 2 mol L�1 sodium methoxide, in methanol were
added. The vial was vortexed for 2 min and centrifuged at
5422g. The organic layer was collected and chromatographed;
the injection volume was 3 lL. All analyses were carried out in
duplicate.

J O U R N A L O F F U N C T I O N A L F O O D S 6 ( 2 0 1 4 ) 4 5 0 – 4 6 1 453
2.5. Tissues antioxidant defenses analyses
All the absorbance and fluorescence readings for the bio-
chemical analyses were determined in a Synergy HT, Biotek
microplate reader (Winooski, VT, USA) with Gen5� 2.0 data
analysis software.
2.5.1. Lipid peroxidation in the tissues2.5.1.1. TBARS (thiobarbituric acid reactive substances)assay. The TBARS levels in the plasma, liver, kidneys, spleen
and brain were determined using the method described by
Ohkawa, Ohishi, and Yagi (1979), with adaptations. The
freeze-dried tissues (10 mg mL�1) were sonicated in acetate
buffer (pH 3.5) on ice or 100 lL in the case of plasma. The sam-
ples were mixed with 8.1% sodium dodecyl sulphate, TBA (2-
thiobarbituric acid) powder, 20% acetic acid and 5% sodium
hydroxide. After heating at 95 �C for 60 min, the samples were
cooled in an ice bath for 10 min and then centrifuged at
10,000g, 10 min, 4 �C. The resulting MDA-TBA and related ad-
ducts were quantified at 532 nm using a 96-well microplate. A
standard curve was prepared using the MDA standard
(#10009202, Cayman Chemical Company, Ann Arbor, MI, USA).
2.5.2. Enzymatic and non-enzymatic endogenous antioxidantsystems in the plasma, pancreas, kidneys and liver2.5.2.1. Plasma measurements. Commercial assay kits from
Cayman Chemical Company were used to determine the plas-
ma GSH levels (#703002) and the GPx (#703102), GR (#703202),
CAT (#707002) and SOD (#706002) activities.
2.5.2.2. Superoxide dismutase activity. One hundred microliters
of appropriately diluted samples (phosphate buffer homogenates
or PB) were added to a 96-well microplate. One hundred and fifty
microliters of a previously prepared solution (0.1 mmol L�1 hypo-
xanthine,0.07 Uxanthineoxidaseand0.6 mmol L�1 NTBinphos-
phate buffer in 1:1:1 proportions) were added just before the
readings. The reading was takenat 560 nmand the reaction mon-
itored for 10 min. The SOD activity expressed as U mg�1 protein.
(Winterbourn, Hawkins, Brian, & Carrell, 1975).
2.5.2.3. Glutathione peroxidase activity. GPx activity in the tis-
sues was quantified in PB homogenates by the method de-
scribed in (Flohe & Gunzler, 1984). The decrease in
absorbance was monitored at 365 nm after induction by
Table 1 – Polyphenols contents and antioxidant activity of freez
Compounds or antioxidant activity MeOH
ORAC (lmol TE g�1) 519.14 ±
Total anthocyanins (mg C3G 100 g�1) 1737.12
Total polyphenols (mg GAE g�1) 113.80 ±
Gallic acid (mg 100 g�1) 4.03 ± 0
Ellagic acid (mg 100 g�1) 348.08 ±
Quercetin (mg 100 g�1) 4.82 ± 0
C3G = cyanidin 3-glucoside.
GAE = gallic acid equivalents.
Different letters in lines represent statistical difference between extractsA Data expressed as mean ± SEM. ND = non determined.
0.25 mmol L�1 H2O2 in the presence of 10 mmol L�1 reduced
glutathione, 4 mmol L�1 NADPH (b-nicotinamide adenine
dinucleotide 2 0-phosphate reduced tetrasodium salt hydrate)
and 1 U GR enzyme activity. The results were expressed as
nmol NADPH consumed min�1 mg�1 protein.
2.5.2.4. Glutathione reductase activity. GR activity was mea-
sured in PB homogenates (Carlberg & Mannervik, 1985), follow-
ing the decrease in absorbance at 340 nm induced by oxidized
glutathione in the presence of NADPH in phosphate buffer.
The results were expressed as nmol NADPH consumed min�1 -
mg�1 protein.
2.5.2.5. Reduced thiol (GSH) contents. The GSH levels in the
tissues were determined in TCA homogenates by Ellman’s
reaction using DTNB (5 05 0-dithio-bis-2-nitrobenzoic acid) (Ell-
man, 1959). The intensity of the yellow colour was read at
412 nm and GSH was used as the external standard. The
GSH concentrations were expressed as nmol GSH lg�1 pro-
tein. The protein concentrations of all tissue homogenates
were determined using the Bradford method (Bradford, 1976).
2.5.3. Free radical scavenging capacity in the plasma, liver,brain, kidneys and spleen2.5.3.1. Sample preparation. The plasma samples were treated
with ethanol:ultrapure water (2:1) and 0.75 mol L�1 metaphos-
phoric acid (Leite et al., 2011). The freeze-dried tissues were
mixed with the same solvents. The samples were centrifuged
at 21,036g for 5 min at 4 �C and the supernatant removed. These
extracts were for the ORAC, TEAC and FRAP assays.
2.5.3.2. ORAC (hydrophilic oxygen radical absorbance capacity)assay. The tissues samples extracts were analyzed according
to the ORAC assay described above (Section 2.2).
2.5.3.3. TEAC (trolox equivalent antioxidant capacity)assay. The tissues TEAC levels were determined based on
the method of Rufino et al. (2010) with modifications. The
ABTS solution was prepared by mixing 5 mL of 7.0 mmol L�1
ABTS (2,2 0-azino-bis(3-ethylbenzothiazoline-6-sulphonic ac
id) diammonium salt) and 88 lL of 145 mmol L�1 potassium
per sulphate solution, which was allowed to react for 12–
16 h at room temperature in the dark. Ethanol (99.5%) was
added to the solution until an absorbance of 0.700 ± 0.05
e-dried jaboticaba peel.A
extract Hydrolysated MeOH extract
11.46a 608.67 ± 33.07a
± 13.60 ND
2.73a 115.76 ± 1.34a
.07b 49.86 ± 0.20a
1.75b 1545.77 ± 12.56a
.03b 54.96 ± 0.40a
(P < 0.05).
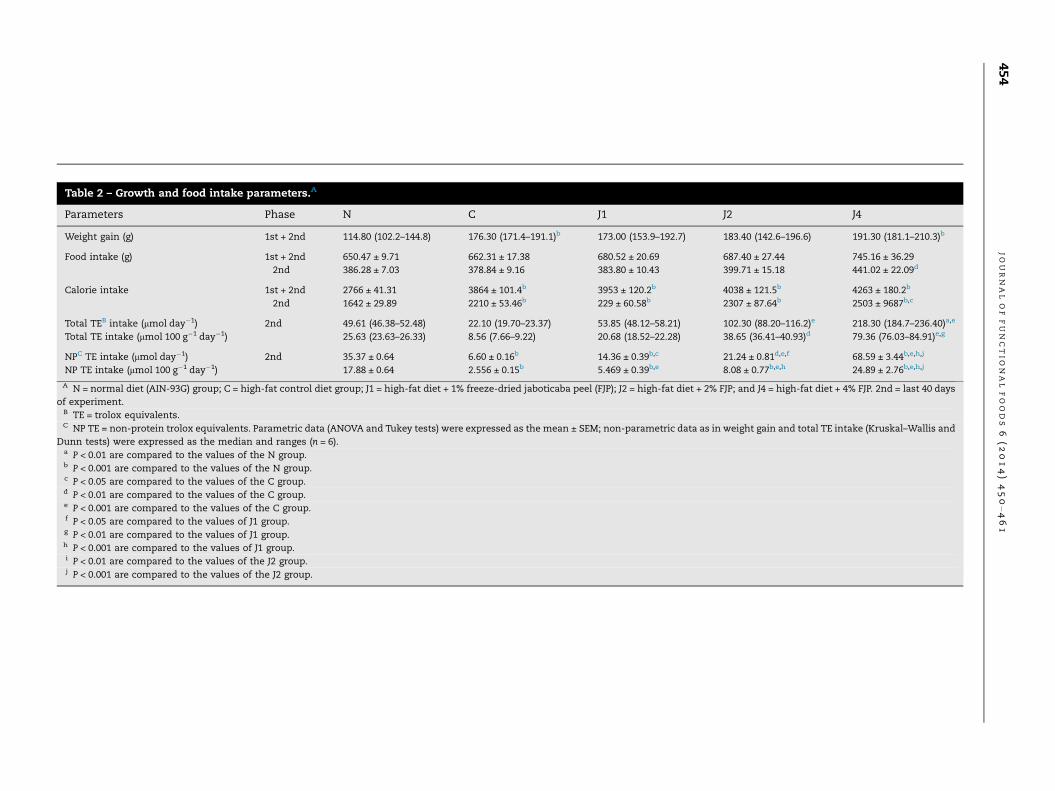
Table 2 – Growth and food intake parameters.A
Parameters Phase N C J1 J2 J4
Weight gain (g) 1st + 2nd 114.80 (102.2–144.8) 176.30 (171.4–191.1)b 173.00 (153.9–192.7) 183.40 (142.6–196.6) 191.30 (181.1–210.3)b
Food intake (g) 1st + 2nd 650.47 ± 9.71 662.31 ± 17.38 680.52 ± 20.69 687.40 ± 27.44 745.16 ± 36.29
2nd 386.28 ± 7.03 378.84 ± 9.16 383.80 ± 10.43 399.71 ± 15.18 441.02 ± 22.09d
Calorie intake 1st + 2nd 2766 ± 41.31 3864 ± 101.4b 3953 ± 120.2b 4038 ± 121.5b 4263 ± 180.2b
2nd 1642 ± 29.89 2210 ± 53.46b 229 ± 60.58b 2307 ± 87.64b 2503 ± 9687b,c
Total TEB intake (lmol day�1) 2nd 49.61 (46.38–52.48) 22.10 (19.70–23.37) 53.85 (48.12–58.21) 102.30 (88.20–116.2)e 218.30 (184.7–236.40)a,e
Total TE intake (lmol 100 g�1 day�1) 25.63 (23.63–26.33) 8.56 (7.66–9.22) 20.68 (18.52–22.28) 38.65 (36.41–40.93)d 79.36 (76.03–84.91)e,g
NPC TE intake (lmol day�1) 2nd 35.37 ± 0.64 6.60 ± 0.16b 14.36 ± 0.39b,c 21.24 ± 0.81d,e,f 68.59 ± 3.44b,e,h,j
NP TE intake (lmol 100 g�1 day�1) 17.88 ± 0.64 2.556 ± 0.15b 5.469 ± 0.39b,e 8.08 ± 0.77b,e,h 24.89 ± 2.76b,e,h,j
A N = normal diet (AIN-93G) group; C = high-fat control diet group; J1 = high-fat diet + 1% freeze-dried jaboticaba peel (FJP); J2 = high-fat diet + 2% FJP; and J4 = high-fat diet + 4% FJP. 2nd = last 40 days
of experiment.B TE = trolox equivalents.C NP TE = non-protein trolox equivalents. Parametric data (ANOVA and Tukey tests) were expressed as the mean ± SEM; non-parametric data as in weight gain and total TE intake (Kruskal–Wallis and
Dunn tests) were expressed as the median and ranges (n = 6).a P < 0.01 are compared to the values of the N group.b P < 0.001 are compared to the values of the N group.c P < 0.05 are compared to the values of the C group.d P < 0.01 are compared to the values of the C group.e P < 0.001 are compared to the values of the C group.f P < 0.05 are compared to the values of J1 group.g P < 0.01 are compared to the values of J1 group.h P < 0.001 are compared to the values of J1 group.i P < 0.01 are compared to the values of the J2 group.j P < 0.001 are compared to the values of the J2 group.
45
4J
OU
RN
AL
OF
FU
NC
TI
ON
AL
FO
OD
S6
(2
01
4)
45
0–
46
1
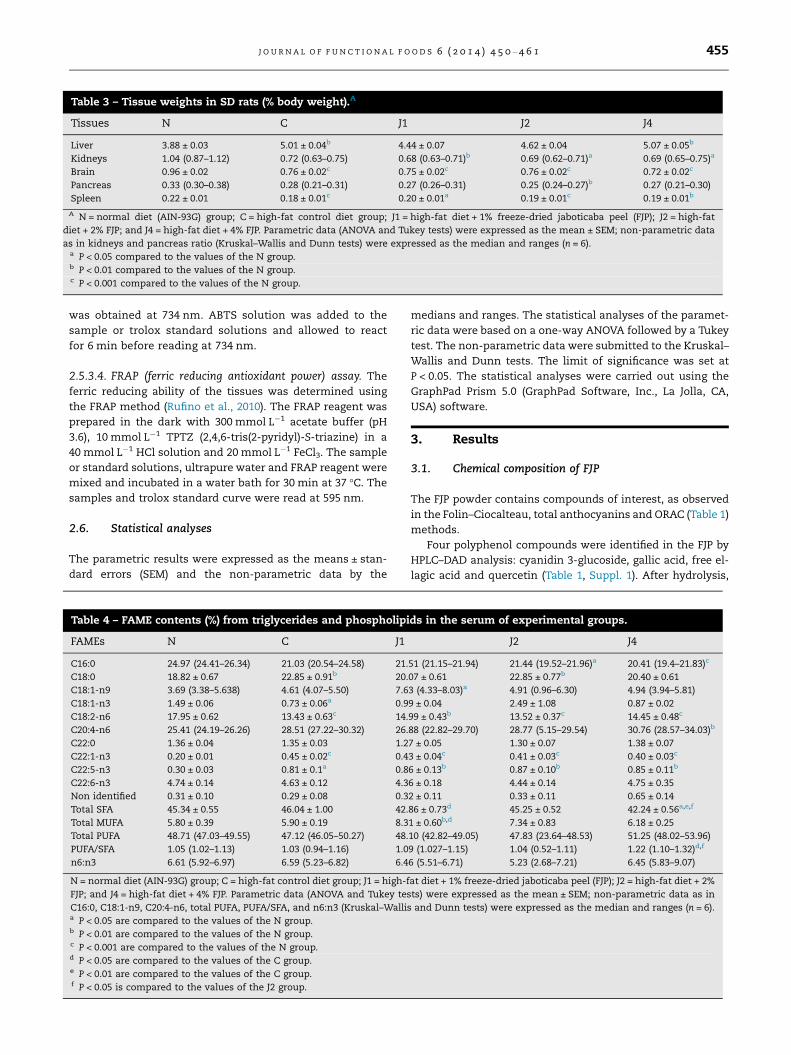
Table 3 – Tissue weights in SD rats (% body weight).A
Tissues N C J1 J2 J4
Liver 3.88 ± 0.03 5.01 ± 0.04b 4.44 ± 0.07 4.62 ± 0.04 5.07 ± 0.05b
Kidneys 1.04 (0.87–1.12) 0.72 (0.63–0.75) 0.68 (0.63–0.71)b 0.69 (0.62–0.71)a 0.69 (0.65–0.75)a
Brain 0.96 ± 0.02 0.76 ± 0.02c 0.75 ± 0.02c 0.76 ± 0.02c 0.72 ± 0.02c
Pancreas 0.33 (0.30–0.38) 0.28 (0.21–0.31) 0.27 (0.26–0.31) 0.25 (0.24–0.27)b 0.27 (0.21–0.30)
Spleen 0.22 ± 0.01 0.18 ± 0.01c 0.20 ± 0.01a 0.19 ± 0.01c 0.19 ± 0.01b
A N = normal diet (AIN-93G) group; C = high-fat control diet group; J1 = high-fat diet + 1% freeze-dried jaboticaba peel (FJP); J2 = high-fat
diet + 2% FJP; and J4 = high-fat diet + 4% FJP. Parametric data (ANOVA and Tukey tests) were expressed as the mean ± SEM; non-parametric data
as in kidneys and pancreas ratio (Kruskal–Wallis and Dunn tests) were expressed as the median and ranges (n = 6).a P < 0.05 compared to the values of the N group.b P < 0.01 compared to the values of the N group.c P < 0.001 compared to the values of the N group.
J O U R N A L O F F U N C T I O N A L F O O D S 6 ( 2 0 1 4 ) 4 5 0 – 4 6 1 455
was obtained at 734 nm. ABTS solution was added to the
sample or trolox standard solutions and allowed to react
for 6 min before reading at 734 nm.
2.5.3.4. FRAP (ferric reducing antioxidant power) assay. The
ferric reducing ability of the tissues was determined using
the FRAP method (Rufino et al., 2010). The FRAP reagent was
prepared in the dark with 300 mmol L�1 acetate buffer (pH
3.6), 10 mmol L�1 TPTZ (2,4,6-tris(2-pyridyl)-S-triazine) in a
40 mmol L�1 HCl solution and 20 mmol L�1 FeCl3. The sample
or standard solutions, ultrapure water and FRAP reagent were
mixed and incubated in a water bath for 30 min at 37 �C. The
samples and trolox standard curve were read at 595 nm.
2.6. Statistical analyses
The parametric results were expressed as the means ± stan-
dard errors (SEM) and the non-parametric data by the
Table 4 – FAME contents (%) from triglycerides and phospholipi
FAMEs N C J1
C16:0 24.97 (24.41–26.34) 21.03 (20.54–24.58) 21.
C18:0 18.82 ± 0.67 22.85 ± 0.91b 20.
C18:1-n9 3.69 (3.38–5.638) 4.61 (4.07–5.50) 7.6
C18:1-n3 1.49 ± 0.06 0.73 ± 0.06a 0.9
C18:2-n6 17.95 ± 0.62 13.43 ± 0.63c 14.
C20:4-n6 25.41 (24.19–26.26) 28.51 (27.22–30.32) 26.
C22:0 1.36 ± 0.04 1.35 ± 0.03 1.2
C22:1-n3 0.20 ± 0.01 0.45 ± 0.02c 0.4
C22:5-n3 0.30 ± 0.03 0.81 ± 0.1a 0.8
C22:6-n3 4.74 ± 0.14 4.63 ± 0.12 4.3
Non identified 0.31 ± 0.10 0.29 ± 0.08 0.3
Total SFA 45.34 ± 0.55 46.04 ± 1.00 42.
Total MUFA 5.80 ± 0.39 5.90 ± 0.19 8.3
Total PUFA 48.71 (47.03–49.55) 47.12 (46.05–50.27) 48.
PUFA/SFA 1.05 (1.02–1.13) 1.03 (0.94–1.16) 1.0
n6:n3 6.61 (5.92–6.97) 6.59 (5.23–6.82) 6.4
N = normal diet (AIN-93G) group; C = high-fat control diet group; J1 = high-f
FJP; and J4 = high-fat diet + 4% FJP. Parametric data (ANOVA and Tukey tes
C16:0, C18:1-n9, C20:4-n6, total PUFA, PUFA/SFA, and n6:n3 (Kruskal–Wallisa P < 0.05 are compared to the values of the N group.b P < 0.01 are compared to the values of the N group.c P < 0.001 are compared to the values of the N group.d P < 0.05 are compared to the values of the C group.e P < 0.01 are compared to the values of the C group.f P < 0.05 is compared to the values of the J2 group.
medians and ranges. The statistical analyses of the paramet-
ric data were based on a one-way ANOVA followed by a Tukey
test. The non-parametric data were submitted to the Kruskal–
Wallis and Dunn tests. The limit of significance was set at
P < 0.05. The statistical analyses were carried out using the
GraphPad Prism 5.0 (GraphPad Software, Inc., La Jolla, CA,
USA) software.
3. Results
3.1. Chemical composition of FJP
The FJP powder contains compounds of interest, as observed
in the Folin–Ciocalteau, total anthocyanins and ORAC (Table 1)
methods.
Four polyphenol compounds were identified in the FJP by
HPLC–DAD analysis: cyanidin 3-glucoside, gallic acid, free el-
lagic acid and quercetin (Table 1, Suppl. 1). After hydrolysis,
ds in the serum of experimental groups.
J2 J4
51 (21.15–21.94) 21.44 (19.52–21.96)a 20.41 (19.4–21.83)c
07 ± 0.61 22.85 ± 0.77b 20.40 ± 0.61
3 (4.33–8.03)a 4.91 (0.96–6.30) 4.94 (3.94–5.81)
9 ± 0.04 2.49 ± 1.08 0.87 ± 0.02
99 ± 0.43b 13.52 ± 0.37c 14.45 ± 0.48c
88 (22.82–29.70) 28.77 (5.15–29.54) 30.76 (28.57–34.03)b
7 ± 0.05 1.30 ± 0.07 1.38 ± 0.07
3 ± 0.04c 0.41 ± 0.03c 0.40 ± 0.03c
6 ± 0.13b 0.87 ± 0.10b 0.85 ± 0.11b
6 ± 0.18 4.44 ± 0.14 4.75 ± 0.35
2 ± 0.11 0.33 ± 0.11 0.65 ± 0.14
86 ± 0.73d 45.25 ± 0.52 42.24 ± 0.56a,e,f
1 ± 0.60b,d 7.34 ± 0.83 6.18 ± 0.25
10 (42.82–49.05) 47.83 (23.64–48.53) 51.25 (48.02–53.96)
9 (1.027–1.15) 1.04 (0.52–1.11) 1.22 (1.10–1.32)d,f
6 (5.51–6.71) 5.23 (2.68–7.21) 6.45 (5.83–9.07)
at diet + 1% freeze-dried jaboticaba peel (FJP); J2 = high-fat diet + 2%
ts) were expressed as the mean ± SEM; non-parametric data as in
and Dunn tests) were expressed as the median and ranges (n = 6).
456 J O U R N A L O F F U N C T I O N A L F O O D S 6 ( 2 0 1 4 ) 4 5 0 – 4 6 1
the content of ellagic acid was significant increased and
cyanidin 3-glucoside was supposedly hydrolysated to agly-
cone cyanidin (Suppl. 1).
3.2. Weight and intake parameters
At the beginning of this study, the 5 groups of animals showed
similar (P = 0.58) body weight (102.6–121.2 g). The animals fed
on the high-fat diet showed a 52% increase in weight gain
(absolute values) as compared to the standard group. The
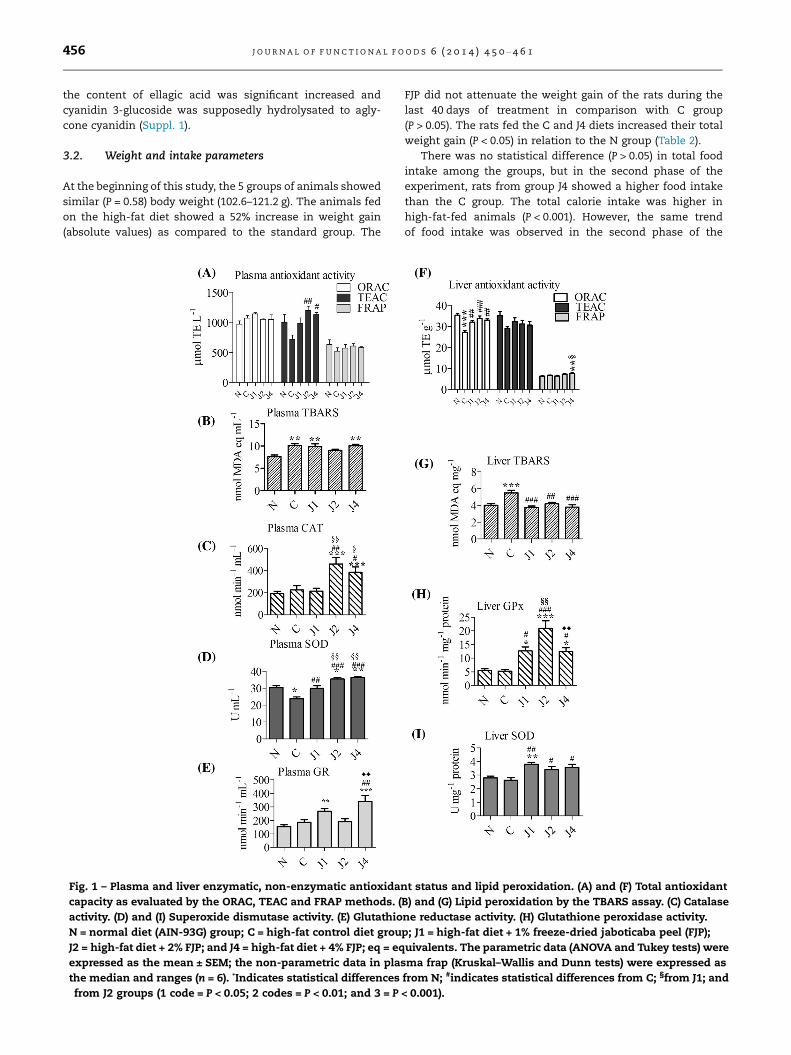
Fig. 1 – Plasma and liver enzymatic, non-enzymatic antioxida
capacity as evaluated by the ORAC, TEAC and FRAP methods. (
activity. (D) and (I) Superoxide dismutase activity. (E) Glutathio
N = normal diet (AIN-93G) group; C = high-fat control diet grou
J2 = high-fat diet + 2% FJP; and J4 = high-fat diet + 4% FJP; eq = eq
expressed as the mean ± SEM; the non-parametric data in pla
the median and ranges (n = 6). *Indicates statistical differences�from J2 groups (1 code = P < 0.05; 2 codes = P < 0.01; and 3 = P
FJP did not attenuate the weight gain of the rats during the
last 40 days of treatment in comparison with C group
(P > 0.05). The rats fed the C and J4 diets increased their total
weight gain (P < 0.05) in relation to the N group (Table 2).
There was no statistical difference (P > 0.05) in total food
intake among the groups, but in the second phase of the
experiment, rats from group J4 showed a higher food intake
than the C group. The total calorie intake was higher in
high-fat-fed animals (P < 0.001). However, the same trend
of food intake was observed in the second phase of the
nt status and lipid peroxidation. (A) and (F) Total antioxidant
B) and (G) Lipid peroxidation by the TBARS assay. (C) Catalase
ne reductase activity. (H) Glutathione peroxidase activity.
p; J1 = high-fat diet + 1% freeze-dried jaboticaba peel (FJP);
uivalents. The parametric data (ANOVA and Tukey tests) were
sma frap (Kruskal–Wallis and Dunn tests) were expressed as
from N; #indicates statistical differences from C; §from J1; and
< 0.001).
J O U R N A L O F F U N C T I O N A L F O O D S 6 ( 2 0 1 4 ) 4 5 0 – 4 6 1 457
experiment to calorie intake by J4. The J4-fed animals showed
the highest antioxidant capacity. The animals showed a
dependent dose response concerning anthocyanin (1.33, 1.53
and 3.30 mg 100 g�1 day�1, by pH differential method) and
polyphenols daily intake (HPLC–DAD). The daily non-protein
trolox equivalents consumed by the J4 animals was higher
than for all the other groups (Table 2). In addition, the regres-
sion analysis showed that the ORAC antioxidant capacity of
the FJP diets depended on the total anthocyanin contents
(r2 = 0.9953; r = 0.9686; P < 0.001; y = �2.0978 + 1.0382x).
The tissue weights were not altered by the dietary FJP treat-
ment when compared to the C group. The weights of the brains
and spleens of the obese rats were lower than those of the
healthy rats. The kidneys of the FJP-fed animals were smaller
than those of the lean and fat control animals (Table 3).
3.3. Serum lipids
The levels of palmitic acid (C16:0) were decreased in the ser-
um for J2 and J4-fed rats; as for stearic acid (C18:0), its content
was higher for C and J2 when compared to N group. No alter-
ations on the concentrations of behenic acid (C22:0) were
found (P = 0.612) among the experimental groups. However,
the total SFA were reduced in the serum triglyceride and
phospholipid fractions of J1 and J4 animals (6.91% and
8.25%, respectively), when compared with C. These results
are consistent with the higher PUFA:SFA ratios in the serum
of the J4 group (Table 4).
The animals of N group showed the highest level of lino-
leic acid (18:2n-6), and the arachidonic acid (C20:4-n6) was in-
creased in J4-fed rats related to N group. However, no
differences were found among the high-fat-fed animals for
n6 FAME (Table 4 and Suppl. 2).
The animals that received the C diet showed lower levels
of serum C18:1n-3 relative to those fed with N diet. The
22:1n-3 and 22:5n-3 FAME were increased in all the high-fat-
fed rats (C, J1, J2, J4) and the 22:5n-3 (docosapentaenoic acid)
FAME increasing in the FJP-fed animals were more significant
(P < 0.01). The DHA (C22:6n-3) contents was similar to all
experimental groups, as occurred with n6:n3 ratio (Table 4
and Suppl. 2).
The plasma of rats treated with J1 diet had higher concen-
trations of oleic acid (C18:1n-9) than the N group. These val-
ues were the main contributor to the high total content on
monounsaturated fatty acids (MUFA) in J1 group in relation
to N and C groups (Table 4 and Suppl. 2).
3.4. Plasma antioxidant status
The TEAC assay showed that the plasma antioxidant capacity
was higher in the J2 and J4 groups as compared to the C group.
The FRAP and ORAC assay showed no statistical differences
among the groups (Fig. 1A). Although the TBARS levels in
high-fat-fed groupswere higher than those fed the normal diet,
the J2-fed animals showed reduced TBARS levels in absolute
values (Fig. 1B). The GSH values were higher in the J1 group
(22.17 mmol L�1) in relation to the N group (13.06 mmol L�1),
but not as compared to the C-fed animals (17.66 mmol L�1).
The antioxidant enzyme parameters indicated that the FJP
intake could promote a protective effect against oxidative
stress in the rat plasma. The CAT activity was 2.02 times high-
er in the J2 plasma and 1.70 times higher in the J4 plasma in
relation to the C group (Fig. 1C). The SOD units in the FJP-fed
rats were higher in relation to the other groups. The SOD
activities in the J1, J2 and J4 plasma was 13.18%, 15.60% and
15.95% higher in comparison to C group (Fig. 1D). The plasma
GR increased 1.83 times in the J4 animals when compared to
the C group (Fig. 1E). On the other hand, the means for GPx
were not statistically different (P > 0.05) among the experi-
mental groups, the values ranging from 11.14 ± 1.41 to
14.96 ± 2.29 (nmol min�1 mL�1).
3.5. Liver antioxidant status
The obese conditions of the high-fat control group were prob-
ably responsible for the high TBARS values and low antioxi-
dant capacity levels in the livers of these animals.
Nevertheless, the addition of FJP to the diets improved the
antioxidant status according to the ORAC method (Fig. 1F)
and ameliorated the lipid peroxidation levels in the rat livers.
The TBARS levels were reduced 23.61% in the animals from
group J2 and about 31% in the J1 and J4-fed animals
(Fig. 1G). A linear trend line showed a significant correlation
coefficient (P < 0.01) between the liver TBARS and ORAC levels
(r2 = 0.2492; r = �0.4992; P = 0.0052; y = 41.111 � 2.0886x).
The diets with added FJP increased the liver GPx and SOD
activities (Fig. 1H and I), which corroborates the antioxidant
status of the tissue. The addition of 2% FJP to the high-fat diet
seemed to be the most efficient dose to increase GPx, since
the J2 animals showed a 3.98 times increase as compared to
the control group. The GSH contents did not differ (P > 0.05)
among the experimental groups (values ranging from
41.32 ± 3.88 to 61.50 ± 10.22 nmol lg�1 protein). The animals
fed the high-fat diets showed the lowest GR activities
(14.63 ± 17.19 nmol min�1 lg�1 protein) as compared to the N
group (23.06 nmol min�1 lg�1 protein), but not in the case of
the J4 animals (17.98 nmol min�1 lg�1 protein).
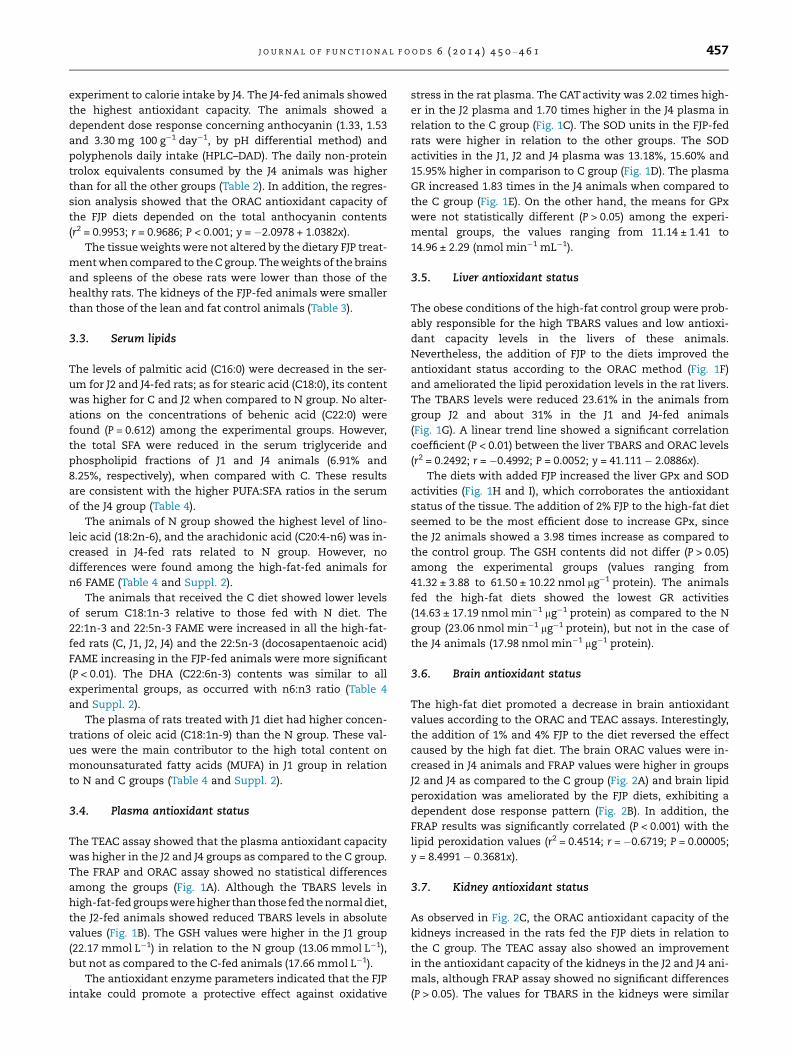
3.6. Brain antioxidant status
The high-fat diet promoted a decrease in brain antioxidant
values according to the ORAC and TEAC assays. Interestingly,
the addition of 1% and 4% FJP to the diet reversed the effect
caused by the high fat diet. The brain ORAC values were in-
creased in J4 animals and FRAP values were higher in groups
J2 and J4 as compared to the C group (Fig. 2A) and brain lipid
peroxidation was ameliorated by the FJP diets, exhibiting a
dependent dose response pattern (Fig. 2B). In addition, the
FRAP results was significantly correlated (P < 0.001) with the
lipid peroxidation values (r2 = 0.4514; r = �0.6719; P = 0.00005;
y = 8.4991 � 0.3681x).
3.7. Kidney antioxidant status
As observed in Fig. 2C, the ORAC antioxidant capacity of the
kidneys increased in the rats fed the FJP diets in relation to
the C group. The TEAC assay also showed an improvement
in the antioxidant capacity of the kidneys in the J2 and J4 ani-
mals, although FRAP assay showed no significant differences
(P > 0.05). The values for TBARS in the kidneys were similar
Fig. 2 – Tissue antioxidant capacity and lipid peroxidation.
(A) Brain total antioxidant capacity as evaluated by the
ORAC, TEAC and FRAP methods. (B) Brain lipid peroxidation
by the TBARS assay. (C) Kidney antioxidant capacity as
evaluated by the ORAC, TEAC and FRAP methods. (D) Kidney
GSH. (E) Spleen antioxidant capacity as evaluated by the
ORAC, TEAC and FRAP methods. Results expressed on a dry
weight basis. N = normal diet (AIN-93G) group; C = high-fat
control diet group; J1 = high-fat diet + 1% freeze-dried
jaboticaba peel (FJP); J2 = high-fat diet + 2% FJP; and
J4 = high-fat diet + 4% FJP; eq = equivalents. The parametric
data (ANOVA and Tukey tests) were expressed as the
mean ± SEM; the non-parametric data in kidneys ORAC and
TEAC (Kruskal–Wallis and Dunn tests) were expressed as
the median and ranges (n = 6). *Indicates statistical
differences from N; #indicates statistical differences from C;§from J1; and �from J2 groups (1 code = P < 0.05; 2
codes = P < 0.01; and 3 = P < 0.001).
458 J O U R N A L O F F U N C T I O N A L F O O D S 6 ( 2 0 1 4 ) 4 5 0 – 4 6 1
among the groups (values ranging from 2.58 to 2.78 nmol MDA
equivalents mg�1), except that there was an increase of
24.45% in lipid peroxidation in the kidneys of the C animals
(2.90 nmol MDA equivalents mg�1) in comparison to the N-
fed ones (2.33 nmol MDA equivalents mg�1).
The GSH values increased in the high-fat-fed animals. Fur-
thermore, groups J2 and J4 showed 39.29% and 84.57% in-
creases in GSH, respectively, as compared to C group
(Fig. 2D). The FJP-fed animals showed similar SOD activities
as compared to group C, but the J4-fed animals (1.47 U mg�1
protein) showed a decrease in activity of this enzyme
(P < 0.05) when compared to group N (2.20 U mg�1 protein).
3.8. Spleen antioxidant status
According to the TEAC results, the J4 group showed an in-
crease in antioxidant activity relative to N, C and J2 groups
(Fig. 2E), but the ORAC, FRAP and TBARS results did not con-
firm these findings.
3.9. Pancreas antioxidant status
The GSH content of the J4 animals (6.30 nmol lg�1) increased
in comparison to J1 (4.27 nmol lg�1 protein) and J2
(4.42 nmol lg�1 protein), but no differences were found in
comparison to group C (5.11 nmol lg�1 protein). On the other
hand, the SOD units in group J4 (1.97 U mg�1 protein) were
lower than in groups N (2.60 U mg�1 protein) and C
(1.75 U mg�1 protein).
4. Discussion
The M. jaboticaba peel contains high contents of polyphenols,
as shown in this study. Corroborating literature results (Abe
et al., 2012), the HPLC–DAD analysis showed significant
amounts of gallic acid, quercetin and ellagic acid.
The ellagitannins content of jaboticaba peel (Alezandro,
Dube, Desjardins, Lajolo, & Genovese, 2013) probably was
responsible for the increased ellagic acid amount in FJP sam-
ple, after the acid hydrolysis (Table 1). In addition, as pub-
lished in previous work (Leite-Legatti et al., 2012), jaboticaba
peel contains significant amounts of cyanidin 3-glucoside
(1963.57 ± 52.72 mg 100 g�1), a very common compound in
deep-purple berries (Prior, 2003). The HPLC–DAD data showed
that cyanidin 3-glucoside content of FJP was increased, and
the aglycone of cyanidin was supposedly released after acid
hydrolysis (Suppl. 1). The polyphenol compounds showed in
this study corroborates to the FJP high antiradical activity
demonstrated by ORAC assay (Table 1).
The high-fat diets changed the FAME profile from triacyl-
glycerols and phospholipids in serum of the rats. Indeed,
the blood FA profile in high-SFA-fed animals is characterized
by a higher proportion of SFA and MUFA, as well as by a lower
proportion of n-6 PUFA (Tranchida et al., 2012). The activity of
D6 and D9 saturases are also increased in obese conditions
(Folsom, Ma, McGovern, & Eckfeldt, 1996). The composition
of lipids in serum is correlated with the insulin resistance
as shown by studies that demonstrated a positive association
between total SFA from plasma phospholipids and cholesterol
J O U R N A L O F F U N C T I O N A L F O O D S 6 ( 2 0 1 4 ) 4 5 0 – 4 6 1 459
ester to type 2 diabetes occurrence (Folsom et al., 1996; Wang
et al., 2003). The high percentage of MUFA of J1 animals could
indicate an increased activity of D9 desaturase, which pro-
duces oleic acid by desaturating stearic acid, and is inversely
correlated insulin levels (Folsom et al., 1996).
Previous studies with FJP-fed obese animals showed no
significant differences in the serum concentration of triglyc-
erides (Batista et al., 2013). However, the plasma insulin levels
were decreased in FJP-fed rats (Lenquiste et al., 2012), and, in
the present work, the FJP intake reduced serum saturated lip-
ids. SFA are strongly related with inflammation and insulin
resistance (Dragano et al., 2013; Tranchida et al., 2012). Thus,
the low levels of saturated FAME in serum triglycerides and
phospholipids from J1 and J4-fed animals might act as a pro-
tection factor against hyperinsulinemia and inflammation.
The 4% FJP dose was more effective, since the J4-animals
showed the better PUFA:SFA ratio among the experimental
group.
Indeed, our previous studies showed that the 4% FJP dose
added to high-fat diets increased triglycerides output,
decreased hyperinsulinemia, hepatic inflammation and im-
prove insulin sensitive in Sprague–Dawley rats and Swiss mice
(Batista et al., 2013; Dragano et al., 2013; Lenquiste et al.,
2012). In addition, the lower serum levels of SFA of J4 animals
could indicate a down-regulation of gene expression of lipo-
genic enzymes, a result cited in a studies using anthocyanin
and ellagic acid-rich diets and extracts (Tsuda et al., 2003;
Wu, Ma, & Tian, 2013a). Folsom and co-workers have shown
that PUFA and SFA from phospholipids are correlated with
dietary pattern and endogenous synthesis, respectively,
which corroborates this discussion (Folsom et al., 1996).
An investigation reported that a concentration of
13.09 ng mL�1 of total anthocyanins was found in human ser-
um 4 h after the consumption of freeze-dried blueberries
(1.16 g 100 g�1 total anthocyanins) (Mazza et al., 2002). In the
present study, a daily consumption of bioactive compounds
from FJP diets enhanced the plasma antioxidant status even
under 12 h fasting conditions (Tables 1 and 2 and Fig. 1). In
agreement with previous studies (Feillet-Coudray et al.,
2009), the plasma results showed that the FJP diets did not al-
ter the values obtained for lipid oxidation, GSH or GPx in ob-
ese rats. Conversely, the enzymatic analyses (CAT, SOD and
GR activities) showed expressive increases in their activities
in the plasma of the FJP groups.
The higher plasma antioxidant status found in the J2 and
J4 animals could explain previous studies that showed in-
creased cardio protective parameters in obese rats fed a FJP
diet (Dragano et al., 2013; Lenquiste et al., 2012). Moreover,
2% FJP was also capable of increasing the antioxidant poten-
tial in healthy rats (Leite et al., 2011) showing that it could pre-
vent diseases under normal conditions.
The high liver weights of the J4-fed animals did not seem
to impact the antioxidant status of the tissue, possibly be-
cause of the higher intake of polyphenols and trolox equiva-
lents that compensated the damage caused by the calorie
intake. The oxidative stress parameters of the livers of the
FJP-fed animals showed that all FJP doses promoted oxidative
protection, especially the J2 diet, as observed in the ORAC,
TBARS and GPx results. Based on the results, it can be seen
that the liver antioxidant defenses in the rats fed high-fat
diets with 1%, 2% and 4% FJP added, were similar to those of
normal diet-fed animals. The ORAC data was shown to corre-
late with the TBARS data, improving the antioxidant defenses
of the liver.
In contrast with some studies (Feillet-Coudray et al., 2009;
Lee, Choi, & Seo, 2009), hepatic GSH showed no differences
among the groups evaluated, possibly because of the use of
different methods or the absence of protein precipitation.
The liver GPx activity was expressively higher in the FJP-fed
animals, which seemed to contribute to an improvement in
the endogenous antioxidant defenses. Polyphenols are re-
lated to increase antioxidant enzymes expression (SOD and
GPx), via activation of transcription factors (such as Nf-E2/
Nrf2) (Chuang & McIntosh, 2011), which could explain these
findings. SOD and GPx act by removing the superoxide radical
and hydrogen peroxide, respectively, and thus prevent the
formation of the hydroxyl radical, a potent ROS responsible
for much cell damage (Vincent et al., 2007).
Concomitantly, the brain/ body weight ratio was signifi-
cantly reduced (about 13%) in the high-fat-fed animals (C,
J1, J2 and J4 groups), which corroborates other findings in
the literature (Jeon et al., 2012). SFA-rich diets is linked with
an increased risk of neurodegenerative disease related to dia-
betes, which could explain these findings (Jeon et al., 2012;
Lenquiste et al., 2012; Winocur & Greenwood, 2005). However,
the present data suggested a better brain antioxidant defense
for animals that received diets with added FJP, based on the
results of the ORAC, TEAC, FRAP and TBARS assays. The pol-
yphenol-rich diet, as shown in this study, could protect neu-
rons against inflammation degenerative action of SFA intake
by acting in insulin transductions signals in the brain as the
IR-AMPK-GSK3b axis and inhibiting NFjB nuclear transloca-
tions and TNFa expression (Jeon et al., 2012; Lau, Joseph,
McDonald, & Kalt, 2009). Thus, as brain and liver could be
the main tissues benefited by the intake of FJP.
The kidneys are responsible for the catabolism of the poly-
phenols, which are widely distributed in this tissue (Talavera
et al., 2005; Vanzo et al., 2011). In fact, the non-enzymatic
antioxidant parameters increased in the J1, J2 and J4 groups,
but lipid peroxidation was higher and did not alter with the
use of the jaboticaba treatment. Kidney lipid peroxidation
may be a consequence of increasing ROS production by renal
tissue damaged by high intrarenal pressures (Noeman et al.,
2011).
In this work, only the TEAC results showed an increase in
antioxidant power of the spleen. The present findings also
suggested macroscopic spleen atrophy arising from the obes-
ity, which could be allied with changes in its physiological
functions, such as immunological cell recycling.
The b-pancreatic cells are very sensitive to oxidative
stress, particularly because they are poor in the antioxidant
enzymes (Tiedge, Lortz, Drinkgern, & Lenzen, 1997). No signif-
icant changes concerning the antioxidant status of the
pancreas was observed in FJP-fed animals.
In conclusion, this study indicated that the oxidative
stress arising from obesity was minimized in many tissues
by the intake of FJP. The diets with added 2% and 4% FJP
showed better in vivo antioxidant properties, leading to plas-
ma, liver, brain and kidney antioxidant status enhancement,
probably due to the presence of polyphenols, such as
460 J O U R N A L O F F U N C T I O N A L F O O D S 6 ( 2 0 1 4 ) 4 5 0 – 4 6 1
anthocyanins, ellagic acid, gallic acid, quercetin derivatives
and others, which were identified in the FJP. In addition, the
serum PUFA:SFA ratio of FAME were increased in obese rats
that received diets containing 4% FJP. Thus, the regular con-
sumption of jaboticaba peel could increase the circulation of
polyphenols in the body, which could possibly improve anti-
oxidant defenses and lipidemia in obese animals, protecting
their cells against oxidative stress damage and obesity-
related diseases.
Acknowledgements
The authors are grateful to CNPq, CAPES and FAPESP for their
financial support. We cordially thank Miriam Camila Lima
and Alice Vieira Leite Legatti for kind cooperation.
Appendix A. Supplementary data
Supplementary data associated with this article can be found,
in the online version, at http://dx.doi.org/10.1016/j.jff.2013.
11.011.
R E F E R E N C E S
Abe, L. T., Lajolo, F. M., & Genovese, M. I. (2012). Potential dietarysources of ellagic acid and other antioxidants among fruitsconsumed in Brazil: Jabuticaba (Myrciaria jaboticaba (Vell.)Berg). Journal of the Science of Food and Agriculture, 92, 1679–1687.
Alezandro, M. R., Dube, P., Desjardins, Y., Lajolo, F. M., & Genovese,M. I. (2013). Comparative study of chemical and phenoliccompositions of two species of jaboticaba: Myrciaria jaboticaba(Vell.) Berg and Myrciaria cauliflora (Mart.) O. Berg.. Food ResearchInternational, 54, 468–477.
Batista, A. G., Lenquiste, S. A., Moldenhauer, C., Godoy, J. T., Reis,S. M. P. M., & Marostica Junior, M. R. (2013). Berry peel(Myrciaria jaboticaba (Vell.) Berg.) intake improved triglyceridesexcretion and hepatic lipid peroxidation in high-fat-fed rats.Brazilian Journal of Nutrition, 26, 571–581.
Bradford, M. M. (1976). Rapid and sensitive method forquantitation of microgram quantities of protein utilizingprinciple of protein–dye binding. Analytical Biochemistry, 72,248–254.
Carlberg, I., & Mannervik, B. (1985). Glutathione-reductase.Methods in Enzymology, 113, 484–490.
Chuang, C., & McIntosh, M. K. (2011). Potential mechanisms bywhich polyphenol-rich grapes prevent obesity-mediatedinflammation and metabolic diseases. Annual Reviews ofNutrition, 31, 155–176.
Costa, A. G. V., Garcia-Diaz, D. F., Jimenez, P., & Silva, P. I. (2013).Bioactive compounds and health benefits of exotic tropicalred–black berries. Journal of Functional Foods, 5, 539–549.
Davalos, A., Gomez-Cordoves, C., & Bartolome, B. (2004).Extending applicability of the oxygen radical absorbancecapacity (ORAC-fluorescein) assay. Journal of Agricultural andFood Chemistry, 52, 48–54.
Dragano, N. R. V., Marques, A. C., Cintra, D. E. C., Solon, C., Morari,J., Leite-Legatti, A. V., Velloso, L. A., & Marostica Junior, M. R.(2013). Freeze-dried jaboticaba peel powder improves insulinsensitivity in high-fat-fed mice. British Journal of Nutrition, 110,447–455.
Ellman, G. L. (1959). Tissue sulfhydryl groups. Archives ofBiochemistry and Biophysics, 82, 70–77.
Feillet-Coudray, C., Sutra, T., Fouret, G., Ramos, J., Wrutniak-Cabello, C., Cabello, G., Cristol, J. P., & Coudray, C. (2009).
Oxidative stress in rats fed a high-fat high-sucrose diet andpreventive effect of polyphenols: Involvement ofmitochondrial and NAD(P)H oxidase systems. Free RadicalBiology and Medicine, 46, 624–632.
Flohe, L., & Gunzler, W. A. (1984). Assays of glutathione-peroxidase. Methods in Enzymology, 105, 114–121.
Folsom, A. R., Ma, J., McGovern, P. G., & Eckfeldt, J. H. (1996).Relation between plasma phospholipid saturated fatty acidsand hyperinsulinemia. Metabolism – Clinical and Experimental,45, 223–228.
Furlan, C. P. B., Marques, A. C., Marineli, R. S., & Marostica Junior,M. R. (2013). Conjugated linoleic acid and phytosterolscounteract obesity induced by high-fat diet. Food ResearchInternational, 51, 429–435.
Jeon, B. T., Jeong, E. A., Shin, H. J., Lee, Y., Lee, D. H., Kim, H. J.,Kang, S. S., Cho, G. J., Choi, W. S., & Roh, G. S. (2012).Resveratrol attenuates obesity-associated peripheral andcentral inflammation and improves memory deficit in micefed a high-fat diet. Diabetes, 61, 1444–1454.
Kalt, W., Foote, K., Fillmore, S. A. E., Lyon, M., Van Lunen, T. A., &McRae, K. B. (2008). Effect of blueberry feeding on plasmalipids in pigs. British Journal of Nutrition, 100, 70–78.
Lau, F. C., Joseph, J. A., McDonald, J. E., & Kalt, W. (2009).Attenuation of iNOS and COX2 by blueberry polyphenols ismediated through the suppression of NF-kappa B activation.Journal of Functional Foods, 1, 274–283.
Lee, S. J., Choi, S. K., & Seo, J. S. (2009). Grape skin improvesantioxidant capacity in rats fed a high fat diet. NutritionResearch and Practice, 3, 279–285.
Leite, A. V., Malta, L. G., Riccio, M. F., Eberlin, M. N., Pastore, G. M.,& Marostica, M. R. (2011). Antioxidant potential of rat plasmaby administration of freeze-dried jaboticaba peel (Myrciariajaboticaba Vell Berg). Journal of Agricultural and Food Chemistry,59, 2277–2283.
Leite-Legatti, A. V., Batista, A. G., Dragano, N. R. V., Marques, A. C.,Malta, L. G., Riccio, M. F., Eberlin, M. N., Machado, A. R. T., deCarvalho-Silva, L. B., Ruiz, A. L. T. G., de Carvalho, J. E., Pastore,G. M., & Marostica, M. R. (2012). Jaboticaba peel: Antioxidantcompounds, antiproliferative and antimutagenic activities.Food Research International, 49, 596–603.
Lenquiste, S. A., Batista, A. G., Marineli, R. D., Dragano, N. R. V., &Marostica, M. R. (2012). Freeze-dried jaboticaba peel added tohigh-fat diet increases HDL-cholesterol and improves insulinresistance in obese rats. Food Research International, 49, 153–160.
Mazza, G., Kay, C. D., Cottrell, T., & Holub, B. J. (2002). Absorptionof anthocyanins from blueberries and serum antioxidantstatus in human subjects. Journal of Agricultural and FoodChemistry, 50, 7731–7737.
Noeman, S. A., Hamooda, H. E., & Baalash, A. A. (2011).Biochemical study of oxidative stress markers in the liver,kidney and heart of high fat diet induced obesity in rats.Diabetology & Metabolic Syndrome, 3, 17.
Ohkawa, H., Ohishi, N., & Yagi, K. (1979). Assay for lipid peroxidesin animal-tissues by thiobarbituric acid reaction. AnalyticalBiochemistry, 95, 351–358.
Plagemann, I., Krings, I., Berger, R. G., & Marostica Junior, M. R.(2012). Volatile constituents of jabuticaba (Myrciaria jaboticaba(Vell.) O. Berg) fruits. Journal of Essential Oil Research, 24, 45–51.
Port’s, P. S., Chiste, R. C., Godoy, H. T., & Prado, M. A. (2013). Thephenolic compounds and the antioxidant potential of infusionof herbs from the Brazilian Amazonian region. Food ResearchInternational, 53, 882–890.
Prior, R. L. (2003). Fruits and vegetables in the prevention ofcellular oxidative damage. American Journal of Clinical Nutrition,78, 570s–578s.
Reeves, P. G., Nielsen, F. H., & Fahey, G. C. (1993). Ain-93 purifieddiets for laboratory rodents – Final report of the AmericanInstitute of Nutrition ad hoc writing committee on the

J O U R N A L O F F U N C T I O N A L F O O D S 6 ( 2 0 1 4 ) 4 5 0 – 4 6 1 461
reformulation of the Ain-76a rodent diet. Journal of Nutrition,123, 1939–1951.
Reynertson, K. A., Wallace, A. M., Adachi, S., Gil, R. R., Yang, H.,Basile, M. J., D’Armiento, J., Weinstein, I. B., & Kennelly, E. J.(2006). Bioactive depsides and anthocyanins from jaboticaba(Myrciaria cauliflora). Journal of Natural Products, 69, 1228–1230.
Rufino, M. D. M., Alves, R. E., de Brito, E. S., Perez-Jimenez, J.,Saura-Calixto, F., & Mancini, J. (2010). Bioactive compoundsand antioxidant capacities of 18 non-traditional tropical fruitsfrom Brazil. Food Chemistry, 121, 996–1002.
Swain, T., & Hillis, W. E. (1959). The phenolic constituents of Prunusdomestica. I.—The quantitative analysis of phenolicconstituents. Journal of the Science of Food and Agriculture, 10, 63–68.
Talavera, S., Felgines, C., Texier, O., Besson, C., Gil-Izquierdo, A.,Lamaison, J. L., & Remesy, C. (2005). Anthocyanin metabolismin rats and their distribution to digestive area, kidney, andbrain. Journal of Agricultural and Food Chemistry, 53, 3902–3908.
Tiedge, M., Lortz, S., Drinkgern, J., & Lenzen, S. (1997). Relationbetween antioxidant enzyme gene expression andantioxidative defense status of insulin-producing cells.Diabetes, 46, 1733–1742.
Tranchida, F., Tchiakpe, L., Rakotoniaina, Z., Deyris, V., Ravion, O.,& Hiol, A. (2012). Long-term high fructose and saturated fatdiet affects plasma fatty acid profile in rats. Journal of ZhejiangUniversity-Science B, 13, 307–317.
Tsuda, T., Horio, F., Uchida, K., Aoki, H., & Osawa, T. (2003). Dietarycyanidin 3-O-beta-D-glucoside-rich purple corn color preventsobesity and ameliorates hyperglycemia in mice. Journal ofNutrition, 133, 2125–2130.
Vanzo, A., Vrhovsek, U., Tramer, F., Mattivi, F., & Passamonti, S.(2011). Exceptionally fast uptake and metabolism of cyanidin
3-glucoside by rat kidneys and liver. Journal of Natural Products,74, 1049–1054.
Vincent, H. K., Innes, K. E., & Vincent, K. R. (2007). Oxidative stressand potential interventions to reduce oxidative stress inoverweight and obesity. Diabetes Obesity & Metabolism, 9,813–839.
Wang, L., Folsom, A. R., Zheng, Z. J., Pankow, J. S., Eckfeldt, J. H., &Investigators, A. S. (2003). Plasma fatty acid composition andincidence of diabetes in middle-aged adults: theatherosclerosis risk in communities (ARIC) study. AmericanJournal of Clinical Nutrition, 78, 91–98.
WHO (2012). World health statistics, 2012. Geneva: WHO Press (pp.176).
Winocur, G., & Greenwood, C. E. (2005). Studies of the effects ofhigh fat diets on cognitive function in a rat model. Neurobiologyof Aging, 26, S46–S49.
Winterbourn, C. C., Hawkins, R. E., Brian, M., & Carrell, R. W.(1975). The estimation of red cell superoxide dismutaseactivity. Journal of Laboratory and Clinical Medicine, 85, 337–341.
Wrolstad, R. E. (1993). Color and pigment analyses in fruit products.Corvallis: Oregon Agricultural Experimental Station.
Wu, D., Ma, X. F., & Tian, W. X. (2013a). Pomegranate husk extract,punicalagin and ellagic acid inhibit fatty acid synthase andadipogenesis of 3T3-L1 adipocyte. Journal of Functional Foods, 5,633–641.
Wu, S. B., Wu, J., Yin, Z. W., Zhang, J. Z., Long, C. L., Kennelly, E. J.,& Zheng, S. P. (2013b). Bioactive and marker compounds fromtwo edible dark-colored Myrciaria fruits and the synthesis ofjaboticabin. Journal of Agricultural and Food Chemistry, 61,4035–4043.


![ScienceDirect cienceirect ScienceDirect · and. {[,], , , : . , /](https://img.pdfslide.us/doc/110x75/608077a6d3af4a2358487f59/-sciencedirect-cienceirect-sciencedirect-and-.jpg)