Embed Size (px)
Citation preview

Office of Air and Radiation June 2011 _____________________________________________________________________________________________ AVAILABLE AND EMERGING TECHNOLOGIES
FOR REDUCING GREENHOUSE GAS EMISSIONS FROM MUNICIPAL SOLID WASTE LANDFILLS

2
Available and Emerging Technologies for Reducing
Greenhouse Gas Emissions from Municipal Solid Waste Landfills
Prepared by the
Sector Policies and Programs Division Office of Air Quality Planning and Standards
U.S. Environmental Protection Agency Research Triangle Park, North Carolina 27711
June 2011

3
Table of Contents
Abbreviations and Acronyms ....................................................................................................................... 4 I. Introduction ............................................................................................................................................... 6 II. Purpose of this Document ........................................................................................................................ 6 III. Description of Municipal Solid Waste Landfills .................................................................................... 6 IV. Summary of Control Measures ............................................................................................................... 8 V. Available Control Technologies for GHG Emissions from MSW Landfills ......................................... 10
A. LFG Collection Efficiency Improvement .......................................................................................... 10 B. LFG Control Devices ......................................................................................................................... 12 C. Increase of CH4 Oxidation ................................................................................................................. 17 D. Economic Analysis ............................................................................................................................ 18
VI. Bioreactor Landfill Systems ................................................................................................................. 20 VII. Management Practices ......................................................................................................................... 21 EPA Contact................................................................................................................................................ 22 References ................................................................................................................................................... 23 Appendix A ................................................................................................................................................. 26 Calculations to Estimate Cost Effectiveness for CO2e Reduced ................................................................. 26

4
Abbreviations and Acronyms ADEME French Agency for Environmental and Energy Management ATSDR Agency for Toxic Substances and Disease Registry BAAQMD Bay Area Air Quality Management District BACT Best available control technology Btu British thermal units CCAR California Climate Action Registry CCTP Climate Change Technology Program CEC California Energy Commission CH4 Methane CHP Combined heat and power CNG Compressed natural gas CO Carbon monoxide CO2 Carbon dioxide CO2e Carbon dioxide equivalents CPTR Cost Incurred Per Metric Ton of Reduced CO2e DER Distributed Energy Resource GHG Greenhouse gas HAP Hazard air pollutants H2 Hydrogen H2S Hydrogen sulfide kW Kilowatts lb Pound LFG Landfill gas LFGcost Landfill Gas Energy Cost Model LFGE Landfill gas energy LMOP Landfill Methane Outreach Program LNG Liquefied natural gas Mg Megagrams MSW Municipal solid waste MT Metric ton MW Megawatts MWh Megawatt-hour N2 Nitrogen N2O Nitrous oxide NESHAP National Emission Standards for Hazardous Air Pollutants NMOC Nonmethane organic compounds NOx Nitrogen oxides NREL National Renewable Energy Laboratory NSPS New Source Performance Standard O2 Oxygen ppmv Parts per million by volume PSD Prevention of significant deterioration psi Pounds per square inch RCRA Resource Conservation and Recovery Act scfm Standard cubic feet per minute SOx Sulfur oxides

5
SWICS Solid Waste Industry for Climate Solutions WARM Waste Reduction Model

6
I. Introduction This document is one of several white papers that summarize readily available information on control techniques and measures to mitigate greenhouse gas (GHG) emissions from specific industrial sectors. These white papers are solely intended to provide basic information on GHG control technologies and reduction measures in order to assist States and local air pollution control agencies, tribal authorities, and regulated entities in implementing technologies or measures to reduce GHG under the Clean Air Act, including, where applicable, in permitting under the prevention of significant deterioration (PSD) program and the assessment of best available control technology (BACT). These white papers do not set policy, standards or otherwise establish any binding requirements; such requirements are contained in the applicable EPA regulations and approved state implementation plans.
II. Purpose of this Document
This document provides information on control techniques and measures that are available to mitigate GHG emissions from the municipal solid waste landfill sector at this time. Because the primary GHG emitted by the municipal solid waste landfill industry are methane (CH4) and carbon dioxide (CO2), the control technologies and measures presented in this document focus on these pollutants. While a large number of available technologies are discussed here, this paper does not necessarily represent all potentially available technologies or measures that that may be considered for any given source for the purposes of reducing its GHG emissions. For example, controls that are applied to other industrial source categories with exhaust streams similar to the municipal solid waste sector may be available through “technology transfer” or new technologies may be developed for use in this sector.
The information presented in this document does not represent U.S. EPA endorsement of any particular control strategy. As such, it should not be construed as EPA approval of a particular control technology or measure, or of the emissions reductions that could be achieved by a particular unit or source under review.
III. Description of Municipal Solid Waste Landfills
The term municipal solid waste (MSW) landfill refers to an entire disposal facility in a contiguous geographic space where municipal waste is placed in or on land. The term does not cover land application units, surface impoundments, injection wells, or waste piles. Many MSW landfills receive other types of waste, such as construction and demolition debris, industrial wastes, and sludge. The information presented in this paper refers to landfills that primarily receive MSW, as defined in the criteria for MSW landfills under the Resource Conservation and Recovery Act (RCRA) regulations (40 CFR Part 258).
According to 2009 data, 54% of MSW in the United States was landfilled, 12% was incinerated, and 34% was recycled or composted (EPA, 2010a). There were approximately

1,800 opapproxim
Ayard trimconditionnonmethprocess, (O2) is deproductio(N2) prodwaste dis
Lapproximpotential GHG ememission
erational lanmately 132 m
After placememmings) decons and is comane organic as shown in epleted, CO2on depletes iduction stabisposal in a la
Figu
Landfills are mately 22% o
of CH4 is 2missions are ens using glob
ndfills in the million tons o
ent in a landomposes. Lamprised of apcompounds Figure 1. F
2 and hydrogin proportionilize. Signifandfill and c
ure 1: Prod
the second lof total U.S. 1 times that expressed in bal warming
United Statof MSW in 2
dfill, a portioandfill gas ispproximately(NMOC). L
First, CO2 is pgen (H2) are n to the CH4ficant LFG pan continue
duction phas
largest anthranthropogenof CO2, makterms of carpotentials.
7
es in 2006 (E2009 (EPA, 2
on of organics produced by 50% CH4,Landfill gas produced unproduced un that is produ
production tyfor 10 to 60
ses of landfi
opogenic sonic CH4 in 2king CH4 a mrbon dioxideFor example
EPA, 2010b2010a).
c waste (suchby microorga 50% CO2, ageneration o
nder aerobic nder anaerobuced. Finallypically begi0 years or lon
ill gas (ATS
urce of CH42008 (EPA, 2more potent e equivalentse, a landfill e
). These lan
h as paper, foanisms undeand trace amoccurs underconditions.
bic conditionly, CH4, CO2ins one or twnger (ATSDR
SDR, 2001a)
in the Unite2010b). TheGHG than Cs (CO2e) thaemitting 1,00
ndfills accep
food waste, aer anaerobic mounts of r a four phas After oxyge
ns. Then CO2 and nitroge
wo years afteR, 2001a).
)
ed States; e global warmCO2. Typicaat weigh 00 metric ton
ted
and
se en
O2 en er
ming ally,
ns of
8
CH4 and 1,000 metric tons of CO2 would have CO2e emissions of 22,000 metric tons [= (1,000 x 21) + 1,000].
Landfills primarily use the “area fill” method which consists of waste placement on a liner, spreading the waste mass in layers, and compaction with heavy equipment. Daily cover is then applied to the waste mass to prevent odors, blowing litter, scavenging, and vectors (carriers capable of transmitting pathogens from one organism to another). Landfill liners may be comprised of compacted clay or synthetic materials to prevent off-site gas migration and to create an impermeable barrier for leachate. A final cover or cap is placed on top of the landfill, after an area or cell is completed, to prevent erosion, infiltration of precipitation, and for odor and gas control.
Methane generation in landfills is a function of several factors, including: (1) the total amount of waste; (2) the age of the waste, which is related to the amount of waste landfilled annually; (3) the characteristics of the MSW, including the biodegradability of the waste; and (4) the climate where the landfill is located, especially the amount of rainfall. Methane emissions from landfills are a function of methane generation, as discussed above, and (1) the amount of CH4 that is recovered and either flared or used for energy purposes, and (2) the amount of CH4 that leaks out of the landfill cover, some of which is oxidized.
IV. Summary of Control Measures
Table 1 summarizes the GHG control measures presented in this document. Where available, the table includes emission reduction potential, capital costs, operating and maintenance costs, and any important details on the applicability of the control.

9
Table 1. Summary of GHG Control Measures for MSW Landfills
Measure Applicability CH4 Reductiona
Typical Capital Costsb
Typical Annual O&M Costsb
Cost Effectiveness
($/metric ton of CO2e reduced)e
Notes/Issues
LFG Collection Efficiency Improvement
All landfills with gas collection systems
Varies $24,000/acre $4,100/acre NA Cost and performance varies depending on the type of cover material.
Flare All landfills with gas collection systems
99% $6 - $25 Emits secondary criteria pollutant emissions (e.g. NOx and CO. No revenue.
Turbine For larger landfills with gas collection systems
99% $1,400/kW (≥3 MW)
$130/kW $12 - $18 Emits secondary criteria pollutant emissions (e.g. NOx and CO). Generates revenue for landfills.
Engine 96-98% $1,700/kW (≥800 kW)
$180/kW $12 - $16
Microturbine 99% $5,500/kW (≤1 MW)
$380/kW $2 - $13
Small Engine 96-98% $2,300/kW (≤1 MW)
$210/kW $11
CHP Engine 96-98% $2,300/kW (≥800 kW)
$180/kW $7 - $57
CHP Turbine 99% NA NA $4 - $51 CHP Microturbine
99% NA NA $9 - $64
Direct Use (boilers, heaters, etc.)
Varies by technology
$960/scfmc + $330,000/miled
$90/scfmc,d NA
Biocover All landfills Up to 32% $48,000/acre NA $745 No extensive retrofit. Biofiltration Bed
Landfills with passive or no gas collection systems
Up to 19% NA NA NA Low cost.
a References provided in section V of this document for the different control measures. b Costs for collection system & flare, turbines, engines, microturbines, small engines, and direct use obtained from Chapter 4 (Project Economics and Financing) of LMOP’s Landfill Gas Energy Project Development Handbook (EPA, 2010c), Costs for CHP engines determined by evaluating the engine case study in the handbook as a CHP engine using LMOP’s LFGcost model (EPA, 2010d). c Costs for gas compression and treatment. d Costs for pipeline and condensate management system (if applicable). e Cost effectiveness obtained from analysis done by BAAQMD for conventional landfills with a medium compacted waste density (BAAQMD, 2008), with adjustments made to determine the costs per metric ton of CO2e reduced from the combustion of CH4, instead of the costs per metric ton of CO2e avoided from displacement of power generation. See section V.D and Appendix A for additional information. NA = not available

10
V. Available Control Technologies for GHG Emissions from MSW Landfills
This section describes the available technologies for controlling GHG emissions from MSW landfills. The available control technologies are divided into three categories: LFG collection efficiency improvement, LFG control devices, and increase of CH4 oxidization. An economic analysis of the control technologies discussed is also included. It should also be noted that large landfills with emissions exceeding 50 megagrams (Mg) NMOC or more are required by New Source Performance Standards (NSPS) to control and/or treat LFG to significantly reduce the amount of toxic air pollutants released. In essentially all cases, controls required by the NSPS will co-control the GHG emissions.
A. LFG Collection Efficiency Improvement
Collection efficiency is contingent upon landfill design and the manner in which landfills are operated and maintained. Gas collection efficiency can be improved by implementing rigorous gas well and surface monitoring and leak identification and repair. Factors contributing to variability in collection efficiency are discussed below.
There are two types of LFG collection systems, active and passive. Passive systems rely
on the natural pressure gradient between the waste mass and the atmosphere to move gas to collection systems. Most passive systems intercept LFG migration and the collected gas is vented to the atmosphere. Active systems use mechanical blowers or compressors to create a vacuum that optimizes LFG collection (ATSDR, 2001a).
For active gas collection systems, the collection efficiency depends primarily upon the design and maintenance of the collection system and the type of materials used to cover the landfill (BAAQMD, 2008). In the background information document for the draft updated landfill AP-42 chapter, a typical collection efficiency range of 50% to 95% is given with a suggested average of 75% (EPA, 2008a).
EPA's Office of Research and Development has completed a field test program using optical remote sensing technology (EPA's OTM-10) to quantify LFG collection efficiency. Sampling was conducted at three MSW landfills to evaluate CH4 emissions across the landfill footprint to compare to the quantity of extracted gas (i.e., rate of fugitive CH4 vs. rate of collected CH4). The preliminary results suggest gas collection efficiencies from 36% to 85% reflecting a range based on landfill design and operational differences. The report is under review and is expected to be released in 2011.
Higher collection efficiencies may be achieved at landfills with well maintained and
operated collection systems, a liner under the waste, and a cover consisting of a geomembrane and a thick layer of clay. Studies conducted by the Solid Waste Industry for Climate Solutions (SWICS) indicate collection systems meeting the requirements of NSPS, Subpart WWW are often more capable of achieving higher collection efficiencies than collection systems used solely for energy recovery because it is difficult to optimize gas quality while trying to attain a high level of gas collection (SWICS, 2009).

11
Results of gas collection efficiency studies for various cover materials using flux box
measurements are documented in Spokas et al. (2005). The data were used to develop default values of percent recovery for the French environment agency (ADEME). These default collection efficiencies for active gas collection systems are listed in Table 2.
Table 2. LFG Collection Efficiencies for Various Cover Materials
Type of Landfill Cover Material Gas Collection Efficiency
Operating cell (no final cover) 35%
Temporary cover 65%
Clay final cover 85%
Geomembrane final cover 90%
Gas collection research studies done by SWICS used flux box data, which may potentially under estimate gas collection efficiency. The resulting collection efficiencies for landfills with active gas collection systems are summarized below (SWICS, 2009):
• 50-70% (mid-range default = 60%) for a landfill or portions of a landfill that are under daily soil cover;
• 54-95% (mid-range default = 75%) for a landfill or portions of a landfill that contain
an intermediate soil cover; and
• 90-99% (mid-range default = 95%) for landfills that contain a final soil and/or geomembrane cover systems.
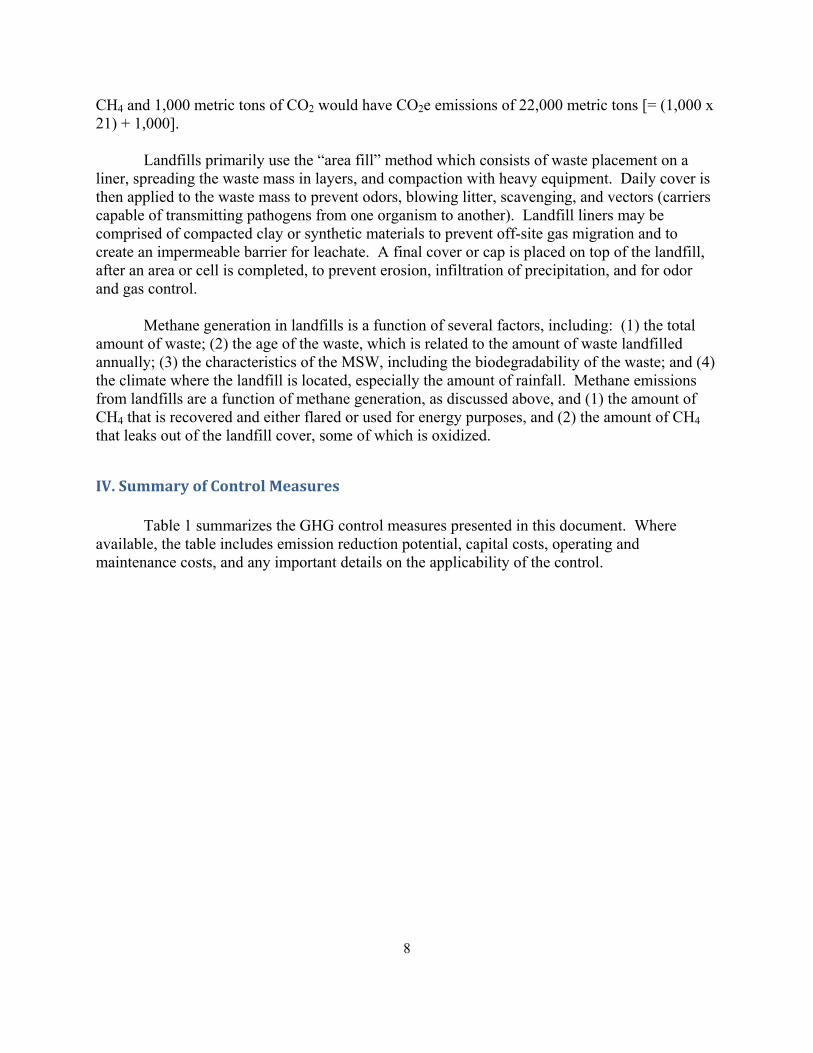
As shown in Table 3, the mid-range default values for the three cover types identified
above were adopted as the collection efficiencies listed in the GHG reporting rule for MSW landfills (40 CFR 98, Subpart HH, Table HH-3). The collection efficiency of a passive gas collection system is assumed to be zero because the pressure gradient is unknown and would likely vary in time and space.
12
Table 3. LFG Collection Efficiencies in the GHG Reporting Rule
Description Gas Collection Efficiency
Area without active gas collection, regardless of cover type 0%
Area with daily soil cover and active gas collection 60%
Area with an intermediate soil cover, or a final soil cover not meeting the criteria below
to achieve 95% efficiency, and active gas collection
75%
Area with a final soil cover of 3 feet or thicker of clay and/or geomembrane cover
system and active gas collection 95%
As shown is Table 3, landfills with final geomembrane covers have higher collection
efficiencies. Changing the final cover material can improve gas collection efficiency. This technology is applicable for all landfills. Typically, modern landfills with active gas collection systems have clay or geomembrane covers in place. An additional geomembrane or clay cover can be added to older landfills with gas collection systems to reduce LFG emissions (BAAQMD, 2008).
B. LFG Control Devices
After collection, LFG may be controlled and/or treated for subsequent sale or use as an energy source to create electricity, steam, heat, or alternate fuels such as pipeline quality gas or vehicle fuel. With approximately half the heating value of natural gas (350 to 600 British thermal units (Btu) per cubic foot), LFG is considered a medium Btu gas. Combustion of LFG is the most common method used to reduce the volatility, global warming potential, and hazards associated with LFG. Combustion methods include destruction devices (e.g., flares), electricity generation units (e.g., reciprocating engines, gas turbines), and energy recovery technologies (e.g., boilers). During the combustion process, CH4 in LFG is converted to CO2. Since CH4 has 21 times the global warming potential of CO2, combustion reduces the global warming effect of LFG significantly. Although CH4 has 21 times the global warming potential of CO2, combusting CH4 reduces the global warming potential only by a factor of 7.6 because the resulting CO2 weighs more than the CH4 by a factor of 2.75. Combustion of LFG also reduces odors and other hazards associated with LFG emissions. However, combustion units emit secondary criteria pollutants, such as carbon monoxide (CO) and nitrogen oxides (NOX), as well as hazardous air pollutants (HAP). Fuel cells are considered a non-combustion treatment option for LFG that converts the gas to energy.
The control devices frequently used for LFG and the associated control efficiencies are
described in the following sections. It is important to note that all of the technologies discussed

13
below typically require treatment of the LFG prior to entering the control device to remove moisture, particulates, and other impurities. The level of treatment depends primarily on the type of control and the types and amounts of contaminants in the LFG. A list of common LFG constituents is found in Tables 2.4-1 and 2.4-2 of the landfill AP-42 chapter (EPA, 1998a). Some of the major trace contaminants in LFG that may need to be treated prior to control include sulfur compounds, such as hydrogen sulfide (H2S), and siloxanes. Flares
Of the combustion methods, flaring is the most commonly used. However, unlike other combustion options, flaring does not recover energy. Controlling LFG emissions by flares is technically feasible for most landfills and many landfills have flares in place. The capital and maintenance costs associated with flares are relatively low compared to other combustion technologies. Flares are often used as backup control devices for landfills that have engines or turbines to generate electricity to limit emissions while these devices are off-line or to respond to variations in LFG generation.
Two different types of flares are available, open flares and enclosed flares. Open flares
employ simple technology where the collected gas is combusted in an elevated open burner. A continuous or intermittent pilot light is generally used to maintain the combustion. While open flares are thought to have combustion efficiencies similar to those of enclosed flares, data are not available to confirm this because open-air combustion makes them difficult to test. Under NSPS, Subpart WWW, open flares must meet a minimum Btu content and have a pilot light. For landfills generating LFG that is unable to meet the Btu content consistently, it may be necessary to supplement the collected gas with natural gas or another fuel source, which may create an additional cost for the landfill.
Enclosed flares typically employ multiple burners within fire-resistant walls, which allow
them to maintain a relatively constant and limited peak temperature by regulating the supply of combustion air (ATSDR, 2001b). Enclosed flares can be tested for destruction efficiency of NMOC and HAP. The background information document for the draft updated landfill AP-42 chapter provides an NMOC control efficiency range of 86% to 100% for flares, with an average of 97.7% (EPA, 2008a). A report published by California’s Bay Area Air Quality Management District (BAAQMD) states that flares typically have CH4 destruction efficiencies of greater than 99.5% (BAAQMD, 2008). Under NSPS, Subpart WWW, enclosed flares are considered to be incinerators and are required to have a minimum NMOC control efficiency of 98% by weight. In California, flares are required to have minimum CH4 destruction efficiencies of 99% (CCR, Article 4, Subarticle 6, Section 95464(b)(2)(A)(1)). Electricity Generation
Internal combustion engines are the most widely used technology for the conversion of LFG to electricity. Advantages of this technology include: low capital cost, high efficiency, and adaptability to variations in the gas output of landfills. The operation of reciprocating engines at low pressure (12-30 pounds per square inch (psi)) also yields less condensate than operation at

14
higher pressure (60-160 psi) (Potas, 1993). Internal combustion engines are primarily used at sites where gas production can generate 100 kilowatts (kW) to 3 megawatts (MW) of electricity, or where sustainable LFG flow rates to the engines are approximately 50 to 960 cubic feet per minute (cfm) at 50% CH4 (EPA, 2010d). For sites able to produce more than 3 MW of electricity, additional engines may be added.
Turbines are an alternative to internal combustion engines. Turbines using LFG require a dependable gas supply for effective operation, and are generally suitable for landfills when gas production can generate at least 3 MW, or where sustainable LFG flow rates to the turbines are over approximately 1,050 cfm at 50% CH4 (EPA, 2010d). Typically, LFG-fired turbines have capacities greater than 5 MW. Advantages of this technology when compared to internal combustion engines include: a greater resistance to corrosion damage, relatively compact size, and lower operation and maintenance costs. When compared with other generator options, turbines require additional power to run the plant’s compression system.
Microturbines can be used instead of internal combustion engines for LFG energy conversion. This technology generally works best for small scale recovery projects that supply electricity to the landfill or to a site that is in close proximity to the landfill. Single microturbine units have capacities ranging between 30 and 250 kW, and are most suitable for applications below 1 MW, or where sustainable LFG flow rates to the microturbines are below approximately 350 cfm at 50% CH4 (EPA, 2010d). Sufficient LFG treatment is generally required for microturbines and involves the removal of moisture and other contaminants (EPA, 2010c).
In general, turbines have a higher CH4 destruction efficiency (greater than 99.5%) than internal combustion engines (roughly 96%) (BAAQMD, 2008). For landfills subject to NSPS, Subpart WWW, control technologies are required to have a minimum control efficiency of 98% by weight NMOC reduction or an outlet concentration of 20 parts per million by volume (ppmv), dry basis as hexane at 3% O2, of NMOC. In California, LFG control devices other than flares must achieve a CH4 destruction efficiency of at least 99% by weight; and lean burn internal combustion engines must reduce the outlet CH4 concentration to less than 3,000 ppmv, dry basis, corrected to 15% O2 (CCR, Article 4, Subarticle 6, Section 95464(b)(3)(A)). Lean burn internal combustion engines are not defined within this California regulation; however, the NSPS for stationary spark ignition internal combustion engines (40 CFR 60, Subpart JJJJ) defines lean burn engines as any two-stroke or four-stroke spark ignited engine that does not meet the definition of a rich burn engine. Rich burn engines are defined as any four-stroke spark ignited engine where the manufacturer's recommended operating air/fuel ratio divided by the stoichiometric air/fuel ratio at full load conditions is less than or equal to 1.1. Cogeneration
Cogeneration, also known as combined heat and power (CHP), is the use of LFG to generate electricity while recovering waste heat from the LFG combustion device. The thermal energy recovered is usually in the form of steam or hot water that can be used for on-site heating, cooling, or process needs. Cogeneration systems are typically more efficient and often more cost effective than separate systems for heat and power (EPA, 2008b). Combustion technologies
15
generally suitable for CHP include internal combustion engines, gas turbines, and microturbines. There are also boiler/steam turbine applications where LFG is combusted in large boilers for steam generation that is then used by turbines to create electricity (EPA, 2010c).
The CH4 control efficiency for cogeneration is directly linked to the electricity generation unit combusting LFG. Landfills subject to NSPS, Subpart WWW, must meet the same requirements for cogeneration as those listed above for electricity generation. Direct Use
Landfill gas may be used to offset traditional fuel sources such as natural gas, coal, and fuel oil used in industrial, commercial, and institutional applications. Direct use of LFG is primarily limited to facilities within 5 miles of a landfill. There are, however, facilities that have used LFG as a fuel at distances greater than 10 miles. Direct use applications for landfills include: boilers (LFG used solely or co-fired with other fuels), direct thermal technologies (e.g. dryers, heaters, kilns), and leachate evaporation. Innovative uses of LFG include heating greenhouses, firing pottery, glassblowing, metalworking, and heating water for an aquaculture (fish farming) operation (EPA, 2010c).
Control efficiencies of CH4 for LFG direct use applications vary depending on the type of technology employed. For landfills subject to NSPS, Subpart WWW, control technologies are required to have a minimum control efficiency of 98% by weight NMOC reduction or an outlet concentration of 20 parts per million by volume (ppmv), dry basis as hexane at 3% O2, of NMOC. In addition, if a boiler or process heater is used as the control device, the collected LFG must be routed into the flame zone. Alternate Fuels
Purification techniques can be used to convert LFG to pipeline-quality natural gas, compressed natural gas (CNG), or liquefied natural gas (LNG). Purification of LFG for the production of natural gas typically involves the removal of inert constituents by adsorption (molecular sieve), absorption with a liquid solvent, and membrane separation. The production of pipeline-quality gas includes processing LFG to increase its energy content and pressurizing the pipeline that is connected to the gas production facility (CCTP, 2005).
The conversion of LFG to CNG and LNG require similar processes, and the resulting products can be used as vehicle fuel. First, the corrosive materials are removed through the use of phase separators, coalescing filters, and activated carbon adsorbents. Next, water and O2 are removed. A cryogenic purifier is then used to remove CO2, which yields high quality gas that is over 90% CH4 (CCTP, 2005).
The type of LFG alternative fuel production and end use will affect the CH4 control efficiency. For landfills subject to NSPS, Subpart WWW, control technologies are required to have a minimum control efficiency of 98% by weight NMOC reduction or an outlet concentration of 20 parts per million by volume (ppmv), dry basis as hexane at 3% O2, of

16
NMOC. If the collected gas is routed to a treatment system, including purification and conversion devices, then vented gases from the treatment system must meet these requirements. Fuel Cells
A fuel cell is an electrochemical cell that converts energy from a fuel into electrical energy. Electricity is generated from the reaction between a fuel supply and an oxidizing agent. The products of basic fuel cell reactions are CO2, water vapor, heat, and electricity (Vargas, 2008). The difference between a battery and a fuel cell is that in a battery, all reactants are present within the battery and are slowly being depleted during the use of the battery. In a fuel cell, reactants (fuel) are continuously supplied to the cell (CEC, 2003). Fuel cells are used in a variety of applications to generate clean electricity without the use of combustion such as in generating transportation fuels for car, boats, and buses. Also fuel cells can serve as a power source in remote locations such as spacecraft, remote weather stations, parks, and in military applications. Fuel cells running on hydrogen are compact and lightweight and have no major moving parts.
For LFG applications, fuel cells use hydrogen from CH4 to generate electricity (EPA, 1998b). Fuel cells have an advantage over combustion technologies in that the energy efficiency is typically higher without generating combustion by-products such as NOX, CO, and sulfur oxides (SOX) (EPA, 1998c). If fuel cells are used to generate electricity from landfill CH4, then a gas cleanup system is required to ensure that the catalyst within the fuel cell is not contaminated by trace constituents that are present in LFG. Trace constituents include sulfur and chlorine compounds which can inhibit performance and poison the catalyst (NREL, 1998).
EPA’s Office of Research and Development conducted a review of fuel cells for LFG applications. The phosphoric acid fuel cell was identified as most appropriate because it is commercially available and has been successfully demonstrated at two landfills. Other types of fuel cells (molten carbonate, solid oxide, polymer electrolyte membrane) may also be applicable for LFG applications as further fuel cell development is conducted. The first demonstration of a fuel cell was at the Penrose Landfill in California. The second was at a Connecticut landfill. Both demonstrations used a 200 kW phosphoric acid fuel cell manufactured by ONSI Corporation (EPA, 1998b). The energy efficiency for the demonstration at the Connecticut landfill was 37% at 120 kW and could have been higher if the waste heat had been utilized. The trace constituents removed in the gas clean up system were flared. An environmental and economic evaluation of a commercial fuel cell energy system concluded that there is a large potential market for fuel cells in this application. The major disadvantage is that the cost is higher compared to combustion technologies such as internal combustion engines and turbines.
For landfills subject to NSPS, Subpart WWW, control technologies are required to have a minimum control efficiency of 98% by weight NMOC reduction or an outlet concentration of 20 parts per million by volume (ppmv), dry basis as hexane at 3% O2, of NMOC. If the collected gas is routed to a treatment system, including conversion devices, then vented gases from the treatment system must meet these requirements.

17
C. Increase of CH4 Oxidation
The technologies to increase the CH4 oxidation rate include biocovers and biofiltration beds. The principle of these technologies is the use of methanotrophic bacteria, which oxidize LFG, specifically CH4, to water, CO2, and biomass. Methanotrophic bacteria possess the CH4 mono-oxygenase enzyme that enables them to use CH4 as a source of energy and as a carbon source. These bacteria are usually found in agricultural soils, forest soils, and compost. These technologies are primarily in the research and development phase, rather than widespread application. The details of these two technologies are discussed below. Biocovers
A biocover is an additional final cover that functions as a CH4 oxidation enhancer to convert CH4 into CO2 prior to venting to the atmosphere. A biocover is composed of two substrate layers: a gas dispersion layer and a CH4 oxidation layer. The gas dispersion layer is an additional permeable layer of gravel, broken glass, or sand beneath the porous media of the CH4 metabolizing layer. This layer is added to evenly distribute the uncaptured LFG to the CH4 oxidation media and to remove excess moisture from the gas. The CH4 oxidation media can be made of soil, compost, or other porous media. This media is usually seeded with methanotrophic bacteria from the waste decomposition.
This control technology does not require extensive retrofit and is applicable to all landfills, including uncontrolled and older landfills with passive or active collection systems. The biocover itself is not known to affect the functionality of an existing or new gas collection and control system. In addition, it has low secondary criteria pollutant emissions. Biocovers can be used as additional final cover to improve the CH4 oxidation rate. According to Abichou et al. (2006), biocover applications increased the average CH4 oxidation rate up to 32%. Biofiltration Beds
Similar to biocovers, biofiltration beds aim to further oxidize CH4 from passively collected LFG. The collected LFG is passed through a vessel containing CH4-oxidizing media prior to venting to the atmosphere or to a control system. This control technology is only feasible for small landfills or landfills with passive gas collection systems due to the size of the biofiltration bed required to treat an air/LFG mixture. In addition, due to the nature of passive gas collection systems, this technology lacks the ability to control and monitor the LFG collection. According to Morales (2006), a pilot project shows that the radial biofiltration bed design has a CH4 oxidation rate of 19%.
A benefit of using a biofiltration bed compared to LFG combustion is that biofiltration beds produce only CO2 and water vapor. Unlike other combustion-based mitigation measures, a biofiltration bed does not emit secondary pollutants such as NOX, SOX, and particulate matter. This technology requires few safety controls for operation, and no start up or shut down procedures.

18
D. Economic Analysis
The economic analysis for GHG control technologies is based on a cost effectiveness value, which is defined in this paper as the cost to remove one metric ton of CO2e. The cost of LFG control technologies can be estimated using the Landfill Gas Energy Cost Model (LFGcost), which was developed by EPA’s Landfill Methane Outreach Program (LMOP) (EPA, 2010d). This model includes direct and indirect costs associated with LFG energy (LFGE) projects. The direct costs are the costs for equipment, including basic treatment of LFG, and installation. The indirect costs include costs for engineering, design, and administration; site surveys and preparation; permits, right-of-ways, and fees; and mobilization/demobilization of construction equipment. Costs estimated by LFGcost are based on costs for average project sites. Individual landfills should adjust costs based on site-specific parameters and conditions. The types of LFG control projects included in LFGcost, Version 2.2 (EPA, 2010d) are as follows:
LFG collection and flaring systems; Direct LFG utilization projects; Electricity generation with standard turbines (greater than 3 MW); Electricity generation with standard reciprocating engines (800 kW and greater); Processing LFG into a high Btu gas (1,000 standard cubic feet per minute (scfm) to
10,000 scfm); Electricity generation with microturbines (30 kW to 750 kW); Electricity generation with small reciprocating engines (100 kW to 1 MW); Leachate evaporators (500 gallons/day and greater); Electricity generation and hot water production with CHP reciprocating engines (800
kW and greater); Electricity generation and steam production with CHP turbines (greater than 3 MW);
and Electricity generation and steam production with CHP microturbines (30 kW to 300
kW).
In 2008, California’s BAAQMD published an economic analysis study on LFG control options using EPA’s LFGcost software. This study was performed for MSW landfills of varying sizes (1.5, 3.0, and 5.9 million Mgs), types (conventional and bioreactor), and waste densities (low, medium, and high). The cost effectiveness values contained in the BAAQMD study for electricity generation technologies are based on CO2e reduced due to avoided electricity production at the power plant. These values were adjusted to determine cost effectiveness values in terms of CO2e reduced from the combustion of CH4 and CO2e reduced from both the combustion of CH4 and avoided electricity generation. Appendix A contains the calculation procedures used to adjust the original cost effectiveness values in the BAAQMD report. The cost effectiveness for adding LFG combustion options to conventional landfills with a medium compacted waste density (100,000 tons of waste in place per acre) are provided in Table 4.

19
Table 4. Cost Effectiveness for Various LFG Combustion Technologiesa, b
LFG Combustion Technology Cost Effectiveness
($/metric ton of CO2e reduced)
Cost Effectiveness ($/metric ton of CO2e reduced and through avoided electricity )
Flare $6 - $25 NA
Engine $12 - $16 $11 - $14
Turbine $12 - $18 $12 - $16
Microturbine $2 - $13 $1 - $12
Small Engine $11 $11
CHP Enginec $7 - $57 $6 - $52
CHP Turbinec $4 - $51 $4 - $47
CHP Microturbinec $9 - $64 $8 - $59 a Source: BAAQMD, 2008. Except for flares, values presented in BAAQMD, 2008 were based on CO2e avoided through reduction in electricity generated. These values were adjusted to take into account the CO2e reduced through combustion of CH4. See Appendix A for detailed calculations. b Except for flares, all cost effectiveness values shown do not include costs for the gas collection system. A gas collection system would increase the cost effectiveness by between $5 and $10 per metric ton of CO2e reduced. c CHP values do not include CO2e reductions due to reduction of fuel use where the heat or steam is being used.
In general, it is more economical for larger landfills with high waste densities to install LFG control technologies since their LFG generation rates are higher. The cost of installing combustion technologies is lower for landfills with pre-existing gas collection systems. Flaring is the cheapest combustion technology for most landfills, but flares do not have the potential to generate revenue from LFGE projects.
The cost effectiveness for biocovers was estimated to be $745 per metric ton of CO2e reduced, according to the report prepared by BAAQMD (2008). Since the cost estimates for biocovers were based on a few test sites, the actual cost effectiveness may vary widely.

20
VI. Bioreactor Landfill Systems
A bioreactor is typically defined as an MSW landfill where enhanced microbial processes are used to expedite waste decomposition and biological stabilization. To properly manage the stabilization process, certain system design and operational modifications are required (Townsend, 2008). A bioreactor landfill employs the addition of liquid and air into the landfill cell to enhance microbial processes. The most common liquid recirculated in bioreactor landfills is leachate (waste liquid that drains from the landfill), but other liquids may be added to account for lack of moisture in the waste mass (BAAQMD, 2008).
A hybrid (both aerobic and anaerobic enhancements) bioreactor landfill uses two primary processes:
• Air is injected in the top portion of the cell to increase aerobic activity; and
• Liquid is injected into the lower (older) portions of the cell to regulate moisture and promote anaerobic activity (BAAQMD, 2008).
While the term bioreactor is not specifically defined under Subtitle D of the Resource
Conservation and Recovery Act (RCRA), there are provisions that allow for short term research, development, and demonstration (RDD) permits specific to bioreactor operations (Townsend, 2008). RCRA Subtitle D prohibits the disposal of bulk liquids unless an RDD permit is granted and allows leachate and LFG condensate recirculation for landfills meeting composite liner requirements. There are also provisions for the prevention of gas migration.
Enhanced degradation in bioreactor landfills also accelerates LFG generation. Compared to conventional landfills, decomposition reaches a higher peak at the year of closure and then declines more rapidly. For anaerobic bioreactors, CH4 generation rates typically increase 200-250% (Pichtel, 2005). Since LFG is generated more rapidly and the CH4 concentration in LFG is greater for bioreactor landfills, the gas can be collected and sold for energy recovery earlier than non-bioreactor landfills. To account for accelerated LFG generation and ultimately mitigate GHG emissions from bioreactors, the National Emission Standards for Hazardous Air Pollutants (NESHAP) for landfills requires installation of the collection system and controls prior to liquids addition (40 CFR 63, Subpart AAAA). It should also be noted that under the NESHAP bioreactors are defined as having a minimum average moisture content of 40% by weight. The NESHAP definition of bioreactors also excludes leachate and LFG condensate.
The feasibility of a bioreactor landfill depends on the landfill characteristics and climate. The potential disadvantages of bioreactor landfills include increased odors, physical instability of the waste mass, liner instability, surface seeps, and landfill fires from air addition. Benefits include increased disposal capacity (i.e., more waste can be placed within a fixed volume of landfill air space), shorter post-closure maintenance periods for LFG and leachate management, and better profiles for energy recovery from LFG.

21
Due to its high capital cost, the implementation of a bioreactor landfill design is suitable primarily for newer active landfill cells that are equipped with the appropriate lining. For existing landfills, converting conventional landfills to bioreactor landfills would require significant changes in landfill design.
VII. Management Practices
Organic materials account for about 55% of waste currently reaching landfills, primarily consisting of food scraps, yard trimmings, wood, and paper/paperboard (EPA, 2010e). Due to their role as the source of CH4 in landfills, the diversion of these materials prior to landfilling may be used as a GHG reduction strategy. Diversion methods include composting, recycling, and anaerobic digestion.
Organic waste diversion from landfills prevents CH4 generation. Methane generation at landfills is reduced proportionally to the amount of organic waste diverted. For example, CH4 generation at landfills is halved with a 50% organic waste diversion rate. Combining organic waste diversion with a gas collection and control system can further reduce GHG emissions.
Recycling reduces the use of and emissions associated with virgin materials, thus reducing GHG emissions associated with producing the material. Additionally, paper recycling reduces harvesting of trees, thus stabilizing carbon sequestration from forests. According to EPA’s Waste Reduction Model (WARM), paper recycling reduces GHG emissions using a lifecycle perspective (EPA, 2010f). There are, however, processing and manufacturing emissions associated with recycling (EPA, 2010e).
Well-managed composting operations facilitate aerobic decomposition. While CH4 and nitrous oxide (N2O) emissions result from anaerobic conditions in the compost pile, a large degree of uncertainty exists in quantifying these emissions. Production of CH4 and N2O from composting varies greatly and results from several factors including: moisture content, carbon-to-nitrogen ratio, stage of the composting process, and the technology used (e.g. windrows, aerated static piles, and in-vessel). While composting operations may reduce GHG emissions, there are emissions associated with pre-processing and on-site equipment (e.g. windrow turners, screens, and blowers); these emissions vary greatly based on the technology used (EPA, 2010e).
Anaerobic digestion is a process where microorganisms break down organic materials in the absence of oxygen. Organic materials are digested in closed containers, minimizing fugitive GHG emissions. Anaerobic digestion yields two products: biogas and a solid residue that can be used as a soil amendment, which can offset conventional fertilizer production and use. Biogas can be used for electricity generation, fuel, or cogeneration.
22
EPA Contact Hillary Ward U.S. EPA OAQPS/SPPD/CCG Mail Code E143-01 Research Triangle Park, NC 27711 Phone: 919-541-3154 [email protected]

23
References Abichou, 2006. Field Performance of Biocells, Biocovers, and Biofilters to Mitigate Greenhouse Gas Emissions from Landfills. Abichou, T., et al. Florida Center for Solid and Hazardous Waste Management. March 2006. http://www.floridacenter.org/publications/Abichou%200432028-06.pdf ATSDR, 2001a. Landfill Gas Primer – An Overview for Environmental Health Professionals, Chapter 2: Landfill Gas Basics. Agency for Toxic Substances and Disease Registry (ATSDR). November 2001. http://www.atsdr.cdc.gov/hac/landfill/html/ch2.html ATSDR, 2001b. Landfill Gas Primer – An Overview for Environmental Health Professionals, Chapter 5: Landfill Gas Control Measures. Agency for Toxic Substances and Disease Registry (ATSDR). November 2001. http://www.atsdr.cdc.gov/hac/landfill/html/ch5.html BAAQMD, 2008. Greenhouse Gas Mitigation: Landfill Gas and Industrial, Institutional and Commercial Boilers, Steam Generators and Process Heaters. Bay Area Air Quality Management District (BAAQMD), prepared by URS Corporation. April 2008. http://www.baaqmd.gov/~/media/Files/Planning%20and%20Research/Climate%20Protection%20Program/GHG_Mitigation_Phase2_001.ashx CCAR, 2009. General Reporting Protocol. Version 3.1. California Climate Action Registry (CCAR). January 2009. http://www.climateregistry.org/resources/docs/protocols/grp/GRP_3.1_January2009.pdf CCTP, 2005. Technology Options for the Near and Long Term, Section 4.1.2: Conversion of Landfill Gas to Alternative Uses. U.S. Climate Change Technology Program (CCTP). August 2005. http://www.climatetechnology.gov/library/2005/tech-options/tor2005-412.pdf CEC, 2003. California Distributed Energy Resource (DER) Guide, DER Equipment: Fuel Cells. California Energy Commission (CEC). August 19, 2003. http://www.energy.ca.gov/distgen/equipment/fuel_cells/fuel_cells.html EPA, 1998a. Compilation of Air Pollutant Emission Factors (AP-42), 5th Ed., Volume I, Chapter 2.4: Municipal Solid Waste Landfills. Office of Air Quality Planning and Standards, U.S. EPA. November 1998. http://www.epa.gov/ttn/chief/ap42/ch02/final/c02s04.pdf EPA, 1998b. Emerging Technologies for the Management and Utilization of Landfill Gas. Office of Research and Development, U.S. EPA. January 1998. http://www.epa.gov/ttn/catc/dir1/etech_pd.pdf

24
EPA, 1998c. Demonstration of Fuel Cells to Recover Energy from Landfill Gas: Phase III. Demonstration Tests, and Phase IV. Guidelines and Recommendations. National Risk Management Research Laboratory, U.S. EPA. March 1998. http://www.epa.gov/nrmrl/pubs/600sr98002/600sr98002.pdf EPA, 2008a. Background Information Document for Updating AP42 Section 2.4 for Estimating Emissions from Municipal Solid Waste Landfills. National Risk Management Research Laboratory, Air Pollution Prevention and Control Division, U.S. EPA. September 2008. http://www.epa.gov/ttn/chief/ap42/ch02/draft/db02s04.pdf EPA, 2008b. Clean Energy Strategies for Local Governments, Section 7.4: Landfill Methane Utilization, Draft. Landfill Methane Outreach Program (LMOP), Climate Change Division, U.S. EPA. December 10, 2008. http://www.epa.gov/statelocalclimate/documents/pdf/7.4_landfill_methane_utilization.pdf EPA, 2010a. Municipal Solid Waste Generation, Recycling, and Disposal in the United States: Facts and Figures for 2009. Solid Waste and Emergency Response, U.S. EPA. December 2010. http://www.epa.gov/epawaste/nonhaz/municipal/pubs/msw2009-fs.pdf EPA, 2010b. Inventory of U.S. Greenhouse Gas Emissions and Sinks: 1990-2008. U.S. EPA. April 2010. http://epa.gov/climatechange/emissions/usinventoryreport.html EPA, 2010c. Landfill Gas Energy Project Development Handbook. Landfill Methane Outreach Program (LMOP), Climate Change Division, U.S. EPA. January 2010. http://epa.gov/lmop/publications-tools/handbook.html EPA, 2010d. Landfill Gas Energy Cost Model (LFGcost), Version 2.2. Landfill Methane Outreach Program (LMOP), Climate Change Division, U.S. EPA. July 2010. EPA, 2010e. Waste Diversion as a Greenhouse Gas Control Strategy for Landfills. EPA Region 9 Air and Waste Divisions, U.S. EPA. September 2010. EPA, 2010f. Waste Reduction Model (WARM). U.S. EPA. August 2010. http://www.epa.gov/climatechange/wycd/waste/calculators/Warm_home.html Morales, 2006. Mitigation of Landfill Methane Emissions from Passive Vents by Use of Oxidizing Biofilters. Morales, J.J., Florida State University, FAMU/FSU College of Engineering. Fall 2006. http://etd.lib.fsu.edu/theses/available/etd-11102006-114600/unrestricted/JoseMoralesThesis.pdf NREL, 1998. Landfill Gas Cleanup for Carbonate Fuel Cell Power Generation. Steinfeld, G. and R. Sanderson, Energy Research Corporation. National Renewable Energy Laboratory (NREL), U.S. DOE. February 1998. http://www.nrel.gov/docs/legosti/fy98/26037.pdf Pichtel, 2005. Waste Management Practices: Municipal, Hazardous, and Industrial. Pichtel, John. CRC Press. 2005.

25
Potas, 1993. Gas Recovery and Utilization from Municipal Solid Waste Landfills. Potas, T.A., RUST Environment & Infrastructure. American Chemical Society, Division of Fuel Chemistry, National Meeting & Exposition, Chicago. Fall 1993. http://www.anl.gov/PCS/acsfuel/preprint%20archive/Files/38_3_CHICAGO_08-93_0895.pdf Spokas et al., 2005. Methane Mass Balance at Three Landfill Sites: What is the Efficiency of Capture by Gas Collection Systems? Spokas, K., et al. Waste Management. July 29, 2005. http://www.landfillsplus.com/pdf/article.pdf SWICS, 2009. Current MSW Industry Position and State-of-the-Practice on LFG Collection Efficiency, Methane Oxidation, and Carbon Sequestration in Landfills. Solid Waste Industry for Climate Solutions (SWICS), prepared by SCS Engineers. Version 2.2, January 2009. http://www.scsengineers.com/Papers/Sullivan_SWICS_White_Paper_Version_2.2_Final.pdf Townsend, 2008. Bioreactor Landfill Operation: A Guide for Development, Implementation, and Monitoring: Version1.0. Townsend, T., et al. Department of Environmental Engineering Sciences, University of Florida. July 1, 2008. http://www.bioreactor.org/BioreactorFinalReport/FinalReportVOLUME1_10/AttachmentforVOLUME8/Bioreactor_Landfill_OperationV10.pdf Vargas, 2008. Introduction to the Future's Energy: Fuel Cells. Vargas, E., The Chemical Engineers’ Resource Page. August 2008. http://www.cheresources.com/fuelcell.shtml

26
Appendix A
Calculations to Estimate Cost Effectiveness for CO2e Reduced
Cost effectiveness values in Tables 1 and 4 of this paper were derived from cost effectiveness values in a report published by California’s Bay Area Air Quality Management District (BAAQMD, 2008). However, the values contained in the BAAQMD report for energy recovery technologies are in units of dollars per metric ton of CO2e emissions reduced due to avoided electricity generation at the power plant. The cost effectiveness values from the 2008 BAAQMD report were adjusted to produce cost effectiveness values in units of dollars per metric ton of CO2e emissions reduced based on the conversion of CH4 to CO2, a less potent global warming pollutant. Cost effectiveness values were also generated based on the GHG emission reductions from both the conversion of CH4 to CO2 (referred to as direct CO2e reductions) and the CO2 emissions avoided from less electricity generated at the power plant (referred to as avoided CO2e reductions). This appendix details the calculations for both cost effectiveness values. The cost effectiveness values for flares in the BAAQMD report are based on CH4 destruction because no energy is recovered (i.e., no electricity avoided); therefore, flare cost effectiveness values were used directly from the report.
The BAAQMD report presents a range of cost effectiveness values for each technology to account for different sized landfills (10 acres, 20 acres & 40 acres). The BAAQMD cost effectiveness values for electricity generation technologies do not include costs for the gas collection system. A.1 Cost Effectiveness Values Based on Direct CO2e Reductions
The BAAQMD report referenced the California Climate Action Registry’s General Reporting Protocol for estimating emission reductions from avoided electricity generation. Tables E.1 and E.3 of the General Reporting Protocol contain the 2007 California electricity emission factors listed below. It was assumed that these factors, in units of pounds (lb) per megawatt-hour (MWh), were used to estimate avoided emissions from the power plant (CCAR, 2009). CO2 electricity emission rate = 878.71 lb/MWh CH4 electricity emission rate = 0.0067 lb/MWh N2O electricity emission rate = 0.0037 lb/MWh
To determine the total amount of CO2e reduced from avoided electricity generation, global warming potentials were applied to the CH4 and N2O emission rates. The consolidated CO2e emission rate was calculated as follows:

27
Overall CO2e electricity emission rate = (878.71) + (0.0067 x 21) + (0.0037 x 310) = 880 lb CO2e/MWh
The BAAQMD report utilized LMOP’s LFGcost software (EPA, 2010c). To properly adjust the cost effectiveness values, fuel use rates and efficiencies for each electricity generation technology from LFGcost were used. These default values are provided in Table A-2.
Table A-2. LFGcost Fuel Use Rates and Efficiencies for LFG Electricity Generation
Technologies
LFG Technology Fuel Use Rate (Btu/kWh generated)
Efficiency (%)
Engine 11,250 93
Turbine 13,000 88
Microturbine 14,000 83
Small Engine 18,000 92
CHP Engine 11,250 93
CHP Turbine 13,000 88
CHP Microturbine 14,000 83 Source: EPA, 2010c
The example calculation outlined below is for the low value of the cost effectiveness
range for engines ($122 per metric ton (MT) of CO2e avoided). The first step is to use the overall CO2e electricity emission rate to convert the cost effectiveness value from dollars per metric ton of CO2e avoided to dollars per amount of electricity produced (in units of MWh), as follows:
($122/metric ton CO2e) x (metric ton/2205 lb) x (880 lb CO2e/MWh) = $48.7 per MWh
The second step is to use the appropriate fuel use rate and efficiency from Table 2 and the heat content and density of CH4 to calculate the cost in terms of dollars per metric ton of CH4 produced by the landfill, as follows: ($48.7/MWh) x (MWh/1000 kWh) x (kWh/11,250 Btu) x 0.93 x (1012 Btu/ft3 CH4) x (ft3 CH4/0.0423 lb CH4) x (2205 lb/metric ton) = $212 per metric ton CH4
The next step is to calculate the amount of CO2e reduced from the conversion of CH4 to CO2. The global warming potential of CH4 is 21, which is used to express the amount of CH4 destroyed in terms of CO2e. The amount of CO2 generated from the combustion of CH4 must be subtracted from the amount of CH4 destroyed using a mass balance method to result in an accurate measure of CO2e reduced. The overall CO2e reduced is calculated as:

28
CO2e reduced = (CH4 destroyed as CO2e) - (CO2 generated by CH4 combustion) CO2e reduced = (21 metric tons CO2e/metric ton CH4) - (44 metric tons CO2/16 metric tons CH4) CO2e reduced = 18.25 metric tons CO2e per metric ton CH4 Lastly, the dollars per metric ton of CH4 produced by the landfill are divided by the overall CO2e reduced to estimate the cost effectiveness values in terms of dollars per metric ton of direct CO2e reduced, as follows: Adjusted cost effectiveness = ($212/metric ton CH4) x (metric ton CH4/18.25 metric tons CO2e) Adjusted cost effectiveness = $12 per metric ton direct CO2e reduced Tables 1 and 4 in the main section of this paper contain the adjusted cost effectiveness values for direct CO2e reduced for all seven electricity generation technologies. A.2 Cost Effectiveness Values Based on Direct and Avoided CO2e Reductions The original cost effectiveness values in the 2008 BAAQMD report represent avoided CO2e reductions and the adjusted cost effectiveness values, as discussed in section A.1, represent direct CO2e reductions. Therefore, the calculation of cost effectiveness values that represent both direct and avoided CO2e reductions can be accomplished using the original and adjusted cost effectiveness values. The derivation of the equation used to determine cost effectiveness values in units of dollars per metric ton of direct and avoided CO2e reductions is as follows: $/D = $ per metric ton of direct CO2e reduced $/A = $ per metric ton of avoided CO2e reduced $/(D+A) = $ per metric ton of direct and avoided CO2e reduced $/(D+A) = ($/A) / ((D+A)/A) = ($/A) / ((D/A) + (A/A)) = ($/A) / ((D/A) + 1) $/(D+A) = ($/A) / (($/A)/($/D) + 1) Using the example calculation for the low cost effectiveness value for engines from section A.1, the cost effectiveness value for direct and avoided CO2e reduced is calculated as: $/D = $12/metric ton of direct CO2e reduced $/A = $122/metric ton of avoided CO2e reduced $/(D+A) = ($122/metric ton) / (($122/metric ton)/($12/metric ton) + 1) = $11/metric ton Cost effectiveness for direct & avoided CO2e reduced = $11 per metric ton of CO2e reduced Table 4 in the main section of this paper contains the cost effectiveness values for direct and avoided CO2e reduced for all seven electricity generation technologies.