Embed Size (px)
Citation preview
availability of in-situ data for assessing the
geographical distribution and trends of aerosols at the european and global
scalefrank raes
julian wilson
jean-philippe putaud

Number size distributionATMOSPHERIC AEROSOL
Diameter (micrometer)
Condensation Nuclei (CN)
Nucleation Mode
Aitken Mode
Accumulation Mode
Coarse Mode

Mass size distributionATMOSPHERIC AEROSOL
Diameter (micrometer)
PM10
PM2.5

chemical composition
organics
sulfates
mineral dust
nitrates
unknown
ATMOSPHERIC AEROSOL
Diameter (micrometer)

POLDER Aerosol Index May 1997

WMO Global Atmospheric Watch Global Stations
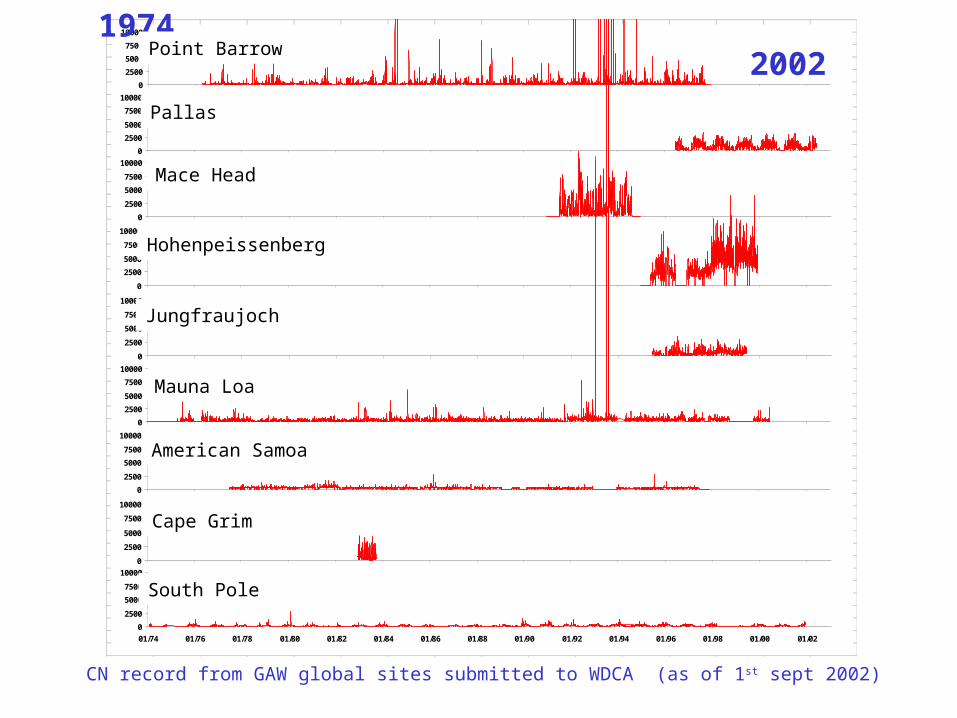
Point Barrow
0
2500
5000
7500
10000
01/74 01/76 01/78 01/80 01/82 01/84 01/86 01/88 01/90 01/92 01/94 01/96 01/98 01/00 01/02Pallas
0
2500
5000
7500
10000
01/74 01/76 01/78 01/80 01/82 01/84 01/86 01/88 01/90 01/92 01/94 01/96 01/98 01/00 01/02Mace Head
0
2500
5000
7500
10000
01/74 01/76 01/78 01/80 01/82 01/84 01/86 01/88 01/90 01/92 01/94 01/96 01/98 01/00 01/02Hohenpeissenberg
0
2500
5000
7500
10000
01/74 01/76 01/78 01/80 01/82 01/84 01/86 01/88 01/90 01/92 01/94 01/96 01/98 01/00 01/02Jungfraujoch
0
2500
5000
7500
10000
01/74 01/76 01/78 01/80 01/82 01/84 01/86 01/88 01/90 01/92 01/94 01/96 01/98 01/00 01/02Mauna Loa
0
2500
5000
7500
10000
01/74 01/76 01/78 01/80 01/82 01/84 01/86 01/88 01/90 01/92 01/94 01/96 01/98 01/00 01/02American Samoa
0
2500
5000
7500
10000
01/74 01/76 01/78 01/80 01/82 01/84 01/86 01/88 01/90 01/92 01/94 01/96 01/98 01/00 01/02
Cape Grim
0
2500
5000
7500
10000
01/74 01/76 01/78 01/80 01/82 01/84 01/86 01/88 01/90 01/92 01/94 01/96 01/98 01/00 01/02South Pole
0
2500
5000
7500
10000
01/74 01/76 01/78 01/80 01/82 01/84 01/86 01/88 01/90 01/92 01/94 01/96 01/98 01/00 01/02
CN record from GAW global sites submitted to WDCA (as of 1st sept 2002)
1974 2002Point Barrow
Pallas
Mace Head
Hohenpeissenberg
Jungfraujoch
Mauna Loa
American Samoa
Cape Grim
South Pole

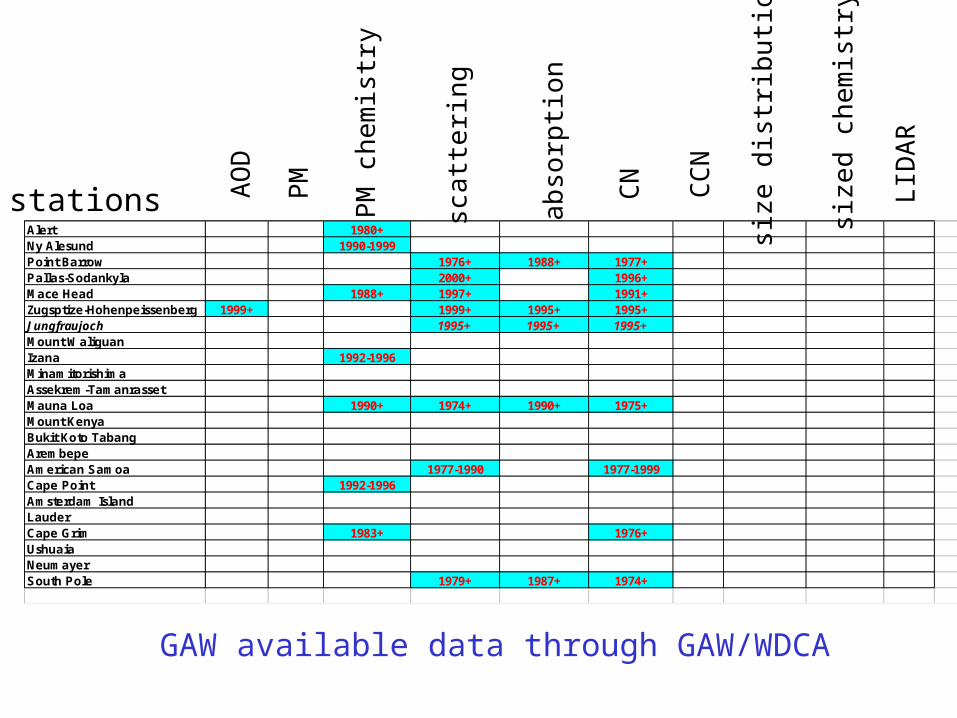
Alert 1980+ 1980+ 1989+Ny Alesund 2000+ 1990-1999Point Barrow 1976+ 1988+ 1977+Pallas-Sodankyla 2000+ 1996+Mace Head 2000+ 1998+ 1988+ 1997+ 1989+ 1991+ 1994+ 1994+Zugsptize-Hohenpeissenberg 1999+ 1996+ 1997+ 1999+ 1995+ 1995+ 1996+ 1997+Jungfraujoch 1999+ 1995+ 1995+ 1995+Mount Waliguan 1994+ 1994+Izana 2000+ 1992-1996Minamitorishima 1995+Assekrem-Tamanrasset 1997+ 1997 1997+Mauna Loa 1990+ 1974+ 1990+ 1975+Mount KenyaBukit Koto Tabang 1997+ 1997-2000ArembepeAmerican Samoa 1977-1990 1977-1999Cape Point 1992-1996Amsterdam Island 1991+Lauder 1993+Cape Grim 1983+ 1990+ 1976+ 1981+ 1992-1996Ushuaia 1994-1997Neumayer 2000+ 1995+ 1982South Pole 1979+ 1987+ 1974+
AO
D
PM
PM
che
mis
try
sca
tteri
ng
abs
orp
tion
CN
CC
N
size
dis
trib
utio
n
LID
AR
size
d ch
em
istr
y
stations
GAW ongoing measurements
Alert 1980+Ny Alesund 1990-1999Point Barrow 1976+ 1988+ 1977+Pallas-Sodankyla 2000+ 1996+Mace Head 1988+ 1997+ 1991+Zugsptize-Hohenpeissenberg 1999+ 1999+ 1995+ 1995+Jungfraujoch 1995+ 1995+ 1995+Mount WaliguanIzana 1992-1996MinamitorishimaAssekrem-TamanrassetMauna Loa 1990+ 1974+ 1990+ 1975+Mount KenyaBukit Koto TabangArembepeAmerican Samoa 1977-1990 1977-1999Cape Point 1992-1996Amsterdam IslandLauderCape Grim 1983+ 1976+UshuaiaNeumayerSouth Pole 1979+ 1987+ 1974+
AO
D
PM
PM
che
mis
try
sca
tteri
ng
abs
orp
tion
CN
CC
N
size
dis
trib
utio
n
LID
AR
size
d ch
em
istr
y
stations
GAW available data through GAW/WDCA

GAW Global Stations COSAM Sites
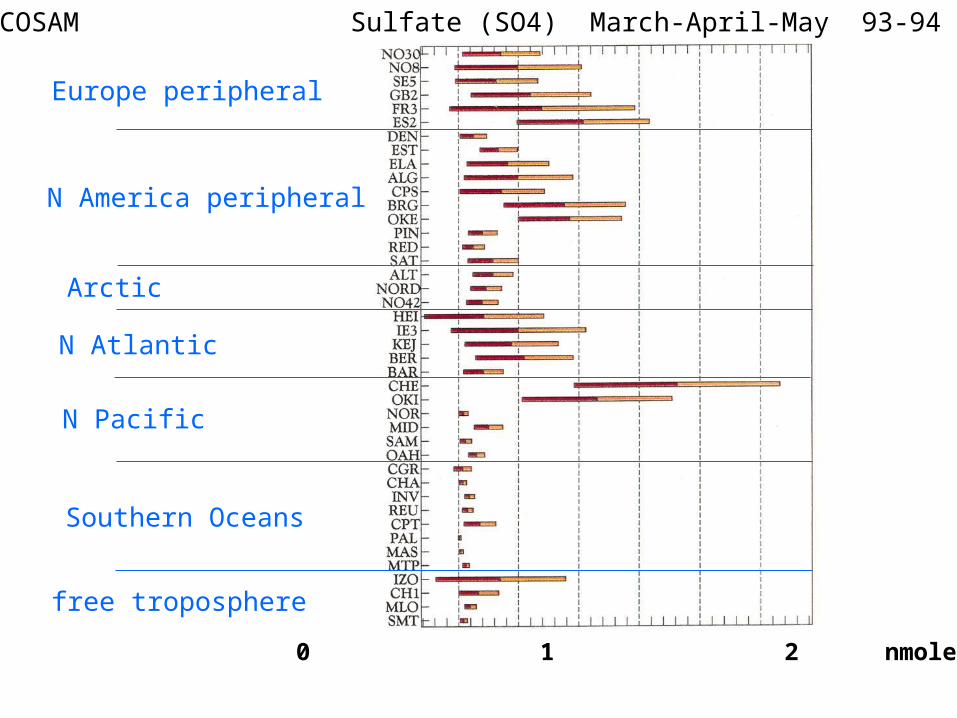
COSAM Sulfate (SO4) March-April-May 93-94
0 1 2 nmole/mole-air
Arctic
N Atlantic
N Pacific
Southern Oceans
free troposphere
N America peripheral
Europe peripheral
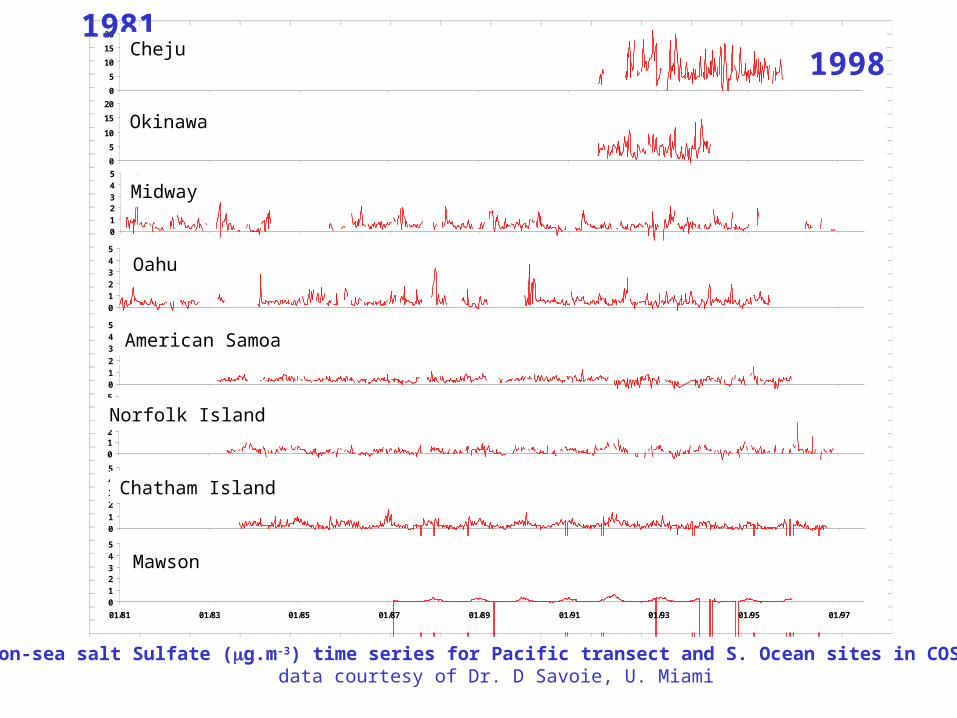
Cheju
0
5
10
15
20
01/81 01/83 01/85 01/87 01/89 01/91 01/93 01/95 01/97Okinawa
0
5
10
15
20
01/81 01/83 01/85 01/87 01/89 01/91 01/93 01/95 01/97Midway
012345
01/81 01/83 01/85 01/87 01/89 01/91 01/93 01/95 01/97
Oahu
012345
01/81 01/83 01/85 01/87 01/89 01/91 01/93 01/95 01/97
American Samoa
012
345
01/81 01/83 01/85 01/87 01/89 01/91 01/93 01/95 01/97Norfolk Island
012345
01/81 01/83 01/85 01/87 01/89 01/91 01/93 01/95 01/97Chatham Island
01
23
45
01/81 01/83 01/85 01/87 01/89 01/91 01/93 01/95 01/97
Mawson
012345
01/81 01/83 01/85 01/87 01/89 01/91 01/93 01/95 01/97
non-sea salt Sulfate (g.m-3) time series for Pacific transect and S. Ocean sites in COSAM. data courtesy of Dr. D Savoie, U. Miami
1981 1998
Okinawa
Cheju
Midway
American Samoa
Oahu
Norfolk Island
Chatham Island
Mawson

DE0004 - Deuselbach
0
1
2
3
4
5
6
1978
1979
1980
1981
1982
1983
1984
1985
1986
1987
1988
1989
1990
1991
1992
1993
1994
1995
1996
1997
1998
g S
O4-S
m-3 Monthly mean values
12-month running mean
0
0.5
1
1.5
2
2.5
19
78
19
79
19
80
19
81
19
82
19
83
19
84
19
85
19
86
19
87
19
88
19
89
19
90
19
91
19
92
19
93
19
94
19
95
19
96
19
97
19
98
g S
O4-S
m
-3
Stoke Ferry
High Muffles
Lough Navar
GlenDye
Strath Vaich
United Kingdom
Germany
Southern FinlandFI0004 - Aehtari
0
0.5
1
1.5
2
2.5
3
19
78
19
79
19
80
19
81
19
82
19
83
19
84
19
85
19
86
19
87
19
88
19
89
19
90
19
91
19
92
19
93
19
94
19
95
19
96
19
97
19
98
g S
O4-S
m
-3
monthly values
12-month av.
Finland
0-
0-
0-
2-
2-
2-
Su
lfate
(m
icro
gra
m S
O4
=/m
3)
EMEP CCC Report 7/20001978 1998

GAWnetwork
WMO/GAWWorld Data Centre for Aerosols
loca
l r
eg
ion
al g
lob
al
Researchprojects
AEROCEACE’s
TRACE’s
compilations
loca
l r
eg
ion
al g
lob
al
EMEPnetwork
IMPROVEnetwork
CAPMONnetwork
IMPROVEData
Centre
CAPMONData
Centre
EMEPData
Centre
http://ies.jrc.cec.eu.int/wdca/[email protected]

natural rural near-city urban kerbside
A European Aerosol Phenomenology(Putaud et al., JRC, 2002)
Put
aud
et a
l., A
Eur
opea
n P
M P
heno
men
olog
y, J
RC
, 200
2

35
40
45
50
55
60
65
70
-10 -5 0 5 10 15 20 25 30
Aerosol Optical Depth TNO FEL
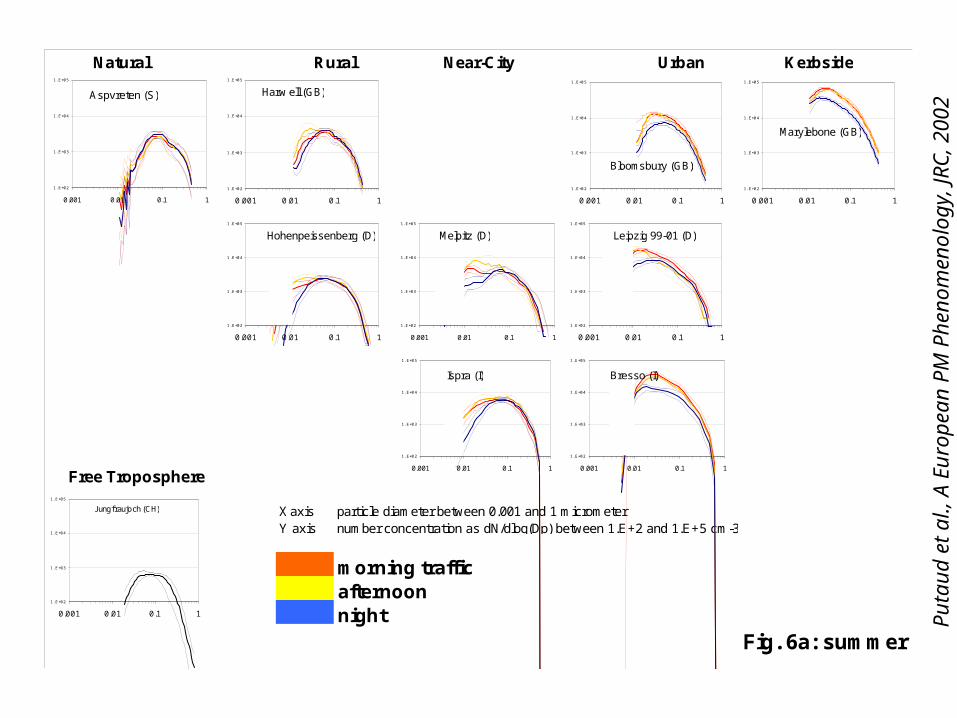
Near-City
Free Troposphere
X axis particle diameter between 0.001 and 1 micrometerY axis number concentration as dN/dlog(Dp) between 1.E+2 and 1.E+5 cm-3
morning trafficafternoonnight
Fig. 6a: summer
Natural Rural Urban Kerbside
1. E+02
1. E+03
1. E+04
1. E+05
0.001 0.01 0.1 1
Melpitz (D)
1. E+02
1. E+03
1. E+04
1. E+05
0.001 0.01 0.1 1
Aspvreten (S)
1. E+02
1. E+03
1. E+04
1. E+05
0.001 0.01 0.1 1
J ungfraujoch (CH)
1. E+02
1. E+03
1. E+04
1. E+05
0.001 0.01 0.1 1
Leipzig 99-01 (D)
1. E+02
1. E+03
1. E+04
1. E+05
0.001 0.01 0.1 1
Marylebone (GB)
1. E+02
1. E+03
1. E+04
1. E+05
0.001 0.01 0.1 1
Harw ell (GB)
1. E+02
1. E+03
1. E+04
1. E+05
0.001 0.01 0.1 1
Hohenpeissenberg (D)
1. E+02
1. E+03
1. E+04
1. E+05
0.001 0.01 0.1 1
Bloomsbury (GB)
1. E+02
1. E+03
1. E+04
1. E+05
0.001 0.01 0.1 1
Ispra (I)
1. E+02
1. E+03
1. E+04
1. E+05
0.001 0.01 0.1 1
Bresso (I)
Put
aud
et a
l., A
Eur
opea
n P
M P
heno
men
olog
y, J
RC
, 200
2
0
20
40
60
80
100
Jung
frau
joch
(C
H)
Sev
ettij
arvi
(F
IN)
Skr
eada
len
(N)
Birk
enes
(N
)
Asp
vret
en (
S)
Cha
umon
t (C
H)
Mon
agre
ga (
E)
Har
wel
l (G
B)
Hoh
enpe
isse
nber
g (D
)
Mel
pitz
(D
)
Ispr
a (I
)
Waa
smun
ster
(B
)
Zue
rich
(CH
)
Bas
el (
CH
)
Blo
omsb
ury
(GB
)
Leip
zig
97-9
9 (D
)
Leip
zig
99-0
1 (D
)
Gen
t (B
)
Bol
ogna
(I)
Bar
celo
na (
E)
Ber
n (C
H)
Mar
yleb
one
(GB
)
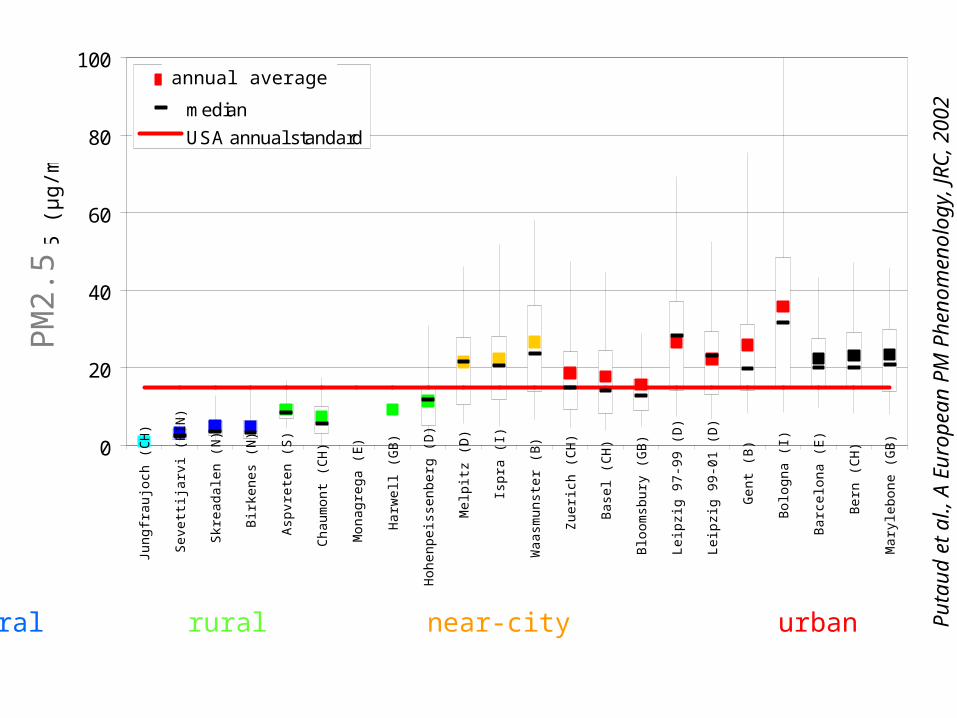
PM
2.5
(µ
g/m
³)
average
median
USA annual standard
natural rural near-city urban kerbside
PM
2.5
annual average
Put
aud
et a
l., A
Eur
opea
n P
M P
heno
men
olog
y, J
RC
, 200
2
0
10
20
30
40
50
Sev
ettij
arvi
(F
IN)
Skr
eada
len
(N)
Birk
enes
(N
)
Fin
okal
ia (
GR
)
Cha
umon
t (C
H)
Mon
agre
ga (
E)
Pay
erne
(C
H)
Waa
smun
ster
(B
)
Mel
pitz
96-
99 (
G)
Mel
pitz
99-
01 (
G)
Ispr
a (I
)
Vallo
n D
ol (
F)
Zue
rich
(CH
)
Bas
el (
CH
)
Gen
t (B
)
Bol
ogna
(I)
Bre
sso
(I)
Bar
celo
na (
E)
Ber
n (C
H)
Wie
diko
n (C
H)
PM
2.5
µg/
m³
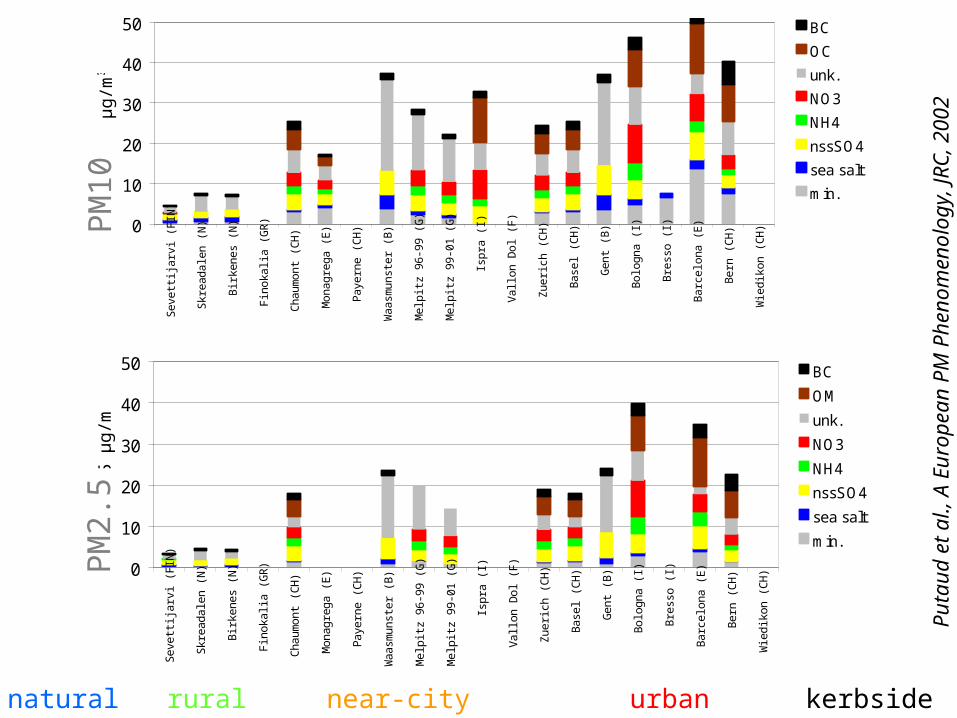
BC
OM
unk.
NO3
NH4
nssSO4
sea salt
min.
PM
2.5
natural rural near-city urban kerbside
0
10
20
30
40
50
Se
vett
ijarv
i (F
IN)
Skr
ea
da
len
(N
)
Bir
ken
es
(N)
Fin
oka
lia (
GR
)
Ch
au
mo
nt
(CH
)
Mo
na
gre
ga
(E
)
Pa
yern
e (
CH
)
Wa
asm
un
ste
r (B
)
Me
lpitz
96
-99
(G
)
Me
lpitz
99
-01
(G
)
Isp
ra (
I)
Va
llon
Do
l (F
)
Zu
eri
ch (
CH
)
Ba
sel (
CH
)
Ge
nt
(B)
Bo
log
na
(I)
Bre
sso
(I)
Ba
rce
lon
a (
E)
Be
rn (
CH
)
Wie
dik
on
(C
H)
PM
10 µ
g/m
³
BC
OC
unk.
NO3
NH4
nssSO4
sea salt
min.
PM
10
Put
aud
et a
l., A
Eur
opea
n P
M P
heno
men
olog
y, J
RC
, 200
2

PM2.5 natural & rural grd averagemin.4% sea salt
7%
nssSO430%
NH47%
NO32%
unacc.21%
OM21%
BC8%
PM2.5 near-city and urban grd averagemin.7% sea salt
3%
nssSO417%
NH411%
NO316%
unacc.17%
OM22%
BC7%
PM2.5 kerbside grd averagemin.8% sea salt
2%
nssSO414%
NH48%
NO311%
unacc.12%
OM32%
BC13%
natural near-city kerbside rural urban
nss-SO430 %
nss-SO417 %
nss-SO414 %
OM21 %
OM22 %
OM32 %
PM2.5 chemical composition
5.4 µg/m³ 25 µg/m³ 29 µg/m³
Putaud et al., A European PM Phenomenology, JRC, 2002
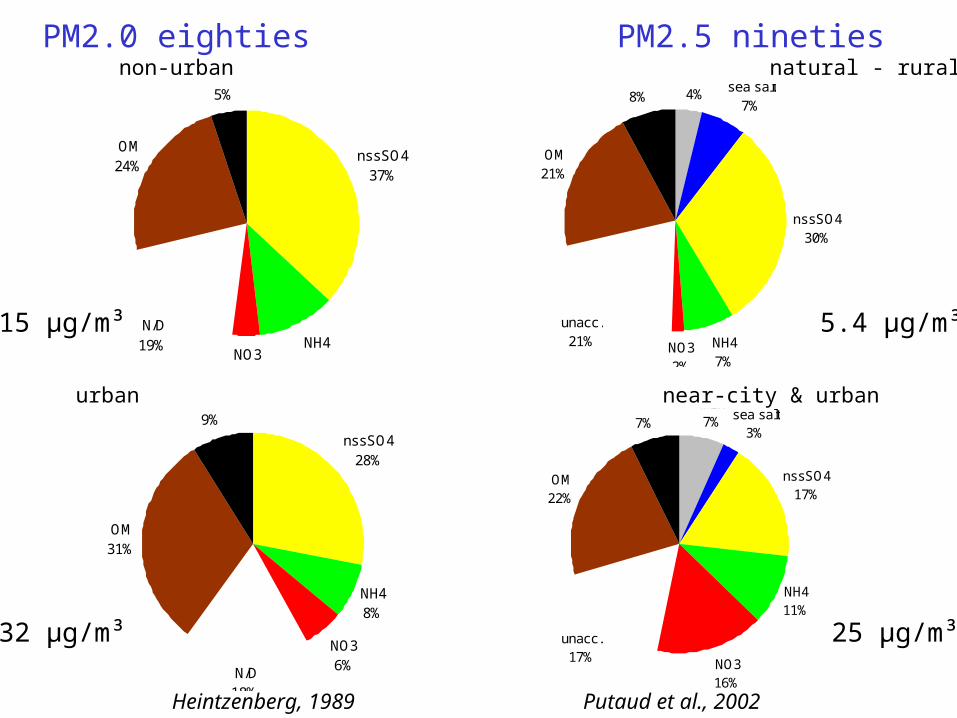
Heintzenberg, 1989 present compilation
Non-urban fine particle composition (Heintzenberg, 1989)
nssSO437%
NH411%NO3
4%
N/D19%
OM24%
BC5%
PM2.5 natural & rural grd averagemin.4% sea salt
7%
nssSO430%
NH47%
NO32%
unacc.21%
OM21%
BC8%
PM2.0 eighties PM2.5 nineties non-urban natural - rural
15 µg/m³ 5.4 µg/m³
Urban fine particle composition(Heitzenberg, 1989)
nssSO428%
NH48%
NO36%N/D
18%
OM31%
BC9%
PM2.5 near-city and urban grd averagemin.7% sea salt
3%
nssSO417%
NH411%
NO316%
unacc.17%
OM22%
BC7%
32 µg/m³ 25 µg/m³
urban near-city & urban
Heintzenberg, 1989 Putaud et al., 2002

summary and conclusions
GAW global stations not well located for aerosol measurementsneed addition of:- regional networks- results from research projects
- need projects that need data (COSAM)
aerosol data for Climate and Health issues- mutual benefit
research projects should also aim at delivering data to compilations, syntheses, public data archives- role for funding agencies- more open attitude among scientists

We would like to acknowledge the following groups for use of the data that they have
submitted to WDCA
• Dr. J Ogren and colleagues, CMDL• Prof. Dr. Y Viisanen and colleagues, FMI,• Prof. S. G. Jennings and colleagues, NUI, Galway• U. Kaminski and colleagues, DWD• Dr. Urs Baltensperger and colleagues, PSI• Dr. J. Gras and colleagues, CSIRO• Dr. D. Savoie and colleagues, U. Miami

A European Aerosol Phenomenology physical and chemical characteristics of particulate matterat kerbside, urban, rural and background sites in Europe.
Jean-P. Putaud1, Urs Baltensperger2, Erika Brüggemann13, M.-Cristina Facchini3, Sandro Fuzzi3, Robert Gehrig4, Hans-C. Hansson5, Roy M. Harrison6, Alan M. Jones6, Paolo Laj7, Willy Maenhaut8, Nikolaos
Mihalopoulos9, Konrad Müller13, Finn Palmgren10, Xavier Querol11, Sergio Rodriguez11, Gerald Spindler13, Harry ten Brink12, Peter Tunved5, Rita Van Dingenen1, Birgit Wehner13, Ernest Weingartner2, Alfred
Wiedensohler13, Peter Wåhlin10, Frank Raes1
1 European Commission, Institute for Environment & Sustainability, Joint Research Centre, Ispra, Italy2 Paul Scherrer Institut, Laboratory of Atmospheric Chemistry, Villigen, Switzerland
3 Istituto di Scienze dell'Atmosfera e dell'Oceano, Consiglio Nazionale delle Ricerche, Bologna, Italy4 Swiss Federal Laboratories for Materials Testing and Research, Dübendorf, Switzerland
5 Institute of Applied Environmental Research, University of Stockholm, Stockholm, Sweden6 University of Birmingham, Division of Environmental health and Risk Management, Birmingham, UK
7 Laboratoire de Météorologie Physique, Université Blaise Pascal, Aubière, France8 University of Gent, Institute for Nuclear Sciences, Department of Analytical Chemistry, Gent, Belgium
9 Environmental Chemical Processes Laboratory, University of Crete, Heraklion, Greece 10 National Environmental Research Institute, Roskilde, Denmark
11 Inst. de Ciencias de la Tierra, Consejo Superior de Investigaciones Científicas (CSIC), Barcelona, Spain12 Netherlands Energy Research Foundation (ECN), Petten, The Netherlands
13 Institut für Troposphärenforschung, Leipzig, Germany