Embed Size (px)
Citation preview
Availability and Reliability Theory
and the Expectations Behind the Numbers

© 2003 APC corporation.
Provide an understanding of reliability and availability which enables IT decision makers to make sound management decisions.
Purpose
© 2003 APC corporation.
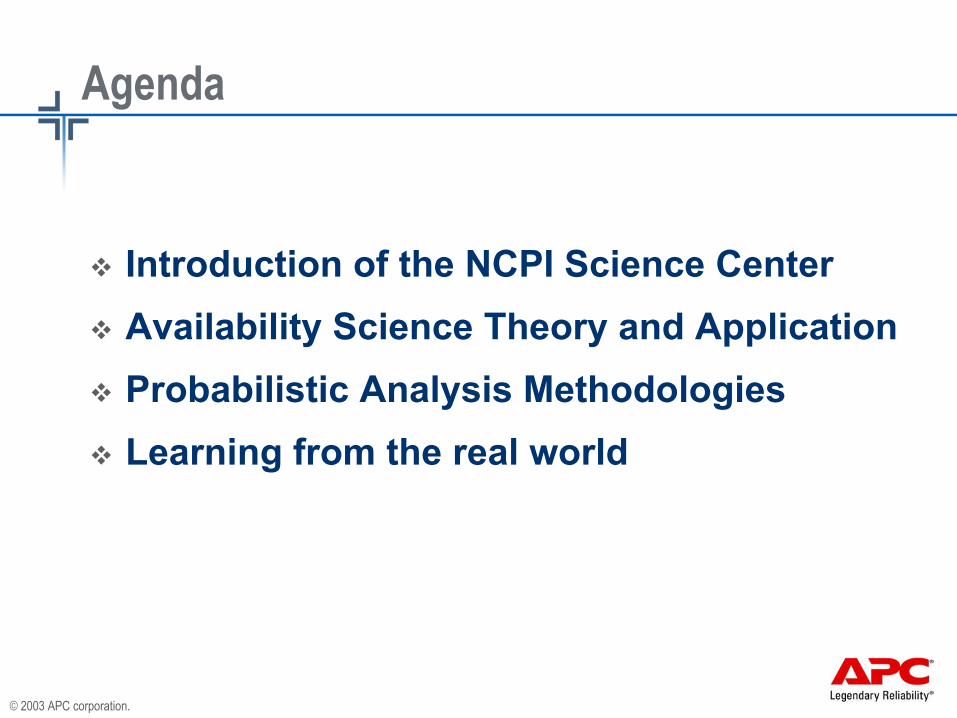
Introduction of the NCPI Science CenterAvailability Science Theory and ApplicationProbabilistic Analysis MethodologiesLearning from the real world
Agenda
© 2003 APC corporation.
Mission: To advance the state of knowledge about the design and operation of Network-Critical Physical Infrastructure (NCPI) in both the industry and user communities. To provide techniques, guidelines, and tools to empower users to make the most effective planning decisions regarding their NCPI investments, maximizing availability and agility while reducing TCO.
NCPI Science Center
Availability / Reliability Theories and Application
Using numbers to make sound decisions

© 2003 APC corporation.
99.999% - Når oppetid er kritisk
© 2003 APC corporation.
A few myths and misconceptions
MTBF is the average number of hours a system will operateMore parts = less reliabilityField MTBF values can be compared if everyone defines “load drop” as a failure
© 2003 APC corporation.
Why use Availability Analysis?
Illustrate the strengths and weaknesses of one architecture over another.Answer how and where dollars should be allocated to increase availability.Most useful for systems that expect significant downtime from outages, or planned downtime.Most applicable industries: Oil refineries and certain manufacturing industries, mining.
© 2003 APC corporation.
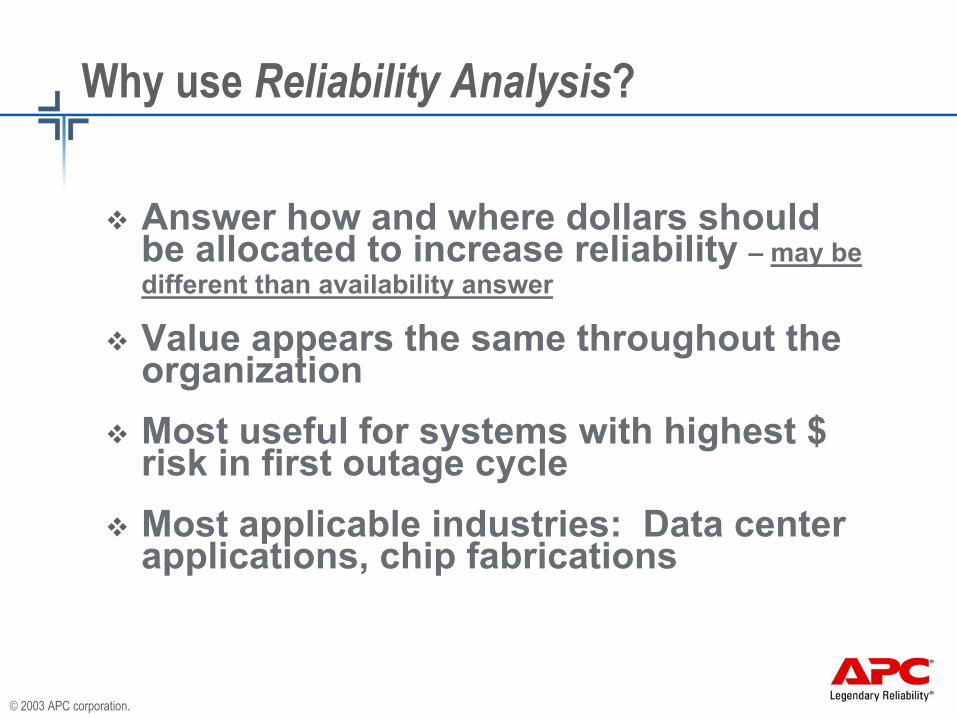
Why use Reliability Analysis?
Answer how and where dollars should be allocated to increase reliability – may be different than availability answer
Value appears the same throughout the organizationMost useful for systems with highest $ risk in first outage cycleMost applicable industries: Data center applications, chip fabrications
© 2003 APC corporation.
andPhysical Structure
Power
Cabling
Cool
ingNCPI
FireSecurityand
Racks
NCPI Elementsare combined into
an integrated system
andFire
SecurityCooling
Racksand
PhysicalStructure
Power
Cabling
ServicesManagementSystems
NCPI
ReliableIT BusinessOperations
People
Process
Information Technology
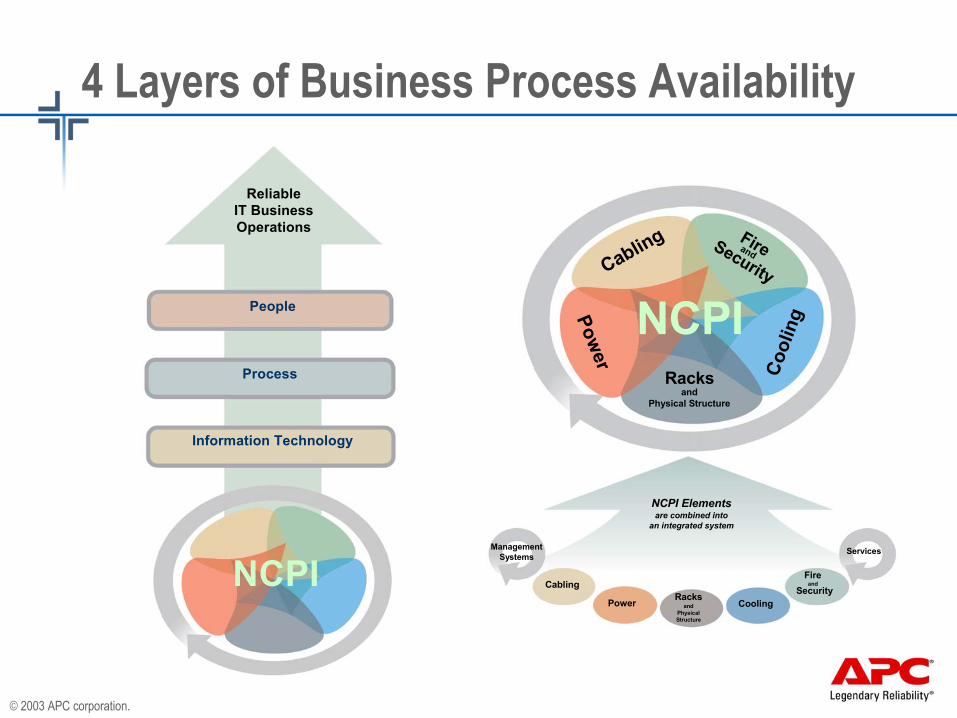
4 Layers of Business Process Availability
© 2003 APC corporation.
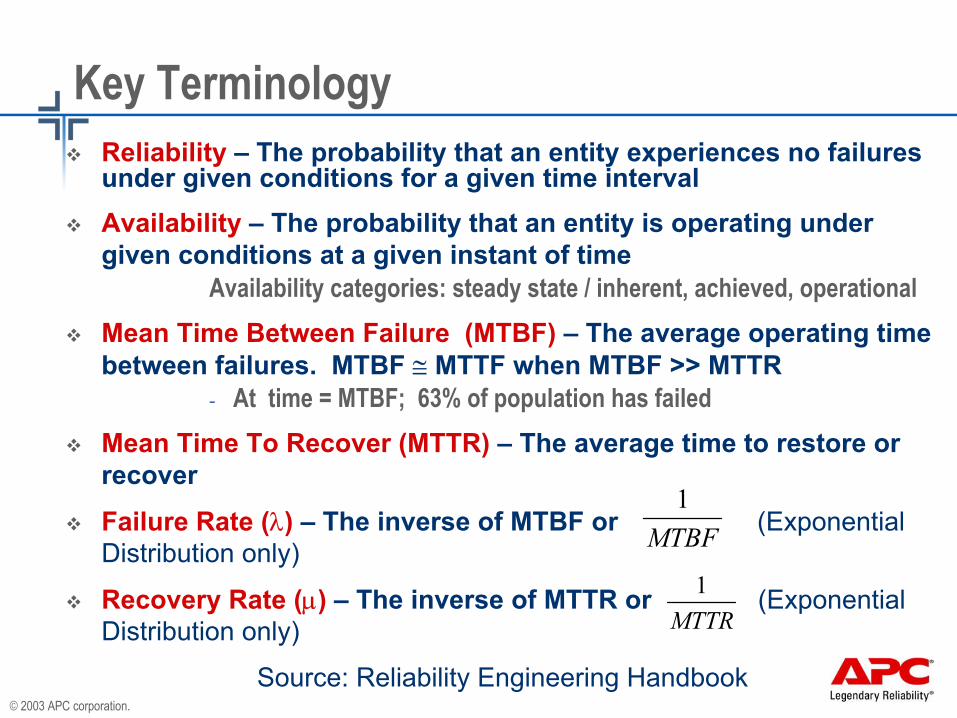
Key TerminologyReliability – The probability that an entity experiences no failures under given conditions for a given time intervalAvailability – The probability that an entity is operating under given conditions at a given instant of time
Availability categories: steady state / inherent, achieved, operationalMean Time Between Failure (MTBF) – The average operating time between failures. MTBF ≅ MTTF when MTBF >> MTTR
- At time = MTBF; 63% of population has failedMean Time To Recover (MTTR) – The average time to restore or recover
Failure Rate (λ) – The inverse of MTBF or (Exponential Distribution only)
Recovery Rate (µ) – The inverse of MTTR or (Exponential Distribution only)
Source: Reliability Engineering Handbook
MTBF1
MTTR1
© 2003 APC corporation.
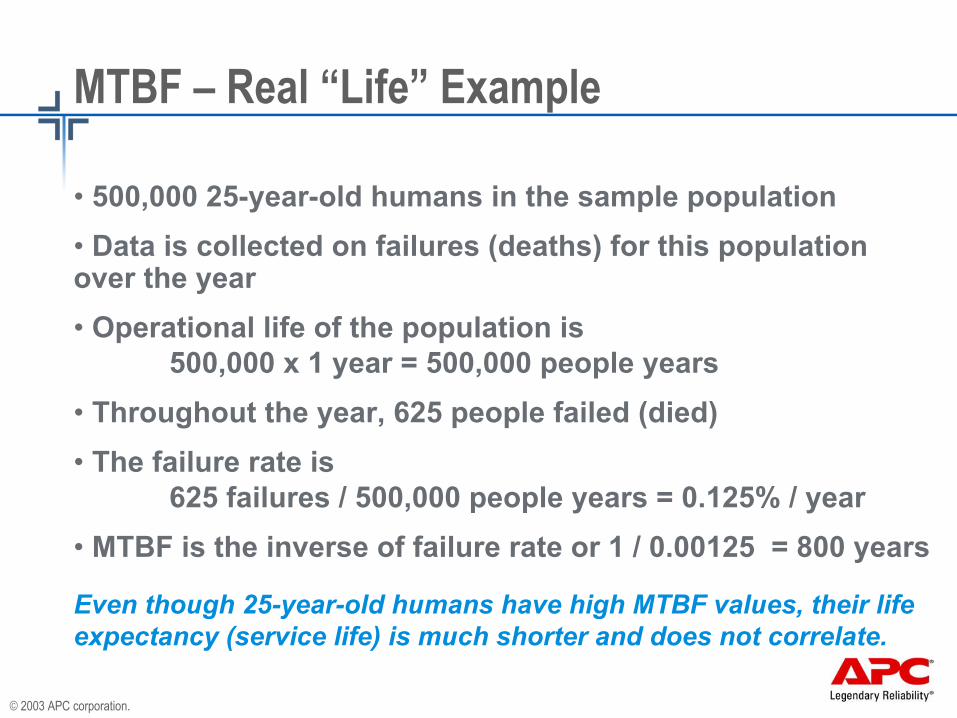
MTBF – Real “Life” Example
• 500,000 25-year-old humans in the sample population• Data is collected on failures (deaths) for this population over the year• Operational life of the population is
500,000 x 1 year = 500,000 people years• Throughout the year, 625 people failed (died)• The failure rate is
625 failures / 500,000 people years = 0.125% / year• MTBF is the inverse of failure rate or 1 / 0.00125 = 800 years
Even though 25-year-old humans have high MTBF values, their life expectancy (service life) is much shorter and does not correlate.
© 2003 APC corporation.
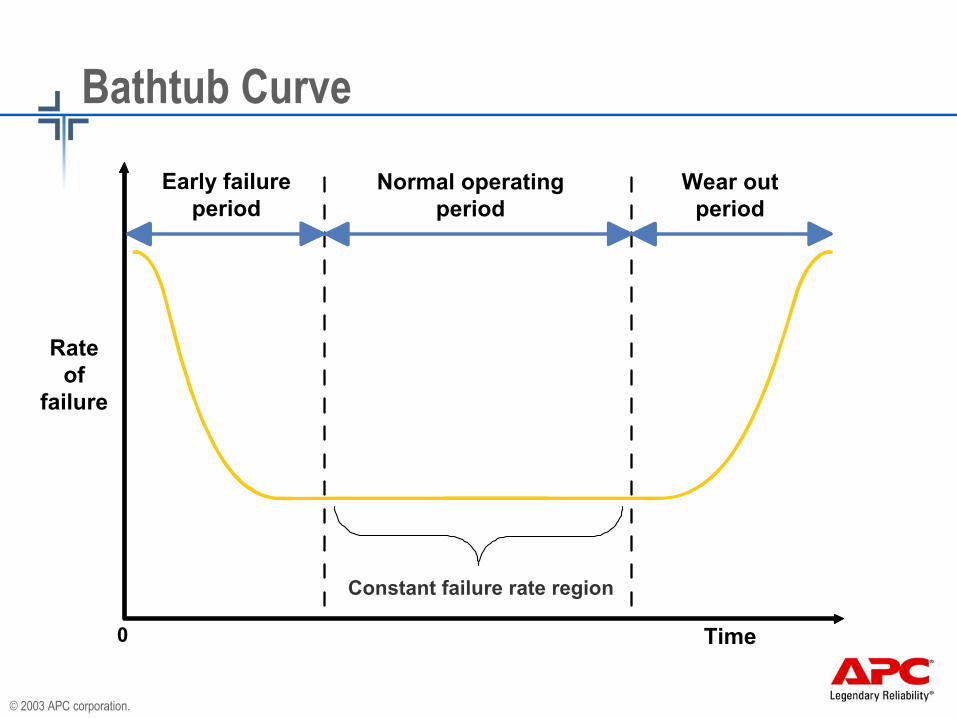
Bathtub Curve
0
Rateof
failure
Constant failure rate region
Early failureperiod
Normal operatingperiod
Wear outperiod
Time

© 2003 APC corporation.
Key Availability Equations
Availability –
Steady State Availability – ( )MTTRMTBFMTBFA
+=
( ) ( )( ) tλµ+−
++
+= eA
λµλ
λµµ
( )λµµ+
=A
( ) ( )( ) 1
001.01001.0
001.0110 0*001.01 =
++
+== +−eAhrst
( ) ( ) 999.00*001.01001.0
001.0111000 =
++
+== Ahrst
( ) 999.011000
1000=
+=A
© 2003 APC corporation.
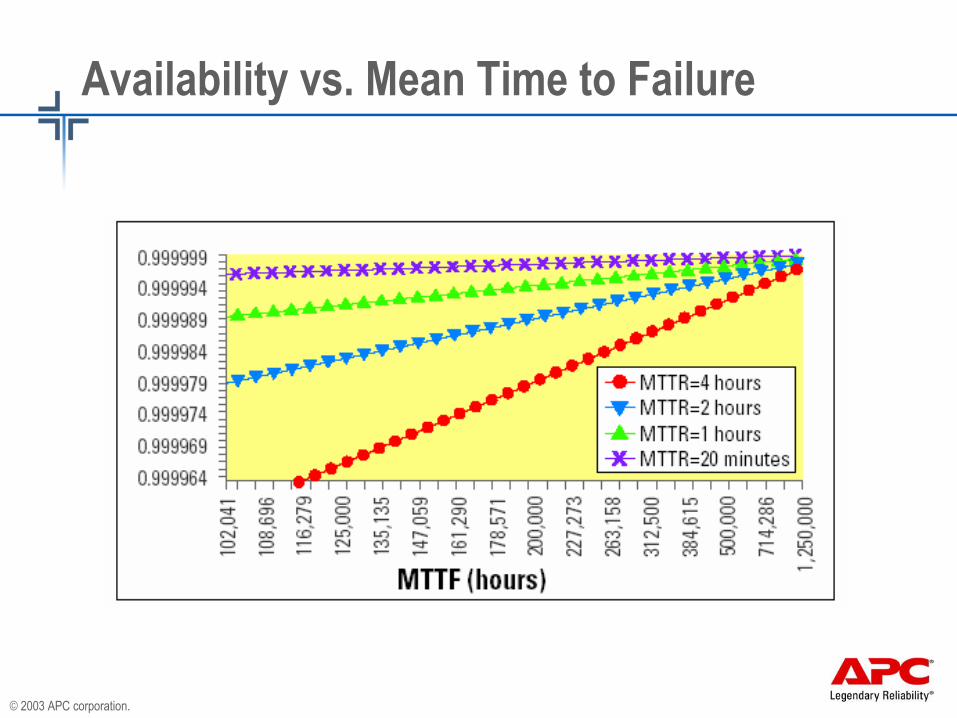
Availability vs. Mean Time to Failure
© 2003 APC corporation.
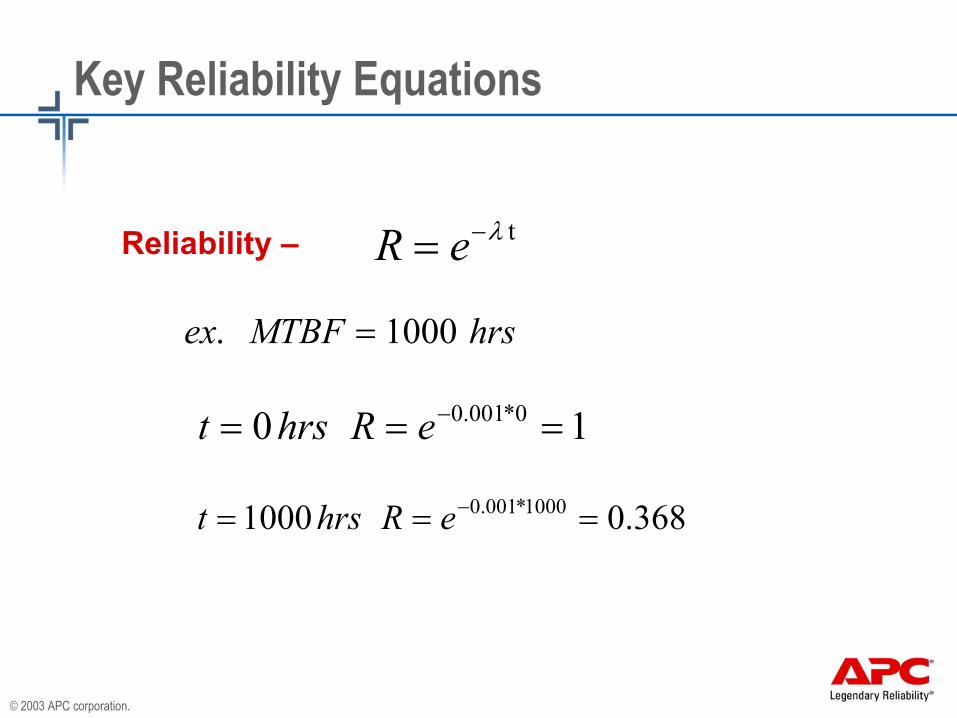
Key Reliability Equations
Reliability – tλ−= eR
10 0*001.0 === −eRhrst
hrsMTBFex 1000. =
368.01000 1000*001.0 === −eRhrst
© 2003 APC corporation.
What makes calculated probabilities credible?Assumptions
- Without assumptions the results mean nothing- I.e. Human error, spare parts on hand, constant failure rate
Methods- Comparing two or more similar architectures is effective in
evaluating the relative differences between them.Helps to avoid the vender specific definitions of “failure”Helps mitigate the assumption of constant failure rate
- Confidence limits depend on the size of the population, you are studying www.weibull.com/hotwire/issue4/relbasics4.htmUseful when calculating the availability or reliability of individual components. Data from Resistor batch much easier to gather then Data Center batch
Data- The results are only as good as the data
© 2003 APC corporation.
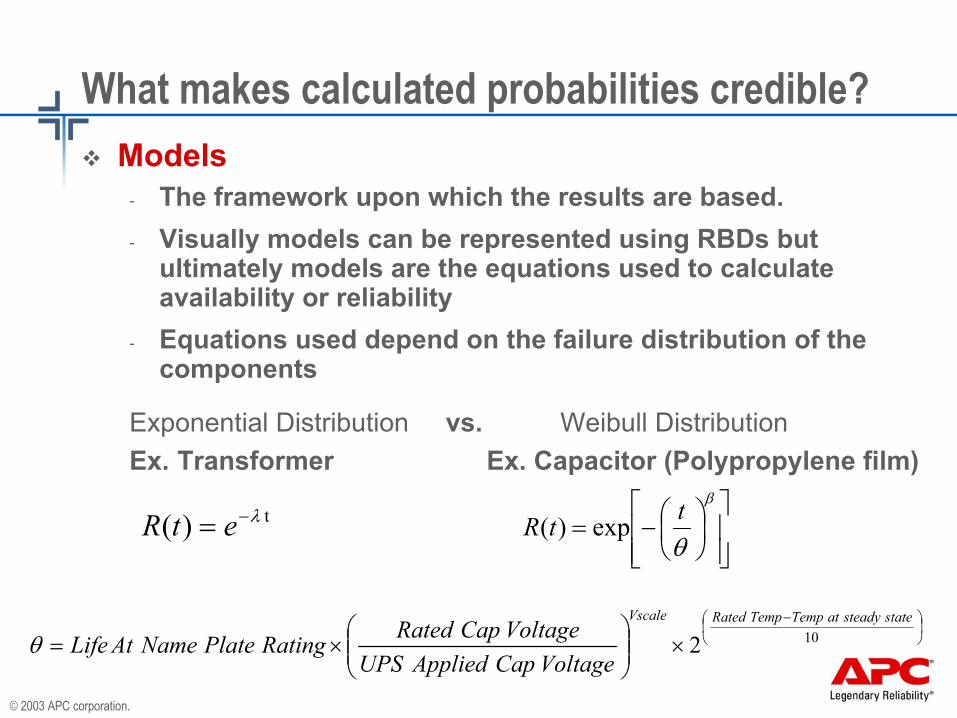
What makes calculated probabilities credible?Models
- The framework upon which the results are based. - Visually models can be represented using RBDs but
ultimately models are the equations used to calculate availability or reliability
- Equations used depend on the failure distribution of the components
Exponential Distribution vs. Weibull DistributionEx. Transformer Ex. Capacitor (Polypropylene film)
t)( λ−= etR
−=
β
θttR exp)(
−
×
×= 102
statesteadyatTempTempRatedVscale
VoltageCapAppliedUPSVoltageCapRatedRatingPlateNameAtLifeθ
© 2003 APC corporation.
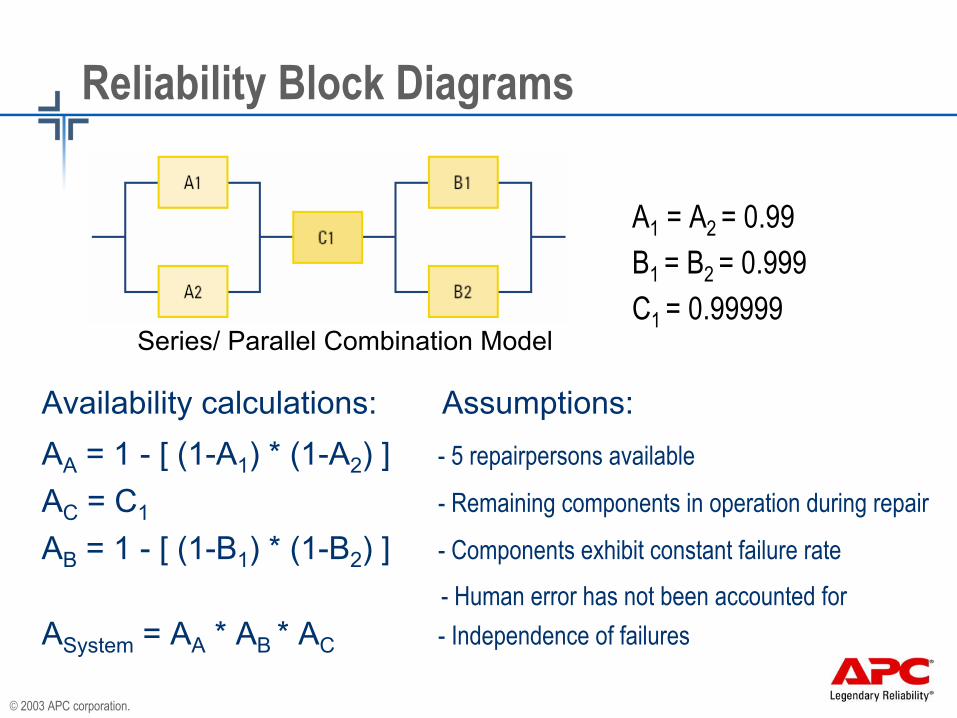
Reliability Block Diagrams
Availability calculations: Assumptions:AA = 1 - [ (1-A1) * (1-A2) ] - 5 repairpersons available
AC = C1 - Remaining components in operation during repair
AB = 1 - [ (1-B1) * (1-B2) ] - Components exhibit constant failure rate- Human error has not been accounted for
ASystem = AA * AB * AC - Independence of failures
Series/ Parallel Combination Model
A1 = A2 = 0.99B1 = B2 = 0.999C1 = 0.99999
© 2003 APC corporation.
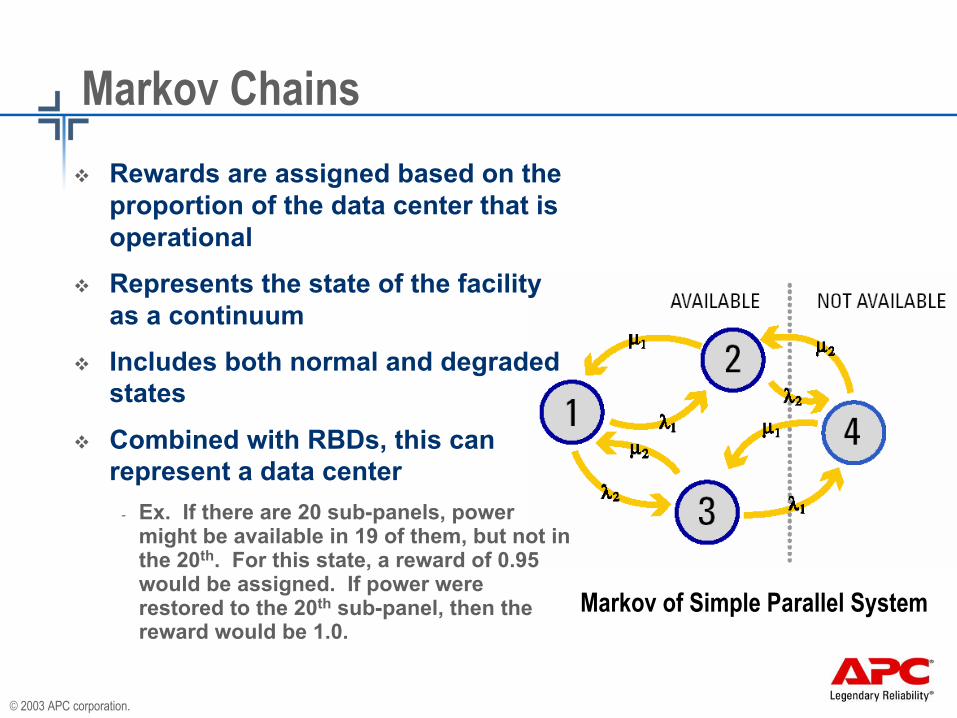
Markov ChainsRewards are assigned based on the proportion of the data center that is operational
Represents the state of the facility as a continuum
Includes both normal and degraded states
Combined with RBDs, this can represent a data center
- Ex. If there are 20 sub-panels, power might be available in 19 of them, but not in the 20th. For this state, a reward of 0.95 would be assigned. If power were restored to the 20th sub-panel, then the reward would be 1.0.
Markov of Simple Parallel System
© 2003 APC corporation.
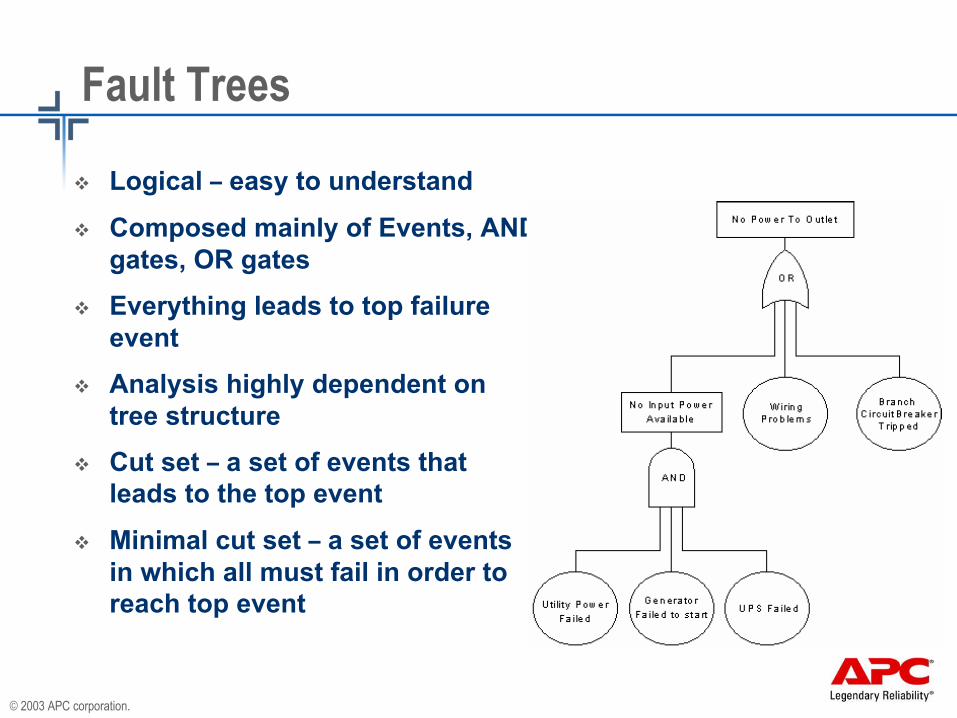
Fault Trees
Logical – easy to understand
Composed mainly of Events, AND gates, OR gates
Everything leads to top failure event
Analysis highly dependent on tree structure
Cut set – a set of events that leads to the top event
Minimal cut set – a set of events in which all must fail in order to reach top event
Probabilistic Analysis Methodologies
© 2003 APC corporation.
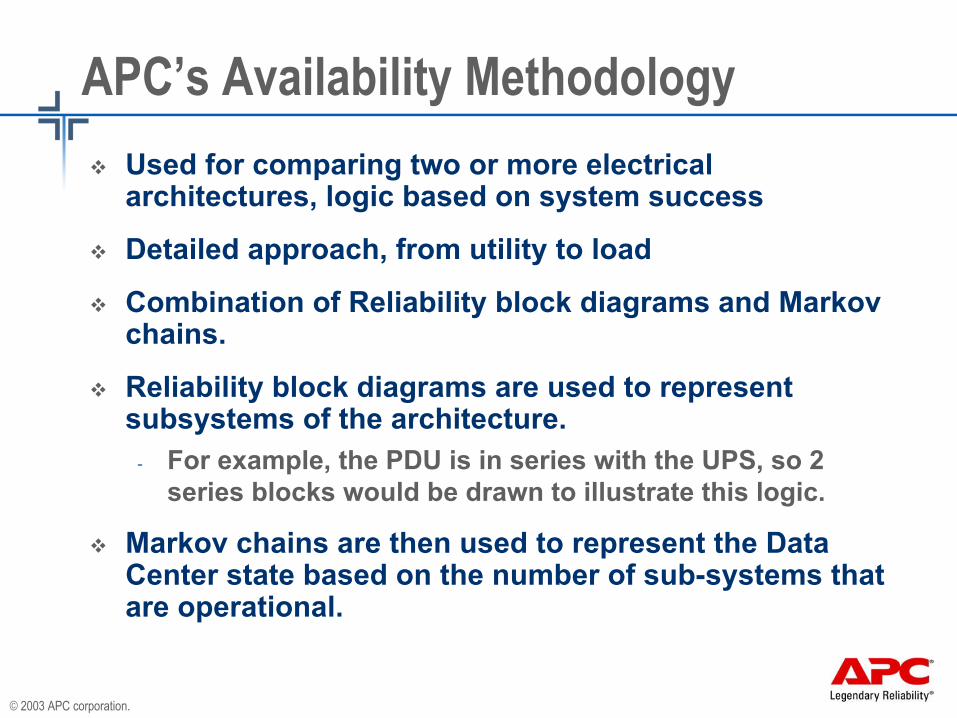
APC’s Availability MethodologyUsed for comparing two or more electrical architectures, logic based on system success
Detailed approach, from utility to load
Combination of Reliability block diagrams and Markov chains.
Reliability block diagrams are used to represent subsystems of the architecture.
- For example, the PDU is in series with the UPS, so 2 series blocks would be drawn to illustrate this logic.
Markov chains are then used to represent the Data Center state based on the number of sub-systems that are operational.
© 2003 APC corporation.
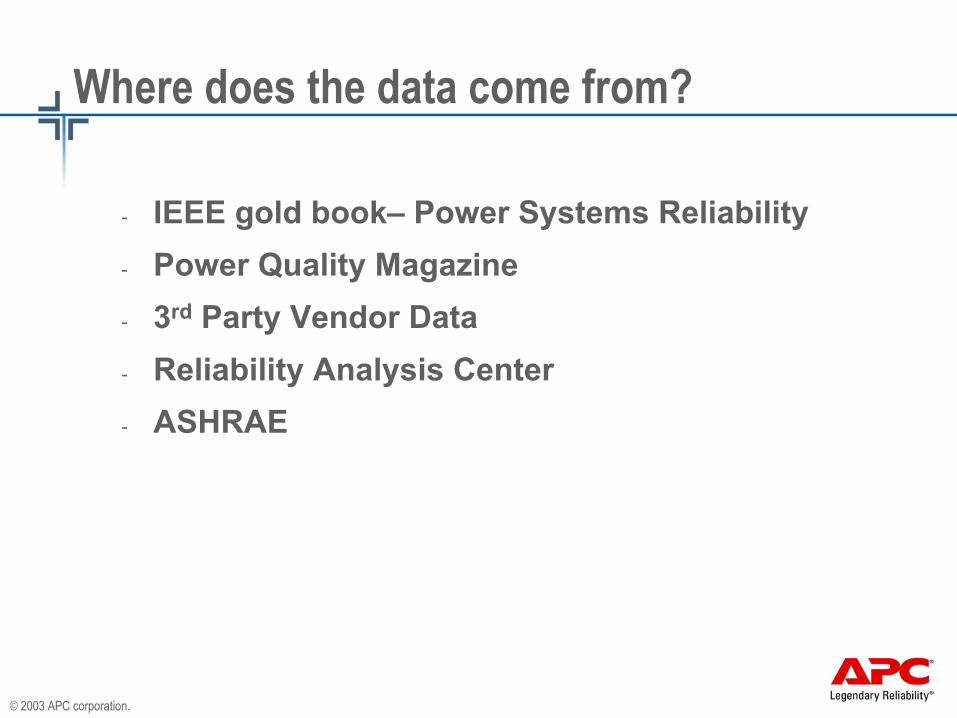
Where does the data come from?
- IEEE gold book– Power Systems Reliability- Power Quality Magazine- 3rd Party Vendor Data- Reliability Analysis Center - ASHRAE
© 2003 APC corporation.
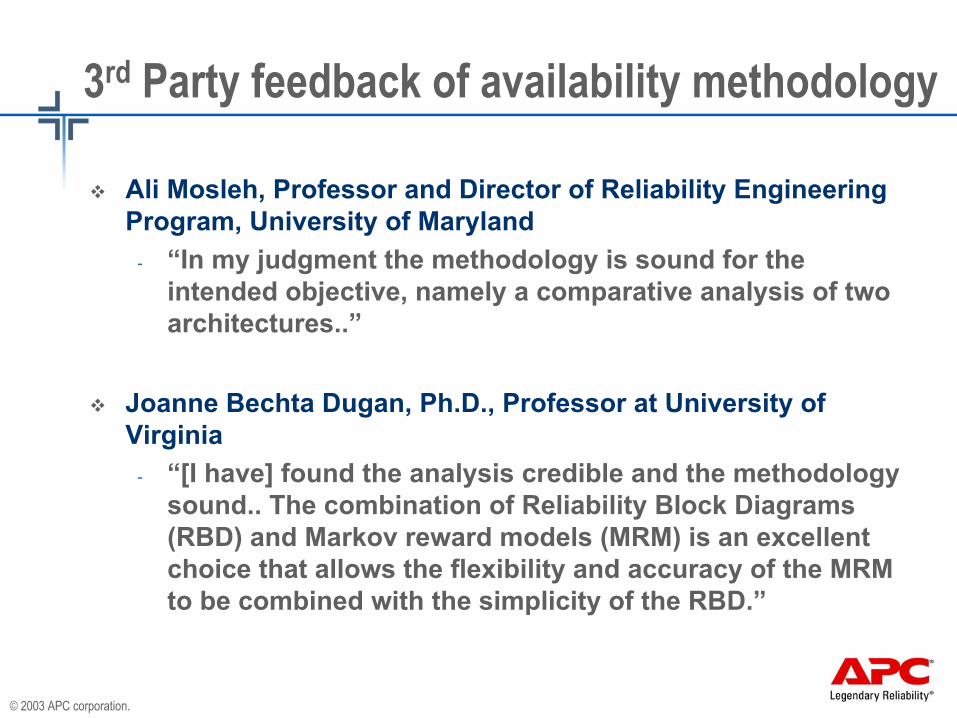
3rd Party feedback of availability methodology
Ali Mosleh, Professor and Director of Reliability Engineering Program, University of Maryland
- “In my judgment the methodology is sound for the intended objective, namely a comparative analysis of two architectures..”
Joanne Bechta Dugan, Ph.D., Professor at University of Virginia
- “[I have] found the analysis credible and the methodology sound.. The combination of Reliability Block Diagrams (RBD) and Markov reward models (MRM) is an excellent choice that allows the flexibility and accuracy of the MRM to be combined with the simplicity of the RBD.”

© 2003 APC corporation.
MTech’s PRA Methodology
Based on nuclear industry PRA
Invasive data gathering, analysis can “stand alone”, logic based on system failure
Primarily uses Fault trees sometime combined with human factors
Determine minimal cut sets from fault tree logical structure
Calculate probability of each minimal cut set during mission
Rank component contributions to failure
Determine sensitivity of results to component failure rate
© 2003 APC corporation.
Where does the data come from?
- IEEE gold book– Power Systems Reliability- Nuclear industry- 3rd Party studies and data- ASHRAE- MTech database

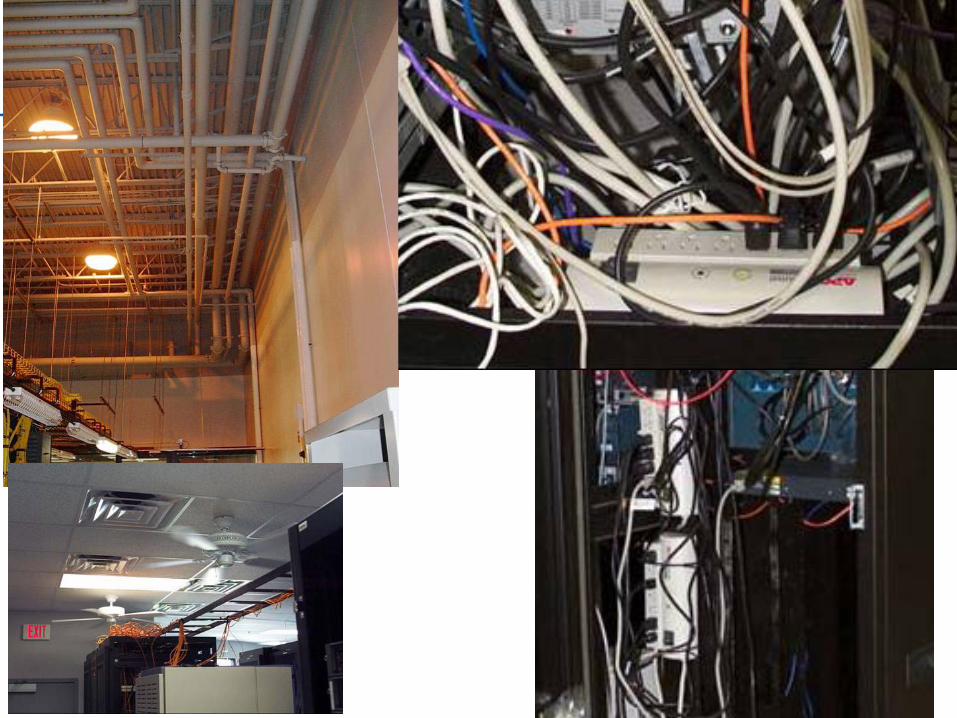
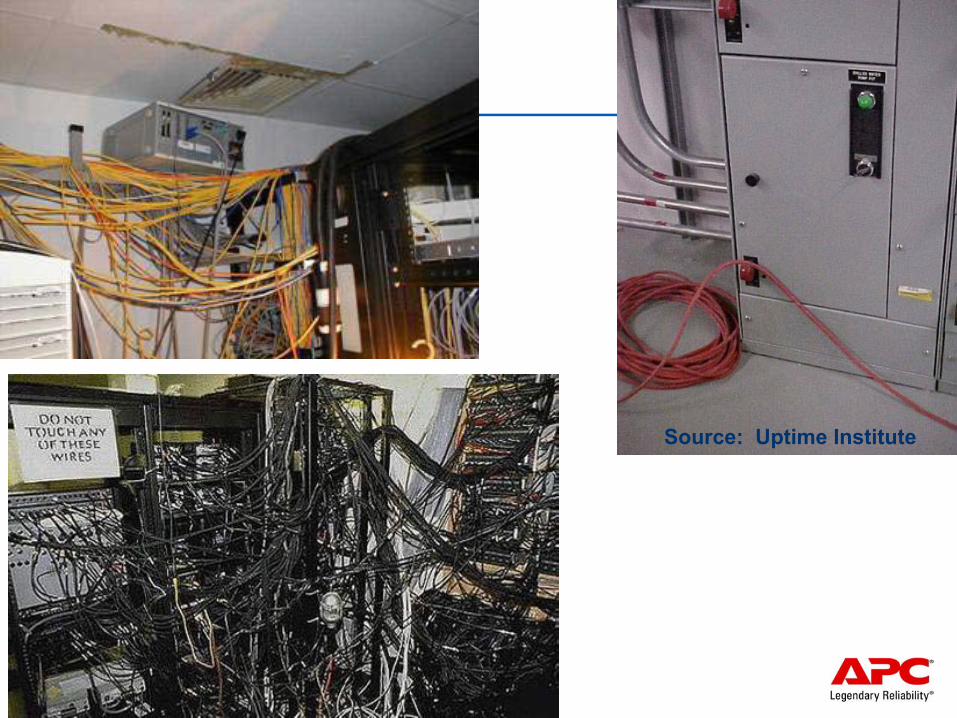
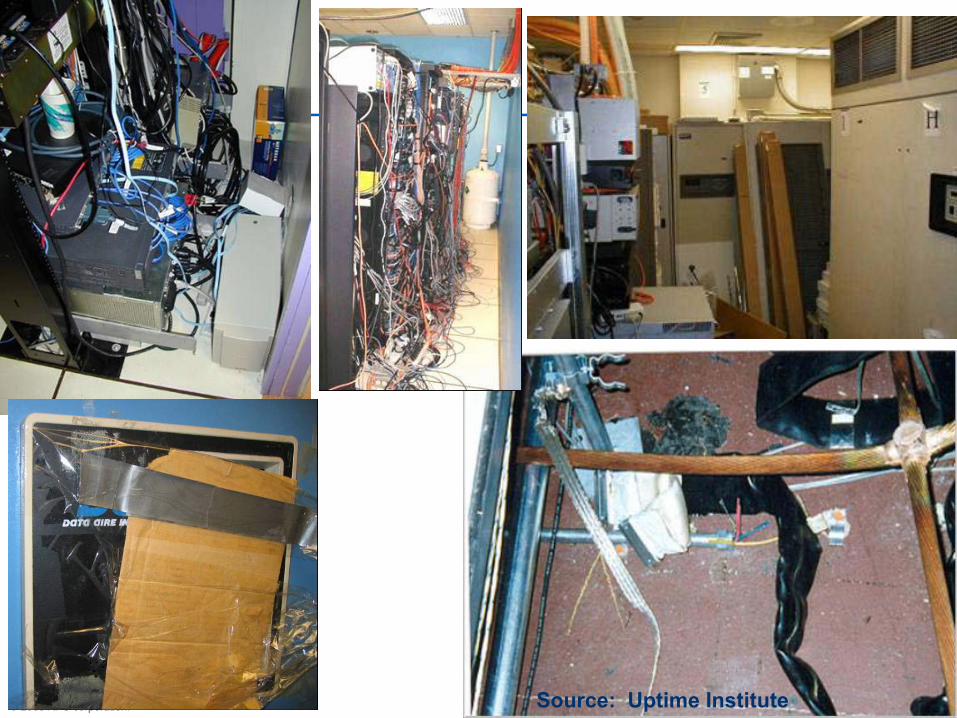
Learning from the real world
Real customer issues
© 2003 APC corporation.
© 2003 APC corporation.
Source: Uptime Institute
© 2003 APC corporation. Source: Uptime Institute
© 2003 APC corporation.
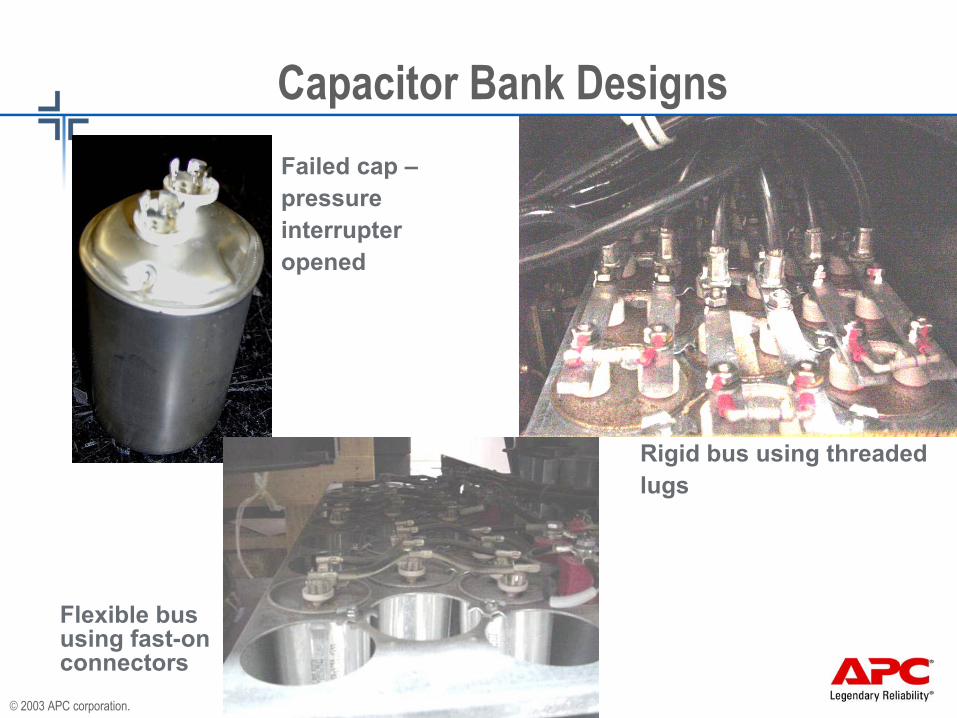
Capacitor Bank Designs
Flexible bus using fast-on connectors
Failed cap –pressure interrupter opened
Rigid bus using threaded lugs
© 2003 APC corporation.
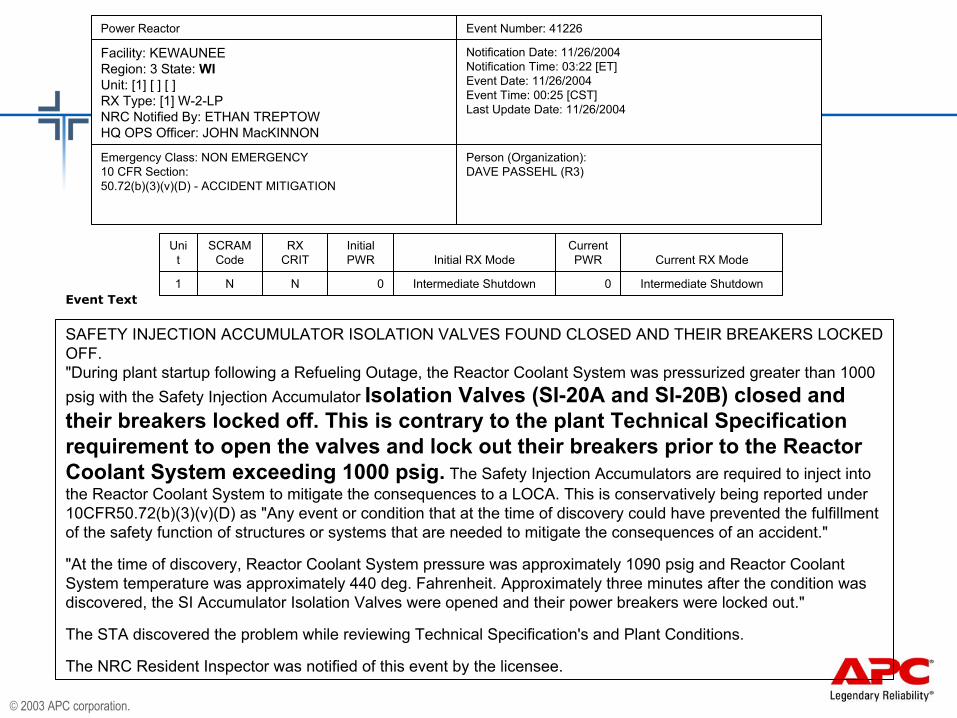
Person (Organization): DAVE PASSEHL (R3)
Emergency Class: NON EMERGENCY10 CFR Section: 50.72(b)(3)(v)(D) - ACCIDENT MITIGATION
Notification Date: 11/26/2004Notification Time: 03:22 [ET]Event Date: 11/26/2004Event Time: 00:25 [CST]Last Update Date: 11/26/2004
Facility: KEWAUNEERegion: 3 State: WIUnit: [1] [ ] [ ]RX Type: [1] W-2-LPNRC Notified By: ETHAN TREPTOWHQ OPS Officer: JOHN MacKINNON
Event Number: 41226Power Reactor
Intermediate Shutdown0Intermediate Shutdown0NN1
Current RX ModeCurrent PWRInitial RX Mode
Initial PWR
RX CRIT
SCRAM Code
Unit
Event Text
SAFETY INJECTION ACCUMULATOR ISOLATION VALVES FOUND CLOSED AND THEIR BREAKERS LOCKED OFF. "During plant startup following a Refueling Outage, the Reactor Coolant System was pressurized greater than 1000 psig with the Safety Injection Accumulator Isolation Valves (SI-20A and SI-20B) closed and their breakers locked off. This is contrary to the plant Technical Specification requirement to open the valves and lock out their breakers prior to the Reactor Coolant System exceeding 1000 psig. The Safety Injection Accumulators are required to inject into the Reactor Coolant System to mitigate the consequences to a LOCA. This is conservatively being reported under 10CFR50.72(b)(3)(v)(D) as "Any event or condition that at the time of discovery could have prevented the fulfillment of the safety function of structures or systems that are needed to mitigate the consequences of an accident."
"At the time of discovery, Reactor Coolant System pressure was approximately 1090 psig and Reactor Coolant System temperature was approximately 440 deg. Fahrenheit. Approximately three minutes after the condition was discovered, the SI Accumulator Isolation Valves were opened and their power breakers were locked out."
The STA discovered the problem while reviewing Technical Specification's and Plant Conditions.
The NRC Resident Inspector was notified of this event by the licensee.
© 2003 APC corporation.
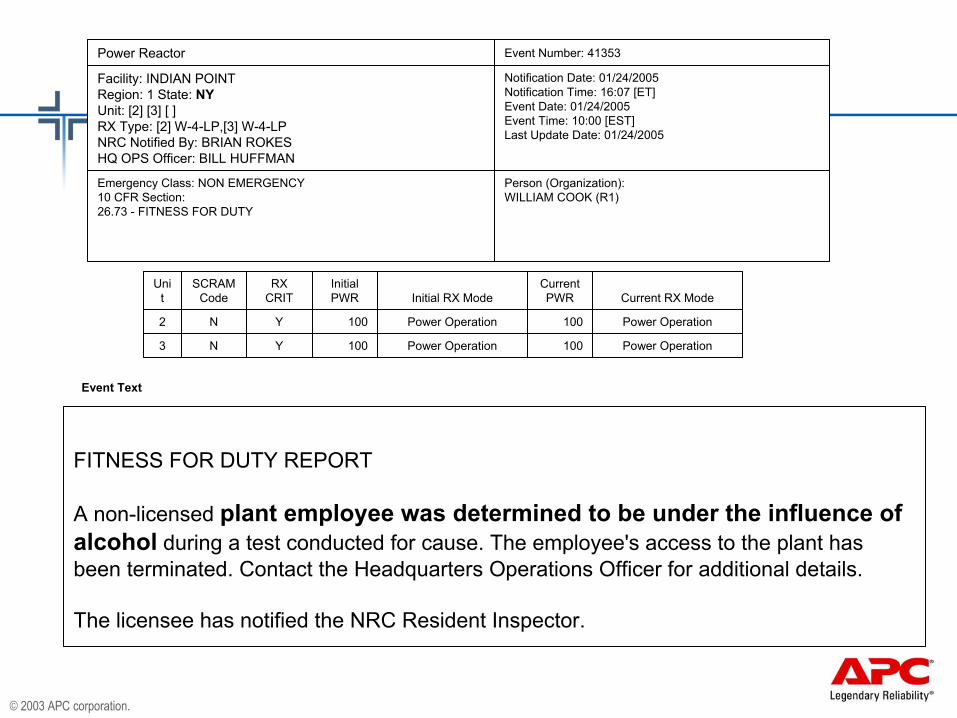
Person (Organization): WILLIAM COOK (R1)
Emergency Class: NON EMERGENCY10 CFR Section: 26.73 - FITNESS FOR DUTY
Notification Date: 01/24/2005Notification Time: 16:07 [ET]Event Date: 01/24/2005Event Time: 10:00 [EST]Last Update Date: 01/24/2005
Facility: INDIAN POINTRegion: 1 State: NYUnit: [2] [3] [ ]RX Type: [2] W-4-LP,[3] W-4-LPNRC Notified By: BRIAN ROKESHQ OPS Officer: BILL HUFFMAN
Event Number: 41353Power Reactor
Power Operation100Power Operation100YN3
Power Operation100Power Operation100YN2
Current RX ModeCurrent PWRInitial RX Mode
Initial PWR
RX CRIT
SCRAM Code
Unit
Event Text
FITNESS FOR DUTY REPORT
A non-licensed plant employee was determined to be under the influence of alcohol during a test conducted for cause. The employee's access to the plant has been terminated. Contact the Headquarters Operations Officer for additional details.
The licensee has notified the NRC Resident Inspector.
© 2003 APC corporation.
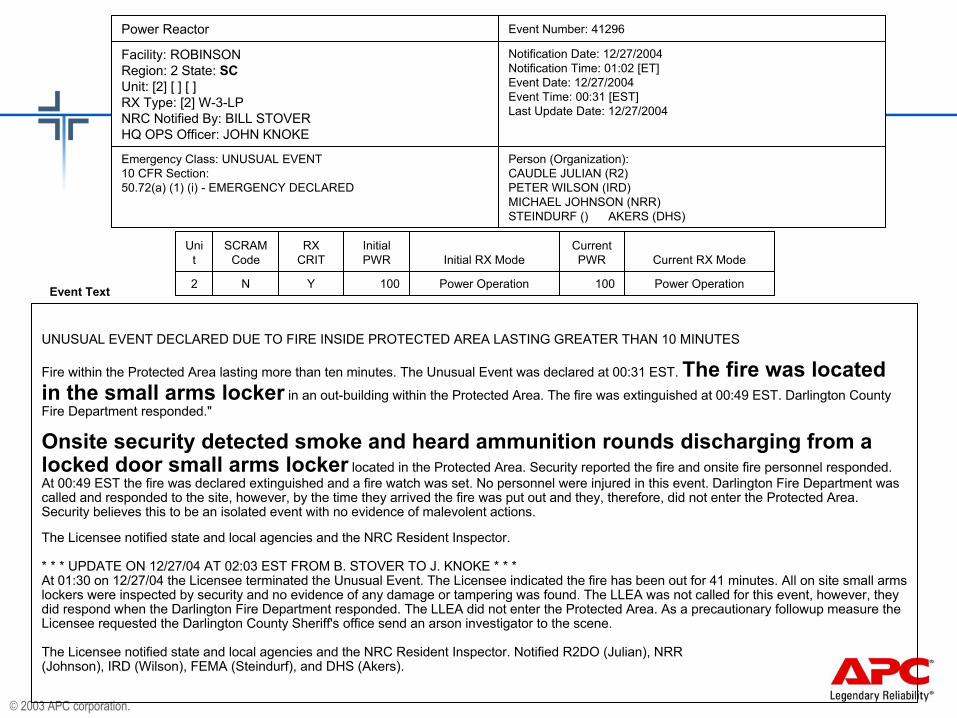
Person (Organization): CAUDLE JULIAN (R2)PETER WILSON (IRD)MICHAEL JOHNSON (NRR)STEINDURF () AKERS (DHS)
Emergency Class: UNUSUAL EVENT10 CFR Section: 50.72(a) (1) (i) - EMERGENCY DECLARED
Notification Date: 12/27/2004Notification Time: 01:02 [ET]Event Date: 12/27/2004Event Time: 00:31 [EST]Last Update Date: 12/27/2004
Facility: ROBINSONRegion: 2 State: SCUnit: [2] [ ] [ ]RX Type: [2] W-3-LPNRC Notified By: BILL STOVERHQ OPS Officer: JOHN KNOKE
Event Number: 41296Power Reactor
Power Operation100Power Operation100YN2
Current RX ModeCurrent PWRInitial RX Mode
Initial PWR
RX CRIT
SCRAM Code
Unit
Event Text
UNUSUAL EVENT DECLARED DUE TO FIRE INSIDE PROTECTED AREA LASTING GREATER THAN 10 MINUTES
Fire within the Protected Area lasting more than ten minutes. The Unusual Event was declared at 00:31 EST. The fire was located in the small arms locker in an out-building within the Protected Area. The fire was extinguished at 00:49 EST. Darlington County Fire Department responded."
Onsite security detected smoke and heard ammunition rounds discharging from a locked door small arms locker located in the Protected Area. Security reported the fire and onsite fire personnel responded. At 00:49 EST the fire was declared extinguished and a fire watch was set. No personnel were injured in this event. Darlington Fire Department was called and responded to the site, however, by the time they arrived the fire was put out and they, therefore, did not enter the Protected Area. Security believes this to be an isolated event with no evidence of malevolent actions.
The Licensee notified state and local agencies and the NRC Resident Inspector.
* * * UPDATE ON 12/27/04 AT 02:03 EST FROM B. STOVER TO J. KNOKE * * * At 01:30 on 12/27/04 the Licensee terminated the Unusual Event. The Licensee indicated the fire has been out for 41 minutes. All on site small arms lockers were inspected by security and no evidence of any damage or tampering was found. The LLEA was not called for this event, however, they did respond when the Darlington Fire Department responded. The LLEA did not enter the Protected Area. As a precautionary followup measure the Licensee requested the Darlington County Sheriff's office send an arson investigator to the scene.
The Licensee notified state and local agencies and the NRC Resident Inspector. Notified R2DO (Julian), NRR (Johnson), IRD (Wilson), FEMA (Steindurf), and DHS (Akers).

© 2003 APC corporation.
Where do failures occur?
Causes of failure in data center
PDU and circuit breakers:
30%
Other circuit breakers:
40%
UPS Failure:20%
Balance of System:
10%
Source: MTech
© 2003 APC corporation.
Questions?