Embed Size (px)
Citation preview

AVAILABILITY AND INEQUALITY IN THE
DISTRIBUTION OF HEALTH WORKERS IN THE PUBLIC
HEALTH SYSTEM IN RURAL INDIA
This thesis is submitted in partial fulfilment
of the requirements for the award of the
degree of Doctor of Philosophy at the
University of Portsmouth
Aditya Singh September 2016

ii
DECLARATION
Whilst registered as a candidate for the above degree, I have not been registered for any other
research award. The results and conclusions embodied in this thesis are the work of the
named candidate and have not been submitted for any other academic award.
iii
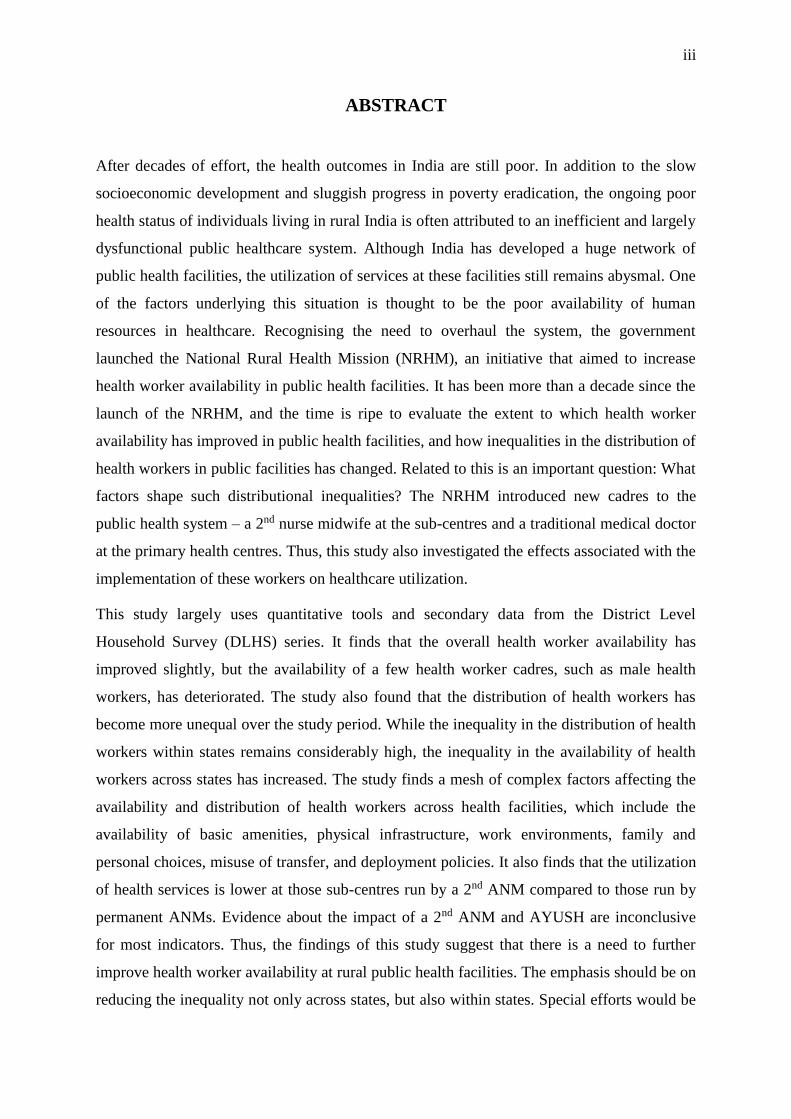
ABSTRACT
After decades of effort, the health outcomes in India are still poor. In addition to the slow
socioeconomic development and sluggish progress in poverty eradication, the ongoing poor
health status of individuals living in rural India is often attributed to an inefficient and largely
dysfunctional public healthcare system. Although India has developed a huge network of
public health facilities, the utilization of services at these facilities still remains abysmal. One
of the factors underlying this situation is thought to be the poor availability of human
resources in healthcare. Recognising the need to overhaul the system, the government
launched the National Rural Health Mission (NRHM), an initiative that aimed to increase
health worker availability in public health facilities. It has been more than a decade since the
launch of the NRHM, and the time is ripe to evaluate the extent to which health worker
availability has improved in public health facilities, and how inequalities in the distribution of
health workers in public facilities has changed. Related to this is an important question: What
factors shape such distributional inequalities? The NRHM introduced new cadres to the
public health system – a 2nd nurse midwife at the sub-centres and a traditional medical doctor
at the primary health centres. Thus, this study also investigated the effects associated with the
implementation of these workers on healthcare utilization.
This study largely uses quantitative tools and secondary data from the District Level
Household Survey (DLHS) series. It finds that the overall health worker availability has
improved slightly, but the availability of a few health worker cadres, such as male health
workers, has deteriorated. The study also found that the distribution of health workers has
become more unequal over the study period. While the inequality in the distribution of health
workers within states remains considerably high, the inequality in the availability of health
workers across states has increased. The study finds a mesh of complex factors affecting the
availability and distribution of health workers across health facilities, which include the
availability of basic amenities, physical infrastructure, work environments, family and
personal choices, misuse of transfer, and deployment policies. It also finds that the utilization
of health services is lower at those sub-centres run by a 2nd ANM compared to those run by
permanent ANMs. Evidence about the impact of a 2nd ANM and AYUSH are inconclusive
for most indicators. Thus, the findings of this study suggest that there is a need to further
improve health worker availability at rural public health facilities. The emphasis should be on
reducing the inequality not only across states, but also within states. Special efforts would be
iv
required for north and central Indian states that have struggled to improve their health worker
availability during this period. The findings also call for policymakers to devise new
strategies to retain health workers in rural and remote areas, while implementing transparent
and apolitical transfer and deployment policies. The government should also look into issues
as to why those sub-centres run by a 2nd ANM are not performing at par with those sub-
centres run by permanent ANMs.

v
ACKNOWLEDGEMENT
Firstly, I would like to thank the two people without whom I would not have embarked on
this academic journey: my previous mentor, Dr Abhishek Singh, who encouraged and helped
me to start this PhD, and my current supervisor, Dr Saseendran Pallikadavath, who has
always encouraged, guided, and supported me through all the ups and down of this journey. I
could never have realised this PhD without his unwavering support.
I am extremely grateful to Professor Tara Dean and Dr Jeanette Bartholomew for all their
help and support through these years. I would like to thank the Higher Education Funding
Council for England and the University of Portsmouth for providing the financial support that
partially funded this project.
My time at Portsmouth was made enjoyable in large part due to the many friends who
became a part of my life. I am grateful for time spent with my fellow PhD students, Julie,
Zakir, and Dia. I am extremely grateful to all of them, as I have been lucky to share all the
highs and lows of this PhD research with them. I would also like to thank my parents who
raised me with a love of science, encouraged me to have higher education, and supported me
in all my pursuits. Thank you.
Finally, I would like to thank everyone who participated in this research and who helped me
during data collection by giving their valuable time and showing great enthusiasm for the
research.
Aditya Singh
University of Portsmouth
Sepetember 2016

vi
Table of Contents Declaration.……………………………………………………………………………………ii
Abstract……………………………………………………………………………………….iii
Acknowledgement………………………………………………………………………….....v
Table of Contents……………………………………………………………………………..vi
List of Tables………………………………………………………………………………….ix
List of Figures………………………………………………………………………………..xii
List of Appendix Tables……………………………………………………………………..xiii
List of Appendix Figures……………………………………………………………………..xv
Dissemination of Findings…………………………………………………………………..xvi
List of Acronyms…………………………………………………………………………...xvii
Chapter 1: Thesis Introduction .............................................................................................. 1 1.1 Introduction ................................................................................................................. 1
1.2 Background and statement of the problem .................................................................. 1
1.3 Study Rationale ........................................................................................................... 4 1.4 Aims and objectives of the study ................................................................................ 7
1.5 Potential significance of the study .............................................................................. 8 1.6 Organization of the thesis .......................................................................................... 11
Chapter 2: Organization of the Health System in Rural India ......................................... 13 2.1 Introduction ............................................................................................................... 13
2.2 Current organization of the public healthcare system in India .................................. 13 2.2.1 Central Level ...................................................................................................... 13
2.2.2 State level ........................................................................................................... 14 2.2.3 District Level ..................................................................................................... 15 2.2.4 Community Level .............................................................................................. 15
2.2.5 Health Sub-Centre .............................................................................................. 15
2.2.6 Primary Health Centre (PHC) ............................................................................ 18
2.2.7 Community Health Centre ................................................................................. 19
Chapter 3: Literature Review ............................................................................................... 22 3.1 Introduction ............................................................................................................... 22 3.2 Who is a health worker? ............................................................................................ 22 3.3 The growing importance of health workers .............................................................. 23 3.4 Health worker shortage ............................................................................................. 24
3.5 What is health worker inequality? ............................................................................. 27 3.6 Why measure health worker inequality? ................................................................... 27 3.7 Measurement of health worker inequality ................................................................. 29 3.8 Factors affecting the availability and distribution of human resources for health .... 32
3.8.1 Individual or personal factors ............................................................................ 33
3.8.2 Community, local environment, and local living conditions ............................. 34 3.8.3 Working conditions and organizational environment ........................................ 36
3.8.4 Motivation, incentives, and career growth opportunities................................... 37 3.8.5 National and international contexts and migration ............................................ 38
3.9 Health worker availability and healthcare service utilization ................................... 39 3.10 Summary ................................................................................................................ 45
vii
Chapter 4: Data and Methods .............................................................................................. 48 4.1 Introduction ............................................................................................................... 48 4.2 Research design of the study ..................................................................................... 48
4.2.1 An overview of quantitative and qualitative research methods ......................... 49 4.2.2 Mixed-methods research methodology or the pragmatism paradigm ................ 50
4.2.3 Mixed-methods design ....................................................................................... 51 4.3 Sources of data .......................................................................................................... 53
4.3.1 District Level Household and Facility Surveys ................................................. 54 4.3.2 Primary data collection ...................................................................................... 57
4.4 Variables used for quantitative analysis .................................................................... 64
4.4.1 Variables used for research questions 1 and 2 ................................................... 64 4.4.2 Variables for research question 3 ....................................................................... 65 4.4.3 Variables for research question 4 ....................................................................... 66 4.4.4 Variables for research question 5 ....................................................................... 70
4.5 Data analysis methods ............................................................................................... 71
4.5.1 Measuring and decomposing distributional inequality ...................................... 71 4.5.2 Count (Poisson and Negative Binomial) regression .......................................... 76
4.5.3 Propensity score matching (PSM) ..................................................................... 80 4.6 Qualitative data analysis – thematic analysis ............................................................ 85
4.6.1 Procedure for addressing issues of validity and reliability in qualitative data
transcription ..................................................................................................................... 87
Chapter 5 Results: Availability and Inequality in the Distribution of Health Workers . 88 5.1 Introduction ............................................................................................................... 88
5.1.1 Availability of human resources ........................................................................ 88
5.1.2 Proportion of health facilities without health workers ....................................... 91 5.2 Inequalities in health worker distribution................................................................ 112
5.2.1 Inequality in the distribution of health workers at the health sub-centres ....... 112
5.2.2 Health worker inequality across primary health centres .................................. 114
5.2.3 Health worker inequality across community health centres ............................ 117 5.2.4 Summary of the main findings of this chapter ................................................. 124
Chapter 6 Results: Factors Affecting the Distribution of Health Workers .................... 128
6.1 Introduction ............................................................................................................. 128 6.2 Results: Factors affecting health worker availability at public health facilities in
rural India: Evidence from the DLHS-3 ............................................................................ 128 6.2.1 Health sub-centres ............................................................................................ 128
6.2.2 Primary health centres...................................................................................... 130 6.2.3 Community health centres ............................................................................... 133
6.3 Results and analysis of the qualitative data ............................................................. 137 6.3.1 Organizational factors ...................................................................................... 138
6.3.2 Contextual factors ............................................................................................ 144 6.3.3 Individual factors ............................................................................................. 149
6.4 Discussion ............................................................................................................... 150
6.5 Conclusions ............................................................................................................. 155
Chapter 7 Results: Effect of Health Worker Availability on Health Services Utilization
................................................................................................................................................ 157 7.1 Introduction ............................................................................................................. 157
viii
7.2 Results: Effect of health worker availability on health service utilization ............. 157
7.2.1 Health sub-centres ............................................................................................ 157 7.2.2 Primary health centres...................................................................................... 161
7.3 Community health centres ....................................................................................... 164 7.4 Results of the propensity score matching-based evaluation of the impact of new
health workers on healthcare service utilization ................................................................ 168 7.4.1 Results of the propensity score matching analysis for the 2nd ANM at HSCs . 168 7.4.2 Results of the propensity score matching analysis for the 2nd ANM at HSCs 174
7.5 Discussion ............................................................................................................... 180 7.6 Conclusions ............................................................................................................. 185
Chapter 8: Summary and Conclusion................................................................................ 187 8.1 Introduction ............................................................................................................. 187 8.2 Summary of the main findings ................................................................................ 187
8.3 Implications of the findings..................................................................................... 190 8.4 Limitations .............................................................................................................. 192 8.5 Future work ............................................................................................................. 194 8.6 Conclusion ............................................................................................................... 195
References ............................................................................................................................. 196
Appendices ............................................................................................................................ 221 Appendix 1: Participant Recruitment Letter .......................................................................... 252 Appendix 2: Participant Consent Form.................................................................................. 253 Appendix 3: Ethics Favourable Opinion................................................................................ 254
Appendix 4: Interview Guide for Medical Officer In-Charge at Primary Health Centre ...... 255 Appendix 5: Interview Guide for Medical Officers at the Community Health Centre ......... 258
Appendix 6: Interview Guide for Health Sub-Centre ANM .................................................. 261 Appendix 7: Interview Guide for Chief/Deputy Medical Officer of the District .................. 264
Appendix 8. Human resources in the rural health system in Sitapur ..................................... 273
ix
List of Tables
Chapter 2
Table 2. 1 Clinical manpower need for a Community Health Centre as recommended by
IPHS, 2010 ............................................................................................................................... 21
Table 2. 2 Non-clinical/support manpower need for Community Health Centre as
recommended by IPHS, 2010 .................................................................................................. 21
Chapter 4
Table 4.1 Sitapur district at a glance ........................................................................................ 58
Chapter 5
Table 5. 1 Average number of health workers available at Health Sub-Centres in India, 2002–
2012.......................................................................................................................................... 89
Table 5.2 Average number of health workers available at Primary Health Centres in India,
2002–2012................................................................................................................................ 90
Table 5.3 Average number of health workers available at Community Health Centres in
India, 2002–2012 ..................................................................................................................... 90
Table 5. 4 Proportion of HSC by total number of health workers in position in India and its
states, 2002–2012 ..................................................................................................................... 92
Table 5. 5 Proportion of health sub centres without health workers in Indian states in 2002–
2004 and 2012–2013 ................................................................................................................ 93
Table 5.6 Proportion of PHCs without a health worker and with six or more health workers in
India, 2002-2012 ...................................................................................................................... 97
Table 5.7 Proportion of PHCs without a lady health visitor and male health assistant, 2002-
2012.......................................................................................................................................... 98
Table 5.8 Proportion of PHCs without a doctor, 2002-2012 ................................................. 101
Table 5.9 Proportion of PHCs and CHCs without a staff nurse and public health nurse ...... 103
Table 5. 10 Proportion of CHCs without specialists, 2002–2012.......................................... 107
Table 5. 11 Decomposition of inter-HSC inequality by state ................................................ 113
Table 5. 12 Decomposition of inter-HSC inequality in distribution of different health workers
by state ................................................................................................................................... 113
Table 5. 13 Decomposition of inter-PHC inequality by state ................................................ 115
Table 5. 14 Decomposition of inter-PHC inequality in distribution of different health workers
by state ................................................................................................................................... 115
Table 5. 15 Decomposition of inter-CHC inequality by state ............................................... 117
Table 5. 16 Decomposition of inter-CHC inequality in specialists’ distribution by state ..... 117
Table 5. 17 Decomposition of inter-CHC inequality in nurses’ distribution by state ........... 117
Table 5. 18 Decomposition of inter-CHC inequality in doctors’ distribution by state .......... 118
Chapter 6
Table 6. 1 Descriptive statistics of the variables (n = 16,652) ................................................ 129
Table 6. 2 Incidence rate ratios (IRR) and 95% confidence intervals (95% CI) from
unadjusted and adjusted Poisson regression models for the availability of health workers at
health sub-centres in India, 2007–2008 ................................................................................. 129
Table 6. 3 Descriptive statistics of the variables, n = 8,159 .................................................... 131
x
Table 6.4 Incidence rate ratios (IRR) and 95% confidence intervals (95% CI) from unadjusted
and adjusted Poisson regression models with respect to the availability of health workers at
primary health centres in India, 2007–2008 .......................................................................... 132
Table 6.5 Descriptive statistics of the variables, n = 3,998 ..................................................... 134
Table 6. 6 Incidence rate ratios (IRR) and 95% confidence intervals (95% CI) from the
unadjusted and adjusted Poisson regression models with respect to the availability of health
workers at community health centres in India, 2007–2008 (n=3,998) .................................. 136
Chapter 7
Table 7.1 Distribution of sub-centres by health worker availability in India, 2007–2008 .... 160
Table 7.2 Unadjusted and adjusted incidence rate ratios showing the effect of nurse midwife
availability on the volume of antenatal care registrations at health sub-centres in India, 2007–
2008........................................................................................................................................ 160
Table 7.3 Unadjusted and adjusted incidence rate ratios showing the effect of nurse midwife
availability on the volume of postnatal care service utilization at health sub-centres in India,
2007–2008.............................................................................................................................. 160
Table 7.4 Distribution of health workers across PHCs .......................................................... 162
Table 7.5 Unadjusted and adjusted incidence rate ratios showing the effect of the availability
of different health workers on the volume of patients at primary health centres in India, 2007–
2008........................................................................................................................................ 163
Table 7.6 Distribution of community health centres by health worker availability, India,
2007–2008.............................................................................................................................. 165
Table 7.7 Unadjusted and adjusted incidence rate ratios showing the effect of the availability
of different health workers on the volume of patients at community health centres in India,
2007–2008.............................................................................................................................. 166
Table 7.8 Descriptive statistics by availability of a 2nd ANM in health sub-centres in India,
2007–2008.............................................................................................................................. 169
Table 7. 9 Estimated propensity scores.................................................................................. 170
Table 7.10 Estimates of the impact of a 2nd ANM on the number of antenatal care
registrations ............................................................................................................................ 170
Table 7.11 Estimates of the impact of a 2nd ANM on the number of women provided with
postnatal care ......................................................................................................................... 170
Table 7.12 Estimates of the impact of a 2nd ANM on the number of infants provided with
postnatal care ......................................................................................................................... 170
Table 7.13 Estimates of the impact of a 2nd ANM on the number of patients treated for minor
ailments .................................................................................................................................. 171
Table 7.14 Description of the sample used in the matching analysis .................................... 172
Table 7.15 Significance of the overall model ........................................................................ 173
Table 7.16 Sensitivity analysis for using Rosenbaum (2002) bounds for the variable ‘number
of patients treated for minor ailments’ at health sub-centres in India.................................... 174
Table 7.17 Descriptive statistics by the availability of AYUSH doctors in primary health
centres in India, 2007–2008 (n=7,381) .................................................................................. 175
Table 7.18 Estimates of the impact of an AYUSH doctor’s availability on the volume of all
patients treated ....................................................................................................................... 175
Table 7.19 Estimates of the impact of an AYUSH doctor’s availability on the volume of
female outpatients .................................................................................................................. 176

xi
Table 7.20 Estimates of the impact of an AYUSH doctor’s availability on the volume of male
patients ................................................................................................................................... 176
Table 7.21 Estimates of the impact of an AYUSH doctor’s availability on the volume of male
inpatients ................................................................................................................................ 177
Table 7.22 Estimates of the impact of an AYUSH doctor’s availability on the volume of
female inpatients .................................................................................................................... 177
Table 7.23 Description of the sample in the matching analysis ............................................ 178
Table 7.24 Significance of the overall model ........................................................................ 179

xii
List of Figures
Chapter 2
Figure 2. 1 Service delivery in public health system in India (Source: Author) ..................... 14
Figure 2. 2 Government healthcare system in rural India ........................................................ 16
Chapter 3
Figure 3. 1 Health worker centric framework for health system by Anand and Bärnighausen
(2012) ....................................................................................................................................... 23
Chapter 4 Figure 4. 1 Objectives, data and methods ............................................................................. 49
Figure 4.2 Map showing the distribution of health facilities in Sitapur .................................. 60
Figure 4.3 Health facilities chosen for the selection of interviewees ...................................... 62
Figure 4. 4 An example of the Lorenz curve ........................................................................... 74
Chapter 5 Figure 5. 1 Contribution of states to ‘between’, ‘within’ and ‘overall (total)’ inequality in the
distribution of health workers across health sub-centres, India, 2012–2013. ........................ 114
Figure 5. 2 Contribution of states to ‘between’, ‘within’ and ‘overall (total)’ inequality in the
distribution of health workers across primary health centres, India, 2012–2013. ................. 116
Figure 5. 3 Contribution of states to between, within and overall (total) inequality in the
distribution of health workers across community health centres, India, 2012–2013. ............ 119
Chapter 6 Figure 6. 1 Distribution of the dependent variable – number of health workers across primary
health centres ......................................................................................................................... 130
Figure 6. 2 Distribution of the dependent variable – number of health workers across
community health centres ...................................................................................................... 133
Chapter 7
Figure 7.1 Distribution of antenatal care registrations across health sub-centres in India,
2007–2008.............................................................................................................................. 159
Figure 7.2 Distribution of postnatal care serviced provided across health sub-centres in India,
2007–2008.............................................................................................................................. 159
Figure 7.3 Distribution of patients treated at primary health centres in India, 2007–2008 ... 162
Figure 7.4 Distribution of patients treated at community health centres in India, 2007–2008
................................................................................................................................................ 165
Figure 7.5 Common support for the 2nd ANM model ............................................................ 171
Figure 7.6 Reduction in the standardized bias before and after matching ............................. 173
Figure 7.7 Common support for the model ............................................................................ 178
Figure 7.8 Reduction in standardized bias before and after matching ................................... 179
xiii
List of Appendix Tables
Chapter 5
Table 5A. 1 Descriptive statistics and Theil’s T for sub-centres 2012–2013. ....................... 222
Table 5A. 2 Descriptive statistics and Theil’s T for primary health centres, 2012–2013. .... 222
Table 5A. 3 Descriptive statistics and Theil’s T for community health centres, 2012–2013 223
Chapter 6
Table 6A. 1 Variance inflation factors for sub-centre model ................................................ 224
Table 6A. 2 Results of the Park’s test for heteroscedasticity (health sub-centre model) ...... 224
Table 6A. 3 Results from split samples to validate final model for health sub-centres. ....... 225
Table 6A. 4 Variance inflation factor for primary health centre model ................................ 225
Table 6A. 5 Results from split sample to validate final model for primary health centres. .. 226
Table 6A. 6 Results of the Park’s test for heteroscedasticity (primary health centre model) 227
Table 6A. 7 Variance inflation factors for community health centres ................................... 227
Table 6A. 8 Results from split samples for validation of the final model for community health
centres .................................................................................................................................... 228
Table 6A. 9 Status of Human Resources (Specialists) at Primary Health Centres in District
Sitapur, Uttar Pradesh, July 2013 .......................................................................................... 229
Table 6A. 10 Status of Human Resources (Specialists) at Community Health Centres in
District Sitapur, Uttar Pradesh, July 2013 ............................................................................. 231
Chapter 7
Table 7A. 1 Distribution of health sub-centre characteristics, 2007–2008 (n=17,667) ......... 232
Table 7A. 2 Descriptive statistics for each variables (n=17,667) .......................................... 232
Table 7A. 3 Unadjusted and adjusted incidence rate ratios for the volume of antenatal care
registrations at health sub-centres in India, 2007–2008 (n=16,537) ...................................... 233
Table 7A. 4 Unadjusted and adjusted incidence rate ratios for postnatal care utilization at
health sub-centres in India, 2007–2008. (n=17,112) ............................................................. 234
Table 7A. 5 Variance inflation factors for the antenatal care utilization model. ................... 235
Table 7A. 6 Variance inflation factors for the postnatal care utilization model .................... 236
Table 7A. 7 Results of the Park test for heteroscedasticity (antenatal care model for the sub-
centres) ................................................................................................................................... 238
Table 7A. 8 Results of the Park test for heteroscedasticity (postnatal care model for the sub-
centres) ................................................................................................................................... 238
Table 7A. 9 Cross-validation of the final model of utilization of health services (antenatal
care registrations) at health sub-centres by comparing coefficient and t-values. .................. 239
Table 7A. 10 Cross validation of the final model of utilization of health services (postnatal
care) at health sub-centres centres by comparison of coefficient and t values. ..................... 240
Table 7A. 11 Descriptive statistics of variables, Primary Health Centres, India, 2007–2008
................................................................................................................................................ 241
Table 7A. 12 Unadjusted and adjusted incidence rate ratios for the volume of patients at
Primary Health Centres in India, 2007–2008 ........................................................................ 242
Table 7A. 13 Variance inflation factor and tolerance for the primary health centres model 243
Table 7A. 14 Results of the Park test for heteroscedasticity ................................................. 244
Table 7A. 15 Cross-validation of the final model of utilization of health services (number of
patients) at primary health centres by comparing coefficients and t-values. ......................... 245
xiv
Table 7A. 16 Descriptive statistics of the various variables, Community Health Centres,
India, 2007–2008 ................................................................................................................... 246
Table 7A. 17 Unadjusted and adjusted incidence rate ratios for the volume of patients at
Community Health Centres in India, 2007–2008 .................................................................. 247
Table 7A. 18 Variance inflation factor and tolerance for the community health centres model
................................................................................................................................................ 248
Table 7A. 19 Results of the Park test for heteroscedasticity ................................................. 249
Table 7A. 20 Cross-validation of the final model of utilization of health services (number of
patients) at Community Health Centres by comparison of coefficient and t values .............. 250
Table 7A. 21 Comparison of baseline characteristics between treated and untreated subjects
in unmatched and matched samples ....................................................................................... 251

xv
List of Appendix Figures
Chapter 6
Figure 6A. 1 Diagnostic plots for Poisson regression model for health worker availability at
health sub-centres in India, 2007-08 ...................................................................................... 224
Figure 6A. 2 Diagnostic plots for Poisson regression model for health worker availability at
primary health centres in India, 2007-08 (n=8159) ............................................................... 226
Figure 6A. 3 Diagnostic plots for negative binomial regression model for health worker
availability at community health centres in India, 2007-08 ................................................... 227
Chapter 7 Figure 7A. 1 Diagnostic plots for antenatal care model for health sub-centres. .................... 237
Figure 7A. 2 Diagnostic plots for postnatal care model for health sub-centres. .................... 237
Figure 7A. 3 Diagnostic plots for primary health centre model. ........................................... 243
Figure 7A. 4 Diagnostic plots for community health centre model. ...................................... 249

xvi
DISSEMINATION
Oral presentations:
1. Singh, A. (2015). ‘Improving utilization of maternity care: Is contractual ANM as effective
as ANM at health sub-centres in India?’ at 2nd Oxford International Health Conference 2015
organized by Hugh College, Oxford (UK), June 25–27, 2015.
2. Singh, A., Pallikadavath, S. (2014). ‘Shortage and inequalities in human resources for
health at the base of India’s public healthcare system’ at 10th World Rural Health
Conference organized by WONCA (World Association of Family Doctors) in Gramado
(Brazil), April 3–5, 2014.
Poster presentations:
3. Singh, A. (2016). ‘Supply-Side Barriers to Maternal Healthcare Utilization at Health Sub-
Centres in Rural India’ at British Sociological Association’s 48th Annual Medical Sociology
Conference, Aston University, Birmingham (UK), September 7–9, 2016.
4. Singh, A. (2016). ‘Shortage and distributional inequalities of specialists at Community
Health Centres in Uttar Pradesh, India’ at British Sociological Association’s 48th Annual
Medical Sociology Conference, Aston University, Birmingham (UK), September 7–9, 2016.
Peer-reviewed papers: (under review/accepted)
5. Singh A. (2016) Supply-side barriers to maternal health care utilization at health sub-centers
in India. PeerJ 4:e2675 [Thomson Reuters Impact Factor = 2.15]
6. Singh A. (2016). Shortage and inequalities in the distribution of medical specialists at
community health centres in Indian state of Uttar Pradesh, 2002-2012. (under review PLOS
One)
7. Singh A. (2017). Has the availability and distribution of staff nurses at community health
centres in Uttar Prasdesh during 2004-2013? (under review in Indian Journal of
Community Health)
Newspaper articles/unpublished articles
8. Singh A. (2013). NRHM in Uttar Pradesh exposes our sick public health system. Published in
Governance Now on 21st June 2013.
9. Singh A. (2014). Making maternity safer and affordable: Some issues and challenges in
implementation of Janani Suraksha Yojana in Sitapur (Uttar Pradesh). Published in
Swarajya on 16th January 2014.
10. Singh A. (2016). Health Sub-Centre buildings in Uttar Pradesh (India): a waste of public
money? Published in Governance Now on 15th November 2016.
11. Singh A. (2017) Parody of Health Mission. Published in Governance Now on 15th May 2017.

xvii
List of Acronyms
ANM Auxiliary Nurse Midwife
ANMTC Auxiliary Nurse Midwife Training Centre
ATE Average Treatment Effect
ATT Average Treatment Effect on Treated
ATU Average Treatment Effect on Untreated
AYUSH Ayurveda, Yoga, Unani, Siddha, and Homeopathy
BIC Bayesian Information Criteria
CANM Contractual Auxiliary Nurse Midwife
CHC Community Health Centre
CI Confidence Intervals
CRM Common Review Mission
DCMO Deputy Chief Medical Officer
DLHS District Level Household Survey
DPHN District Public Health Nurse
FRU First Referral Unit
HRH Human Resources for Health
HSC Health Sub-Centre
IFA Iron Folic Acid
IRR Incidence Rate Ratio
ISDT Integrated Skills Development Training
LHV Lady Health Visitor
LR Likelihood Ratio
LT Laboratory Technician
MHA Male Health Assistant
MHW Male Health Worker
MO Medical Officer
MPHW/MHW Multipurpose Health Worker/Male Health Worker
NHM National Health Mission
NRHM National Rural Health Mission
OLS Ordinary Least Square
PHC Primary Health Centre
PHN Public Health Nurse
PPS Probability Proportional to Size
PS Propensity Score
PSM Propensity Score Matching
RHS Rural Health Statistics
SBA Skilled Birth Attendance
SD Standard Deviation
SE Standard Error
SN Staff Nurse
UP Uttar Pradesh
UT Union Territories
VHSC Village Health and Sanitation Committee
VIF Variance Inflation Factor

1 Chapter 1: Thesis Introduction
1.1 Introduction
The main aims of this study are to examine the change in availability and inequality in the
distribution of health workers in publicly funded rural health facilities in India and to
examine their impact on the utilization of health services at these facilities. This chapter
introduces the current study. First, a statement of the research problem, along with its
background, is briefly presented. Then, the rationale for conducting this study is given. This
is followed by an outline of the main objectives and research questions, as well as by details
regarding the potential significance of the present study. The chapter concludes by providing
an overview and organization of the thesis.
1.2 Background and statement of the problem
Despite improvements in recent decades, life expectancy and other health status indicators in
India still remain well below most large, middle-income countries. With 257 maternal deaths
per 100,000 mothers, India ranks well below its neighbour, Sri Lanka (30), and even one of
the poorest countries in the world, Mongolia (207) (Hogan et al. 2010). With respect to the
prevalence of child malnutrition, India continues to fall behind its Asian neighbours, and it is
also lagging behind many sub-Saharan African countries According to the National Family
Health Survey, about 48% of Indian children under the age of 5 years were suffering from
undernutrition in 2005–2006 (Kumar & Singh 2013). Most health status indicators are worse
in rural areas than in urban areas (Paul et al. 2011).
In addition to the slow improvements in socioeconomic development and the poor progress
being made in the eradication of poverty, the continuing poor health status of people in India
has also been attributed to an inefficient and largely dysfunctional publicly-funded health
system (Banerjee et al. 2004). Over the past seven decades since its independence from
colonial rule, India has developed a vast network of public health facilities, even in the
remotest corners of the land (Bhandari & Dutta 2007). However, these health facilities, which
are funded by states and the federal government and run by state governments, have been
struggling to provide affordable and quality health services to the masses due to inadequate
infrastructure, shortages in and the irrational deployment of health workers, and an
inadequate supply of drugs and equipment (Barik & Thorat 2015). Apart from that, it is also
2
true that until recently, the approach to building an effective public health system has been
fragmentary rather than comprehensive; the focus of policies has mainly been on short-term
priorities such as family planning, disease (tuberculosis, malaria, and polio) eradication, and
other pressing issues (Shakarishvili et al. 2010). Hence, it is not surprising that health service
utilization at publicly-funded health facilities in India has remained considerably low
throughout the history of independent India.
In the year 2005, the Government of India started implementing a new set of comprehensive
health system reforms under the name ‘National Rural Health Mission’ to revitalize the
publicly-funded health system of rural India (for details of the organisational structure of the
publicly-funded rural health system, please refer to Chapter 2) (Dhingra & Dutta 2011).
Apart from integrating various health programs, the main aim of the program was to
strengthen the publicly-funded health system in rural India to provide accessible, affordable,
and quality healthcare to the rural population, especially to vulnerable groups (Sharma 2009).
To strengthen the system, the NRHM (known as National Health Mission (NHM) since 2013,
following the merger of rural and urban health missions) focused on improving the physical
infrastructure, increasing the availability of human resources, and ensuring a regular and
adequate supply of drugs and logistics.
Recognizing that providing healthcare is a labour-intensive task and that the effective
delivery of health services to the population is not possible without an efficient and capable
health workforce, the NRHM designed a number of ways to improve the numerical strength
and skill-mix of human resources at rural public health facilities (Rao et al. 2012). The
program provided financial support to the states in an effort to strengthen the health system
by recruiting nurses, doctors, and specialists on a contractual basis based on their
requirements. It provided additional incentives to serve in remote, difficult, and underserved
areas to attract health professionals to join public health facilities in these areas. It also
proposed to provide performance-based incentives to motivate healthcare workers to provide
better service (Rao et al. 2011).
Apart from that, the NRHM also regularly requested state governments to fill health worker
vacancies without delay. The central government also took several steps under the NRHM to
increase the availability of doctors. For instance, the mission envisaged to convert one-doctor
primary health centres into two-doctor primary health centres by placing an AYUSH doctor

3
(a doctor trained in traditional medicine systems—namely Ayurveda, Yoga, Unani, Siddha,
and Homeopathy—often abbreviated together as AYUSH) as the second doctor (Samal
2015a). It further proposed to equip health sub-centres (the lowest level of health facilities in
the hierarchy of the rural public health system) with an additional auxiliary nurse midwife,
although they had been previously managed by a single auxiliary nurse midwife (Malik
2009).
Apart from the shortage of health workers, the program also recognised the problem of the
irrational deployment of health workers across health facilities in rural areas; therefore, it
incentivized states to fill existing vacancies in remote rural areas to ensure a rational and
equitable deployment of the healthcare workforce (Lisam et al. 2015). To increase the
number of doctors, nurses, and midwives, the program also proposed reforms and additional
investments in medical education in the form of setting up new schools and institutes at the
national, regional, and state levels (R Sood & Singh, 2012). For the first time, the NRHM
produced a set of uniform standards regarding essential physical infrastructure, human
resources, drugs, and equipment that rural health facilities should follow in order to provide
effective service delivery. These norms are known as the Indian Public Health Standards
(IPHS) and are used as a benchmark for assessing the functional status of health facilities
(Ministry of Health and Family Welfare 2012h).
It has been more than a decade since the launch of the NRHM in 2005, and the time is ripe to
evaluate how the situation of health-related human resources in a rural public health system
has changed over time, whether the shortage of health workers has reduced, or whether HRH-
related IPHS norms are being fulfilled (Sharma 2009). Other questions include whether the
distribution of health workers across regions has become more equitable over time, whether
the introduction of contractual health worker has had a positive impact on health service
utilization at public health facilities in rural areas, and whether the deployment of AYUSH
doctors at a primary health centre helps improve health service utilization. These are some of
the human resources-related questions that need to be answered within the current healthcare
system.
A review of previous studies shows that most of the evaluation studies that have been
conducted by the government adopt sample sizes that are too small for generalization. For
instance, the government of India has been sending Common Review Missions (CRM) every
4
year in selected states to evaluate the progress of the program and its effect on service
delivery. However, CRM reports are based on only 5–10 health facilities from two to three
districts; this is too small a sample size, especially for bigger states where the number of
health facilities runs into the tens of thousands (Government of India 2013). Other studies
also have a very limited geographical scope. Moreover, these studies are cross-sectional in
nature and are thus limited to one point in time. What is needed is a study that compares the
situation before and after the NRHM was implemented. Although previous studies do claim
to examine the effect of additional health workers (contractual health workers and AYUSH
doctors), none have actually applied appropriate statistical techniques to evaluate the
independent impact of these interventions (Albert & Porter 2015).
Therefore, the main goal of the study is to examine how the availability and distributional
inequality of health workers has changed between the years 2002–2004 (pre-NRHM) and
2012–2013 (post-NRHM) across different levels of publicly funded rural health facilities in
India. It also explores the factors affecting the availability and distribution of health workers
across public health facilities. Further, this study examines the effect of the availability of
health workers on service utilization at the health facility level. It also examines the impact of
the newly deployed cadres – a 2nd ANM and AYUSH doctors – on health service utilization.
1.3 Study Rationale
There are a number of reasons that inspired me to conduct the present study. The first, and
perhaps the most profound of all, is related to the fact that government health services
typically have a mandate to provide a minimum set of services on the basis of equity. In
theory, the distribution of health system resources (for example, health workers) by
geographical locations and across health facility units should be equal. Any unfair
distribution of resources across health facilities or geographical units leads to what is often
referred to as territorial injustice and horizontal inequality which, in turn, could exacerbate
regional health inequalities (Kay 2005). With the introduction of the Indian Public Health
Standards for government health facilities in India, there are now clear recommendations
regarding the number and type of health workers that a particular type of public health
facility should have (Satpathy 2005). Therefore, in practice, there should be little or no
variation across health facilities. A previous study has found that variations in health worker
allocation in the lowest-run public health facilities do exist (Pallikadavath et al. 2013).
However, the evidence for health worker inequality in public health facilities is still weak and

5
the issue of health worker inequality in the publicly funded health system in India is still
largely unexplored (Anand 2010). It has been more than a decade since the IPHS norms were
first released in 2005, but no study has yet examined how health worker availability and
distributional inequality have changed since the NRHM was implemented.
Human resources for health is an understudied field within the larger field of healthcare
studies, particularly in India (Pallikadavath et al. 2013). This lack of attention has resulted
from the fact that in the past, the focus of academics and researchers has always been on
other components of the health system, such as finance, equipment, physical infrastructure,
etc. This is particularly true in contexts where there is a serious lack of research on human
resources for health, most likely due to the lack of publicly available data regarding
healthcare human resources (Jindal 2014). Although the central government has published
some basic numbers and statistics about the rural health system on an annual basis, including
some data about the availability of human resources as well, they are not very useful from a
researcher’s perspective, as these data are mostly aggregated at several different levels
(Nambiar 2012). Until a few years ago, India’s central government did not have any central
repository for the data on HRH in the country. Similarly, the states do not have any publicly
accessible HRH data repositories. The result is that, today, there is very little evidence related
to human resources for healthcare in India (Nandan & Agarwal 2012).
Since the research on HRH issues has been hampered in the past due to the lack of reliable
data, the measurement of shortages and inequalities in HRH has been a recent phenomenon,
especially in India (Anand 2010). Since India has a huge public healthcare system that must
cater to its vast population in rural areas, it is important for policymakers to know where, how
much, and what kind of human resources are lacking and how the problem of HRH shortage
and distribution can be rectified. This research not only examines the shortage and inequality
of HRH in India, but it also studies how the HRH shortage and inequitable distribution of
human resources is affecting the delivery of different health services.
Another important reason underlying why this study was conducted is that most studies
focusing on the measurement of the shortage of health workers in India have used global
norms and measures, such as health worker density and the nurse–doctor ratio (Basden 2008).
Such norms and measures may be suitable for a cross-country comparison, but they are not
useful for the Indian government or policymakers, as most of these studies also include
6
private sector health workers in their analyses. For a government or its policymakers, the
information on public sector health workers is what matters because that is where they can
intervene effectively.
Socio-economic health and healthcare utilization inequalities have been studied extensively
in India (Kumar & Singh, 2013; Pathak, Singh, & Subramanian, 2010; Sanneving, Trygg,
Saxena, Mavalankar, & Thomsen, 2013). One of the factors that deepen such inequalities
might be the unequal distribution of health workers. However, it is surprising that only one
study has examined the nature of distributional inequality in public sector HRH
(Pallikadavath et al. 2013). The distribution of existing health workers in the public health
system has not been measured systematically.
One might question why I have chosen to focus on the rural public health system. First, about
70% of the total population lives in rural India; if India wishes to improve its health
indicators, it must focus on rural areas (Office of the Registrar General and Census
Commissioner of India, 2011). A great proportion of the rural population still lives in poverty
and it cannot afford expensive private healthcare (Government of India 2014). In a recent
study, about 25% of rural residents reported that they have no funds for healthcare
(Binnendijk et al. 2012). A national survey reveals that more than two-thirds of all
households do not seek healthcare from public healthcare facilities due to the poor quality of
care. As a result, about 40% of hospitalized rural people have to borrow money or sell their
assets to pay for healthcare. About 35% fall below poverty lines due to out-of-pocket health
expenditures (Bonu et al. 2005; Leive & Xu 2008). Therefore, the only way to avoid poverty
induced by healthcare expenditures is to strengthen the public healthcare system.
I was born and brought up in a village in Northern India, one of the poorest regions in India.
This is a region where people still have to travel several kilometres to reach a nurse midwife.
My grandmother lost eight of her children, and my mum lost two of her children, simply
because they could not reach the nearest hospital, which was about 15 kilometres away.
Although faster modes of transport and good roads are now available, the situation has not
changed much as far as the availability of midwives is concerned. In fact, the situation is
actually worse than it was in the past. I have been told me that the village had only one
midwife back in 1985, and the number has not changed since then, despite the fact that the
population of the village has tripled. As a result, the burden on the midwife has increased

7
exponentially. Being a rural dweller, I have seen people suffering and dying because of the
shortage/absence of health workers at public health facilities. This is particularly true for
remote rural health facilities located in difficult and inaccessible areas. These unfortunate
experiences are among the reasons that pushed me to take up the issue of human resources for
health in rural healthcare systems in India as the topic for my doctoral research.
Moreover, this research is a continuation of my deep interest in health system issues that was
sparked during my university education. I worked to investigate inequalities in the
delivery/utilization of healthcare services during my MPhil course, which gave me an idea
about how the public healthcare system in rural India works and how it shapes health and
healthcare inequalities in rural society in general. This was the time when I became deeply
engaged in healthcare services research in rural India, and I published a few peer-reviewed
papers examining the demand side of healthcare utilization (Kumar & Singh, 2015; Singh,
Kumar, & Pranjali, 2014; Singh & Kumar, 2014). I have always wished to expand my
expertise on this issue and to look at how the supply side (health system components) impacts
healthcare delivery. As I continued to explore the supply-side factors affecting healthcare
utilization, I found that human resources for health, the most important of all components of a
health system, was still largely unexplored territory in the context of India. I continued to
deepen my interest in this area and finally prepared a research proposal to conduct a
systematic study of human resources for health in the public health system in rural India.
1.4 Aims and objectives of the study
The thesis thus aims to study the change in the availability of, and the inequalities in the
distribution of, health workers in the rural public health system of India. Additionally, it aims
to explore the factors that determine the availability and distribution of health workers at
public health facilities. It further aims to examine the how health worker availability affects
service delivery at public health facilities. More specifically, the objectives are as follows:
• To measure the shortage and distributional inequality of different health
workers across health facilities in the rural public health system of India.
• To examine the factors affecting the availability or non-availability of
different health workers in public health facilities in rural India.

8
• To examine the effect of human resource availability on service
delivery/utilization at the health facility level in the rural public health system
in India.
For achieving the aforementioned study aims, this investigation used both quantitative and
qualitative methods. The quantitative data came from three District Level Household Surveys
(DLHS) conducted in 2002–2004 (DLHS-1), 2007–2008 (DLHS-2), 2012–2013 (DLHS-3).
The qualitative data were collected from health workers and managers using semi-structured
interviews. The study used simple descriptive statistics and inequality indices to measure the
change in availability and inequality in the distribution of health workers from 2002–2012. It
used regression analysis (using DLHS-3 data) and thematic analysis to accomplish the second
objective, which explored the factors affecting health worker availability at public health
facilities. The third objective was accomplished by applying regression models and
propensity score matching analysis using the DLHS-3 dataset.
To achieve the targeted aims of the study, the research questions are as follows:
➢ How has the availability of health workers in public health facilities in rural India
changed from 2002–2012?
➢ How has the level of distributional inequality in the health workforce across public health
facilities in rural India changed from 2002–2012?
➢ What are the determinants of health worker availability and distribution across public
health facilities in rural India?
➢ Does the increased number of health workers (multipurpose health workers, doctors,
nurses, and allied health professionals) affect service utilization at publicly funded rural
health facilities in India?
➢ Does the availability of new health workers – a contractual 2nd ANM at health sub-centres
and an AYUSH doctor at primary health centres – increase healthcare service utilization
at their respective health facilities?
1.5 Potential significance of the study
The findings of this study call for improving the availability and equitable distribution of
health workers in public health facilities in India. Doing so may not only improve the
9
delivery of medical services, but it may also enhance the lives of the Indian people, as
improved public health services would drastically cut the burden of out-of-pocket
expenditures. It could also help these individuals save money and get out of poverty. It must
be noted that out-of-pocket healthcare expenses are currently very high in India, and a
substantial number of households plunge into poverty due to such high out-of-pocket
expenditures. Therefore, an improved public health system is the need of the hour. It may
reduce health inequalities, while improving the overall well-being of the people, ultimately
acting as a catalyst for economic growth.
Human resources for health represents an emerging field of study. In particular, the
measurement of inequality in the distribution of human resources is a fairly recent
development (Anand 2010). Therefore, it is not surprising that the volume of existing
literature and evidence on this issue in India is scant. To the best of my knowledge, this is the
first time that health worker inequalities in the rural public health system have been
measured. The importance of this study lies in the fact that it focuses on the rural public
health system, which is unlike previous studies that made no distinction between the public
and private sectors. This fact renders previous studies less useful for policymaking, as
policymakers largely deal with the public health system and have little to do with private
health services. Thus, the present study may prove to be a significant source of evidence for
policymaking efforts intended to improve rural health facilities.
Additionally, the study could prove useful for policymakers and other stakeholders who are
engaged with the public health system. One of the objectives of this study was to examine
whether any association exists between health worker availability and the volume of health
service utilization at public health facilities in rural India. The study also examined the
question of whether the deployment of new health workers under the NRHM (a 2nd ANM and
an AYUSH doctor) increased the volume of health services. It has been almost a decade since
the government decided to incorporate these health workers in the public health system in
order to fill vacant posts and ease the burden of other health workers (Samal 2013). The
number of these health workers in the system has increased during this period, and it may
have huge implications for India’s rural health system. A number of studies have found that
contractual workers are associated with lower productivity and poor job satisfaction (Kumar
et al. 2014; Kumar et al. 2013; Peters et al. 2010); however, to our knowledge, no studies
have evaluated the effect of a 2nd ANM (a contractual worker) on the delivery of healthcare

10
services in health sub-centres, although several studies have questioned the deployment of
AYUSH doctors in health facilities (Pillai & Agarwal 2015; Gopichandran & Kumar 2012;
Albert & Porter 2015; Shrinivasan 2015; Rao et al. 2013). Therefore, this study is probably
the first evidence in the country related to this issue, and it could prove useful for
policymakers to decide whether to continue inducting additional similar health workers into
the health system.
This study is important from a theoretical perspective as well. One of the aims of this study is
to examine the factors that shape the inequality of health worker distribution across rural
health facilities. The results from the qualitative analysis reveal a set of previously lesser-
known factors, such as politics and the corruption of ‘attachments’ and ‘transfers’. Thus, the
study adds a few more factors into the existing scheme of factors affecting the overall
distribution of health workers across public health facilities. Apart from this, the study offers
evidence in favour of a demand–supply framework regarding the utilization and provision of
healthcare (Ensor & Cooper 2004). In previous years, a number of studies have identified
numerous demand-side factors (socioeconomic and bio-demographic conditions of the
population seeking services) as important barriers to healthcare utilization in India. However,
surprisingly, only a few have truly addressed the supply-side barriers such as essential
supplies, medications, and human resources (Kumar et al. 2014). The contribution of this
study is that it has highlighted the effect of health worker availability on healthcare service
utilization in public health facilities, and it has reached a number of important conclusions
that could guide human resource decisions for health policies that affect public health
facilities around the country.
It is expected that this study may play an important role in inspiring further research in this
field. It has left many unanswered questions regarding the status of health worker availability,
distributional inequalities, and their impact on health service utilization in public health
facilities in rural India. Human resources for health is a matter for each state; thus, the factors
that contribute to health worker shortages could vary from state to state. Future research may
explore those factors that cause these shortages and the unequal distribution of health workers
in different states. This study has not explored urban public health facilities; therefore, future
studies may be needed to explore human resource issues in these facilities.

11
1.6 Organization of the thesis
The thesis is organized into seven chapters. The contents of each chapter are briefly described
below. The first chapter, as presented above, attempts to provide a brief summary to set the
scene for the thesis. This chapter highlights the statement of the research problem, the
rationale for conducting this study, and the study’s aims and objectives. This chapter also
identifies the research questions and significance of this study. The overview of this thesis is
provided at the end of Chapter One. Chapter Two provides an introduction to the hierarchy of
publicly funded health system institutions in India. It also discusses the norms of
establishement and staffing for rural health facilties.
Chapter Three provides a review of the literature on three the interrelated HRH issues that
were discussed above in the present chapter. It provides a brief overview of the evidence
regarding the HRH shortage and distributional inequalities around the world. It critically
assesses the benchmarks used for the assessment of this shortage and the methodology used
in previous studies to measure these inequalities. The second part of this chapter focuses on
the factors affecting HRH shortages and inequalities. It reviews a number of theoretical
frameworks used in previous studies to inform the choice of variables for the present study.
In the third and last part of this chapter, an attempt has been made to critically asses the
evidence regarding the association of health worker availability with the utilization of
healthcare services. This review includes studies from both developed and developing
countries.
Chapter Four describes the data and methods used for this study. It mainly discusses issues
such as the reason for selecting a mixed-methods approach, conceptualising and selecting the
most appropriate mixed methods, the challenges involved in that process, and the potential
utility of such design—i.e., the selected concurrent mixed-methods research design for the
current study. Since the study uses secondary data as its mainstay, the chapter describes the
problems associated with the availability of reliable secondary data on HRH in India. It also
delves into the reasons why such a lack of data on HRH is commonplace in the country.
Further in the chapter, accounts of primary data collection are given. The methods of analysis
chosen for different objectives are described at the end of this chapter.

12
Chapter Five is dedicated to achieving the first objective of the study. It presents the results
of the analysis of the availability of health workers in rural public health facilities (health
sub-centres, primary health centres, and community health centres) across states and how it
has changed since the NRHM was launched in 2005. The analysis used the data from two
time periods—2002–2004 and 2012–2013—to examine the availability of different types of
health workers. The chapter then provides the results of an inequality analysis. Health worker
inequality across health facilities was measured using the Gini and Thiel T Indices. Inequality
was measured during two time points (2002–2004 and 2012–2013) to examine the changes
over time. Further, the chapter presents the results of an inequality decomposition analysis
that was conducted to account for the sources of inequalities at a sub-national level.
Chapter Six presents the results of a regression analysis that was conducted to examine the
factors affecting health worker availability in rural health facilities. The chapter then presents
the findings of a qualitative (thematic) analysis that was carried out using data collected by
semi-structured interviews during the field visit. Before presenting the results of the
qualitative analysis, a brief discussion is provided about the HRH shortages and inequalities
in the Sitapur district of Uttar Pradesh Province—the areas where the field study was
conducted. Further in the chapter, the results of both analyses are integrated, discussed, and
compared against the backdrop of relevant literature.
Chapter Seven presents the results of a regression analysis that examined the association
between the number of available health workers in a facility and the volume of service
utilization. The analysis was carried out for all three levels of health facilities. The chapter
also provides the results of propensity score matching that was conducted to examine the
effects of the contractual 2nd ANM and AYUSH doctors on the utilization of healthcare
services at health sub-centres and primary health centres, respectively. At the end, a
discussion of the findings is presented.
Chapter Eight is the last chapter in the thesis and it presents an overview of the entire study.
The chapter first briefly details the significant findings of the study and it then discuss some
policy implications of the present study. The chapter then discusses the limitations of the
study. The chapter ends with some recommendations for conducting further research in the
field of human resources for health in the Indian context.
13
2 Chapter 2: Organization of the Health System in Rural India
2.1 Introduction
The main purpose of this chapter is to describe publicly-funded rural health system in India.
The chapter begins with an introduction to the health system governance in India. It then
provides the details of the hierarchical nature of health system institutions in India. This is
followed by a detailed description of rural health facilities, including their evolution, norms,
and staffing practices.
2.2 Current organization of the public healthcare system in India
In order to better understand the organization of healthcare in India, one needs to know a few
facts about the political organization of India. India, which is politically known as a Union of
States, has a Central Government; each State has its own government. The Indian
Constitution dispenses administrative and legislative powers between the States and the
Centre. The powers of legislation are listed under three basic lists viz. Union List, State List,
and Concurrent List. The Union List includes the tasks to be handled by the Central
Government of India, whereas the State List consists of the issues to be handled by the states.
The Concurrent List has items for which both the State and the Centre can legislate.
Health as an issue in India is the responsibility of the State Government (Chandra et al.
2013). The Central Government can also intervene to assist the state governments in the area
of control/eradication of major communicable and non-communicable diseases, medical and
paramedical education combined with regulatory measures, drug control and prevention of
food adulteration, Child Survival and Safe Motherhood (CSSM), and the immunization
programme. Many such interventions from the Central Government have emerged in the last
60 years, and these interventions generally take the form of targeted programs that address
HIV/AIDS, mental health, or cancer-related programs; these are collectively known as
National Health Programs (NHP).
There is a hierarchical healthcare system in the country, which ranges from the national level
to the village level (see Figure 2.1). This service organization can be described under the
following headings.
2.2.1 Central Level
This level is the highest on the hierarchical ladder of health service organizations in India.
This level consists of the Union Ministry of Health and Family Welfare with its three

14
departments, viz. the Department of Health and Family Welfare, Department of Ayurveda,
Yoga–Naturopathy, Unani, Siddha & Homeopathy (AYUSH), and Department of Health
Research; each of these is headed by a secretary.
Figure 2. 1 Service delivery in the public health system in India (Source: Author)
2.2.2 State level
Health services at the State level fall under the State Department of Health and Family
Welfare in each State, which is headed by a Minister. The Secretariat is under the charge of
the Secretary/Commissioner (Health and Family Welfare). The State Directorate of Health
Services, as part of the technical wing, is an office that is attached to the State Department of
Health and Family Welfare; it is also headed by a Director of Health Services. The medical
education program, which is under the jurisdiction of the Directorate of Health Services of
the State, is known as the Directorate of Medical Education and Research. This Directorate is
National Level Ministry of Health and Family Welfare (Medical colleges, NIHFWs and AIIMS)
State and UTs levelDepartment of Health and Family Welfare (State medical colleges and SIHFWs)
Districts level
District Hospitals
Urban Areas
Hospital
Dispensary
Rural Areas
Community Health Centre
Primary Health Centre
Sub-Centre
Village-level Functionary

15
under the charge of the Director of Medical Education, who answers directly to the Health
Secretary/Commissioner of the State. Some states have created the posts of Director
(Ayurveda) and Director (Homeopathy). These officers enjoy greater autonomy, although
they sometimes still fall under the Directorate of Health Services of the State.
2.2.3 District Level
All healthcare programs in a district are placed under unified control. This serves as the link
between the State/regional-level structures and the peripheral-level structures, such as the
PHCs/sub-centres. The Chief Medical and Health Officer or the District Medical and Health
Officer (popularly known as DMOs or CMOs) are responsible for health program
implementations within the districts. These DMOs/CMOs are assisted by Deputy CMOs and
program officers. Each district features District Hospitals, which act as referral centres for all
health facilities in the district.
2.2.4 Community Level
Within in a district, urban and rural areas have hospitals and health centres. Urban areas have
urban primary health centres and dispensaries, while rural areas have a three-tiered health
system. A detailed description of these health facilities is given below, as these are the health
facilities that serve as the unit of analysis in this study. Figure 2.2 provides a glimpse of the
hierarchical structure of the rural health system.
2.2.5 Health Sub-Centre
The HSC represents the lowest level in the hierarchy of the publicly funded primary
healthcare delivery system in India; the overall performance of the healthcare system thus
certainly depends on the progress made by these health facilities. They act as the first formal
contact point between the community and the public healthcare delivery system. It is also the
most peripheral unit of the primary health system, and it is further engaged in providing basic
health services to village communities in the rural parts of India.
The main purpose of an HSC is to deliver preventive and promotive care; however, it also
provides some basic curative care to the community it serves. Some of the important services
include antenatal, natal, and postnatal care services, as well as family planning, counselling,
and the treatment of common illnesses, like respiratory tract infections, diarrhoea, fever, and
worm infestations. HSCs also take the initiative to prevent malnutrition and they implement
various national- and state-level health programs through frontline workers like Auxiliary

16
Nurse Midwives (ANMs), Accredited Social Health Activists (ASHAs), Aanganwadi
Workers (AWWs), and Male Health Workers (MHWs).
Figure 2. 2 Government healthcare system in rural India (Source: Author)
2.2.5.1 Indian Public Health Standards and Health Sub-centres
Indian Public Health Standards (IPHS) provide the guidelines for the functioning of HSCs
and they prescribe the standards that must be achieved and maintained to ensure an
acceptable quality of service delivery. It is expected that formally defining standards would
help monitor and improve the functioning of HSCs across the country. The newly revised
IPHS (2012) for HSCs has categorised services, infrastructure, manpower, equipment, and
drugs into two categories: Essential (minimum assured services) and Desirable (the ideal
level of service provision that the states and UT will try to achieve).
2.2.5.2 Population norms for the establishment of an HSC
HSCs are established per population norms – there is one HSC for every 5,000 individuals in
the population in plain areas, and one HSC per every 3,000 individuals in the population in
hilly/tribal/desert areas. However, the uneven distribution of the population in this country
does not always allow HSCs to be established per the guidelines. In such cases, the
establishment of an HSC depends on the case load of the facility and the distance of the
village/habitations that comprise the HSC. New guidelines have emerged from program-
based evaluations of the expected number of beneficiaries of maternal and child healthcare,
immunization, family planning, and other services.
Community Health Centre (CHC) Population served: 80,000-1,20,000
Primary Health Centre (PHC) Population served: 20,000-30,000
Health Sub Centre (HSC) Population served: 3,000-5,000
• A 30-bed hosital or referral unit for 4 PHCs with specialised services
• Manned with 6 general-duty doctors, 6 specialists, and 19 nurses
• A referral unit for 6 sub-centres, 4-6 beds
• Manned with 4 doctors, 5 nurses, 1 ANM, and 14 subordinate para-medical staff
• The most peripheral contact point between the PHC system and the community
• Manned with 1 male health worker and 2 female health workers (ANMs)

17
2.2.5.3 Standards for staffing
The IPHS 2012 expects each HSC to have at least two female health workers, known as
ANMs, and one male health worker (MHW). Apart from these workers, an additional female
worker who will assist the ANMs and keep the centre clean and tidy has been recommended;
however, it is optional that states keep this worker. If an ANM wishes to keep such a worker,
she has to pay a sum of Rs.100 per month from the contingency fund allocated to her for
HSC development.
The feedback provided through the interactions with Female Health Workers/ ANMs was
obtained in the revised version of the IPHS, and it was found that a wide spectrum of services
that HSC Staff were expected to provide were already being delivered. However, the
outcomes of health indicators did not match the services that were being provided. An
additional ANM, apart from one male health worker and one ANM, was recommended in the
revised IPHS for all HSCs to ensure the delivery of a full range of services and to foster
better outcomes (Ministry of Health and Family Welfare 2012h).
The IPHS 2012 guidelines also made it clear that due to the uneven population density, it is
not always possible or worthwhile to have equal numbers of workers at all facilities. The
number of HSCs and ANMs should depend on the facility’s case load, as well as on the
distance of the village/habitations that comprise the HSC. It also prescribes an additional
ANM that will be added onto the existing HSC, if the population of the village is above
5,000. In such cases, an additional HSC would not be mandatory; rather, an additional ANM
could be added for every additional 5,000 members of the population.
In the areas where the PHC and CHC are located, the population that falls within the
immediately surrounding area would be served by the HSC located within larger facilities
(i.e., HSC staff for that area would be in close vicinity of, or co-located with, the same
campus; Ministry of Health and Family Welfare 2012h).
ANMs and other staff at the HSCs are not the only ones who alone at the grassroots level;
there are community workers, like ASHA (Accredited Social Health Activists) and AW
(Aanganwadi Workers), who help the ANMs deliver various healthcare services. There are 5
to 7 ASHAs working under one HSC; however, this is not a set standard. This may vary
depending on the size of the population served by each HSC. Since ASHAs are not formally
part of the staff at the HSC, they will not be included in the analysis in this chapter.

18
2.2.5.4 Functions of health workers at HSCs
ANMs, who are the most important workers at the HSCs, take care of most of the service
delivery related to government-based maternal and child programmes. ANMs foster
awareness about family planning methods, as well as their advantages and disadvantages, and
they try to get people to accept these methods. ANMs’ other duties include IEC (information,
education, and communication) activities related to the medical termination of a pregnancy,
RTI/STI, HIV/AIDS, and nutrition. They immunize children and pregnant women. They keep
records of vital events and disease cases in the specific catchment area, and they also
maintain registers at the HSC regarding drugs and other amenities. An ANM treats minor
ailments and refers cases to higher-level facilities when situations are beyond her control.
Apart from aforementioned activities, she works as a facilitator for the ASHA and helps LHV
with training Dais in her area.
MHWs at the HSCs are responsible for making door-to-door visits to inquire about various
diseases and fevers. Collecting information about cases and taking the primary steps to
control Filaria, leprosy, blindness, and tuberculosis in his catchment areas is his
responsibility. He also identifies cases of communicable diseases and immediately refers
them to medical officers at the PHC. He administers vaccines and helps the ANMs immunize
pregnant women and children.
MHWs disseminate knowledge of family planning to the village community, and they
distribute conventional and oral contraceptives to couples, while promoting their use,
especially among males. He also provides follow-up services for male acceptors, and in cases
that are beyond his capacity, he refers them to the PHC or to a higher-level facility.
2.2.6 Primary Health Centre (PHC)
The PHC is the second rung from the bottom in the hierarchy of public- or state-owned
healthcare facilities in India (the lowest being the HSC). Indian Public Health Standards
(IPHS 2012) designates them as the cornerstone of rural health services and the first port of
call to a qualified doctor of the public sector in rural areas for the sick and for those who
directly report or referred from Health Sub-Centres for curative, preventive and promotive
health care (Directorate General of Health Services 2012).
2.2.6.1 Population norms for the establishment of PHCs
PHCs have been established per population norms, particularly since the 6th five-year plan
was declared. The IPHS (2010) recommends establishing one PHC for every 30,000

19
members of the population in plain areas, and one per every 20,000 in the population in
hilly/tribal/desert areas. A PHC acts as a referral unit for 6 sub-centres, and they refer cases to
the CHC (a 30-bed hospital) and higher-order public hospitals located at the sub-district and
district level.
2.2.6.2 Indian Public Health Standards (IPHS) norms for staffing
Pre-IPHS norms originally only needed 15 workers at the PHC, which was subsequently
increased to 17 by the IPHS 2006, and then to 23 by the IPHS 2010. Increases in the numbers
of required health workers were due to increases in the numbers of staff nurses, medical
officers, laboratory technicians, and pharmacists. The number of staff nurses increased from
one to five; instead of only one medical officer (MO), the IPHS recommended four MOs,
including one AYUSH practitioner or any practitioner from the Indian System of Medicine
(ISM). It was also suggested that it should not be compulsory to have a permanent driver at
the PHC; drivers should be optional and vehicles may be outsourced ( Directorate General of
Health Services 2012).
2.2.7 Community Health Centre
This healthcare institution was envisaged to function as a referral centre for four PHCs, while
also catering to the needs of the people as a rural hospital. CHCs are being established and
maintained by the State Government under the Minimum Needs Program. A CHC is
supposed to cater to a prescribed norm of 80,000 to 120,000 individuals in rural areas. Under
this scheme, it was decided that each CHC should have four specialists, one with a
specialisation in each of the following fields of medicine: surgery, paediatrics, and
gynaecology. Besides, a CHC should also be equipped with facilities like 30 beds for indoor
patients, a laboratory, an X-ray machine, and so on.
The functions of CHCs include regular and outpatient services; inpatient services;
comprehensive family welfare services (i.e. surgical and non-surgical); obstetric,
gynaecological, and specialised services including labour room services to tackle high-risk
pregnancies; surgical services; specialised medical and paediatric services; laboratory
diagnostic services; X-ray facilities; National Health Programmes; maternal care and child
healthcare; immunisation services, etc.
2.2.7.1 Norms for staffing the CHC
The CHCs were established as per population norms since their inception in the 5th five-year
plan declaration. One CHC (a 30-bed hospital) works as referral unit for four PHCs and 24

20
SCs. The IPHS (2010) needs one CHC for every 120,000 members of the population in plain
areas and one per 80,000 members of the population in hilly/tribal/desert areas.
Four medical specialists (i.e., a surgeon, physician, gynaecologist, and paediatrician),
supported by 21 paramedical and other staff members, man the CHC. The IPHS established
guidelines for the CHCs in 2006, where the minimum requirement for medical specialists was
4, and the proposed number was 6 or 7 (see Table 2.1). Newly added personnel included an
anaesthetist and a public health program manager. On the other hand, the number of
paramedical/support staff at the CHC was 23 or 25, including a public health nurse (see Table
2.1) (Sodani & Sharma 2011).

21
Table 2. 1 Clinical manpower needed for a Community Health Centre, as recommended by the IPHS, 2010
Personnel Essential Desirable
Block Health Officer 1
General Surgeon 1 1
Physician 1 1
Obstetrician/Gynaecologist 1 1
Paediatrics 1 1
Anaesthetist 1 1
Public Health Program Manager 1 1
Eye Surgeon 1 for every 5 CHCs 1
Dental Surgeon 1
General Duty Medical Officer 6 (at least 2 female doctors)
Specialist of AYUSH 1
General Duty Medical Officer of AYUSH 1
Part-time Cancer Surgeon 1
Total 15/16 17/18
Source: IPHS 2010 Guidelines draft, MOHFW, GoI.
Table 2. 2 Non-clinical/support manpower needed for a Community Health Centre, as recommended by IPHS, 2010
Personnel Essential Desirable
Staff Nurse 15 18
Lady Health Visitor (LHV) 1
Public Health Nurse (PHN) 1
ANM 1
Pharmacist/Compounder 3
Pharmacist – AYUSH 1
Lab. Technician 3
Radiographer 2
Dietician 1
Ophthalmic Assistant 1
Dental Assistant 1
Cold Chain and Vaccine Logistics Assistant 1
Dresser (certified by Red Cross/St. John’s) 2
Ward Boys/Nursing Orderly 5
Sweepers* 5
Chowkidar (Watchman)* 5
Dhobi (Washer man) * 1
Mali (Gardener)* 1
Aaya (Female attendant) * 5
Peon* 2
OPD Attendant* 1
Registration Clerk 2
Statistical Assistant/Data Entry Operator 2
Trained cooks as per hospital dietary requirements 2
Account/Admin Assistant 1
OT Technicians 1
Multi-Rehabilitation Worker/Community 1 2
Counsellor 1
Driver* 3
Total 65 75
Source: IPHS 2010 Guidelines draft, MOHFW, GoI.
Note: *Outsourced.
22
3 Chapter 3: Literature Review
3.1 Introduction
This chapter provides a review of the literature of the recent research conducted on the issues
of shortage and inequality of human resources for health (HRH) around the world. The
review then summarizes the previous research on the factors that shape health worker
availability and distribution in rural areas, and it finally details the emerging evidence of the
linkage between health worker availability and healthcare utilization. The chapter begins by
briefly informing the reader of how HRH, as an issue, has taken the centre stage in the field
of health and healthcare studies. Before moving on to the issues of distributional inequality in
the health workforce, it briefly touches upon the shortage of health workers (including
doctors and nurses). Further in the review, it sheds light on the issues of measuring HRH
inequality. The chapter then provides a review of the literature of various factors affecting the
availability and distribution of health workers, covering a range of studies from both
developed and developing countries. The final part of the review discusses the evidence
regarding that links HRH availability and healthcare utilization, and it attempts to identify a
research gap in light of the NRHM strategies that aim to improve the situation for HRH in the
publicly funded rural health system of India.
3.2 Who is a health worker?
In order to evaluate how many health workers are available and how many more are needed,
one must precisely define who a health worker is. According to Diallo et al. (2003), all
people engaged in the promotion, protection, or improvement of the health of the population
are health workers (Diallo et al. 2003). Although this is a comprehensive definition, it might
include a number of people such as family members looking after the sick, volunteers, unpaid
caregivers, health studies professors, and researchers who are not part of a health system in
the strictest sense. Even everyone working within a health system is not a ‘health worker’.
The workers engaged in health management and support staff (clerks, ambulance drivers,
accountants, gardeners) should not be counted as ‘health workers’ (Poz et al. 2006). For the
purpose of the present study, health workers have thus been defined as those who are directly
involved in the provision of healthcare. These include doctors, nurses, and allied health
professionals (pharmacists, radiographers, and laboratory technicians).

23
3.3 The growing importance of health workers
Today, health workers are considered to be an utmost priority within a health system.
However, this was not the case before, especially in the last quarter of the 20th century. A
review of the health system frameworks proposed during last three decades reveals that none
of these frameworks place health workers at the centre of a health system. For example, in
Evans’ actor framework (1981), health workers are perceived as one of the ‘transactors’ in
the healthcare market (Courtney 2005; Langwell et al. 1980; Lin et al. 1997). Hurst (1991)
considers them as a ‘recipient of payments’ in the health system (Hurst 1991). Further, in the
1990s, Frenk (1994) and Cassels (1995) called them ‘actors’ and one of the ‘institutional
components’ of a health system, respectively. Only in the early years of current decade was
the HRH placed at the centre of the health system. Anand and Bärnighausen (2012), in their
‘system framework’, put health workers at the core of the health system, arguing that all
health systems work through health professionals to achieve their goals; this framework
fosters a better understanding of health system functions and performance in relation to
health system goals (Anand & Bärnighausen, 2012) (See Figure 3.1).
Figure 3. 1 A health worker-centric framework for health systems by Anand and Bärnighausen (2012)
As noted above, the issue of health workers/human resources for health (HRH) has been
largely ignored across national and international forums until the dawn of the 21st century.
However, in the new century, there is increasing awareness at the national, regional, and
international levels regarding the critical impact that the supply, distribution, and quality of
24
the health workforce may have on the achievement of health and health system goals (Chen
et al. 2004). For instance, in January 2004, the High-Level Forum on the Health Millennium
Development Goals (MDGs) stated, ‘There is a human resources crisis in health, which must
be urgently addressed’. Later in the same year, the Joint Learning Initiative (JLI) – a
consortium of more than 100 health leaders – declared that the HRH was the most critical,
but also the most neglected and overlooked, factor driving health system performance.
Further, in 2006, the World Health Organisation devoted its entire annual report, also known
as the World Health Report, to highlighting the global crisis of HRH (World Health
Organization 2006).
3.4 Health worker shortage
The concept of a health worker shortage depends on the number of health workers considered
adequate. The World Health Organization uses an arbitrary minimum threshold of 2.5 health
workers (doctors, nurses, midwives) per thousand individuals in the population (Chen et al.
2004). This threshold has become popular in research studies, and most country-level studies
have been using it for quite some time. In a public health system where health facilities are
mandated to have a fixed number of health workers, a shortage would occur if the availability
of health workers falls below the fixed number of health workers that should be in place. For
instance, in India, the number and type of health workers that public health facilities ought to
have is mandated by the Indian Public Health Standards (IPHS) (Government of India 2006).
Since the present study deals with rural public health facilities in India, if the available
number of health workers at a health facility is less than the number recommended by the
IPHS, the facility would be considered to be suffering from a shortage of health workers.
The severe shortage of health workers across the countries has been recognized as one of the
most critical constraints to achieving health and development goals. The crisis is weakening
the delivery of essential, life-saving interventions such as immunizations, safe maternity
services for mothers, and access to preventive measures and treatments for many deadly
diseases such AIDS, malaria, and tuberculosis. Health workers are also important for the
global security threats posed by emerging and epidemic-prone diseases such as SARS, avian
flu, and Zika virus. Without urgent action, the shortage will worsen, health systems will be
weakened even further, and health goals will not be achieved.
25
The shortage of HRH is not a new issue, as nursing shortages were reported in US hospitals
as early as 1915 (Friss 1994). Hence, there is no dearth of studies examining the availability
and shortage of HRH, especially in the developed world. A review of the evidence on health
worker shortages in different countries clearly suggests that this issue is prevalent almost
everywhere, in some form or another. Shortages also exist at the sub-national level as well.
Although health worker density in developed countries is high, there are often health worker
shortages. For instance, Canadian government officials have voiced concerns over the
shortage of nurses, which is estimated to grow to about 60,000 nurses by 2022 (Tomblin
Murphy et al. 2012). The situation in developing countries is even direr. The continent of
Africa harbours about 25% of the global burden of disease, but it has only employs 1.3% of
global health workers. It is a continent of contrasts. On the hand, Africa has countries like
South Africa and Egypt, which are well above the WHO threshold of health professionals
(i.e., 2.5 health workers per 1,000 people). Severe shortages have been reported in Botswana
(Sinha & Onyatseng 2013), Guinea Bissau (Lopes et al. 2014), Ghana (Asante & Zwi 2009),
Kenya (Wakaba et al. 2014), Sudan (Federal Ministry of Health 2012), and Mauritania
(Ogilvie et al. 2007).
India has also been facing health worker shortages since its independence in 1947. Many
studies have raised concerns about the shortage of health workers recently. According to one
study, the density of doctors in India is 6.0 for a population of 10,000, and that of nurses and
midwives is 13 per 10,000, which represents 11.9 health workers for a population of 10,000
(WHO 2010). India finds itself ranked 52nd out of the 57 countries currently facing an HRH
crisis. Based on cumulative data from comparative time periods (2001–2005), the NCMH
reported that in 2005, India had a doctor population ratio of 2.1 per 10,000 people compared
to 3 in Thailand, 4 in Sri Lanka, 16 in China, 54 in the United Kingdom, 55 in the United
States of America, and 59 in Cuba.
What is important to recognize is that most of the studies conducted in India have used
different definitions and benchmarks to calculate the shortage of health workers. For instance,
Hazarika (2013) used a health worker density measure, which is a measure based on the
number of health workers per 1,000 people. It is a widely-used indicator of HRH shortages,
particularly since the WHO, along with a number of studies, had reached the conclusion that
a minimum of 2.5 health workers per 1,000 people must be available to reach the established
Millennium Development Goals (MDGs). In 2006, the World Health Report declared that 57
countries fell below the threshold density of 2.5 health workers per 1,000 individuals. Since
26
then, this threshold density has become the standard with which to compare the situation of
HRH across countries (World Health Organization 2006).
In a country like India where both public and private health systems exist, it is important to
study them separately, as their motives are different. The private health sector is motivated by
profit, while the public health system is focused on providing affordable healthcare access to
all. Most previous studies have not made any distinctions between public or private health
facilities when estimating the shortages. While estimating the overall shortage of health
workers in a country could be useful from a policy perspective, it has often been seen that
policymakers and governments have little control over the private sector, which means it
cannot be manipulated by the government. However, public health facilities are under the
direct control of the government, and it holds full authority and the power to manipulate these
facilities as and when it wants for the greater public good. It is clear from the review of
previous studies that only a few studies have looked at the shortage of health workers across
public health facilities (Government of Uttarkhand 2009; Nandan et al. 2015; Government of
India 2010c; Government of India 2010b; Sodani & Sharma 2011). This could be due to a
false perception that policymakers can take care of the public health system, so there is no
need to look into worker shortages in public health facilities.
It is important to remember that public health facilities play an important role in providing
affordable healthcare to people, and they can bridge the growing socioeconomic inequalities
in access to healthcare if proper steps are taken. There was a general perception that public
health facilities have been under-resourced, which is why the NRHM was launched in 2005.
It has been more than a decade now since it was first launched. Evaluation studies have been
conducted, but they focus more on health outcomes than health system improvements. The
government of India has been conducting evaluation studies of the NRHM at regular
intervals; however, most of these studies feature a very small sample size. For instance, the
Common Review Missions (CRM), a team of experts sent by the Central Government to the
States to evaluate any progress made in the NRHM programs, have based their evaluations on
one point in time, and they have selected only one or two facilities within a district. Their
entire report is based on not more than three to four CHCs (Ministry of Health and Family
Welfare 2010a).
Similarly, The Concurrent Evaluation of National Rural Health Mission (CE-NRHM), which
the researcher was once a part of, was conducted in only a few selected states. The sample

27
size of this study was very small as well, and the focus was on the question of whether health
outcomes had improved or not. Similarly, there exist a number of small-scale primary studies,
which are most frequently based on a sample of five to ten health facilities in a district. For
instance, a study by the Indian Institute of Management Ahmedabad, which examined the
problem of specialist shortages in CHCs, included only two districts from each of the four
states in the sample (Iyengar & Dholakia 2015). The problem with these studies is that they
are so small that their findings cannot be generalized.
3.5 What is health worker inequality?
Inequality is defined as an unfair situation where some individuals, groups, or areas in society
have more resources than others. The presence of inequality goes against the basic notions of
fairness and justice (Sen 2002; Whitehead 1991). Health worker inequality occurs when
health workers are distributed unequally across areas or groups or people. The underlying
idea is that the allocation of health workers should be equal, but for some reason, it is not.
The most common way to measure inequality is to compare the number of health workers per
capita across districts or other local administrative units (Brown, 1994; Theodorakis,
Mantzavinis, Rrumbullaku, Lionis, & Trell, 2006).
The inequalities or imbalances in health workers can be of many types, such as
profession/specialty imbalances (e.g., shortages of one type of specialist, doctor, or nurse),
geographical imbalances (when the inequality in health worker distribution occurs across
regions, districts, or other local administrative units), institutional imbalances (when
inequality is related to differences in health workforce endowment between healthcare
facilities), public/private imbalances (when the imbalance is associated with differences in
human resource allocation between the public and private healthcare system), and gender
imbalances (when there are disparities in the female/male representation in the health
workforce) (Zurn, Dal Poz, Stilwell, Adams, et al. 2004).
3.6 Why measure health worker inequality?
The term ‘health inequality’ has become a buzzword recently among health researchers and
policymakers all over the world. A plethora of studies in the past have measured health
inequalities, and they have also studied how these inequalities arise and are perpetuated and
exacerbated. Concerns over persistent inequalities in health outcomes across individuals and
social groups have been expressed across both the developed and developing worlds. Since
health systems play an important role in maintaining and improving population health, equity

28
in those health system inputs (such as human resources, finance, physical infrastructure,
equipment, drugs, etc.) that are important for delivering and managing health services is an
issue of immense interest. However, a review of past studies suggests that majority of them
have focused on the inequalities in access (Balarajan, Selvaraj, & Subramanian, 2011; Davis,
1991; Grover & Citro, 2011; Luo, Zhang, Jin, & Wang, 2009; Pallikadavath, Foss, & Stones,
2004; Viegas Andrade, Noronha, Singh, Rodrigues, & Padmadas, 2012), utilization (Kumar
& Mohanty, 2011; Pathak & Mohanty, 2010; Saxena, Vangani, Mavalankar, & Thomsen,
2013; Singh et al., 2012; Singh, Kumar, & Pranjali, 2014), and financing of health services
(Omrani-Khoo et al. 2013; Porto 2002; Horev et al. 2004; Jin et al. 2015). Furthermore, a
number of studies in both developing and developed countries has also examined the
inequalities in physical infrastructure, such as patient beds (Asl et al. 2015; Geravandi et al.
2015; Meskarpour-Amiri et al. 2014; Nishiura et al. 2004). Little attention has been paid to
inequalities in human resources for health, especially in developing countries, despite the
argument that health workers are now considered to be the most important among all
components of a health system (Anand 2010).
Tackling inequalities in health outcomes is an important part of the agenda at the
international level, and it has been a major challenge for policymakers around the world in
recent times (Gupta et al. 2003; Gravelle & Sutton 2001). It is believed that inequalities in the
supply, deployment, and composition of health workers represent one of the factors that
results in inequities in the effective provision of health services; this ultimately exacerbates
inequalities in health outcomes. Thus, health worker inequality is a serious impediment in
achieving important national and international health- and development-related goals, such as
Sustainable Development Goals and Universal Health Coverage (Phiri 2007; World Health
Organization 2015).
In addition, inequalities in health worker distribution also contribute to the wasting of scarce
resources. For instance, an excessive concentration of health workers in urban settings has
appears to contribute to the overutilization or inappropriate use of services such as the over-
prescription of drugs or laboratory tests (Edson Araújo & Maeda 2013). Inequalities in health
worker distribution also seem to have a number of other adverse consequences on health
system performance, such as lower quality and productivity of health services, the closure of
hospital wards, increased wait times, a reduction in the number of available beds for patients,
the diversion of emergency department patients, and underutilization of remaining personnel,
29
or personnel substitutions by those who lack the required skills to perform critical
interventions (Gupta et al. 2003).
3.7 Measurement of health worker inequality
There are a number of indicators that measure health worker inequality. Previous studies have
used various indicators to estimate the incidence and extent of health worker
shortages/surpluses. Zurn et al. (2008) grouped these indicators into four main categories:
employment indicators, activity indicators, normative population-based indicators, and
monetary indicators. Employment indicators include vacancies and health worker-specific
employment rates. Activity indictors include overtime (this may be not a good indicator in
situations where overtime is a deliberate policy). Normative population indicators, such as the
number of doctors per 1,000 members of the population or the number of nurses per 1,000
members of the population, have been used extensively (Munga et al. 2009; Hazarika 2013;
Rao et al. 2011).
A number of studies conducted around the world have investigated the various disparities
across geographical space or spatial units, e.g. between urban and rural regions, between poor
and rich regions, or between administrative or epidemiological regions. A number of studies
in the developed world were conducted to measure distributional inequalities in HRH across
geographic spaces. One of the primary concerns of these studies has been the geographic
distribution of physicians in North America (Blumetithal 1994; Yang & Huh 1989; Mick et
al. 2000; Rosenthal et al. 2005; Hicks & Glenn 1989; Krishnan 1992; Escarce et al. 2000;
Matsumoto, Inoue, Bowman, Noguchi, et al. 2010; Matsumoto, Inoue, Bowman & Kajii
2010; Rosenblatt et al. 2015), Europe (Theodorakis & Mantzavinis; Mantzavinis et al. 2003;
Gravelle & Sutton 2001; Goddard et al. 2010; Isabel & Paula 2010), and Africa (Anyangwe
& Mtonga, 2007; Munga & Mæstad, 2009; Olsen, Ndeki, & Norheim, 2005)
Some studies have examined the geographical distribution of specialists such as
paediatricians (Snyder 2008; Chang & Halfon 1997; Randolph & Pathman 2001; Sasaki et al.
2013), oncologists (Kirkwood et al. 2014; Aneja et al. 2012), radiologists (Tanikawa et al.
2012; Matsumoto et al. 2015; Smieliauskas et al. 2014), surgeons (Snyder 2008; Sirinek et al.
2014), and dentists (Lo & Wong 1999; Teusner 2005; Teusner et al. 2007; Susi &
Mascarenhas 2002; Hashim Nainar & Feigal 2004; Wall & Brown 2007; Krause et al. 2005).
Studies focusing on the geographic distribution of anaesthetists (Orkin 1976), cardiologists
(Aneja et al. 2011), and nurses (Courtney 2005; Langwell et al. 1980; Lin et al. 1997) are

30
relatively fewer in number. It must be noted that most of the aforementioned studies come
from the developed world, including countries such as the United States, the United
Kingdom, Japan, and Australia. Only a few investigations have been from developing
countries. None of the HRH studies from India have explored the geographic distribution of
HRH, except for one that examined the inequalities across the states of India using Theil’s
index (Anand 2010).
Besides, a number of studies suggest that health workers – especially highly skilled
professionals – concentrate in urban and affluent areas rather than in rural areas. Rural–urban
differentials in HRH distribution are not a characteristic pattern for developing countries
alone (van Rensburg 2014); in fact, it has been argued that no countries have yet been able to
solve the problem of the rural–urban imbalance in the health workforce (Zurn, Dal Poz,
Stilwell & Adams 2004). Numerous studies show that rural–urban differentials in the
distribution of the health workforce exist in many developed countries. For instance, in
Portugal, the physician-to-population ratios were found to be higher for the metropolitan
areas of Lisbon and Oporto than for non-metropolitan areas. Only 39.7% of all doctors in
Portugal reside in the rest of the country (Russo, Ferrinho, de Sousa, & Conceição, 2012).
The situation is not much different in the developing world. For example, in Nicaragua, more
than 50% of the health workforce is concentrated in its capital city (Nigenda & Machado
2000). Similarly, in Bangladesh, about 30% of nurses and 35% of doctors are concentrated in
four metropolitan cities where only 14.5% of total country’s population live (Ahmed et al.
2011; Hossain & Begum 1998). In Sudan, the doctor-to-population ratio in urban areas
(Khartoum) is 24 times that of rural areas (of the South), and the nurse-to-population ratio is
20 times higher than in rural areas (Abuagla, Yousif, & Badr, 2013).
However, even though India is a huge country demographically, and given that the condition
of its health system may have some implications on internationally agreed upon health- and
healthcare-related goals, such as sustainable development goals, the rural–urban differential
in HRH still remains one of the most understudied HRH issues in an Indian context. There
exists only one study that has examined the issue of HRH distribution across the rural–urban
stratum (Anand 2010); however, the estimates presented in this study conducted by Anand
(2010) are for all health workers, without discriminating between public and private sector
health workers. Such estimates may not be very useful from the policymakers’ point of
views, as unsegregated estimates cannot be used to frame policies for the public healthcare
system in rural areas, which is where 69% of the Indian population resides.

31
Inequalities in health workforce availability across the healthcare facilities of a given health
system have been studied as well (Zurn, Dal Poz, Stilwell & Adams 2004). Generally, health
facilities have set norms for staffing; therefore, there is little scope for inequality to occur.
However, in the case of developing countries where there are always a number of ways to get
around the rules, it is possible that health workers become posted to those health facilities that
are more accessible to them, or that are located in or near urban areas, or have more
educational and recreational facilities (Dussault & Franceschini 2006).
However, evidence to support the argument that inequalities in the distribution of HRH exist
across the public health facilities in rural areas is meagre, especially in India where, to the
best of my knowledge, there were no studies conducted on this topic until 2013, which is
when a study examining HRH inequalities in health cub-centres (a health facility at the
bottom of the health system) across India states and districts was published in the journal
Health and Place (Pallikadavath, Singh, Ogollah, Dean, & Stones, 2013). The study found
substantial inequalities in HRH availability across health sub-centres in India states. Further,
it decomposed the overall inequality and found that most inequalities were ‘within-state’
inequalities (71%) in terms of health workers’ distribution. ‘Between-state’ inequalities
explained the remaining 29%. The scope of this study was limited, as it studied only health
sub-centres. Thus, the two upper echelons of the rural Indian public health system, i.e.
primary health centres and community health centres, are still unexplored.
Summarising the above review of studies, it can be said that, although there is an abundance
of studies examining the availability and shortage of health workers internationally, the
shortage and inequality in HRH still remains an understudied issue in India. The review
reveals a number of gaps. Most of the previous studies on India have focused on estimating
the number of health workers for the entire country without discriminating between private
and public sector health workers. Since the main aim of public policymakers is to improve
the publicly funded health sector, and not the private sector (as it takes care of itself through
market forces), the unsegregated estimates are often not very useful to policymakers as they
do not reveal anything about the situation of the public sector health workforce. Similarly, the
indicators that have been generally used to measure the adequacy of HRH, such as the
number of doctors or nurses per 10,000 people, do not reveal anything about the situation of
private and public sector HRH. Since the government can directly intervene in the public
sector to improve service delivery, policymakers often require information on whether the

32
HRH in government health facilities are adequate, and whether the existing HRH are
equitably distributed.
As mentioned above, past HRH studies in India have examined HRH shortages using the
WHO norm of 2.5 health workers per 1,000 people in the population, which is a good
practice, as it helps to make comparisons between two or more countries. However, this is the
least useful for policymakers who are trying to focus on fixing a public health system. India
has recently published its own norms/standards, known as Indian Public Health Standards
(IPHS), for staffing in public health facilities. These standards are now considered to be the
benchmark for evaluating the adequacy of HRH in the public healthcare system. Therefore,
there is a need to reassess HRH availability, while keeping the IPHS norms in mind. Besides,
none of the studies in India have examined temporal changes in HRH situations, especially in
the context of the NRHM. None of the studies, except one, have looked exclusively at rural
public health facilities to analyse the inequalities in HRH distribution, despite the fact that
these rural public health facilities serve 69% of the total population of India.
3.8 Factors affecting the availability and distribution of human resources for
health
There could be multiple factors influencing a health worker’s decision to relocate, stay, or
leave a post in an area or institution. These could be complex and interconnected factors,
linked to health professional’s characteristics and preferences, related to health system
organization and a wider social, political, and economic environment (WHO 2010). Most
commonly reported factors include: inappropriate pre-service training for rural and remote
area practices, a lack of prospects for further training and career development, low salaries,
poor working environments, limited availability of equipment and drugs, insufficient family
support, inadequate management, and unsupportive supervision (Grobler et al. 2009). These
have been described as “pull” and “push” factors. The “pull” factors are those that attract
health professionals for a given post/location (higher income or possibility of practicing in
the private sector, improved working and living conditions, etc.). The “push” factors are
those that may coercively influence the health workers’ decisions to not take up a post in a
remote location and not to remain there (Lehmann et al. 2008a).
Many other studies have tried to group these factors under different headings. For example,
Willis-Shattuck et al. (2008), in a systematic review of African and Asian countries,
identified a few factors that could motivate those in the health workforce to make certain
33
decisions that shape the overall distribution patterns of health workers in an area. These were
financial (salary or allowances), carrier development, further education (having the
opportunity to take classes and attend seminars), health facility infrastructure (physical
conditions often described as a work environment), resource availability (equipment and
medical supplies), management (refers to having a positive working relationship with the
management with whom the health workers work), personal recognition or appreciation
(either from managers or colleagues in the community), housing allowances, job security,
personal safety, staff shortages, and social factors (such as the effects on family life) (Willis-
Shattuck et al. 2008). The factors identified by previous studies can be categorised into
individual, organizational, and contextual factors.
3.8.1 Individual or personal factors
Individual characteristics of a health worker, such as his or her place of origin (rural or
urban), gender, marital status, ethnicity, age, personal values and beliefs, familiarity with the
rural context, attitude towards work, self-esteem, etc. have a significant impact on their
employment decision. The way that these factors influence health professionals’ decisions to
work in rural areas may vary according to the individual’s age and career stage (Lehmann et
al. 2008a). A considerable amount of literature discussing various personal and lifestyle
factors hails from developed countries. Recently, a number of studies from developing
countries have also shed light on how these factors work in low-resource settings.
Studies have shown that younger nurses are more likely to leave their jobs for career
advancement purposes (Camerino et al. 2008; Camerino et al. 2006). A study in Singapore
found no association between marital status and the intention to leave work, or the decision to
actually leave the job. Marriage brings family responsibilities and, in most settings, women
are more affected by marriage than men. Many studies have showed that nurses with no
kinship responsibilities, such as dependent children or relatives, are more likely to stay in a
given job (Hayes et al. 2012). In South Asian settings, a study in Malaysia concluded that the
migration of an individual also depends on the attributes of the spouse. The findings highlight
that male mobility is primarily economic in motivation, while a woman’s decision to move is
influenced by fertility or family considerations (Smith & Thomas 1998).
The impact of gender on employment decisions is complex and requires a careful
understanding of the underlying motivations and social contexts: for example, job mobility
for women appears to be more likely to be influenced by family considerations, while for
men, mobility is guided more strongly by economic reasons in Malaysian contexts (Smith &
34
Thomas 1998). Altruism, religious beliefs, and socio–political convictions are also other
personal factors that may influence the decision to work in rural or remote areas.
Preferences for rural practice also depend on the type of living conditions that the health
professionals were used to (Morell et al. 2014). However, whether medical students from
underserved areas will return to these areas is still being heavily debated in the literature.
There is a growing body of literature to suggests that health professionals born and bred in
rural areas are more likely to return to rural practice (Dussault & Franceschini 2006;
Lehmann et al. 2008a).
3.8.2 Community, local environment, and local living conditions
These factors are also known as contextual factors. Living facilities (housing, electricity,
water, sanitation, access to market); proximity to one’s home town and a school for children’s
education; physical safety and security; connectivity; community activities; entertainment
facilities; social circles; and language and cultural affinity are some of the local factors that
affect an individual’s decision to work in a rural health facility (Ramani et al. 2013).
Community support and appreciation towards health workers have also been identified as
important pull factors.
Housing has been highlighted by many studies as one of the most important considerations by
health workers when choosing a rural health facility (Kruk et al. 2009; Ramani et al. 2010;
Ramani et al. 2013). A study in India found that government-provided accommodations in
rural areas are often decrepit and lack maintenance and running water. Doctors demand that
quarters be within the premises of the health centre, or at least close by, with around-the-
clock water, electricity, and proper toilets (Ramani et al. 2013). A study in Africa found that
doctors perceive good housing conditions to be of utmost importance when making decisions
about joining rural health services (Kotzee & Couper 2006).
Similarly, a lack of quality schooling for children is also frequently quoted as one of the
reason for not joining/leaving rural health services (Kadam et al. 2012; Ageyi-Baffour et al.
2013). Since rural areas lack such schools, health workers are not willing to join rural
services. The study found that some doctors were willing to take up rural stints before their
children started formal schooling, but not afterwards (Kadam et al. 2012).
Safety has been recorded as a major concern for health workers joining rural health services.
A lack of proper security lighting and safety features in housing/accommodation provided by
the government makes health workers vulnerable to violence, thefts, burglaries, etc. For

35
nurses, personal security, both at the workplace and at home, is of importance. Health
workers working in remote areas often face challenges due to a lack of knowledge about the
community and culture (Opie et al. 2010). Misunderstandings and miscommunication often
lead to workplace violence (Boyle et al. 2007). Workplace violence in rural health facilities
has also been recorded as one of the reasons why health workers are often unwilling to join
rural services in several countries (Rao et al. 2010).
Proximity to family and relatives is another important factor that governs the location of a
health worker. Proximity involves working in the same areas in which their families lived, or
being able to physically live with their families. In many developing countries where social
and family ties are considered to be of utmost importance, health workers often choose to
work in health facilities that are close to their family homes (Rao et al. 2010; Ramani et al.
2013). However, it has been found that health workers are often ready to travel even a few
hundred kilometres, if they are given the proper travel allowance (Rao et al. 2010; Ramani et
al. 2013; Ramani et al. 2010).
Poor connectivity and a lack of transportation also contributes to the existing crisis facing the
rural health worker force (Asante & Zwi 2009; Edson Araújo & Maeda 2013; Kruk et al.
2009; Lehmann et al. 2008a; Ramani et al. 2013; Snow et al. 2011; WHO 2010). Road
conditions in rural and remote areas are often poor, and travelling consumes a lot of time.
Public transport is generally non-existent and, hence, the use of private vehicles becomes
necessary. Transport allowances are sometimes very little in comparison to the actual amount
spent on travelling. Such push factors actually repel the workforce from rural and remote
areas (Snow et al. 2011; Ramani et al. 2010).
Cultural barriers, such as language and ethnicity, have also been recorded as important
predictors of health workers’ decisions to stay or leave the area (Kanchanachitra et al. 2011;
Ojakaa et al. 2014; de Vries & Reid 2003; The Britain-nepal Medical Trust 2010; Fóti 2012).
The lack of language training centres in remote areas has been found to be one of the reasons
why nurses in Nepal do not join rural and remote health services (The Britain-nepal Medical
Trust 2010). Rural communities in many countries such as India often do not offer enough in
terms of entertainment and a social life, and there is always a sense of isolation and boredom
for those health workers who are used to an urban lifestyle. The lack of peer groups and
entertainment facilities (going to restaurants, pubs, clubs, malls, and theatres) is often an
important determinant of the job choices health workers make (Ramani et al. 2013).

36
3.8.3 Working conditions and organizational environment
It has been pointed out that the shortage of health workers in rural and remote areas is more
significantly affected by problems of retention rather than recruitment (Dussault &
Franceschini 2006). In other words, while a significant number of health workers could be
initially recruited to these posts, they do not generally stay for long, and high turnover rates
affect their overall availability. Rural and remote health facilities are often poorly equipped
and inadequately supplied with drugs, the physical working conditions are severe, and staff
members are poorly supported or supervised, and they often feel isolated and neglected
(Chhea et al. 2010). Doctors in remote areas in Ghana, for example, have identified the sense
of “professional isolation” to describe their working conditions; they highlighted the lack of
mentoring, an inability to contact peers to discuss cases, and an inability to share their
experiences as major problems (Snow et al. 2011).
The availability of clinical infrastructure – equipment, drugs, ambulance, operation theatre
facilities, and basic laboratory testing kits, etc. – was found to be an important factor
affecting job preference (Ageyi-Baffour et al., 2013; Araújo & Maeda, 2013; Chimwaza et
al., 2014; Dussault & Franceschini, 2006; Kruk et al., 2010; Lehmann et al., 2008; Mullei et
al., 2010; Ojakaa et al., 2014; Rao et al., 2010; Snow et al., 2011; The Britain Nepal Medical
Trust, 2011; Willis-Shattuck et al., 2008; WHO, 2010; Zurn et al., 2004). A lack of clinical
infrastructure actually makes cadres feel limited in their capacity to use their skills and serve
the community. A lack of medicine, essential drugs, and equipment sometimes leads to harsh
comments and rude and violent behaviour by members of the public. Such incidents
definitely demotivate health workers and force them to leave rural health centres (Dieleman
et al. 2006; Kotzee & Couper 2006; Manongi et al. 2006; Ssengooba et al. 2007). The
provision of high-quality physical infrastructure, like tables, chairs, cupboards, air
conditioning, and toilets (with running water in those toilets) is also deemed necessary by
rural health workers (Ramani et al., 2013).
A large number of previous studies has found that recognition or appreciation, either from
managers, colleagues, or the community, are among the most important motivating factors
for health workers (Dieleman et al. 2006; Franco et al. 2004; Manongi et al. 2006; Mathauer
& Imhoff 2006; Ssengooba et al. 2007). The feeling of being valued and trusted among the
community has been cited as crucial for high motivation (Willis-Shattuck et al. 2008). When
workers are ill-treated, not adequately supported, and their efforts are not recognized by
managers, they feel demotivated. Negative interactions with other staff members or
37
colleagues have also influenced health workers’ decisions to leave their jobs. In several
instances, even a preventable death causes severe demotivation to carry on with their present
job (Chimwaza et al., 2014). Low motivation has a negative impact on the performance of
health workers, facilities, and the health system as a whole. It adds to the power of push
factors, and it ultimately leads to the migration of health workers to different areas, regions,
states, or countries (Mathauer & Imhoff, 2006).
The lack of support staff burdens health workers (doctors and nurses) with additional work
that they are not supposed to do, such as cleaning the premises (Goma et al. 2014; Manongi
et al. 2006). A study from Malawi noted that the lack of staff often leads to situations where a
single person (nurse or doctor) has to attend different wards, sections, and swarms of patients
alone. In some cases, patients sometimes get anxious and start shouting and threatening the
staff. This often happens in case of maternal deaths. Such incidents demoralize health
workers; sometimes, these health workers end up thinking about leaving their jobs
(Chimwaza et al., 2014).
3.8.4 Motivation, incentives, and career growth opportunities
Career development opportunities are basically located in urban centres; therefore, health
workers do not prefer to work in rural and remote areas. Many studies indicate that health
workers are motivated when they feel that they have the opportunity to progress. A study
conducted in India reported that among allopathic doctors, becoming a specialist was highly
prized. Almost all undergraduate doctors in this study were keen to study towards a
postgraduate degree. Given that a job in primary care is considered to be less respectable than
a job in an urban health centre, doctors often decided not to join rural services (Ramani et al.
2013). Therefore, salaries and other financial benefits, such as scholarships, play an important
role in the decision to relocate to rural and remote posts.
It has been argued that financial benefits should be expanded to incorporate the “ability to
generate income” rather than the salary differential only. The possibility of generating
income in a second employment (private practice, for example) may be more influential than
the income generated during primary employment. The evidence suggests that access to
continuing education (professional courses and workshops) is limited to those not working in
urban settings (Chhea et al. 2010). Moreover, as those working in rural and remote areas are
often overloaded, they have a limited amount of time to dedicate to these activities, if they are
available.

38
The absence of senior posts in rural areas, the lack of recognition from managers, and slower
career progression are other factors associated with the feeling of “professional
imprisonment” identified by those working in rural and remote posts in Ghana (Snow et al.,
2011). Transparency in the staff deployment system is also an important factor; health
professionals may be willing to practice in rural areas, as long as the period for the
assignment is defined and complied.
3.8.5 National and international contexts and migration
In some countries, it has been found that out-migration of the health work force is a major
determinant in the availability of adequate numbers of health workers in the health system
(Stilwell et al. 2004; Hongoro & McPake 2004). A large number of nurses from Africa
emigrate every year. A recent study of migration trends among Sub-Saharan Africa-trained
physicians found that migration increased from 2002 to 2011 for all countries except South
Africa (Tankwanchi et al. 2013). Nurses seem to emigrate in many cases due to better
professional development opportunities, quality of life, and personal safety (Kingma 2001). A
recent study in Pakistan sheds light on the most common reasons why medical graduates
want to migrate to other countries. Some of the reasons noted by this study are a lucrative
salary abroad, followed by quality of training, job satisfaction, a better way of life, relatives,
more opportunities, better working environment, terrorism, a desire to settle abroad, peer
pressure, longer working hours, and favouritism in Pakistan (Sheikh et al. 2012).
Overall shortages are commonly aggravated by skewed distributions within countries, as well
as by the movement of health workers from rural to urban areas, from public to private
sectors (for-profit and not-for-profit), or to jobs outside the health sector. Contributing factors
include insufficient investment in pre-service training, migration, work overload, inadequate
growth opportunities, and work environment issues (World Health Organization 2006). As
the number of health professionals is set at uniform levels for each type of health facility,
without considering epidemiological conditions, a lower share of health professionals in
certain health facilities generates inequalities in human resources and service provision.
It can be concluded that there exists a plethora of literature on the factors that affect HRH
availability or unavailability of workers in a health system. However, the studies on this issue
in India are few and far between. Most of the previous studies are qualitative in nature and all
of them are based on small samples; hence, their results may not be robust and cannot be
generalized for the whole country. Thus, there is a need to conduct a study that considers the

39
entire country, while examining the factors that affect the decisions of health workers to stay
or leave a facility which, in turn, affects the availability of health workers at a health facility.
3.9 Health worker availability and healthcare service utilization
Policymakers in many developing and developed countries are grappling with low health
service utilization and poor health outcomes. India is no exception. According to the most
recent estimates, India is among the countries with highest rates for malnourishment for
children under five years of age; it also has high rates of child mortality, maternal mortality,
and other pregnancy-related complications (The World Bank 2012). India contributes to one-
fifth of the global burden of absolute maternal deaths despite implementing a variety of safe
motherhood programs in the last three decades (Hogan et al. 2010). Maternal healthcare
utilization is still low compared to other counties in Asia that have huge socioeconomic and
geographic inequalities (International Institute for Population Sciences 2010). Similarly, the
universal immunization of children is still a dream. A lot of children still die because of
childhood diarrhoea (International Institute for Population Sciences 2010).
In the last decade, although India has pumped in a vast sum of financial resources to
strengthen the public healthcare system by expanding its network of health facilities in rural
areas under the ‘National Health Mission’ program, which was previously known as the
National Rural Health Mission (NRHM), the utilization of healthcare services still remains
abysmally low and it is often marked by substantial socioeconomic and geographical
inequality (Bahadur 2010). For instance, in 2011, the rate of institutional delivery was less
than 60% in as many as 170 districts. This is despite the fact that a large share of health
spending has been devoted to maternal and child health issues in the wake of Millennium
Development Goal deadlines (Office of Registrar General of India 2011).
One of the factors that determine the health of a population is the provision of health services.
Hence, it is important to understand the factors that could affect both the utilization and
provision of healthcare. These factors can be understood by a demand–supply framework
(Ensor & Cooper 2004). In a demand–supply framework, demand-side determinants are
defined as those factors that influence demand and that operate at the individual, household,
or community level. In contrast, supply-side factors are characteristics of the health system
that exist beyond the control of potential health service users, such as the quality and quantity
of health facilities, drugs, equipment, finance, human resources, geographic distance, etc.
(Peters et al. 2008). All of these interact with each other to produce effective healthcare
services.

40
Quantifying how the availability of human resources (doctors, nurses, and other health
professionals and workers), drugs, medical equipment, infrastructure, and staff training in
public health facilities affects the utilization of health services is important because the
government has full control over the provision and allocation of resources to equip its health
facilities (Kumar et al. 2014). It can bring about major changes through interventions, which
is not possible for the private sector, as this is where the government has little or no power to
change anything. In recent years, many countries have abolished user fees or provided
financial incentives to those seeking maternity care, as this increases the demand of health
services; however, whether the health facilities are adequately equipped with the resources to
meet this increased demand is not well understood. For instance, an evaluation of the Indian
conditional cash transfer program for pregnant women, Janani Suraksha Yojana (JSY), has
found that while the volume of deliveries has increased, the facilities also faced drug,
equipment, and health worker shortages (Sharma et al. 2009). Therefore, it is essential to ask
an important question: To what extent does the alleviation of these constraints (supply-side
factors) result in improved health service utilization, and how should these constraints be
prioritized?
A number of studies in the past have identified several demand-side factors as important
obstacle to healthcare utilization, especially in developing countries (O’Donnell 2007; Ensor
& Cooper 2004; Kesterton et al. 2010; Sarma 2009); however, only few have truly addressed
the supply-side barriers (Metcalfe & Adegoke 2013). A study in Egypt found that facility
quality variables were more influential in the uptake of intrauterine devices at public health
facilities than demographic or geographic characteristics (Hong et al. 2006). Although several
studies in the past have documented the shortage of drugs, equipment, physical infrastructure,
finance, and human resources for health across the world, including India, to the best of my
knowledge, the evidence about how supply-side factors, especially the availability of human
resources, affects service provision in public healthcare facilities is still very thin (Kumar &
Dansereau, 2014).
The relationship between the availability of health workers and the coverage of health
services has been explored by several studies in the past. For instance, the link between the
availability of doctors, nurses, and midwives across countries, as well as intervention
coverage (the percentage of deliveries with skilled birth attendance and the proportion of
children fully immunized against measles) was explored by Chen et al. (2004), and by Anand
and Bärnighausen (2004), who also examined its relationship with maternal, infant, and

41
mortality among those under 5 years of age. These analyses show that health status and levels
of coverage are positively associated with health worker density, which is defined as the
number of health workers per 1,000 members of the population (Anand & Bärnighausen
2004).
Chen et al. (2004) go a step further and suggest that countries with fewer than 2.5 health
workers per 1,000 members of the population were very unlikely to achieve minimum
desirable levels of coverage (80%) for skilled birth attendants and measles immunization.
Speybroeck et al. (2006) found a statistically significant relationship between the aggregate
density of health workers and coverage for both measles immunization and skilled birth
attendants, even including a larger set of poor countries in the analysis. This remained true
even after controlling for other possible determinants. However, when the health worker
density was disaggregated into doctor and nurse densities and entered separately into the
analysis, the results reversed: the density of doctors was significantly correlated with measles
coverage, while nurse density was not. They also repeated the analysis by Chen et al. (2004)
and found that countries with fewer than 2.28 health providers per 1,000 members of the
population are unlikely to achieve the minimum target level of 80% coverage (Speybroeck et
al. 2006; Chen et al. 2004).
A study by Mitchell and co-workers (2008) examines HRH densities and coverage of the
Expanded Programme on Immunization (EPI) during the period spanning 2000 to 2006 in
Turkey. The findings revealed that the combined density of physicians, nurses/midwives, and
health officers is significantly associated with vaccination rates, independent of provincial
female illiteracy, GDP per capita, and land area, although the association was initially
positive and turned negative over time. The HRH–vaccination rate relationships differs as a
function of health worker availability, with the availability of physicians and health officers
exhibiting significant relationships that mirror those for aggregate density ;meanwhile,
nurse/midwife densities are not consistently significant HRH densities that hold stronger
relationships with vaccination coverage among the more rural provinces, particularly when
compared to those with higher population densities (Mitchell et al. 2008).
Kurk and co-workers (2009) performed cross-national analyses of low- and middle-income
countries by means of ordinary least squares regression with coverage rates of antenatal care,
attended delivery, caesarean section, measles immunization, tuberculosis case diagnosis, and
care for acute respiratory infection as outcomes. Doctor, nurse, and aggregate health worker
(sum of doctors and nurses) concentrations were the main explanatory variables. Doctors and

42
nurses, when considered together as a single cadre, were found to be associated with the
utilization of skilled birth attendants and measles immunization, but not with four other
essential service viz. antenatal care, TB case diagnosis, care for respiratory infection, and
caesarean section. However, nurses were found to be significantly associated with skilled
birth attendant coverage, while doctors were related to measles coverage in the disaggregated
analysis (Kruk et al. 2009).
Hazarika (2013) recently studied the effect of health workforce densities on measles
immunization coverage in India. He used data from the Indian Ministry of Statistics and
Program Implementation. He found that the combined density of doctors and nurses was
significantly associated with measles vaccination coverage. However, when the effects of the
density of doctors and the density of nurses were estimated separately, doctor density did not
turn out to be statistically significant, while nurse density did (Hazarika 2013). Acharya and
Cleland (2000), in their study on healthcare services in Nepal, found that the number of
professional staff was significantly associated with antenatal care utilization. The utilization
among those women who lived near a health post where the available number of professional
staff members was, as per sanctioned posts, 2.5 times higher than among those who lived
near health posts where the available number of professional staff was less than the
sanctioned number of posts. The same was true for the BCG vaccine as well. A number of
socioeconomic and health system factors were controlled in this analysis (Acharya & Cleland
2000).
Datar et al. (2005), using data from the first two rounds of the National Family Health
Survey, studied immunization coverage in India and found that the availability of a village
health guide (VHG) or a trained birth attendant (TBA) was not associated with significant
changes in non-polio vaccine coverage. The presence of an Angandwadi worker in the village
was only weakly associated with a decrease in the no-cover rate for non-polio vaccine
preventable diseases (VPDs). The availability of Angandwadi workers in the village was not
associated with increased coverage for polio vaccines. The presence of a TBA in the village,
while not associated with changes in non-polio coverage, reduced the likelihood of ‘some-
cover’ (Datar et al. 2007).
Hounton et al. (2008), in a study performed on rural Burkina Faso, examined the uptake of
delivery care services. In the unadjusted analysis, the authors found a strong association
between the number of health workers in a health centre and the proportion of institutional
births in the health centre’s catchment area. Less than a third (29.0%) of births associated

43
with health centres featuring two or fewer health workers per 10,000 members of the
population were institutional compared to about half (54.2%) for health centres with more
than six health workers per 10,000 people. The same held true for caesarean sections.
However, when controlling for other factors, the health worker density was not associated
with either institutional births or caesarean sections (Hounton et al. 2008). Mugisha and
Nabyonga (2009) examined the performance of the districts on institutional deliveries and the
extent to which additional medical personnel are likely to increase the number of mothers
who experience childbirth in health facilities in Uganda. Using multivariate regression, the
authors found that the density of nurses and midwives was strongly associated with
institutional deliveries at the district level in Uganda. Districts with a higher density of nurses
and midwives, and those with a higher density of allied health workers registered a higher
proportion of institutional deliveries. For example, keeping other things constant, by
increasing the density of nurses and midwives by 1 for every 100,000 people, an increase of
0.3% in institutional deliveries could be expected. Furthermore, an associated increase of
0.2% could be observed for total health workers and 0.9% for allied health workers (Mugisha
& Nabyonga 2009).
Sousa and others examined the relationship between the coverage of antenatal care achieved
by municipalities in Brazil and the availability of health workers, by means of a production
function approach. The authors found that the overall density of health workers had a
statistically significant, positive correlation with the coverage of antenatal care. When health
workers were disaggregated by categories, nurse professionals appeared to have a greater
impact on coverage than physicians. Interestingly, no relationship was found between nurse
associates and the coverage of antenatal care (Sousa et al. 2013). Furthermore, Magadi and
her co-workers (2000), using data from the Kenya Demographic and Health Survey, studied
variations in the use of antenatal care services in Kenya. Their analyses showed that the early
start of antenatal care in Kenya was associated with the availability of community health
workers in the village after controlling for a range of relevant socioeconomic, cultural, and
reproductive factors (Magadi et al. 2000).
At the global level, simple correlations between health worker concentrations (doctors,
nurses, and midwives per 1,000 people) and coverage of essential services suggest that more
workers are associated with the greater use of some services, including measles vaccinations
and the use of skilled birth attendants. Policies in developing countries generally reached the
consensus that doctor and nurse shortages could be a constraint to increasing the utilization of

44
essential health services. Despite the broad consensus about the central role that health
workers play in reducing maternal and child mortality (Robinson & Wharrad 2001), there is
limited research on the quantitative links between health worker availability and the
utilization of health services at public health facilities in India. Only one study from India has
attempted to examine the relationship between human resources for health and health
outcomes in India (Hazarika 2013). The study uses a simple linear regression and has not
controlled for various other factors that affect health outcomes, such as the availability of
buildings, medical equipment, drugs, and other infrastructure (e.g., electricity and water), as
the data used for the analysis do not contain these variables.
The above review shows that only recent studies have found clear links between health
worker availability and healthcare utilization. However, the relationship has not been studied
in the context of the publicly funded health system in India. Recently, the NRHM has
emphasized increasing the availability of health workers in the public health system through
various measures. Therefore, it is important to examine whether increased availability is
associated with increases in healthcare utilization at public health facilities, while controlling
for other factors.
The launch of the NRHM in 2005 has been a turning point for the publicly funded health
system in India. One of the important contributions of the NRHM has been the introduction
of human resource norms (also known as Indian Public Health Standards, or IPHS) for public
health facilities (Sharma, 2009). To meet these standards, the States were advised to sanction
more posts and recruit more health workers. As an immediate measure, they were encouraged
to hire, on a contractual basis, an additional ANM for peripheral HSCs and a second AYUSH
doctor for PHCs (Sundararaman & Gupta 2011; Malik 2009). Hiring a 2nd ANM on a
contractual basis was supposed to be a temporary measure to increase the health workforce in
public health facilities; however, this problem has persisted even a decade after the NRHM
was launched, likely due to the fact that health administrators perceive that contractual
appointments offer many benefits such as accountability, less absenteeism, and flexible
posting when compared to permanent health workers, and these workers thus perform better
than permanent health workers. The number of contractual health workers in the public
healthcare system has increased manifold during the first decade of the NRHM, and it may
have huge implications for India’s rural health system (Kumar, Khan, Inder, & Mehra, 2014).
However, to the best of my knowledge, no studies exist that compare the effect of health
worker availability among these two streams on the volume of health services being utilized.
45
India has a number of traditional systems of medicine – namely, Ayurveda, Yoga, Unani,
Siddha, and Homoeopathy, often abbreviated as AYUSH. Therefore, it is not surprising that
the country has a number of networks of registered practitioners, research institutions, and
licensed pharmacies (Patwardhan 2011). However, they were not fully integrated in the
publicly funded health system until recently when in 2005, the NRHM sought to revitalize
local health traditions and mainstream AYUSH (including manpower and drugs) to
strengthen the public health system at all levels. A number of initiatives were adopted under
the NRHM. For instance, it was decided that AYUSH medications/formulations would be
made available across SC/PHC/CHC levels. Further, a separate space for AYUSH
practitioners and pharmacists at the CHC level was also envisaged under the new Indian
Public Health Standards (IPHS) model. The most important intervention was made at the
PHC level, where the program decided to upgrade single-doctor PHCs to two-doctor PHCs
by inducting an AYUSH practitioner, also known as AYUSH medical officer in some states
(Gopichandran & Kumar 2012).
After a decade since the launch of the NRHM, the number of PHCs with an AYUSH
practitioner has grown to 36%. In many states, AYUSH doctors serve in primary health
centres (PHC), often as the main clinical provider. One of the motives underlying the
NRHM’s decision to upgrade single-doctor PHCs to two-doctor PHCs was to increase
healthcare utilization at the PHC level (Government of India 2010a). However, there exists
no study evaluating whether the deployment of AYUSH at PHC leads to an increase in
healthcare utilization. Recent studies have speculated that AYUSH doctors are not associated
with any improvements in healthcare utilization due to the unpopularity of these systems in
certain parts of India (Albert & Porter 2015). Further, discordance has also been noted
between the expected and actual competencies of the AYUSH doctors. A recent study found
that AYUSH practitioners were reluctant to handle “emergency and serious” cases (Samal
2015b). Thus, the question arises as to whether the deployment of AYUSH doctors brings
about positive changes in health service utilization at PHCs. Most of the previous studies
dealing with this issue are qualitative and geographically restrictive in nature.
3.10 Summary
Summarising the review, it can be said that there exist only a few studies estimating the
shortage of health workers in rural public health facilities. None of the studies have evaluated
the temporal change in health worker availability in the rural public health system, despite the

46
fact that rural facilities serve more than two-thirds of the Indian population. Moreover, the
issue of the unequal distribution of health workers across these health facilities has not been
adequately addressed before. There is a lack of studies examining health workers’
distributional inequalities in rural public health facilities, especially at the primary and
community health centre level. No study, as yet, has attempted to examine distributional
inequalities across professional categories of public health workers in rural areas. Also, no
studies have examined/compared health worker availability and inequalities between the pre-
NRHM and post-NRHM period.
Regarding the factors that affect the distribution inequalities among available health workers,
it can be said that there is no dearth of literature internationally. However, there appears to be
a lack of studies in India, particularly in the context of the HRH situation in rural public
healthcare facilities. As yet, no study has attempted to unravel the factors affecting the
current pattern of availability in rural public health facilities across all three levels (i.e., SCs,
PHCs, and CHCs.
The third and last section of the review focused on the relationship between health worker
availability and health service utilization. Among the plethora of studies that exist in both
developed and developing countries, only a few recent studies have argued in favour of the
idea that there is a relationship between the available number of health workers and
healthcare outcomes. Therefore, it can be said that the evidence is not conclusive. Also, very
little research has been conducted to investigate this issue in India. Supply-side (health-
system) factors, including the human resources that affect healthcare utilization at public
health facilities in rural areas have largely remained unexplored in the Indian context. Two
new cadres of health workers – a 2nd ANM at HSCs and AYUSH doctors at PHCs – were
introduced under the NRHM. The share of these health workers has increased considerably,
yet no studies have evaluated their impact on healthcare utilization at the public facilities they
serve. To inform the policy, it is important to study their impact of healthcare utilization.
Based on the discussion presented in this chapter, as well as on the critical analysis provided
in the literature review, the main research questions of this study are as follows:
1. How has the availability of health workers in public health facilities in rural India
changed from 2002–2012?
2. How has the level of distributional inequality in the health workforce across public health
facilities in rural India changed from 2002–2012?

47
3. What are the determinants of health worker availability and distribution across public
health facilities in rural India?
4. Does the increased number of health workers (multipurpose health workers, doctors,
nurses, and allied health professionals) affect the services utilization at publicly-funded
rural health facilities in India?
5. Does the availability of new health workers – a contractual 2nd ANM at HSCs and an
AYUSH doctor at PHCs – increase healthcare service utilization at their respective health
facilities?
48
4 Chapter 4: Data and Methods
4.1 Introduction
This chapter focuses on describing the data and methods used in this study. It begins by
providing a brief discussion about several conceptual details and various issues associated
with qualitative and quantitative research methods. A brief overview of the main features of,
and the rationale for, the choice of using a mixed-methods approach has been provided. The
chapter then goes on to offer a discussion about the availability of secondary data on human
resources in healthcare settings, and their quality, in India, which is followed by a description
of the important features of the main datasets used in this study. Next, this chapter provides a
comprehensive description of the steps involved in the process of primary data collection.
Having described the data and variables in detail, the chapter offers a detailed account of the
rationale for and the different methods of analysis used to accomplish the objectives of this
study, which are described in Section 3.10.
4.2 Research design of the study
Although the data and analysis methods used to accomplish two of the three objectives of this
study are purely quantitative in nature (see Figure 4.1), the research design adopted in this
thesis can be termed as a ‘mixed-methods research design’, as the second objective of the
study attempts to integrate both quantitative and qualitative analyses to obtain enriched
results (Creswell & Plano Clark, 2011). In this way, I was not only able to compare or
validate the results of the quantitative analysis, but I was also able to acquire detailed and
possibly new and interesting insights pertaining to the second objective (research question 3)
– the factors that might affect the (un)availability of health workers in certain public health
facilities – through the qualitative analysis. Prior to providing a comprehensive overview of
the mixed-methods research design, I will provide a brief critical account of the quantitative
and qualitative research methods used, as both methods serve as the fundamental constituents
of mixed-methods research; these approaches have been practiced within the fields of health
science and social work research for decades.
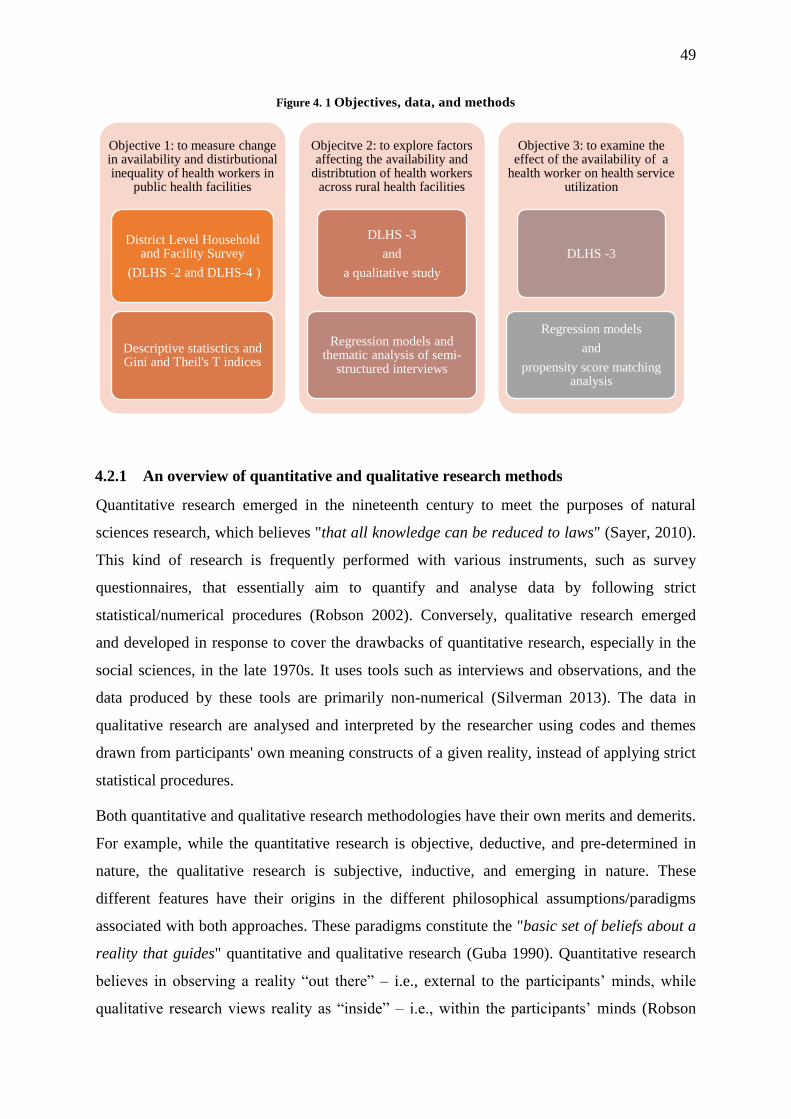
49
Figure 4. 1 Objectives, data, and methods
4.2.1 An overview of quantitative and qualitative research methods
Quantitative research emerged in the nineteenth century to meet the purposes of natural
sciences research, which believes "that all knowledge can be reduced to laws" (Sayer, 2010).
This kind of research is frequently performed with various instruments, such as survey
questionnaires, that essentially aim to quantify and analyse data by following strict
statistical/numerical procedures (Robson 2002). Conversely, qualitative research emerged
and developed in response to cover the drawbacks of quantitative research, especially in the
social sciences, in the late 1970s. It uses tools such as interviews and observations, and the
data produced by these tools are primarily non-numerical (Silverman 2013). The data in
qualitative research are analysed and interpreted by the researcher using codes and themes
drawn from participants' own meaning constructs of a given reality, instead of applying strict
statistical procedures.
Both quantitative and qualitative research methodologies have their own merits and demerits.
For example, while the quantitative research is objective, deductive, and pre-determined in
nature, the qualitative research is subjective, inductive, and emerging in nature. These
different features have their origins in the different philosophical assumptions/paradigms
associated with both approaches. These paradigms constitute the "basic set of beliefs about a
reality that guides" quantitative and qualitative research (Guba 1990). Quantitative research
believes in observing a reality “out there” – i.e., external to the participants’ minds, while
qualitative research views reality as “inside” – i.e., within the participants’ minds (Robson
Objective 1: to measure change in availability and distirbutional inequality of health workers in
public health facilities
District Level Household and Facility Survey
(DLHS -2 and DLHS-4 )
Descriptive statisctics and Gini and Theil's T indices
Objecitve 2: to explore factors affecting the availability and
distribtution of health workers across rural health facilities
DLHS -3
and
a qualitative study
Regression models and thematic analysis of semi-
structured interviews
Objective 3: to examine the effect of the availability of a
health worker on health service utilization
DLHS -3
Regression models
and
propensity score matching analysis

50
2002). These contrasting philosophical assumptions have unfortunately given rise to a well-
known and equally controversial “paradigm war” in the field of research methods (Bazeley
2004). For example, quantitative researchers are branded as positivists, while those who have
a resolute faith in the power of qualitative methodologies are labelled as interpretivists (Guba
1990).
However, I will not delve deeper into this philosophical war; rather, I shall focus on the
strengths and weaknesses of both methods, as the combination of their respective strengths
and weaknesses are fundamentally valued in mixed-methods research (Morgan 1998). For
example, quantitative research is often regarded as systematic, focused, controlled, and
practical; it is criticised as being non-sensitive, overly simplistic, and representing an
average of the participants' subjective responses. The inflexibility of a positivistic approach
has drawn a lot of criticism that, in turn, has led to the revision of this approach into post-
positivism, which considers the limitations of rigid positivism. Conversely, qualitative
methods are subjective and exploratory in nature; this means that this approach is not only
flexible, but it also facilitates the researcher’s ability to investigate complicated social issues.
However, the qualitative approach not bereft of weaknesses. It has been argued that
qualitative research is less systematic in nature and hence cannot be repeated to obtain the
same results. It is difficult to make generalisations with qualitative data. Moreover, this
approach is time consuming, expensive, and labour intensive (Morgan 2007). In short, it can
be argued that none of these research methods is considered perfect on its own. The mixed-
methods approach draws upon the merits and demerits of both approaches, and it combines
these two types of data in a single study, as in the present study, by following the
fundamental rationale of triangulation, which aims to obtain better, more robust results on a
selected issue (Bazeley 2004).
4.2.2 Mixed-methods research methodology or the pragmatism paradigm
Mixed-methods research is a pragmatic approach that has been widely regarded as a ‘third
paradigm’. It abandons methodological orthodoxy in favour of methodological
appropriateness as the primary criterion for judging methodological quality (Morgan 2007).
Since this is a relatively new research methodology, I believe that providing some details of
its evolution and the issues/challenges that it faces is necessary. This methodology began to
develop around the late 1980s as a result of the contributions of many researchers. Of these,
key works included those by Tashakkori and Teddlie (1998), Morgan (1998), Bryman (2006),
51
and Greene (2007), who worked in various fields such as evaluation, education, and
management sciences, and so on (Bryman, 2006; Greene J, 2007; Morgan, 1998; Tashakkori
& Teddie, 1998). The mixed-methods design has developed in several phases over the last
two decades. According to Creswell (2009), these phases include the early formative stage,
the holding of a theoretical discussion, identifying procedural issues, engaging in recent
debates on pressing controversies, and holding discussions about expanding this method into
other disciplines (Creswell, 2014).
Although some researchers are highly optimistic that the mixed-methods methodology can
become a third paradigm, I should point out that there are still certain issues surrounding the
mixed-methods approach that make it more complex to achieve. First, this methodology is
not well established as yet (Creswell, 2014). This seems true not only in terms of its ideology,
integration, and priorities in integration, but also from a design perspective. Such issues can
be observed in the emergence and description of numerous mixed-methods research designs
and in the different sets of procedures involved in the data collection, analysis, and
integration of a study’s results. Second, many terms are used to describe the mixed-methods
approach, such as methodological triangulation, synthesis, mixed-methods research,
multitrait–multimethod research, integrated/combined quantitative and qualitative
approaches/research, and multi-strategy research (Creswell, 2014). I adopted the recent term,
“mixed-methods research” for the sake of simplicity and to avoid confusion. Finally, it
should be noted that this method presents some challenges for the researcher, which are
associated with his/her knowledge about these methods, his/her ability to justify the choice of
study, and his/her potential to face other issues, such as those associated with resources and
time, which I also kept in mind and adopted in the present study.
4.2.3 Mixed-methods design
Numerous mixed-methods research designs are presented by many researchers such as Morse
(1991), Morgan (1998), Tashakkori and Teddlie (2010), and Creswell (2014). For example,
among the studies mentioned, Tashakkori and Taddlie (2010) has 41, while Creswell (2014)
has six well-known, but different, types of mixed-methods designs (Creswell, 2014a;
Morgan, 1998; Morse, 1991; Tashakkori & Teddlie, 2003). These six mixed-methods designs
are referred to as a concurrent triangulation (also known as convergent parallel), concurrent
transformative, concurrent nested, sequential exploratory, sequential explanatory, and
sequential transformative research designs. It is worth mentioning that Creswell rationalised

52
these six mixed-methods designs on the basis of three key principles. Among these are focus
(priority), implementation (the sequence of collecting both qualitative and quantitative data),
and integration (the phase of data integration). While these six mixed-methods research
designs are particularly relevant in a mixed-methods study, they are different, primarily due
to considerations based on the four aforementioned fundamental principles (Creswell, 2014).
The mixed-methods approach used in this study is the ‘mixed-methods sequential
explanatory’ design. It is highly popular among researchers and has been widely used in both
social and behavioural sciences research (Ceci 1990; Brenner et al. 2014; Van den Heede et
al. 2013; Schmiedeknecht et al. 2015; Kinnick & Kempner 1988). This implies collecting and
analysing quantitative data first, followed by qualitative data in two consecutive phases
within one study. The second, qualitative, phase builds on the first (the quantitative phase),
and the two phases are connected in the intermediate stage in the study. The rationale for this
approach is that the quantitative data and their subsequent analysis provide a general
understanding of the research problem (Creswell & Plano Clark, 2011). The qualitative data
and their analysis refine and explain those statistical results by exploring participants’ views
in more depth. Therefore, it can be argued that this research design can overcome the
demerits of one research method by combining the strengths of the other (Bryman, 2006;
Creswell, 2014).
In the present study, the quantitative research component consists of analysing DLHS-3
facility survey data using negative binomial regression. This allows me to quantitatively
measure the effect of a number of factors on the availability and distribution of health
workers across health facilities. Since the literature suggests that there could be various
factors (which have not been measured in the DLHS-3 dataset) that can influence health
workers’ availability across health facilities, I chose to design a qualitative component that
was in line with the overall explanatory mixed-methods approach. This component consists
of semi-structured interviews with health workers, health facility managers, and a district-
level medical officer. In this explanatory design, it is expected that a comprehensive
understanding of the factors affecting the availability and distribution of health workers in
rural public health facilities will emerge through careful triangulation of both quantitative and
qualitative elements.

53
4.3 Sources of data
To accomplish the objectives stated in section 4.2, the study uses data from both primary and
secondary sources. However, a considerable part of this thesis is based on the results obtained
from secondary data – i.e., the District Level Household and Facility Surveys. Primary
qualitative data were also used to accomplish the second objective of the thesis. Before
describing the datasets used in this study in detail, a brief examination of the existing HRH-
related secondary data sources that are available has been made to evaluate their suitability
for the present study.
India follows the federal system of governance where developing a health system is primarily
the State government’s responsibility (Ramani & Mavalankar 2006). Since they are free to
chart their own course of development of the health system, there has been substantial
variation in health system priorities across states. Therefore, some of this variation is
expected in the recordkeeping of human resources for health information. While many states
have full-fledged institutions that keep track of human resources in their publicly-funded
health facilities, in other states, systems are not fully developed and information is not often
found in one place. Some states still do not have a proper HRH information system in place
(Shukla et al. 2014). Until recently, even the federal government (also known as the central
government) did not have an HRH information system. In this situation, whatever little data
are available are often fragmented and irregular, as they come from different agencies that
have their own standards of information management (USAIDS 2012). Therefore, assessing
numerical adequacy and inequality in the distribution of health workers in public health
facilities in India is a challenging task, even in the 21st century (Hazarika 2013).
While there is no single data source that can capture various dimensions of HRH stocks and
flows, a number of different data sources exist in India that may be used to obtain
information about the health workforce of the public health system. The Census of India
(2001), the Revised Indian National Classification of Occupations (2004) published by the
Directorate General of Employment and Training, Ministry of Labour (Government of India),
the Survey on Employment and Unemployment (61st round) carried out by the National
Sample Survey Organization (2004–05), and the District Level Household and Facility
Survey (DLHS) conducted by the International Institute for Population Sciences, Mumbai
(India) under the auspices of the Ministry of Health and Family Welfare (Government of
India), are some of the most reliable sources of HRH information (Hazarika 2013).

54
Unfortunately, none of the aforementioned data sources is useful for the current study (except
for DLHS-3) because of their inability to discriminate between private and public health
sector workers, while the current study exclusively focuses on public health facilities in rural
India. For instance, the Census of India does provide information on people’s occupations,
but it does not provide any information about the organization they work with. Hence, it is
literally impossible to segregate health workers by private and public health sectors.
Therefore, the Census of India cannot be used for this study.
Rural Health Statistics (RHS), compiled by the Government of India, does provide rich
information on the state of human resources for health facilities in publicly funded health
systems in rural India; however, the information published is aggregated at the state level and
it thus cannot be used to calculate inequality. Moreover, the RHS does not provide any
information about the volume of healthcare utilization; hence, the effect of health worker
availability on the utilization of healthcare services cannot be analysed. In addition, the
quality of RHS data is also questionable, as it is merely a compilation of the aggregate data
that is sent to the Central Government by State agencies.
The only source of data that collects information about the rural health system and its
components at regular intervals using a fixed set of questions and a sampling design across
the country is the DLHS. It not only provides disaggregated information on HRH availability,
but it also reports a number of other characteristics of a given health facility. Thus, it is clear
that this instrument has a number of advantages over other available datasets that provide
HRH information in public sector; therefore, it serves as the main data source for the HRH
analysis throughout this thesis. Descriptions of the relevant aspects of the DLHS are
described in the following section.
4.3.1 District Level Household and Facility Surveys
The DLHS is a series of nationally representative large-scale surveys. The survey was carried
out four times in a row during 1998–1999, 2002–2004, 2007–2008, and 2012–2013. These
four rounds are often known as DLHS-1, DLHS-2, DLHS-3, and DLHS-4, respectively. The
DLHS are conducted to provide estimates on important indicators of maternal and child
health, family planning, and other reproductive health services. In addition, they also provide
information on the important interventions of the National Rural Health Mission (NRHM).
The main aim of the DHLS is to collect data on various aspects of maternal and child

55
healthcare utilization, and to assess the capacity and preparedness of publicly funded health
facilities in terms of infrastructure, human resources, drugs, equipment, and training. Data on
the first aspect of the first, second, and third round of the DHLS were collected through a
household survey, while data on health facility capacity and preparedness were collected
through a facility survey. Apart from collecting information on the resources available at
these health facilities, the facility survey also gathered data on the utilization of various
services at surveyed facilities during the month preceding its administration.
The DLHS surveys used a multistage, stratified probability proportional to size (PPS)
sampling design. While the sampling frame for the DLHS-2 was based on the Census of India
1991, the sampling frame for DLHS-3 and DLHS-4 was based on the Census of India 2001.
A sampling frame aids in the selection of primary sampling units (PSUs). A PSU in the
DLHS represents a group of villages. First of all, all PSUs in a district were stratified into
different strata based on population/household size, the percentage of SC/ST populations,
female literacy (7+), etc. Then, a fixed number of PSUs or census villages were selected by
systematic PPS sampling, followed by the sampling of households from each PSU using
circular systematic sampling. In DLHS-2, the total number of households covered in a district
was 1,100 (including a 10% cushion for non-responses). In DLHS-3, the number of sampled
households varied between 1,200 and 1,500, depending on the immunization, antenatal care,
and institutional delivery coverage of that district.
The selection of rural health facilities for the Facility Survey in DLHS-3 and DLHS-4 was
linked with the sampled rural PSUs. The Facility Survey of DLHS-3 and DLHS-4 covered
those SCs that were located in close proximity and that were expected to serve the healthcare
needs of the sampled rural PSUs. Subsequently, those PHC that catered to selected SCs were
also covered in the survey. Both these DLHS rounds covered all community health centres
(CHCs) and district hospitals within a given district. The selection procedure of health
facilities in the DLHS-2 was not clearly mentioned in the DLHS-2 reports.
All three rounds of the DLHS used uniform bilingual questionnaires (in English and in the
local language of the area) in each state of India. There were four types of questionnaires
used for the household survey: household, ever-married women (aged 15–49 years),
unmarried women (aged 15–24 years), and village. The facility survey in all three rounds of
the DHLS had collected data using face-to-face interviews by administering structured
questionnaires separately for each level of the health facility. Some information was collected
directly from official registers that were maintained by the health facility itself.

56
Some issues included in the questionnaire were the same across HSCs, PHCs, and CHCs,
such as questions about the availability of physical infrastructure – e.g., the type of building,
water supply, electricity supply, toilets, communication facilities (such as computers and
telephones), waste disposal facilities, residential quarters for health workers, the number of
beds, and labour rooms. At the PHC level, additional information about the availability of
medical officers (permanent and contractual), a lady medical officer, staff nurses, a
pharmacist, an operation theatre, reproductive and child health-related equipment, a waiting
room for outpatients, drug storage facilities, essential drugs, and essential laboratory testing
facilities was collected. A section of the PHC questionnaire was devoted to training-related
questions. These question asked whether health workers working at PHCs had undergone the
following training in the last five years: reproductive tract infection/sexually transmitted
infection (RTI/STI), basic emergency obstetric care, integrated management of neonatal and
child illness (IMNCI), immunization, and skilled birth attendance.
Information collected for the CHC included the availability of specialists, nurses, doctors,
and para-medical and support staff, as well as the availability of health workers trained for
non-scalpel vasectomy (NSV), emergency obstetrics, MTP, newborn care and the treatment
of RTI/STI, IMNCI, and electrocardiogram (ECG). Apart from common questions about the
status of physical infrastructure and the availability of essential drugs, a few questions about
the availability of surgical, laboratory, and cold-chain equipment were also included in the
CHC questionnaire (International Institute for Population Sciences (IIPS), 2010).
In DLHS-2, a total of 620,000 households were covered. From these surveyed households,
507,000 currently married women (aged 15–44 years) and 330,000 husbands of eligible
women were interviewed. In all, the DHLS-3 household survey collected information from
720,320 households; there were 643,944 ever-married women aged 15–49 years and 166,260
unmarried women aged 15–24 years. While the Facility Survey of the DLHS-2 covered 1,625
CHCs, 9,688 PHCs, and 18,385 HSCs, the Facility Survey of the DLHS-3 covered 18,068
HSCs, 8,619 PHCs, and 4,162 CHCs. The Facility Survey of the DLHS-4 covered 18,120
HSCs, 8,458 PHCs, and 4,792 CHCs. The overall household response rate for the DLHS-2
and DLHS-3 was around 99% and 94%, respectively. The response rate for DHLS-4 is not
yet available. All surveys oversampled households by 10% to serve as a cushion for non-
responders. More information on the sampling procedures, survey design implementation,
calculation of sample weights, and response rates can be found in the national reports
available at www.rchiips.org.
57
The first objective of this study is to examine the change in the availability of human
resources during 2002–2012. It also aims to measure the change in the distributional
inequality of health workers. To fulfil these objectives, the data from the DLHS-2 and DLHS-
4 were used. Data obtained from the DLHS-3 were not used because this instrument collected
HRH information in a slightly different way. To accomplish the third and final objective of
the study, where the aim is to examine the association between health worker availability and
health service utilization at public health facilities, the DLHS-3 dataset was used. The reason
underlying why the DLHS-4 was not used for this purpose is that the household survey was
not conducted in many states; hence, it was not possible to control for demand-side factors in
the analysis. The reason why the DLHS-2 was not used is that the health facilities in the
survey were not linked with villages/populations. The second objective used DLHS-3 for the
quantitative analysis, while primary data were collected from the field for the qualitative
analysis. While the DLHS-3 was used to examine the effect of various factors (available)
with the availability of health workers at public health facilities, the primary data were used
to substantiate the findings from the quantitative analysis while exploring any additional
factors that were not available in the DLHS-3 dataset. The process of collecting the primary
data used in this study is described in detail in the following section.
4.3.2 Primary data collection
The second objective of this study is to explore the factors affecting the availability and
inequality of human resources in health facilities in India. In order to substantiate the results
from the quantitative analysis (based on the DLHS-3) for objective number two, the primary
data were collected from the health facilities and health functionaries using semi-structured
interviews. However, the fieldwork basically involved two types of data collection: the first
was to perform a quantitative assessment of the availability of different types of health
workers in rural public health facilities. To accomplish this, data concerning sanctioned,
filled, and vacant health worker posts from block-level administrative offices were collected.
The second type of data was qualitative in nature. It was collected through semi-structured
interviews conducted with health professionals and administrative officers posted at health
facilities in rural areas of the Sitapur district in the state of Uttar Pradesh (UP). The primary
purpose of conducting these interviews was to explore those factors that led to higher HRH
availability at some health facilities and lower at others.

58
4.3.2.1 Selection of the study area
Sitapur, which is the fourth largest district in terms of area (at 5,743 square kilometres) in the
state of UP, was selected for this study. The first challenge faced when selecting the study
area was to select a state with considerable variation in HRH availability. Since there could
be a number of states with considerable variation in HRH availability across public health
facilities, a preliminary analysis was conducted using the DLHS dataset to examine the
availability and inequality in the distribution of health workers. It was found that the state of
UP not only had the lowest health worker availability in the country, but it also had
substantial inequalities in the distribution of HRH across its publicly funded rural health
facilities. Therefore, the state of UP was chosen for this study.
The selection of the Sitapur district was based on two primary reasons. First, the district of
Sitapur was one of the most backward districts in the country. In 2009, an assessment report
on the implementation of Rastriya Sam Vikas Yojana (the National Balanced Development
Plan) by the Planning Commission of India ranked Sitapur among the most backward
districts in India. By no means can the reality of socioeconomic development be said to be
satisfactory in the district. The percentage of illiterate women is still over 40%. As for the
Human Development Index, Sitapur is ranked 51st out of a total of 70 districts in the state
(Government of Uttar Pradesh 2007).
Table 4.1 Sitapur district at a glance
% urban population (2007–2008 DLHS-3) 11.9
% of scheduled castes (2001) 31.9
Sex ratio (females/1,000 males) (2001) 862
% below poverty line 37.3
% literate, all (2001) 49.1
% literate, males 61.0
% literate, females 35.0
Total fertility rate (2005–2006) 4.7
Infant mortality rate (per 1,000) 97
% of girls marrying below 18 years of age 64.2
% of children getting complete immunization 38.6
Estimated % coverage of safe drinking water (habitations) 48.21
% of villages not connected to pucca roads 59.98
Ranking (out of the 569 districts in India) on the basis of a composite index 554
Other indicators
% fully immunized children (DLHS-3, 2007–2008) 18.5
% households with electricity 14.6
% households with toilets 15.8
% households with pucca houses 16.5
% of mothers having safe deliveries 24.0
% contraceptive prevalence 26.0
Source: DFID, UK’s The Poorest Areas Civil Society (PACS) Programme Website (accessed from http://www.empowerpoor.org/districtdetail.asp?district=83#) and the DLHS 2007–2008 state report – Uttar Pradesh

59
The fertility rate stands at an alarming 4.7 children per woman. According to the Annual
Health Survey 2011, of the 70 districts in UP, Sitapur ranks 12th from the bottom in terms of
the crude birth rate (CBR), 14th from the bottom in terms of the infant mortality rate (IMR),
and 7th from the bottom in terms of the under-5 mortality rate (U5MR). As compared to
Lucknow, the state capital located just 80 kilometres from Sitapur, the CBR (28.0) and the
CDR (6.0) in Sitapur are almost 1.5 times as high, while the IMR (82), NNMR (57), and
U5MR (120) are almost twice as high (see Table 4.1). Second, from the researcher’s point of
view, conducting a qualitative study in Sitapur was the least costly in terms of time, effort,
and money. The researcher was well aware about the setting in which he was going to
conduct the study. He had a good level of prior knowledge about the local geography, history,
politics, health system, and language of the region.
4.3.2.2 Administrative divisions of the Sitapur district
The district is divided into six Tehsils (sub-districts): Khairabad, Biswan, Mishrikh,
Laharpur, Mahmoodabad, and Sidhauli. These are the major towns in the district. A Tehsil is
further divided into one or more blocks. These divisions are known as development blocks
(DBs) and they normally serve as socioeconomic planning and development units of the
district, in addition to the Tehsils. DBs represent a compact area for which effective plans are
prepared and implemented by the government. These six Tehsils in the district are further
divided into 19 DBs: Maholi, Pisawan, Misrikh, Gondalamau, Sidhauli, Pahla,
Mahmoodabad, Rampur Mathura, Parsendi, Sanda, Reusa, Behta, Laharpur, Parsendi,
Khairabad, Ailia, Hargaon, Biswan, and Kasmanda.
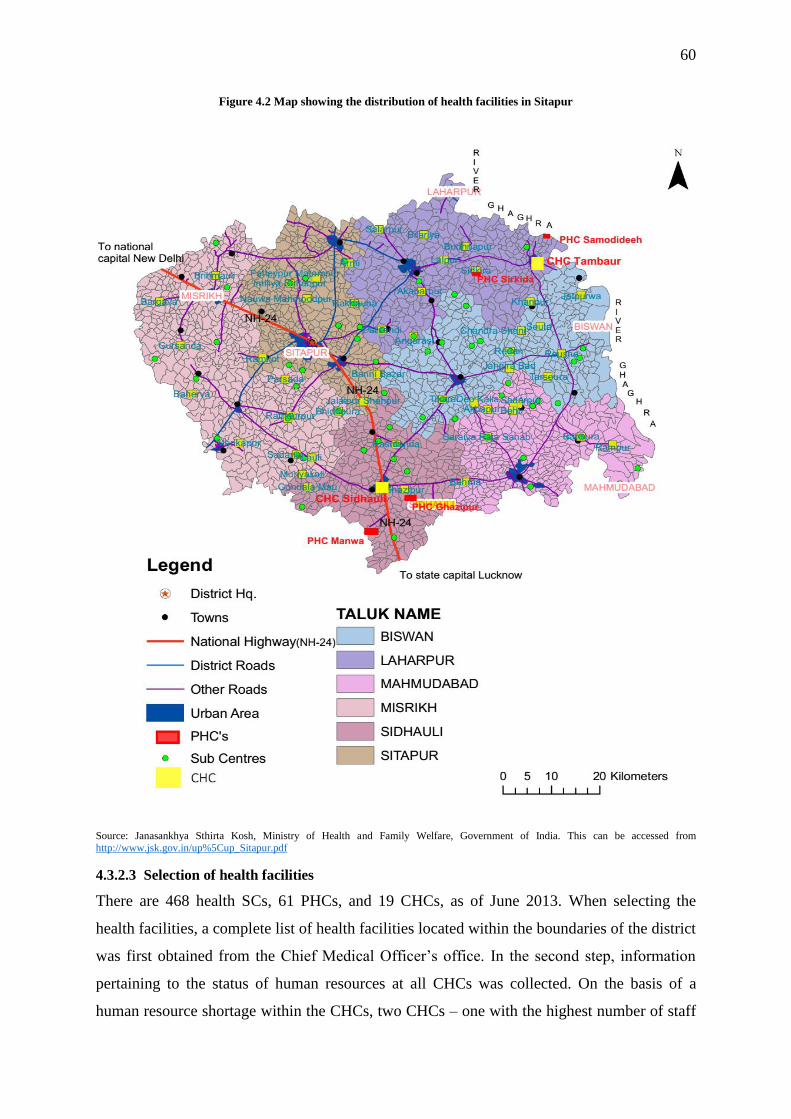
60
Figure 4.2 Map showing the distribution of health facilities in Sitapur
Source: Janasankhya Sthirta Kosh, Ministry of Health and Family Welfare, Government of India. This can be accessed from http://www.jsk.gov.in/up%5Cup_Sitapur.pdf
4.3.2.3 Selection of health facilities
There are 468 health SCs, 61 PHCs, and 19 CHCs, as of June 2013. When selecting the
health facilities, a complete list of health facilities located within the boundaries of the district
was first obtained from the Chief Medical Officer’s office. In the second step, information
pertaining to the status of human resources at all CHCs was collected. On the basis of a
human resource shortage within the CHCs, two CHCs – one with the highest number of staff
61
(CHC Sidhauli) and another with the lowest number of staff (CHC Tambaur) – were selected
of all 19 CHCs. The basis for this selection was the total strength of human resources at the
health facility, as the objective of the study was to explore the factors that affect health
worker availability and distribution across health facilities in the district. The main motive
was to explore the factors that could have led to low health worker availability at some
facilities and high health worker availability at others. Therefore, CHC Sidhauli represented
an overstaffed CHC in the study, while CHC Tambaur represented an understaffed CHC.
Within a CHC, there were 3–4 PHCs. Again, one overstaffed and one understaffed PHC was
selected from each CHC. PHC Samodideeh and PHC Sirkida were chosen from CHC
Tamabur, while PHC Manwa and PHC Gazhipur were selected from CHC Sidhauli. From
each selected PHC, I then chose two HSCs. Thus, a total of 14 health facilities was selected.
4.3.2.4 Participant selection
Since the objective of the research was to understand the factors that shaped health worker
availability at a particular facility, I decided to interview the head of each selected health
facility. For example, for a CHC, I chose the Superintendent of the CHC and for an HSC, I
selected the ANM. Among district-level officials, I chose the Chief Medical Officer (CMO).
In the event that the CMO was not available, I planned to interview his deputy. Altogether,
15 participants in the study were selected to be interviewed.
4.3.2.5 Selection of the interview instrument
Interviews are possibly the most widely used instruments in various fields (including in
health systems and health services research) when compared with other instruments that are
used to collect qualitative data, such as observations and document analysis (Robson 2002; J.
W. Creswell 2014). One primary reason for this is that since responses are generally
qualitative in nature, interviews (unlike questionnaires) enable the researcher to elicit the
participants' subjective ideas and opinions through their own words, which may provide more
in-depth data about the targeted issue. By keeping this in mind, I also chose to conduct
interviews to provide participants with the opportunity to express their views about the
factors the affect health worker shortages in particular health facilities. Since questionnaires,
such as the one used by the DLHS-3, leave out many variables/reasons that could explain the
unavailability of health workers in particular health facilities, these unknown, yet potentially
significant, aspects/reasons/factors could be better captured in greater detail with the help of
interviews, which can be used to support or validate the findings obtained from quantitative
data (Bowling 2009).

62
Figure 4.3 Health facilities chosen for the selection of interviewees
4.3.2.6 Reasons for selecting semi-structured interviews
Among the different types of interview formats, I selected the semi-structured interview as a
tool to collect qualitative data from the participants. This method is intermediate in nature, as
it falls between structured and unstructured interviews. Both structured and unstructured
interviews have their own strengths. For example, structured interviews, like the
questionnaires employed in the DLHS-3, are able to provide more focused and rapid data
collection, while unstructured interviews help to provide more exploratory data (Bernard
2013). However, both of these types of interviews, I believe, were not proper choices for the
study. For instance, I cannot afford to use the highly unfocused type of data provided by
unstructured interviews due to time limitations, as mentioned earlier. At the same time, I
believe that structured interviews, with their well-prepared, specific, and domain-focused
questions, restrict the participants’ ability to explain their answers. Therefore, I preferred the
use of semi-structured interviews, which I believe can offer certain advantages for this study.
As its name suggests, the semi-structured interview is more flexible – i.e., it is both
conversational and less structured when compared with the other two types of interviews
(Cresswell, 2014), which I could really benefit from for this study. I was a novice researcher
at the time, and I was looking to provide participants with greater flexibility to provide their
own responses while conducting the interviews, which is something that semi-structured
interviews can offer. In other words, semi-structured interviews have some positive points,
especially within the context of this study, as I needed to restructure the main questions, ask
more questions by probing, and establish a good rapport with the hopes of acquiring more
Distrcit CMO
CHC Tambaur
PHC Samodideeha
HSC Samodideeha
HSC Phoolpur Guniya
PHC Sirkida
HSC Matua HSC Sumali
CHC Sidhauli
PHC Manwa
HSC Amberpur
HSC Rampur Tedwa
PHC Ghazipur
HSC Ramadana
HSC Neelgaon
63
insightful data. Similarly, the choice of using a semi-structured interview was equally
important for the participants, as they needed more freedom to ask questions and to express
their views freely. I prepared the semi-structured interview guide/protocol for the study,
while keeping in mind the factors affecting a health worker’s decision to choose/stay/leave a
health facility, as discussed in Chapter 2. The interview guide contained open-ended
questions, and it also featured some possible related probing sub-questions, with the ultimate
aim of obtaining participants’ in-depth thoughts and interpretations about the targeted issues.
4.3.2.7 Procedure for qualitative data collection
The participants were sent a letter that invited them to participate in the interviews. Once they
responded to the letter, they were asked to provide the best place and time to conduct the
interview. Before attending the interview, an interview guide was prepared to help keep the
interview focused. For each type of health worker and health official, the interview guide
differed in terms of the issue included. Each interview lasted almost 90 minutes; however, in
some cases, it was less than 90 minutes. These interviews took place either at the health
facility or at the home of the concerned participant. During the interview, I wrote down the
participants’ keywords, which not only helped me to obtain additional information in
subsequent analyses, but I was also able to explore the participants’ in-depth views on these
topics. I provided the participants with enough time and opportunities to not only express
their thoughts as much as they wanted, but to also record them properly using the audio
recorder. I attempted to complete the interview by primarily summarising the participants’
overall views and by asking them for additional comments. A tape recorder was used to
record the conversation during the interviews, and field notes were taken on a paper notepad.
At the end of the interviews, I thanked the participants and provided my contact details in
case they wanted more information about me and the research initiative. I also noted the
participants’ contact information in the event that I might need to reach them again. Since the
research site was a socioeconomically backward rural area, the transportation and electricity
resources were very poor. It took six months to finish the work successfully and to return to
the UK. The field work started in April 2013 and ended in September 2013.
4.3.2.8 Confidentiality and ethics
Since this study focused on health workers, I was well aware of the potential challenges
pertaining to the ethical issues associated with this topic. Hence, I constructed the semi-
structured interview guide very carefully. Prior to seeking their formal consent, I explained to
the participants that their participation in this study was not at all compulsory and that they

64
could withdraw at any time. Moreover, I adopted various measures to ensure their anonymity
and confidentiality during and after the research. For example, I provided both written
(consent form) and verbal communication that only the researcher had access to the data; I
also indicated that the data would not be disclosed to anyone. As mentioned earlier, while
keeping in mind the sensitive nature of the research site (health facilities are places of politics
too!), I avoided conducting the interviews with health workers in the presence of another
health worker who was senior to him/her.
Last, but not least, the University of Portsmouth Ethics Research Committee’s approval was
obtained regarding the methods employed for data collection, data security, participants’
details, the research context, channels of potential bias in data collection, etc. Ethical
approval was granted by the committee before the field research began in April 2013. The
research adhered to the ethical guidelines laid by the university’s ethical assessment
committee.
All participants in the research project were fully informed about the aims of the research, the
procedures involved in the research, and their rights as a participant. Informed consent was
sought from the participant him/herself. Each participant had the right and opportunity to
withdraw from the interview at any time. The informed consent form template that was used
in this investigation is presented in the appendix of this thesis. Each participant was known
and referred to by his/her designation rather than by his/her name during the interviews. All
data were made anonymous before the analysis. The collected data were kept in a safe and
secure place in order to reduce the possibility of use/misuse by others. Electronic data were
kept in password-protected files.
4.4 Variables used for quantitative analysis
This section describes the variables used to accomplish the goals of the study one by one.
4.4.1 Variables used for research questions 1 and 2
This study used the DLHS-2 and DLHS-4 to accomplish the first (measuring temporal
changes in health worker availability at each level of the rural public health system) and
second goals (measuring temporal changes in the distributional inequality of health workers
at each level of the rural public health system) of the study. The availability of health workers
in the DHLS-2 and DLHS-4 was measured using binary variables featuring two possible
responses: ‘yes’ or ‘no’. The variable ‘total number of health workers’ is used for the first
65
two objectives, as it is used to calculate health worker inequality. This variable, ‘total number
of health workers’, as it related to SCs, considered the availability of permanent ANMs,
contractual 2nd ANMs, and male health workers. The same variable for PHCs included the
availability of doctors (permanent medical officers, contractual medical officers, AYUSH
medical officers, and lady medical officers), nurses (staff nurses, nurse midwives, and
ANMs), the supervisory cadre (lady health visitors, male health assistants), and allied health
professionals (pharmacists, lab technicians). The variable ‘total number of health workers’
for CHCs considered the availability of specialists (surgeons, paediatricians, gynaecologists,
anaesthetists), general duty medical officers, nurses (staff nurses, public health nurses), and
allied health professionals (pharmacists, lab technicians, radiographers).
4.4.2 Variables for research question 3
The third research question aims to examine the determinants of health worker availability at
the SCs, PHCs, and CHCs, separately. The dependent variable ‘total number of health
workers at the facility’ was created for each type of health facility. The health workers that
were included in the creation of this variable were described in the previous section (section
4.6.2). The dependent variable ‘total number of health workers at the facility’ is used as a
count variable.
A number of independent variables were also used. The choice of independent variables in
this analysis was guided by previous studies. A description of these independent variables is
given below. The analysis of the determinants of health worker availability at the SCs
included two continuous variables – namely, ‘distance (of health facility) from (district)
headquarter’, ‘population served (by health facility)’ – and five binary variables, including
‘functional toilet’, ‘electricity generator’, ‘telephone’, ‘location of PHC’ (with categories –
‘rural’ and ‘urban’), and ‘24×7 PHC’, which refers to the PHCs’ functions 24 hours, 7 days a
week. Four categorical variables – namely, source of water supply (with categories ‘tap’
(reference category), ‘other’, ‘no supply’), electricity supply (with categories ‘regular supply’
(reference category), irregular supply, ‘no connection’), the number of available residences
for health workers (with categories ‘none’ (reference category), ‘one’, ‘two’, ‘three’, ‘four’),
and region (with categories ‘South’ (reference category), ‘North’, ‘Central’, ‘Northeast’,
‘East’, and ‘West’) – were also included.

66
The variable ‘region’ was created by grouping Indian states on a geographical basis. The
north region includes Jammu and Kashmir, Himachal Pradesh, Punjab, Rajasthan, Haryana,
Chandigarh (Union Territory – UT), and Delhi; the central region includes the states of UP,
Uttaranchal, Madhya Pradesh, and Chhattisgarh; the northeast region includes the states of
Sikkim, Assam, Meghalaya, Manipur, Mizoram, Nagaland, Tripura, and Arunachal Pradesh;
the east region includes the states of Bihar, Jharkhand, West Bengal, and Orissa; the west
region includes the states of Gujarat, Maharashtra, Goa, as well as the UTs of Dadra and
Nagar Haveli, and Daman and Diu; and the south region includes the states of Kerala,
Karnataka, Andhra Pradesh, Tamil Nadu, as well as the UTs of Andaman and Nicobar
Islands, Pondicherry, and Lakshadweep. The health SC-level analysis also used the same set
of independent variables.
The same independent variables were used to analyse the determinants of health worker
availability at the HSCs and CHCs, except for ‘electricity’ and ‘telephone’. For the CHC-
level analysis, instead of the categorical ‘electricity supply’ variable, the binary ‘availability
of electricity connection’ variable was used. Instead of the binary variable ‘telephone’, a
continuous index that measured the availability of communication equipment (Internet,
telephone, and computer) at the CHC was constructed. The index ranged from 0 to 3, with
facilities receiving 1 point for having each type of communication equipment. The
categorical variable that measured the availability of a residence for health workers at the
CHCs had seven categories instead of four, as in the case of PHCs. The distance from
headquarters was not available for the CHCs, and hence this variable was not used in the
analysis.
4.4.3 Variables for research question 4
Research question 4 asked, ‘Do increased numbers of healthcare workers (multipurpose
healthcare workers, doctors, nurses, and allied health professionals) affect service utilization
at publicly funded rural health facilities in India?’ To answer this question, a regression
analysis was conducted for all three levels of health facilities. The dependent and independent
variables used in this study are described in the following sections.
4.4.3.1 Dependent variables
The analysis of the factors that affect healthcare utilization at the various health facilities
employed the following ‘count’ variables as dependent variables in the analyses.

67
• SC level
o Number of patients who registered for antenatal care services
o Number of patients who received postnatal care services
• PHC level
o Total number of patients, including inpatients and outpatients
• CHC level
o Total number of patients, including inpatients and outpatients
4.4.3.2 Independent variables
The selection of independent variables in this study was guided by a demand–supply
framework provided by Ensor and Cooper (Ensor & Cooper 2004). The study included a
number of supply- and demand-side variables that were available in the DLHS-3 dataset.
Most of these variables were found to be associated with healthcare utilization in various
settings around the world. For instance, the presence of an auxiliary nurse midwife (ANM)
was found to be associated with an increase in maternal healthcare utilization by a study in
South India (Navaneetham & Dharmalingam 2002). Similarly, other supply-side factors such
as drugs, physical infrastructure, in-service training, equipment, and accessibility were also
found to be influential in shaping healthcare utilization patterns (Valdivia 2002; Peters et al.
2008; Kumar & Prakash 2013; Blankart 2012; Agrawal et al. 2012; S. Kumar et al. 2014;
Kesterton et al. 2010)
Although the focus of the study was to examine the effect of health worker availability on
health service utilization at public health facilities in rural India, the analysis also considered
a number of other supply- and demand-side factors that are considered to be important
predictors of healthcare service utilization. All of the variables, including health worker-
related variables, used in the analysis can be grouped into the following seven categories: a)
health personnel, b) drugs, c) equipment, d) infrastructure, e) quality-related variables, f)
geographic variables, and g) socioeconomic and demographic variables. A detailed
description of the variables included in the analysis is given in the following paragraphs.
Health worker variables
Since SCs are ideally supposed to have two ANMs (one permanent and another contractual),
the DLHS-3 asked a question as to whether the position of a specific worker at a health SC
was filled. Using this information, a health worker variable for SCs – which combined
permanent and contractual ANM-related variables – was generated. It had four categories:

68
HSC without an ANM, HSC with only a permanent ANM (reference category), HSC with
only a contractual ANM, and HSC with both ANMs.
At the PHC level, three indices showing the availability of ‘doctors’, ‘nurses’, and allied
health professionals’ were created. Each one of these continuous indices measured the
availability of doctors (permanent medical officers, contractual medical officers, AYUSH
medical officers, and lady medical officers), nurses (staff nurses, nurse midwives, ANMs,
LHVs), and allied health professionals (pharmacists, lab technicians). The index for doctors
and nurses ranged from 0 to 4, and for allied health workers it ranged from 0 to 2, with health
facilities receiving 1 point for having each type of health personnel.
At the CHC level, four categorical variables for the four streams of CHC health workers –
i.e., specialists, general duty medical officers/doctors, nurses, and allied health professionals
– were created by recoding the already existing variables in the dataset. The recoded variable
for specialists had five categories named after the number of specialists – ‘none’ (reference
category), ‘one or two’, ‘three or four’, ‘five and six’, and ‘seven and above’. Similarly, the
variable representing allied health professionals also had five categories – ‘none’ (reference
category), ‘one or two’, ‘three or four’, ‘five and six’, and ‘seven and above’. The recoded
variable for nurses had seven categories in total – ‘none’ (reference category), ‘one to three’,
‘four to six’, ‘seven to nine’, ‘ten to twelve’, ‘thirteen to fifteen’, and ‘fifteen and above’. The
variable for general duty medical officers had six categories – namely, ‘none’ (reference
category), ‘one’, ‘two’, ‘three’, ‘four’, and ‘five and above’.
Other variables
The availability of drugs at the SCs was captured using two binary variables – one for iron–
folic acid (IFA) tablets/syrup and another for paracetamol tablets. An index was created to
capture the availability of essential obstetric care drugs. The index ranged from 0 to 5, with
HSCs receiving one point for having each of the following obstetric care drugs: gentamycin,
magnesium sulphate, ampicillin, metronidazole, and misoprostol. At the PHC and CHC level,
the variable capturing drug availability was constructed using same methodology. The index
ranged from 0 to 18 for PHCs and 0 to 15 for CHCs. The list of drugs that a PHC and CHC
should have can be found in the DLHS-3 questionnaires.
To measure the availability of medical equipment at the SC level, the following binary
variables were used: blood pressure instrument, weighing scale for adults, and Sims
speculum. Two indices, one for PHC and the other for CHC, were created to capture
69
equipment availability, as described in the previous paragraph. The index for PHCs ranged
from 0 to 22 and that for CHCs ranged between 0 and 32.
The availability of furniture and instruments at the SCs was measured using three categorical
variables – namely, the availability of a labour table, an examination table, and a bed screen
(with the following categories applicable to all three variables – available and functional
(reference category), available but unusable, and not available) – and they were included in
the SC analysis. Two indices, one for PHC and the other for CHC, were created to capture the
availability of furniture and instrument equipment. The index for PHCs ranged from 0 to 17
and that for the CHCs ranged between 0 and 13.
To capture the quality of a SC and to check whether high-quality facilities were likely to
deliver a higher volume of service, three additional binary variables were included. The first
two of these binary variables captured the quality of an ANM by asking whether the ANM
had received ‘integrated skills development training’ and ‘skilled birth attendance training’
anytime during last five years preceding the survey. The third binary variable that captured
the quality of HSCs was whether the village health and sanitation committee (VHSC)
monitored the ANMs’ work on a regular basis. At the PHCs and CHCs, a variable measuring
whether Rogi Kalyan Samiti (also known as a Patient Welfare Committee – a facility-based
management structure that aims to provide quality healthcare services by engaging the local
population in the decision-making process) was established at the facility. At the PHC level,
to measure the quality of a medical officer, a continuous index was created, which measured
the number of different trainings that medical officers had undergone. The index ranged from
0 to 12, with facilities receiving 1 point if a medical officer underwent each of the 12 types of
trainings. Similarly, the index assessing the quality of medical officers and paramedical staff
at the CHCs was also calculated. The index for medical officers ranged from 0 to 9 and that
for paramedical staff ranged between 0 and 7.
The following variables were included to capture the availability of basic amenities and
infrastructure at the SCs: a categorical variable for electricity supply (with categories ‘regular
supply’ (reference category), ‘irregular supply’, ‘no electricity connection’), and three binary
variables for water, toilets, and telephone facilities. At the PHCs, three variables were
included: a count of communication and transport facilities (telephone, Internet, NIC
terminal, computer, and vehicle) available at the PHC, the availability of an electricity
generator, and whether the PHC functions 24 hours a day, 7 days a week. For the CHC-level
analysis, to measure the availability of basic amenities and infrastructure, a continuous index
70
was created. The index ranged from 0 to 4, with CHCs receiving 1 point for having each of
the following facilities: a designated government building, the availability of an electricity
connection, the availability of generator, and separate toilets for males and females. A
variable measuring whether a CHC functions as a first referral unit was also included.
The analysis of SCs included a categorical variable that captured the effect of the distance of
the ANMs’ actual residence from the SC village where s/he works. The variable has four
categories – namely, ‘within 4 kilometres’ (reference category), ‘5–20 kilometres’, ‘21–40
kilometres’, and ‘more than 40 kilometres’. In the PHC- and CHC-level analysis, a location
(urban or rural) variable was included. A variable of ‘region’ (as described in section 4.6.2)
was included in all analyses.
A number of demand-side variables that were well-known determinants of the demand for
healthcare services were included, such as socioeconomic, demographic, and geographical
factors (Metcalfe & Adegoke, 2013; Midhet, Becker, & Berendes, 1998; Patel & Ladusingh,
2015; A. Singh, Kumar, & Pranjali, 2014; P. K. Singh, Rai, Alagarajan, & Singh, 2012;
Sunil, Rajaram, & Zottarelli, 2006; ten Hoope-Bender, Liljestrand, & MacDonagh, 2006). All
of these variables were calculated for the district as a whole. These variables included a log
of the population living in the catchment area of the facility, a district-level fertility indicator
(the total fertility rate was calculated using birth-order information from the DLHS-3 ever-
married women dataset), the average number of years of education among mothers, the
percentage of households in the lowest economic quartile (as defined by an asset score
calculated from the DLHS-3 household file), and the percentage of Hindu households in a
given district. All of the aforementioned variables were continuous variables.
4.4.4 Variables for research question 5
To answer research question five, two propensity score analyses – the first to measure the
effect of a 2nd ANM effect and the second to measure the effect of an AYUSH doctor on
healthcare utilization – were conducted. The outcome variables and the variable included to
create a propensity score to match the treated and untreated group are given below.
4.4.4.1 Outcome variables
The analysis for the 2nd ANM included four outcome variables: the number of antenatal care
registrations, the number of maternal postnatal care services provided, the number of infant
postnatal care services provided, and the number of patients treated for minor ailments. The
71
analysis regarding the AYUSH doctor included four variables as well: the number of male
inpatients, the number of female inpatients, the number of male outpatients, and the number
of female outpatients. The exposure time was same for all variables: 30 days.
4.4.4.2 Treatment variables
For the HSC analysis, the treatment variable is ‘whether a 2nd ANM is available’ and for the
PHC analysis, it is ‘whether an AYUSH doctor is available’.
4.4.4.3 Matching variables
To match sub-centres, the following continuous variables were used in the analysis – ANM
training, equipment, infrastructure, furniture, and essential drugs. The ANM and MHW
interaction was also used. A log of the catchment population, region (north and central
regions were merged into one category to balance the variable), fertility rate, maternal
education, and monitoring by a village health and sanitation committee are defined in
previous sections.
For PHCs, the total number of health workers excluding an AYUSH doctor, whether a PHC
is open 24×7 (yes/no), rural location (yes/no), rogi kalyan samiti (patient welfare committee)
established at a PHC (yes/no), availability of a labour room (yes/no), basic emergency
obstetric care training by a medical officer (yes/no), integrated skills development training
(yes/no), IMNCI (child illness) training (yes/no), safe delivery (SBA) training (yes/no), four
or more beds available (yes/no), regular electricity (yes/no), a toilet (yes/no), a telephone
(yes/no), tap water available (yes/no), a generator available for electricity (yes/no), and
equipment, furniture, and essential drugs (continuous variables – the score represents the
number of equipment, furniture, or essential drugs at the facilities), as well as total fertility,
maternal education, proportion of poor, proportion of Hindus, and the log of the catchment
population were already defined in previous sections.
4.5 Data analysis methods
This section provides a description of the analytical methods employed in this study in order
to accomplish the objectives stated at the end of Chapter 3.
4.5.1 Measuring and decomposing distributional inequality
The first objective of the present study is to examine changes in health worker availability
and in their distributional inequality across rural public health facilities in India and its states.
The overall availability at health facilities has been measured by averaging the total number
72
of health workers at facilities at the national and state level. To measure this change, the
average number of health workers over the course of two years (2002–2004 and 2012–2013)
was compared. To measure the change in the availability of individual workers, the
proportion of health facilities without health workers was calculated for 2002–2004 and
2012–2013 for each state, separately. Then, the proportions for 2002–2004 and 2012–2013
were compared.
To accomplish the second part of the first objective, which seeks to measure inequality in the
human resource distribution in public health facilities in rural India for 2002–2004 and 2012–
2013, the study uses two widely used measures of inequality: the Gini and Theil T. In the
section below, these two methods that measure inequality have been described in detail. The
section also provides the rationale for selecting these measures of inequality over others.
In statistics, a variety of indices are available to understand the characteristics of any
distribution. All indices can be categorised into three types: a) location, b) variability, and c)
shape. The first type provides a synthesis of the representative value of the distribution. The
main indices of this category are the mode, median, and mean. The second type is a kind of
statistical index that synthesizes the attitude of the distribution to take different values.
Among these indices are the range, the relative mean deviation, the variance, and the
coefficient of variation. The third type provides information about the shape of the
distribution (normal, asymmetric, peaked, etc.). Skewness and kurtosis are the main indices
used to obtain information on shape. These methods have long been used to measure
inequality. These indices are often known as ‘simple measures of inequality’ (Bellù &
Liberati, 2006).
A good measure of inequality should satisfy the following six principles: a) symmetry – if
incomes are swapped among the members of the population, there should be no change in the
measure of inequality; b) Pigou–Dalton transfer sensitivity – this means that the transfer of
income from rich to poor should reduce the measured inequality; c) population size
independence; d) decomposability – this means that the measured inequality may be broken
down by population groups or income sources, or in other dimensions; e) mean independence
– if all incomes are doubled, the measured inequality would not change; and f) statistical
testability – the measure of inequality should be testable for the significance of changes in the
index. This is not a problem nowadays, as confidence intervals can typically be generated
using bootstrap techniques (Cowell, 2011). The ‘simple measures of inequality’ mentioned in
the previous paragraph do not satisfy all of the aforementioned conditions.

73
However, there are number of ‘complex inequality measures’ that do satisfy most of the
conditions described in the previous paragraph. The Gini coefficient and the Theil T are two
such measures of inequality. The reason for choosing the Theil T is that it is additively
decomposable, which allows researchers to account for different sources of inequality
(Bartley 2004). The reason for including the Gini coefficient, despite the fact that it is not
additively decomposable (Lambert & Aronson 1993), is that it is the most well-known and
extensively computed measure of inequality, and it has both an upper bound (one) and a
lower bound (zero); further, it is easy to understand and compare (income, consumption, etc.)
(Anand, 2010). Although the Theil T measure has the most desirable decomposition property,
it is not defined when there are zero health workers in a geographical unit (Bourguignon
1979; Shorrocks 1980). Other members of the class of decomposable indices (the
Generalized Entropy (GE) class) have significantly less attractive decomposition properties
(Atkinson 1970), so they have not been used in this study. Brief descriptions of how the Gini
coefficient and the Theil T are computed are given in the following sections.
4.5.1.1 Lorenz curve and the Gini coefficient of inequality
Among the most popular measure of inequality, which has almost all of the properties (except
for decomposability) of a good inequality measure, is the Gini coefficient. It is derived from
the Lorenz curve, which is a plot of the cumulative frequency of total health workers against
the cumulative proportion of health facilities/units where these health workers are posted (see
Figure 4.4).
To estimate the Gini coefficient, the first graph of the cumulative proportion of health
facilities (in ascending order) on the horizontal axis and the cumulative proportion of
available health workers on the vertical axis is rendered (Gastwirth 1972). The Lorenz curve
shown in the figure below is based on Indian data on doctors posted at CHCs. The diagonal
line represents perfect equality. The Gini coefficient is defined as P/(P+Q), where P and Q
are the areas shown on the graph. If P=0, the Gini coefficient becomes 0, which means that
there is perfect equality; conversely, if Q=0, the Gini coefficient becomes 1, which means
that there is complete inequality. In this example, the Gini coefficient is about 0.35.
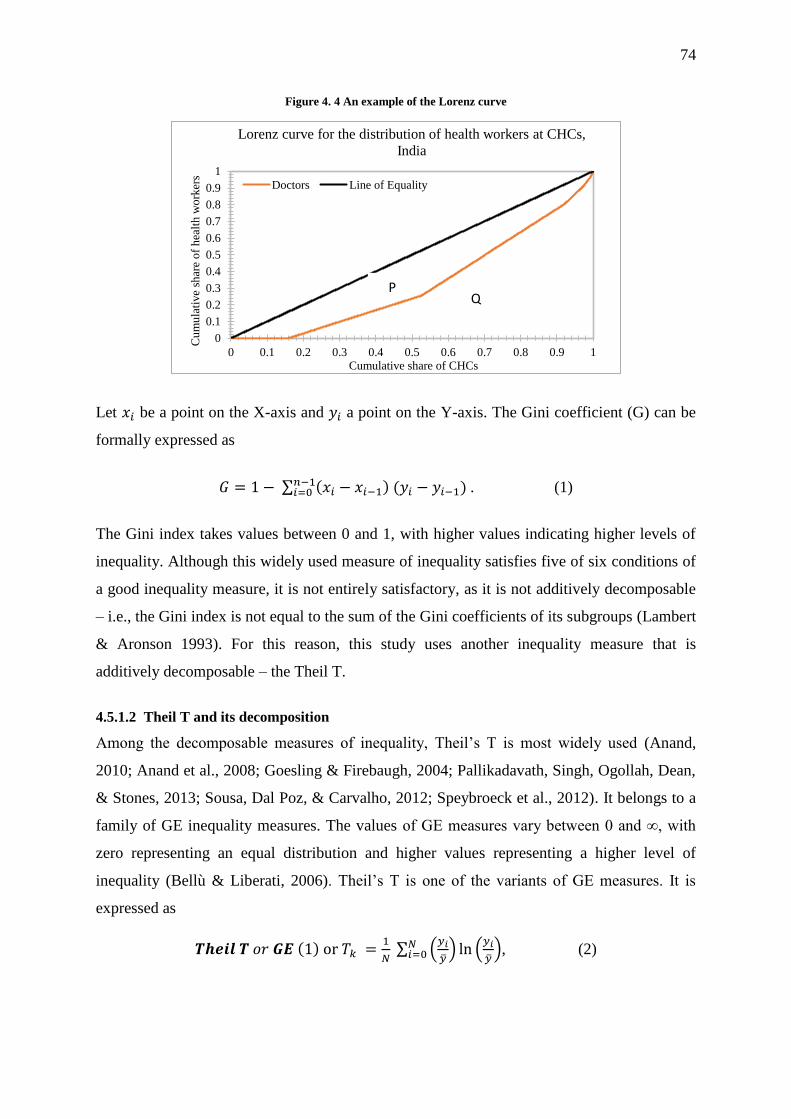
74
Figure 4. 4 An example of the Lorenz curve
Let 𝑥𝑖 be a point on the X-axis and 𝑦𝑖 a point on the Y-axis. The Gini coefficient (G) can be
formally expressed as
𝐺 = 1 − ∑ (𝑥𝑖 − 𝑥𝑖−1) (𝑦𝑖 − 𝑦𝑖−1)𝑛−1𝑖=0 . (1)
The Gini index takes values between 0 and 1, with higher values indicating higher levels of
inequality. Although this widely used measure of inequality satisfies five of six conditions of
a good inequality measure, it is not entirely satisfactory, as it is not additively decomposable
– i.e., the Gini index is not equal to the sum of the Gini coefficients of its subgroups (Lambert
& Aronson 1993). For this reason, this study uses another inequality measure that is
additively decomposable – the Theil T.
4.5.1.2 Theil T and its decomposition
Among the decomposable measures of inequality, Theil’s T is most widely used (Anand,
2010; Anand et al., 2008; Goesling & Firebaugh, 2004; Pallikadavath, Singh, Ogollah, Dean,
& Stones, 2013; Sousa, Dal Poz, & Carvalho, 2012; Speybroeck et al., 2012). It belongs to a
family of GE inequality measures. The values of GE measures vary between 0 and ∞, with
zero representing an equal distribution and higher values representing a higher level of
inequality (Bellù & Liberati, 2006). Theil’s T is one of the variants of GE measures. It is
expressed as
𝑻𝒉𝒆𝒊𝒍 𝑻 𝑜𝑟 𝑮𝑬 (1) or 𝑇𝑘 =1
𝑁 ∑ (
𝑦𝑖
��) ln (
𝑦𝑖
��)𝑁
𝑖=0 , (2)
0
0.1
0.2
0.3
0.4
0.5
0.6
0.7
0.8
0.9
1
0 0.1 0.2 0.3 0.4 0.5 0.6 0.7 0.8 0.9 1
Cu
mu
lati
ve
shar
e o
f h
ealt
h w
ork
ers
Cumulative share of CHCs
Lorenz curve for the distribution of health workers at CHCs,
India
Doctors Line of Equality
PQ

75
where 𝑦𝑖 is number of health workers at the health facility, �� is the (national) average number
of health workers at health facilities, and N is the total number of health facilities in the
country. 𝑇𝑘 represents the inter-unit (inter-facility) inequality. Thus, the fundamental idea
behind the Theil index is that it measures the divergence between the structure of the
distribution of health workers across groups and the structure of the distribution of health
facilities across the same groups. Groups that have their fair share of health workers
contribute nothing to the Theil index. If all groups have their fair share of income, the Theil
index attains its minimum value: zero (Conceição & Ferreira 2000).
The decomposition of the Theil T involves a partition of units (of analysis) into mutually
exclusive and exhaustive groups (such as rural–urban strata or provinces/states in the
country), as well as a calculation of two separate components of overall inequality: a
weighted sum of inter-unit (‘inter-health facility’ in the present study) inequality within each
group (state/province), called the “within-group” component, and a “between-group”
component that measures inequality that is solely due to variations in health-worker density
across groups (Anand, 2010). If there are ‘m’ groups, Theil T assumes the following form:
𝑇 = ∑ (𝑛𝑘
𝑛
��𝑘
��)𝑚
𝑘=1 𝑇𝑘 + ∑𝑛𝑘
𝑛(
��𝑘
��)𝑚
𝑘=1 𝑙𝑛 (��𝑘
��). (3)
The first term in (3) is the weighted average of the Theil inequality indices of each group 𝑇𝑘,
with weights represented by the total income (health worker) share, (the product of
population (health facility) shares and relative mean income (health worker) share). This
gives the ‘within’ part of the decomposition. The second term is the Theil Index, which is
calculated using subgroup means ��𝑘 instead of actual health worker availability. This follows
the logic of replacing actual health worker distributions in each group with the average
availability of health workers of the same group. This is the ‘between’ part of the
decomposition (Conceição & Ferreira 2000).
The ‘between’ inequality values can be either negative or positive, depending on the health
workers’ share in comparison with the health facility’s share. A negative value for the
between inequality measure is an indication of health workers’ lower share when compared
to the health facility’s share. The between values are always positive. When between and
within inequalities are combined, they give the net contribution of the state to overall
inequality. Again, the net (within and between) contribution of each state could be negative
or positive, and the total of values is the overall Theil’s T, which is always positive
76
(Pallikadavath et al. 2013). The Theil T calculation and its decomposition analysis was
performed using Stata12 via the ‘ineqdeco’ command (Jenkins 2015).
4.5.2 Count (Poisson and Negative Binomial) regression
Poisson and Negative Binomial regression have been used to answer research questions three
and four. While the third research question aims to examine the factors associated with health
worker availability at public health facilities, the fourth research question intends to examine
the association between human resource availability at health facilities and the ‘volume of
healthcare service utilization’ during the last month preceding the survey.
Prior to implementing any multivariate analysis, it was necessary to thoroughly examine the
data to attain a basic understanding of the data and relationships between the variables.
Therefore, all dependent variables were examined for the shape of their distribution. All
variables were checked for outliers, missing values, and any illogical values (health facilities
serving populations of ‘zero’ or 999,999,999). All missing values were removed from the
analysis. Missing data under 10% are considered to be generally ignorable (Hair et al. 1998).
The proportion of missing values in none of the analyses crossed 1%. Outliers were also
removed after careful consideration. Values representing non-response categories, such as ‘do
not know’ and ‘missing’, had numeric values such as 98; 99; 998; 999; 9,998; 9,999, and so
on. Observations (health facilities) containing these values were not included in the analysis.
A bivariate analysis was conducted to see how health facility characteristics are distributed.
All dependent variables included in the analysis share certain properties: (a) their values are
always non-negative integers/whole numbers; (b) their lowest possible value is zero; and (c)
they are often positively skewed, with most values being low and relatively few high values.
Such variables are known as “count variables” (Cameron & Trivedi 1998). Such variables are
generally dealt with Poisson or negative binomial regression. For details of the dependent
variables used in these analyses, see the section on dependent variables in this chapter.
Poisson regression is very popular and it is often used for modelling count data. Both of these
models have a number of advantages over the traditional ordinary least squares (OLS)
regression model. The possibility of using a Poisson regression model is ruled out because of
its strict assumption that the mean and variance of the dependent variable should be the same
(Land et al. 1996). None of the dependent variables in this study have equal mean and
variance. All of them exhibit a clear over-dispersion. In such cases, where there is an element
77
of over-dispersion, a Poisson regression model usually produces inefficient estimates. On the
other hand, a negative binomial model does not require the assumption of equality of the
mean and variance, and it allows for unmeasured characteristics that generate over-dispersion
in the count data (Gardner et al. 1995). Hence, a negative binomial model is preferred over a
Poisson model for the analyses.
The generalised negative binomial regression model used in this study can be expressed as:
𝑌𝑓𝑑 = 𝛽0 + 𝛽1𝑋1 + 𝛽2𝑋2 + 𝛽3𝑋3 + ⋯ + 𝛽𝑘𝑋𝑘 + (𝜎𝑑) + 휀𝑓𝑑, (4)
where Y is the outcome variable, the volume of health services delivered during the last
month preceding the survey, at health facility f in district d, and Xn represents the facility and
district-level socioeconomic and demographic factors affecting this outcome. 휀𝑓𝑑 is the
random effect that varies at the district level (휀𝑓𝑑∼N(0, σd)). The random intercept 휀𝑓𝑑
captures the effect of latent district-specific covariates that cause some districts to have
facilities that produce a greater volume of services than others, such as fewer private clinics
or the socioeconomic or demographic characteristics of the population that potentially affect
the demand for health services at public health facilities. In the first step, each model was
developed using a constant term alone, and then a stepwise incremental approach was used to
introduce different variables into the model. A likelihood-based objective measure (the
Bayesian Information Criterion, or BIC) was compared for each of the models. The
catchment population of the health facility served as the ‘exposure’ variable.
The results of the negative binomial regression have been presented in the form of incidence
rate ratios, which can be obtained by using the ‘IRR’ option in the Stata12 software package.
An IRR greater than 1 implies that an increase in the dependent variable is associated with an
increase in the outcome variable, and vice versa. P-values and confidence intervals for
estimates were also provided with the IRRs.
Alpha, the over dispersion parameter, is presented at the bottom of each model. If alpha is
zero, then the data are not over-dispersed and a Poisson model is suitable. If alpha is greater
than zero, then the data are over-dispersed and the negative binomial distribution models the
data more accurately than the Poisson distribution. To test that the dispersion parameter alpha
is equal to zero, a likelihood ratio chi-square test was applied, the results of which are also
presented along with the models. The large test statistics with very small P-values suggest
that the response variable is over-dispersed and is better estimated using a negative binomial
model than a Poisson model.

78
This study used the BIC to assess the adequacy of the model. The BIC identifies the model
that is more likely to have generated the observed data. Unlike many Pseudo R2 measures, the
information measures have penalties for including variables that do not significantly improve
fit. Particularly with large samples, the information measures can lead to more parsimonious
but adequate models. The smaller the value of the statistic (or the more negative the value),
the better the model fit. The extent to which one model is preferred over another depends on
the magnitude of the difference. Raftery proposed the following guidelines: 0–2 = weak; 2–6
= positive; 6–10 = strong; and >11 = very strong (Raftery 1999).
After the regression, the residuals from each full model were tested for the presence of
heteroscedasticity by first using a graphical method, followed by Park’s test and the Glejser
test (Gujarati 2004). In the presence of heteroscedasticity, although the estimated coefficients
remain unbiased and consistent, the estimated standard errors are not reliable (Gujarati 2004).
If the test results confirmed the presence of heteroscedasticity, White’s robust procedure
(using the ‘robust’ command in Stata12) was applied to obtain robust standard errors.
Normality of residuals was checked using a quantile plot, which was produced using the
“qnorm” option post-regression.
One of the most important steps in the regression analysis is to check for evidence of
multicollinearity. Multicollinearity exists when two or more of the predictors in a regression
model are moderately or highly correlated. It decreases the precision of the estimated
regression coefficients as more predictor variables are added to the model (Gunst & Webster
1975). The presence of multicollinearity increases the standard errors and widens the
confidence intervals, thus making it difficult to demonstrate that the coefficient is
significantly different from zero. Apart from influencing the statistical significance of the
coefficients or the overall model, excessive multicollinearity in the model does not only
produce incorrect coefficients, but it can also occasionally change the direction of the
relationship.
The common method used to detect multicollinearity is to look for large correlations among
pairs of predictor variables (Helms, 1982). Looking at correlations only among pairs of
predictors, however, is limiting. It is possible that the pairwise correlations are small, and yet
a linear dependence exists among three or more variables. Therefore, this study uses another
method that quantifies how much the estimated errors – i.e., the variances – of the estimated
coefficients are inflated when multicollinearity exists. This is known as the variance inflation
factor (VIF) (O’brien 2007). The VIF gets its name from the fact that the square root of the

79
VIF is the degree to which the standard errors have increased due to multicollinearity. For
instance, if the VIF for a variable is 4, it means that the standard error has doubled due to
multicollinearity. On the other hand, a VIF of 1 means that there is no correlation among the
kth predictor and the remaining predictor variables and, hence, the variance of the estimated
coefficient is not inflated at all. The general rule of thumb is that VIFs exceeding 4 deserve
further investigation, while VIFs exceeding 10 are signs of severe multicollinearity requiring
correction (O’brien 2007).
In the present study, multicollinearity was checked using VIF as post-estimation procedure.
In some cases, wherever there was high multicollinearity, the variables were
removed/recoded/transformed and then entered into the regression analysis. The VIF for each
model was provided in the appendix. The Stata (version 12.0) statistical software was used
for the analysis (StataCorp 2011).
After fitting the final model and performing all necessary checks, the final step is to ensure
the model’s generalizability and transferability. To achieve this, one needs to test the
regression model on new data/samples from the population where a previous sample was
collected. However, it is not always possible to collect new data due to many constraints,
such as time and money. In such cases, the researchers often divide the sample that they
already have into two parts and validate their results using those samples. This method is
known as the split sample validation test.
In the present study, it was not possible to collect a new sample against which to validate the
results of the present study. Therefore, to validate the results, following every regression
model, the sample was randomly divided into two samples. A uniform random variate in (0,
1) was generated for each record, and the entire dataset was then sorted using the random
number. The first 50 percent of the observations were used as ‘Dataset B’, whereas the
remaining 50 percent of observations were considered as ‘Dataset C’. Stata12 was used to
estimate the model parameters with a negative binomial error distribution for each of
Datasets B and C (StataCorp 2011). First, the coefficient of the variables obtained from all
three datasets (A, B, and C) was compared to identify that the signs of the coefficients were
consistent among the three models. In order to check for consistency and reliability, the
model coefficients from Datasets B and C were further compared via a T test by using the
following formula:
𝑇𝐵𝐶 =𝛽𝐵−𝛽𝐶
√𝑆𝐵2+𝑆𝐶
2 (5)

80
Where, 𝑇𝐵𝐶 is the absolute difference between 𝛽𝐵 and 𝛽𝐶, which are estimated coefficients
from sub-samples B and C. 𝑆𝐵2 and 𝑆𝐶
2 are corresponding standard errors. The coefficient of
model B is not significantly different from the coefficient of model C when the estimated
values of 𝑇𝐵𝐶 are below 1.96.
4.5.3 Propensity score matching (PSM)
The study adopted PSM analysis to estimate the effect of the availability of recently
introduced health workers under the NRHM (the contractual 2nd ANM at the SC and the
AYUSH doctor at the PHC) on healthcare utilization – i.e., the number of patients served,
which is the fifth and final research question (see section 3.10). PSM is a useful tool that can
evaluate the treatment effect for cross-sectional/observational/non-experimental data when
randomized clinical trials, which are considered the gold standard approach for estimating the
effect of treatments/interventions on outcomes, are not feasible (Luo et. al, 2010).
4.5.3.1 Why PSM?
As mentioned at the outset of this chapter, the study proposed to evaluate the effect of the
availability of a 2nd ANM and an AYUSH doctor (henceforth, in this section, these workers
will be referred to as ‘new workers’) on healthcare utilization in terms of the number of
patients treated. Therefore, the basic aim was to compare the outcomes (the number of
patients treated) between those health facilities that had a new worker and those that did not.
Such a comparison could be straightforward, provided that the selection of those health
facilities with a new health worker is random and that the selection process is not correlated
with the outcome of interest. In such cases, the average outcome for health facilities with new
workers could be simply compared to those facilities without new workers, as health facilities
with new workers are expected to be statistically equal in all characteristics under
consideration. The average differences in the number of patients in this type of situation
could be convincingly attributed to the effect of the availability of new workers. This was
possible only if the data were collected through randomized controlled trials.
In cross-sectional settings, the assignment of subjects to treatment and control groups is often
random. The same is the case with DLHS-3. The facilities where new workers were deployed
may be systematically different from those facilities where new workers were not deployed.
In such a situation, the estimate of the effect of new workers might be biased due to the
existence of confounding factors.
81
Generally, the effect of a treatment on an outcome is estimated using a multiple regression
equation. For instance, the current study could have applied a multiple regression equation
using the number of patients and the availability of new workers as the outcome; a set of
control variables could also be used to account for all other observable differences between
facilities with and without new workers. The regression coefficient would thus be the
measure of the effect of the availability of new workers and a causal interpretation would be
assumed. However, the results from the regression models could be biased, especially when
the treated and non-treated groups differ substantially (Luo et al. 2010).
One alternative solution was to use matching methods to create comparable groups of
exposed and unexposed health facilities. However, this type of matching would be an
increasingly complex task if the number of covariates was to increase. PSM was therefore
chosen to overcome this problem. It allows matching to be based on a score function of
observable characteristics.
4.5.3.2 Estimating the propensity score
Little guidance is available regarding the functional form that one should use for a PS model.
In general, the choice should be influenced by the quality of the matching achieved. Hence,
this study used a logit model. There exists little information about how the variables for a PS
model should be selected. Brookhart (2006) suggested that any variables that are unrelated to
exposure, but related to the outcome, should ‘always’ be included in a PS model. The
inclusion of such variables is expected to increase the precision of the estimated effect of
exposure without increasing bias. In contrast, including variables that are related to the
exposure, but not to the outcome, is expected to decrease the precision of the estimated effect
of exposure without decreasing bias (Brookhart et al. 2006).
Since the goal of a PS model is to efficiently control for confounders and not to predict
treatment or exposure, the present study did not apply any model-building strategies based on
a “hit or miss method” or on statistical significance, which are often used to develop good
predictive models of exposure. The reason why no such strategy was adopted is that such
variable selection criteria will miss important confounding variables that have a weak
relationship to exposure, but a strong relationship to outcomes (Caliendo & Kopeinig 2005).
It is suggested that omitting important variables can seriously increase bias in resulting
estimates. Rubin and Thomas (1996) also suggest that models not be trimmed in the name of
parsimony. They advise that a variable should only be excluded from the analysis if one is
fully confident that the variable under consideration is either unrelated to the outcome or not

82
a proper covariate. If one is not sure about these two points, the authors suggest including the
relevant variables in the PS estimation (Rubin & Thomas 1996).
Following the suggestions provided by the researchers mentioned above, the current study
included only those variables that were either solely related to the outcome, or that were
related to both outcome and exposure. Variables were not excluded based on ‘statistical
significance’ and the ‘hit or miss method’, as the purpose of a PS model is not to predict the
exposure, but to efficiently control for confounders. Therefore, all the chosen variables were
kept in the model despite their statistical non-significance.
4.5.3.3 Calculation of propensity score
The propensity score is defined as the conditional probability of receiving treatment given a
set of observed covariates. In the context of the present study, it represents the probability of
new worker availability at a health facility, given various background characteristics:
𝑝(𝑋) = 𝑃𝑟(𝐷 = 1|𝑋) (6)
where D = {0,1} is the indicator of the availability of new workers and 𝑋 is the
multidimensional vector of pre-treatment characteristics.
4.5.3.4 Matching correction algorithm
There are a number of different matching methods that have been developed in the last few
decades. Their main motive is to match as many individuals with control individuals (in our
case, the individuals are health facilities) as possible. This study applied several measures of
matching to achieve balance in the covariates. The results showed that the average
standardized bias was maximally reduced through biweight kernel matching with
replacement. Therefore, among all matching methods available, the study chose to make use
of biweight kernel matching with replacement, which is one of the options available in
Stata12’s PSMATCH2 package (Leuven & Sianesi 2003).
4.5.3.5 Balancing test
Since matching is not based on covariates, but on propensity scores, it should be able to
balance the distribution of chosen variables in both the treatment and comparison groups. To
achieve this, a balancing test was performed in this study, but only on those observations that
were within the common support region. Some researchers argue that imposing a common
support region could sometimes discard high-quality matches at the boundary of the region,
while others say that imposing such restrictions in the estimation of propensity scores
improves the quality of estimates. This study, however, imposed the common support for the
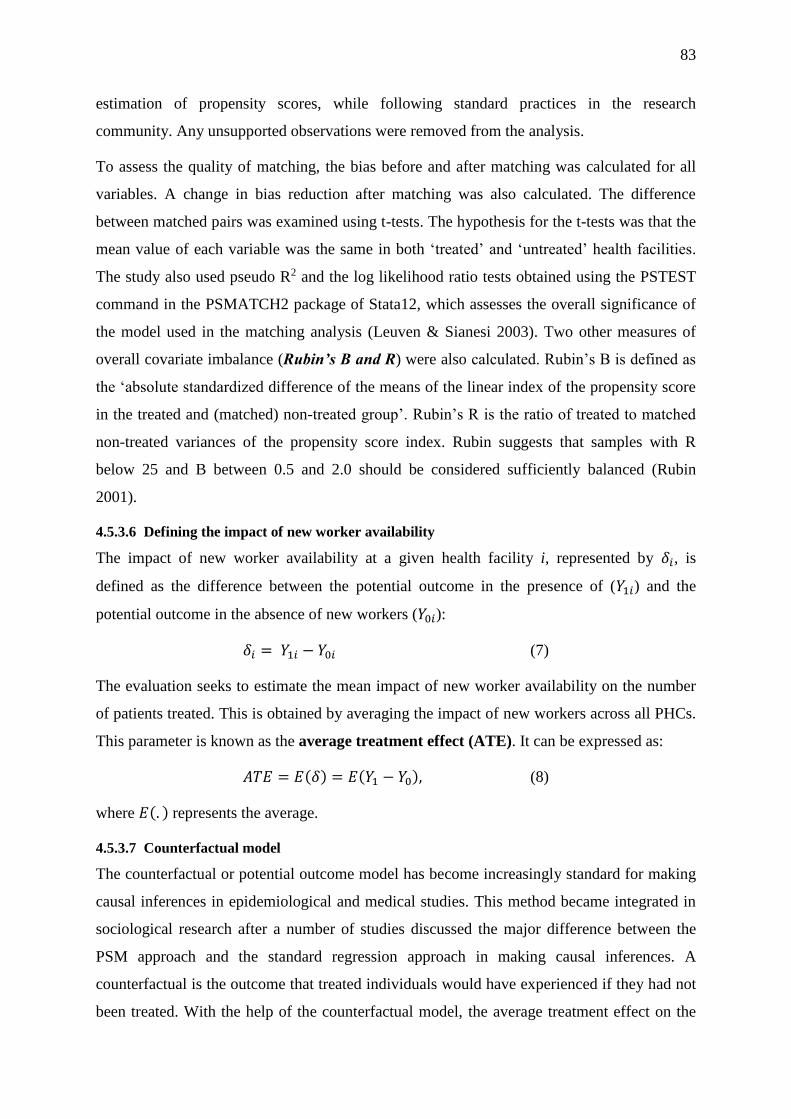
83
estimation of propensity scores, while following standard practices in the research
community. Any unsupported observations were removed from the analysis.
To assess the quality of matching, the bias before and after matching was calculated for all
variables. A change in bias reduction after matching was also calculated. The difference
between matched pairs was examined using t-tests. The hypothesis for the t-tests was that the
mean value of each variable was the same in both ‘treated’ and ‘untreated’ health facilities.
The study also used pseudo R2 and the log likelihood ratio tests obtained using the PSTEST
command in the PSMATCH2 package of Stata12, which assesses the overall significance of
the model used in the matching analysis (Leuven & Sianesi 2003). Two other measures of
overall covariate imbalance (Rubin’s B and R) were also calculated. Rubin’s B is defined as
the ‘absolute standardized difference of the means of the linear index of the propensity score
in the treated and (matched) non-treated group’. Rubin’s R is the ratio of treated to matched
non-treated variances of the propensity score index. Rubin suggests that samples with R
below 25 and B between 0.5 and 2.0 should be considered sufficiently balanced (Rubin
2001).
4.5.3.6 Defining the impact of new worker availability
The impact of new worker availability at a given health facility i, represented by 𝛿𝑖, is
defined as the difference between the potential outcome in the presence of (𝑌1𝑖) and the
potential outcome in the absence of new workers (𝑌0𝑖):
𝛿𝑖 = 𝑌1𝑖 − 𝑌0𝑖 (7)
The evaluation seeks to estimate the mean impact of new worker availability on the number
of patients treated. This is obtained by averaging the impact of new workers across all PHCs.
This parameter is known as the average treatment effect (ATE). It can be expressed as:
𝐴𝑇𝐸 = 𝐸(𝛿) = 𝐸(𝑌1 − 𝑌0), (8)
where 𝐸(. ) represents the average.
4.5.3.7 Counterfactual model
The counterfactual or potential outcome model has become increasingly standard for making
causal inferences in epidemiological and medical studies. This method became integrated in
sociological research after a number of studies discussed the major difference between the
PSM approach and the standard regression approach in making causal inferences. A
counterfactual is the outcome that treated individuals would have experienced if they had not
been treated. With the help of the counterfactual model, the average treatment effect on the

84
treated (ATT) was calculated. The ATT measures the impact of new worker availability on
the number of patients in those health facilities with new workers:
𝐴𝑇𝑇 = 𝐸(𝑌𝑖|𝐷 = 1) − 𝐸(𝑌0|𝐷 = 1), (9)
where, 𝐸(𝑌𝑖|𝐷 = 1) is the average number of patients treated at health facilities with a new
worker. 𝐸(𝑌0|𝐷 = 1) is the counterfactual outcome; it is the average number of patients that
those health facilities with new workers would have treated, had these facilities not had new
workers, which is unobserved.
Another measure is the average treatment effect in the untreated (ATU), which provides the
impact that new workers would have had on the number of patients treated in those health
facilities without new workers:
𝐴𝑇𝑈 = 𝐸(𝑌𝑖|𝐷 = 0) − 𝐸(𝑌0|𝐷 = 0), (10)
where 𝐸(𝑌𝑖|𝐷 = 0) is the average number of patients treated at health facilities without a new
worker. 𝐸(𝑌0|𝐷 = 0) is the counterfactual outcome; it is the average number of patients that
those health facilities without new workers would have treated, had they not had new
workers, which is unobserved.
The main aim of the study was to calculate the ATE:
𝐴𝑇𝐸 = 𝐸(𝑌𝑖|𝐷 = 1) − 𝐸(𝑌0|𝐷 = 0) = Δ
Δ can also be written as 𝐴𝑇𝑇 + 𝐸(𝑌0|𝐷 = 1) − 𝐸(𝑌0|𝐷 = 0)
Δ = 𝐴𝑇𝑇 (if 𝐸(𝑌0|𝐷 = 1) = 𝐸(𝑌0|𝐷 = 0). (11)
If equation (11) is true, then the ATT can be estimated by the difference between the mean
observed outcomes for treated and untreated units (health facilities). However, the equation is
often not true in several cases. The main goal of evaluation is to ensure that the selection bias
is equal to 0 in order to correctly estimate the parameter of interest. Matching is the solution
used to overcome this problem.
4.5.3.8 Sensitivity analysis for estimates
As discussed in the previous paragraphs, all matching estimators are based on a strong
assumption that only observable covariates account for the selection process where
individuals are placed into the treatment and control conditions. In other words, matching-
based estimates of treatment effects are considered unbiased only if there are no unobserved
confounders, and only if all relevant covariates have been included in the model. This is a
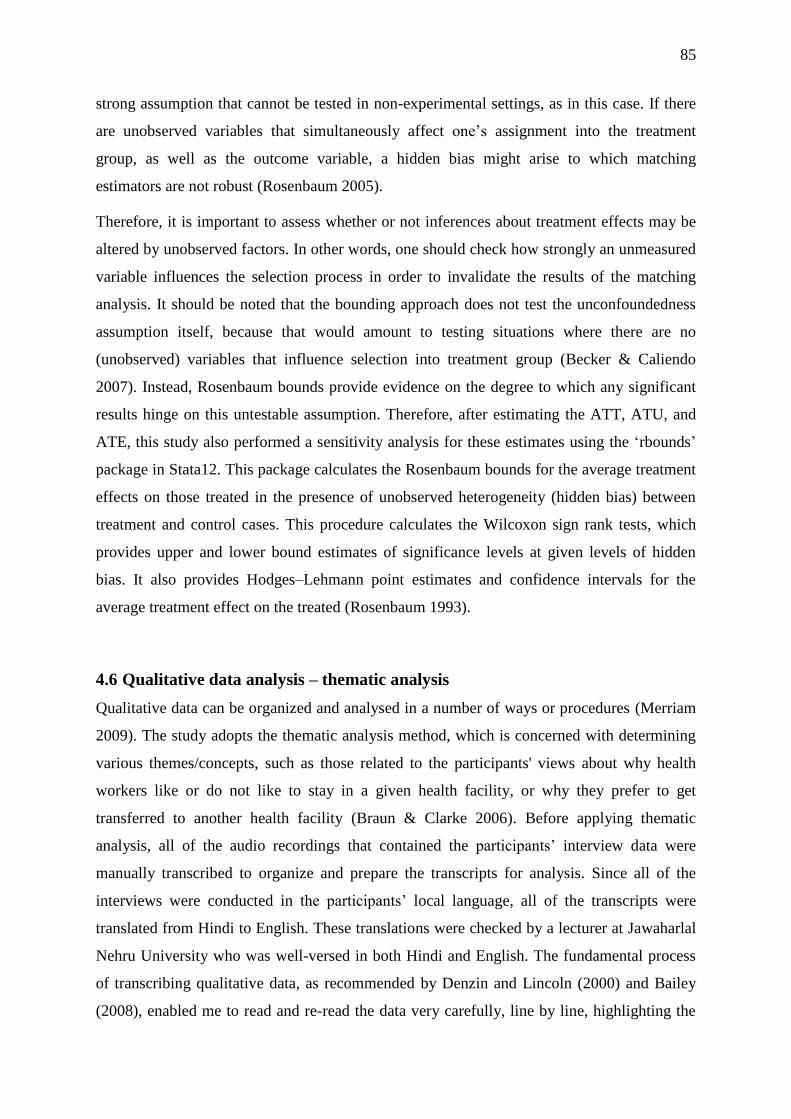
85
strong assumption that cannot be tested in non-experimental settings, as in this case. If there
are unobserved variables that simultaneously affect one’s assignment into the treatment
group, as well as the outcome variable, a hidden bias might arise to which matching
estimators are not robust (Rosenbaum 2005).
Therefore, it is important to assess whether or not inferences about treatment effects may be
altered by unobserved factors. In other words, one should check how strongly an unmeasured
variable influences the selection process in order to invalidate the results of the matching
analysis. It should be noted that the bounding approach does not test the unconfoundedness
assumption itself, because that would amount to testing situations where there are no
(unobserved) variables that influence selection into treatment group (Becker & Caliendo
2007). Instead, Rosenbaum bounds provide evidence on the degree to which any significant
results hinge on this untestable assumption. Therefore, after estimating the ATT, ATU, and
ATE, this study also performed a sensitivity analysis for these estimates using the ‘rbounds’
package in Stata12. This package calculates the Rosenbaum bounds for the average treatment
effects on those treated in the presence of unobserved heterogeneity (hidden bias) between
treatment and control cases. This procedure calculates the Wilcoxon sign rank tests, which
provides upper and lower bound estimates of significance levels at given levels of hidden
bias. It also provides Hodges–Lehmann point estimates and confidence intervals for the
average treatment effect on the treated (Rosenbaum 1993).
4.6 Qualitative data analysis – thematic analysis
Qualitative data can be organized and analysed in a number of ways or procedures (Merriam
2009). The study adopts the thematic analysis method, which is concerned with determining
various themes/concepts, such as those related to the participants' views about why health
workers like or do not like to stay in a given health facility, or why they prefer to get
transferred to another health facility (Braun & Clarke 2006). Before applying thematic
analysis, all of the audio recordings that contained the participants’ interview data were
manually transcribed to organize and prepare the transcripts for analysis. Since all of the
interviews were conducted in the participants’ local language, all of the transcripts were
translated from Hindi to English. These translations were checked by a lecturer at Jawaharlal
Nehru University who was well-versed in both Hindi and English. The fundamental process
of transcribing qualitative data, as recommended by Denzin and Lincoln (2000) and Bailey
(2008), enabled me to read and re-read the data very carefully, line by line, highlighting the

86
transcripts as a whole; I did this a number of times to obtain a general sense of the
participants’ views (Denzin & Lincoln 2000; Bailey 2008). As suggested by Creswell and
Clark (2011), I also began to write notes about any initial ideas along the margins of the
transcribed data, which helped to not only save my time, but it also facilitated the coding
process (Cresswell & Clark, 2011).
Following this, the coding process was completed; this involved labelling or attaching names
to key relevant chunks of data in the study. Codes included the key words, phrases, sentences,
and paragraphs that represented the participants' views about health worker
availability/distribution across different health facilities within the district, their views about
their own preferences about posting, and their perceptions about government policies on the
recruitment, transfer, and attrition of health workers. A few key points were considered while
coding the relevant chunks of data from the dataset, as recommended by Creswell and Clark
(2011). Among those, I considered instances when participants repeated selected coded
chunks in several places, as well as when they discussed some unexpected chunks – points
that the participants themselves had highlighted. Last but not least, I further sought guidance
from the existing literature about the targeted issues. Additionally, I also kept verifying the
notes that were taken during the fieldwork, and I considered them while coding the chunks of
data. In short, it can be said that the process of coding facilitated me in further reducing and
organizing the data into useful codes.
In the next step, as recommended by many researchers such as Robson (2002) and Tuckett
(2005), primary categories, also called themes, were created by bringing together at least two
or more important, but related, codes (Robson 2002; Tuckett 2005). Throughout this process
of creating specific themes, I followed certain key steps. Specifically, I went through the
previously created codes, reread them, and spotted the similarities and dissimilarities very
carefully (Tuckett 2005). While generating the themes, I also kept in mind those factors that
were already found to be significantly associated with overall health worker availability
across health facilities in quantitative analysis. Finally, as suggested by Creswell and Plano
Clark (2011), I also considered similar themes and concepts in the existing literature, which
discussed the factors that affect a health worker’s choice of working at a given health facility
(Creswell & Plano Clark, 2011).

87
4.6.1 Procedure for addressing issues of validity and reliability in qualitative data
transcription
I followed certain key procedures to analyse both the validity and reliability of the qualitative
data. Qualitative validity is concerned with a researcher’s ability to verify the accuracy of the
findings; this can be accomplished by employing certain procedures such as using a rich and
thick context description, clarifying personal biases, presenting negative information, using
peer de-briefing, performing triangulation of different data sources, and many more
(Cresswell, 2014). I adopted the first three methods to determine the qualitative validity of
the study. I also attempted to clarify the possible personal bias in the findings by providing a
rich background of the Sitapur district and its public health system, which included
presenting the latest information on the availability of different kinds of health workers in the
district. Along with these results, I mentioned potential sources of bias that could have crept
up during the data collection process. Furthermore, I also stated which measures I took to
prevent influencing the participants’ views.
Finally, I tried to ensure the reliability of the qualitative results as well, which is related to a
researcher's ability to consistently follow other key researchers' recommended procedures in a
given study. I followed, to the best of my ability, the most highly recommended standard
procedures to collect and analyse these data. These methods included adopting the semi-
structured interview approach using suitable interview guides, transcribing the data, and
creating themes (Creswell & Plano Clark, 2011).

88
5 Chapter 5 Results: Availability and Inequality in the
Distribution of Health Workers
5.1 Introduction
This chapter presents the results of the analysis that was conducted in order to accomplish the
first aim of the thesis: to examine the change in the availability of health workers and the
inequality of their distribution across publicly funded health facilities in rural India. To
analyse the change in health worker availability, the data from DLHS-2 (2002–2004) and
DLHS-4 (2012–2013) were utilized. The results are presented for all three levels of health
facilities – health sub-centres (HSCs), primary health centres (PHCs), and community health
centres (CHCs). At the outset, the average number of health workers available at HSCs,
PHCs, and CHCs has been calculated for all the states for both time periods to assess whether
overall HRH availability has improved over the study period. Subsequently, the proportion of
health facilities without health workers for two time periods has been compared. The results
for each health worker category are followed by a discussion (to know which health worker
categories have been included in the analysis, see section 4.6.1). Later in the chapter, the
results of health worker inequality analysis have also been presented. The Theil T and Gini
indexes have both been used to measure health worker inequality across different types of
health facilities in rural India. The results of the inequality decomposition analysis have been
presented alongside the result of the inequality analysis. A summary of the results and main
conclusions derived from this chapter is given at the end.
5.1.1 Availability of human resources
5.1.1.1 Average number of health workers at HSCs, PHCs, and CHCs
In 2002–2004, the average number of health workers at sub-centres was 1.39. The number
has risen only slightly (by 0.14) since then. The average number of health workers at the
HSCs in 2012–2013 was 1.53. The average at state level varies from as low as 1.02 in Tamil
Nadu to as high as 2.28 in Assam. While some states have witnessed an increase in their
averages over the study period, others have experienced a decrease. For instance, the North-
Eastern states of Manipur, Tripura, Meghalaya, and Assam and the states of Haryana and
Andhra Pradesh have registered a growth of more than 0.60 points in average availability. In
contrast, socioeconomically underdeveloped states like Uttaranchal, Uttar Pradesh,
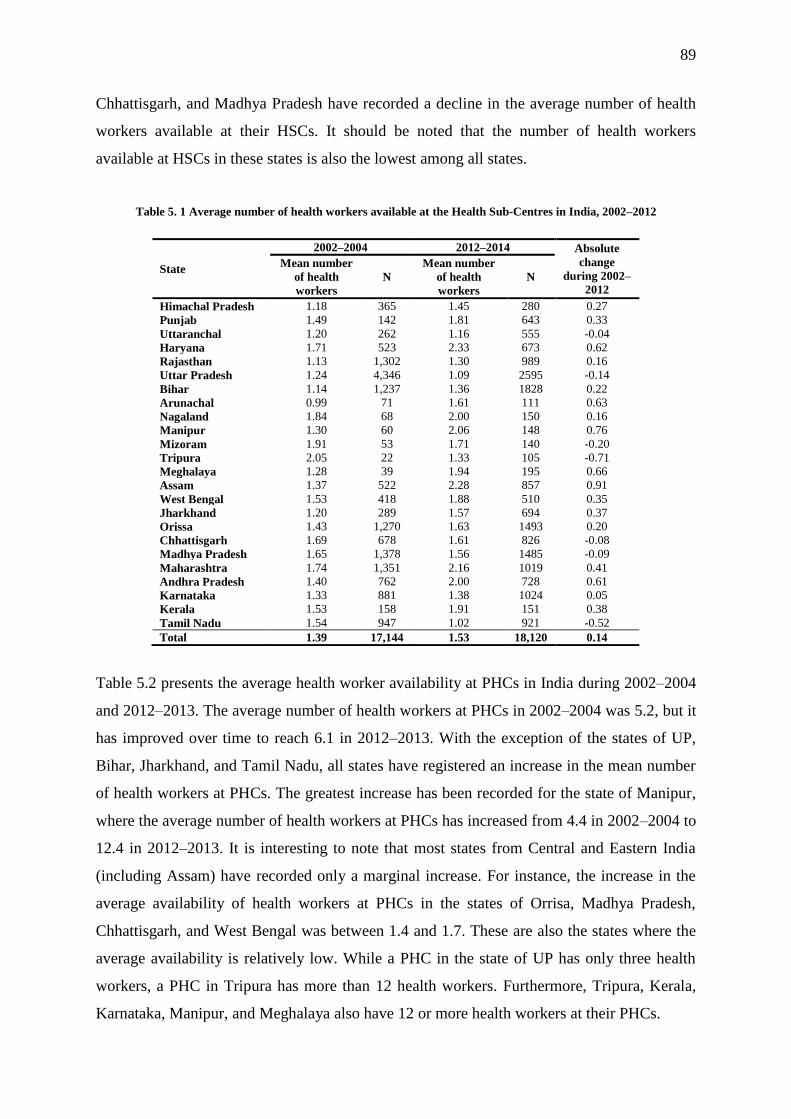
89
Chhattisgarh, and Madhya Pradesh have recorded a decline in the average number of health
workers available at their HSCs. It should be noted that the number of health workers
available at HSCs in these states is also the lowest among all states.
Table 5. 1 Average number of health workers available at the Health Sub-Centres in India, 2002–2012
State
2002–2004 2012–2014 Absolute
change
during 2002–
2012
Mean number
of health
workers
N
Mean number
of health
workers
N
Himachal Pradesh 1.18 365 1.45 280 0.27
Punjab 1.49 142 1.81 643 0.33
Uttaranchal 1.20 262 1.16 555 -0.04
Haryana 1.71 523 2.33 673 0.62
Rajasthan 1.13 1,302 1.30 989 0.16
Uttar Pradesh 1.24 4,346 1.09 2595 -0.14
Bihar 1.14 1,237 1.36 1828 0.22
Arunachal 0.99 71 1.61 111 0.63
Nagaland 1.84 68 2.00 150 0.16
Manipur 1.30 60 2.06 148 0.76
Mizoram 1.91 53 1.71 140 -0.20
Tripura 2.05 22 1.33 105 -0.71
Meghalaya 1.28 39 1.94 195 0.66
Assam 1.37 522 2.28 857 0.91
West Bengal 1.53 418 1.88 510 0.35
Jharkhand 1.20 289 1.57 694 0.37
Orissa 1.43 1,270 1.63 1493 0.20
Chhattisgarh 1.69 678 1.61 826 -0.08
Madhya Pradesh 1.65 1,378 1.56 1485 -0.09
Maharashtra 1.74 1,351 2.16 1019 0.41
Andhra Pradesh 1.40 762 2.00 728 0.61
Karnataka 1.33 881 1.38 1024 0.05
Kerala 1.53 158 1.91 151 0.38
Tamil Nadu 1.54 947 1.02 921 -0.52
Total 1.39 17,144 1.53 18,120 0.14
Table 5.2 presents the average health worker availability at PHCs in India during 2002–2004
and 2012–2013. The average number of health workers at PHCs in 2002–2004 was 5.2, but it
has improved over time to reach 6.1 in 2012–2013. With the exception of the states of UP,
Bihar, Jharkhand, and Tamil Nadu, all states have registered an increase in the mean number
of health workers at PHCs. The greatest increase has been recorded for the state of Manipur,
where the average number of health workers at PHCs has increased from 4.4 in 2002–2004 to
12.4 in 2012–2013. It is interesting to note that most states from Central and Eastern India
(including Assam) have recorded only a marginal increase. For instance, the increase in the
average availability of health workers at PHCs in the states of Orrisa, Madhya Pradesh,
Chhattisgarh, and West Bengal was between 1.4 and 1.7. These are also the states where the
average availability is relatively low. While a PHC in the state of UP has only three health
workers, a PHC in Tripura has more than 12 health workers. Furthermore, Tripura, Kerala,
Karnataka, Manipur, and Meghalaya also have 12 or more health workers at their PHCs.
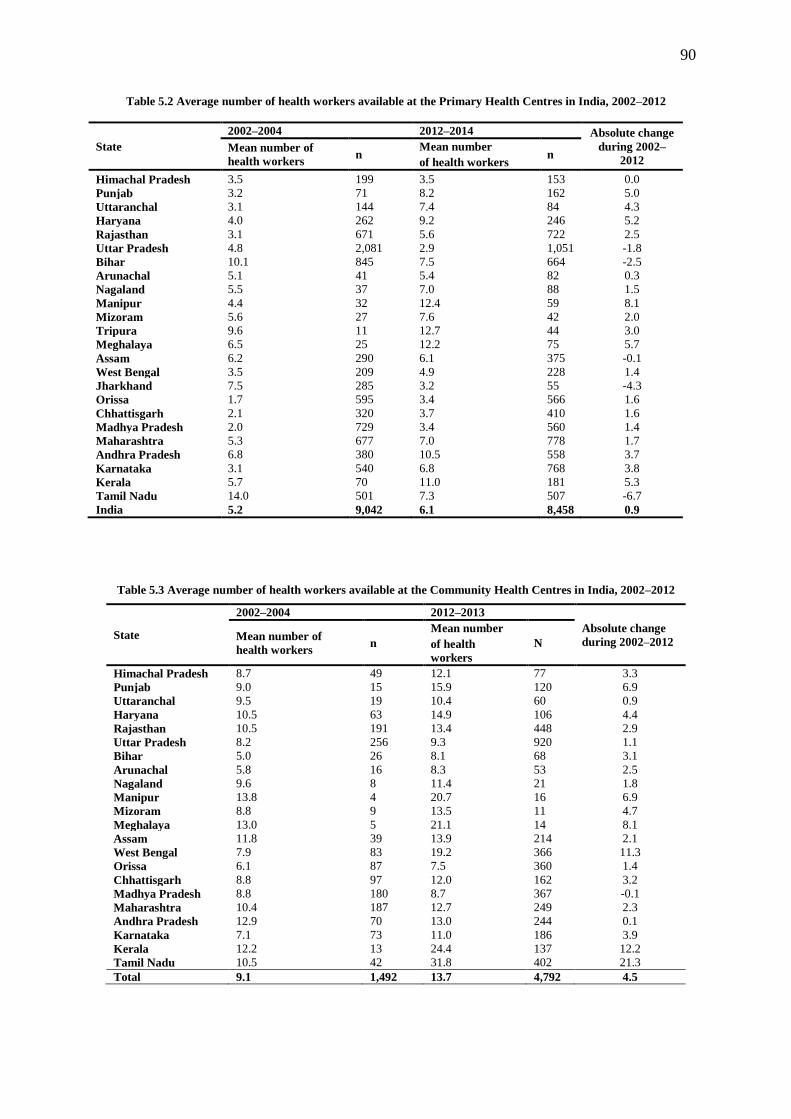
90
Table 5.2 Average number of health workers available at the Primary Health Centres in India, 2002–2012
State
2002–2004 2012–2014 Absolute change
during 2002–
2012 Mean number of
health workers n
Mean number n
of health workers
Himachal Pradesh 3.5 199 3.5 153 0.0
Punjab 3.2 71 8.2 162 5.0
Uttaranchal 3.1 144 7.4 84 4.3
Haryana 4.0 262 9.2 246 5.2
Rajasthan 3.1 671 5.6 722 2.5
Uttar Pradesh 4.8 2,081 2.9 1,051 -1.8
Bihar 10.1 845 7.5 664 -2.5
Arunachal 5.1 41 5.4 82 0.3
Nagaland 5.5 37 7.0 88 1.5
Manipur 4.4 32 12.4 59 8.1
Mizoram 5.6 27 7.6 42 2.0
Tripura 9.6 11 12.7 44 3.0
Meghalaya 6.5 25 12.2 75 5.7
Assam 6.2 290 6.1 375 -0.1
West Bengal 3.5 209 4.9 228 1.4
Jharkhand 7.5 285 3.2 55 -4.3
Orissa 1.7 595 3.4 566 1.6
Chhattisgarh 2.1 320 3.7 410 1.6
Madhya Pradesh 2.0 729 3.4 560 1.4
Maharashtra 5.3 677 7.0 778 1.7
Andhra Pradesh 6.8 380 10.5 558 3.7
Karnataka 3.1 540 6.8 768 3.8
Kerala 5.7 70 11.0 181 5.3
Tamil Nadu 14.0 501 7.3 507 -6.7
India 5.2 9,042 6.1 8,458 0.9
Table 5.3 Average number of health workers available at the Community Health Centres in India, 2002–2012
State
2002–2004 2012–2013
Absolute change
during 2002–2012 Mean number of
health workers n
Mean number
N of health
workers
Himachal Pradesh 8.7 49 12.1 77 3.3
Punjab 9.0 15 15.9 120 6.9
Uttaranchal 9.5 19 10.4 60 0.9
Haryana 10.5 63 14.9 106 4.4
Rajasthan 10.5 191 13.4 448 2.9
Uttar Pradesh 8.2 256 9.3 920 1.1
Bihar 5.0 26 8.1 68 3.1
Arunachal 5.8 16 8.3 53 2.5
Nagaland 9.6 8 11.4 21 1.8
Manipur 13.8 4 20.7 16 6.9
Mizoram 8.8 9 13.5 11 4.7
Meghalaya 13.0 5 21.1 14 8.1
Assam 11.8 39 13.9 214 2.1
West Bengal 7.9 83 19.2 366 11.3
Orissa 6.1 87 7.5 360 1.4
Chhattisgarh 8.8 97 12.0 162 3.2
Madhya Pradesh 8.8 180 8.7 367 -0.1
Maharashtra 10.4 187 12.7 249 2.3
Andhra Pradesh 12.9 70 13.0 244 0.1
Karnataka 7.1 73 11.0 186 3.9
Kerala 12.2 13 24.4 137 12.2
Tamil Nadu 10.5 42 31.8 402 21.3
Total 9.1 1,492 13.7 4,792 4.5
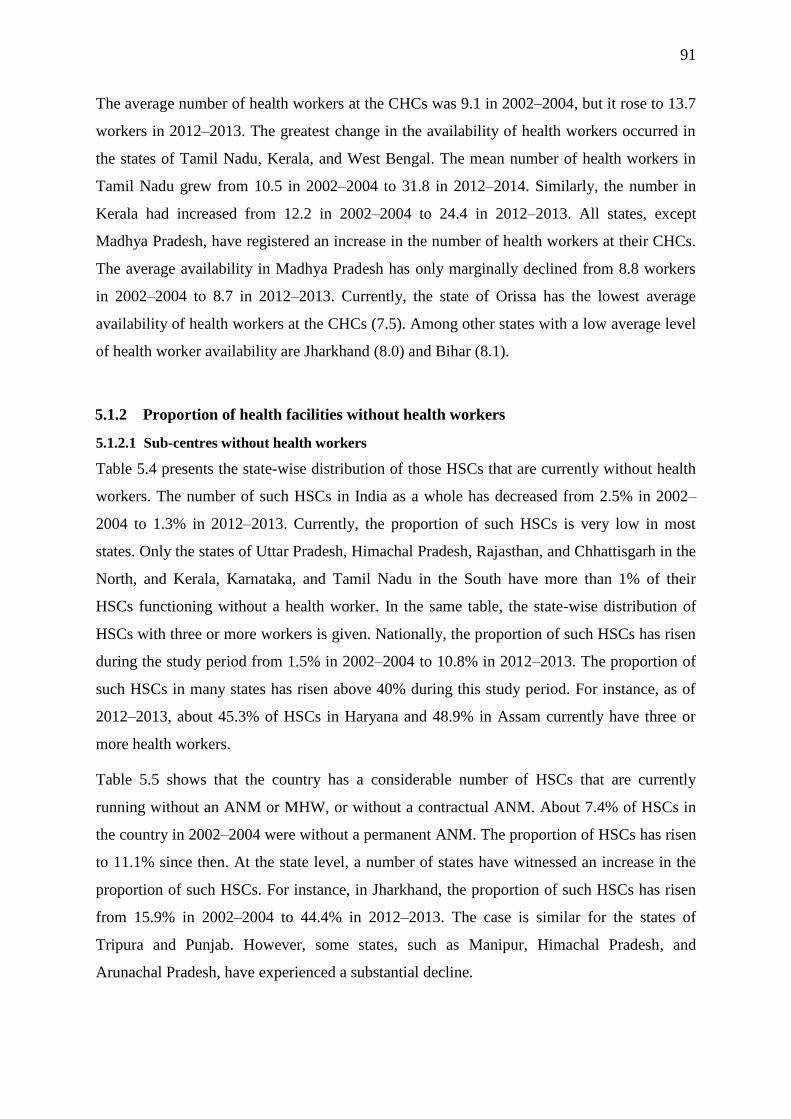
91
The average number of health workers at the CHCs was 9.1 in 2002–2004, but it rose to 13.7
workers in 2012–2013. The greatest change in the availability of health workers occurred in
the states of Tamil Nadu, Kerala, and West Bengal. The mean number of health workers in
Tamil Nadu grew from 10.5 in 2002–2004 to 31.8 in 2012–2014. Similarly, the number in
Kerala had increased from 12.2 in 2002–2004 to 24.4 in 2012–2013. All states, except
Madhya Pradesh, have registered an increase in the number of health workers at their CHCs.
The average availability in Madhya Pradesh has only marginally declined from 8.8 workers
in 2002–2004 to 8.7 in 2012–2013. Currently, the state of Orissa has the lowest average
availability of health workers at the CHCs (7.5). Among other states with a low average level
of health worker availability are Jharkhand (8.0) and Bihar (8.1).
5.1.2 Proportion of health facilities without health workers
5.1.2.1 Sub-centres without health workers
Table 5.4 presents the state-wise distribution of those HSCs that are currently without health
workers. The number of such HSCs in India as a whole has decreased from 2.5% in 2002–
2004 to 1.3% in 2012–2013. Currently, the proportion of such HSCs is very low in most
states. Only the states of Uttar Pradesh, Himachal Pradesh, Rajasthan, and Chhattisgarh in the
North, and Kerala, Karnataka, and Tamil Nadu in the South have more than 1% of their
HSCs functioning without a health worker. In the same table, the state-wise distribution of
HSCs with three or more workers is given. Nationally, the proportion of such HSCs has risen
during the study period from 1.5% in 2002–2004 to 10.8% in 2012–2013. The proportion of
such HSCs in many states has risen above 40% during this study period. For instance, as of
2012–2013, about 45.3% of HSCs in Haryana and 48.9% in Assam currently have three or
more health workers.
Table 5.5 shows that the country has a considerable number of HSCs that are currently
running without an ANM or MHW, or without a contractual ANM. About 7.4% of HSCs in
the country in 2002–2004 were without a permanent ANM. The proportion of HSCs has risen
to 11.1% since then. At the state level, a number of states have witnessed an increase in the
proportion of such HSCs. For instance, in Jharkhand, the proportion of such HSCs has risen
from 15.9% in 2002–2004 to 44.4% in 2012–2013. The case is similar for the states of
Tripura and Punjab. However, some states, such as Manipur, Himachal Pradesh, and
Arunachal Pradesh, have experienced a substantial decline.
92
As far as the proportion of HSCs without a male health worker (MHW) is concerned, the rate
has risen from 60.6% in 2002–2004 to 68.1% in 2012–2013. All states except Assam,
Karnataka, and Kerala have recorded an increase in the proportion of such HSCs. In other
words, most states have witnessed a decline in the availability of MHWs at HSCs. The
proportion of such HSCs has currently reached over 90% in some states. For instance, about
98.2% and 96.9% of HSCs in the states of Uttar Pradesh and Bihar, respectively, are
currently functioning without MHWs. In South India, the proportion of such HSCs in Tamil
Nadu has increased from 47.0% to 95.3%, whereas in the neighbouring state of Kerala, the
proportion of such HSCs has reduced from 46.8% in 2002–2004 to 23.8% in 2012–2013.
Table 5. 4 Proportion of HSCs by the total number of health workers in position in India and its states, 2002–2012
State HSCs without a health worker HSCs with three health workers
2002–2004 2012–2013 2002–2004 2012–2013
Himachal Pradesh 15.9 1.8 0.3 0.7
Punjab 2.1 0.3 0.7 19.3
Uttaranchal 0.0 0.4 0.8 0.9
Haryana 1.0 0.7 8.0 48.9
Rajasthan 3.2 3.3 0.5 1.8
Uttar Pradesh 0.4 1.3 1.8 0.4
Bihar 11.7 0.4 0.7 1.3
Arunachal Pradesh 19.7 2.7 1.4 9.9
Nagaland 0.0 0.0 8.8 19.3
Manipur 18.3 1.4 10.0 32.4
Mizoram 0.0 0.0 1.9 3.6
Tripura 0.0 0.0 9.1 2.9
Meghalaya 2.6 0.0 0.0 2.6
Assam 4.6 0.1 6.5 45.3
West Bengal 0.7 0.2 1.9 12.9
Jharkhand 6.2 0.7 0.7 9.5
Orissa 0.6 0.5 0.6 4.5
Chhattisgarh 0.7 1.9 4.0 4.6
Madhya Pradesh 0.8 0.8 1.7 9.2
Maharashtra 0.4 1.1 0.2 35.2
Andhra Pradesh 0.5 0.7 0.1 24.7
Karnataka 4.7 3.8 0.0 1.1
Kerala 0.0 3.3 0.0 16.6
Tamil Nadu 1.1 4.1 0.4 0.4
India 2.5 4.5 1.5 10.8
The proportion of HSCs without a contractual ANM in the country as a whole has declined
from 93.4% in 2002–2004 to 64.7% in 2012–2013. However, the decline has been uneven
across the states. As of 2012–2013, the proportion of such HSCs is lowest in the states of
Haryana (15.6%) and Meghalaya (11.3%). Assam and Jharkhand have also improved. For
instance, the proportion of such PHCs in Jharkhand declined from 97.6% in 2002–2004 to
21.8% in 2012–2013. Similarly, in Andhra Pradesh, the proportion diminished from 92.4% to
26% during 2002–2013. Nagaland, Manipur, Punjab, and Bihar have also witnessed

93
considerable declines in such HSCs during this period. Unfortunately, in some states that are
socioeconomically underdeveloped, the proportion of such HSCs is still considerably high
(above 85%). For instance, about 97.5%, 92.4%, and 89.8% of HSCs in Himachal Pradesh,
Chhattisgarh, and Uttar Pradesh, respectively, are still functioning without a contractual
ANM.
Table 5. 5 Proportion of health sub-centres without health workers in various Indian states in 2002–2004 and 2012–2013
State
Without an
Auxiliary Nurse-Midwife
Without a
Male Health Worker
Without a
Contractual Auxiliary Nurse-
Midwife
2002–2004 2012–2013 2002–2004 2012–2013 2002–2004 2012–2013
Himachal Pradesh 48.8 8.6 34.0 48.9 99.7 97.5
Punjab 11.3 26.3 40.9 54.3 99.3 38.3
Uttaranchal 1.2 1.6 86.6 94.6 92.4 87.9
Haryana 5.0 9.5 39.4 41.9 84.9 15.6
Rajasthan 6.7 9.3 85.5 89.4 94.6 71.7
Uttar Pradesh 1.3 5.0 85.9 98.2 89.2 87.7
Bihar 20.4 28.6 69.8 96.9 96.4 38.9
Arunachal Pradesh 78.9 30.6 28.2 53.2 94.4 55.0
Nagaland 1.5 1.3 23.5 76.0 91.2 22.7
Manipur 28.3 3.4 58.3 60.8 83.3 29.7
Mizoram 3.8 11.4 9.4 35.7 96.2 82.1
Tripura 0.0 41.0 4.6 34.3 90.9 91.4
Meghalaya 5.1 0.5 66.7 93.9 100.0 11.3
Assam 8.1 6.0 88.9 36.8 66.1 28.8
West Bengal 2.4 0.6 50.0 77.7 95.2 33.7
Jharkhand 15.9 44.4 66.1 76.8 97.6 21.8
Orissa 3.5 5.4 54.4 41.4 98.7 89.8
Chhattisgarh 16.2 10.8 29.4 36.1 87.0 92.4
Madhya Pradesh 10.8 5.5 26.8 59.6 97.9 79.1
Maharashtra 1.6 5.2 24.1 29.1 99.9 50.3
Andhra Pradesh 8.4 7.3 59.5 66.4 92.4 26.0
Karnataka 6.9 12.1 60.4 56.3 99.9 93.7
Kerala 3.2 6.6 46.8 23.8 97.5 78.8
Tamil Nadu 1.3 4.6 47.0 95.3 98.0 98.6
India 7.4 11.1 60.6 68.1 93.4 64.7
Discussion
The results presented in the previous section show that the average availability of health
workers has risen only slightly over the study period. It is still much below the IPHS norm of
three workers per health sub-centre. The IPHS advises that states should deploy at least two
ANMs and a male health worker at each health sub-centre. However, even after eight years
since the implementation of the NRHM, no states have come close to reaching this norm. Of
the 24 states included in the analysis, only six were successful at raising their average above
two health workers per HSC. However, these results are still quite encouraging, as there was
only one state with an average above two in 2002–2004. Moreover, the proportion of HSCs
with three health workers has risen considerably (see Table 5.4).
94
A disaggregated analysis by health workers presented in Table 5.5 reveals that the proportion
of HSCs without a permanent ANM is low across all states except Punjab, Bihar, and
Arunachal Pradesh. Arunachal Pradesh has witnessed a considerable decline in HSCs without
an ANM, which indicates the effort the state has made towards the training (as there is one
fully functional ANM training centre at Pasighat) and recruitment of ANMs during the study
period. However, 30% and 55% of HSCs still do not have permanent and contractual ANMs,
respectively. According to a report by the National Health System Resource Centre (2012a),
due to the shortage of ANMs in higher-level health facilities, the ANMs meant for HSCs are
frequently posted there, making things more difficult at the periphery.
The NRHM proposed equipping all HSCs with an additional ANM back in 2005. This
additional ANM was to be recruited and trained by the states on a contractual basis, but the
burden of their salary was to be borne by the central government. The results reveal that a
number of states have created additional posts for contractual ANMs, and they have been
successful in filling them (Malik 2009). Punjab, Haryana, Jharkhand, Assam, and Andhra
Pradesh are some of the states where the proportion of HSCs without a contractual ANM has
declined considerably. Punjab recruited a large number of ANMs in 2010–2011 on a
contractual basis in all districts except Amritsar (Government of Punjab 2010). Haryana, on
the other hand, has been conducting a small number of recruitments almost every year, as
based on its needs. As a result, 84% of HSCs in the state currently have a contractual ANM in
position (National Rural Health Mission 2012).
On other hand, there are states where very little progress has been made on this front. The
state of Uttar Pradesh is one of them, where 88% of HSCs are functioning without a
contractual ANM. The state has not sanctioned enough posts to deploy a second ANM for
each of its existing sub-centres, possibly because of resource constraints (Ministry of Health
and Family Welfare 2014b). Furthermore, the lack of functioning ANMTCs could be one of
the reasons why the state has not recruited any ANMs since 1992. The state has about 40
ANM training centres and 30 district training centres where ANMs’ pre-training service can
be conducted, but only a few of them are actually fully functional at present. No pre-service
training has taken place in the state between 1992 and 2004 because policymakers in the
early 1990s were convinced that the state had produced enough ANMs to serve the existing
HSCs for years to come. Hence, most training centres were shut down, and teaching and
administrative staff were gradually laid off. Since then, the policy has not witnessed any
changes despite the fact that the state’s population has doubled over the same period

95
(Government of Uttar Pradesh 2016). Since no training has taken place since 1992, the
existing cadre of ANMs serving at HSCs are on the verge of retirement age (60 years). The
cadre is likely to witness huge attrition in its numbers in the years to come. Therefore, the
state must take steps to recruit more ANMs in a timely manner.
In Tamil Nadu, the proportion of HSCs has remained stagnant at close to 100%. This is
because the state has made a policy decision to not recruit any contractual ANMs. Only a few
HSCs that are located in difficult areas have been provided with a second ANM (National
Health System Resource Centre 2012b). Similarly, the state of Himachal Pradesh still has
98% of its HSCs functioning without a contractual ANM. Himachal Pradesh has also decided
not to deploy any contractual ANMs at its sub-centres. Further, Kerala has decided not to
deploy a 2nd ANM, otherwise known as a Junior Public Health Nurse (JPHN) in this state
(Ministry of Health and Family Welfare 2011; Government of Kerala 2003). The state of
Orissa has not been able to make any significant progress in deploying contractual ANMs at
sub-centres, possibly due to the shortage of teaching staff at its training centres and their low
intake of students (Government of India 2010c). In Bihar, the proportion of HSCs without a
permanent ANM has increased, while those without contractual ANMs have decreased
during the study period. The reason behind this anomaly is that the state has not recruited
regular ANMs over the last two decades. The last time a permanent ANM was recruited in
the state was in the year 1994. Since 2007, however, ANMs in the state are being recruited on
a contractual basis (Government of India 2010b).
As for MHWs, their cadre was introduced back in the 1970s on the recommendation of a
health committee instituted by the Government of India. They were involved in the
implementation of a number of public health measures, such as the collection of drinking-
water samples, environmental sanitation, school health, adolescent health programs, and other
National Health Programs. However, in the early 1990s, the average intake in MHW training
programs slowly dropped and, in many states, training programs were completely shut down.
This point marks when the crisis of an MHW shortage began to build up (Ministry of Health
and Family Welfare 2010b). The results of the present study indicate that the crisis that
started in the early 1990s has further grown in size despite the fact that, under the NRHM, the
central government decided to bear most of the financial burden caused by the deployment of
MHWs.
The state governments were encouraged to create the requisite number of posts and to fill
them on a regular basis (Malik 2009). However, according to the Rural Health Statistics
96
(2014), most states have yet to sanction the requisite number of MHW posts (Ministry of
Health and Family Welfare 2014b). Also, a majority of training centres across the states are
still lying dormant. Some states have declared the MHW a dying cadre (Ministry of Health
and Family Welfare 2010b). Apart from that, it seems that several states are not comfortable
with the idea of recruiting MHWs, as they consider it an additional burden on the state
exchequer. Therefore, it is not surprising that the overall availability of MHWs at the sub-
centres during the study period has declined considerably.
The results disaggregated by the states reveal that the proportion of HSCs without an MHW
has increased in all states except Assam, Chhattisgarh, and Kerala. The situation in Uttar
Pradesh, Bihar, Uttaranchal, Rajasthan, and Tamil Nadu is even worse, where more than 90%
of HSCs are functioning without an MHW. As mentioned in the previous paragraph, the
unavailability of MHWs can be attributed to the lack of functional pre-service training
institutes. This is particularly true in the case of Rajasthan and Tamil Nadu. Tamil Nadu has
three and Rajasthan has seven male health worker training centres, but they are not functional
(National Health System Reseource Centre 2012b).
As for the states of Uttar Pradesh, Uttaranchal, and Bihar, there are no functional pre-service
training institutions for MHWs in these states (Ministry of Health and Family Welfare
2010b). According to the Department of Medical Health and Family Care of the Government
of Uttar Pradesh, back in 2008, the state had planned to establish its training capacity of
producing 1,500 MHWs per year. Although the year 2010 saw the induction of some 492
MHWs into the system, the dream of producing 1,500 MHWs is still a dream. The state of
Uttar Pradesh currently requires about 8,000 MHW-sanctioned posts to be fulfilled
(Government of Uttar Pradesh 2013). Filling the vacant posts of (male) MPHWs has been
successful in some states, notably in Assam and Kerala, and it is visible in the results of our
study as well (Ministry of Health and Family Welfare 2010b).
Apart from the lack of training institutions, another reason why the MHW positions have
remained unfilled in many states is the nature of their contractual appointment – such
appointments need to be renewed in a timely manner after they expire. However, this is often
not possible due to a number of reasons (Ministry of Health and Family Welfare 2010b).
Another reason why states have not been successful in recruiting MHWs could be the low
salary being offered. The central government offers only Rs.6000 (~£65) per month, which is
very low when compared to their permanent counterparts who receive around Rs.20000–
25000 per month for the same amount of work and level of responsibilities. MHWs are

97
indispensable to the success of public health programs. Their non-availability has been
adversely affecting the implementation of many health programs due to the overburdening of
the available ANMs. The introduction of several national health programs for non-
communicable diseases during twelfth five-year plan period also requires the services of
MHWs for their effective implementation at the field level. Hence, the central and state
governments should take steps to increase the availability of MHWs in sub-centres.
5.1.2.2 PHCs without health workers
Table 5.6 presents the state-wise proportions of PHCs without a health worker for 2002–2004
and 2012–2013. The proportion of such PHCs in India as a whole has declined from 3.1% in
2002–2004 to 2.1% in 2012–2013. The highest proportion of such PHCs is found in the states
of Madhya Pradesh (13.0%), Jharkhand (9.1%), Arunachal Pradesh (7.3%), and Kerala
(5.0%). The same proportion in the states of Uttar Pradesh, Bihar, Jharkhand, and Himachal
Pradesh varies between 2%–4%.
Table 5.6 Proportion of PHCs without a health worker and with six or more health workers in India, 2002–2012
State PHCs with no health worker PHCs with six or more health workers
2002–2004 2012–2013 2002–2004 2012–2013
Himachal Pradesh 2.5 2.6 2.3 2.0
Punjab 0.0 0.0 17.5 30.3
Uttaranchal 1.4 0.0 17.9 25.0
Haryana 1.5 0.0 41.3 51.6
Rajasthan 0.8 1.1 6.8 7.3
Uttar Pradesh 2.1 2.5 3.1 1.5
Bihar 0.0 2.0 73.3 40.2
Arunachal 0.0 7.3 14.6 6.1
Nagaland 0.0 0.0 23.6 30.7
Manipur 0.0 0.0 28.6 71.2
Mizoram 0.0 0.0 40.7 38.1
Tripura 0.0 0.0 56.8 81.8
Meghalaya 0.0 0.0 54.7 90.7
Assam 0.0 0.8 25.7 21.3
West Bengal 6.7 0.4 15.5 14.0
Jharkhand 3.2 9.1 6.7 3.6
Orissa 1.7 0.7 0.4 0.4
Chhattisgarh 12.8 3.7 1.0 1.0
Madhya Pradesh 18.9 13.0 1.3 1.4
Maharashtra 0.2 0.1 4.2 5.4
Andhra Pradesh 0.3 0.2 23.2 35.5
Karnataka 0.4 0.5 8.2 9.4
Kerala 0.0 5.0 31.0 44.8
Tamil Nadu 0.4 0.0 35.2 31.2
India 3.1 2.1 17.7 16.7
Table 5.6 also presents the state-wise proportion of PHCs with six or more health workers.
About 17.7% of all PHCs in the country fell into this category in 2002–2004. The proportion
has marginally declined since then to reach 16.7% in 2012–2013. The proportion of such

98
PHCs is highest in Meghalaya (90.7%), followed by Tripura (81.8%), Manipur (71.2%),
Haryana (51.6%), Kerala (44.8%), and Bihar (40.2). Uttar Pradesh (1.5%), Orissa (0.4%),
Chhattisgarh (1.0%), and Madhya Pradesh (1.4%) are the states with the lowest proportion of
such PHCs.
5.1.2.3 PHCs without supervisory staff (lady health visitor and male health supervisor)
Nationally, the proportion of PHCs without LHVs was 63.9% (see Table 5.7). With a decline
of 10.8% during 2002–2013, it currently stands at 53.1%. However, a number of states still
have more than 75% of their PHCs functioning without a LHV. Prominent among them are
Jharkhand (96.4%), West Bengal (91.7%), Bihar (80.9%), and Uttar Pradesh (78.0%). As for
MHAs, 56.1% of PHCs in the country were without functioning MHAs in 2002–2004. The
figure has only marginally increased since then. Currently, the figure stands at 59.2%. The
proportion of such PHCs in 2012–2013 was highest for the state of Uttar Pradesh (where
MHAs are unavailable in 90.3% PHCs) followed by West Bengal (89.9%), Jharkhand
(87.3%), and Orissa (86.6%). The proportion of such PHCs was only 8.3% in the state of
Kerala.
Table 5.7 Proportion of PHCs without a lady health visitor and male health assistant, 2002–2012
State Lady Health Visitor Male Health Assistant
2002–2004 2012–2013 2002–2004 2012–2013
Himachal Pradesh 76.4 61.4 71.9 77.1
Punjab 77.5 38.9 80.3 55.6
Uttaranchal 83.3 29.8 66.7 53.6
Haryana 77.1 36.2 70.6 29.3
Rajasthan 78.1 39.9 82.4 80.1
Uttar Pradesh 81.0 78.0 68.7 90.3
Bihar 86.5 80.9 73.6 72.7
Arunachal Pradesh 92.7 84.2 41.5 40.2
Nagaland 40.5 75.0 43.2 76.1
Manipur 59.4 45.8 56.3 55.9
Mizoram 81.5 83.3 55.6 76.2
Tripura 27.3 86.4 0.0 52.3
Meghalaya 64.0 17.3 32.0 52.0
Assam 84.8 77.3 70.7 77.1
West Bengal 94.3 91.7 95.2 89.9
Jharkhand 71.6 96.4 71.2 87.3
Orissa 100.0 63.8 99.3 86.6
Chhattisgarh 38.4 59.3 61.3 58.3
Madhya Pradesh 45.8 41.3 62.6 68.6
Maharashtra 9.6 12.7 8.7 10.5
Andhra Pradesh 23.7 20.4 20.8 17.7
Karnataka 55.2 59.6 76.7 26.3
Kerala 25.7 14.4 22.9 8.3
Tamil Nadu 5.6 47.1 8.0 77.1
India 63.9 53.1 56.1 59.2
99
Discussion
An LHV (also known as a female health assistant) is a senior ANM who has undergone a six-
month promotional training course and has been promoted to supervise the activities of
female ANMs (health assistants). One of the reasons behind the lack of LHVs in states is that
the administrative process of promoting someone has been made so cumbersome that only a
few ANMs opt for a promotional training course. The second reason for the lack of LHVs in
the states is rooted in the states’ ANM recruitment policies. For instance, the states of West
Bengal and Uttar Pradesh stopped recruiting ANMs in the late 1980s and early 1990s. Since
that time, LHVs are recruited from a pool of senior and experienced ANMs. These states had
no option but to stop LHV recruitment as well, as LHV recruitment would have led to a
shortage of ANMs at the sub-centres. An ANM shortage at the HSCs would, in turn, have
disrupted the functioning of health programs and the health system as a whole. West Bengal,
for example, declared ANMs a ‘dying cadre’ back in 1987, meaning that no such posts would
be created and no recruitment for that cadre would take place. Similarly, the state of Uttar
Pradesh stopped recruiting ANMs back in 1992, which continued until 2004, when the
government made a few temporary postings for vacant ANM positions.
West Bengal, however, has restarted its ANM and LHV training programs. Around 60 ANMs
in the state are now being recruited and trained as LHVs every year as of 2012 (Government
of West Bengal 2013). Although the state of Uttar Pradesh had planned to induct more ANMs
and train senior ANMs as LHVs back in 2008, these plans have never taken off, as the school
for LHV training is still not fully functional and new ANMs are not being recruited on a
regular basis. Jharkhand and Bihar also lack training facilities, and they are currently facing
the same sort of problems with ANM/LHV recruitment that their neighbouring states, Uttar
Pradesh and West Bengal, have been facing for decades.
A study in Orissa reveals that ANMs do not prefer to go for LHV training because they are
not posted as an LHV even after their training (Government of India 2010c). The case is
similar for LHVs in the Sitapur district of Uttar Pradesh, where the researcher, during his
fieldwork, found that many ANMs completed their LHV courses many years ago, but they
have not been posted as LHVs. Although Orissa has made considerable progress during the
study period, there is still a huge number of PHCs that currently function without LHVs. This
situation could be attributed to the fact that promotions are made irregularly to the LHV post,
as well as because of the shortage of LHV training institutions (one) in the state (Government
of India 2010c).
100
The high proportion of PHCs without an LHV in Bihar can be explained by the fact that most
ANMs in the state are working on a contractual basis and the state does not offer any
promotion policies through which these individuals can be promoted to LHV posts. However,
according to a recent report, the state is finalizing the proposal through which ANMs can
become LHVs in the future. The only LHV training school was closed in 1980, as the
requirement of LHVs in the state at that time was no longer in place. Another reason
underlying the shortage of LHVs could be the closure of the only LHV training school in the
state in that same year (Government of India 2010b). Uttaranchal is one of the states that
have witnessed a significant decline in the proportion of PHCs without an LHV. This can be
explained by the fact that, unlike other states, ANMs in the state are promoted to the post of
LHV on the basis of seniority before they are sent for training. In other states, ANMs have to
undergo LHV training before they can be promoted to the LHV post (Government of India
2010c).
Male health assistants (also known as male health supervisors) assist, supervise, and monitor
the activities of the MHWs under their supervision at HSCs. Senior MHWs are recruited and
trained for six months and promoted as MHAs. This cadre, along with MHAs, are possibly
the most neglected cadre in the Indian health system. In most states, their duties are not well
defined and they are often used whenever there is a shortage of workers in a health program.
The results reveal that the country is suffering from a huge shortage of MHAs.
A little more than half of the country’s PHCs do not have MHAs. This shortage can be
explained by the shortage of MHWs in the country. Most states are either slow in recruiting
MHAs, or they have not recruited MHAs at all for many years. For instance, in the late
1980s, the state of Uttar Pradesh has declared that MHWs represent a dying cadre. No
recruitments have been made since then. In Jharkhand, promotions and recruitment for
regular staff cadres were adjourned until 2009. This may be one reason why the proportion of
PHCs without MHAs (and also without LHVs) in the state has grown over the study period
(Government of India 2013).
Some states have made significant progress in creating new posts and filling up the existing
ones, however. One of these is Karnataka, where the proportion of PHCs without MHAs has
declined considerably due to the revival of the MHW program by the government of India’s
initiative under the NRHM, in which it decided to provide 100% support for engaging 9,655

101
contractual MHWs in 16 states for the 200 malaria-endemic and Kala-Azar-affected districts.
The state recruited about 1,200 MHWs in 2012 and promoted the old cadre as MHAs.
5.1.2.4 PHCs and CHCs without a doctor
Table 5.8 displays the state-wide proportion of PHCs and CHCs without a doctor for 2002–
2004 and 2012–2013. Nationally, the proportion of PHCs without a doctor has decreased
from 11.1% in 2002–2003 to 9.53% in 2012–2013. In the year 2012–2013, the highest
proportion of such PHCs was found in the states of Madhya Pradesh (29.6%), Jharkhand
(27.3%), and Chhattisgarh (27.1%). While the state of Tripura has no such PHCs, the state of
Maharashtra has only 0.6% of their PHCs functioning without a doctor. The proportion of
such PHCs in the state of Uttar Pradesh is 16.5%, which shows a marginal decline from
2002–2004.
Table 5.8 Proportion of PHCs without a doctor, 2002–2012
State Primary Health Centre
2002–2004 2012–2013
Himachal Pradesh 11.6 7.2
Punjab 26.8 9.9
Uttaranchal 16.7 8.3
Haryana 8.0 11.4
Rajasthan 7.0 10.0
Uttar Pradesh 17.7 16.5
Bihar 0.0 3.5
Arunachal Pradesh 4.9 18.3
Nagaland 24.3 15.9
Manipur 0.0 1.7
Mizoram 18.5 7.1
Meghalaya 8.0 1.3
Assam 14.1 3.5
West Bengal 16.8 8.3
Orissa 19.5 6.2
Chhattisgarh 13.4 27.1
Madhya Pradesh 23.7 29.6
Maharashtra 1.8 0.6
Andhra Pradesh 2.1 1.4
Karnataka 1.5 5.9
India 11.1 9.5
Discussion
The results show that the proportion of PHCs without a doctor had marginally declined
during the implementation of the NRHM. However, the rate is still considerably high in the
states of Madhya Pradesh, Chhattisgarh, Uttar Pradesh, and some north-eastern states, such as
Arunachal Pradesh. One reason why Uttar Pradesh has not been able to reduce its proportion
of PHCs without doctors is that it still adheres to the tenets set forth in the 1991 Census of
India population in health and health system planning. The number of sanctioned posts is still

102
at the 1991 level, while the number of PHCs has grown rapidly in recent times. Also, its
recruitment process is too slow (MOHFW (GOI) 2013). One important feature of its
recruitment process that acts as an obstacle in recruiting doctors for the public health system
is the absence of waiting lists, so when a successful candidate does not wish to join the
service, the position remains vacant until the Department of Health next announces the
recruitment (Bajpai et al. 2013). The state also does not allow other states’ doctors to join its
medical services.
As for Arunachal Pradesh, it is a well-known fact that it does not have any medical colleges;
hence, it is not surprising that a considerable number of its PHCs are without doctors
(National Health System Reseource Centre 2012a). With respect to Madhya Pradesh and
Chhattisgarh, they too have fewer medical colleges. A large swath of these states is covered
with jungles and the terrain is highly rugged. It has been found that doctors have been
reluctant to go to these areas. According to the 6th Common Review Mission report, the state
of Chhattisgarh still finds it difficult to post doctors in a number of PHCs in rural or tribal
areas, as well as within regions that feature left-wing extremism (Ministry of Health and
Family Welfare 2012c).
5.1.2.5 PHCs and CHCs without a staff nurse and public health nurse
As for those PHCs without nurses, 56.1% of PHCs in the country were without staff nurses in
2002–2004. The figure has declined only marginally since then (see Table 5.9). As a result,
48.2% of PHCs in the country still do not have nurses. Despite the decrease in the proportion
of PHCs in the country as whole, several of its states have witnessed a substantial increase in
the number of such PHCs over time. For instance, the proportion in the state of West Bengal
has risen from 29.7% in 2002–2004 to 72.8% in 2012–2013. The proportion of such PHCs is
highest in Orissa where 93.5% of PHCs are functioning without a nurse. The states of Uttar
Pradesh (76.6%), Himachal Pradesh (75.2%), West Bengal (72.9%), and Madhya Pradesh
(72.1%) are also not far behind.
As for nurses, the proportion of CHCs without a staff nurse has declined from 15.5% in
2002–2004 to 9.7% in 2012–2014. Among the larger states, Kerala is the only one where
none of the CHCs are without a staff nurse – i.e., all CHCs have at least one nurse available.
The state of Bihar has the largest proportion of CHCs without nurses (42.7%), followed by
the state of Jharkhand (32.8%). The proportion of CHCs without public health nurses in the

103
country is considerably higher than the proportion of CHCs without a staff nurse; 88.9% of
CHCs did not have public health nurses in 2002–2004. The proportion has since then
marginally declined by about 10%. Currently, the proportion of such CHCs is 79.8%. There
exists considerable variation at the state level. On the one hand, 7%–10% of CHCs in the
states of Kerala, West Bengal, and Meghalaya do not have staff nurses, while the proportion
of such CHCs in the states of Jharkhand (99.4%), Orissa (98.6%) and Chhattisgarh is above
90%.
Table 5.9 Proportion of PHCs and CHCs without a staff nurse and public health nurse
State PHC staff nurse CHC staff nurse Public health nurse
2002–2004 2012–2013 2002–2004 2012–2013 2002–2004 2012–2013
Himachal Pradesh 58.3 75.2 24.5 1.3 93.9 90.9
Punjab 57.8 45.7 26.7 1.7 100.0 85.8
Uttaranchal 96.5 59.5 21.1 3.3 84.2 83.3
Haryana 67.6 15.9 17.5 2.8 69.8 61.3
Rajasthan 46.8 24.0 30.9 11.4 88.0 81.3
Uttar Pradesh 70.8 76.6 21.5 13.4 97.3 94.9
Bihar 10.2 42.5 38.5 42.7 100.0 94.1
Arunachal 41.5 41.5 12.5 15.1 93.8 98.1
Nagaland 8.1 50.0 0.0 0.0 75.0 71.4
Manipur 18.8 44.1 25.0 0.0 100.0 25.0
Mizoram 7.4 9.5 33.3 0.0 88.9 90.9
Meghalaya 16.0 44.0 20.0 0.0 20.0 7.1
Assam 20.7 18.4 2.6 7.5 82.1 94.9
West Bengal 29.7 72.8 7.2 1.6 10.8 9.8
Orissa 99.5 93.5 12.6 18.3 98.9 98.6
Chhattisgarh 89.1 52.4 11.3 3.7 97.9 95.7
Madhya Pradesh 85.1 72.1 11.7 16.9 96.7 92.4
Maharashtra 75.0 27.5 1.6 2.0 99.5 96.4
Andhra Pradesh 15.5 24.0 2.9 6.2 95.7 88.5
Karnataka 68.9 30.7 19.2 1.6 91.8 90.3
Kerala 34.3 42.0 0.0 0.0 92.3 8.0
India 56.1 48.2 15.5 9.7 88.9 79.8
Discussion
The NRHM, through the Indian Public Health Standards, envisages at least one staff nurse at
the PHC level and seven nurses at the CHC level. The results presented in the previous
section reveal that although the proportion of PHCs without nurses has declined, the same is
applicable to all states. The state of Bihar and Uttar Pradesh are among the most populous
and rapidly growing states, and their needs are increasing swiftly, yet they have made little
effort to improve their situation.
The states of Uttar Pradesh and Bihar have witnessed an increase in the number of such
PHCs. The increase in the case of Uttar Pradesh can be explained by the fact that the state has
recently converted (upgraded) all of its old PHCs into CHCs. The PHCs designated as mother
104
PHCs used to have staff nurses, but the state has decided not to deploy staff nurses at the
newly established PHCs, and it thus has not recruited any staff nurses for PHCs during the
study period. The state has been reprimanded for its lethargic attitude towards filling the
sanctioned nurses posts by the 6th Common Review Mission (Ministry of Health and Family
Welfare 2012e). The main problem with the state of Uttar Pradesh is that it is still using the
1991 population census figures of 136 million people for estimating its requirements for
infrastructure and human resources, despite the fact that the population of the state in 2011
was about 200 million (Ministry of Health and Family Welfare 2009). States have therefore
been working with a norm of one nurse/three doctors. This has now been revised to one
nurse/doctor, although it should be noted that the international norms are four nurses per
doctor.
As for Bihar, the 6th Common Review Mission (2012) reports that 3,810 new staff nurse
posts have been created in 1,905 APHC (two in each additional PHC) under the NRHM; of
3,810 posts, 2,374 have already been filled as of October 2012 (Ministry of Health and
Family Welfare 2012b).(Ministry of Health and Family Welfare 2012b). However, it is
strange that this recruitment is neither reflected in the results of the present study, nor in the
data compiled in the 2014 Rural Health Statistics. The high proportion of such PHCs in
Orissa can be explained by the lack of regularly sanctioned posts. The state decided to scrap
all regular post recruitment initiatives in the year 2008. Although staff nurses recruited on an
ad hoc basis can be regularized and absorbed in the system after six years of service, it is
often not possible because of a lack of regular vacancies (Government of India 2010c).
A public health nurse is a trained nurse who uses knowledge from nursing, and social and
public health sciences, to promote and protect the health of the population. In the Indian
public health system, a PHN is often deployed at the sub-district level in CHCs to lead the
work of the ANMs and their supervisors – LHVs. Initially, when PHNs were introduced in
the early 1960s, they were deployed at district level and called District Public Health Nurses
(DPHNs) (Sharma et al. 2010). Under the NRHM, the IPHS norms recommended that all
states should create at least one post for a PHN at the CHC level to reduce the burden of
DPHNs (Ministry of Health and Family Welfare 2012g).
The results of the study show that most CHCs in the state of West Bengal, Kerala, and
Meghalaya have PHNs in position. In Kerala, the cadre of PHNs exists by another name –
Lady Health Supervisor (LHSs). They represent the second level of supervisory officials.
Before the NRHM, most CHCs did not have a PHN equivalent in the state. However, after
105
the NRHM, when the restructuring of primary health institutions took place and new PHCs
were created, the old ones were designated as block PHCs and the old cadre of supervisors
was converted into a PHN equivalent (Ministry of Health and Family Welfare 2011).
Currently, ANMs in Kerala are supervised by Lady Health Inspectors (LHIs) who, in turn,
are supervised by the LHS (Government of Kerala 2003). The cadre of PHNs in the state of
West Bengal was created in the 1980s. Given the capacity of nursing personnel production in
the state, it is not surprising to see that few CHCs were functioning without PHNs, even in
the pre-NRHM era (Ministry of Health and Family Welfare 2012a).
Now, over a decade later, many states have still not created a post for PHNs at the CHC level,
as recommended by the IPHS. Bihar, Uttar Pradesh, Rajasthan, and Uttaranchal are examples
of such states. In Orissa, PHNs were trained back in the 1990s, but this training initiative was
stopped in 1999. At that time, PHNs were mainly trained to be tutors or to become DPHNs.
Since there are no institutions that are able to train PHNs, the state has not created any posts
for PHNs at the CHC level (Government of India 2010c). The case in Jharkhand and
Chhattisgarh is similar, as no posts for PHNs have been created here either. A 2013 NRHM
report from Jharkhand states that creating a PHN cadre is ‘one of the issues that needs to be
addressed urgently’ (Ministry of Health and Family Welfare 2012f).
5.1.2.6 CHCs without specialists
Table 5.10 presents the state-wide proportion of CHCs functioning without specialists.
Nationally, the proportion of CHCs without specialists has risen slightly from 55.6% in
2002–2004 to 57.0% in 2012–2013. Among the states, the proportion of such CHCs currently
varies from as high as 92.5% in Arunachal Pradesh and 90.9% in Tripura to as low as 7.1% in
Meghalaya and 19.7% in Maharashtra. The proportion in the states of Meghalaya and
Maharashtra declined substantially during 2002–2012. However, in some other states, such as
Orissa, Assam, and Uttar Pradesh, a surge has occurred. In Uttar Pradesh, the proportion of
such CHCs has increased from 20.3% in 2002–2004 to 62.1 in 2012–2013. However, in some
other states where the proportion of such CHCs was high in 2002–2004, this level has
remained unchanged during the study period. Madhya Pradesh is an example of such a state.
As far as the proportion of CHCs without a gynaecologist is concerned, 76% of CHCs in the
country are still without a gynaecologist. The proportion has not changed, even by a single
percentage point, during the study period. Similarly, the proportion of CHCs without a
paediatrician has not changed much either. While the proportion of CHCs without
106
anaesthetists has declined from 93.5% in 2002–2004 to 83.9% in 2012–2013, the proportion
of CHCs without surgeons in the country has risen from 69.8% in 2002–2004 to 83.2% in
2012–2013.

107
Table 5. 10 Proportion of CHCs without specialists, 2002–2012
State No specialist Gynaecologist Paediatrician Anaesthetist Surgeon
2002–2004 2012–2013 2002–2004 2012–2013 2002–2004 2012–2013 2002–2004 2012–2013 2002–2004 2012–2013
Himachal Pradesh 89.8 79.2 98.0 93.5 98.0 92.2 100.0 89.6 93.9 87.0
Punjab 46.7 31.7 73.3 59.2 86.7 72.5 93.3 80.8 46.7 56.7
Uttaranchal 15.8 48.3 42.1 71.7 52.6 66.7 84.2 88.3 42.1 83.3
Haryana 58.7 72.6 82.5 84.9 90.5 92.5 96.8 91.5 73.0 91.5
Rajasthan 32.5 58.0 68.1 79.7 80.1 77.7 98.4 85.0 41.9 78.4
Uttar Pradesh 20.3 62.1 62.9 80.0 48.4 81.4 75.4 88.5 39.1 85.5
Bihar 30.8 33.8 69.2 67.7 69.2 77.9 88.5 61.8 61.5 55.9
Arunachal 87.5 92.5 100.0 96.2 100.0 98.1 100.0 96.2 87.5 98.1
Nagaland 87.5 76.2 100.0 95.2 100.0 90.5 100.0 85.7 87.5 90.5
Manipur 50.0 68.8 100.0 87.5 75.0 87.5 75.0 87.5 100.0 100.0
Mizoram 22.2 63.6 33.3 81.8 66.7 90.9 100.0 63.6 77.8 81.8
Meghalaya 60.0 7.1 80.0 85.7 80.0 21.4 80.0 100.0 60.0 7.1
Assam 59.0 76.6 69.2 80.4 92.3 87.4 87.2 88.8 79.5 94.4
West Bengal 98.8 72.4 98.8 80.3 100.0 88.8 100.0 88.0 100.0 95.1
Orissa 10.3 38.9 34.5 62.5 44.8 80.6 100.0 93.3 31.0 67.5
Chhattisgarh 80.4 61.7 94.9 83.3 93.8 84.0 99.0 76.5 90.7 87.0
Madhya Pradesh 69.4 68.1 84.4 85.3 88.9 84.5 97.8 92.6 86.7 90.2
Maharashtra 95.2 19.7 95.7 46.2 98.4 56.2 98.9 59.8 99.5 75.9
Andhra Pradesh 62.9 31.6 75.7 60.7 90.0 62.7 95.7 65.6 87.1 85.3
Karnataka 54.8 49.5 69.9 61.8 84.9 80.1 95.9 88.2 79.5 89.8
Kerala 61.5 49.6 61.5 67.2 92.3 62.8 84.6 82.5 92.3 53.3
India 55.6 57.0 76.3 76.0 79.8 81.0 93.5 84.0 69.8 83.2

222
The proportion of CHCs without a gynaecologist is highest in Arunachal Pradesh (96.2%)
and lowest in Maharashtra (46.2%). Maharashtra has witnessed a sharp decline in the number
of such CHCs during the study period. The proportion of such CHCs in the state in 2002–
2004 was 95.7%. It is interesting to note that a similar decline is seen for other categories of
specialists as well. For instance, the proportion of CHCs without anaesthetists in the states
has decreased from 98.9% in 2002–2004 to 59.8% in 2012–2013. In contrast, the state of
Orissa has witnessed an increase in the proportion of such CHCs regardless of specialist
category. For instance, while the proportion of CHCs without gynaecologists has risen from
34.5% in 2002–2004 to 62.5% in 2012–2013, the proportion of CHCs without a surgeon has
risen from 31.0% to 67.5% during the same period.
Discussion
India has been facing a shortage of specialists in its CHCs for many decades. It is not a new
phenomenon; rather, it is just a continuation of an old disease that could not be cured. It is a
matter of concern that, even after a decade’s effort under the National Rural Health Mission,
states have not been successful in placing enough specialists to seamlessly run their rural
hospitals (i.e., CHCs).
The results reveal that the proportion of CHCs without a specialist doctor has risen in many
states. CHCs in the north-eastern, states such as Manipur, Mizoram, Tripura, Arunachal
Pradesh, and Nagaland, are almost completely devoid of specialist doctors. There are very
few regularly appointed specialists available in these states. The foremost reason behind such
a situation in these states is the lack of medical colleges and schools where specialists can be
trained. States like Arunachal Pradesh, Nagaland, and Mizoram have no medical college of
their own, and thus they have no other option but to send students to other parts of the
country for training. According to the Medical Council of India, there are only nine medical
colleges in the north-eastern region. The states of Arunachal Pradesh, Nagaland, and
Mizoram do not offer medical colleges for undergraduate courses in allopathic medicine
(Medical Council of India 2015).
The state of Himachal Pradesh also faces a huge shortage of specialists, despite the fact that it
has two publicly funded medical colleges and a private medical college where postgraduate
courses are taught. The problem is not only related to the lack of specialist doctor training,
but also to the harsh environmental conditions of rural Himachal Pradesh and the lack of
basic amenities and decent salaries for specialist doctors. As of 2012, the state government in

109
Himachal Pradesh pays only Rs.40000 per month to specialists in the state sector with an
incentive of Rs.5000, while in private nursing homes, specialists easily earn Rs.70000 to
Rs.85000 per month. A study has found that specialists consider their existing salaries
meagre when compared to the earnings that specialist doctors practicing outside the public
health system are able to make. The study also found that their counterparts in private
practices earn nearly two to three times more than them. This is one reason why only a few
postgraduate doctors (specialists) are attracted towards working in the government public
health service.
On October 7, 2011, the Health Department of Himachal Pradesh conducted a walk-in
interview for specialists at Shimla. Only four specialist doctors appeared for the interview
(Sood 2012). This was not the first time such an situation occurred. Even in previous walk-in
interviews, only a few candidates came for an interview. According to a report published in
The Tribune in 2007, the health department of the Himachal Pradesh government in
advertised 210 posts for specialists in 2007; only seven applied. It is clear that the existing
specialists in the state are not keen to work in rural areas with meagre salaries. Realizing that
there is no way to solve the shortage of specialists in rural areas, the government recently
decided to use a helicopter ambulance scheme in difficult, hilly, and sparsely populated rural
areas.
Another important issue related to the shortage of specialist doctors is related to the
sanctioning of an adequate number of posts for specialists. The responsibility of creating
posts lies with the state governments. All states need to revise sanctioned strengths for all
categories of specialists in order to keep up with increasing need. Some states are proactive in
sanctioning new posts while others are not. For instance, since 2007, the state of West Bengal
has sanctioned more than twice the number of obstetrician and gynaecologist posts compared
to its current requirements, while the state of Arunachal Pradesh has sanctioned none, despite
suggestions given by the NRHM’s Sixth Common Review Mission. The reason behind these
new posts not being sanctioned is that the state is facing a resource crunch in its health budget
(Ministry of Health and Family Welfare 2013a). Although the state of West Bengal has
sanctioned 787 posts for obstetricians and gynaecologists to serve in its CHCs, it is noticeable
that the state has not made any effort to fill these posts, except that it has recently recruited
163 specialists on a contractual basis.
Some states have adopted methods that could be considered unconventional. For example, the
state of Tamil Nadu has decided not to recruit any permanent specialists to serve its CHCs

110
and PHCs. Instead, it decided to hire specialists for part-time services (Krupp & Madhivanan
2009). Although similar arrangements are in effect in Bihar, no studies have been able to
shed light on how successful these arrangements have been. It must be noted that the results
from this study indicate that the proportion of CHCs without specialist doctors in the state of
Bihar was one of the lowest in India during 2012–2013.
Irrational deployment is one problem that makes the shortage of specialists look larger than it
is. Examples of irrational deployment abound in different states. According to the 7th CRM
report (2011) of Jharkhand’s Bokaro district, there was only one obstetrician and
gynaecologist in the district, and this specialist was not only posted as a District TB Officer,
but that person was also working as a Blood Bank Officer. Similarly, there was only one
paediatrician who was in charge of the MTC wing of the hospital (Ministry of Health and
Family Welfare 2013e). In Andhra Pradesh, a specialist (gynaecologist and anaesthetist) was
deployed at the post of a special public health officer (Ministry of Health and Family Welfare
2013c). In the state of Arunachal Pradesh, 61 specialists were posted as General Duty
Medical Officers at PHCs in the absence of sanctioned posts of specialists at CHCs. Such
irrational deployments hide a lot of the specialist workforce and cause the shortage figures to
swell unnecessarily (Ministry of Health and Family Welfare 2013a). Most states have no
rational deployment policy in place. Himachal Pradesh is one such example (Ministry of
Health and Family Welfare 2013d). Moreover, the state has no policy with regard to its
postings and transfers. Although Assam has developed a system for the facility-specific
posting of specialists and doctors, the 6th Common Review Mission of Assam report notes
some aberrations in the policy for the specialist deployment. For example, a gynaecologist
was found to be posted at a PHC (Ministry of Health and Family Welfare 2012i).
Another important issue that aggravates the shortage of specialists is the non-availability of a
‘specialist cadre’ in many states. This makes it difficult for planners to identify Medical
Officers (MOs) with postgraduate degrees, which ultimately leads to under-utilization of their
specialist skills. For instance, about 5% of specialists are posted in additional primary health
centres (APHCs) where they can never be utilized. Another 30% are posted in block primary
health centres (BPHCs). Similarly, 20% of emergency obstetric care (EmOC)- and lifesaving
anaesthetic skills (LSAS)-trained MOs are posted in non-FRUs, where their skills cannot be
utilized. There is no specialist cadre in the states of Jharkhand, Assam, Haryana, Uttar
Pradesh, Arunachal Pradesh, and Orissa (Ministry of Health and Family Welfare 2012d;
Ministry of Health and Family Welfare 2013a; Ministry of Health and Family Welfare
111
2013e). MOs and specialists join services at the same level (i.e. Assistant Surgeons) and they
sometimes do not get posted at a facility where their skills are more required.
The results show a sudden increase in the proportion of CHCs without specialists in the state
of Uttar Pradesh. There could be several reasons why the state government has not been able
to increase the number of specialists in the system. First of all, there are simply not enough
specialists graduating every year to fill the gap. For instance, the medical colleges in the state
(including private ones) have only 93 and 74 postgraduate seats in obstetrics/gynaecology
and paediatrics courses, respectively (Medical Council of India 2016). Even if it is assumed
that all obstetricians are able to join CHCs after the completion of their courses – which,
given the current policies, is unlikely to happen – it would still take six to seven years to fill
all vacant positions for obstetricians at the CHCs in UP. The same is true for the other
categories of specialists as well.
A study has found that the state has been ‘lethargic’ as far as the recruitment of health
workers is concerned (Ministry of Health and Family Welfare 2012d). The authors argue that
one of the reasons why the state is not able to recruit enough people is the lack of candidates
applying for the Provincial Medical Services (PMS), through which the specialists in the state
are recruited for their service in public health facilities (Bajpai et al. 2013). It has been noted
that a lot of those who do apply and get selected do not appear to the interview due to the
lengthy recruitment process, leaving many posts vacant (Raha et al. 2009). Since the state
does not have waiting lists for regular appointments, there is no way to fill those posts that
remain vacant by those who prefer not to join the services (Ministry of Health and Family
Welfare 2012d). Many previous studies have found that specialist doctors are also recruited
against the post of ‘medical officer’. Such policy loopholes further aggravate the specialist
shortages in the system (Bajpai et al. 2013).
The state of Haryana does have a rational deployment policy. According to this policy,
doctors with postgraduate qualifications cannot get posted at PHCs, but only at CHCs
designated as FRUs; moreover, specialists cannot get posted at nonclinical posts up to the
district level (Ministry of Health and Family Welfare 2013b). Nevertheless, around 73% of
CHCs were functioning without a specialist during 2012–2013. One of the reasons for this
might be the government’s emphasis on posting more specialists at district hospitals. With
respect to health officials, the reason underlying such a move is that the state has good road
connections and people prefer district hospitals rather than CHCs (Ministry of Health and
Family Welfare 2013b).
112
Incentive packages for specialist doctors working in difficult and inaccessible areas can
sometimes prove to be a motivating factor. However, several states, such as Bihar and
Arunachal Pradesh, still do not have an incentive package for specialists. It is surprising that
the state of Arunachal has not institutionalized any incentives for its staff working in these
difficult areas, despite the fact that it is one of the states where shortages are about 100% for
all types of specialists. It certainly has a bearing on the motivation of staff in difficult areas.
The government of Himachal Pradesh has organized an incentive scheme, in addition to the
fixed salary for medical staff, at extremely hard terrain areas. However, in reality, these
incentives have not attracted health workers, as these areas are difficult and harsh. The state
has not been able to recruit any specialists and ANMs in the district of Lahaul and Spiti as yet
(Ministry of Health and Family Welfare 2013d).
5.2 Inequalities in health worker distribution
Using data on health worker availability from the DLHS-2 and DLHS-4, inequalities in the
distribution of health workers have been measures for all three levels of health facilities to
examine how much the distribution has changed from 2002–2012. Inequalities were also
measured for individual health workers. The following health workers were included in the
analysis: ANMs and MHWs at the HSC level; doctors, staff nurses, lab technicians,
pharmacists, LHVs, and male health assistants at PHCs; and gynaecologists, paediatricians,
surgeons, anaesthetists, doctors, staff nurses, public health nurses, lab technicians,
pharmacists, and radiographers at the CHC level. Inequalities have been measured with the
Gini and Theil T indices. Theil T (overall inequality) has been decomposed into within and
between components. As discussed in Chapter 4, overall inter-county inequality is the sum of
the within-group inequality and between-group inequality, where within-group inequality is a
weighted average of inequality in each group. The contribution of states to within and
between-state inequality has only been calculated for the latest year, i.e. 2012–2013.
5.2.1 Inequality in the distribution of health workers at the health sub-centres
Table 5.11 provides the decomposition of overall inter-HSC inequality into ‘within’- and
‘between’-State inequalities. The ‘between-State’ and ‘within-State’ Theil T were 0.0299 and
0.0705, respectively, indicating that the ‘between’- and ‘within’-state inequalities contributed
29.8% and 70.2%, respectively, to the overall inequality. Inequalities for both ANM and
MPW have increased as well; the between-state contribution for both cadres has increased
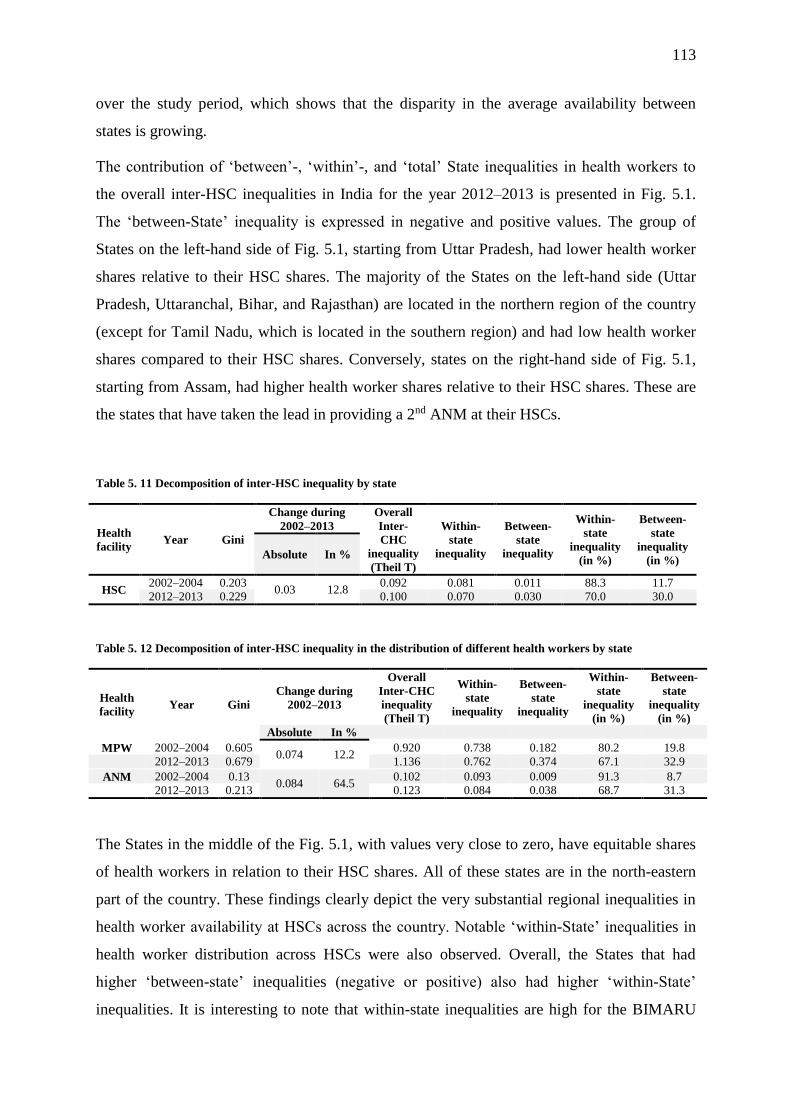
113
over the study period, which shows that the disparity in the average availability between
states is growing.
The contribution of ‘between’-, ‘within’-, and ‘total’ State inequalities in health workers to
the overall inter-HSC inequalities in India for the year 2012–2013 is presented in Fig. 5.1.
The ‘between-State’ inequality is expressed in negative and positive values. The group of
States on the left-hand side of Fig. 5.1, starting from Uttar Pradesh, had lower health worker
shares relative to their HSC shares. The majority of the States on the left-hand side (Uttar
Pradesh, Uttaranchal, Bihar, and Rajasthan) are located in the northern region of the country
(except for Tamil Nadu, which is located in the southern region) and had low health worker
shares compared to their HSC shares. Conversely, states on the right-hand side of Fig. 5.1,
starting from Assam, had higher health worker shares relative to their HSC shares. These are
the states that have taken the lead in providing a 2nd ANM at their HSCs.
Table 5. 11 Decomposition of inter-HSC inequality by state
Health
facility Year Gini
Change during
2002–2013
Overall
Inter-
CHC
inequality
(Theil T)
Within-
state
inequality
Between-
state
inequality
Within-
state
inequality
(in %)
Between-
state
inequality
(in %) Absolute In %
HSC 2002–2004 0.203
0.03 12.8 0.092 0.081 0.011 88.3 11.7
2012–2013 0.229 0.100 0.070 0.030 70.0 30.0
Table 5. 12 Decomposition of inter-HSC inequality in the distribution of different health workers by state
Health
facility Year Gini
Change during
2002–2013
Overall
Inter-CHC
inequality
(Theil T)
Within-
state
inequality
Between-
state
inequality
Within-
state
inequality
(in %)
Between-
state
inequality
(in %)
Absolute In %
MPW 2002–2004 0.605 0.074 12.2
0.920 0.738 0.182 80.2 19.8
2012–2013 0.679 1.136 0.762 0.374 67.1 32.9
ANM 2002–2004 0.13 0.084 64.5
0.102 0.093 0.009 91.3 8.7
2012–2013 0.213 0.123 0.084 0.038 68.7 31.3
The States in the middle of the Fig. 5.1, with values very close to zero, have equitable shares
of health workers in relation to their HSC shares. All of these states are in the north-eastern
part of the country. These findings clearly depict the very substantial regional inequalities in
health worker availability at HSCs across the country. Notable ‘within-State’ inequalities in
health worker distribution across HSCs were also observed. Overall, the States that had
higher ‘between-state’ inequalities (negative or positive) also had higher ‘within-State’
inequalities. It is interesting to note that within-state inequalities are high for the BIMARU
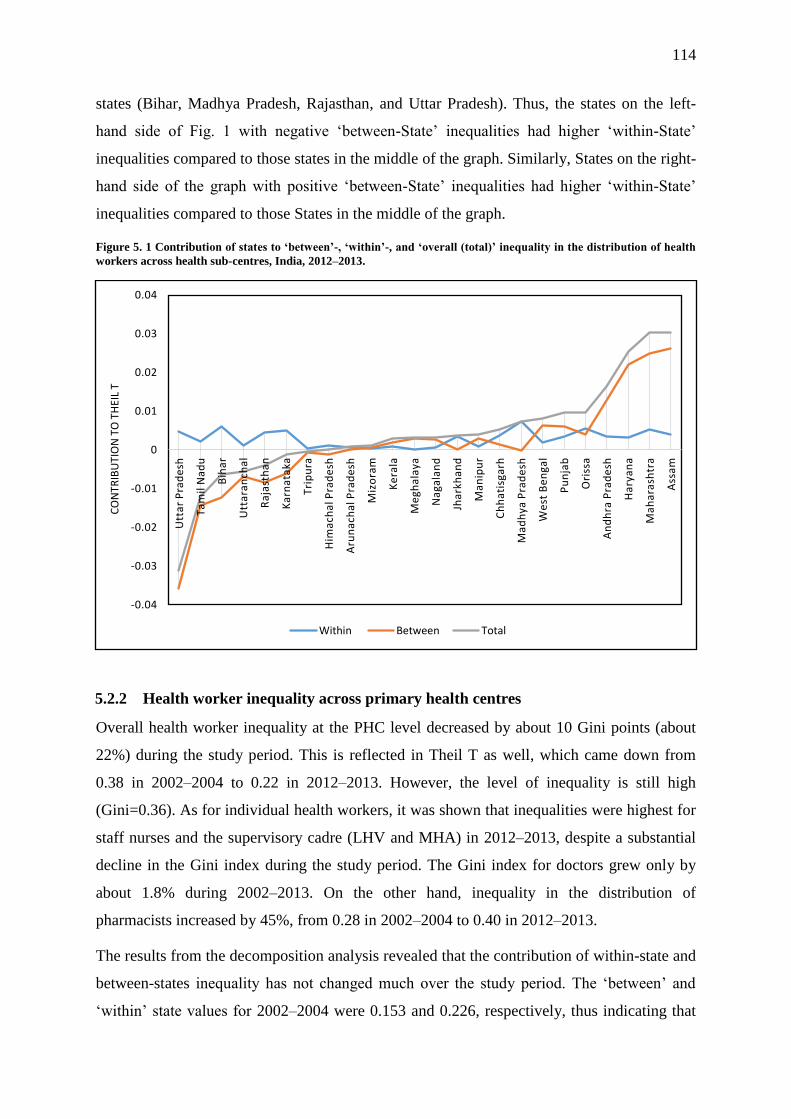
114
states (Bihar, Madhya Pradesh, Rajasthan, and Uttar Pradesh). Thus, the states on the left-
hand side of Fig. 1 with negative ‘between-State’ inequalities had higher ‘within-State’
inequalities compared to those states in the middle of the graph. Similarly, States on the right-
hand side of the graph with positive ‘between-State’ inequalities had higher ‘within-State’
inequalities compared to those States in the middle of the graph.
Figure 5. 1 Contribution of states to ‘between’-, ‘within’-, and ‘overall (total)’ inequality in the distribution of health
workers across health sub-centres, India, 2012–2013.
5.2.2 Health worker inequality across primary health centres
Overall health worker inequality at the PHC level decreased by about 10 Gini points (about
22%) during the study period. This is reflected in Theil T as well, which came down from
0.38 in 2002–2004 to 0.22 in 2012–2013. However, the level of inequality is still high
(Gini=0.36). As for individual health workers, it was shown that inequalities were highest for
staff nurses and the supervisory cadre (LHV and MHA) in 2012–2013, despite a substantial
decline in the Gini index during the study period. The Gini index for doctors grew only by
about 1.8% during 2002–2013. On the other hand, inequality in the distribution of
pharmacists increased by 45%, from 0.28 in 2002–2004 to 0.40 in 2012–2013.
The results from the decomposition analysis revealed that the contribution of within-state and
between-states inequality has not changed much over the study period. The ‘between’ and
‘within’ state values for 2002–2004 were 0.153 and 0.226, respectively, thus indicating that
-0.04
-0.03
-0.02
-0.01
0
0.01
0.02
0.03
0.04
Utt
ar
Pra
de
sh
Ta
mil
Na
du
Bih
ar
Utt
ara
nch
al
Ra
jast
ha
n
Ka
rna
taka
Tri
pu
ra
Him
ach
al P
rad
esh
Aru
na
cha
l Pra
de
sh
Miz
ora
m
Ke
rala
Me
gha
laya
Na
gala
nd
Jha
rkh
an
d
Ma
nip
ur
Ch
ha
tisg
arh
Ma
dh
ya P
rad
esh
We
st B
en
gal
Pu
nja
b
Ori
ssa
An
dh
ra P
rad
esh
Ha
rya
na
Ma
ha
rash
tra
Ass
am
CO
NTR
IBU
TIO
N T
O T
HEI
L T
Within Between Total

115
‘between’- and ‘within’-state inequalities contributed about 59.7% and 40.3% to the overall
inequality, respectively. With a marginal change, the contribution of ‘between’- and ‘within’-
state inequalities in 2012–2013 turned out to be 38.8% and 61.2%, respectively.
Table 5. 13 Decomposition of inter-PHC inequality by state
Health
facility Year Gini
Change during
2002–2012
Overall
Inter-PHC
inequality
(Theil T)
Within-
state
inequality
Between-
state
inequality
Within-
state
inequality
(in %)
Between-
state
inequality
(in %)
Absolute In %
PHC 2002–2004 0.456
-0.10 -21.9 0.379 0.226 0.153 59.7 40.3
2012–2013 0.356 0.217 0.133 0.084 61.2 38.8
Among health worker categories, within-state inequality was highest for staff nurses,
pharmacists, and male health assistants during 2002–2004 (see Table 5.14). The share of
within-state inequalities for these categories of health workers was more than two-thirds of
the overall inequality. However, the share of within-state inequalities in the overall inequality
for these health workers has declined. Contrary to this, within-state inequality had increased
for doctors and LHVs, which also means that the share of between-state inequality in the
overall inequality for these health workers had reduced substantially. For instance, the share
of between-state inequalities for doctors had reduced from 50.7% in 2002–2004 to 32.0% in
2012–2013.
Table 5. 14 Decomposition of inter-PHC inequality in the distribution of different health workers by state
Health facility Year Gini
Change during
2002–2013
Overall
Inter-
PHC
inequality
(Theil T)
Within-
state
inequality
Between-
state
inequality
Within-
state
inequality
(in %)
Between-
state
inequality
(in %)
Absolute in %
Doctor 2002–2004 0.392 0.007 1.8
0.318 0.157 0.161 49.3 50.7
2012–2013 0.400 0.314 0.214 0.100 68.0 32.0
Staff Nurse 2002–2004 0.725
-0.079 -10.8 1.252 1.033 0.219 82.5 17.5
2012–2013 0.646 0.832 0.530 0.302 63.7 36.3
Pharmacist 2002–2004 0.275
0.123 44.8 0.300 0.270 0.030 89.2 10.8
2012–2013 0.399 0.460 0.310 0.150 67.7 32.3
LT 2002–2004 0.567
-0.078 -13.8 0.820 0.620 0.200 75.7 24.3
2012–2013 0.489 0.710 0.580 0.130 81.9 18.1
LHV 2002–2004 0.747
-0.134 -17.9 1.223 0.678 0.544 55.5 44.5
2012–2013 0.614 0.866 0.665 0.201 76.8 23.2
MHA 2002–2004 0.812
-0.23 -28.3 1.047 0.786 0.261 75.1 24.9
2012–2013 0.582 1.056 0.704 0.352 66.7 33.3

116
Figure 5.2 provides the contribution of the states to the between-state, within-state, and
overall inequality in the distribution of PHC-level health workers for the year 2012–2013.
The between-state inequality value for a state is negative when the share of its health workers
is lower than the share of its PHCs, and vice versa. In 2012–2013, the contribution of the
states of Uttar Pradesh, Orissa, Chhattisgarh, and Madhya Pradesh was lowest among all
states. On the other hand, the highest positive contribution to the between-state inequality
comes from the states of Andhra Pradesh, Kerala, Karnataka, Bihar, Haryana, Maharashtra,
and Tamil Nadu.
Figure 5. 2 Contribution of the states to ‘between’-, ‘within’-, and ‘overall (total)’ inequality in the distribution of
health workers across primary health centres, India, 2012–2013.
As for the within-state inequality, the states with bigger (negative or positive) contributions to
the between-state inequality had higher shares in terms of the total within-state inequality.
The states of Andhra Pradesh, Bihar, Kerala, and Karnataka contributed most to the total
within-state inequality. The contribution of Uttar Pradesh, Madhya Pradesh, Rajasthan, and
Assam also appears to be significant. The states of the north-eastern regions (Mizoram,
Arunachal Pradesh, Nagaland, Tripura, and Manipur) do not seem to contribute much to
within-state inequality. Their contribution is negligible.
-0.05
-0.04
-0.03
-0.02
-0.01
0
0.01
0.02
0.03
0.04
0.05
0.06
0.07
0.08
Utt
ar
Pra
de
sh
Ori
ssa
Ma
dh
ya P
rad
esh
Ch
ha
tisg
arh
Him
ach
al P
rad
esh
We
st B
en
gal
Jha
rkh
an
d
Ra
jast
ha
n
Aru
na
cha
l Pra
de
sh
Miz
ora
m
Na
gala
nd
Utt
ara
nch
al
Ass
am
Tri
pu
ra
Ma
nip
ur
Me
gha
laya
Pu
nja
b
Ta
mil
Na
du
Ma
ha
rash
tra
Ha
rya
na
Ka
rna
taka
Ke
rala
Bih
ar
An
dh
ra P
rad
esh
CO
NTR
IBU
TIO
N T
O T
HEI
L 'T
'
Within Between Total

117
5.2.3 Health worker inequality across community health centres
Table 5.15 provides a glimpse of the overall inter-CHC inequality in the distribution of health
workers at the sub-centres, PHCs, and CHCs for two time periods: 2002–2004 and 2012–
2013. Overall health worker inequality across CHCs has increased by about 37% (0.10 Gini
points) during this period. This decrease is visible in Theil T as well, which has risen from
0.13 in 2002–2004 to 0.32 in 2012–2013. The index for specialists and public health nurses
always stands above 0.80 (see Table 5.16 and 5.17). The Gini coefficient for all categories of
specialists during 2012–2013 is above 0.80, which suggests their distribution was highly
unequal. In 2002–2004, anaesthetists (Theil ‘T’ = 2.10; Gini = 0.88) were the most unequally
distributed among all specialists. Their distribution changed considerably during the study
period.
Table 5. 15 Decomposition of inter-CHC inequality by state
Health
facility Year Gini
Change during
2002–2013
Overall
inter-
CHC
inequality
Within-state
inequality
Between-
state
inequality
Within-
state
inequality
(in %)
Between-
state
inequality
(in %)
Absolute In % (Theil T)
CHC 2002–2004 0.280
0.104 37.14 0.134 0.117 0.017 87.2 12.8
2012–2013 0.384 0.324 0.222 0.102 68.4 31.6
Table 5. 16 Decomposition of inter-CHC inequality in specialists’ distribution by state
Specialist Year Gini
Change
during
2002–2013
Overall
inter-CHC
inequality
(Theil T)
Within-
state
inequality
Between-
state
inequality
Within -
state
inequality
(in %)
Between-
state
inequality
(in %)
Absolute in %
Surgeon 2002–2004 0.592
0.866 0.666 0.200 76.9 23.1
2012–2013 0.874 0.282 47.6 2.003 1.657 0.345 82.8 17.2
Paediatrician
2002–2004 0.677
1.102 0.832 0.270 75.5 24.5
2012–2013 0.829 0.151 22.3 1.740 1.568 0.172 90.1 9.90
Obstetrician
2002–2004 0.661
1.047 0.867 0.180 82.8 17.2
2012–2013 0.797 0.136 20.6 1.517 1.382 0.135 91.1 8.90
Anaesthetist
2002–2004 0.879
2.098 1.625 0.474 77.4 22.6
2012–2013 0.865 -0.014 -1.6 1.930 1.766 0.165 91.5 8.50
Table 5. 17 Decomposition of inter-CHC inequality in nurses’ distribution by state
Health
worker
category
Year Gini
Change
during
2002–2013
Overall
Inter-
CHC
inequality
(Theil T)
Within-
state
inequality
Between-
state
inequality
Within-
state
inequality
(in %)
Between-
state
inequality
(in %) Absolute In %
Staff Nurse 2002–2004 0.469 -0.028 -6.1 0.395 0.275 0.121 69.5 30.5
2012–2013 0.440 0.358 0.255 0.103 71.3 28.7
Public
Health Nurse
2002–2004 0.932 -0.015 -1.6 2.682 1.812 0.87 67.6 32.4
2012–2013 0.917 2.308 1.199 1.108 52.0 48.0

118
Table 5. 18 Decomposition of inter-CHC inequality in doctors’ distribution by state
Health
worker
category
Year Gini
Change
during 2002–2013
Overall
Inter-CHC
inequality
(Theil T)
Within-
state
inequality
Between-
state
inequality
Within-
state
inequality
(in %)
Between -
state
inequality
(in %) Absolute In %
Doctor 2002–2004 0.446
0.399 0.316 0.083 79.3 20.7
2012–2013 0.447 0.001 0.092 0.376 0.288 0.088 76.7 23.3
For the other three specialists, the Gini index was between 0.60 and 0.70 during 2002–2004.
Their distribution changed considerably during the study period. The biggest change in
distributional inequality occurred in the case of surgeons (47.6%), followed by paediatricians
(22.3%) and obstetricians (20.6%). Anaesthetists, whose distribution was already highly
unequal in 2002–2004, did not witness much change as their Gini score declined marginally
by 1.6%. In this regard, it must be noted that the Gini coefficient for other specialists in
2002–2004 was much smaller than anaesthetists.
The Gini index for nursing staff at the CHC level reveals that both staff nurses and public
health nurses witnessed a marginal reduction in inequality. While the Gini index for staff
nurses decreased from 0.47 in 2002–2004 to 0.44 in 2012–2013, for public health nurses, this
dropped from 0.93 in 2002–2004 to 0.92 in 2012–2013. The Gini index for general doctors
did not change substantially during the study period. The Gini index for doctors also did not
change substantially during the study period.
5.2.3.1 Decomposition of inter-CHC health worker inequality (Theil ‘T’ index)
Table 5.14 provides the decomposition of inequality (Theil ‘T’ index) into within- and
between-state inequalities for both time periods, 2002–2004 and 2012–2013. The overall
inequality across the CHCs increased during the study period. The between- and within-state
values for 2002–2004 were 0.017 and 0.117, respectively, thus indicating that between- and
within-state inequalities contributed to around 13% and 87% to the overall inequality,
respectively. With the rise in the overall inequality during the study period, the contribution
of between- and within-state inequalities to overall inequality also changed considerably.
Between-state inequalities witnessed a rise of about 18%, while the opposite was true for
within-state inequalities. However, the contribution of within-state inequality still remained
substantial (68%).
In the case of specialists, the rise in overall inequality (see the Gini index for individual
categories of specialist doctors) did not seem to be associated with any rise in the

119
contribution of between-state inequalities. Within-state inequalities across specialist
categories have increased. For instance, the contribution of the within-state inequality for
paediatricians rose from 75.5% in 2002–2004 to 90.1% in 2012–2013. Similarly, the
contribution of within-state inequality in the case of anaesthetists increased from 77.4% to
91.5% during the study period. In the case of staff nurses, the contribution of within-state
inequalities increased only slightly, while for public health nurses the contribution of within-
state inequalities declined considerably from 67.6% in 2002–2004 to 52% in 2012–2013. In
other words, about 48% of the overall inequality in the distribution of public health nurses is
due to between-state inequality. The contribution of within- and between-state inequality has
not changed much in the case of doctors.
Figure 5.3 provides the contribution of states to between-state, within-state, and overall
inequality in the distribution of health workers serving at CHCs for 2012–2013. The between-
state inequality values could be negative or positive, depending on the share of health
workers the state has when compared to their share of CHCs.
Figure 5. 3 Contribution of states to between-, within-, and overall (total) inequality in the distribution of health
workers across community health centres, India, 2012–2013
-0.055
-0.045
-0.035
-0.025
-0.015
-0.005
0.005
0.015
0.025
0.035
0.045
0.055
Utt
ar
Pra
de
sh
Ori
ssa
Ma
dh
ya P
rad
esh
Jha
rkh
an
d
Ka
rna
taka
Aru
na
cha
l Pra
de
sh
Bih
ar
Utt
ara
nch
al
Ma
ha
rash
tra
Ch
ha
tisg
arh
Na
gala
nd
Miz
ora
m
Him
ach
al P
rad
esh
Tri
pu
ra
Me
gha
laya
An
dh
ra P
rad
esh
Ma
nip
ur
Ha
rya
na
Pu
nja
b
Ra
jast
ha
n
Ass
am
Ke
rala
We
st B
en
gal
CO
NTR
IBU
TIO
N T
O T
HEI
L 'T
'
Within Between Total

120
The four states on the left-hand side (Uttar Pradesh, Orissa, Madhya Pradesh, and Jharkhand)
had the lowest contribution to between-state inequality. In other words, these states had lower
health worker shares relative to their CHC share. On the right-hand side of the figure are the
states that have a higher share of health workers compared to their CHC shares. Kerala,
Tamil Nadu, and West Bengal are prominent among them. A majority of states lie in the
middle of the figure; they contribute little to the between-state inequality.
The share of within-state inequalities in overall health worker inequality is still considerably
high (68%). Decomposition results reveal that the states with a higher (negative or positive)
contribution to the between-state inequality are also those that contribute substantially to
within-state inequality. The states of Kerala, West Bengal, and Tamil Nadu again contribute
the most. Uttar Pradesh and Orissa also contribute considerably. Although the states of
Assam and Rajasthan did not contribute much to the between-state inequality, they did
contribute considerably to the within-state inequality. The contribution of Madhya Pradesh
and Jharkhand also appears to be substantial.
Discussion
It is clear from the results that the HSC-level health worker inequality has not increased
substantially during the study period. However, the contribution of between-state inequality
to overall inequality has risen considerably. The results are the same even when the analysis
for ANMs and MPWs was conducted separately. Such a rise in between-state inequality
could be explained by the fact that a number of states have actively recruited MHWs and
contractual ANMs to fill the post of a second ANM in their sub-centres; Haryana, Assam,
Maharashtra, Andhra Pradesh are examples of this trend. Conversely, there are states that
have not been able to recruit ANMs, or which have made a policy decision to not recruit
second ANMs. This could be one of the reasons why the disparity in health worker
availability at the HSCs between states has risen over time.
The results also reveal that the Gini coefficient for MHWs is higher than the Gini for ANMs.
The reason for this is that a considerable number of HSCs are running without MHWs. Many
states stopped recruiting MHWs long ago. At present, most states do not envisage a bigger
role for MHWs at the sub-centres (which were predominantly only involved in national
disease control programs). On the other hand, an ANM is the most important functionary at
the HSC level. A majority of central and state-sponsored health programs are implemented
through her. Therefore, most states try to maintain at least one ANM per HSC, barring only a

121
few HSCs. The higher proportion of HSCs running without MHWs is the reason why the
Gini index is much higher for MHWs compared to ANMs.
The decomposition analysis by the state showed that both the between-state and within-state
inequalities in health worker distribution contributed to overall inter-HSC inequalities.
However, the within-state inequalities contribute to about 70% of the overall HSC
inequalities. The fact that within-state inequalities are much higher than the between-state
inequalities highlights the need to address within-state inequalities. Strategies to reduce inter-
HSC health worker inequality should focus primarily on states that contribute most to overall
inequality. Within-state inequalities are present in almost all of these states, including the
states that are considered to have better public health systems, such as Kerala, Tamil Nadu,
Andhra Pradesh, and Karnataka. Even the states with a low share of health workers, such as
Uttar Pradesh, Bihar, Rajasthan, and Madhya Pradesh, had considerably higher contributions
to the total within-state inequality.
Such evenness in the contribution to within-inequality may be attributed to a lack of rational
deployment policies across states. Many even lack proper transfer policies. The lack of
proper transfer and posting policies provide health workers and officers with the liberty to get
posted to their favourite places, leaving health facilities located in difficult, poor, and/or far-
off places without health workers. Apart from that, most states have designated certain HSCs
as delivery points where they have posted two or more ANMs. Uttar Pradesh is one such state
where, post-NRHM, the state decided to declare some of its HSCs as delivery points for
normal delivery to ease the burden on PHCs and CHCs.
In the case of PHCs, the results showed that health worker inequality, though reduced over
the study period, it is still high. A deeper look at the data reveals why the overall inequality is
still high; as of 2012–2013, while about 16% of PHCs had only one or two health workers,
about 12% of them had ten or more health workers. This wide disparity in the total number of
available health workers across PHCs resulted in a high Gini score. A comparison of Gini
indices for individual health workers for both time periods suggests that the inequality for
staff nurses, LHVs, and MHAs was higher than for other health workers. As discussed in the
previous paragraphs, high inequality is often the result of an overall shortage of health
workers, which results in a high proportion of health facilities functioning without a health
worker. High inequality in the distribution of staff nurses could be arising from the fact that a
number of states do not post a staff nurse at PHCs per their HRH policy. Uttar Pradesh and

122
Orissa are just two examples of such states. For them, the PHCs are meant to have only one
or two doctors and a pharmacist.
The high inequality in the case of the supervisory cadre (LHV and MHA) at PHCs is again
the result of a high proportion of PHCs functioning without LHVs and MHAs. This high
proportion is an indirect result of no or irregular recruitment of ANMs and MHWs. It has
forced states to slow down the process to recruit or train senior ANMs and MHWs as LHVs
and MHWs, respectively. Although the Gini score is high, it has been noted that the overall
inequality has reduced considerably for these workers (except MHAs, for whom the Gini
index did not change) over the study period. This reduction could be attributed to the rise in
availability of these workers, plus a reduction in the proportion of PHCs with more than one
health worker. For instance, the proportion of PHCs without LHVs was reduced by ten
percentage points over the study period. Furthermore, the proportion of PHCs with three or
more LHVs reduced from about 7% in 2002–2004 to 2% in 2012–2013. A deeper look into
the dataset reveals that the distribution of LHVs had a longer tail in 2002–2004 than in 2012–
2013. The same is applicable to staff nurses’ distribution as well.
The decomposition analysis of PHC-level inequality revealed similar results as the HSC
analysis, except for the fact that the within-state inequalities contributed to about 61% of the
overall PHC inequalities. However, it highlights the need to address within-state inequalities
by focusing on those states that contribute the most to it. Among these states are the high
resource states of Karnataka, Andhra Pradesh, and Kerala on the one hand, and Rajasthan,
Uttar Pradesh, Madhya Pradesh, Orissa, Chhattisgarh, Assam, and Bihar on the other. The
states of Rajasthan, Uttar Pradesh, Madhya Pradesh, Orissa, and Chhattisgarh also have lower
health worker shares relative to their HSC shares, which means that these states urgently need
more health workers to at least match their HSC shares. Conversely, those states with higher
contributions to between-state inequality need to deploy their existing HRH more equally.
The results for the CHC-level inequality analysis revealed that inter-CHC health worker
inequality has increased considerably during the study period. This increase in inequality
could be the result of a multitude of factors. One of them could be directly related to the
NRHM’s emphasis on designating a selected CHC as the first referral unit and then equipping
that CHC with more resources (including human resources) as compared with the general
CHCs (Sodani & Sharma 2011). A deeper look into the DLHS-4 data reveals that the
difference in the average number of health workers between FRUs and non-FRUs in 2012–
2013 was about seven workers compared to one worker in 2002–2003. This selective over-

123
deployment of human resources at some CHCs increases the variability of inter-CHC health
worker distribution.
Another source of the increase in inequality could be the increasing gap between states during
the study period. While some major states in the south, such as Kerala and Tamil Nadu, have
witnessed substantial improvements in their CHC-level human resource situation, the states
in north and central India (for instance, Uttar Pradesh and Orissa) witnessed small or no
improvement. The average number of health workers available at CHCs in these states
improved very little. The widening gap in the availability of health workers at the CHCs
between states is also reflected in the growing share of between-state inequalities and in the
overall inter-CHC inequality, which has grown from 13% in 2002–2004 to 32% in 2012–
2013.
The inequality analysis for different health worker categories reveals that the inequality is
high for specialists and public health nurses. It is important to note that these inequalities
have increased or remained stagnant over the study period. Both specialists and public health
nurses are scarce in the health system. Since, under the NRHM, there is tremendous pressure
on the state to perform better, they use the available specialist workforce judiciously by
placing them at strategic CHCs. This strategy of deploying a specialist at only certain CHCs
may be the reason why the proportion of CHCs without specialists has increased over the
study period, resulting in increased inequality (a higher Gini index). The Gini index for other
workers (doctors and nurses) hovers between 0.40 and 0.45.
The results of the decomposition of the overall inequality revealed that while the share of
within-state inequality decreased considerably, it was still significantly high, accounting for
nearly 68% of the overall inequality. The results underscore the need to address within-state
inequalities. It must be noted that the share of between-state inequalities has risen during the
study period as well. The focus of strategies to reduce inter-CHC inequality should be on the
states that have contributed most to the overall inequalities. The states of Uttar Pradesh,
Orissa, Madhya Pradesh, and Jharkhand are the states with lower health worker shares
relative to their CHC shares. These states need to recruit more health workers. Their higher
contribution to within-state inequality suggests that states (along with Rajasthan and Assam)
need to redistribute their existing CHC health workforce as well. It must be noted that all of
these states are the states where maternal and child health services are still lagging behind
(International Institute for Population Sciences 2010). Maternal and child mortality is still
much higher than in the rest of the country (Ministry of Health and Family Welfare 2014a).

124
This finding echoes the classic observation the people with the greatest need often have the
greatest difficulty receiving care. In this regard, Hart (1971), almost four decades ago,
observed that the availability of good medical care varies inversely with the need for it in the
population served (Hart 1971). His observation seems to be true for these states. Since the
CHCs are at the top of the hierarchy of the rural healthcare system and given that they are
responsible for providing affordable specialist services, low levels of human resources with a
highly unequal distribution could disrupt proper functioning of these health facilities and may
further deepen the overall adverse health situation in these states (Iyengar & Dholakia 2015).
The governments in these states must strive to appoint more healthcare workers to meet the
norm for HSCs.
The states of Tamil Nadu, West Bengal, and Kerala also contributed significantly to between-
state inequalities, but unlike the states of Uttar Pradesh, Orissa, Madhya Pradesh, and
Jharkhand, their contributions were positive. In other words, these states had higher shares of
health workers compared to their CHC shares. It is noticeable that these states experienced
the largest growth in health worker availability at the CHCs post 2002–2004. Unfortunately,
the distribution of existing human resources was highly unequal. Such a pattern (the overall
excess of health workers, but with substantial ‘within’-state inequalities) is typically found in
developed countries (Ricketts et al. 2000; Dumont et al. 2008). This kind of pattern is
probably a reflection of the fact that health policies in these states are influencing the
allocation of human resources across the CHCs. As discussed in previous paragraphs, this
may also be due to the lack of rational deployment and transfer policies, which gives health
workers the liberty to flee difficult, far off, and less developed areas to get posted in easy-to-
reach, better off, and developed areas. Various reports of common review missions that were
instituted under the NRHM have reiterated the need to fill vacancies in high-focus/remote
areas on a priority basis, which suggests that vacancies in health facilities existed despite the
overall higher availability of health workers (Ministry of Health and Family Welfare 2012j).
Therefore, the governments in these states should devise and implement policies that could
bring about a more equitable distribution of health workers across CHCs.
5.2.4 Summary of the main findings of this chapter
This chapter examined the availability of health workers, as well as the inequality of their
distribution, at HSCs, PHCs, and CHCs in India for two time points – 2002–2004 and 2012–
125
2013 – using the DLHS-2 and DLHS-4 facility data. The main findings of this chapter are as
follows:
• Average health worker availability at rural public health facilities has improved over
the study period (2002–2012). For instance, the average number of health workers
rose from 1.39 to 1.53 at the sub-centres, from 5.1 to 6.1 at the PHCs, and from 9.1 to
13.7 at the CHCs between 2002–2004 and 2012–2013.
• However, there exist variations across states – while some states improved their
average availability, other states witnessed a reduction in the average availability of
health workers at their rural public health facilities. For instance, while the state of
Kerala witnessed improvements in the average availability of health workers across
HSCs, PHCs, and CHCs, the state of Uttar Pradesh witnessed a decline in the average
availability of health workers at the HSCs and PHCs, and only a marginal
improvement at the CHC level.
• The findings revealed that 2.5% HSCs and 2.1% PHCs in the country were
functioning without any health workers. The proportion of HSCs without a health
worker and with three workers has risen to 4.5% and 10.8%; those with an ANM rose
from 7.4% in 2002–2004 to 11.1% in 2012–2013, and those without an MHW rose
from 60.6% to 68.1%. The proportion of HSCs without a contractual ANM declined
considerably and stood at about 65%. State-level variation does exist. Some states had
as many as 44% of their HSCs functioning without an ANM. The states of Haryana,
Assam, West Bengal, and Andhra Pradesh made considerable progress in reducing
their share of HSCs without a contractual ANM.
• About 50%–60% of PHCs in the country were functioning without a supervisory
cadre – i.e., an MHA and LHV. While the proportion of PHCs without an MHW
increased marginally from 56.1% to 59.2%, the proportion of PHCs without an LHV
declined from 63.9% to 53.1%. At state level, the proportion of PHCs without MHAs
rose as high as 90.3% in the state of UP, while for LHV, the proportion of such PHCs
was 96.4% in Jharkhand.
• The proportion of PHCs and CHCs without a doctor declined over the period;
however, still about 10% of PHCs and 12% of CHCs were functioning without a
doctor in 2012–2013. The proportion of PHCs without a doctor was high in the states
of Uttar Pradesh (17%), Madhya Pradesh (27%), and Chhattisgarh (30%), while the
126
proportion of CHCs without a doctor was high in the states of Bihar, Orissa, and
Karnataka.
• Despite improvements in the availability of staff nurses at PHCs and CHCs during the
study period, nearly half of the PHCs and one tenth of the CHCs in the country were
functioning without staff nurses in 2012–2013. The proportion of PHCs without staff
nurses was highest in the states of Orissa, Uttar Pradesh, and West Bengal. The
proportion of such CHCs was highest in the state of Bihar. The proportion of CHCs
without public health nurses was high in all states except Kerala and West Bengal.
• About 31% of PHCs and 10% of CHCs in the country did not have a pharmacist in
position in 2012–2013. In the case of PHCs, the proportion of such PHCs was highest
in Rajasthan, Madhya Pradesh, and Jharkhand. The proportion of CHCs without
pharmacists was highest in the state of Bihar (56%).
• The proportion of CHCs without a specialist rose marginally during the study period
to reach 57% in 2012–2013. When the proportion was calculated for separate
categories of specialists, it rose above 80%. For instance, 83%–84% of CHCs did not
have anaesthetists and surgeons, respectively. The proportion varied across states, but
all states, except Kerala and Bihar, had a high proportion of such CHCs.
• As far inequalities in health worker distribution are concerned, inequality – as
measured by the Theil T and Gini index – increased for the sub-centres and CHCs.
For PHCs, the inequality in the distribution of health workers reduced from Gini 0.45
to Gini 0.35 during 2002–2012. Among health workers, inequality was high for
specialists and public health nurses. All categories of specialists showed high
inequality.
• The decomposition of overall inequality into between-state and within-state inequality
revealed that a majority of the contribution came from within-state inequality. This
was true for all health workers as well. It was observed that the share of between-state
inequality rose considerably during the study period and hovered between 30%–40%
across categories of health workers.
• At the HSC level, within-state inequalities were present in almost all of these states
including Kerala, Tamil Nadu, Andhra Pradesh, and Karnataka. The share of Uttar
Pradesh, Bihar, Rajasthan, and Madhya Pradesh was considerably higher than in the
other states. The contribution to between-state inequality was highest from Assam,
Maharashtra, Haryana, Andhra Pradesh, Uttar Pradesh, and Tamil Nadu.
127
• The analysis of the state-wise contribution to the overall within-state inequality in the
distribution of PHC workers revealed that the largest contribution came from Andhra
Pradesh, Karnataka, Kerala, Bihar, Uttar Pradesh, and Madhya Pradesh. The greatest
contribution to between-state inequality came again from Andhra Pradesh, Karnataka,
Kerala, Bihar, Haryana, Uttar Pradesh, Orissa, and Madhya Pradesh.
• At the CHCs, the largest shares of overall within-state inequality came from the state
of Tamil Nadu, Kerala, West Bengal, Uttar Pradesh, Orissa, and Madhya Pradesh.
These states hugely contributed to between-state inequality as well.
Overall, looking at the findings of this chapter, it can be concluded that during 2002–2012,
the overall situation of human resources improved to some extent. However, the shortage of
health workers is still considerably high, especially for the supervisory cadre (LHVs and
MHAs), specialists, public health nurses, a 2nd ANM, and MHWs. The inequality analysis
suggests that the lack of an adequate supply of health workers in the rural public health
system in India is not the only problem; the unequal distribution of available health workers
is also a serious problem. There are states with an adequate number of health workers, but
they are suffering from unequal distributions across health facilities. On the other hand, there
are states such as Uttar Pradesh that not only suffer from an insufficient supply of health
workers, but also from a highly uneven distribution of existing health workers across their
health facilities. Since most inequality is attributed to within-state inequalities, state
governments should attempt to recruit health workers and also ensure that proper deployment
and transfer policies are in place. Furthermore, they should be given more liberty to choose
the policies most appropriate for their location, rather than simply implementing nationally
sponsored programmes, such as the NRHM.

128
6 Chapter 6 Results: Factors Affecting the Distribution of Health
Workers
6.1 Introduction
This chapter presents the findings of the quantitative and qualitative analyses that were
carried out to accomplish the second objective of the study, which aimed to examine the
factors affecting health worker availability across public health facilities in rural India. The
chapter starts by presenting the results of count regression analysis conducted for the sub-
centres, primary health centres (PHCs), and community health centres (CHCs), separately.
Then, the chapter presents the findings of the thematic analysis, which was conducted to
analyse the data obtained from semi-structured interviews to explore the factors affecting
health worker availability in the Sitapur district of Uttar Pradesh. This chapter closes by
providing a discussion on the combined results of the qualitative and quantitative analyses
with the help of relevant literature on this issue, which pertains to identifying the factors that
affect health worker availability and distribution.
6.2 Results: Factors affecting health worker availability at public health facilities
in rural India: Evidence from the DLHS-3
6.2.1 Health sub-centres
This section provides the results of the Poisson regression analysis that was conducted to
examine the factors affecting health worker availability at health-sub centres (HSCs). In all,
the analysis included 16,652 sub-centres. The dependent variable, the number of health
workers available at a given HSC, was a count variable with a mean of 1.54 and a variance of
0.39. For details of the independent and dependent variables used in this analysis, see section
4.4.3 of Chapter 4.
6.2.1.1 Descriptive statistics
Table 6.1 shows the descriptive statistics of the variables used in the analysis. About 44% of
HSCs were housed in government buildings. Furthermore, nearly 47% did not have
electricity, and approximately 32% received an irregular supply. There were HSCs with no
water facilities as well. The proportion of such HSCs was about 27%. On an average, an HSC
served 6,322 people; however, the range of the population served varied from 30 to 90,000.
Village Health Sanitation Committees (VHSCs) were established in about 60% of HSCs.
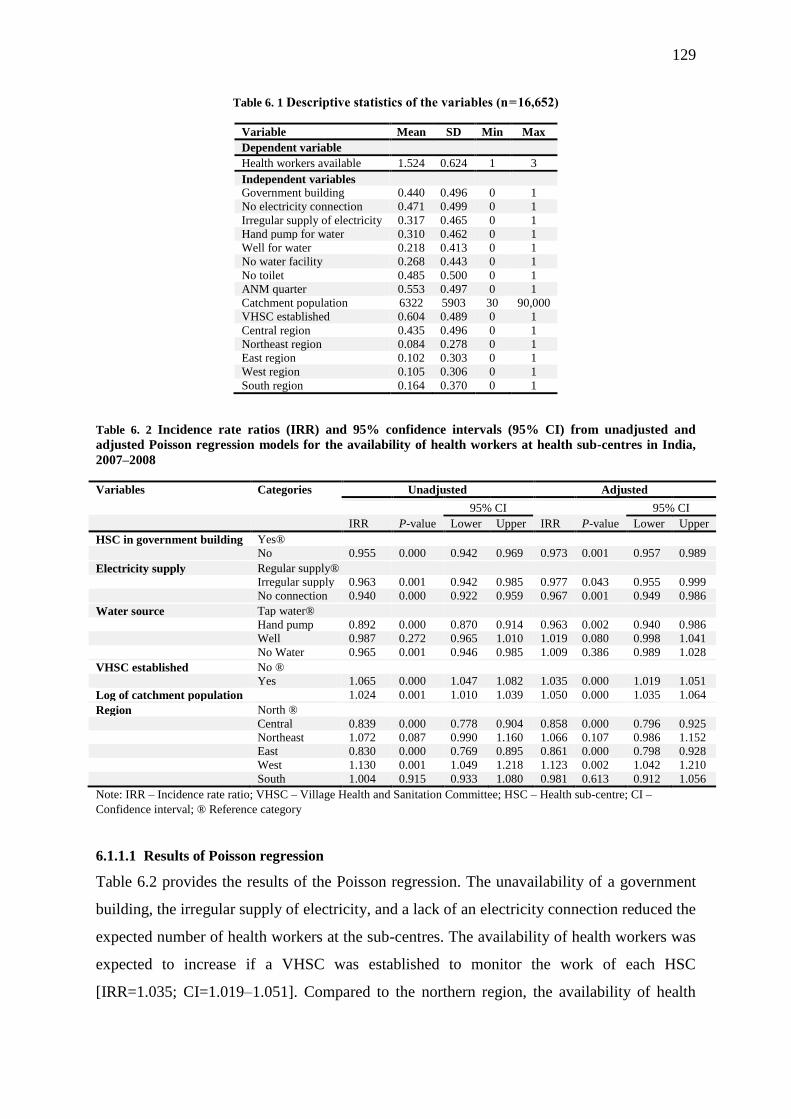
129
Table 6. 1 Descriptive statistics of the variables (n = 16,652)
Variable Mean SD Min Max
Dependent variable
Health workers available 1.524 0.624 1 3
Independent variables
Government building 0.440 0.496 0 1
No electricity connection 0.471 0.499 0 1
Irregular supply of electricity 0.317 0.465 0 1
Hand pump for water 0.310 0.462 0 1
Well for water 0.218 0.413 0 1
No water facility 0.268 0.443 0 1
No toilet 0.485 0.500 0 1
ANM quarter 0.553 0.497 0 1
Catchment population 6322 5903 30 90,000
VHSC established 0.604 0.489 0 1
Central region 0.435 0.496 0 1
Northeast region 0.084 0.278 0 1
East region 0.102 0.303 0 1
West region 0.105 0.306 0 1
South region 0.164 0.370 0 1
Table 6. 2 Incidence rate ratios (IRR) and 95% confidence intervals (95% CI) from unadjusted and
adjusted Poisson regression models for the availability of health workers at health sub-centres in India,
2007–2008
Variables Categories Unadjusted Adjusted
95% CI 95% CI
IRR P-value Lower Upper IRR P-value Lower Upper
HSC in government building Yes®
No 0.955 0.000 0.942 0.969 0.973 0.001 0.957 0.989
Electricity supply Regular supply®
Irregular supply 0.963 0.001 0.942 0.985 0.977 0.043 0.955 0.999
No connection 0.940 0.000 0.922 0.959 0.967 0.001 0.949 0.986
Water source Tap water®
Hand pump 0.892 0.000 0.870 0.914 0.963 0.002 0.940 0.986
Well 0.987 0.272 0.965 1.010 1.019 0.080 0.998 1.041
No Water 0.965 0.001 0.946 0.985 1.009 0.386 0.989 1.028
VHSC established No ®
Yes 1.065 0.000 1.047 1.082 1.035 0.000 1.019 1.051
Log of catchment population 1.024 0.001 1.010 1.039 1.050 0.000 1.035 1.064
Region North ®
Central 0.839 0.000 0.778 0.904 0.858 0.000 0.796 0.925
Northeast 1.072 0.087 0.990 1.160 1.066 0.107 0.986 1.152
East 0.830 0.000 0.769 0.895 0.861 0.000 0.798 0.928
West 1.130 0.001 1.049 1.218 1.123 0.002 1.042 1.210
South 1.004 0.915 0.933 1.080 0.981 0.613 0.912 1.056
Note: IRR – Incidence rate ratio; VHSC – Village Health and Sanitation Committee; HSC – Health sub-centre; CI –
Confidence interval; ® Reference category
6.1.1.1 Results of Poisson regression
Table 6.2 provides the results of the Poisson regression. The unavailability of a government
building, the irregular supply of electricity, and a lack of an electricity connection reduced the
expected number of health workers at the sub-centres. The availability of health workers was
expected to increase if a VHSC was established to monitor the work of each HSC
[IRR=1.035; CI=1.019–1.051]. Compared to the northern region, the availability of health
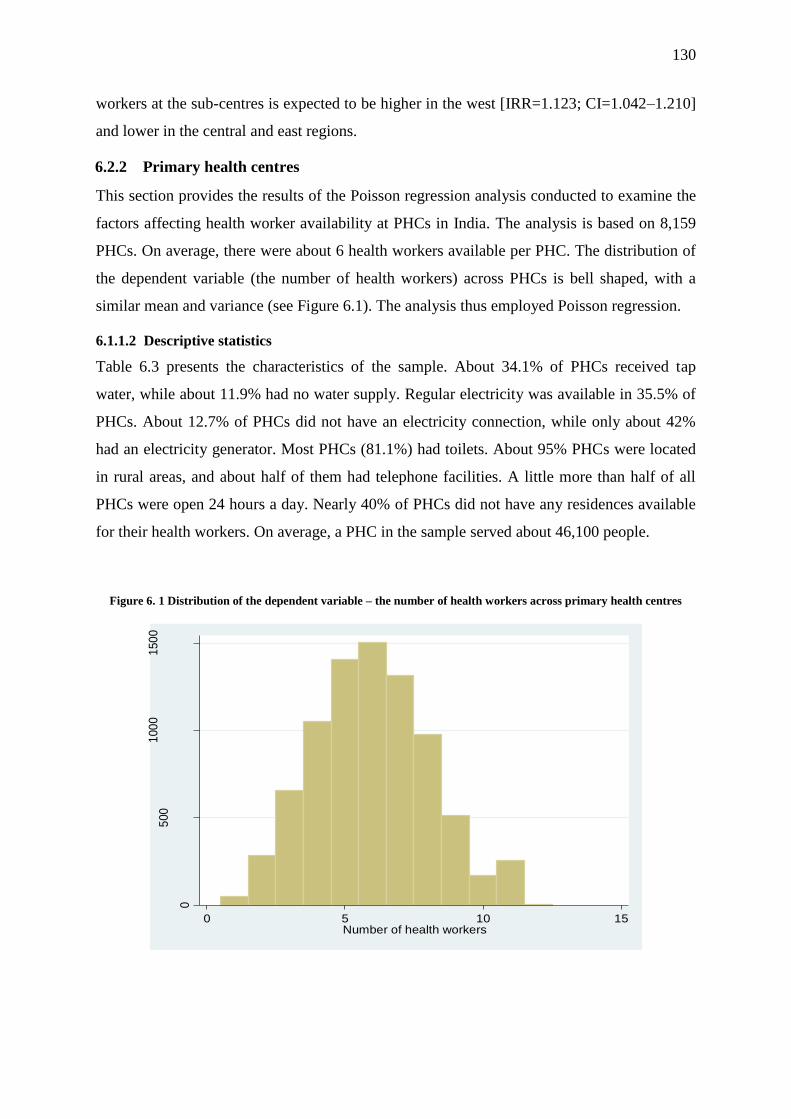
130
workers at the sub-centres is expected to be higher in the west [IRR=1.123; CI=1.042–1.210]
and lower in the central and east regions.
6.2.2 Primary health centres
This section provides the results of the Poisson regression analysis conducted to examine the
factors affecting health worker availability at PHCs in India. The analysis is based on 8,159
PHCs. On average, there were about 6 health workers available per PHC. The distribution of
the dependent variable (the number of health workers) across PHCs is bell shaped, with a
similar mean and variance (see Figure 6.1). The analysis thus employed Poisson regression.
6.1.1.2 Descriptive statistics
Table 6.3 presents the characteristics of the sample. About 34.1% of PHCs received tap
water, while about 11.9% had no water supply. Regular electricity was available in 35.5% of
PHCs. About 12.7% of PHCs did not have an electricity connection, while only about 42%
had an electricity generator. Most PHCs (81.1%) had toilets. About 95% PHCs were located
in rural areas, and about half of them had telephone facilities. A little more than half of all
PHCs were open 24 hours a day. Nearly 40% of PHCs did not have any residences available
for their health workers. On average, a PHC in the sample served about 46,100 people.
Figure 6. 1 Distribution of the dependent variable – the number of health workers across primary health centres
0
500
100
01
50
0
Fre
que
ncy
0 5 10 15Number of health workers
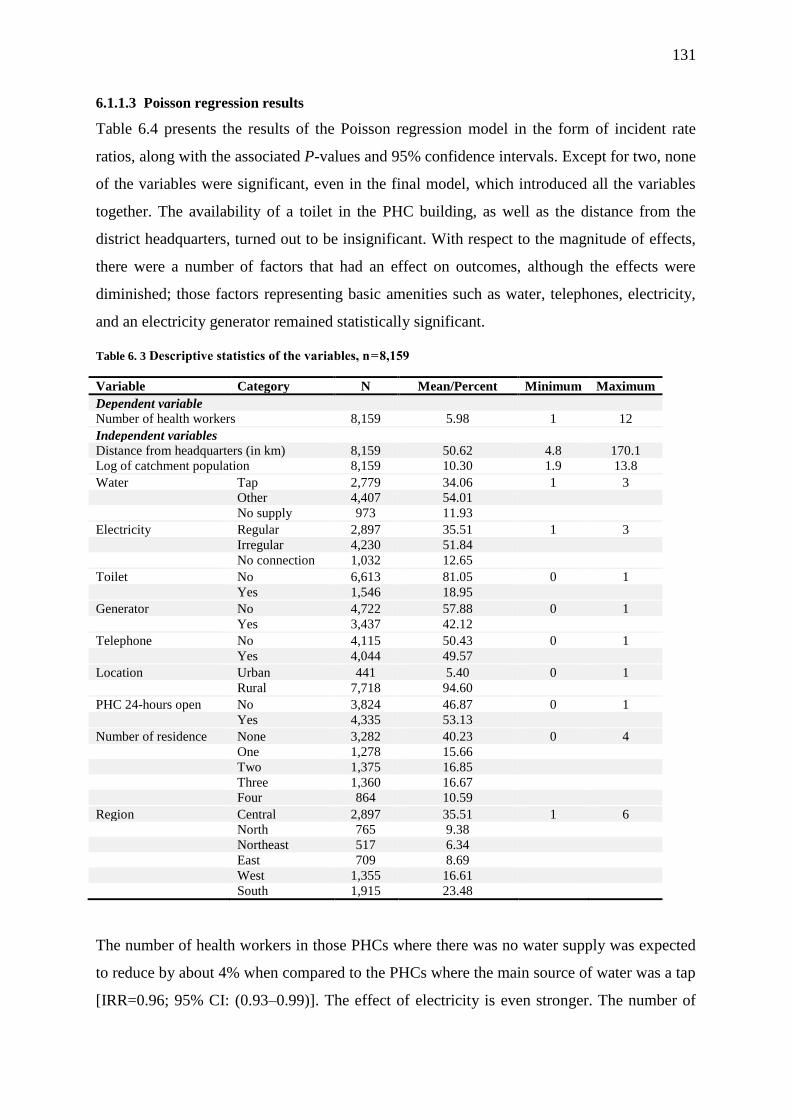
131
6.1.1.3 Poisson regression results
Table 6.4 presents the results of the Poisson regression model in the form of incident rate
ratios, along with the associated P-values and 95% confidence intervals. Except for two, none
of the variables were significant, even in the final model, which introduced all the variables
together. The availability of a toilet in the PHC building, as well as the distance from the
district headquarters, turned out to be insignificant. With respect to the magnitude of effects,
there were a number of factors that had an effect on outcomes, although the effects were
diminished; those factors representing basic amenities such as water, telephones, electricity,
and an electricity generator remained statistically significant.
Table 6. 3 Descriptive statistics of the variables, n = 8,159
Variable Category N Mean/Percent Minimum Maximum
Dependent variable
Number of health workers 8,159 5.98 1 12
Independent variables
Distance from headquarters (in km) 8,159 50.62 4.8 170.1
Log of catchment population 8,159 10.30 1.9 13.8
Water Tap 2,779 34.06 1 3
Other 4,407 54.01
No supply 973 11.93
Electricity Regular 2,897 35.51 1 3
Irregular 4,230 51.84
No connection 1,032 12.65
Toilet No 6,613 81.05 0 1
Yes 1,546 18.95
Generator No 4,722 57.88 0 1
Yes 3,437 42.12
Telephone No 4,115 50.43 0 1
Yes 4,044 49.57
Location Urban 441 5.40 0 1
Rural 7,718 94.60
PHC 24-hours open No 3,824 46.87 0 1
Yes 4,335 53.13
Number of residence None 3,282 40.23 0 4
One 1,278 15.66
Two 1,375 16.85
Three 1,360 16.67
Four 864 10.59
Region Central 2,897 35.51 1 6
North 765 9.38
Northeast 517 6.34
East 709 8.69
West 1,355 16.61
South 1,915 23.48
The number of health workers in those PHCs where there was no water supply was expected
to reduce by about 4% when compared to the PHCs where the main source of water was a tap
[IRR=0.96; 95% CI: (0.93–0.99)]. The effect of electricity is even stronger. The number of
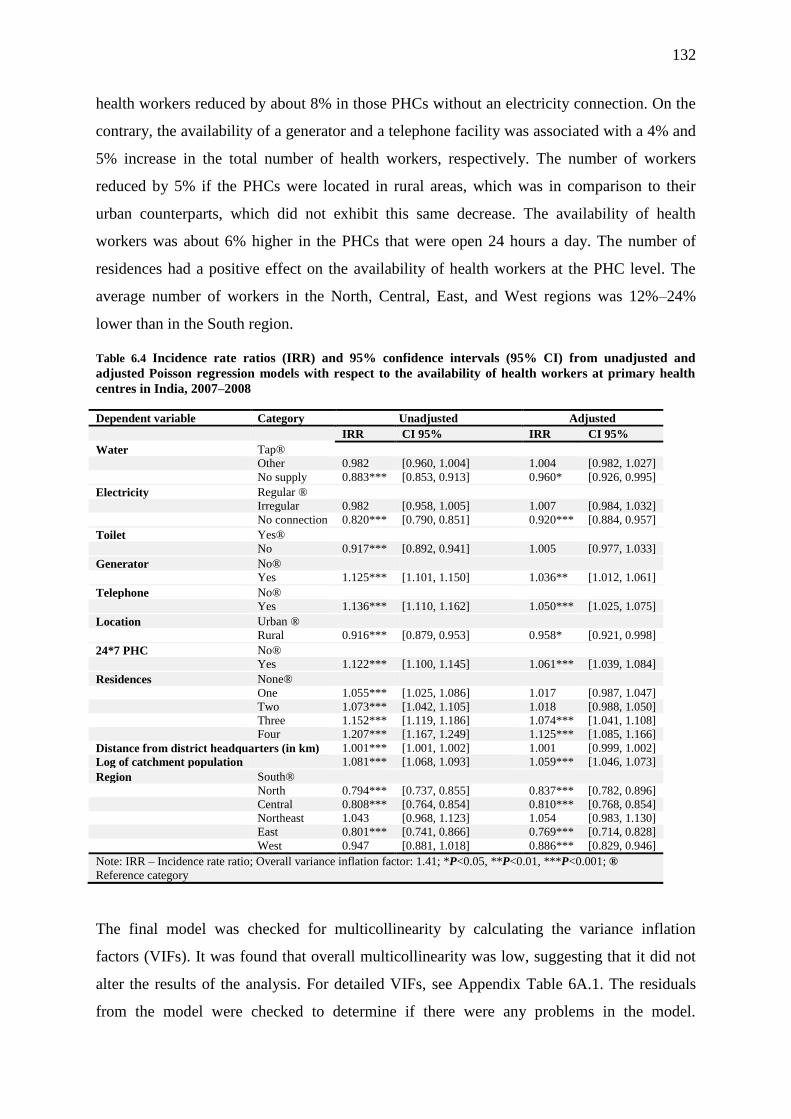
132
health workers reduced by about 8% in those PHCs without an electricity connection. On the
contrary, the availability of a generator and a telephone facility was associated with a 4% and
5% increase in the total number of health workers, respectively. The number of workers
reduced by 5% if the PHCs were located in rural areas, which was in comparison to their
urban counterparts, which did not exhibit this same decrease. The availability of health
workers was about 6% higher in the PHCs that were open 24 hours a day. The number of
residences had a positive effect on the availability of health workers at the PHC level. The
average number of workers in the North, Central, East, and West regions was 12%–24%
lower than in the South region.
Table 6.4 Incidence rate ratios (IRR) and 95% confidence intervals (95% CI) from unadjusted and
adjusted Poisson regression models with respect to the availability of health workers at primary health
centres in India, 2007–2008
Dependent variable Category Unadjusted Adjusted
IRR CI 95% IRR CI 95%
Water Tap®
Other 0.982 [0.960, 1.004] 1.004 [0.982, 1.027]
No supply 0.883*** [0.853, 0.913] 0.960* [0.926, 0.995]
Electricity Regular ®
Irregular 0.982 [0.958, 1.005] 1.007 [0.984, 1.032]
No connection 0.820*** [0.790, 0.851] 0.920*** [0.884, 0.957]
Toilet Yes®
No 0.917*** [0.892, 0.941] 1.005 [0.977, 1.033]
Generator No®
Yes 1.125*** [1.101, 1.150] 1.036** [1.012, 1.061]
Telephone No®
Yes 1.136*** [1.110, 1.162] 1.050*** [1.025, 1.075]
Location Urban ®
Rural 0.916*** [0.879, 0.953] 0.958* [0.921, 0.998]
24*7 PHC No®
Yes 1.122*** [1.100, 1.145] 1.061*** [1.039, 1.084]
Residences None®
One 1.055*** [1.025, 1.086] 1.017 [0.987, 1.047]
Two 1.073*** [1.042, 1.105] 1.018 [0.988, 1.050]
Three 1.152*** [1.119, 1.186] 1.074*** [1.041, 1.108]
Four 1.207*** [1.167, 1.249] 1.125*** [1.085, 1.166]
Distance from district headquarters (in km) 1.001*** [1.001, 1.002] 1.001 [0.999, 1.002]
Log of catchment population 1.081*** [1.068, 1.093] 1.059*** [1.046, 1.073]
Region South®
North 0.794*** [0.737, 0.855] 0.837*** [0.782, 0.896]
Central 0.808*** [0.764, 0.854] 0.810*** [0.768, 0.854]
Northeast 1.043 [0.968, 1.123] 1.054 [0.983, 1.130]
East 0.801*** [0.741, 0.866] 0.769*** [0.714, 0.828]
West 0.947 [0.881, 1.018] 0.886*** [0.829, 0.946]
Note: IRR – Incidence rate ratio; Overall variance inflation factor: 1.41; *P<0.05, **P<0.01, ***P<0.001; ®
Reference category
The final model was checked for multicollinearity by calculating the variance inflation
factors (VIFs). It was found that overall multicollinearity was low, suggesting that it did not
alter the results of the analysis. For detailed VIFs, see Appendix Table 6A.1. The residuals
from the model were checked to determine if there were any problems in the model.
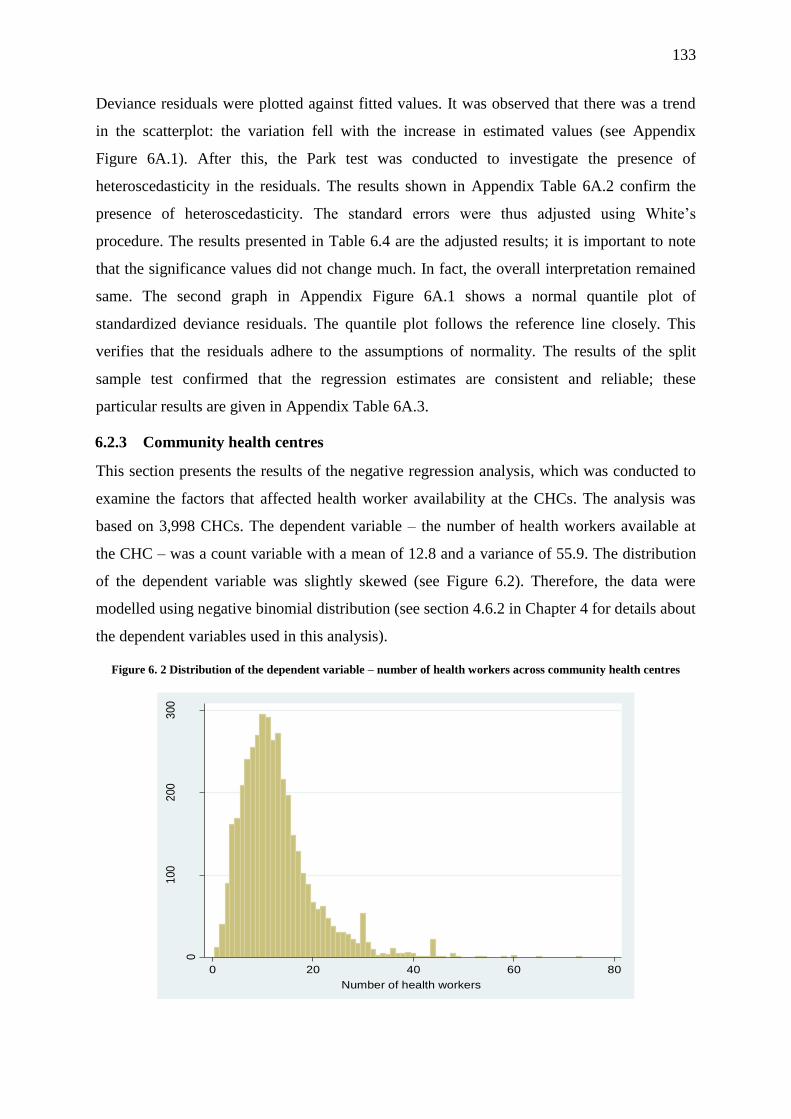
133
Deviance residuals were plotted against fitted values. It was observed that there was a trend
in the scatterplot: the variation fell with the increase in estimated values (see Appendix
Figure 6A.1). After this, the Park test was conducted to investigate the presence of
heteroscedasticity in the residuals. The results shown in Appendix Table 6A.2 confirm the
presence of heteroscedasticity. The standard errors were thus adjusted using White’s
procedure. The results presented in Table 6.4 are the adjusted results; it is important to note
that the significance values did not change much. In fact, the overall interpretation remained
same. The second graph in Appendix Figure 6A.1 shows a normal quantile plot of
standardized deviance residuals. The quantile plot follows the reference line closely. This
verifies that the residuals adhere to the assumptions of normality. The results of the split
sample test confirmed that the regression estimates are consistent and reliable; these
particular results are given in Appendix Table 6A.3.
6.2.3 Community health centres
This section presents the results of the negative regression analysis, which was conducted to
examine the factors that affected health worker availability at the CHCs. The analysis was
based on 3,998 CHCs. The dependent variable – the number of health workers available at
the CHC – was a count variable with a mean of 12.8 and a variance of 55.9. The distribution
of the dependent variable was slightly skewed (see Figure 6.2). Therefore, the data were
modelled using negative binomial distribution (see section 4.6.2 in Chapter 4 for details about
the dependent variables used in this analysis).
Figure 6. 2 Distribution of the dependent variable – number of health workers across community health centres
0
100
200
300
Fre
que
ncy
0 20 40 60 80
Number of health workers

134
6.1.1.4 Descriptive statistics
Table 6.5 presents the characteristics of the sample used in the regression analysis. About
42% of the CHCs received tap water, while about 21% of the CHCs did not have an
electricity connection. About 75% of the CHCs had an electricity generator that provided
them with an irregular supply of electricity. Only about 19% of all CHCs had all three
communication items: a computer, an Internet connection, and a telephone. A little more than
one-fourth of the CHCs were located in urban areas. Furthermore, the proportion of CHCs
without residences for their workers was about 35%; meanwhile, only 5% of CHCs had met
the recommendation of providing six residences for their staff members. The average
population served by a CHC was 122,750 individuals.
Table 6.5 Descriptive statistics of the variables, n =3,998
Variable Category Mean Std. Dev. Min Max
Water supply Tap
Other 0.56 0.50 0 1
No supply 0.02 0.14 0 1
Electricity Yes
No connection 0.21 0.40 0 1
Generator No
Yes 0.75 0.44 0 1
Communication None
One 0.29 0.46 0 1
Two 0.33 0.47 0 1
Three 0.19 0.39 0 1
Location Rural
Urban 0.26 0.44 0 1
FRU No
Yes 0.52 0.50 0 1
Residences None
One 0.30 0.46 0 1
Two 0.19 0.39 0 1
Three 0.10 0.30 0 1
Four 0.07 0.25 0 1
Five 0.04 0.20 0 1
Six 0.05 0.22 0 1
Population served by the CHC 122,750 89,441 0 922,813
Region North
Central 0.44 0.50 0 1
Northeast 0.05 0.21 0 1
East 0.10 0.30 0 1
West 0.12 0.33 0 1
South 0.20 0.40 0 1
6.1.1.5 Results of the negative binomial regression
Table 6.6 presents the unadjusted and adjusted odds ratios obtained from the negative
binomial regression analysis. The final analysis is based on 3,998 CHCs after removing some
CHCs from the calculations due to their unusual values (such as the CHC that showed a
catchment population of 0). The results highlighted that the magnitude of the coefficient for
all variables had reduced. With the exception of the availability of a toilet, all variables were

135
statistically significant predictors of health worker availability at the CHC level. The
availability of health workers in the CHCs with no water supply and no electricity connection
was, respectively, 13% and 9% lower than in those CHCs where these amenities were
available.
The availability of a generator and communication facilities, as well as the number of
residences, have a positive and statistically significant effect on health worker availability at
the CHCs. For instance, the availability of an electricity generator was associated with a 14%
increase in the number of health workers, while the availability of all three communication
facilities (a telephone, a computer, and the Internet) was associated with a 16% increase in
the number of health workers. Similarly, there is a progressive increase in the number of
health workers with increasing numbers of in-campus residences. Health worker availability
increased by about 41% if the CHC had 4 residences, when compared to those CHCs with no
residences.
The final model was assessed to verify whether the negative binomial distribution fit the data
better than Poisson distribution. To achieve this aim, a likelihood ratio test was conducted.
The chi-square statistics were large and highly significant. The dispersion parameter, α, was
positive (greater than 0) and statistically significant, which means that it was significantly
different from zero. This indicates that the outcome was over-dispersed and the negative
binomial regression was a better choice when compared to Poisson regression.
The model was checked for multicollinearity as well, the results of which are given in the
Appendix. The table shows that the overall multicollinearity, as shown by VIF, was very
small. This illustrates that the results were largely free from multicollinearity. Model checks
were conducted at the end as a final step to see if there were any problems with it. Appendix
Figure 6A features two graphs. The first presents the deviance residuals plotted against the
estimated number of health workers. Although not very strong, there is a trend of falling
variation with increases in the estimated value of health workers. A model is considered to
have a good fit if randomness is present and there are no patterns in the deviance residuals
versus the fitted values in the graph. Patterns in the deviance residuals show that there is a
problem of heteroscedasticity; this was confirmed by the Park test as well (see Appendix
Table 6A). Therefore, any standard errors associated with the coefficients were adjusted for
heteroscedasticity using White’s procedure. The second graph is the normal quantile plot of
standardized deviance residuals. The deviance values closely follow the diagonal line, except
in the upper-right half, where they veer off the line towards the left. As most values follow
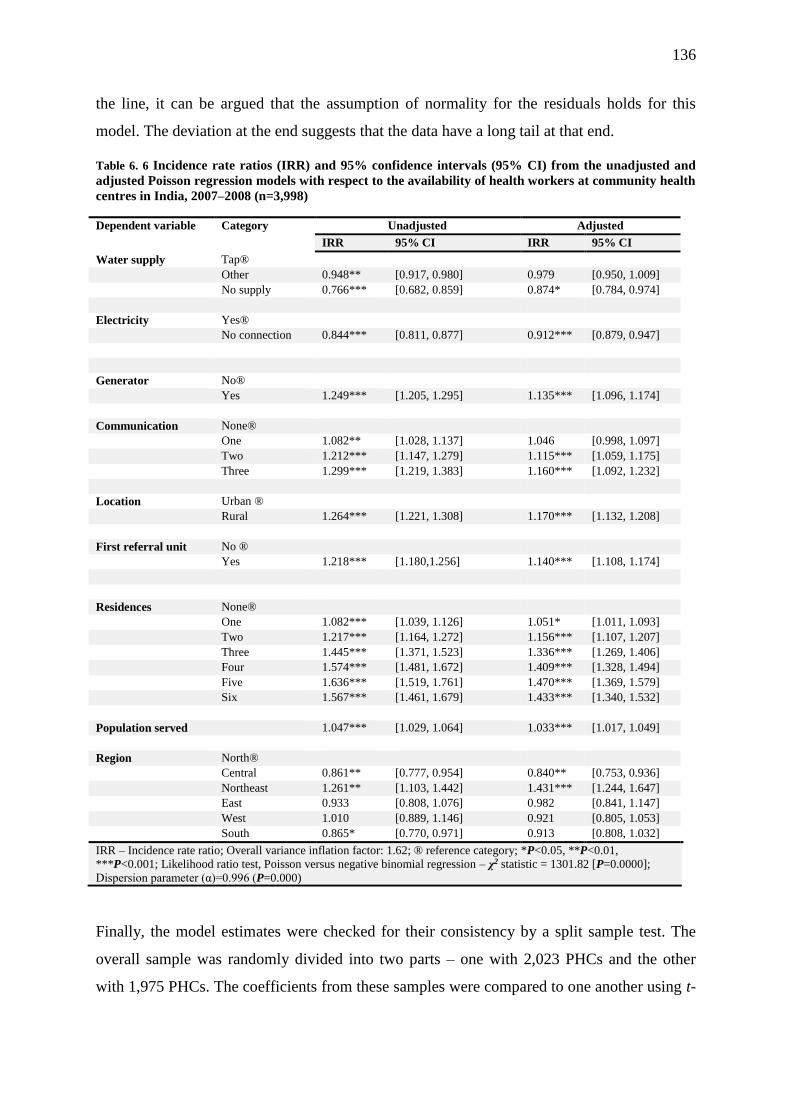
136
the line, it can be argued that the assumption of normality for the residuals holds for this
model. The deviation at the end suggests that the data have a long tail at that end.
Table 6. 6 Incidence rate ratios (IRR) and 95% confidence intervals (95% CI) from the unadjusted and
adjusted Poisson regression models with respect to the availability of health workers at community health
centres in India, 2007–2008 (n=3,998)
Dependent variable Category Unadjusted Adjusted
IRR 95% CI IRR 95% CI
Water supply Tap®
Other 0.948** [0.917, 0.980] 0.979 [0.950, 1.009]
No supply 0.766*** [0.682, 0.859] 0.874* [0.784, 0.974]
Electricity Yes®
No connection 0.844*** [0.811, 0.877] 0.912*** [0.879, 0.947]
Generator No®
Yes 1.249*** [1.205, 1.295] 1.135*** [1.096, 1.174]
Communication None®
One 1.082** [1.028, 1.137] 1.046 [0.998, 1.097]
Two 1.212*** [1.147, 1.279] 1.115*** [1.059, 1.175]
Three 1.299*** [1.219, 1.383] 1.160*** [1.092, 1.232]
Location Urban ®
Rural 1.264*** [1.221, 1.308] 1.170*** [1.132, 1.208]
First referral unit No ®
Yes 1.218*** [1.180,1.256] 1.140*** [1.108, 1.174]
Residences None®
One 1.082*** [1.039, 1.126] 1.051* [1.011, 1.093]
Two 1.217*** [1.164, 1.272] 1.156*** [1.107, 1.207]
Three 1.445*** [1.371, 1.523] 1.336*** [1.269, 1.406]
Four 1.574*** [1.481, 1.672] 1.409*** [1.328, 1.494]
Five 1.636*** [1.519, 1.761] 1.470*** [1.369, 1.579]
Six 1.567*** [1.461, 1.679] 1.433*** [1.340, 1.532]
Population served 1.047*** [1.029, 1.064] 1.033*** [1.017, 1.049]
Region North®
Central 0.861** [0.777, 0.954] 0.840** [0.753, 0.936]
Northeast 1.261** [1.103, 1.442] 1.431*** [1.244, 1.647]
East 0.933 [0.808, 1.076] 0.982 [0.841, 1.147]
West 1.010 [0.889, 1.146] 0.921 [0.805, 1.053]
South 0.865* [0.770, 0.971] 0.913 [0.808, 1.032]
IRR – Incidence rate ratio; Overall variance inflation factor: 1.62; ® reference category; *P<0.05, **P<0.01,
***P<0.001; Likelihood ratio test, Poisson versus negative binomial regression – χ2 statistic = 1301.82 [P=0.0000];
Dispersion parameter (α)=0.996 (P=0.000)
Finally, the model estimates were checked for their consistency by a split sample test. The
overall sample was randomly divided into two parts – one with 2,023 PHCs and the other
with 1,975 PHCs. The coefficients from these samples were compared to one another using t-
137
statistics, which were calculated using the formula mentioned in section 4.7.2. The results
show that most coefficients were not statistically different from their counterparts in the other
model, indicating that the results from the analysis were consistent.
6.3 Results and analysis of the qualitative data
This section presents the findings and analysis of the qualitative data, which were collected
from health facility managers via semi-structured interviews to explore the factors that shape
the unequal distribution of health workers across rural health facilities in the district of
Sitapur.
As discussed in Chapter 4, open coding (line by line) of the written interviews was initially
carried out. These codes were then recoded into broad themes (factors and themes are used
interchangeably in this chapter). The themes could be placed under a few main headings,
such as organization factors, geographical factors, contextual factors, individual factors, and
so on; some of these themes could be placed under more than one of these headings. I not
only considered well-known themes that are currently featured in this research area, but I also
valued the findings from the quantitative data analysis, while establishing themes in the
qualitative data.
Before discussing the main themes that emerged from the qualitative analysis, a brief
summary of the health worker situation in the district must be provided to help readers better
understand the results. The three-tier hierarchy of the rural health system consists of 468
HSCs, 61 PHCs, and 19 CHCs as of 2013. The current number of health facilities in the
district is nowhere near the norms set forth by the Indian Public Health Standards (IPHS). A
district teeming with 4.3 million rural people would need an additional 17 CHCs, 82 PHCs,
and over 400 HSCs to effectively cover its total population. Apart from shortages in health
facilities, the quality of the existing infrastructure (including basic amenities) is generally
poor.
The severity of the shortage of health workers in the district can be gauged from the fact that
there are only four surgeons for a population of 4.3 million. It is not just the shortage of
specialists that is worrisome; the system also suffers from a severe shortage of nursing staff
in the CHCs. There are only 33 nurses in the entire system, which is a stark contrast against
the IPHS’s recommended norm of 190 nurses. If the current population is taken into
consideration, the total number of required nurses increases to 360, which is 10 times the

138
current number of nurses in the district. Moreover, there are many CHCs without a nurse. In
such cases, ANMs have to assume the nurses’ responsibility.
There are 61 PHCs in the district. As per the established norms, a PHC in UP must have an
MBBS doctor, who also doubles as the superintendent of the PHC. Apart from that, a PHC
must have a medical officer of community health (MOCH), a pharmacist, a lab assistant, a
non-medical assistant (male health assistant), a ward boy, a sweeper, and an ANM. Within
the PHCs, of a total of 478 sanctioned posts, only 279 are filled. In other words, about 41.4%
of all sanctioned posts at the PHC level are vacant. Every PHC in the district, except for four
– Terwa, Angrashi, Rikhuana, and Khanpur – has a medical officer. On the contrary, only one
in five PHCs has a MOCH in place. There are no vacant posts as far as pharmacists are
concerned. Moreover, only 33.8% of sanctioned posts for lab assistants are filled in the
district. CHCs in the district have a huge shortage of specialists – about 77% of posts were
vacant as of July 2013. A closer look at the data reveals an interesting pattern. While the
CHCs in the most ‘difficult’ areas (located in ravine tracts affected by annual floods) in the
district have no specialists, the most accessible CHCs have 4 to 5 specialists. See Appendix
Table 6A.9 and Table 6A.10 for details regarding the health workforce at public health
facilities in Sitapur.
The following primary themes emerged from the qualitative data analysis; they will be
discussed one by one under following headings.
6.3.1 Organizational factors
6.3.1.1 Recruitment and deployment policies
The present distribution of health workers across the district is the shaped by a number of
factors. The one that was expressed by almost every participant included in the sample was
the inability of the government to recruit more workers and to fill the existing vacancies. The
chief medical officer (CMO) found that the number of unfilled positions in the PHCs and
CHCs constitutes the main reason behind this unequal distribution. According to him, the
unfilled/vacant posts give health workers the opportunity to transfer to their favourite health
facilities which were, unfortunately, the favourite for most people, as they are located in
better areas and along the highways. A similar view was expressed by a medical officer who
doubles as the superintendent of a PHC:
“…the government …state government ...they are the ones who recruit doctors and
nurses…but as far as I know…I have been in service for 10 years now…only
contractual recruitments have been conducted …and that too under the

139
NRHM…only in a few places. If the government does not recruit workers, obviously
facilities won’t have workers…vacant positions are the reason why you see workers
teeming in certain facilities, and not in others…they can get transferred to
PHC/CHC closer to their homes.” (CHC Tambaur)
Medical officers were of the opinion that the reason why no recruitment initiatives were
underway was the lack of political will and the low priority given to the health system when
compared to other populist measures of the government. In a medical officer’s words:
“If politicians have the will, they can do whatever they want…this (health)
system will start functioning properly in just a day…if they want…” (PHC
Samodideeh)
Although some health workers were recruited under NRHM, there are obviously not enough
workers to fill existing vacancies. The CMO revealed how the workforce recruited under the
NRHM is selectively deployed in only few facilities; this is important from the NRHM’s
perspective, which focuses primarily on improving the uptake of institutional delivery.
Therefore, most NRHM health workers are deployed only to those health facilities that have
been designated as delivery points. Giving an example of such a policy, she says:
“The NRHM’s staff is dedicated to NRHM programs only. They are
deployed strategically to selected facilities…so you will not find a
contractual ANM that was recruited under the NRHM scheme to a sub-
centre in a village because the government has decided …deliveries will not
be conducted in sub-centres…of course, except those (sub-centres) that are
located in CHCs and PHCs…and even in PHCs and CHCs, not all sub-
centres have two ANMs…so, you will not find them in villages…they (their
services) are being utilized only at some places.”
6.3.1.2 Transfer policy
A lack of proper transfer policies within the states was another frequently cited issue by the
respondents. They believed that partiality in the transfer of health workers in health
department can cause unequal distribution among health workers in the district. A number of
ANMs revealed that their colleagues, who had good networks and a strong rapport with
senior officers in the department, were transferred from difficult interior and riparian areas
east of the district, where transportation and communication facilities are limited, to their
140
favourite higher-level health facilities. As a result, many health sub-centres (HSCs) in the
eastern part of the district have been functioning without an ANM.
A medical officer who was posted in a PHC located in the interior PHC for many years now
did seem to be comfortable talking about the lack of transparency in the transfer process. He
revealed that transfer procedures and policies do exist, but that they are not properly enacted
and followed. Expounding on how influential health workers usefully get transferred to their
favourite places by bribing higher-level officials, he says:
“money is everything …the principle nowadays is… pay a ‘service charge
(bribe)’, I will help you go wherever you want to…but if you don’t want to give (a
bribe), then be sure, you are going to languish in this remotest corner of the
district where there is no light, no water and ...if you die, no knows you have
died.” (PHC Samodideeh)
The above statement reflects the sorry state of affairs in the health department in UP,
where politically influential health workers get transferred to their favourite hospitals by
paying a bribe to health department officials who are in charge of these matters.
Although the CMO revealed that a large number of transfer requests are usually made to
ensure that a worker is posted in facilities located along the main arterial roads (national
and state highways) in the district, he emphasised that not all requests are entertained.
Although the issue was investigated further, he refused to say anything on the role of
money and politics in the transfer process; however, the ANMs were quite open about
it. One ANM, who was posted in a riparian village in the northeastern part of the district
and the villages she covers (which is many kilometres away in the sandy flood plain),
communicated her dismay about the unfair transfer process. She expressed her grief,
saying:
…I have been working here in this sandy plain for all my life now…(my)
home is 20 kilometres from here…I come here every day…but you see this
area is so difficult…sand and sand is all you see for kilometres…in summers
when it is very hot, it is very difficult for me who is in (her) 50s to walk from
one village to another…I requested CMO Sahib many times to transfer me
to somewhere…I have served enough in this place but…many CMOs have
come and gone since, no one listens to me…the thing is I can’t give money
...those who can have been transferred to wherever they wanted to. (HSC
Sumali)

141
Other ANMs also felt that both processes – getting to a desirable post and being
stationed at a desirable post for a long time – required political clout and money. In
brief, it can be said that due to a lack of specific transfer guidelines, while some health
workers were able to escape difficult postings, other were not. Those who had political
clout were probably able to stay at desirable posts for durations longer than specified,
while health workers without political influence were stuck in remote areas for long
periods of time, as they were unnoticed and not considered for promotions.
6.3.1.3 Attachment policy
A health worker can be posted at a different place for some time, as needed, during his
service term. This is known as “attachment”. For instance, if a health facility/hospital needs
more health workers during a particular time, the health workers from other health facilities
or hospitals can be posted to that particular hospital to ease the burden. In principle, it is not
possible to get attachments until a particular PHC or CHC is in dire need of more health
workers to ease this burden. However, in reality, most of the attachments are unnecessary,
except during monsoon season when human resource-deficient areas (characterised by annual
floods) need more health workers to contain diseases.
Many respondents were of the opinion that, apart from unfair transfers, “attachment” to a
health facility was also one of the reasons for this unequal distribution. As expressed by the
respondents, the reason for this was that these ‘attachments’ to a health facility often served
as a way out to get closer to the workers’ homes. It emerged during the interviews that
attachments are often ‘permanent’ and not temporary. In other words, a considerable number
of attachment workers have no intention to ‘move’ from the health facility they became
attached to; however, they draw their salaries from their previous facility. As a result, health
worker availability at certain health facilities is higher than others. One example of such a
facility was a PHC in the southwestern part of the district, which is not far away from the
state capital. I dug a little deeper when discussing the issue of excess health workers at this
facility. The medical officer said:
This is a place everyone wants to come…first of all, it is not far from Lucknow,
the roads are good, the people are good, the CHC to which this PHC is attached
is good…everything about my PHCs is good…as for madam (lady doctor) …she
has been attached here because …workload on this PHC is high…plus she had
some family problem I guess…she wanted to be closer to home (Lucknow). (PHC
Ghazipur)
142
Since it is illegal to sanction attachments when there is no need, it seemed that the need was
artificially created, and it involved money/a bribe to the officials involved. One who wants to
be attached to another facility of his/her choice has to pay the bribe, also known as ‘Suvidha
Shulk’ in local Hindi, to the officials. A superintendent articulated his point of view about a
recent attachment of an ANM from his area (the northeastern part of the district, which is
socioeconomically impoverished and features annual floods, which makes life difficult in the
area) to a place closer to the district headquarters:
She is going to Persendi (CHC), which is very close to Sitapur, just about 15
kilometres…she must have given 20–40 thousand rupees for this purpose… must
be around 20,000 rupees. She was here for many years now. She might have
thought that if she gets transferred to that area, it will be nearer to her home.
(PHC Tambaur)
The above statement reveals how health workers get posted to places where they may not be
required. This creates a problem of irrational health worker deployment. Such deployments
make the overall distributional inequality look even bigger. While there are many CHCs
where specialists post a vacancy, specialists are still deployed in those PHCs where their
skills are underutilized because they do not have the necessary equipment and support staff to
treat their patients. Similarly, while some HSCs, especially in riparian villages on the eastern
border of the district, have not had an ANM for many years now, the CHCs in the western
part of the district, which is economically vibrant, have two or more ANMs looking after the
only sub-centre located within the CHC campus. This practice is not limited to only health
workers; it extends to support workers, such as ward boys and sweepers, as well.
A look at the availability statistics reveals that the PHCs in both Sirkida and Samodideeh did
not have any ward boys in service. The post has remained vacant for many years now. The
medical officer of the Tamabaur CHC, under which the Sirkida PHC works, informed me
how earlier, there was one ward boy in Sirkida, but he was attached to the CMO office later
on. He revealed how convenient this arrangement was for both the CMO and the ward boy. In
his words:
It is not a developed area…its far away Sitapur (the district headquarters and
the only city). There is a post sanctioned, but nobody is posted. Nobody wants to
come here. Actually, the number of ward boys is very small. These are the
workers who work at a basic level and they are very few in number…there was
a ward boy here… but he got himself attached to the CMO officer now…it is
good for both of them…the CMO has an additional worker to help him with

143
little tasks and the worker is happy because he is closer to his home. (PHC
Samodideeh)
Another important factor emerged from the analysis, which is that medical officers believed
that the difficulty in being granted a formal leave was one of the reasons why many
specialists and doctors either got transferred to health facilities with higher numbers of health
workers, or they left the health system forever, particularly in cases where they did not have
any political networks within the health system. The ability to take a leave of absence in rural
facilities was restricted because there were not enough workers or substitutes in low-resource
health facilities. Moreover, applications for leave are often processed after many weeks.
Health workers often have to pay bribes to those clerks and authorities who sanction leaves in
the event that an emergency leave application is needed.
The perceptions of the work burden in rural areas were found to be important in determining
the preference for working at a given health facility. Since there are very few specialist
doctors available in the system, the available specialists were often overburdened and
working during their off hours. This is especially true for those who stayed within the
premises of the CHC and were thus ‘available’ around the clock. Their duties are often
extended beyond the normal working periods of eight hours. Compared to the meagre salary
that specialists receive for providing services in the CHCs, those working in the private sector
earn more by working for shorter periods of time. Therefore, it is not surprising that
specialists and other doctors flee health facilities with low numbers of health workers, and
they also move to health facilities where health worker availability is high. CHC Tambaur is
an example of such a CHC where there was only one paediatrician who was doubling as the
superintendent of the CHC. This paediatrician aptly discusses the problem of the overburden
of health workers, and how it relates to health worker distribution in the district:
There are so many nursing homes there. They pay hefty amounts to
doctors…sometimes 2 to 3 lakh rupees per month for just 8 hours’ duty. Here
in the government sector, the duty hours are 24 hours. The duty period is very
long. It should be fixed. For example, here I am, a superintendent…being both
a doctor and superintendent, how many hours should I work? Will I do it
24×7? No! There must be a limit.
The eight hours’ duty is not fixed. Now you have to perform your duty 24
hours a day. You can be called anytime. In the private sector, nobody is going
to call you after 2 o’clock. Do your 8 am to 2 pm duty and after 2 pm,
wherever you go, nobody will track you. Here (at the CHC), for example, you

144
go home after your 8 am to 2 pm duty…and someone comes with news that an
accident has taken place somewhere; they will ask you to come back and see
the patient. Then, the whole night passes and then the day passes, no one cares
about your comfort. Even you would not get a day off next day. (CHC
Tamabur)
6.3.2 Contextual factors
A number of factors related to facility amenities, living conditions, the local environment,
and community behaviour emerged as important factors that shaped the decision of health
workers to leave a facility. Among the main themes under this heading are living facilities,
proximity to one’s family, children’s education, safety and security, accessibility, and
transportation.
All respondents, except for two who belonged to the CHC Sidhauli and PHC Ghazipur,
lamented the poor living conditions in their facility, and they explained how living conditions
affect a health worker’s decision to look for facilities with better living arrangements. The
data analysis revealed that health workers often travel to their health facility to work each and
every day, rather than staying in the health facility, as they do not have the basic amenities
such as electricity, a water supply, and proper functioning toilets. Medical officers and ANMs
revealed that the housing provided at the PHCs and sub-centres is of low quality and lacked
maintenance. For instance, one medical officer commented:
There is no electricity in my room. I arrange my own bed. Though there is a
bathroom. There is no water in it, so I have to go out in the morning and take
a bath in the open. Now who is going to do that among those in high class, I
mean doctors. There are toilets there, but you need to bring water from
outside. You need to get a bucket for that … Do you think anybody among the
specialists would like to stay there? This is the reason why people don’t stay
here. Even in the doctor’s residence, he has got his private hand pump there.
He also takes water from there and carries it to the toilets. (CHC Tambaur)
Similar views were presented in the interviews with the ANMs as well. Most ANMs were not
satisfied with the design of the sub-centres, especially given the small residence sizes. Many
HSCs still do not have a government building. Moreover, those that are functioning in a
building have serious design flaws, which is one reason why ANMs do not want to live in
sub-centre buildings. One ANM aptly summarizes the problem in a few sentences:
145
Rooms are so small that you family cannot fit in here …everything is
small…toilet, kitchen, living room…whoever built it must have no common
sense…I am not the only person who is going to stay …most ANMs have families.
I don’t know what they think while designing the sub-centres…these centres are
not liveable…I live here because I have to…most of the ANMs don’t stay in these
teeny-tiny buildings…they have not provided even stairs to walk up to the
terrace…now tell me …if a person wants to sleep on the terrace when it is too hot
in the summer...how will he walk upstairs...we use a bamboo ladder but that is
simply inconvenient and dangerous…there is no loft in the rooms to store stuff.
(HSC Ramdana)
The above statement clearly indicates the kind of housing problems the ANMs and other
workers must face in the health centre residences. It can be deduced from the statement that
although it seems these residences may be good enough for a single health worker, they are
clearly not suitable for families. However, it is a fact that most health workers are married,
and they have families and their parents often live with them. The problem does not simply
end with the lack of residences and basic amenities – almost all rural health facilities in UP
face a severe electricity shortage. A regular supply of electricity was deemed necessary by
most respondents in the study, including the CMO. According to him, the reason why
doctors, especially specialists, do not want to stay in far-off CHCs and PHCs was the poor
electricity supply, as well as the lack of electricity generators and fuel. He said:
…yes, electricity is probably the most important issue…without electricity you
cannot run a CHC or PHC properly…your cold chain will not work, vaccines will
go bad, X-rays will not work…irregular supply hampers almost everything…every
CHC has at least one generator, but the funds for fuel are often meagre and so it
is not possible to provide electricity to health worker residences…generators are
used when ...say…you want an X-ray or you want to keep vaccines in the cold
chain…in PHCs, there are no generators. (CHC Tambaur)
It is a well-known fact that health workers do not stay in PHCs, except in those PHCs that
have been declared a delivery point; they remain open 24 hours a day. Most of these PHCs
are located in accessible places, particularly in the western half of the district. The CHCs that
were included in this study had no such PHCs. In those PHCs, no one stays the night.
Leading a comfortable life, even during the daytime, is not possible in summers when the
temperature soars up to 45 degrees. In these situations, leading an urban life (and electrical
appliances are an integral part of daily life in urban areas) – which medical doctors are
accustomed to – is nearly impossible. Moreover, not having electricity poses a serious
146
security threat to doctors, especially in rural areas. A lack of lighting in the night also makes
health facilities vulnerable to violence, thefts, and burglaries, and it forces health workers to
find a better health facility where there is a regular supply of electricity. The medical officer
at PHC Shahpur aptly articulates this issue in the following statement:
Although people come and stay here (Shahpur PHC), it is not possible to stay
there in Samodideeh (PHC)…. If one stays there in the night, he will get killed
for sure. In the daytime, it is okay to stay there, but they have no security. It is
impossible to stay there in the night and not get killed…there is no
electricity...and if you go there, you will find that the PHC is located about
200 meters out of the village…imagine yourself alone in a big
building…surrounded by sugarcane fields…in the dark…isn’t that scary…that
is a tarai ilaka (lowland area) …thieves and bullies abound in that area. (PHC
Shahpur)
From the above statement, it is clear that security was an important issue when shaping the
health workers’ decision to choose to work at particular facilities. The issue was raised not
only by doctors, but also by female health workers. They agreed that the location of a health
facility is an important determinant of a health worker’s decision to stay (or not) in a given
health facility. The medical officer at the CHC located in the eastern part of the district
expressed concerns about his CHC’s outer location. According to him, since the CHC was
located in the outskirts of town, and given that it only had a 4-foot-high boundary wall, it was
easy for outsiders, thieves, and burglars to break into the campus. The boundary wall of the
CHC, according to him, was breached several times in the past one year. There was also a
troop of monkeys that would create trouble for everybody. According to him, these were
important factors that served as reasons why no doctors with families stayed at this CHC for
more than two or three months.
“…everyone wants to stay safe while away from home…but here you are not
safe, this area is dangerous… it is very difficult for a family to survive
here...no one knows when angry people would break into your residence and
beat you up…it has happened before as well…you see that boundary wall, it is
not even four-feet high, even a kid can jump over it…and people do jump over
it…it has been breached …I think five or six times… in the last one year…
people come inside the campus with their cattle…if you say a word…tell them
off…do you know what would happen next…they will come in large group and
beat you up…you can only request them to move out….life is always at risk
here…that is why I never bring my family here… now you understand why
147
doctors come here for one or two months at most…and as soon as they get a
chance, they get themselves transferred (to a better place).” (CHC Tambaur)
The above statement highlights how the local people’s behaviour might force health workers
to flee a given health facility. Local people’s behaviour and attitudes towards health workers
were primarily cited by health workers working in CHC Tambaur. Doctors at the PHCs and
CHCs revealed that health workers are mostly considered outsiders in the communities they
serve. In the event that a patient dies, the doctors at the PHC and CHC often have to face
severe verbal abuse which, if resisted, often turns into violence and threats. This leads to
occupation burnout and ultimately forces the doctors to leave. Once a facility becomes
infamous for bad behaviour among the patients, new health workers avoid getting posted to
such facilities. The medical officer at CHC Tambaur expresses this in the following words:
“...in cases where the patient has died and you could not cure him…then you
should be ready to face people…they come with a local goon or some local
leader…and try to intimidate you and beat you up…it has happened to many of
my former colleagues who worked here…people in this area are not good…go to
any other place, you won’t find people fighting with a doctor or beating them
up…it is a strange place…when a patient has political links, the situation gets
even worse…” (CHC Tambaur)
Analysis of the ANM interview revealed that sometimes, ANMs and villagers do not have a
congenial relationship. The ANM, being an outsider, is often threatened and thus she has to
leave the place. Such an incident occurred in Matua HSC. The ANM is recalls an old
incident that she heard from the villagers:
Before me, there was Brahmin ANM posted here and she stayed with her family
in the HSC. The hand pump that you see today was being constructed. The sand
came out when drilling for the pipe. Some people from her own caste came and
tried to take sand without permission. When her daughter told them that they
can’t take the sand until her mother comes home, they slapped her. And then
there were a lot of legal proceedings.
So what I want to say is that whatever caste you are from, if you live with them
in harmony and keep saying yes to everything they say… then you are safe and
fine. But if you do otherwise, then the problem arises…was getting beaten
beneficial? Was it justified? No…ultimately she had to leave…she got
transferred to some other sub-centre. (HSC Matua)
A lack of good schools in rural areas was cited as one reason why specialists and doctors do
not want to join rural health facilities or move to better health facilities. During the

148
interviews, most respondents converged on the fact that the schooling quality in rural areas
was often very low. Teachers in rural schools were often not well-qualified. Schools did not
teach the English language which, nowadays, plays an important role in getting a good job
and pursuing a successful career. Some ANMs who currently stay at the district headquarters
cited their children’s education as an important reason why they got themselves transferred to
a nearby HSC. The CMO found that the quality of schooling was a crucial factor affecting
specialist doctors’ retention in rural CHCs. This is especially true for the CHCs located in the
eastern part of the district. It is a socioeconomically underdeveloped area and lacks good
schooling facilities.
As discussed above, residences in health facilities are devoid of basic amenities; therefore, it
is not surprising to know that an overwhelming proportion of the public health workforce
commutes to these rural health facilities. The ANMs included in the interview also revealed
that poor housing conditions at the sub-centres forced them to stay at their homes in urban
areas and they commuted to work almost daily. Commuting is often difficult in rural areas
because there is a lack of good public transport and the roads are often bumpy and full of
potholes. Many HSCs under CHC Tambaur were functioning without an ANM for many
years. An ANM who moved from one such interior sub-centre to a sub-centre near the district
headquarters aptly communicates her case in the following statement:
I was in Biswan block … because it was really far from my home, I tried to get
transferred somewhere nearby home… and I got this (health facility). I had to
carry the vaccine from the CHC to the sub-centre, even there in Biswan…so
once you go to the CHC to receive the vaccine box and then in the evening go
back again to Biswan to submit the vaccine box and then travel to home in
Sidhauli…it was a travel of about 30 to 35 kilometres each way. It was
horrible and wearisome…so, I got myself transferred here…now I am
relaxed…do my duty and reach home on time. (HSC Rampur Tedva)
The accessibility of a health facility turned out to be a major factor underlying why certain
health facilities in the district have more health workers when compared to other facilities.
The only health worker posted at Samodideeh PHC, a medical officer, accepted that the
accessibility of that particular PHC served as a major factor explaining why health workers
flee from the Samodideeh PHC. The PHC was almost 80 kilometres away from the district
headquarters. The road connecting it to the headquarters was not suitable for rapid transport.
Since it is located on the banks of the River Ghaghra, outbreaks of communicable diseases
such as malaria, diarrhoea, dengue, etc., during Monsoon season are very common. In such

149
situations, doctors are often burdened with an extra hour of duties. Therefore, it is not
surprising why the PHC in question had very few workers compared to the CHC Sidhauli’s
PHCs, where three medical officers were available.
Have you been to Samodideeh? In summers, it is not far away from here
because the river has very little water, but in Monsoons, we have to go via
Matua – Shahpur…almost 50 kilometres from here. Roads are very bad. It
takes at least 2 hours to reach there from Sitapur. The burden of work is too
much in Monsoon season, as there are many diseases. The doctor has to be
there on special duty, while in other PHCs, doctors enjoy their days...come at
8 am and leave at 2 pm…So any doctor who is posted there gets himself
transferred. (PHC Sirkida)
Other CHCs in the eastern part of the district, CHC Reusa and CHC Rampur Mathura, were
also poorly connected with the district headquarters. A look at the health worker availability
table reveals that these CHCs are among the ones with lower health availability in the district.
As mentioned above, there is no vacancy in the PHCs of the Sidhauli block. The town of
Sidhauli is located near National Highway 24 and it is well connected with the state capital,
Lucknow. PHC Ghazipur and PHC Ataria both have 8 staff members, while PHC Manwa has
3 doctors. One of these doctors is a female doctor, who has been attached there for the last six
months.
In the interview with the medical officer in charge of the Ghazipur PHC, it was revealed that
the female doctor became attached to his PHC because she wanted to stay close to her home
in Lucknow. Earlier, she was posted to CHC Pisawan, which was about 125 kilometres from
her home, while Ghazipur is not even 50 kilometres from Lucknow. Moreover, Ghazipur was
located along the national highway, while CHC Pisawan was located on a major district road
(it is bumpier than the national highway) about 20 kilometres off the same highway. The
above example shows how important transport and accessibility are in shaping health
workers’ decisions to choose between health facilities.
6.3.3 Individual factors
A number of individual factors emerged during the analysis. One of them was doctors’
preferences for working in rural health facilities. The analysis of interviews with a medical
officer revealed that specialists, including radiographers, often do not want to work in rural
areas because of smaller salaries. After they finish their studies, they prefer going into private
practice rather than joining the public health system. The salary differentials between the

150
public and private sectors are huge. Medical officers strongly believed that salary was the
primary reason driving specialist doctors to leave the CHCs and establish their own hospital
or nursing home, which would fetch much more money than they would receive as a salary
for providing services in public health facilities. A superintendent aptly discusses this
dilemma:
…nobody wants to work for a meagre salary. The salary is not that great.
Even a newly trained specialist earns more than an experienced specialist in
the system. Why do you think a surgeon is going to work with the government?
If he opens a nursing home, there are many patients out there. He does not
have to do any investment and he does not have to give enough time. He can
work as per his own will and carry out a surgery or two and come back home
to spend time with family. He would certainly earn a minimum of two lakh
rupees per month. He earns this much when he does not even work hard
enough. (CHC Sidhauli)
The above statement shows that the private sector provides a much higher salary than the
public sector, and it also features a smaller work burden, better working hours, and peace of
mind. Many specialists leave the public health facilities and open their own hospitals and
clinics. One such incident happened in CHC Tambaur, where the specialist did not even
inform the health department about choosing to leave the health facility. The medical officer
at CHC Tamabur recollected the incident:
…specialists generally open their own clinics and nursing homes. He also
opened his nursing home. He later left the service. He was given many
reminders. However, he did not join again. (CHC Tambaur)
In the interviews with medical officers, it came to the fore that health workers do not have a
sense of fulfilment due to a number of factors; this is why they leave the system and never
return to it. They also revealed that sometimes, health workers quit their jobs because they do
not like the excessive politics in the health system.
6.4 Discussion
This chapter examined the factors affecting health worker availability at rural public health
facilities using both quantitative and qualitative tools. A number of factors that appeared to
be statistically significant in the quantitative analysis were found to be important in shaping
health worker availability in the qualitative analysis as well. Apart from that, the qualitative
151
study revealed many factors that were not possible to examine in the quantitative study, as
this information was unavailable in the dataset.
The findings reported in this chapter portray a large number of factors that affect and shape
the different levels of health worker availability at publicly funded health facilities in rural
India. This multiplicity suggests that policies to address this differential health worker
availability should also be multipronged. Broad scrutiny of these factors indicates that the
proximity to one’s home town, a school for his/her children’s education, safety and security
concerns, a lack of connectivity, a lack of entertainment facilities, transfers, no recruitment,
the unavailability of specialists, a lack of basic amenities in health facilities, relationships
with the community, and poor remuneration are the critical factors that shaped the existing
pattern of health worker availability in rural health facilities. Many of the factors elucidated
in this study are not new and confirm the findings obtained from other international studies,
as discussed earlier in the literature review (Chapter 3). These factors, however, had not been
studied in India, especially with regard to rural health facilities.
The results presented in this chapter revealed that the current distribution of health workers
across health facilities is a result of a multitude of factors, ranging from the state’s
recruitment and deployment policies to the health workers’ personal choices, which are also
affected by several factors such as working environment, amenities, quality of residence, time
to travel, and so on. The most prominent primary reason underlying the existing skewed
pattern of health worker availability across public health facilities turned out to be irregular
recruitment. There could be several reasons why the state government in Uttar Pradesh has
not been able to fill vacant positions in its public health facilities in rural areas. With respect
to specialists, whose shortage is very high, the reason why the government is unable to recruit
specialists is that there are simply not enough specialists graduating every year. For instance,
the medical colleges (including private ones) have only 93 and 74 postgraduate seats in
obstetrics/gynaecology and paediatrics courses overall (Medical Council of India 2015). Even
if one assumes that all obstetricians would join CHCs after completing their courses – which,
given the current policies, is obviously not going happen – it would still take six to seven
years to fill all vacant positions for obstetricians at the CHCs in UP. This is true for ANMs
and LHVs as well, whose training centres have been shut since 1992 (Nandan et al. 2015).
Another reason why vacant positions for doctors, especially specialists, cannot be filled could
be that recruitment drives by the state government have failed miserably in the past, simply
because there are not enough candidates applying for the Provincial Medical Services (PMS),
152
which is where specialists/doctors are recruited for the service (Bajpai et al. 2008). For
medical officer posts, although a lot of candidates apply and get selected, very few appear in
interviews, leaving many posts vacant (Raha et al. 2009). Since the state does not have a
provision of waiting lists for regular appointments, there is no way to fill the posts that are
left vacant by those who do not prefer to join the services. Instead, a new recruitment process
is initiated that takes nearly a year to complete.
Transfer and deployment policies were cited as the major factors behind the unequal
distribution of health workers across health facilities. It was found that the current system of
transfer and attachment was opaque and highly political, with no clear guidelines for time of
service in rural area. Several studies have found similar results across the various states
(Iyengar & Dholakia 2015). The current transfer system within the public sector is state
specific, and guidelines (if they exist) vary considerably. However, in the case of UP,
transfers and deployment policies do exist, but they are seldom followed. A study found that
with respect to the transfer policy, ‘there is a lot of political influence’, which corroborates
the findings of the present study (Nandan et al. 2015). It has been argued that the transfer
policy of UP does not guarantee health workers that they will be rotated between posts that
are characterised by hardship and those that are not.
The availability of health workers was found to be affected by poor road connectivity and an
unreliable public transportation system. Most rural areas in the state have a poor road
connectivity and the public transport is almost non-existent (Sinha 2016). In such a situation,
the use of private vehicles becomes necessary. Since the state government provides no
transport or rural allowance (Chaudhuri et al. 2013) for travelling to CHCs located in rural
and far-off areas, it is not difficult to understand why rural CHCs have fewer specialists
compared to their urban counterparts, which are well connected to the district headquarters or
to major cities through major district roads (MDR) and state highways (SH). It was noted
during the fieldwork that those health facilities that are not connected by a metalled road have
fewer numbers of health workers when compared to those health facilities that are located
close to the national highway. The results of this study are similar to those of several previous
studies (E Araújo & Maeda 2013; Asante & Zwi 2009; Kruk et al. 2010; Lehmann et al.
2008b).
The unavailability of quality schooling for children in rural areas is another issue that is often
quoted as a reason why professionals either do not join or choose to leave a given rural health
service (Kadam et al. 2012; Ageyi-Baffour et al. 2013). Like anywhere else in the developing
153
world, rural schools in the state of UP have a multitude of problems in terms of the quality of
their teachers, infrastructure, the overall learning environment, and outcomes. English is
rapidly becoming an essential language that can help secure a good future. Hence, it is not
surprising that the respondents in the study emphasized the lack of an English-medium school
as a push factor. The results of this study are in line with the results of a recent study, which
concluded that health workers are generally willing to take up rural stints before their
children begin formal schooling, not afterwards (Ramani et al., 2013).
The desire of health workers to live with their family has also been noted as a reason for the
lack of health workers in certain health facilities, which were difficult to reach, as they were
located in far-off rural areas. The results of this study can be corroborated by a recent study
conducted in four North Indian states, which found that a considerable proportion of
specialists are willing to leave rural CHCs to be able to live with their families in towns,
cities, or district headquarters (Iyengar & Dholakia 2015). Social and family ties are
considered to be of utmost importance in a cultural setting like India. Health workers in such
settings prefer to work in health facilities that allow them to stay close to and connected with
their families and relatives. A study on medical students’ preferences found that these
students do not prefer to live separately from their families on a long-term basis (Rao et al.
2010).
The results of the quantitative study reveal that those health facilities where residences are
available for specialists are expected to have a higher number of health workers than those
health facilities where residences for health workers are not available. This finding was
corroborated by the results of the qualitative analysis as well. However, the qualitative
analysis also found that the quality of the health facility residence was an important factor
that determined health worker availability at a particular health facility. This study reveals
that health workers prefer to stay in those facilities where the residences are equipped with
basic amenities. The results are in line with several previous studies conducted in developing
countries (Kruk et al. 2009; Ramani et al. 2010; Ramani et al. 2013). Housing quality has
been highlighted by many studies as one of the most important considerations by health
workers when choosing a rural health facility (Kotzee & Couper 2006; Kruk et al. 2010). A
study by Ramani and others also found that doctors demand that their quarters be within the
premises, and that the health centre be at or near their residence, featuring around-the-clock
water and electricity supply, as well as the provision of proper toilets (Ramani et al. 2010). A
study in Africa found that doctors perceive good housing conditions to be of utmost

154
importance while making a decision about joining the rural health service (Kotzee & Couper
2006). Similarly, several respondents from a study conducted in Malawi reported that poor
housing conditions at the hospital served as one of the main reasons why they were
demotivated in their profession and ultimately chose to leave their jobs (Chimwaza et al.
2014). The same was found to be true regarding doctors from Ghana, who reported that they
were willing to take rural posts, but the lack of work-based accommodation and delayed
renovations forced them to give up considering a rural post; they then chose to settle in a city
(Snow et al. 2011).
Similar to the findings of many previous studies that have shown that the availability of basic
amenities such as water and electricity is deemed necessary by health workers, the results of
the quantitative component of the study also show that the lack of an electricity connection is
associated with a decrease in health worker availability. This finding was corroborated by the
findings of the qualitative analysis as well (Ojakaa et al. 2014; Ageyi-Baffour et al. 2013).
The supply of electricity in the state is highly irregular and the rural areas receive electricity
for only six hours a day on an average (Modi 2005). When there is no electricity, leading an
urban life (electrical appliances are an integral part of daily life in urban areas) – which
specialist doctors are accustomed to – is nearly impossible. Moreover, not having electricity
poses a serious security threat to doctors, especially in rural areas. A lack of lighting in the
night makes CHCs vulnerable to violence, thefts, and burglaries. This has been highlighted in
the qualitative findings of the present study. The results of this investigation confirm the
results of previous studies conducted in developed and developing countries (Newman et al.
2011; Opie et al. 2010; Boyle et al. 2007; Ramani et al. 2010). Since it was noted in the
quantitative analysis that a considerable proportion of health facilities still do not have a
residence, tap water, and an electricity connection, the government should invest more
resources to build residences and provide basic amenities in health facilities.
Safety has also been recorded as a major concern among health workers in rural health
facilities. This observation corroborates evidence from other countries’ contexts, where it has
been found that health workers in remote and rural areas often face security- and safety-
related challenges due to a lack of knowledge about the community. Misunderstandings and
miscommunication often lead to workplace violence. The analysis of medical officer
interviews in the present study finds that similar workplace violence, which is committed by
patients, is also often due to misunderstandings and miscommunication. The findings are
similar to those of some previous studies (Opie et al. 2010). In addition, the study also finds

155
that security threats arise based on the location of a given health facility. Often, PHCs and
HSCs are constructed far from settlement areas, and they are often surrounded by agricultural
fields. Moreover, a lack of electricity makes it impossible to have lighting after sunset. The
boundary walls at these health facilities are also frequently 4 to 5 feet high. Thus, safety and
security is a big concern for health workers, as the campus is insecure and vulnerable to
violence, thefts, burglaries, and so on.
Various studies have shown that salary/remuneration is an important determinant of
employment choice (Barr et al. 2005; Ubach et al. 2003). The results of the qualitative
component suggest that smaller salaries, when compared to those received by private sector
doctors, is one important issue why doctors do not join the services, even if those who join do
join facilities in better off, easily accessible areas. Some studies in India have also noted that
salary is an important factor in this regard (Rao et al. 2010; Sheikh et al. 2016). It is
interesting to note that in the state of UP, the difference in salary between the initial urban
and rural postings for a recent graduate in the public health facilities in the state is just Rs.100
(Rao et al. 2010). Such a miniscule difference is probably one of the reasons why doctors do
not want to join rural PHCs and CHCs.
6.5 Conclusions
The findings of this chapter revealed a complex interplay of factors that influence health
worker availability in rural public health facilities, using both qualitative and quantitative
data. This multiplicity suggests that a policy to address this differential availability in the
rural health workforce should be comprehensive and multipronged. The public health systems
in almost all Indian states face particular challenges when maintaining a balanced distribution
of health workers and minimizing their overall shortage. The challenge of maintaining an
adequate health workforce at all levels of the public health system in rural areas requires
sustained effort in workforce planning, development, and financing.
To address this issue, the first aim should be to fill up existing positions, as it is the first
necessary condition that must be met to ensure the equal distribution of health workers.
Although the Central and State Governments are pursuing a number of measures to scale up
the production of health workers in the country (as evidenced in the previous chapter),
success has been more elusive in some states. While the State governments have been
devising strategies to encourage and motivate health workers to stay and work in rural, hard-
to-reach, and disadvantaged areas, as recommended by the World Health Organization
156
guidelines, the results of the present study show that there is little, if any, impact on inter-
facility inequalities, as they have increased in the sub-centres and CHCs. This suggests that
the current strategies need to be reworked and implemented.
The findings of this study ultimately suggest that the provision of basic amenities, decent
housing, a regular supply of electricity, transparent transfer policies, deployment and
attachment policies, the removal of political interference in transfers and deployments, the
provision of transport allowances, the provision of salaries that are on a par with the private
sector, improved working conditions, the provision of proper remuneration for out-of-hour
work, the provision of proper schooling for health workers’ children, and easier processes for
being granted leave could enhance overall health worker availability in those health facilities
located in rural and remote areas.

157
7 Chapter 7 Results: Effect of Health Worker Availability on
Health Services Utilization
7.1 Introduction
The present chapter provides the results of the analysis conducted in order to accomplish the
third objective of this study, which aimed to examine the effect of health worker availability
on the utilization of health services. Specifically, the chapter first presents the results of the
negative binomial regression analysis that was carried to examine the effect of aggregate
availability (the total number) of doctors, nurses, and allied health workers on service
utilization at health sub-centres (HSCs), primary health centres (PHCs), and community
health centres (CHCs). Further in the chapter, the results of the propensity score matching
analysis are given; this analysis was conducted to measure the net impact of a 2nd ANM and
an AYUSH doctor on healthcare utilization at the HSCs and PHCs, respectively. As far as the
regression analysis for the HSC level is concerned, three indicators of maternal healthcare
(antenatal care, delivery care, and postnatal care) were considered. At the PHC and CHC
levels, the total number of patients treated was included as a dependent variable. The analyses
in this chapter used the DLHS-3 dataset. In the end, the results are discussed in light of the
relevant literature.
7.2 Results: Effect of health worker availability on health service utilization
7.2.1 Health sub-centres
For HSCs, the analytical sample did not include any missing or ‘don’t know’ responses. Also,
HSCs with missing values, zero, and ‘don’t know’ responses were not included in the
analytical sample. As a result, the analytical sample was reduced to 17,537 HSCs for
antenatal care regression and 17,112 HSCs for postnatal care regression. The dependent
variables are as follows: a) the number of antenatal care registrations performed at the sub-
centres in the last month preceding the survey; and b) the number of postnatal care services
provided at the sub-centres in the last month preceding the survey.
The first step in model development was to choose the independent variables. The basis for
choosing the independent variables has been outlined in the Methods section. The
independent variables used in this study have been grouped under six previously described
categories: health personnel, drug availability, equipment, infrastructure, facility quality, and

158
socioeconomic and demographic characteristics of the population. For detailed descriptions
of these variables, see Chapter 4, sections 4.4.3.1 and 4.4.3.2.
As mentioned in section 4.5.2 of Chapter 4, the negative binomial regression models in this
study were built using an incremental approach. First, a null model was run. Then, blocks of
variables starting from human resources (doctors, nurses, and allied health workers) were
included in the model one by one. If any of the variables turned out to be insignificant and
did not contribute to the model, as indicated by BIC, they were not included in further
analyses. However, if the variable improved the BIC even by 2–3 points, it was kept in the
model. The log of the catchment population of the PHC was used as an offset variable.
Final models were checked to establish whether a negative binomial model was a better
option than Poisson regression. For this, a likelihood ratio test was conducted, the results of
which showed that an alpha for the over the dispersion parameter was greater than zero,
indicating that negative binomial distribution modelled the data more accurately than Poisson
distribution. The LR chi-square statistic is given at the end of the results in each table (see
Tables 7.1 and 7.2). The presence of multicollinearity was also assessed by calculating the
variance inflation factor. The overall VIFs of the HSC-level models were considerably small,
indicating an insignificant presence of multicollinearity, which means that the results of the
present model are not affected by the presence of multicollinearity. See Appendix Table 7A.5
and 7A.6.
The mean number of antenatal care registrations and postnatal care provided was about 15
and 7, respectively. The distribution of both dependent variables appears to be highly skewed
(see Figures 7.1 and 7.2), as there was considerable variance. The variance for antenatal care
registrations and postnatal care was 364.5 and 56.4, respectively, both of which were clearly
higher than their respective means. The maximum and minimum number of registrations at
the sub-centres was 429 and 0, respectively. Similarly, the maximum and minimum number
of postnatal care provided was 95 and 0, respectively.
The descriptive statistics for the independent variables are given in Tables 7A.1 and 7A.2.
Tables 7.2 and 7.3 report the results from the negative binomial regression models for
antenatal registrations and postnatal services, respectively. The results are reported in the
form of unadjusted and adjusted incidence rate ratios (IRRs), along with their 95%
confidence intervals (CIs). An IRR greater than 1 implies that an increase in the dependent
variable is associated with an increase in the outcome variable, and vice versa.
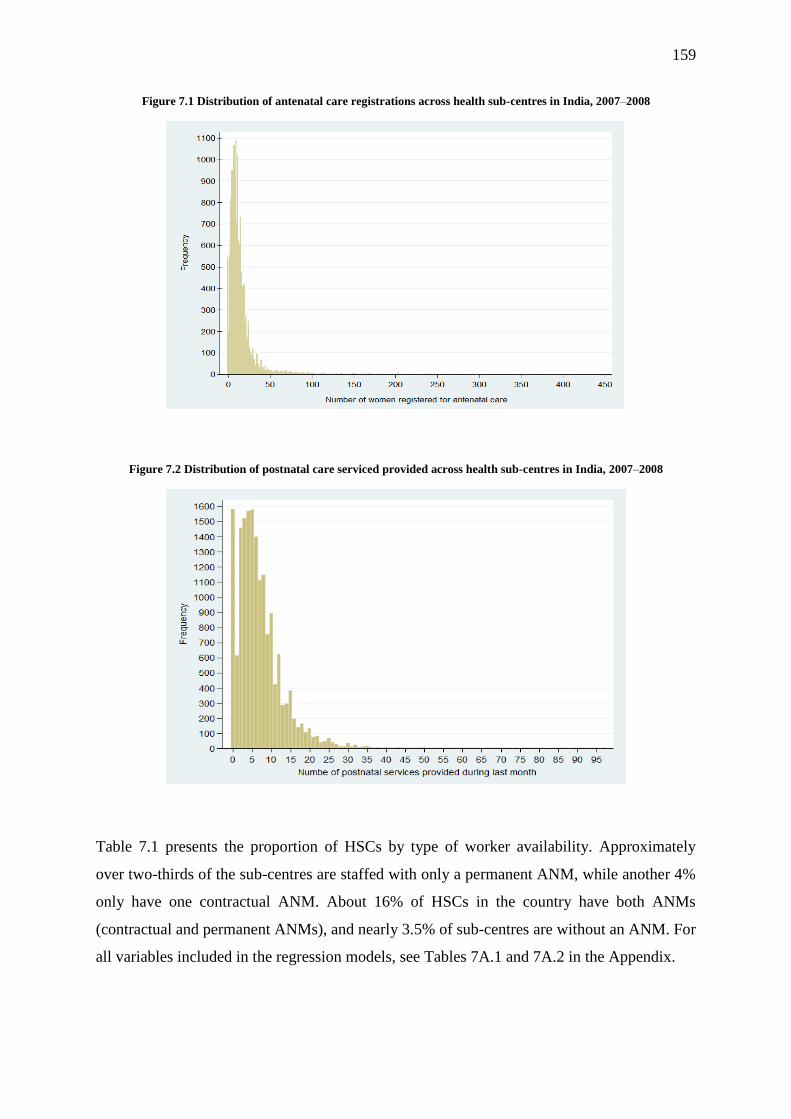
159
Figure 7.1 Distribution of antenatal care registrations across health sub-centres in India, 2007–2008
Figure 7.2 Distribution of postnatal care serviced provided across health sub-centres in India, 2007–2008
Table 7.1 presents the proportion of HSCs by type of worker availability. Approximately
over two-thirds of the sub-centres are staffed with only a permanent ANM, while another 4%
only have one contractual ANM. About 16% of HSCs in the country have both ANMs
(contractual and permanent ANMs), and nearly 3.5% of sub-centres are without an ANM. For
all variables included in the regression models, see Tables 7A.1 and 7A.2 in the Appendix.
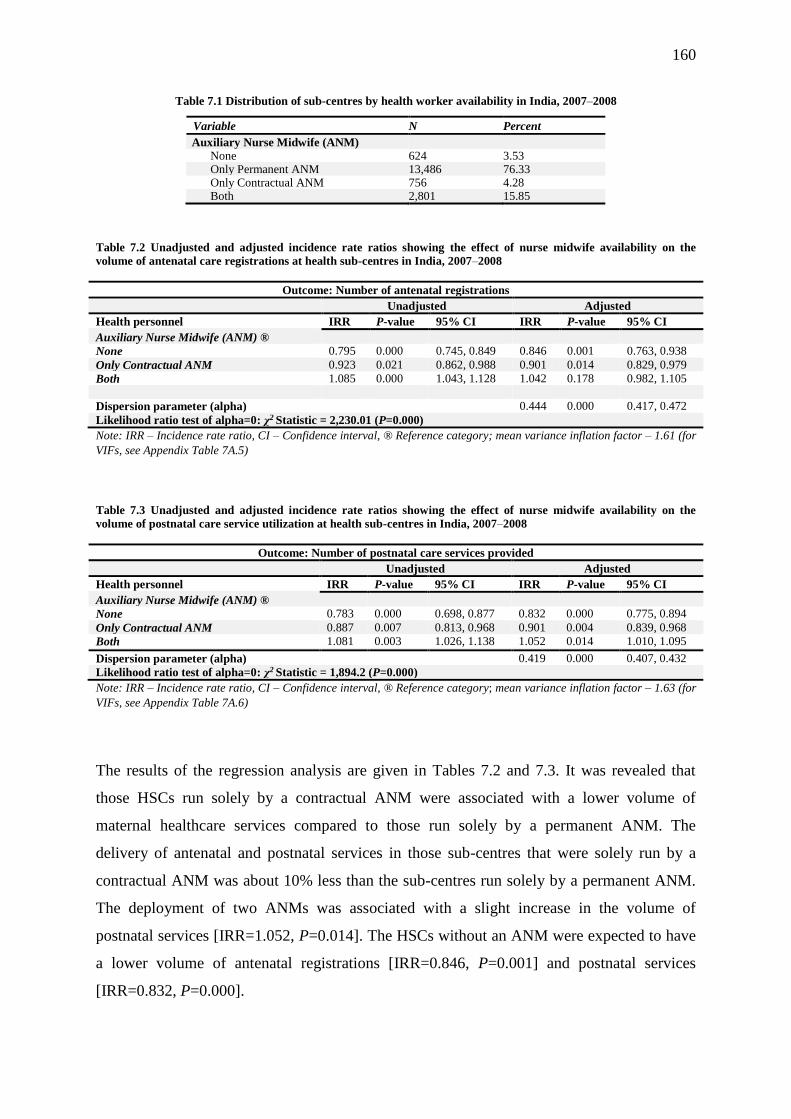
160
Table 7.1 Distribution of sub-centres by health worker availability in India, 2007–2008
Variable N Percent
Auxiliary Nurse Midwife (ANM)
None 624 3.53 Only Permanent ANM 13,486 76.33 Only Contractual ANM 756 4.28 Both 2,801 15.85
Table 7.2 Unadjusted and adjusted incidence rate ratios showing the effect of nurse midwife availability on the
volume of antenatal care registrations at health sub-centres in India, 2007–2008
Outcome: Number of antenatal registrations
Unadjusted Adjusted
Health personnel IRR P-value 95% CI IRR P-value 95% CI
Auxiliary Nurse Midwife (ANM) ®
None 0.795 0.000 0.745, 0.849 0.846 0.001 0.763, 0.938
Only Contractual ANM 0.923 0.021 0.862, 0.988 0.901 0.014 0.829, 0.979
Both 1.085 0.000 1.043, 1.128 1.042 0.178 0.982, 1.105
Dispersion parameter (alpha) 0.444 0.000 0.417, 0.472
Likelihood ratio test of alpha=0: χ2 Statistic = 2,230.01 (P=0.000)
Note: IRR – Incidence rate ratio, CI – Confidence interval, ® Reference category; mean variance inflation factor – 1.61 (for
VIFs, see Appendix Table 7A.5)
Table 7.3 Unadjusted and adjusted incidence rate ratios showing the effect of nurse midwife availability on the
volume of postnatal care service utilization at health sub-centres in India, 2007–2008
Outcome: Number of postnatal care services provided
Unadjusted Adjusted
Health personnel IRR P-value 95% CI IRR P-value 95% CI
Auxiliary Nurse Midwife (ANM) ®
None 0.783 0.000 0.698, 0.877 0.832 0.000 0.775, 0.894
Only Contractual ANM 0.887 0.007 0.813, 0.968 0.901 0.004 0.839, 0.968
Both 1.081 0.003 1.026, 1.138 1.052 0.014 1.010, 1.095
Dispersion parameter (alpha) 0.419 0.000 0.407, 0.432
Likelihood ratio test of alpha=0: χ2 Statistic = 1,894.2 (P=0.000)
Note: IRR – Incidence rate ratio, CI – Confidence interval, ® Reference category; mean variance inflation factor – 1.63 (for
VIFs, see Appendix Table 7A.6)
The results of the regression analysis are given in Tables 7.2 and 7.3. It was revealed that
those HSCs run solely by a contractual ANM were associated with a lower volume of
maternal healthcare services compared to those run solely by a permanent ANM. The
delivery of antenatal and postnatal services in those sub-centres that were solely run by a
contractual ANM was about 10% less than the sub-centres run solely by a permanent ANM.
The deployment of two ANMs was associated with a slight increase in the volume of
postnatal services [IRR=1.052, P=0.014]. The HSCs without an ANM were expected to have
a lower volume of antenatal registrations [IRR=0.846, P=0.001] and postnatal services
[IRR=0.832, P=0.000].
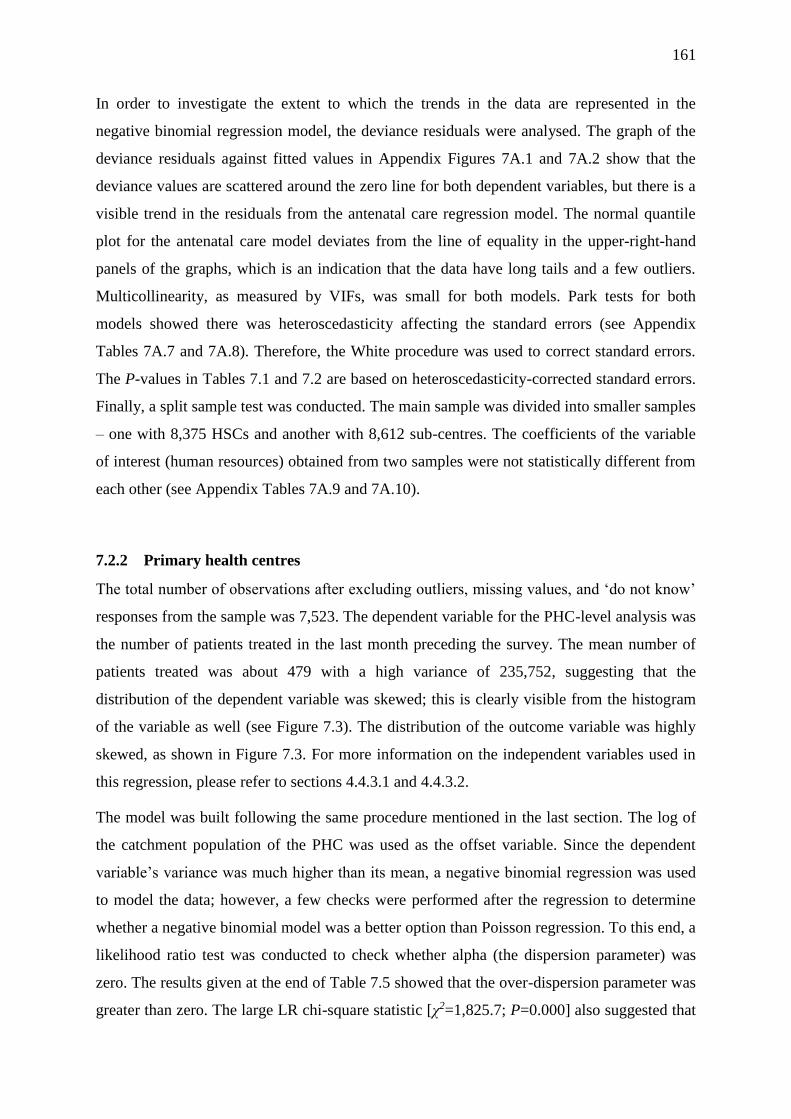
161
In order to investigate the extent to which the trends in the data are represented in the
negative binomial regression model, the deviance residuals were analysed. The graph of the
deviance residuals against fitted values in Appendix Figures 7A.1 and 7A.2 show that the
deviance values are scattered around the zero line for both dependent variables, but there is a
visible trend in the residuals from the antenatal care regression model. The normal quantile
plot for the antenatal care model deviates from the line of equality in the upper-right-hand
panels of the graphs, which is an indication that the data have long tails and a few outliers.
Multicollinearity, as measured by VIFs, was small for both models. Park tests for both
models showed there was heteroscedasticity affecting the standard errors (see Appendix
Tables 7A.7 and 7A.8). Therefore, the White procedure was used to correct standard errors.
The P-values in Tables 7.1 and 7.2 are based on heteroscedasticity-corrected standard errors.
Finally, a split sample test was conducted. The main sample was divided into smaller samples
– one with 8,375 HSCs and another with 8,612 sub-centres. The coefficients of the variable
of interest (human resources) obtained from two samples were not statistically different from
each other (see Appendix Tables 7A.9 and 7A.10).
7.2.2 Primary health centres
The total number of observations after excluding outliers, missing values, and ‘do not know’
responses from the sample was 7,523. The dependent variable for the PHC-level analysis was
the number of patients treated in the last month preceding the survey. The mean number of
patients treated was about 479 with a high variance of 235,752, suggesting that the
distribution of the dependent variable was skewed; this is clearly visible from the histogram
of the variable as well (see Figure 7.3). The distribution of the outcome variable was highly
skewed, as shown in Figure 7.3. For more information on the independent variables used in
this regression, please refer to sections 4.4.3.1 and 4.4.3.2.
The model was built following the same procedure mentioned in the last section. The log of
the catchment population of the PHC was used as the offset variable. Since the dependent
variable’s variance was much higher than its mean, a negative binomial regression was used
to model the data; however, a few checks were performed after the regression to determine
whether a negative binomial model was a better option than Poisson regression. To this end, a
likelihood ratio test was conducted to check whether alpha (the dispersion parameter) was
zero. The results given at the end of Table 7.5 showed that the over-dispersion parameter was
greater than zero. The large LR chi-square statistic [χ2=1,825.7; P=0.000] also suggested that
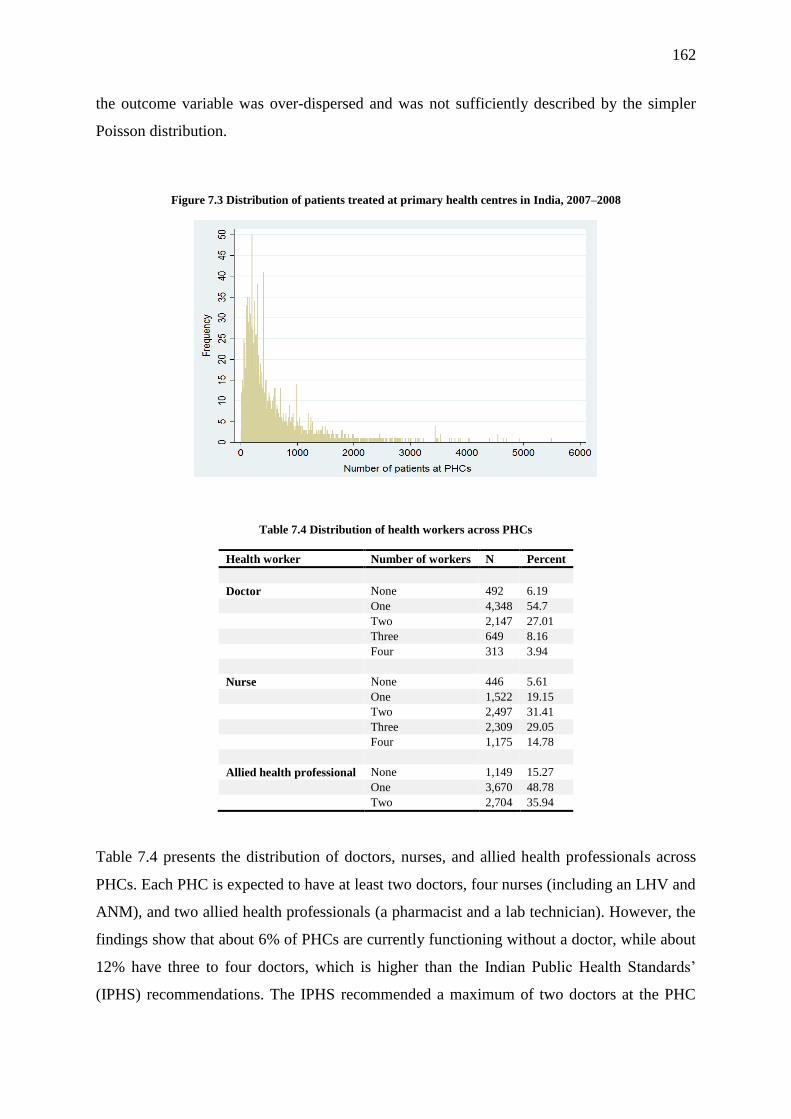
162
the outcome variable was over-dispersed and was not sufficiently described by the simpler
Poisson distribution.
Figure 7.3 Distribution of patients treated at primary health centres in India, 2007–2008
Table 7.4 Distribution of health workers across PHCs
Health worker Number of workers N Percent
Doctor None 492 6.19
One 4,348 54.7
Two 2,147 27.01
Three 649 8.16
Four 313 3.94
Nurse None 446 5.61
One 1,522 19.15
Two 2,497 31.41
Three 2,309 29.05
Four 1,175 14.78
Allied health professional None 1,149 15.27
One 3,670 48.78
Two 2,704 35.94
Table 7.4 presents the distribution of doctors, nurses, and allied health professionals across
PHCs. Each PHC is expected to have at least two doctors, four nurses (including an LHV and
ANM), and two allied health professionals (a pharmacist and a lab technician). However, the
findings show that about 6% of PHCs are currently functioning without a doctor, while about
12% have three to four doctors, which is higher than the Indian Public Health Standards’
(IPHS) recommendations. The IPHS recommended a maximum of two doctors at the PHC

163
level. Similarly, with respect to nurses, while about 15% of PHCs feature four or more
nurses, about 6% of PHCs currently function without a nurse. For the descriptive statistics of
all variables used in the analysis, see Appendix Table 7A.11.
Table 7.5 presents the results of the negative binomial regression model for the volume of
patients treated at PHCs. It is clear from the table that the volume of patients progressively
increases with increasing numbers of available health workers. For instance, the volume of
patients in PHCs with a doctor increases by about 23% compared to those PHCs without a
doctor. Similarly, PHCs with two and three doctors are expected to receive about 30% and
38% more patients, respectively. With respect to nurses, increases in the volume of patients is
constant – with every additional nurse at a given PHC, there is an increase in the number of
patients by 6%–7%. Compared to PHCs without nurses, those PHCs with one nurse witness
an increase in patient volume of about 7%, while those PHCs with four nurses observe an
increase of about 29%. This finding is applicable to the allied health professionals as well.
See Appendix Table 7A.12 for a full model.
Table 7.5 Unadjusted and adjusted incidence rate ratios showing the effect of the availability of different health
workers on the volume of patients at primary health centres in India, 2007–2008
Independent variables Categories Unadjusted
IRR P-value 95% CI
Adjusted
IRR P-value 95% CI
Lower Upper
Lower Upper
Doctor None®
1 1.376 0.000 1.289 1.469 1.238 0.000 1.159 1.322
2 1.522 0.000 1.418 1.633 1.306 0.000 1.216 1.402
3 1.605 0.000 1.473 1.747 1.378 0.000 1.266 1.501
4 1.626 0.000 1.409 1.877 1.444 0.000 1.257 1.660
Nurse None®
1 1.123 0.001 1.046 1.205 1.072 0.047 1.001 1.149
2 1.254 0.000 1.167 1.347 1.138 0.000 1.061 1.221
3 1.362 0.000 1.263 1.468 1.192 0.000 1.107 1.283
4 1.525 0.000 1.403 1.657 1.292 0.000 1.190 1.403
Allied workers None®
1 1.170 0.000 1.119 1.223 1.119 0.000 1.072 1.169
2 1.311 0.000 1.247 1.379 1.210 0.000 1.151 1.274
Dispersion parameter (alpha) 0.315 (P=0.000)
(95% CI=0.304, 0.325)
Likelihood ratio test of alpha=0: χ2=1,825.7 (P=0.000)
Note: IRR – Incidence rate ratio, CI – Confidence interval, ® Reference category; mean variance inflation factor – 2.05 (for a detailed
VIF, see Appendix Table 7A.13)
The overall VIF for the model was small (2.05), suggesting the insignificant existence of
multicollinearity. As a final step, the residuals from the model were checked. Deviance
164
residuals were plotted against fitted values, where it was found that a trend exists in the
scatter plot. Specifically, the variation fell in association with increases in the estimated value
(see Appendix Figure 7A.3). Following this, the Park test was conducted to investigate the
presence of heteroscedasticity in the residuals. The results shown in Appendix Table 7A.14
confirm the presence of heteroscedasticity. The standard errors were therefore adjusted using
the White procedure. The results presented in Table 7.5 are the adjusted results; it should be
noted that the significance values did not change much, and the overall interpretation thus
remained the same. The second graph in Appendix Figure 7A.3 shows a normal quantile plot
of standardized deviance residuals. The quantile plot follows the reference line closely,
except at the far end of the upper-right portion of the graph. This verifies assumptions of
normality for the residuals with respect to most of the range of values. The minor deviations
from the reference line at both ends suggest that the data distribution has a long tail at the
end.
A split sample test was also conducted to check the consistency of the coefficients (see
Appendix Table 7A.15). The overall sample of 7,523 PHCs was randomly split into two: one
with 3,719 PHCs and the other with 3,804 PHCs. The same model that was used to obtain the
final results presented in Table 7.5 was employed to these datasets. Then, the resulting
coefficients from both datasets were compared to one another using formula 5, as mentioned
in section 4.5.2 in Chapter 4. The t-test values suggest that for most variables, the coefficients
from the two datasets were not significantly different from each other, as their t-values were
below 1.96. However, there were two variables (access to generators and communication)
whose t-values were over 1.96 (i.e., statistically significant at 5%).
7.1.1 Community health centres
The number of patients treated in the last month preceding the survey served as the dependent
variable. The mean number of patients treated was about 2721, with a high variance of
5,563,084. The distribution of the outcome variable was highly skewed, as shown in Figure
7.4. The total number of observations included in the final model after excluding outliers,
missing values, and ‘do not know’ responses from the sample was 3,595. For more
information on the dependent and independent variables used in the regression analysis for
the CHC level, please refer to sections 4.4.3.1 and 4.4.3.2. The model was built using an
incremental method, as described in Chapter 4.

165
Figure 7.4 Distribution of patients treated at community health centres in India, 2007–2008
Table 7.6 Distribution of community health centres by health worker availability, India, 2007–2008
Health workers Number of CHCs Percent
Number of specialists
None 1,076 28.9
1–2 1,315 35.3
3–4 742 19.9
5–6 364 9.8
7+ 226 6.1
Number of medical officers
0 611 16.4
1 955 25.7
2 1,109 29.8
3 560 15.0
4 244 6.6
5+ 244 6.5
Number of nurses
0 50 1.3
1–3 652 17.5
4–6 1,129 30.3
7–9 949 25.5
10–12 418 11.3
13–15 229 6.2
16+ 296 7.9
Number of allied health professionals
0 69 1.8
1–2 898 24.1
3–4 1,782 47.9
5–6 624 16.8
7+ 350 9.4
The descriptive statistics given in Table 7.6 revealed that about 28.9% of CHCs were
functioning without specialists, while about 15.9% had five or more specialists, which is
more than the recommended number of four specialists. As for doctors, about 16.4% of
CHCs were without a medical officer. On the one hand, about 14% of CHCs had 13 or more
nurses; on the other, about 1.3% of CHCs in the country were running without a nurse. The

166
proportion of CHCs without allied health professionals (pharmacists and lab technicians) was
slightly less than 2%. About 9% of CHCs had 7 or more allied health professionals. For the
descriptive statistics of the other variables used in the model, see Appendix Table 7A.16.
Table 7.7 presents the results of negative binomial regression in the form of incidence ratios,
along with their P-values and associated confidence intervals. The results show that when
controlling for other relevant variables, a higher availability of health workers is associated
with a rise in the volume of patients being treated at the CHCs. Also, there is a progressive
increase in the volume of patients as the number of health workers increases. All health
worker variables were statistically significant at first; however, as the model became more
populated, the effect of medical officer availability waned, and only one category remained
significant.
Table 7.7 Unadjusted and adjusted incidence rate ratios showing the effect of the availability of different health
workers on the volume of patients at community health centres in India, 2007–2008
Independent variable Unadjusted
IRR
P-
value
Adjusted
IRR P-value
95% CI 95% CI
Lower Upper Lower Upper
Specialists
None®
1–2 1.144 0.000 1.073 1.219 1.068 0.038 1.003 1.136
3–4 1.362 0.000 1.253 1.480 1.174 0.000 1.081 1.276
5–6 1.623 0.000 1.459 1.805 1.303 0.000 1.171 1.450
7+ 1.541 0.000 1.339 1.774 1.232 0.003 1.073 1.416
Medical officers
None®
1 0.976 0.590 0.893 1.066 0.981 0.660 0.901 1.068
2 1.036 0.449 0.945 1.135 1.017 0.715 0.931 1.110
3 1.138 0.014 1.026 1.261 1.092 0.083 0.989 1.206
4 1.168 0.018 1.027 1.328 1.069 0.292 0.944 1.210
5+ 1.234 0.002 1.080 1.409 1.104 0.132 0.971 1.255
Nurses
None®
1–3 1.299 0.033 1.022 1.652 1.382 0.005 1.101 1.733
4–6 1.591 0.000 1.253 2.021 1.593 0.000 1.272 1.996
7–9 1.754 0.000 1.377 2.234 1.684 0.000 1.340 2.116
10–12 1.825 0.000 1.421 2.343 1.705 0.000 1.346 2.161
13–15 1.781 0.000 1.371 2.313 1.566 0.000 1.222 2.007
16+ 1.670 0.000 1.291 2.159 1.448 0.003 1.135 1.847
Allied health professionals
None®
1–2 1.481 0.000 1.214 1.808 1.633 0.000 1.350 1.976
3–4 1.688 0.000 1.382 2.062 1.750 0.000 1.445 2.120
5–6 1.855 0.000 1.506 2.286 1.792 0.000 1.465 2.191
7+ 1.885 0.000 1.501 2.367 1.851 0.000 1.486 2.306
Dispersion parameter (alpha)
0.427 0.000 0.405 0.450
Likelihood ratio test of alpha=0: χ2=357.7 (P=0.000)
Note: IRR – Incidence rate ratio, CI – Confidence interval, ® Reference category; mean variance inflation factor – 1.79 (for
a detailed VIF, see Appendix Table 7A.18)

167
The results of the analysis revealed that CHCs with higher numbers of specialists are
expected to have higher volumes of patients. For instance, the volume of patients in those
CHCs that had 1–2 specialists available was about 7% higher than those that did not have any
specialists. The rise in patient volume for CHCs with 3–4 [IRR=1.174, P=0.000] and 5–6
[IRR=1.303, P=0.000] specialists was even higher. Similarly, the deployment of nurses was
found to be associated with a rise in patient volume. However, this volume seems to increase
progressively up to a specific limit, after which it diminishes. For instance, when compared to
those CHCs with no nurses, the volume of patients at CHCs with 1–3 nurses increases by
about 38%. At CHCs with 10–12 nurses, the volume increases by 70%. However, after this
point, any increase in the number of nurses does not seem to increase the volume of patients.
The case of allied health professionals seems to be a little different, as the increase in their
number is associated with a progressive increase in the volume of healthcare. For instance,
while the volume of patients at CHCs with 1–2 allied workers increases by 63%, the rise in
volume goes up to 75%, 79%, and 85% at CHCs with 3–4, 5–6, and 7 or more allied workers,
respectively. It is notable that although there is a progressive increase in the volume of
patients, the rise is constant; however, the volume of patients diminishes as the number of
allied workers increases at the CHCs. For a detailed model, see Appendix Table 7A.17.
The likelihood ratio test with an alpha=0 produced a large chi-square (357.7) value, with an
associated P-value of <0.001. A large test statistic is an indicator that the outcome (the
number of patients) is over-dispersed and is not sufficiently described by the simpler Poisson
distribution. The dispersion parameter was also greater than zero, indicating that the data are
over-dispersed and should be estimated using a negative binomial model instead of a Poisson
model.
The final model was checked for multicollinearity using VIF. The results showed that the
overall VIF for the entire model was very small (1.79), illustrating that the magnitude of
multicollinearity was insignificant. For detailed VIFs, see Appendix Table 7A.18. Some
model checks were performed to identify whether any problems existed in the model. The
first graph of the two presented in Appendix Figure 7A.4 shows the deviance residuals
plotted against fitted values. A trend was observed where there was a decline in variation
with an increase in the estimated value. Following this, the Park test was used to investigate
the presence of heteroscedasticity in the residuals. The results of the Park test are given in
Appendix Table 7A.19; they confirm the presence of heteroscedasticity. The standard errors
were thus adjusted using the White procedure, as were the results presented in Table 7.7.
168
There were only minor changes in the significance values of a few categories; the overall
interpretation of the results remains the same. To highlight this, the second graph in
Appendix Figure 7A.4 is known as a normal quantile plot of standardized deviance residuals.
The quantile plot appears to closely follow the reference line (except in the upper-right and
lower-left portions). This verifies the assumptions of normality of the residuals for most of
the value ranges. Any minor deviations from the reference line at both ends suggest that the
data distribution had a long tail at each end.
Finally, a split sample test was also conducted to verify the consistency of the model
parameters (see Appendix Table 7A.20). The dataset (featuring 3,723 observations) was
therefore randomly partitioned into two subsets: one with 1,882 observations and the other
with 1,841 observations. Models using the same covariates were run on each dataset and the
coefficients of the first dataset were compared to the coefficients obtained from the second
dataset using a t-test (formula 5, Chapter 4). The t-test values suggest that the coefficients for
most variables in the two datasets were not significantly different from one another, as their t-
values were below 1.96. However, there was one variable (vehicle) whose t-value was over
1.96 (i.e., it was statistically significant at 5%).
7.3 Results of the propensity score matching-based evaluation of the impact of
new health workers on healthcare service utilization
This section presents the results of the propensity score matching analysis, which was
conducted to accomplish the second objective of this investigation, as mentioned at the outset
of this chapter. The results pertaining to the impact of the 2nd ANM are presented first. Then,
the results from the AYUSH doctor’s analysis follow. The analysis for the 2nd ANM included
four outcome variables: the number of antenatal care registrations, the number of maternal
postnatal care services provided, the number of infant postnatal care services provided, and
the number of patients treated for minor ailments. The analysis regarding the AYUSH doctor
included four variables as well: the number of male inpatients, the number of female
inpatients, the number of male outpatients, and the number of female outpatients. For details
about the variables used to create the propensity score, see Chapter 4.
7.3.1 Results of the propensity score matching analysis for the 2nd ANM at HSCs
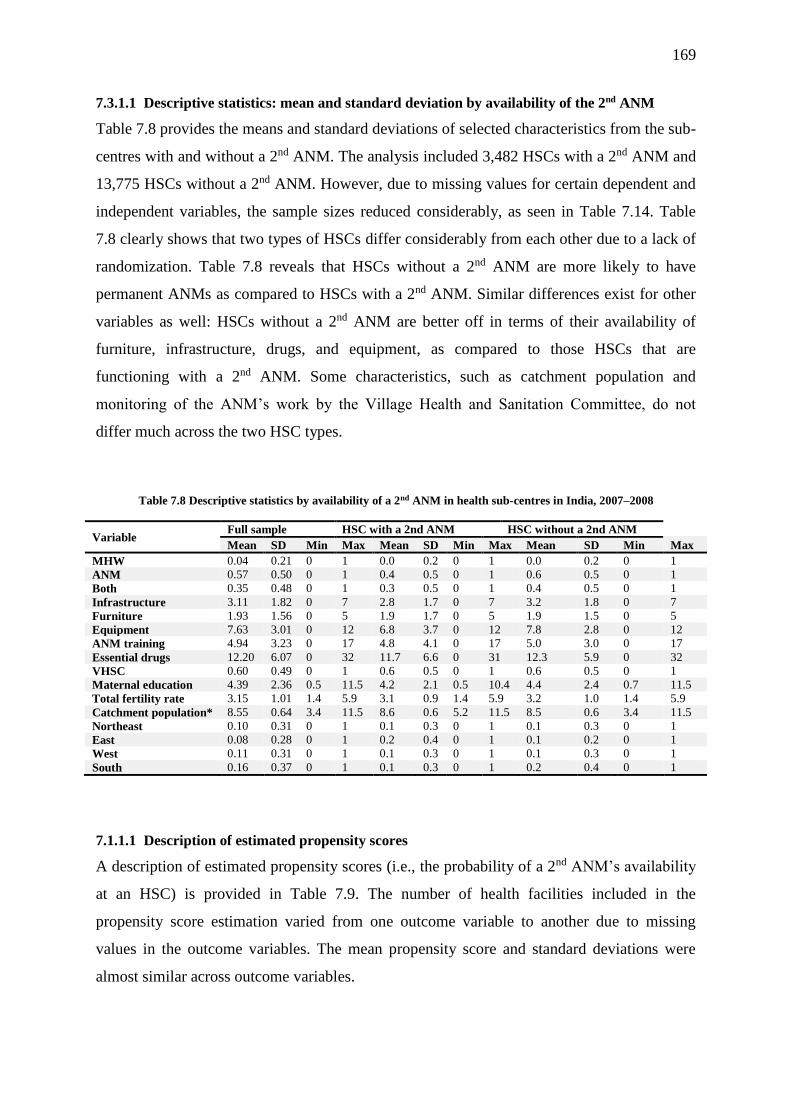
169
7.3.1.1 Descriptive statistics: mean and standard deviation by availability of the 2nd ANM
Table 7.8 provides the means and standard deviations of selected characteristics from the sub-
centres with and without a 2nd ANM. The analysis included 3,482 HSCs with a 2nd ANM and
13,775 HSCs without a 2nd ANM. However, due to missing values for certain dependent and
independent variables, the sample sizes reduced considerably, as seen in Table 7.14. Table
7.8 clearly shows that two types of HSCs differ considerably from each other due to a lack of
randomization. Table 7.8 reveals that HSCs without a 2nd ANM are more likely to have
permanent ANMs as compared to HSCs with a 2nd ANM. Similar differences exist for other
variables as well: HSCs without a 2nd ANM are better off in terms of their availability of
furniture, infrastructure, drugs, and equipment, as compared to those HSCs that are
functioning with a 2nd ANM. Some characteristics, such as catchment population and
monitoring of the ANM’s work by the Village Health and Sanitation Committee, do not
differ much across the two HSC types.
Table 7.8 Descriptive statistics by availability of a 2nd ANM in health sub-centres in India, 2007–2008
Variable Full sample HSC with a 2nd ANM HSC without a 2nd ANM
Mean SD Min Max Mean SD Min Max Mean SD Min Max
MHW 0.04 0.21 0 1 0.0 0.2 0 1 0.0 0.2 0 1
ANM 0.57 0.50 0 1 0.4 0.5 0 1 0.6 0.5 0 1
Both 0.35 0.48 0 1 0.3 0.5 0 1 0.4 0.5 0 1
Infrastructure 3.11 1.82 0 7 2.8 1.7 0 7 3.2 1.8 0 7
Furniture 1.93 1.56 0 5 1.9 1.7 0 5 1.9 1.5 0 5
Equipment 7.63 3.01 0 12 6.8 3.7 0 12 7.8 2.8 0 12
ANM training 4.94 3.23 0 17 4.8 4.1 0 17 5.0 3.0 0 17
Essential drugs 12.20 6.07 0 32 11.7 6.6 0 31 12.3 5.9 0 32
VHSC 0.60 0.49 0 1 0.6 0.5 0 1 0.6 0.5 0 1
Maternal education 4.39 2.36 0.5 11.5 4.2 2.1 0.5 10.4 4.4 2.4 0.7 11.5
Total fertility rate 3.15 1.01 1.4 5.9 3.1 0.9 1.4 5.9 3.2 1.0 1.4 5.9
Catchment population* 8.55 0.64 3.4 11.5 8.6 0.6 5.2 11.5 8.5 0.6 3.4 11.5
Northeast 0.10 0.31 0 1 0.1 0.3 0 1 0.1 0.3 0 1
East 0.08 0.28 0 1 0.2 0.4 0 1 0.1 0.2 0 1
West 0.11 0.31 0 1 0.1 0.3 0 1 0.1 0.3 0 1
South 0.16 0.37 0 1 0.1 0.3 0 1 0.2 0.4 0 1
7.1.1.1 Description of estimated propensity scores
A description of estimated propensity scores (i.e., the probability of a 2nd ANM’s availability
at an HSC) is provided in Table 7.9. The number of health facilities included in the
propensity score estimation varied from one outcome variable to another due to missing
values in the outcome variables. The mean propensity score and standard deviations were
almost similar across outcome variables.

170
Table 7. 9 Estimated propensity scores
Variable Observation Mean SD Min Max
Number of deliveries 16,078 0.177 0.108 0.014 0.785
Number of women received postnatal care 16,569 0.176 0.106 0.015 0.78
Number of children received postnatal care 16,562 0.176 0.106 0.015 0.781
Number of patients treated for minor
ailments 15,428 0.179 0.11 0.013 0.786
7.3.1.2 Impact assessment of the 2nd ANM on service utilization
Tables 7.10, 7.11, 7.12, and 7.13 provide the estimates of the impact of a 2nd ANM’s
availability on the utilization of different maternal and child services. The raw estimates from
unmatched samples show that the utilization of antenatal, postnatal (maternal and child), and
minor ailment treatment services in the sub-centres with a 2nd ANM are slightly higher than
in those sub-centres without a 2nd ANM. The average treatment effect on treated (ATT), the
average treatment effect on untreated (ATU), and the average treatment effect (ATE) show
the estimates after matching. Using the nearest-neighbour method of matching with a 0.001
calliper, the calculated value of ATT (minor treatments) for the treated and control groups
was 22.8 and 18.7, respectively, suggesting a slight increase in the number of patients who
received treatment for minor ailments when HSCs were staffed by a 2nd ANM. The P-values
and confidence intervals (obtained from bootstrapping with 500 replications) indicate that the
ATT for minor ailments was statistically significant.
Table 7.10 Estimates of the impact of a 2nd ANM on the number of antenatal care registrations
Sample Treated Controls Difference S.E. t-stat P>z 95% CI
Unmatched 15.047 14.755 0.291 0.392 0.740
ATT 15.047 14.364 0.683 0.505 0.135 0.176 (–0.307, 1.674)
ATU 14.759 14.331 –0.428
ATE
–0.232
Table 7.11 Estimates of the impact of a 2nd ANM on the number of women provided with postnatal care
Sample Treated Controls Difference S.E. t-stat P>z 95% CI
Unmatched 7.525 7.385 0.140 0.153 0.91
ATT 7.525 7.074 0.451 0.222 1.23 0.219 (–0.162, 0.710)
ATU 7.386 7.436 0.050
ATE
0.120
Table 7.12 Estimates of the impact of a 2nd ANM on the number of infants provided with postnatal care
Sample Treated Controls Difference S.E. t-stat P>z 95% CI
Unmatched 7.117 7.211 –0.097 0.158 –0.66
ATT 7.117 6.871 0.243 0.193 1.27 0.204 (–0.133-0.624)
ATU 7.213 7.222 0.009
ATE
0.050
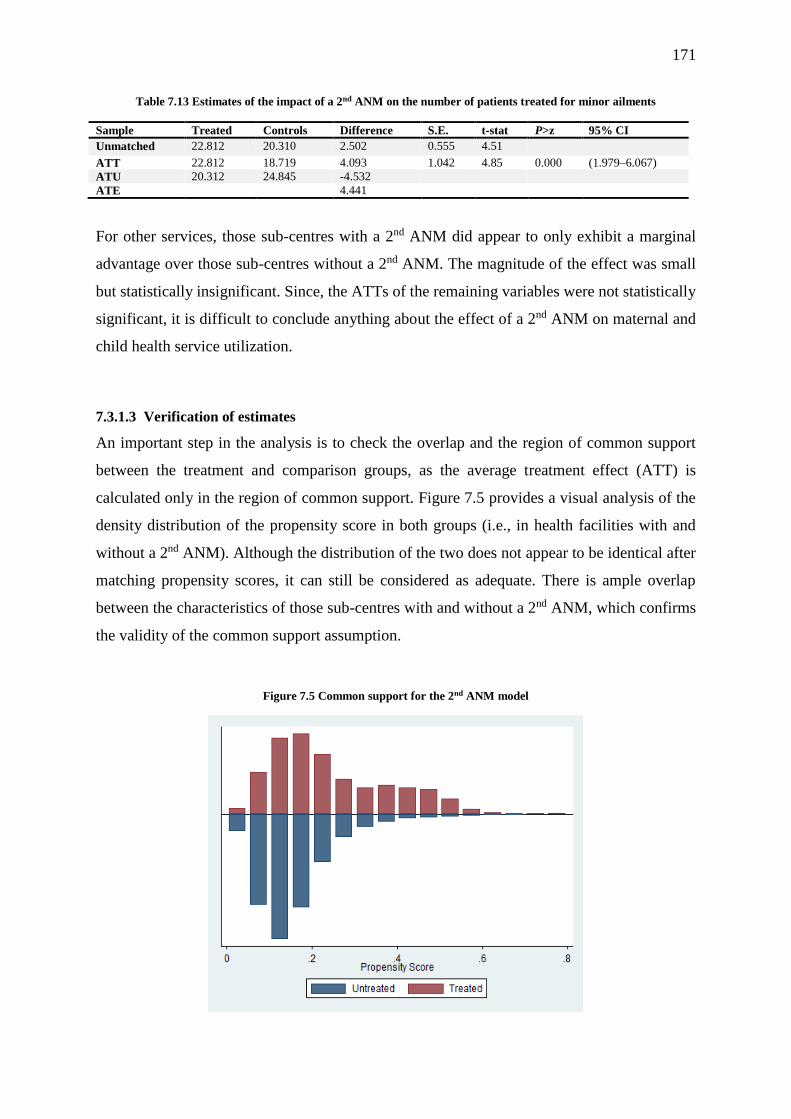
171
Table 7.13 Estimates of the impact of a 2nd ANM on the number of patients treated for minor ailments
Sample Treated Controls Difference S.E. t-stat P>z 95% CI
Unmatched 22.812 20.310 2.502 0.555 4.51 ATT 22.812 18.719 4.093 1.042 4.85 0.000 (1.979–6.067)
ATU 20.312 24.845 -4.532
ATE 4.441
For other services, those sub-centres with a 2nd ANM did appear to only exhibit a marginal
advantage over those sub-centres without a 2nd ANM. The magnitude of the effect was small
but statistically insignificant. Since, the ATTs of the remaining variables were not statistically
significant, it is difficult to conclude anything about the effect of a 2nd ANM on maternal and
child health service utilization.
7.3.1.3 Verification of estimates
An important step in the analysis is to check the overlap and the region of common support
between the treatment and comparison groups, as the average treatment effect (ATT) is
calculated only in the region of common support. Figure 7.5 provides a visual analysis of the
density distribution of the propensity score in both groups (i.e., in health facilities with and
without a 2nd ANM). Although the distribution of the two does not appear to be identical after
matching propensity scores, it can still be considered as adequate. There is ample overlap
between the characteristics of those sub-centres with and without a 2nd ANM, which confirms
the validity of the common support assumption.
Figure 7.5 Common support for the 2nd ANM model

172
Common support improves matching by removing those individuals for which there are no
matching samples available. Table 7.14 shows that no observations in the minor ailments
model were dropped from the analysis due to a lack of common support. One observation
(from the treated group) from the maternal postnatal care model, as well as two from the
child’s postnatal care model, were dropped during the analysis; moreover, 14 untreated
observations were dropped from the antenatal care model.
Table 7.14 Description of the sample used in the matching analysis
Treatment assignment Sample
Off support On support Total
Number of antenatal care registrations
Untreated 14 13,693 13,707
Treated 0 2,920 2,920
Total 0 16,613 16,627
Number of women who received postnatal care
Untreated 0 13,657 13,657
Treated 1 2,911 2,912
Total 1 16,568 16,569
Number of infants who received postnatal care
Untreated 0 13,655 13,655
Treated 2 2,905 2,907
Total 2 16,560 16,562
Number of patients treated for minor ailments
Untreated 0 12,672 12,672
Treated 0 2,756 2,756
Total 0 15,428 15,428
The analyses revealed that health facility characteristics were statistically significantly
different in the unmatched samples across almost all covariates. The percentage bias was
highest for infrastructure, equipment, and ANM training, as well as for the east and south
regions. After matching, the bias was reduced (see % reduction bias) by more than 80% in
each case. The standardized % bias dipped below 4% for all covariates (see Figure 7.6). As
long as the standardised % bias is below 10%, it is often not considered a problem.
The analysis also produced Pseudo-R2 for the PS model for both samples (see Table 7.15). If
the covariates are well-balanced in a matched sample, then the Pseudo-R2 should be fairly
low. The same table also shows that the mean and median biases are also reduced to 3.0 and
2.3, respectively, which is far below the limit (>20) suggested by Rosenbaum and Rubin
(1985). The likelihood ratio, which was highly significant before matching, turned out to be
insufficient after matching, indicating that there were no systematic differences in the

173
distribution of covariates between the two groups (i.e., those health facilities with and without
a 2nd ANM).
Figure 7.6 Reduction in the standardized bias before and after matching
Table 7.15 Significance of the overall model
Sample Ps R2 LR χ2 P>χ2 Mean bias Median
bias Rubin’s B Rubin’s R
Unmatched 0.080 1152.8 0.000 13.1 8.0 71.8 1.3
Matched 0.003 23.2 0.081 3.0 2.3 13.0 0.9
The sensitivity of the estimated treatment effect was measured using Rosenbaum bounds.
This analysis examines the extent to which selection on unobservable data may bias
inferences about the effect of the treatment. Tables 7.16 exhibits values from Wilcoxon
signed-rank tests for the average treatment effect on those treated when setting the gamma
value at different thresholds. The analysis was conducted using the ‘rbounds’ module in
Stata12. A sensitivity analysis carried out using rbounds is meaningful only for highly
significant effects (P<0.001). Therefore, this analysis was carried out only for two outcomes
that were found to be highly significant. The P-values represent the bound on the significance
level of the treatment effect in the presence of positive and negative bias with respect to
treatment status.

174
Table 7.16 Sensitivity analysis for using the Rosenbaum (2002) bounds for the variable ‘number of patients treated
for minor ailments’ at health sub-centres in India
Gamma Sig+ Sig- t-hat+ t-hat- CI+ CI-
1.0 0.000 0.000 2.500 2.500 1.500 3.500
1.1 0.003 0.000 1.500 3.500 0.500 5.000
1.2 0.203 0.000 0.500 5.000 –0.500 6.000
1.3 0.832 0.000 –0.500 6.000 –1.500 7.500
1.4 0.996 0.000 –1.500 7.500 –2.500 8.500
1.5 1.000 0.000 –2.000 8.500 –3.500 10.000
Since the estimated effect of the availability of a 2nd ANM was positively related to the
number of patients treated for minor ailments, the bounds for positive bias were of interest in
this analysis. The critical level of gamma, above which conclusions about the effect of a 2nd
ANM on the number of treatments for minor ailments could be questioned, was 1.1. In other
words, if the unobserved covariates caused the odds ratio of treatment assignment to differ
between treatment and control cases by a factor of about 1.1, it would render spurious the
conclusion of a positive effect of a 2nd ANM on the number of patients receiving treatment
for minor ailments.
This result only means that the confidence interval for the effect of a 2nd ANM would include
zero if an unobserved variable caused the odds ratio of treatment assignment to differ
between the treatment and control groups by a factor of 1.1. This result only suggests that
there is a level of uncertainty contained in the matching estimator by showing just how large
the influence of unobserved covariates must be to weaken the conclusion of the analysis. The
results suggest that even a small unobserved difference in a covariate would change our
inferences.
7.3.2 Results of the propensity score matching analysis for the 2nd ANM at HSCs
7.3.2.1 Descriptive statistics: mean and standard deviation by the availability of an AYUSH
doctor
The unadjusted mean and standard deviation of selected characteristics of the PHCs with and
without AYUSH doctors are given in Table 7.17. The analysis was based on 1,365 PHCs
with AYUSH doctors and 6,016 PHCs without AYUSH doctors. The examination of the
PHC’s selected characteristics showed that those PHCs with an AYUSH doctor were
substantially different from those without an AYUSH doctor. It was noted from the table that
PHCs with AYUSH doctors are more likely to have other health workers, as compared to
their counterparts. For instance, while about 42% of PHCs with AYUSH doctors have a
contractual medical officer, the proportion was only 26% in those PHCs without AYUSH
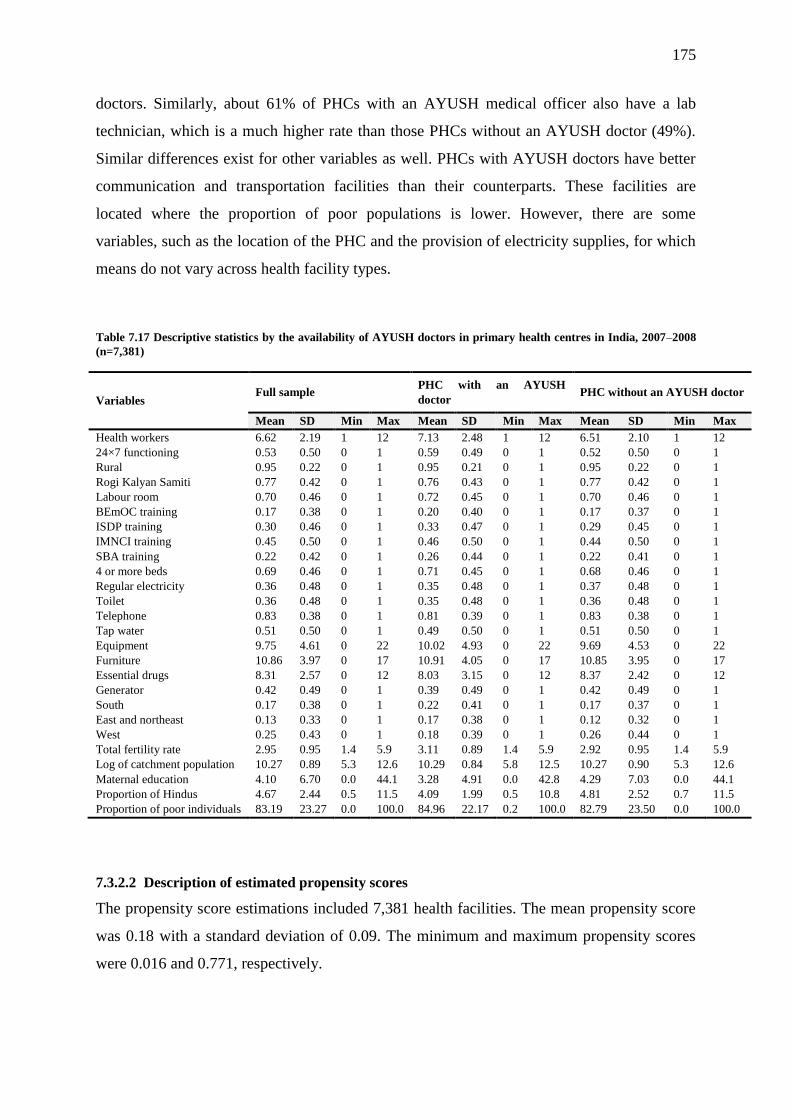
175
doctors. Similarly, about 61% of PHCs with an AYUSH medical officer also have a lab
technician, which is a much higher rate than those PHCs without an AYUSH doctor (49%).
Similar differences exist for other variables as well. PHCs with AYUSH doctors have better
communication and transportation facilities than their counterparts. These facilities are
located where the proportion of poor populations is lower. However, there are some
variables, such as the location of the PHC and the provision of electricity supplies, for which
means do not vary across health facility types.
Table 7.17 Descriptive statistics by the availability of AYUSH doctors in primary health centres in India, 2007–2008
(n=7,381)
Variables Full sample
PHC with an AYUSH
doctor PHC without an AYUSH doctor
Mean SD Min Max Mean SD Min Max Mean SD Min Max
Health workers 6.62 2.19 1 12 7.13 2.48 1 12 6.51 2.10 1 12
24×7 functioning 0.53 0.50 0 1 0.59 0.49 0 1 0.52 0.50 0 1
Rural 0.95 0.22 0 1 0.95 0.21 0 1 0.95 0.22 0 1
Rogi Kalyan Samiti 0.77 0.42 0 1 0.76 0.43 0 1 0.77 0.42 0 1
Labour room 0.70 0.46 0 1 0.72 0.45 0 1 0.70 0.46 0 1
BEmOC training 0.17 0.38 0 1 0.20 0.40 0 1 0.17 0.37 0 1
ISDP training 0.30 0.46 0 1 0.33 0.47 0 1 0.29 0.45 0 1
IMNCI training 0.45 0.50 0 1 0.46 0.50 0 1 0.44 0.50 0 1
SBA training 0.22 0.42 0 1 0.26 0.44 0 1 0.22 0.41 0 1
4 or more beds 0.69 0.46 0 1 0.71 0.45 0 1 0.68 0.46 0 1
Regular electricity 0.36 0.48 0 1 0.35 0.48 0 1 0.37 0.48 0 1
Toilet 0.36 0.48 0 1 0.35 0.48 0 1 0.36 0.48 0 1
Telephone 0.83 0.38 0 1 0.81 0.39 0 1 0.83 0.38 0 1
Tap water 0.51 0.50 0 1 0.49 0.50 0 1 0.51 0.50 0 1
Equipment 9.75 4.61 0 22 10.02 4.93 0 22 9.69 4.53 0 22
Furniture 10.86 3.97 0 17 10.91 4.05 0 17 10.85 3.95 0 17
Essential drugs 8.31 2.57 0 12 8.03 3.15 0 12 8.37 2.42 0 12
Generator 0.42 0.49 0 1 0.39 0.49 0 1 0.42 0.49 0 1
South 0.17 0.38 0 1 0.22 0.41 0 1 0.17 0.37 0 1
East and northeast 0.13 0.33 0 1 0.17 0.38 0 1 0.12 0.32 0 1
West 0.25 0.43 0 1 0.18 0.39 0 1 0.26 0.44 0 1
Total fertility rate 2.95 0.95 1.4 5.9 3.11 0.89 1.4 5.9 2.92 0.95 1.4 5.9
Log of catchment population 10.27 0.89 5.3 12.6 10.29 0.84 5.8 12.5 10.27 0.90 5.3 12.6
Maternal education 4.10 6.70 0.0 44.1 3.28 4.91 0.0 42.8 4.29 7.03 0.0 44.1
Proportion of Hindus 4.67 2.44 0.5 11.5 4.09 1.99 0.5 10.8 4.81 2.52 0.7 11.5
Proportion of poor individuals 83.19 23.27 0.0 100.0 84.96 22.17 0.2 100.0 82.79 23.50 0.0 100.0
7.3.2.2 Description of estimated propensity scores
The propensity score estimations included 7,381 health facilities. The mean propensity score
was 0.18 with a standard deviation of 0.09. The minimum and maximum propensity scores
were 0.016 and 0.771, respectively.
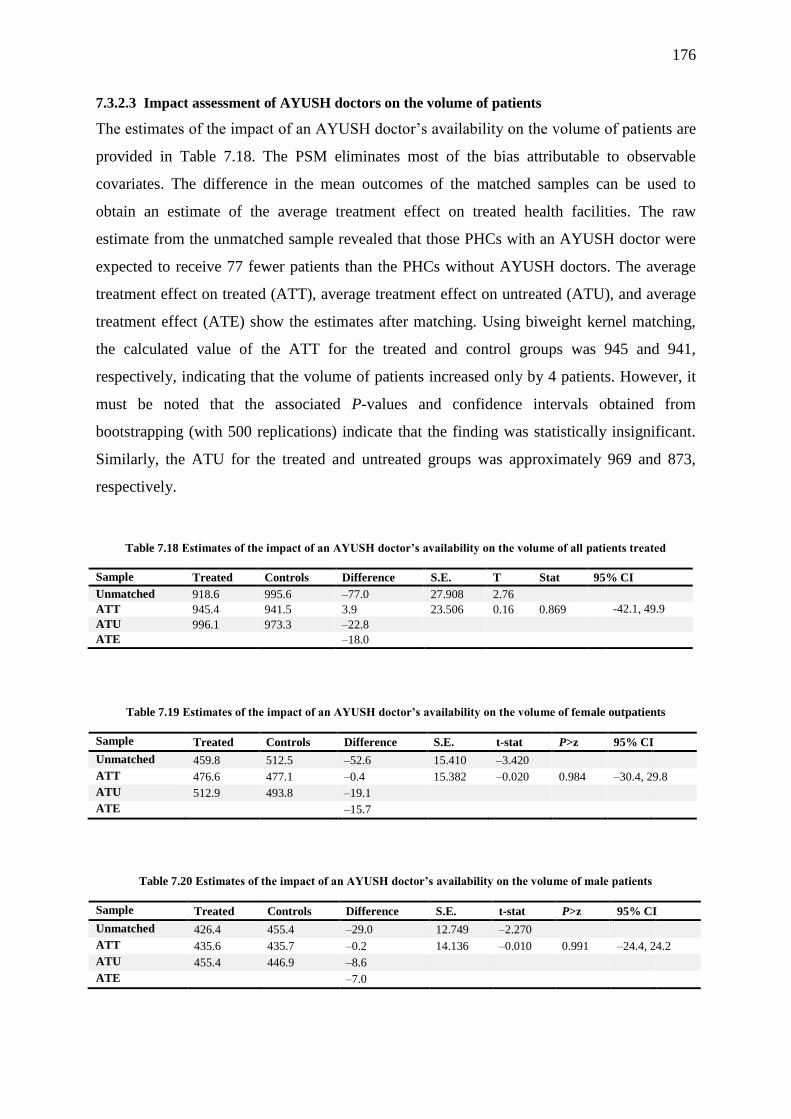
176
7.3.2.3 Impact assessment of AYUSH doctors on the volume of patients
The estimates of the impact of an AYUSH doctor’s availability on the volume of patients are
provided in Table 7.18. The PSM eliminates most of the bias attributable to observable
covariates. The difference in the mean outcomes of the matched samples can be used to
obtain an estimate of the average treatment effect on treated health facilities. The raw
estimate from the unmatched sample revealed that those PHCs with an AYUSH doctor were
expected to receive 77 fewer patients than the PHCs without AYUSH doctors. The average
treatment effect on treated (ATT), average treatment effect on untreated (ATU), and average
treatment effect (ATE) show the estimates after matching. Using biweight kernel matching,
the calculated value of the ATT for the treated and control groups was 945 and 941,
respectively, indicating that the volume of patients increased only by 4 patients. However, it
must be noted that the associated P-values and confidence intervals obtained from
bootstrapping (with 500 replications) indicate that the finding was statistically insignificant.
Similarly, the ATU for the treated and untreated groups was approximately 969 and 873,
respectively.
Table 7.18 Estimates of the impact of an AYUSH doctor’s availability on the volume of all patients treated
Sample Treated Controls Difference S.E. T Stat 95% CI
Unmatched 918.6 995.6 –77.0 27.908 2.76
ATT 945.4 941.5 3.9 23.506 0.16 0.869
-42.1, 49.9
ATU 996.1 973.3 –22.8
ATE
–18.0
Table 7.19 Estimates of the impact of an AYUSH doctor’s availability on the volume of female outpatients
Sample Treated Controls Difference S.E. t-stat P>z 95% CI
Unmatched 459.8 512.5 –52.6 15.410 –3.420
ATT 476.6 477.1 –0.4 15.382 –0.020 0.984 –30.4, 29.8
ATU 512.9 493.8 –19.1
ATE
–15.7
Table 7.20 Estimates of the impact of an AYUSH doctor’s availability on the volume of male patients
Sample Treated Controls Difference S.E. t-stat P>z 95% CI
Unmatched 426.4 455.4 –29.0 12.749 –2.270
ATT 435.6 435.7 –0.2 14.136 –0.010 0.991 –24.4, 24.2
ATU 455.4 446.9 –8.6
ATE
–7.0
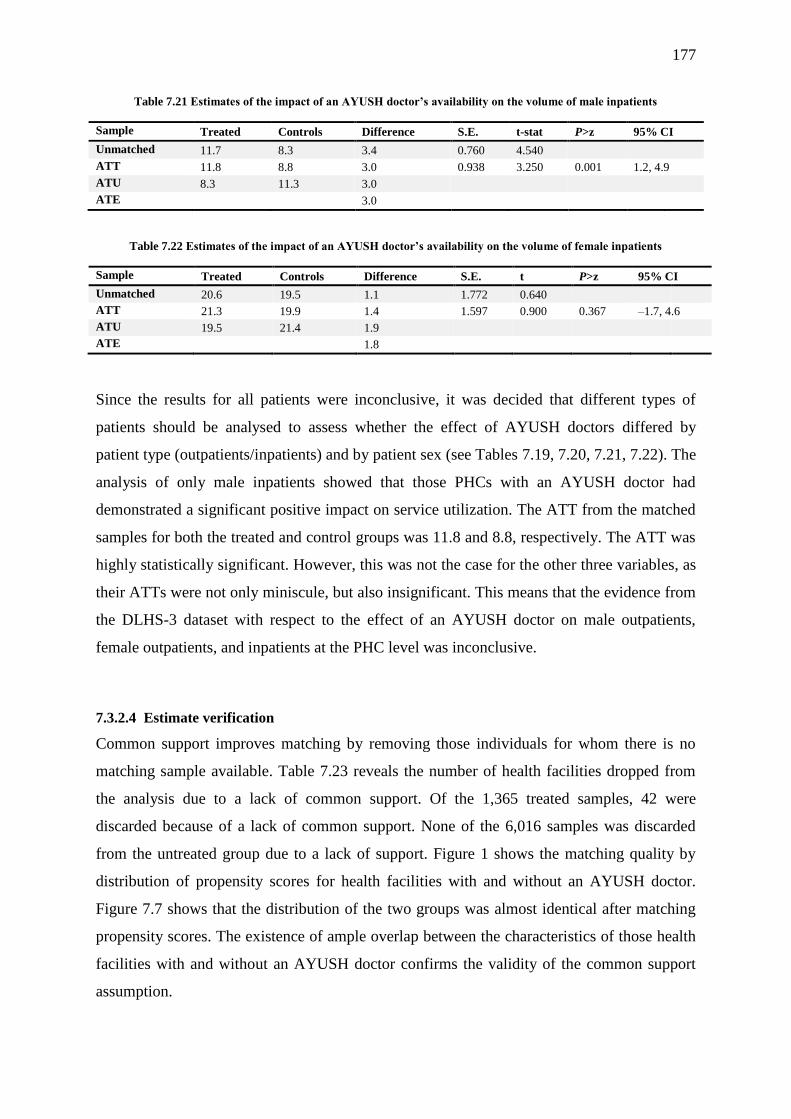
177
Table 7.21 Estimates of the impact of an AYUSH doctor’s availability on the volume of male inpatients
Sample Treated Controls Difference S.E. t-stat P>z 95% CI
Unmatched 11.7 8.3 3.4 0.760 4.540
ATT 11.8 8.8 3.0 0.938 3.250 0.001 1.2, 4.9
ATU 8.3 11.3 3.0
ATE
3.0
Table 7.22 Estimates of the impact of an AYUSH doctor’s availability on the volume of female inpatients
Sample Treated Controls Difference S.E. t P>z 95% CI
Unmatched 20.6 19.5 1.1 1.772 0.640
ATT 21.3 19.9 1.4 1.597 0.900 0.367 –1.7, 4.6
ATU 19.5 21.4 1.9
ATE
1.8
Since the results for all patients were inconclusive, it was decided that different types of
patients should be analysed to assess whether the effect of AYUSH doctors differed by
patient type (outpatients/inpatients) and by patient sex (see Tables 7.19, 7.20, 7.21, 7.22). The
analysis of only male inpatients showed that those PHCs with an AYUSH doctor had
demonstrated a significant positive impact on service utilization. The ATT from the matched
samples for both the treated and control groups was 11.8 and 8.8, respectively. The ATT was
highly statistically significant. However, this was not the case for the other three variables, as
their ATTs were not only miniscule, but also insignificant. This means that the evidence from
the DLHS-3 dataset with respect to the effect of an AYUSH doctor on male outpatients,
female outpatients, and inpatients at the PHC level was inconclusive.
7.3.2.4 Estimate verification
Common support improves matching by removing those individuals for whom there is no
matching sample available. Table 7.23 reveals the number of health facilities dropped from
the analysis due to a lack of common support. Of the 1,365 treated samples, 42 were
discarded because of a lack of common support. None of the 6,016 samples was discarded
from the untreated group due to a lack of support. Figure 1 shows the matching quality by
distribution of propensity scores for health facilities with and without an AYUSH doctor.
Figure 7.7 shows that the distribution of the two groups was almost identical after matching
propensity scores. The existence of ample overlap between the characteristics of those health
facilities with and without an AYUSH doctor confirms the validity of the common support
assumption.
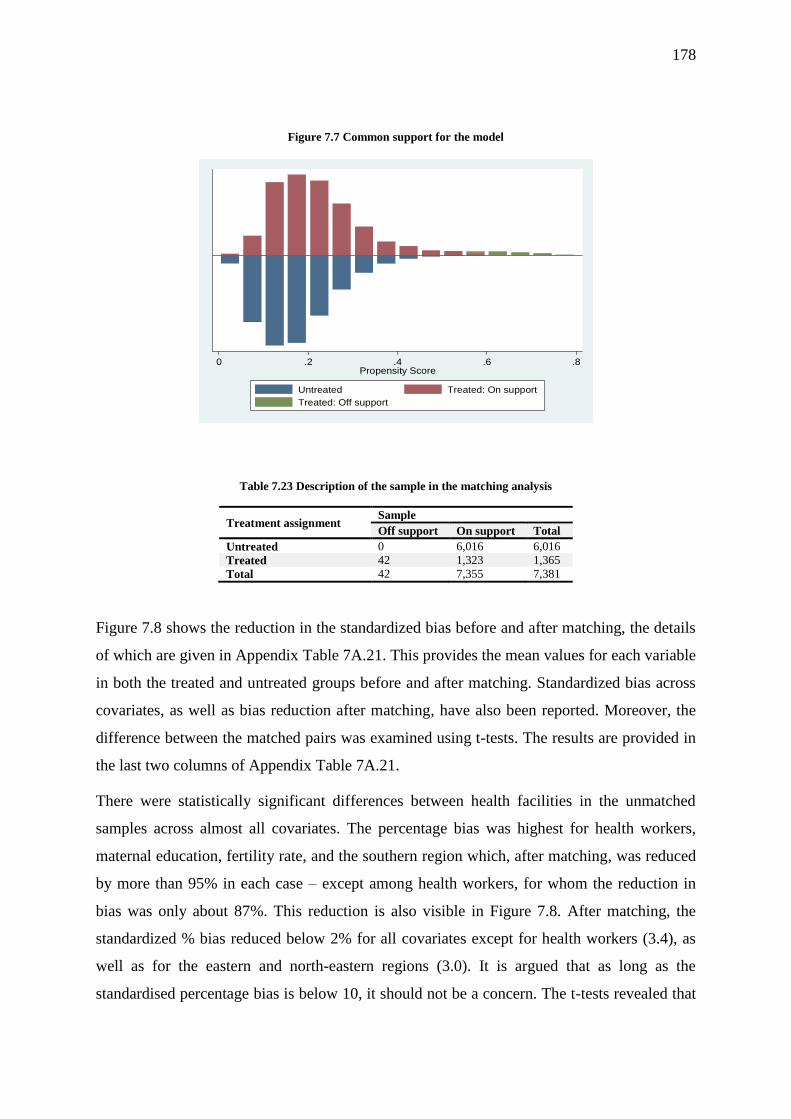
178
Figure 7.7 Common support for the model
Table 7.23 Description of the sample in the matching analysis
Treatment assignment Sample
Off support On support Total
Untreated 0 6,016 6,016
Treated 42 1,323 1,365
Total 42 7,355 7,381
Figure 7.8 shows the reduction in the standardized bias before and after matching, the details
of which are given in Appendix Table 7A.21. This provides the mean values for each variable
in both the treated and untreated groups before and after matching. Standardized bias across
covariates, as well as bias reduction after matching, have also been reported. Moreover, the
difference between the matched pairs was examined using t-tests. The results are provided in
the last two columns of Appendix Table 7A.21.
There were statistically significant differences between health facilities in the unmatched
samples across almost all covariates. The percentage bias was highest for health workers,
maternal education, fertility rate, and the southern region which, after matching, was reduced
by more than 95% in each case – except among health workers, for whom the reduction in
bias was only about 87%. This reduction is also visible in Figure 7.8. After matching, the
standardized % bias reduced below 2% for all covariates except for health workers (3.4), as
well as for the eastern and north-eastern regions (3.0). It is argued that as long as the
standardised percentage bias is below 10, it should not be a concern. The t-tests revealed that
0 .2 .4 .6 .8Propensity Score
Untreated Treated: On support
Treated: Off support

179
after matching, none of the mean differences between the treated and untreated groups was
significant, which was an indication of the fact that the covariates were sufficiently balanced.
Figure 7.8 Reduction in standardized bias before and after matching
This conclusion was also supported by Rubin’s B and R, both of which fell between the
recommended limits for the matched sample (see Table 7.24). Rubin’s B for the matched
sample was 6.6, as compared to the recommended upper limit of 25, whereas Rubin’s R,
which should fall between 0.5 and 2.0, turned out to be 1.15.
Table 7.24 Significance of the overall model
Sample Ps R2 LR χ2 P>χ2 Mean bias Median bias Rubin’s B Rubin’s R
Unmatched 0.059 413.96 0.000 9.9 7.5 60.8 1.12
Matched 0.001 2.90 0.999 1.0 0.7 6.6 1.15
In addition, the analysis produced Pseudo-R2 for the PS model for both samples (see Table
7.24). This reveals that the Pseudo-R2, which was highly significant before matching, turned
out to be insufficient after matching, indicating that there were no systematic differences in
180
the distribution of covariates between the two groups (i.e., health facilities with and without
an AYUSH doctor). A sensitivity analysis for the estimates was not conducted, as performing
a sensitivity analysis for insignificant results does not make sense.
7.4 Discussion
This chapter examined the effect of health worker availability at public health facilities on the
utilization of healthcare services. The first question specifically looked at whether the
increase in the availability (number) of health workers is associated with an increase in health
service utilization, while the second question examined the impact of two newly introduced
health workers – namely, an AYUSH doctor and a 2nd ANM – on the utilization of healthcare
services at PHCs and HSCs, respectively.
The results of the sub-centre analysis show that the deployment of two ANMs instead of one
permanent ANM had a small, but positive and statistically significant, effect on the utilization
of postnatal services. However, the same was not true for the utilization of antenatal services.
Another important result was that those sub-centres that are run solely by a contractual ANM
delivered fewer services than those sub-centres run by a permanent ANM, despite controlling
for other relevant factors. This applies to both maternal health services that were considered
for the analysis. This finding is particularly important because one of the key strategies of the
National Rural Health Mission, which served as an immediate measure to increase the
availability of health workers in publicly funded rural public health facilities, has been to
deploy contractual ANMs instead of recruiting permanent ANMs (Dhingra & Dutta, 2011).
It is argued that recruiting contractual ANMs is both convenient and economical for the
government (Prinja et al., 2014). However, this study indicates that this measure, despite
being convenient and economically savvy for the government, does not seem to result in any
substantial improvement in maternity service utilization. The results show that the utilization
of maternal healthcare services at HSCs run solely by a contractual ANM are not on par with
those solely run by permanent ANMs. The volume of service delivery does not increase
substantially, even when both ANMs run a sub-centre. In other words, deploying the second
ANM to sub-centres on a contractual basis is not likely to improve maternal health service
utilization. The same message is echoed in the results of the propensity score matching as
well, which found that the effect of a 2nd ANM on maternal and child health services,
although statistically insignificant, was miniscule. The only positive and statistically

181
significant effect was seen with respect to the increase in the number of patients treated for
minor ailments.
There may be a number of factors that can lead to the anomalous performance of ANMs in
these two streams. The 2nd ANM is a contractual health worker whose contract has to be
renewed every year. Previous studies have recorded that the poor performance of contractual
workers could be due to low motivation. This is an important factor that arises out of a
number of factors, such as job insecurity, low salaries and privileges, discrimination between
regular and contractual staff by higher authorities, the lack of a career path, and so on
(Kumar, Khan, Inder, & Anu, 2014; Kumar, Khan, Inder, & Mehra, 2014; Kumar, Khan,
Inder, & Sharma, 2013). As for salaries, there is a significant difference in pay between
contractual and regular ANMs. Contractual ANMs receive much less remuneration for the
same amount of work and they have the same responsibilities as a permanent ANM. For
instance, a contractual ANM in the state of Bihar earns a meagre ₹11,500 per month when
compared to a permanent ANM, who receives a salary of ₹25,000 per month (Government of
Bihar, 2011, 2014). A similar difference is found in other states as well. Therefore, the
government and policymakers should look into this issue and develop a solution to ensure
that the investment they are making in deploying contractual ANMs is optimally utilized.
Another reason why HSCs solely run by a 2nd ANM perform worse than HSCs run solely by
a permanent ANM could be due to the fact that the former has less experience in the role.
Many 2nd ANMs that the rural public health system has at present were recruited under the
NRHM. Most ANMs are younger than permanent ANMs who, in most states, were recruited
back in the 1980s and 1990s. It should be noted that most ANMs are not local residents.
Being an outsider, a new ANM requires time to adapt to her local area, while simultaneously
building a rapport and trust with people.
The results from the PHC- and CHC-level analysis showed that, in general, an increase in the
number of available health workers was associated with increased healthcare service
utilization. However, this increase in service utilization at the CHCs appears to have a limit,
after which the increase in health workers leads to only a negative marginal increase in
service utilization. At the PHC level, there is a progressive increase in the utilization of health
services with an increase in the number of available doctors, nurses, and allied health
workers. The IPHS recommends only two doctors per PHC while in reality, a considerable
number of PHCs have no doctors, and others have three or four workers. Given that the

182
number of doctors at the PHCs results in increased health service utilization, the need of the
hour is to redistribute the current workforce of doctors.
Allied health workers (lab technicians and pharmacists) are an important part of the PHC
workforce, as they support doctors by dispensing proper medicines to patients and by
providing basic laboratory services such as routine blood and urine tests, as well as basic tests
for haemoglobin, TB, malaria, and typhoid, along with those for reproductive tract infections,
pregnancy, syphilis, faecal contamination of water, and so on. However, it is unfortunate that
these services (laboratory and pharmacy) are often given lower priority. PHCs in the country
are still only viewed as centres that carry out preventive care activities, and they are often
seen as mere dispensaries. It is no wonder why about 15% of PHCs in the country do not
offer both of these health functionaries. Laboratory and pharmacy services not only improve
the utilization of health services at PHCs, as shown by the results, but they may also improve
the public’s opinion about PHCs which, in turn, may reduce the patient burden in the CHCs.
At the CHC level, the utilization of services increases as the number of specialists increases,
reaching a peak at a total of six specialists. Deploying more than six specialists at a given
CHC does not seem to improve healthcare service utilization any further. This is an
indication that the specialists at the CHCs should be deployed rationally. This becomes even
more important in light of the fact that a considerable number of CHCs in the country is
functioning without specialists, such as at the PHCs. Overconcentration of the specialist
workforce leads to underutilization of these specialists’ services and skills, while the other
areas where their services are much needed remain unserved. For instance, digging deeper
into the data reveals that the proportion of CHCs with 7 or more specialists is higher in
socioeconomically impoverished states such as Bihar, Orissa, Chhattisgarh, and Madhya
Pradesh. These are also the states where a considerable number of CHCs are currently
functioning without specialists. Therefore, specialists should be rationally deployed across
the CHCs.
As for medical officers, their effect is significant, but only when there are three doctors at a
CHC. This could be an indication of the fact that CHCs usually have one or two general duty
medical officers (about 55%), which are stationed at the CHCs, so they can mainly deal with
administrative work, such as supervising the PHCs and sub-centres in their area. Hence, it is
not surprising that when there are less than three doctors, their effect on health service
utilization is not strong and significant. While the effect of an increase in the number of

183
doctors is growing stronger, it remains insignificant. This finding can be explained by the fact
that most people go to CHCs for specialist services rather than for general health problems.
The IPHS recommends employing 10 staff nurses and one public health nurse, along with an
ANM to provide services at the sub-centres within the CHC premises. Thus, altogether, the
IPHS recommends 12 nurses for each CHC. It just so happens that the results of the analysis
also indicate that increasing the number of nurses beyond 12 does not seem to improve health
service utilization any further. This suggests that providing an excessive number of nurses
may not lead to improvements in the number of service users. Given that about 20% of all
CHCs make do with only three nurses, and about 10% of CHCs have 14 or more nurses, a
redistribution of the existing workforce would be a desirable step to further increase service
utilization.
CHCs are meant to provide specialist services, which involve a number of procedures that
require the help of a radiographer or lab technician (George 2011). A pharmacist is always an
important part of the CHC, as s/he dispenses medicine. Since these personnel are so vital to
the proper functioning of CHCs, it is not surprising that the presence of any of these two
professionals leads to an increase in health service utilization by about 63%. There is a
progressive rise in the volume of service utilization, as more of these workers are added to a
CHC. However, it is also a fact that about 10% of CHCs are still functioning with only one of
these workers, and another 10% are functioning with 6 or more allied health workers.
Therefore, the most pressing need is to increase the number of allied health professionals in
CHCs either by redistributing the existing workforce or by recruiting new workers.
This study also examined the net impact of AYUSH doctors on the utilization of health
services at PHCs with the help of propensity score matching analysis, which is one of the best
possible ways to answer this question, as this method involves constructing an adequate
comparison group. The findings of this study are inconclusive, as the ATTs estimated from
the data did not turn out to be statistically significant, except for the case of male inpatient
services. Hence, not much can be said about the effect of an AYUSH doctor’s deployment on
the utilization of health services at the PHCs. However, if we disregard the statistical
significance for a while and consider only the ATT from the matched sample, it turns out that
the effect of an AYUSH doctor on the volume of service utilization appears to be minuscule.
This is contrary to the general belief that the deployment of an AYUSH doctor, or any doctor,
should ideally lead to an increase in the utilization of health services.

184
Many studies in the past have raised concerns about introducing the cadre of AYUSH
medical officers into the publicly funded health system. Questions have been asked about the
necessity of these doctors, their skills to perform all clinical functions of an allopathic
physician, and their acceptability among the medical community (Albert & Porter 2015).
Some studies have concluded that among the non-clinical practitioners working at PHCs, the
clinical competence of AYUSH doctors is lower than that of the allopathic doctors and rural
medical assistants, as the former are trained for only two years (Rao et al. 2013). The
evidence about the clinical competence of AYUSH doctors has been strengthened further by
a recent study, where the authors found that only half of their prescriptions provided by
AYUSH doctors were appropriate for treating the patients’ medical conditions (Rao et al.
2013).
Some previous studies have argued and demonstrated that deploying AYUSH doctors may
not be an effective strategy to increase healthcare utilization at public health facilities in some
regions of the country where the AYUSH medical system is considered to be an alien system.
For instance, a study from Northeast India, where the majority of the population is
categorised as ‘Scheduled Tribes’, noted that the utilization of AYUSH services in public
health facilities is very low because people are not familiar with AYUSH, and they do not
believe that AYUSH is any better than their own local, tribal, and traditional medicine system
(Albert & Porter 2015).
Studies in the past have noted that when the doctors of two streams are placed in the same
facility, people prefer to see an allopathic doctor rather than an AYUSH doctor. For instance,
one study in West Bengal showed that less than 5% people preferred an AYUSH doctor (Ray
et al. 2011). Apart from their clinical incompetence in allopathic medicine, another reason
why AYUSH doctors are not very popular could be related to the pace with which AYUSH
medications work when compared to allopathic medicines (Chatterjee et al. 2012). In general,
AYUSH medications take a little longer than allopathic medicines to demonstrate an effect
on patients.
The public’s general attitude towards AYUSH medicine is still not good; it has been found
that patients often ask/demand AYUSH doctors to prescribe allopathic medicines rather than
AYUSH medicines (Nambiar et al. 2014; Lakshmi et al. 2015). Many states, however, do not
allow AYUSH practitioners to prescribe allopathic medicines, as this practice is unethical and
against the law (Pillai & Agarwal 2015). The issue of whether AYUSH practitioners should
be allowed to prescribe allopathic medicines and practice primary healthcare is still being
185
debated, and no consensus has emerged thus far. However, it seems that the current
government has finally begun turning the wheels, as they have recently backed the radical
proposal to allow AYUSH doctors to practice allopathic primary healthcare (Vishnoi 2016).
Another problem with AYUSH doctors could be their relatively smaller remunerations, as
well as the contractual nature of their job, which is devoid of job security. In most states,
AYUSH doctors are recruited on a contractual basis to deliver the same amount of services as
permanent allopathic doctors. However, these contracts are often not renewed in a timely
manner. The salaries of contractual AYUSH medical officers in most of these states are well
below that of their contractual allopathic counterparts, let alone when compared with the
salaries of permanent allopathic medical officers. Moreover, the salaries for contractual
AYUSH medical officers are not regularly revised in accordance with pay commission
recommendations (Lakshmi 2012).
With low salaries and no job security, it has been found that healthcare worker motivation is
usually lower than among those who hold a permanent job and receive higher salaries. Low
motivation is often cited as one of the reasons behind absenteeism and lower productivity in
health facilities. It is a fact that absenteeism among doctors in public health facilities is very
high in India (Muralidharan et al. 2011). Such a high absenteeism rate is often the result of
unethical interpersonal arrangements between doctors and higher authorities, where higher
authorities fraudulently document the attendance of the absent medical officer in exchange
for financial considerations, or as part of some other reciprocal arrangement (Lakshmi 2012).
In such situations, a worker is officially ‘available’, but in actuality, s/he is not.
7.5 Conclusions
The purpose of this chapter was to examine whether increasing numbers of health workers
are associated with any rise in healthcare utilization at publicly funded health facilities in
rural India. Another objective was to assess the impact of newly inducted cadres under the
NRHM, i.e. a 2nd ANM and AYUSH medical officer, on healthcare utilization. The results
illustrated that, in general, the increase in health worker availability at rural health facilities
leads to an improvement in health service utilization. However, there is a limit to this effect,
for at a certain point, a negative marginal return sets in. The government should identify
those health facilities where there are excessive numbers of health workers deployed, and
these individuals should be redistributed to where they are most needed: in those facilities
with no or fewer health workers.
186
At the various sub-centres, the effect of having two ANMs, as compared to only one
permanent ANM, on service utilization differs from one service to another. The PSM analysis
suggested that the effect of deploying a 2nd contractual ANM was very small and insignificant
for maternal and child health service utilization, which means that the evidence from the
DLHS-3 is inconclusive. The same is true for AYUSH medical officers as well: the evidence
is inconclusive about AYUSH medical officers’ impact on overall health service utilization.
When a desegregated analysis was conducted, it was still found that the effect of an AYUSH
doctor’s availability was small and insignificant, except for male inpatients. As discussed in
the previous section, both of these cadres are currently facing a number of problems, which
could be the reason why these factors have a minuscule effect on health service utilization.
Since the results from the PSM are inconclusive for most services, more studies are needed in
this direction.
222
8 Chapter 8: Summary and Conclusion
8.1 Introduction
This chapter discusses the summary and implications of the main findings of this study. It
also discusses the limitations of this study. In the end, this chapter presents some suggestions
for future research in this field.
8.2 Summary of the main findings
Although the country has developed a vast network of publicly funded health facilities over
the last seven decades, which cover even the remotest corners of the country, health service
utilization in these facilities is still considerably low. Recognizing this fact, the Government
of India embarked on a national mission, popularly known as the NRHM, to carry out any
necessary architectural corrections in the basic healthcare delivery system through reforms
in various sectors, including human resources for health, in the year 2005. The mission aimed
to operationalise health facilities to meet Indian Public Health Standards, which were first
released in that same year. This task included improving human resource availability at rural
public health facilities to meet the norms established by the IPHS through various measures,
including the recruitment of contractual workers and the utilisation of an existing workforce
of doctors trained in traditional medicine, which is often abbreviated as AYUSH. Ever since
its launch in 2005, the initiative has been under constant scrutiny by academicians,
researchers, and policymakers. However, various studies have mostly focused on how the
NRHM has led improvements in health outcomes – primarily as they relate to maternal and
child health. The question of whether the NRHM has brought about any significant changes
in the availability and distribution of health-related human resources in the rural public health
system has not been adequately dealt with, despite the fact that human resources are
considered a key factor in the success of a healthcare delivery system.
Therefore, the aim of this study was to measure changes in the availability and inequality of
the health workforce’s distribution over a period of 10 years, spanning from 2002 to 2012,
and to account for these sources of inequalities at the sub-national level. The second aim of
this thesis was to explore the factors that affect health worker availability across rural health
facilities. The third aim was to examine the effect of increased health worker availability on
healthcare utilization at the facility level. This study also investigated the effect of new cadres

188
introduced by the NRHM (i.e., a 2nd ANM and an AYUSH doctor) on healthcare utilization at
rural health facilities.
The findings suggest that the average health worker availability at public health facilities has
improved over the study period (2002–2012). However, the shortage of some health workers
still remains considerably high. These health workers include the supervisory cadre (LHV
and MHA) at PHCs, specialists and public health nurses at CHCs, and a 2nd ANM and male
health workers at HSCs. The shortage of doctors at PHCs has remained nearly stagnant. As
expected, the health worker shortages are still higher in the north–central states of Uttar
Pradesh, Bihar, Jharkhand, Chhattisgarh, Madhya Pradesh, Orissa, and Rajasthan. Although
the overall availability of health workers at public health facilities in rural India has
increased, inter-facility inequality in the distribution of health workers at the HSC and CHC
level seems have grown over this period. Specialists and public health nurses are the most
unequally distributed cadres. The results of decomposition revealed that within-state
inequalities and overall inter-facility inequality had considerably more significant effects on
health worker availability than between-state inequalities. However, it was also found that the
contribution of between-state inequalities increased over the study period, which is an
indication that there is growing disparity between the states in terms of health worker
availability.
The finding that overall health worker availability has slightly increased and improved over
the study period suggests that the strategies used to improve the human resource situation
under the NRHM have been somewhat successful. However, the significantly high level of
shortages among certain health workers has shown that more needs to be done to address this
problem. The most glaring shortages exist for specialist doctors, public health nurses, and
supervisory cadres. The fact that a study conducted back in 2009 noted the same findings
highlights that as far as shortages are concerned, not much has changed since that time for
these cadres. Policymakers thus need to devise new ways to improve the availability of these
health workers in public health facilities.
The finding that the shortages are still relatively high in the north–central states of Uttar
Pradesh, Bihar, Jharkhand, Chhattisgarh, Madhya Pradesh, Orissa, and Rajasthan shows that
the changes in these states have been slow. These are the states with the highest fertility and
mortality rates in India. They are also among the poorest and socioeconomically most
disadvantaged states in India. They are in dire need for a health system overhaul, as their
needs are much higher than those in southern and western India, where human development

189
indicators are good. In these regions, the states are relatively more prosperous, and they
spend considerable amounts of resources on their health systems. These finding echo the
tenets of the ‘inverse care law’, which states that the availability of medical care is often
inversely proportional to the needs of the population (Hart 1971). Although the NRHM’s
primary focus has been on 18 relatively less developed states featuring high mortality rates, it
is clear from that even 10 years after the launch of the program, the regional inequalities in
human resource distribution in health services has increased. This suggests the need to correct
such inequalities between states to uphold the principles of territorial and distributive justice
(Kay 2005; Starfield 2011).
The finding that transfer, attachment, and deployment policies are not being properly
implemented is another challenge for the states. A number of states did not have proper
transfer, attachment, and deployment policies during the pre-NRHM period. It is unfortunate
that a number of states still do not have such policies in place (for example, Jharkhand)
(Government of India 2013). It has been found that even in those states where these policies
are in place, they are seldom followed due to excessive political interference (Nandan et al.
2015; Government of Uttarkhand 2009). This study suggests that the misuse of these policies
leads to the unequal distribution of health workers across health facilities. Hence, the
government and policymakers must devise alternative ways to implement these policies in a
more transparent and fair manner.
One significant finding of this study is that those sub-centres that are run solely by a
contractual ANM delivered fewer services than those sub-centers run by a permanent ANM,
despite controlling for other relevant factors. This applies to all three maternal health services
considered in this study. This finding is particularly important because one of the key
strategies of the National Rural Health Mission, which served as an immediate measure to
increase the availability of health workers in publicly funded rural public health facilities, has
been to deploy contractual ANMs instead of recruiting permanent ANMs (Dhingra & Dutta,
2011). It is argued that recruiting contractual ANMs is both convenient and economical for
the government (Prinja et al., 2014). However, this study indicates that this measure, despite
being convenient and economically savvy for the government, does not seem to result in any
substantial improvement in the utilization of maternity services. The results of this study
show that the utilization of maternal healthcare services at HSCs run solely by a contractual
ANM are not at par with those solely run by permanent ANMs. The volume of service
delivery does not rise substantially, even when both ANMs run a sub-centre. These are

190
important findings, and they can have serious implication for government health programs, as
the majority of programs are implemented through ANMs, including a multitude of maternal
and child health programs. (Malik, 2009; Mavalankar & Vora, 2008).
8.3 Implications of the findings
This study has several important implications for human resource planning in the country. I
believe that the implications of my study will contribute to improving the human resource
situation in the country.
Given that 69% of India’s population still lives in rural areas, the health indicators of India as
a whole can only be rectified if the rural populace is provided with a better and more
affordable healthcare system. With its vast network, the rural public health system can play a
significant role in improving the health outcomes if it is equipped with adequate human
resources, essential drugs, equipment, and infrastructure. However, the finding that a great
number of public health facilities are still functioning without health workers even a decade
after the NRHM was launched suggests that more needs to be done in this regard. This
shortage has risen for some important workers since 2004. This may have serious
implications for the coverage of health interventions and health services utilization at health
facilities. The findings also reveal that the progress in most socioeconomically backward
states has been slow during the NRHM period. These observations highlight the need to
strengthen the health workforce by increasing the recruitment of a new workforce and
redistributing the exiting one in rural health facilities, by adopting innovative methods.
Increasing inequalities in health-related human resources may have serious implications for
the overall health of individuals across those states that have not yet been able to catch up. It
has been found that the very states that have been the focus of the NRHM right from the
program’s inception have struggled to improve their health-related human resources in rural
public health facilities. Rising inequalities in health worker distribution across public health
facilities in rural areas could trigger increases in socioeconomic inequalities in patient health
and healthcare overall which, in turn, could have serious micro- and macroeconomic
implications. Therefore, the most pressing need is to improve access to public health facilities
among individuals living in rural areas by improving not only the overall health worker
availability, but also the distribution of health workers, while keeping in view the principles
of territorial justice and horizontal inequality.
191
Most national and state health interventions and programs are implemented through sub-
centres; as such, they need to be equipped with a 2nd ANM, who can reduce the burden of the
existing ANM. While attempts to introduce a 2nd ANM to the sub-centres under the NRHM
have succeeded in about one third of all HSCs, this result is not satisfactory, as it has been
more than 10 years since the program was initially launched. The findings of this study,
especially as they relate to the effects of a 2nd ANM on health service utilization at the sub-
centre level, have shown that although the evidence remains inconclusive, implementation of
a 2nd ANM on the treatment of minor ailments in maternal and child health services is
positive. This suggests that the 2nd ANMs can disburden the first ANM in many ways.
Therefore, the NRHM should expedite the deployment of 2nd ANMs. However, policymakers
and researchers should further investigate why service utilization at those HSCs run by a 2nd
ANM is lower than at those HSCs run by a permanent ANM.
Strengthening PHCs can reduce the burden on community health centres; hence, it is
important to ensure that PHCs have at least one doctor on staff. However, the findings reveal
that the progress in this regard has been slow throughout the course of the NRHM’s
development. About 10% of PHCs are still without doctors, and what is noticeable is that
such PHCs are mostly located in socioeconomically and demographically disadvantaged
states. The NRHM’s attempt to strengthen the workforce of doctors at the PHC level through
the deployment of Ayurvedic, Yoga and Naturopathy, Unani, Siddha, and Homoeopathy
(AYUSH) doctors does not seem to be fruitful. The NRHM also encouraged various states to
place contractual doctors at the PHCs; however, these efforts do not seem to have had much
of an impact on the workforce of doctors at the PHC level. Thus, efforts should be made to
place more doctors at PHCs so that the utilization of services at PHCs could be increased and
burden on CHCs could be reduced so that they can focus on providing specialist services.
One of the main findings in this study is that CHCs in the country are not only suffering from
a severe shortage of specialists, they are also negatively impacted by the deep distributional
inequalities in their existing workforce. The situation has become progressively worse over
the study period. This shortage of specialists has remained stagnant to 80%–85% and the
inequality in their distribution has grown considerably. Decomposition reveals that a large
part of the overall inequality in the distribution of specialists comes from “within”-district
inequality; moreover, the contribution of “within”-district inequality to overall inequality has
steadily grown over time. Therefore, human resources policies across the state need to rethink
their strategies to recruit more specialists and to devise innovative strategies to influence the

192
within-district distribution of specialists to make it more equitable. A high shortage of
specialists across the CHCs may have serious implications for maternal and child mortality,
especially in those states where a considerable proportion of people are poor and rely on
subsidized healthcare in public health facilities (Iyengar & Dholakia 2015).
The results also show that supervisory cadres are facing huge shortages and inequalities
across many states. The lack of a supervisory cadre may have implications for the quality of
services provided at each sub-centre, as these health facilities serve as the first point of
contact between people and the government health system. Similarly, it has been noted that
not much progress has been seen among the availability of male health workers, who are
indispensable to the success of public health programs. Their non-availability could adversely
affect the implementation of many health programs due to the fact that the available ANMs
are overburdened. The introduction of several national health programs for non-
communicable diseases during the 12th five-year plan period also requires the services of
MPHW (male) for their effective implementation at the field level (Ministry of Health and
Family Welfare 2010b). Hence, the central and state governments should take steps to
increase MHW availability in the sub-centres.
8.4 Limitations
This thesis has a few limitations that must be noted. A large portion of the analysis conducted
for this study employed DLHS data. The quality of responses in this dataset could be
questioned. The data were not polished and contained several missing values and data-entry
errors, although these values were carefully removed from the analysis. Readers and users of
the results must be aware of this drawback.
The data from Facility Survey may not be as accurate as it should be because the answers for
several questions related to physical infrastructure were to be recorded by the investigator
himself based on his observations. The investigators were instructed to fill out the
questionnaire with the help of any health worker who was present in the facility on the day of
the survey. Since lower-level health workers generally have limited information about their
facility, the quality of data may not be as good in those facilities where the head of the
facility was not present on the day of the survey.
The data on drug availability and the utilization of various services was to be collected from
registers maintained by the health facility. However, my fieldwork experiences suggested that
193
in many places, data from the registers are frequently not representative of the actual situation
due to corrupt practices.
Since the data used in the study were collected using face-to-face interviews, it is also likely
that the data suffer from the response bias that arose from the inability of respondents to
answer questions accurately, as well as their unwillingness to respond honestly.
Given that the study is based on cross-sectional data, causality cannot be inferred. One needs
to conduct a panel data study to address the issue of reverse causality or temporality. The
analysis does not deal with the healthcare situation post-2013. This is because the unit-level
data on health workers from public health facilities in rural areas spanning from 2013
onwards are not available.
In the regression analysis that was conducted to accomplish the third objective of this thesis
(i.e., to investigate the effect of health worker availability on healthcare utilization at public
health facilities), the analysis did not include any indicators that represent private sector
healthcare service availability in the sub-centre area. It is well known that a considerable
number of individuals in rural areas seek healthcare services at private facilities, arguably due
to the poor quality of services provided in public health facilities. However, due to the lack of
variables on private health facilities in the dataset, the analysis could not control for the use
of private health facilities in the analysis. For the same reason, the study was also not able to
incorporate any variables related to the quality of care provided (such as patient and health
worker behaviour).
All demand-side variables, such as maternal education, total fertility rate, and the proportion
of households in the lowest quintile were calculated at the district-level; therefore, they may
not be truly representative of the population’s characteristics of the very areas that the health
facilities serve in the current study.
The variable ‘number of antenatal registrations’ does not represent the actual number of
antenatal care services provided at the health facilities – a measure that is more important
from a policy perspective.
I should clarify that the qualitative data were collected only from medical officers, ANMs,
and chief medical officers in the district. The data may not have covered the perspectives of
individual cadres, such as nurses or pharmacists. More in-depth information could have been
gathered from higher-level authorities in the government, who often possess a big-picture

194
understanding of how the policies that affect health worker availability or distribution are
prepared and implemented in the state.
I should stress that I felt there was an intentional bias during the interviews, especially with
respect to the chief medical officer’s responses, as he reluctantly discussed only a few issues,
and he also refused to comment on the issue of transfers involving bribery and political clout,
which the other respondents discussed openly.
8.5 Future work
The present study exploited the datasets from the DLHS series to estimate inequalities in
health worker distribution. However, one key limitation of this study is that it did not explore
health worker inequality across districts. Under the NRHM, the devolution of power and
resources has been emphasized; as such, the district is fast becoming the centre where the
majority of decisions are made. From this perspective, a district-level analysis of health
worker inequality for separate states could be undertaken to monitor the impact of NRHM
policies on health worker availability and distribution at the district level.
The present study has limited itself only to examining the availability and inequality of
healthcare workers in public health facilities in rural areas. It would be interesting to extend
this analysis to urban health facilities, such as district hospitals or urban PHCs. Homeopathic
or Ayurveda hospitals located in rural areas were not included in this study. Future studies
can measure the availability and inequality of the healthcare workforce in these hospitals
using data from the DLHS series.
The evidence regarding the effect of a 2nd ANM and an AYUSH doctor on health service
utilization at the HSCs and PHCs was inconclusive in this study. Implementation of these two
health workers represents an important intervention in the public health system under the
NRHM; therefore, this issue needs to be investigated further.
Future studies should also investigate the shortage of other workers in public health facilities,
particularly those who are not considered ‘health workers’, such as wards boys, clerks,
accountants, dressers, and attendants, as the unavailability of these workers can also disrupt
each of the public health facility’s functions.
195
8.6 Conclusion
Summarizing the findings of this study, it can be argued that health worker availability in
public health facilities has only marginally increased. This increase in the availability of
health workers is characterized by rising inequalities in their distribution. The between-state
inequalities have increased or remained stagnant over time, which highlights the growing gap
between states in terms of health worker availability in the rural health system. It is also
important to note that the contribution of within-state inequalities still remains considerably
high, which means that states need to remain focused within their territories to improve this
situation. It was noted that apart from physical infrastructure and basic amenities at the
various health facilities, transfer, attachment and deployment polices, personal choices,
salary, and working environment also affected a health worker’s decision to stay at a given
health facility. The study also found that increased numbers of health workers are generally
associated with increased health service utilization at health facilities. Service utilization was
lower in those HSCs with a 2nd ANM, as compared to those with a permanent ANM, which
represents an open question that future researchers can address. Although this study made an
attempt to assess the impact of AYUSH doctor availability on service utilization, the results
were inconclusive for most services, except for male inpatients services, where an AYUSH
doctor’s presence did increase service utilization. However, there is still a need for further
exploration of this issue.

196
9 References
Acharya, L.B. & Cleland, J., 2000. Maternal and child health services in rural Nepal: does
access or quality matter more? Health policy and planning, 15(2), pp.223–9. Available
at: http://www.ncbi.nlm.nih.gov/pubmed/10837046 [Accessed March 14, 2016].
Ageyi-Baffour, P. et al., 2013. Factors that influence midwifery students in Ghana when
deciding where to practice: a discrete choice experiment. BMC medical education,
13(64). Available at:
http://www.pubmedcentral.nih.gov/articlerender.fcgi?artid=3684532&tool=pmcentrez&
rendertype=abstract [Accessed March 14, 2016].
Agrawal, P.K. et al., 2012. Effect of knowledge of community health workers on essential
newborn health care: a study from rural India. Health policy and planning, 27(2),
pp.115–26. Available at: http://www.ncbi.nlm.nih.gov/pubmed/21385799 [Accessed
August 11, 2016].
Ahmed, S.M. et al., 2011. The health workforce crisis in Bangladesh: shortage, inappropriate
skill-mix and inequitable distribution. Human resources for health, 9(3). Available at:
http://www.pubmedcentral.nih.gov/articlerender.fcgi?artid=3037300&tool=pmcentrez&
rendertype=abstract [Accessed March 10, 2016].
Albert, S. & Porter, J., 2015. Is “ mainstreaming AYUSH ” the right policy for Meghalaya ,
northeast India ? BMC Complementary and Alternative Medicine, 15(288). Available at:
http://dx.doi.org/10.1186/s12906-015-0818-x.
Anand, S. et al., 2008. China’s human resources for health: quantity, quality, and distribution.
Lancet (London, England), 372(9651), pp.1774–81. Available at:
http://www.thelancet.com/article/S014067360861363X/fulltext [Accessed March 9,
2016].
Anand, S., 2010. Measuring health workforce inequalities: Methods and application to China
and India, Geneva, Switzerland. Available at:
http://www.who.int/hrh/resources/observer/en/ [Accessed March 1, 2012].
Anand, S. & Bärnighausen, T., 2004. Human resources and health outcomes: cross-country
econometric study. The Lancet, 364(9445), pp.1603–1609. Available at:
http://www.sciencedirect.com/science/article/pii/S0140673604173133 [Accessed March
5, 2012].
Aneja, S. et al., 2012. Geographic analysis of the radiation oncology workforce. International
journal of radiation oncology, biology, physics, 82(5), pp.1723–9. Available at:
http://www.ncbi.nlm.nih.gov/pubmed/21493013 [Accessed March 10, 2016].
Aneja, S. et al., 2011. US cardiologist workforce from 1995 to 2007: modest growth, lasting
geographic maldistribution especially in rural areas. Health affairs (Project Hope),
30(12), pp.2301–9. Available at:
http://www.pubmedcentral.nih.gov/articlerender.fcgi?artid=3332098&tool=pmcentrez&
rendertype=abstract [Accessed March 10, 2016].
Anyangwe, S.C.E. & Mtonga, C., 2007. Inequities in the global health workforce: the greatest
impediment to health in sub-Saharan Africa. International journal of environmental
research and public health, 4(2), pp.93–100. Available at:
http://www.pubmedcentral.nih.gov/articlerender.fcgi?artid=3728573&tool=pmcentrez&
rendertype=abstract [Accessed March 10, 2016].
197
Araújo, E. & Maeda, A., 2013. How to recruit and retain health workers in rural and remote
areas in developing countries. The World Bank, Washington DC.
Asante, A.D. & Zwi, A.B., 2009. Factors influencing resource allocation decisions and equity
in the health system of Ghana. Public health, 123(5), pp.371–7. Available at:
http://www.ncbi.nlm.nih.gov/pubmed/19364613 [Accessed February 13, 2016].
Asl, I.M. et al., 2015. Distribution of hospital beds in Tehran Province based on Gini
coefficient and Lorenz curve from 2010 to 2012. Electronic physician, 7(8), pp.1653–7.
Available at:
http://www.pubmedcentral.nih.gov/articlerender.fcgi?artid=4725420&tool=pmcentrez&
rendertype=abstract [Accessed March 9, 2016].
Atkinson, A.B., 1970. On the measurement of inequality. Journal of Economic Theory, 2(3),
pp.244–263. Available at:
http://www.sciencedirect.com/science/article/pii/0022053170900396 [Accessed January
21, 2016].
Bahadur, A.S., 2010. National Rural Health Mission: a failing mission. Indian Journal of
Medical Ethics, 7(3), pp.170–171. Available at:
http://www.ijme.in/index.php/ijme/article/view/287/1240 [Accessed March 14, 2016].
Bailey, J., 2008. First steps in qualitative data analysis: transcribing. Family practice, 25(2),
pp.127–31. Available at: http://www.ncbi.nlm.nih.gov/pubmed/18304975 [Accessed
September 17, 2016].
Bajpai, N., Dholakia, R. & Sachs, J., 2008. Scaling up Primary Health Services in Rural
India: Public Investment Requirements and Health Sector Reform. Working paper
Center on Globalization and Sustainable Development, Columbia University.
Bajpai, N., Dholakia, R. & Vynatheya, J., 2013. Increasing the Availability of Skilled Birth in
Rural India, Working Paper No. 9, Columbia Global Centers - South Asia, Columbia
University.
Balarajan, Y. et al., 2011. Health care and equity in India. Lancet, 377(9764), pp.505–15.
Available at: http://linkinghub.elsevier.com/retrieve/pii/S0140673610618946 [Accessed
March 5, 2012].
Banerjee, A., Deaton, A. & Duflo, E., 2004. Health, health care, and economic development:
wealth, health, and health Services in rural Rajasthan. The American Economic Review,
94(2), p.326. Available at: http://www.ncbi.nlm.nih.gov/pubmed/19305517 [Accessed
September 27, 2016].
Barik, D. & Thorat, A., 2015. Issues of Unequal Access to Public Health in India. Frontiers
in public health, 3(245). Available at: http://www.ncbi.nlm.nih.gov/pubmed/26579507
[Accessed September 27, 2016].
Barr, A. et al., 2005. For Public Service Or Money : Understanding Geographical
Imbalances In The Health Workforce, The World Bank. Available at:
http://elibrary.worldbank.org/doi/book/10.1596/1813-9450-3686 [Accessed September
28, 2016].
Bartley, M., 2004. Health Inequality: An Introduction to Theories, Concepts and Methods.
Polity Press: Cambridge.
Basden, D.R., 2008. Monitoring the health workforce: measurement isues and selected tools.
Spotlight on Statistics: A fact file on health workforce statistics, 1(January), pp.1–14.

198
Available at: http://content.apa.org/reviews/018178.
Bazeley, P., 2004. Issues in Mixing Qualitative and Quantitative Approaches to Research. In
R. Buber, J. Gadner, & L. Richards, eds. Applying qualitative methods to marketing
management research. UK: Palgrave Macmillan, pp. 141–156.
Becker, S.O. & Caliendo, M., 2007. mhbounds – Sensitivity Analysis for Average Treatment
Effects, Berlin, Germany. Available at:
https://www.diw.de/documents/publikationen/73/55697/dp659.pdf.
Bernard, H.R., 2013. Social research methods : qualitative and quantitative approaches,
SAGE Publications.
Bhandari, L. & Dutta, S., 2007. Health infrastructure in rural India. In P. Kalra & A. Rastogi,
eds. India Infrastructure Report, 2007. New Delhi: Oxford University Press. Available
at: www.iitk.ac.in/3inetwork/html/reports/IIR2007/11-Health.pdf.
Binnendijk, E., Koren, R. & Dror, D.M., 2012. Hardship financing of healthcare among rural
poor in Orissa, India. BMC health services research, 12(1), p.23. Available at:
http://bmchealthservres.biomedcentral.com/articles/10.1186/1472-6963-12-23
[Accessed February 1, 2016].
Blankart, C.R., 2012. Does healthcare infrastructure have an impact on delay in diagnosis and
survival? Health Policy, 105(2), pp.128–137.
Blumetithal, D.S., 1994. Geographic Imbalances of Physician Supply: An International
Comparison. The Journal of Rural Health, 10(2), pp.109–118. Available at:
http://doi.wiley.com/10.1111/j.1748-0361.1994.tb00217.x [Accessed March 10, 2016].
Bonu, S. et al., 2005. Does use of tobacco or alcohol contribute to impoverishment from
hospitalization costs in India? Health policy and planning, 20(1), pp.41–9. Available at:
http://www.ncbi.nlm.nih.gov/pubmed/15689429 [Accessed March 4, 2016].
Bourguignon, F., 1979. Decomposable income inequality measures. Econometrica: Journal
of the Econometric Society, 47(4), pp.901–920.
Bowling, A., 2009. Research methods in health : Investigating health and health services,
Boyle, M. et al., 2007. A pilot study of workplace violence towards paramedics. Emergency
medicine journal : EMJ, 24(11), pp.760–3. Available at:
http://www.pubmedcentral.nih.gov/articlerender.fcgi?artid=2658319&tool=pmcentrez&
rendertype=abstract [Accessed March 14, 2016].
Braun, V. & Clarke, V., 2006. Using thematic analysis in psychology. Qualitative Research
in Psychology, 3(2), pp.77–101. Available at:
http://www.tandfonline.com/doi/abs/10.1191/1478088706qp063oa [Accessed
September 17, 2016].
Brenner, S. et al., 2014. Design of an impact evaluation using a mixed methods model--an
explanatory assessment of the effects of results-based financing mechanisms on
maternal healthcare services in Malawi. BMC health services research, 14(1), p.180.
Available at: http://bmchealthservres.biomedcentral.com/articles/10.1186/1472-6963-
14-180 [Accessed April 14, 2016].
Brookhart, M.A. et al., 2006. Variable selection for propensity score models. American
Journal of Epidemiology, 163(12), pp.1149–1156. Available at:
http://www.ncbi.nlm.nih.gov/pubmed/16624967 [Accessed September 16, 2016].
Bryman, A., 2006. Integrating quantitative and qualitative research: how is it done?

199
Qualitative Research, 6(1), pp.97–113. Available at:
http://qrj.sagepub.com/cgi/doi/10.1177/1468794106058877 [Accessed September 17,
2016].
Caliendo, M. & Kopeinig, S., 2005. Some Practical Guidance for the Implementation of
Propensity Score Matching, Journal of Economic Surveys, 22(1), pp.31-72.
Camerino, D. et al., 2008. Age-dependent relationships between work ability, thinking of
quitting the job, and actual leaving among Italian nurses: a longitudinal study.
International Journal of Nursing Studies, 45(11), pp.1645-59. Available at:
http://doc.utwente.nl/61665/1/Camerino08age.pdf [Accessed March 14, 2016].
Camerino, D. et al., 2006. Low-perceived work ability, ageing and intention to leave nursing:
a comparison among 10 European countries. Journal of advanced nursing, 56(5),
pp.542–52. Available at: http://www.ncbi.nlm.nih.gov/pubmed/17078829 [Accessed
March 14, 2016].
Cameron, A.C. & Trivedi, P.K., 1998. Regression analysis of count data, Oxford University
Press.
Ceci, S.J., 1990. How Much Does Schooling Influence General Intelligence and Its Cognitive
Components? A Reassessment of the Evidence. Developmental Psychology, 27(5),
pp.703–23. Available at: http://eric.ed.gov/?id=EJ438145 [Accessed April 14, 2016].
Chandra, R., Singh, A. & Mukherjee, S., 2013. A Disaggregated Analysis of Change in
Household Out-Of-Pocket Expenditure on Healthcare in India Out of Pocket expenditure
on health care. International Journal of Public Health Research, 3(1), pp.257–266.
Chang, R.K. & Halfon, N., 1997. Geographic distribution of pediatricians in the United
States: an analysis of the fifty states and Washington, DC. Pediatrics, 100(2 Pt 1),
pp.172–9. Available at: http://www.ncbi.nlm.nih.gov/pubmed/9240795 [Accessed
March 10, 2016].
Chatterjee, B., Biswas, P.C. & Pancholi, J., 2012. Health awareness and popularity of
alternative medicines among people of Jamnagar town: A cross - sectional study. Ayu,
33(1), pp.33–7. Available at: http://www.ncbi.nlm.nih.gov/pubmed/23049181 [Accessed
September 28, 2016].
Chaudhuri, A. et al., 2013. Motivation, compensation and retention of health workforce, New
Delhi. Available at: http://www.swasti.org/images/projects/factsheets/Motivation-
Compensation-Retention of Health Workforce.pdf.
Chen, L. et al., 2004. Human resources for health: overcoming the crisis, Lancet, 364(9449),
pp.1984–1990. Available at:
http://www.sciencedirect.com/science/article/pii/s0140673604174825 [Accessed
February 29, 2012].
Chhea, C., Warren, N. & Manderson, L., 2010. Health worker effectiveness and retention in
rural Cambodia. Rural and remote health, 10(3), p.1391. Available at:
http://www.ncbi.nlm.nih.gov/pubmed/20701412 [Accessed March 14, 2016].
Chimwaza, W. et al., 2014. What makes staff consider leaving the health service in Malawi?
Human resources for health, 12, p.17. Available at:
http://www.pubmedcentral.nih.gov/articlerender.fcgi?artid=3974437&tool=pmcentrez&
rendertype=abstract [Accessed March 14, 2016].
Conceição, P. & Ferreira, P., 2000. The Young Person's Guide to the Theil Index: Suggesting

200
Intuitive Interpretations and Exploring Analytical Applications (February 29, 2000).
UTIP Working Paper No. 14. Available at SSRN: https://ssrn.com/abstract=228703 or
http://dx.doi.org/10.2139/ssrn.228703Texas.
Courtney, K.L., 2005. Visualizing nursing workforce distribution: policy evaluation using
geographic information systems. International journal of medical informatics, 74(11–
12), pp.980–8. Available at:
http://www.sciencedirect.com/science/article/pii/S1386505605001085 [Accessed March
10, 2016].
Creswell, J., 2014. Research design : qualitative, quantitative, and mixed methods
approaches, Sage Publications.
Creswell, J.W., 2014. Research design : qualitative, quantitative, and mixed methods
approaches, Thousand Oaks, CA: SAGE Publications.
Creswell, J.W. & Plano Clark, V.L., 2011. Designing and conducting mixed methods
research, SAGE Publications.
Datar, A., Mukherji, A. & Sood, N., 2007. Health infrastructure & immunization coverage in
rural India. The Indian journal of medical research, 125(1), pp.31–42. Available at:
http://www.ncbi.nlm.nih.gov/pubmed/17332655 [Accessed March 14, 2016].
Davis, K., 1991. Inequality and Access to Health Care. The Milbank Quarterly, 69(2),
pp.253–273.
Denzin, N.K. & Lincoln, Y.S., 2000. Handbook of qualitative research, Sage Publications.
Dhingra, B. & Dutta, A.K., 2011. National Rural Health Mission. Indian Journal of
Pediatrics, 78(12), pp.1520–6. Available at:
http://www.ncbi.nlm.nih.gov/pubmed/21830029 [Accessed May 10, 2016].
Diallo, K. et al., 2003. Monitoring and evaluation of human resources for health: an
international perspective. Human resources for health, 1(3). Available at: http://human-
resources-health.biomedcentral.com/articles/10.1186/1478-4491-1-3 [Accessed
September 27, 2016].
Dieleman, M. et al., 2006. The match between motivation and performance management of
health sector workers in Mali. Human resources for health, 4(2). Available at:
http://www.pubmedcentral.nih.gov/articlerender.fcgi?artid=1402315&tool=pmcentrez&
rendertype=abstract [Accessed March 14, 2016].
Directorate General of Health Services, 2012. Indian Public Health Standards: Guidelines for
Primary Health Centres Revised 2012. Government of India.
Dumont, J.-C. et al., 2008. International mobility of health professionals and health
workforce management in Canada: myths and realities, Paris, France. Available at:
http://www.oecd.org/canada/41590427.pdf [Accessed April 14, 2016].
Dussault, G. & Franceschini, M.C., 2006. Not enough there, too many here: understanding
geographical imbalances in the distribution of the health workforce. Human resources
for health, 4(12). Available at:
http://www.pubmedcentral.nih.gov/articlerender.fcgi?artid=1481612&tool=pmcentrez&
rendertype=abstract [Accessed August 31, 2011].
Ensor, T. & Cooper, S., 2004. Overcoming barriers to health service access: Influencing the
demand side. Health Policy and Planning, 19(2), pp.69–79. Available at:
http://www.ncbi.nlm.nih.gov/pubmed/14982885 [Accessed February 24, 2016].

201
Escarce, J.J. et al., 2000. HMO growth and the geographical redistribution of generalist and
specialist physicians, 1987-1997. Health services research, 35(4), pp.825–48. Available
at:
http://www.pubmedcentral.nih.gov/articlerender.fcgi?artid=1089155&tool=pmcentrez&
rendertype=abstract [Accessed March 10, 2016].
Federal Ministry of Health, 2012. National Human Resources for Health Strategic Plan for
Sudan , 2012-2016. Government of Sudan.
Fóti, K., 2012. Mobility and migration of healthcare workers in central and eastern Europe.
European Foundation for the Improvement of Living and Working Conditions: Dublin.
Available at:
http://digitalcommons.ilr.cornell.edu/cgi/viewcontent.cgi?article=1279&context=intl.
Franco, L.M. et al., 2004. Determinants and consequences of health worker motivation in
hospitals in Jordan and Georgia. Social science & medicine (1982), 58(2), pp.343–55.
Available at: http://www.ncbi.nlm.nih.gov/pubmed/14604620 [Accessed March 14,
2016].
Friss, L., 1994. Nursing studies laid end to end form a circle. Journal of health politics, policy
and law, 19(3), pp.597–631. Available at:
http://www.ncbi.nlm.nih.gov/pubmed/7844324 [Accessed March 11, 2016].
Gardner, W., Mulvey, E.P. & Shaw, E.C., 1995. Regression analyses of counts and rates:
Poisson, overdispersed Poisson, and negative binomial models. Psychological bulletin,
118(3), pp.392–404. Available at: http://www.ncbi.nlm.nih.gov/pubmed/7501743
[Accessed April 9, 2016].
Gastwirth, J.L., 1972. The Estimation of the Lorenz Curve and Gini Index. The Review of
Economics and Statistics, 54(3), pp.306–316. Available at:
http://www.jstor.org/stable/1937992.
George, M., 2011. The role of basic laboratory services in strengthening primary health
centres. Indian journal of medical ethics, 8(3), pp.161–163.
Geravandi, S. et al., 2015. The Assessment of Inequality in the Geographical Distribution of
Burn Beds in Iran. Electronic physician, 7(6), pp.1407–11. Available at:
http://www.pubmedcentral.nih.gov/articlerender.fcgi?artid=4623804&tool=pmcentrez&
rendertype=abstract [Accessed March 9, 2016].
Ghosh, N., Chakrabarti, I. & Chakraborty, M., 2013. Imbalances in health workforce in a
primary health centre of Darjeeling district, West Bengal, India. IOSR Journal of Dental
and Medical Sciences, 8(6), pp.18–22.
Goddard, M. et al., 2010. Where did all the GPs go? Increasing supply and geographical
equity in England and Scotland. Journal of health services research & policy, 15(1),
pp.28–35. Available at: http://www.ncbi.nlm.nih.gov/pubmed/19843638 [Accessed
March 9, 2016].
Goesling, B. & Firebaugh, G., 2004. The Trend in International Health Inequality. Population
and Development Review, 30(1), pp.131–146. Available at:
http://doi.wiley.com/10.1111/j.1728-4457.2004.00006.x [Accessed April 14, 2016].
Goma, F.M. et al., 2014. Evaluation of recruitment and retention strategies for health workers
in rural Zambia. Human resources for health, 12 Suppl 1(1), p.S1. Available at:
http://human-resources-health.biomedcentral.com/articles/10.1186/1478-4491-12-S1-S1
[Accessed March 14, 2016].
202
Gopichandran, V. & Satish Kumar, C., 2012. Mainstreaming AYUSH: an ethical analysis.
Indian journal of medical ethics, 9(4), pp.270–7. Available at:
http://www.ncbi.nlm.nih.gov/pubmed/23099604.
Government of India, 2013. 7th Common Review Mission - Jharkhand, New Delhi.
Government of India, 2006. Indian Public Health Standards, New Delhi. Available at:
http://nrhm.gov.in/nhm/nrhm/guidelines/indian-public-health-standards.html [Accessed
March 4, 2014].
Government of India, 2010a. National AYUSH Mission: Framework for Implimentation,
Government of India, 2010b. Nursing in Bihar: Current situation, requirments and measures
to address shortages, New Delh.
Government of India, 2010c. Nursing Services in Orissa: Current situation, requirments and
measures to address shortages, New Delhi.
Government of India, 2014. Report of the expert group to review methodlogy for
measurement of poverty, New Delhi. Available at:
http://planningcommission.nic.in/reports/genrep/pov_rep0707.pdf.
Government of Kerala, 2003. Job responsibilities of multipurpose health workers in primary
health care institutions in Kerala health services, India.
Government of Punjab, 2010. Recruitment of ANM’s on contractual basis under NRHM in
Punjab.
Government of Uttar Pradesh, 2013. Deployment of multipurpose health worker male against
created number of posts. Available at: http://uphealth.up.nic.in/maleworker_scheme.htm
[Accessed January 3, 2014].
Government of Uttar Pradesh, 2007. Human Development Report, Uttar Pradesh, Lucknow.
Government of Uttar Pradesh, 2016. Training Program for MPW (ANM & MPW Male &
Supervisors). Available at: http://uphealth.up.nic.in/anm_scheme.htm [Accessed April 9,
2016].
Government of Uttarkhand, 2009. Determinants of Workforce Availability and Performance
of Specialists and General Duty Doctors in Health and F . W . Department of
Uttarakhand, New Delhi.
Government of West Bengal, 2013. Advertisement for recruitment of Female Health Assitant
in West Bengal.
Gravelle, H. & Sutton, M., 2001. Inequality in the geographical distribution of general
practitioners in England and Wales 1974-1995. Journal of health services research &
policy, 6(1), pp.6–13. Available at: http://www.ncbi.nlm.nih.gov/pubmed/11219363
[Accessed March 9, 2016].
Greene J, 2007. Mixed methods in social inquiry, Jossey-Bass.
Grobler, L. et al., 2009. Interventions for increasing the proportion of health professionals
practising in rural and other underserved areas. The Cochrane database of systematic
reviews, (1), p.CD005314. Available at:
http://www.ncbi.nlm.nih.gov/pubmed/19160251 [Accessed February 20, 2016].
Grover, A. & Citro, B., 2011. India: Access to affordable drugs and the right to health. The
Lancet, 377(9770), pp.976–977. Available at: http://dx.doi.org/10.1016/S0140-
6736(10)62042-9.

203
Guba, E.G., 1990. The paradigm dialog. Sage Publications. Available at:
http://www.jstor.org/stable/3340973 [Accessed September 17, 2016].
Gujarati, D.N., 2004. Basic Econometrics, McGraw-Hill: Irwin.
Gunst, R.F. & Webster, J.T., 1975. Regression analysis and problems of multicollinearity.
Communications in Statistics, 4(3), pp.277–292. Available at:
http://www.tandfonline.com/doi/abs/10.1080/03610927308827246?src=recsys
[Accessed April 14, 2016].
Gupta, N. et al., 2003. Uses of population census data for monitoring geographical imbalance
in the health workforce: snapshots from three developing countries. International
journal for equity in health, 2(1), p.11. Available at:
http://equityhealthj.biomedcentral.com/articles/10.1186/1475-9276-2-11 [Accessed
March 5, 2016].
Hair, J.F. et al., 1998. Multivariate Data Analysis, Prentice Hall.
Hart, J.T., 1971. The inverse care law. Lancet (London, England), 1(7696), pp.405–12.
Available at: http://www.ncbi.nlm.nih.gov/pubmed/4100731 [Accessed February 16,
2016].
Hashim Nainar, S.M. & Feigal, R.J., 2004. Geographic Distribution of Pediatric Dentists in
Private Practice in the United States. Pediatric Dentistry, 26(6), pp.526–529. Available
at: http://www.ingentaconnect.com/content/aapd/pd/2004/00000026/00000006/art00010
[Accessed March 10, 2016].
Hayes, L.J. et al., 2012. Nurse turnover: a literature review - an update. International journal
of nursing studies, 49(7), pp.887–905. Available at:
http://www.ncbi.nlm.nih.gov/pubmed/22019402 [Accessed August 6, 2015].
Hazarika, I., 2013. Health workforce in India: assessment of availability, production and
distribution. WHO South-East Asia Journal of Public Health, 2(2), p.106. Available at:
http://www.who-seajph.org/article.asp?issn=2224-
3151;year=2013;volume=2;issue=2;spage=106;epage=112;aulast=Hazarika [Accessed
February 20, 2016].
Van den Heede, K. et al., 2013. Effective strategies for nurse retention in acute hospitals: a
mixed method study. International journal of nursing studies, 50(2), pp.185–94.
Available at:
http://www.journalofnursingstudies.com/article/S0020748911004640/fulltext [Accessed
January 29, 2016].
Hicks, L.L. & Glenn, J.K., 1989. Too many physicians in the wrong places and specialties?
Populations and physicians from a market perspective. Journal of health care marketing,
9(4), pp.18–26. Available at: http://www.ncbi.nlm.nih.gov/pubmed/10304170 [Accessed
March 10, 2016].
Hogan, M.C. et al., 2010. Maternal mortality for 181 countries, 1980-2008: a systematic
analysis of progress towards Millennium Development Goal 5. Lancet (London,
England), 375(9726), pp.1609–23. Available at:
http://www.sciencedirect.com/science/article/pii/S0140673610605181 [Accessed
February 18, 2016].
Hong, R., Montana, L. & Mishra, V., 2006. Family planning services quality as a determinant
of use of IUD in Egypt. BMC health services research, 6, p.79. Available at:
http://www.pubmedcentral.nih.gov/articlerender.fcgi?artid=1553443&tool=pmcentrez&

204
rendertype=abstract [Accessed March 14, 2016].
Hongoro, C. & McPake, B., 2004. How to bridge the gap in human resources for health.
Lancet, 364(9443), pp.1451–6. Available at:
http://www.ncbi.nlm.nih.gov/pubmed/15488222 [Accessed February 15, 2016].
Horev, T., Pesis-Katz, I. & Mukamel, D.B., 2004. Trends in geographic disparities in
allocation of health care resources in the US. Health policy (Amsterdam, Netherlands),
68(2), pp.223–32. Available at: http://www.ncbi.nlm.nih.gov/pubmed/15063021
[Accessed March 9, 2016].
Hossain, B. & Begum, K., 1998. Survey of the existing health workforce of Ministry of
Health, Bangladesh. Human Resources for Health Development Journal, 29, pp.109–
116.
Hounton, S. et al., 2008. Effects of a Skilled Care Initiative on pregnancy-related mortality in
rural Burkina Faso. Tropical medicine & international health : TM & IH, 13(1), pp.53–
60. Available at: http://www.ncbi.nlm.nih.gov/pubmed/18578812 [Accessed March 4,
2016].
International Institute for Population Sciences, 2010. District Level Household and Facility
Survey (DLHS-3), 2007-2008, Mumbai.
Isabel, C. & Paula, V., 2010. Geographic distribution of physicians in Portugal. The
European journal of health economics : HEPAC : health economics in prevention and
care, 11(4), pp.383–93. Available at: http://www.ncbi.nlm.nih.gov/pubmed/20012127
[Accessed March 9, 2016].
Iyengar, S. & Dholakia, R.H.., 2015. Specialist Services in the Indian Rural Public Health
System for Maternal and Child Healthcare – A Study of Four States, Ahmedabad.
Jenkins, S., 2015. INEQDECO: Stata module to calculate inequality indices with
decomposition by subgroup. Statistical Software Components. Available at:
https://ideas.repec.org/c/boc/bocode/s366002.html [Accessed September 16, 2016].
Jin, J. et al., 2015. Equality of Medical Health Resource Allocation in China Based on the
Gini Coefficient Method. Iranian journal of public health, 44(4), pp.445–57. Available
at:
http://www.pubmedcentral.nih.gov/articlerender.fcgi?artid=4441957&tool=pmcentrez&
rendertype=abstract [Accessed March 9, 2016].
Jindal, A.K., 2014. Universal health coverage: the way forward. Indian journal of public
health, 58(3), pp.161–7. Available at: http://www.ijph.in/article.asp?issn=0019-
557X;year=2014;volume=58;issue=3;spage=161;epage=167;aulast=Jindal [Accessed
March 4, 2016].
Kadam, S. et al., 2012. Assessment of factors influencing retention of health workforce in
rural and remote areas of Odisha, India. BMC Proceedings, 6(Suppl 5), p.O4. Available
at: http://bmcproc.biomedcentral.com/articles/10.1186/1753-6561-6-S5-O4 [Accessed
March 14, 2016].
Kanchanachitra, C. et al., 2011. Human resources for health in southeast Asia: shortages,
distributional challenges, and international trade in health services. Lancet (London,
England), 377(9767), pp.769–81. Available at:
http://www.ncbi.nlm.nih.gov/pubmed/21269674 [Accessed March 14, 2016].
Kay, A., 2005. Territorial Justice and Devolution. The British Journal of Politics and

205
International Relations, 7(4), pp.544–560. Available at:
http://bpi.sagepub.com/lookup/doi/10.1111/j.1467-856x.2005.00200.x [Accessed
September 25, 2016].
Kesterton, A.J. et al., 2010. Institutional delivery in rural India: the relative importance of
accessibility and economic status. BMC pregnancy and childbirth, 10(1), p.30.
Available at: http://bmcpregnancychildbirth.biomedcentral.com/articles/10.1186/1471-
2393-10-30 [Accessed March 12, 2016].
Kingma, M., 2001. Nursing migration: global treasure hunt or disaster-in-the-making?
Nursing inquiry, 8(4), pp.205–12. Available at:
http://www.ncbi.nlm.nih.gov/pubmed/11844042 [Accessed March 7, 2016].
Kinnick, M.K. & Kempner, K., 1988. Beyond ?front door? access: Attaining the bachelor’s
degree. Research in Higher Education, 29(4), pp.299–318. Available at:
http://link.springer.com/10.1007/BF00992773 [Accessed April 14, 2016].
Kirkwood, M.K. et al., 2014. Enhancing the American Society of Clinical Oncology
workforce information system with geographic distribution of oncologists and
comparison of data sources for the number of practicing oncologists. Journal of
oncology practice / American Society of Clinical Oncology, 10(1), pp.32–8. Available
at: http://www.ncbi.nlm.nih.gov/pubmed/24443732 [Accessed March 10, 2016].
Kotzee, T. & Couper, I., 2006. What interventions do South African qualified doctors think
will retain them in rural hospitals of the Limpopo province of South Africa. Rural
Remote Health, 6(581).
Krause, D., Frate, D.A. & May, W.L., 2005. Demographics and distribution of dentists in
Mississippi. The Journal of the American Dental Association, 136(5), pp.668–677.
Available at: http://www.sciencedirect.com/science/article/pii/S0002817714609533
[Accessed March 10, 2016].
Krishnan, V., 1992. A macro model of change in specialty and spatial distribution of
physicians in Canada, 1971-1981. Socio-economic planning sciences, 26(2), pp.111–27.
Available at: http://www.ncbi.nlm.nih.gov/pubmed/10121713 [Accessed March 10,
2016].
Kruk, M.E. et al., 2009. Are doctors and nurses associated with coverage of essential health
services in developing countries? A cross-sectional study. Human resources for health,
7(1), p.27. Available at: http://human-resources-
health.biomedcentral.com/articles/10.1186/1478-4491-7-27 [Accessed March 14, 2016].
Kruk, M.E. et al., 2010. Rural practice preferences among medical students in Ghana: a
discrete choice experiment. Bulletin of the World Health Organization, 88(5), pp.333–
41.
Krupp, K. & Madhivanan, P., 2009. Leveraging human capital to reduce maternal mortality
in India: enhanced public health system or public-private partnership? Human resources
for health, 7, p.18.
Kumar, A. & Mohanty, S.K., 2011. Intra-urban differentials in the utilization of reproductive
healthcare in India, 1992-2006. Journal of urban health : bulletin of the New York
Academy of Medicine, 88(2), pp.311–28. Available at:
http://www.pubmedcentral.nih.gov/articlerender.fcgi?artid=3079032&tool=pmcentrez&
rendertype=abstract [Accessed February 25, 2016].
Kumar, A. & Singh, A., 2013. Decomposing the gap in childhood undernutrition between

206
poor and non-poor in urban India, 2005-06. PloS one, 8(5), p.e64972. Available at:
http://journals.plos.org/plosone/article?id=10.1371/journal.pone.0064972 [Accessed
March 4, 2016].
Kumar, A. & Singh, A., 2015. Explaining the gap in the use of maternal healthcare services
between social groups in India. Journal of public health (Oxford, England), p.fdv142-.
Available at:
http://jpubhealth.oxfordjournals.org/content/early/2015/12/11/pubmed.fdv142.abstract
[Accessed March 4, 2016].
Kumar, P. et al., 2014. A comparative study of job satisfaction among regular and staff on
contract in the primary health care system in Delhi, India. Journal of family &
community medicine, 21(2), pp.112–8. Available at:
http://www.pubmedcentral.nih.gov/articlerender.fcgi?artid=4073559&tool=pmcentrez&
rendertype=abstract [Accessed March 4, 2016].
Kumar, P. et al., 2013. Job satisfaction of primary health-care providers (public sector) in
urban setting. Journal of family medicine and primary care, 2(3), pp.227–33. Available
at:
http://www.pubmedcentral.nih.gov/articlerender.fcgi?artid=3902677&tool=pmcentrez&
rendertype=abstract [Accessed March 4, 2016].
Kumar, S. et al., 2014. Supply-side barriers to maternity-care in India: a facility-based
analysis. W. A. Carlo, ed. PloS one, 9(8), p.e103927. Available at:
http://dx.plos.org/10.1371/journal.pone.0103927 [Accessed April 6, 2016].
Kumar, S. & Prakash, N., 2013. Impact of the Village Health and Sanitation Committee on
health-care utilisation: findings from propensity score matching in India. The Lancet,
381, p.S77. Available at:
http://linkinghub.elsevier.com/retrieve/pii/S0140673613613318 [Accessed August 2,
2016].
Lakshmi, J.K. et al., 2015. Cultural consonance, constructions of science and co-existence: A
review of the integration of traditional, complementary and alternative medicine in low-
and middle-income countries. Health Policy and Planning, 30(8), pp.1067–1077.
Lakshmi, J.K., 2012. Less equal than others ? Experiences of AYUSH medical officers in
primary health centres in Andhra Pradesh. Indian Journal of Medical Ethics, IX(1),
pp.18–21.
Lambert, P.J. & Aronson, J.R., 1993. Inequality Decomposition Analysis and the Gini
Coefficient Revisited. The Economic Journal, 103(420), pp.1221–1227.
Land, K.C., McCall, P.L. & Nagin, D.S., 1996. A Comparison of Poisson, Negative
Binomial, and Semiparametric Mixed Poisson Regression Models: With Empirical
Applications to Criminal Careers Data. Sociological Methods & Research, 24(4),
pp.387–442. Available at: http://smr.sagepub.com/content/24/4/387 [Accessed April 9,
2016].
Langwell, K. et al., 1980. Geographic distribution of certified nurse-midwives. Journal of
Nurse-Midwifery, 25(6), pp.3–11. Available at:
http://www.sciencedirect.com/science/article/pii/0091218280900919 [Accessed March
10, 2016].
Lehmann, U., Dieleman, M. & Martineau, T., 2008a. Staffing remote rural areas in middle-
and low-income countries: a literature review of attraction and retention. BMC health

207
services research, 8(19). Available at:
http://www.pubmedcentral.nih.gov/articlerender.fcgi?artid=2259330&tool=pmcentrez&
rendertype=abstract [Accessed March 4, 2016].
Leive, A. & Xu, K., 2008. Coping with out-of-pocket health payments: empirical evidence
from 15 African countries. Bulletin of the World Health Organization. Available at:
http://www.who.int/bulletin/volumes/86/11/07-049403/en/ [Accessed March 4, 2016].
Leuven, E. & Sianesi, B., 2003. PSMATCH2: Stata module to perform full Mahalanobis and
Propensity Score Matching, version 1.2. 1. Statistical Software Components. Available
at: https://ideas.repec.org/c/boc/bocode/s432001.html [Accessed September 16, 2016].
Lin, G., Burns, P.A. & Nochajski, T.H., 1997. The geographic distribution of nurse
practitioners in the United States. Applied Geographic Studies, 1(4), pp.287–301.
Available at: http://deepblue.lib.umich.edu/handle/2027.42/35206 [Accessed March 10,
2016].
Lisam, S. et al., 2015. Strategies for attraction and retention of health workers in remote and
difficult-to-access areas of Chhattisgarh, India: Do they work? Indian journal of public
health, 59(3), pp.189–95. Available at: http://www.ncbi.nlm.nih.gov/pubmed/26354394
[Accessed March 4, 2016].
Lo, E.C. & Wong, M.C., 1999. Geographic distribution of private dentists in Hong Kong in
1989 and 1998. British Dental Journal, 186(4), pp.172–173. Available at:
http://www.ncbi.nlm.nih.gov/entrez/query.fcgi?cmd=Retrieve&db=PubMed&dopt=Citat
ion&list_uids=10205953.
Lopes, S.C., Cabral, A.J. & de Sousa, B., 2014. Community health workers: to train or to
restrain? A longitudinal survey to assess the impact of training community health
workers in the Bolama Region, Guinea-Bissau. Human resources for health, 12(1), p.8.
Available at: http://human-resources-health.biomedcentral.com/articles/10.1186/1478-
4491-12-8 [Accessed March 15, 2016].
Luo, J. et al., 2009. Inequality of access to health care among the urban elderly in
northwestern China. Health Policy, 93(2–3), pp.111–117.
Luo, Z., Gardiner, J.C. & Bradley, C.J., 2010. Applying propensity score methods in medical
research: pitfalls and prospects. Medical Care Research and Review, 67(5), pp.528–54.
Available at: http://www.ncbi.nlm.nih.gov/pubmed/20442340 [Accessed September 16,
2016].
Magadi, M.A., Madise, N.J. & Rodrigues, R.N., 2000. Frequency and timing of antenatal
care in Kenya: explaining the variations between women of different communities.
Social science & medicine (1982), 51(4), pp.551–61. Available at:
http://www.ncbi.nlm.nih.gov/pubmed/10868670 [Accessed March 14, 2016].
Malik, G., 2009. Role of Auxiliary Nurse Midwives in National Rural Health Mission. The
Nusing Journal of India, C(3). Available at: http://www.tnaionline.org/april-09/8.htm
[Accessed March 15, 2016].
Manongi, R.N., Marchant, T.C. & Bygbjerg, I.C., 2006. Improving motivation among
primary health care workers in Tanzania: a health worker perspective. Human resources
for health, 4, p.6. Available at:
http://www.pubmedcentral.nih.gov/articlerender.fcgi?artid=1450300&tool=pmcentrez&
rendertype=abstract [Accessed March 3, 2016].
Mantzavinis, G. et al., 2003. Geographical inequalities in the distribution of general

208
practitioners in Sweden. Lakartidningen, 100(51–52), pp.4294–7. Available at:
http://www.ncbi.nlm.nih.gov/pubmed/14756094 [Accessed March 9, 2016].
Mathauer, I. & Imhoff, I., 2006. Health worker motivation in Africa: the role of non-financial
incentives and human resource management tools. Human resources for health, 4, p.24.
Available at:
http://www.pubmedcentral.nih.gov/articlerender.fcgi?artid=1592506&tool=pmcentrez&
rendertype=abstract [Accessed March 14, 2016].
Matsumoto, M. et al., 2015. Geographic Distribution of Radiologists and Utilization of
Teleradiology in Japan: A Longitudinal Analysis Based on National Census Data. PloS
one, 10(9), p.e0139723. Available at:
http://www.pubmedcentral.nih.gov/articlerender.fcgi?artid=4589480&tool=pmcentrez&
rendertype=abstract [Accessed March 10, 2016].
Matsumoto, M., Inoue, K., Bowman, R., Noguchi, S., et al., 2010. Geographical distributions
of physicians in Japan and US: Impact of healthcare system on physician dispersal
pattern. Health policy (Amsterdam, Netherlands), 96(3), pp.255–61. Available at:
http://www.ncbi.nlm.nih.gov/pubmed/20236722 [Accessed March 10, 2016].
Matsumoto, M., Inoue, K., Bowman, R. & Kajii, E., 2010. Self-employment, specialty
choice, and geographical distribution of physicians in Japan: A comparison with the
United States. Health policy (Amsterdam, Netherlands), 96(3), pp.239–44. Available at:
http://www.ncbi.nlm.nih.gov/pubmed/20223549 [Accessed March 10, 2016].
Medical Council of India, 2016. List of Colleges Teaching PG Courses. Available at:
http://www.mciindia.org/InformationDesk/ForStudents/ListofCollegesTeachingPGCour
ses.aspx [Accessed April 29, 2016].
Merriam, S.B., 2009. Qualitative research : a guide to design and implementation. Jossey-
Bass.
Meskarpour-Amiri, M. et al., 2014. Assessment the trend of inequality in the distribution of
intensive care beds in Iran: using GINI index. Global journal of health science, 6(6),
pp.28–36. Available at: http://www.ncbi.nlm.nih.gov/pubmed/25363104 [Accessed
March 9, 2016].
Metcalfe, R. & Adegoke, A.A., 2013. Strategies to increase facility-based skilled birth
attendance in South Asia: a literature review. International health, 5(2), pp.96–105.
Available at: http://www.ncbi.nlm.nih.gov/pubmed/24030109 [Accessed March 14,
2016].
Mick, S.S., Lee, S.Y. & Wodchis, W.P., 2000. Variations in geographical distribution of
foreign and domestically trained physicians in the United States: “safety nets” or
“surplus exacerbation”? Social science & medicine (1982), 50(2), pp.185–202.
Available at: http://www.ncbi.nlm.nih.gov/pubmed/10619689 [Accessed March 10,
2016].
Ministry of Health and Family Welfare, 2009. 3rd Common Review Mission Uttar Pradesh,
New Delhi.
Ministry of Health and Family Welfare, 2010a. 4th Common Review Mission Report for
Uttar Pradesh, Available at:
nhsrcindia.org/pdf_files/resources_thematic/Health.../226.pdf.
Ministry of Health and Family Welfare, 2012a. 6th Common Review Mission: West Bengal,
New Delhi.

209
Ministry of Health and Family Welfare, 2012b. 6th Common Review Mission Bihar, New
Delhi.
Ministry of Health and Family Welfare, 2012c. 6th Common Review Mission Report, New
Delhi.
Ministry of Health and Family Welfare, 2012d. 6th Common Review Mission Report: Uttar
Pradesh, New Delhi.
Ministry of Health and Family Welfare, 2012e. 6th Common Review Mission Uttar Pradesh,
New Delhi.
Ministry of Health and Family Welfare, 2013a. 7th Common Review Mission To Arunachal
Pradesh, New Delhi.
Ministry of Health and Family Welfare, 2012f. Approval of State Programme Implementation
Plan of NRHM : Jharkhand, New Delhi.
Ministry of Health and Family Welfare, 2010b. Guidelines For Multipurpose Health Worker (
Male ) Government of India.
Ministry of Health and Family Welfare, 2012g. Indian Public Health Standards: Guidelines
for Community Health Centres Revised 2012. Available at:
http://health.bih.nic.in/docs/guidelines/guidelines-community-health-centres.pdf.
Ministry of Health and Family Welfare, 2012h. Indian Public Health Standards (IPHS):
Guidelines for Sub-Centres Revised 2012, New Delhi.
Ministry of Health and Family Welfare, 2014a. Infant, Child and Maternal Mortality Rate:
2009-2012. Available at: http://pib.nic.in/newsite/PrintRelease.aspx?relid=106438
[Accessed March 15, 2016].
Ministry of Health and Family Welfare, 2011. Kerala: 6th Common Review Mission Report.,
New Delhi.
Ministry of Health and Family Welfare, 2013b. Report of the Sevent Common Review
Mission Haryana, New Delhi.
Ministry of Health and Family Welfare, 2013c. Report of the Seventh Common Review
Mission Andhra Pradesh, New Delhi.
Ministry of Health and Family Welfare, 2013d. Report of the Seventh Common Review
Mission Himachal Pradesh, New Delhi.
Ministry of Health and Family Welfare, 2013e. Report of the Seventh Common Review
Mission Jharkhand, New Delhi.
Ministry of Health and Family Welfare, 2012i. Report of the Sixth Common Review Mission
Assam, New Delhi.
Ministry of Health and Family Welfare, 2014b. Rural Health Statistics 2014-15, New Delhi.
Ministry of Health and Family Welfare, 2012j. VI CRM Report – Tamil Nadu, New Delhi.
Mitchell, A.D. et al., 2008. Health worker densities and immunization coverage in Turkey: a
panel data analysis. Human resources for health, 6, p.29. Available at:
http://www.pubmedcentral.nih.gov/articlerender.fcgi?artid=2631449&tool=pmcentrez&
rendertype=abstract [Accessed December 4, 2011].
Modi, V., 2005. Improving electricity services in rural India, New York, USA.
210
MOHFW (GOI), 2013. 7th Common Review Mission Report: Uttar Pradesh, New Delhi.
Available at: http://nrhm.gov.in/images/pdf/monitoring/crm/7th-
crm/report/7th_CRM_Report_UP.pdf.
Morell, A.L. et al., 2014. Attraction, recruitment and distribution of health professionals in
rural and remote Australia: early results of the Rural Health Professionals Program.
Human resources for health, 12(1), p.15. Available at: http://human-resources-
health.biomedcentral.com/articles/10.1186/1478-4491-12-15 [Accessed March 14,
2016].
Morgan, D.L., 2007. Paradigms Lost and Pragmatism Regained: Methodological Implications
of Combining Qualitative and Quantitative Methods. Journal of Mixed Methods
Research, 1(1), pp.48–76. Available at:
http://mmr.sagepub.com/cgi/doi/10.1177/2345678906292462 [Accessed September 17,
2016].
Morgan, D.L., 1998. Practical strategies for combining qualitative and quantitative methods:
applications to health research. Qualitative health research, 8(3), pp.362–376. Available
at: http://www.ncbi.nlm.nih.gov/pubmed/10558337 [Accessed September 17, 2016].
Morris, S., Sutton, M. & Gravelle, H., 2005. Inequity and inequality in the use of health care
in England: An empirical investigation. Social Science and Medicine, 60(6), pp.1251–
1266.
Morse, J.M., 1991. Approaches to qualitative-quantitative methodological triangulation.
Nursing research, 40(2), pp.120–123. Available at:
http://www.ncbi.nlm.nih.gov/pubmed/2003072 [Accessed September 17, 2016].
Mugisha, F. & Nabyonga, J., 2009. Human resources and institutional deliveries in districts
of Uganda.
Munga, M.A., Maestad, O. & Mæstad, O., 2009. Measuring inequalities in the distribution of
health workers: the case of Tanzania. Human resources for health, 7(1), p.4. Available
at: http://human-resources-health.biomedcentral.com/articles/10.1186/1478-4491-7-4
[Accessed February 29, 2012].
Muralidharan, K. et al., 2011. Is There a Doctor in the House? Medical Worker Absence in
India. Harvard University. Available at: http://www.hrhresourcecenter.org/node/3964.
Nambiar, D., 2012. A comparison of data sources and models to project HRH needs in India:
lessons from the universal health coverage planning process. BMC Proceedings, 6(Suppl
5). Available at: http://www.ncbi.nlm.nih.gov/pmc/articles/PMC3467599/ [Accessed
March 4, 2016].
Nambiar, D. et al., 2014. Experiences and meanings of integration of TCAM (Traditional,
Complementary and Alternative Medical) providers in three Indian states: results from a
cross-sectional, qualitative implementation research study. BMJ open, 4(11), p.e005203.
Available at: http://bmjopen.bmj.com/content/4/11/e005203.short.
Nandan, D. et al., 2015. Assessment of Nursing Management Capacity in Uttar Pradesh.
Government of India: New Delhi. Available at: http://nihfw.org/pdf/Nsg Study-
Web/Uttar Pradesh Report.pdf.
Nandan, D. & Agarwal, D., 2012. Human resources for health in India: urgent need for
reforms. Indian journal of community medicine : official publication of Indian
Association of Preventive & Social Medicine, 37(4), pp.205–6. Available at:
http://www.pubmedcentral.nih.gov/articlerender.fcgi?artid=3531009&tool=pmcentrez&

211
rendertype=abstract [Accessed March 4, 2016].
National Health System Reseource Centre, 2012a. Arunachal Pradesh : Public Health
Workforce – Issues and Challenges, Guwahati.
National Health System Reseource Centre, 2012b. Tamil Nadu: Public health workforce -
issues and challenges, New Delhi.
National Rural Health Mission, 2012. Facility Wise Deployment of contractual Staff engaged
under NRHM in District Kuruksehtra. Government of Haryana.
Navaneetham, K. & Dharmalingam, A., 2002. Utilization of maternal health care services in
Southern India. Social Science and Medicine, 55(10), pp.1849–1869.
Newman, C.J. et al., 2011. Workplace violence and gender discrimination in Rwanda’s health
workforce: Increasing safety and gender equality. Human resources for health, 9(19).
Available at:
http://www.pubmedcentral.nih.gov/articlerender.fcgi?artid=3154143&tool=pmcentrez&
rendertype=abstract [Accessed February 24, 2016].
Nigenda, G. & Machado, M.H., 2000. From state to market: the Nicaraguan labour market
for health personnel. Health policy and planning, 15(3), pp.312–8. Available at:
http://www.ncbi.nlm.nih.gov/pubmed/11012406.
Nishiura, H. et al., 2004. Health inequalities in Thailand: geographic distribution of medical
supplies in the provinces. The Southeast Asian journal of tropical medicine and public
health, 35(3), pp.735–40. Available at: http://www.ncbi.nlm.nih.gov/pubmed/15689097
[Accessed March 10, 2016].
O’brien, R.M., 2007. A caution regarding rules of thumb for variance inflation factors.
Quality & Quantity, 41(5), pp.673–690. Available at:
http://link.springer.com/10.1007/s11135-006-9018-6 [Accessed October 16, 2014].
O’Donnell, O., 2007. Access to health care in developing countries: breaking down demand
side barriers. Cadernos de saude publica, 23(12), pp.2820–34. Available at:
http://www.ncbi.nlm.nih.gov/pubmed/18157324 [Accessed March 14, 2016].
Office of Registrar General of India, 2011. Annual Health Survey 2011-12, New Delhi.
Available at:
http://www.censusindia.gov.in/vital_statistics/AHSBulletins/AHS_Factsheets_2011_12.
html [Accessed March 14, 2016].
Ogilvie, L. et al., 2007. The exodus of health professionals from sub-Saharan Africa:
Balancing human rights and societal needs in the twenty-first century. Nursing Inquiry,
14(2), pp.114–124.
Ojakaa, D. et al., 2014. Factors affecting motivation and retention of primary health care
workers in three disparate regions in Kenya. Human resources for health, 12(1), p.33.
Available at: http://human-resources-health.biomedcentral.com/articles/10.1186/1478-
4491-12-33 [Accessed March 14, 2016].
Olsen, Ø.E., Ndeki, S. & Norheim, O.F., 2005. Human resources for emergency obstetric
care in northern Tanzania: distribution of quantity or quality? Human resources for
health, 3, p.5. Available at:
http://www.pubmedcentral.nih.gov/articlerender.fcgi?artid=1199615&tool=pmcentrez&
rendertype=abstract [Accessed March 3, 2016].
Omrani-Khoo, H. et al., 2013. Equity in Distribution of Health Care Resources; Assessment
212
of Need and Access, Using Three Practical Indicators. Iranian journal of public health,
42(11), pp.1299–308. Available at:
http://www.pubmedcentral.nih.gov/articlerender.fcgi?artid=4499072&tool=pmcentrez&
rendertype=abstract [Accessed March 9, 2016].
Opie, T. et al., 2010. Trends in Workplace Violence in the Remote Area Nursing Workforce.
Australian Journal of Advanced Nursing, The, 27(4), p.18. Available at:
http://search.informit.com.au/documentSummary;dn=207404584689045;res=IELHEA
[Accessed March 14, 2016].
ORGI, 2011. Provisional Population Totals Paper 1 of 2011 India Series 1. Census of India
Website. Available at: http://censusindia.gov.in/2011-prov-
results/prov_results_paper1_india.html [Accessed March 4, 2014].
Orkin, F.K., 1976. Analysis of the geographical distribution of anesthesia manpower in the
United States. Anesthesiology, 45(6), pp.592–603. Available at:
http://europepmc.org/abstract/med/984476 [Accessed March 10, 2016].
Pallikadavath, S. et al., 2013. Human resource inequalities at the base of India’s public health
care system. Health & place, 23, pp.26–32. Available at:
http://www.sciencedirect.com/science/article/pii/S1353829213000725 [Accessed March
4, 2016].
Pallikadavath, S., Foss, M. & Stones, R.W., 2004. Antenatal care: Provision and inequality in
rural north India. Social Science and Medicine, 59(6), pp.1147–1158.
Pathak, P.K. & Mohanty, S.K., 2010. Does the safe-motherhood programme reach the poor in
Uttar Pradesh, India? Asian Population Studies, 6(2), pp.173–191. Available at:
http://www.tandfonline.com/doi/abs/10.1080/17441730.2010.494444 [Accessed March
9, 2016].
Pathak, P.K., Singh, A. & Subramanian, S. V, 2010. Economic inequalities in maternal health
care: prenatal care and skilled birth attendance in India, 1992-2006. PloS one, 5(10),
p.e13593. Available at:
http://journals.plos.org/plosone/article?id=10.1371/journal.pone.0013593 [Accessed
March 4, 2016].
Patwardhan, B., 2011. Planned progress for health. Journal of Ayurveda and Integrative
Medicine, 2(4), p.161. Available at: http://www.ncbi.nlm.nih.gov/pubmed/22253502
[Accessed September 28, 2016].
Paul, V.K. et al., 2011. Reproductive health, and child health and nutrition in India: meeting
the challenge. The Lancet, 377(9762), pp.332–349.
Peters, D.H. et al., 2010. Job satisfaction and motivation of health workers in public and
private sectors: cross-sectional analysis from two Indian states. Human resources for
health, 8, p.27. Available at:
http://www.pubmedcentral.nih.gov/articlerender.fcgi?artid=3003185&tool=pmcentrez&
rendertype=abstract [Accessed March 14, 2016].
Peters, D.H. et al., 2008. Poverty and access to health care in developing countries. Annals of
the New York Academy of Sciences, 1136(1), pp.161–71. Available at:
http://doi.wiley.com/10.1196/annals.1425.011 [Accessed October 1, 2015].
Phiri, M., 2007. Investing in Human Resources for Health to Attain the Health MDGs.
African Health Monitor, 7(1), pp.15–21.

213
Pillai, A.M. & Agarwal, K.K., 2015. AYUSH cannot prescribe modern medicine. Indian
Medical Association Legal Cell. Available at: http://www.ima-india.org/ima/left-side-
bar.php?scid=245 [Accessed April 4, 2016].
Porto, S.M., 2002. Equity and geographic distribution of financial resources in health
systems. Cadernos de saude publica, 18(4), pp.939–57. Available at:
http://www.ncbi.nlm.nih.gov/pubmed/12118303 [Accessed March 9, 2016].
Poz, M.R.D. et al., 2006. Counting health workers : definitions , data , methods and global
results, Geneva, Switzerland.
Raftery, A.E., 1999. Bayes Factors and BIC. Sociological Methods & Research, 27(3),
pp.411–427.
Raha, S., Bermen, P. & Rao, K.D., 2009. Challenges in recruitment of doctors by
government. Indian Health Beat, 1(4), pp.1–4.
Ramani, K.V. & Mavalankar, D., 2006. Health system in India : opportunities and challenges
for improvements. Journal of Health Organization and Management, 20(6).
Ramani, S. et al., 2010. Attracting and retaining health workers in rural areas: investigating
nurses’ views on rural posts and policy interventions. BMC health services research, 10
Suppl 1(1), p.S1. Available at:
http://bmchealthservres.biomedcentral.com/articles/10.1186/1472-6963-10-S1-S1
[Accessed March 14, 2016].
Ramani, S. et al., 2013. For more than love or money: attitudes of student and in-service
health workers towards rural service in India. Human resources for health, 11(58).
Available at:
http://www.pubmedcentral.nih.gov/articlerender.fcgi?artid=4222605&tool=pmcentrez&
rendertype=abstract [Accessed March 14, 2016].
Randolph, G.D. & Pathman, D.E., 2001. Trends in the rural-urban distribution of general
pediatricians. Pediatrics, 107(2), p.E18. Available at:
http://www.ncbi.nlm.nih.gov/pubmed/11158492 [Accessed March 10, 2016].
Rao, K.D. et al., 2013. As good as physicians: patient perceptions of physicians and non-
physician clinicians in rural primary health centers in India. Global health, science and
practice, 1(3), pp.397–406.
Rao, K.D. et al., 2010. Health worker attitudes toward rural service in India: Results from
qualitative research, Health, Nutrition and Population (HNP) discussion paper. World
Bank: Washington, DC.
Rao, K.D. et al., 2013. Which doctor for primary health care? Quality of care and non-
physician clinicians in India. Social Science and Medicine, 84, pp.30–34. Available at:
http://dx.doi.org/10.1016/j.socscimed.2013.02.018.
Rao, K.D., Bhatnagar, A. & Berman, P., 2012. So many, yet few: Human resources for health
in India. Human resources for health, 10(1), p.19. Available at: http://human-resources-
health.biomedcentral.com/articles/10.1186/1478-4491-10-19 [Accessed March 4, 2016].
Rao, M. et al., 2011. Human resources for health in India. Lancet, 377(9765), pp.587–98.
Available at: http://www.thelancet.com/article/S0140673610618880/fulltext [Accessed
March 5, 2012].
Ray, S., Basu, A. & Basu, S., 2011. An assessment of rural health care delivery system in
some areas of West Bengal-An overview. Indian Journal of Public Health, 55(2), p.70.
214
Available at: http://www.ijph.in/text.asp?2011/55/2/70/85235 [Accessed August 15,
2016].
van Rensburg, H.C.J., 2014. South Africa’s protracted struggle for equal distribution and
equitable access - still not there. Human resources for health, 12(26). Available at:
http://www.pubmedcentral.nih.gov/articlerender.fcgi?artid=4029937&tool=pmcentrez&
rendertype=abstract [Accessed February 7, 2016].
Ricketts, T.C., Hart, L.G. & Pirani, M., 2000. How Many Rural Doctors Do We Have? The
Journal of Rural Health, 16(3), pp.198–207. Available at:
http://doi.wiley.com/10.1111/j.1748-0361.2000.tb00457.x [Accessed September 14,
2016].
Robinson, J. & Wharrad, H., 2001. The relationship between attendance at birth and maternal
mortality rates: an exploration of United Nations’ data sets including the ratios of
physicians and nurses to population, GNP per capita and female literacy. Journal of
advanced nursing, 34(4), pp.445–55. Available at:
http://www.ncbi.nlm.nih.gov/pubmed/11380711.
Robson, C., 2002. Real world research : a resource for social scientists and practitioner-
researchers, Oxford: Blackwell Publishers.
Rosenbaum, P.R., 1993. Hodges-Lehmann point estimates of treatment effect in
observational studies. Journal of the American Statistical Association, 88(424),
pp.1250–1253.
Rosenbaum, P.R., 2005. Sensitivity Analysis in Observational Studies. Encyclopedia of
Statistics in Behavioral Science, 4, pp.1809–1814. Available at: http://www-
stat.wharton.upenn.edu/~rosenbap/BehStatSen.pdf\nhttp://dx.doi.org/10.1002/04700131
92.bsa606\nhttp://onlinelibrary.wiley.com/doi/10.1002/0470013192.bsa606/abstract?sys
temMessage=Wiley+Online+Library+will+be+disrupted+3+Mar+from+10-
13+GMT+for+mo.
Rosenblatt, R.A. et al., 2015. Geographic and specialty distribution of US physicians trained
to treat opioid use disorder. Annals of family medicine, 13(1), pp.23–6. Available at:
http://www.pubmedcentral.nih.gov/articlerender.fcgi?artid=4291261&tool=pmcentrez&
rendertype=abstract [Accessed March 10, 2016].
Rosenthal, M.B., Zaslavsky, A. & Newhouse, J.P., 2005. The geographic distribution of
physicians revisited. Health services research, 40(6 Pt 1), pp.1931–52. Available at:
http://www.pubmedcentral.nih.gov/articlerender.fcgi?artid=1361233&tool=pmcentrez&
rendertype=abstract [Accessed March 10, 2016].
Rubin, D.B., 2001. Using propensity scores to help design observational studies: Application
to the tobacco litigation. Health Services and Outcomes Research Methodology, 2(3–4),
pp.169–188.
Rubin, D.B. & Thomas, N., 1996. Matching Using Estimated Propensity Scores : Relating
Theory to Practice. Biometrics, 52(1), pp.249–264.
Samal, J., 2013. Role of AYUSH doctors in filling the gap of health workforce inequality in
rural India with special reference to National Rural Health Mission: A situational
analysis. International Journal of Advanced Ayurveda, Yoga, Unani, Siddha and
Homeopathy, 2(1), p.pp–83. Available at: http://medical.cloud-
journals.com/index.php/IJAAYUSH/article/view/Med-83\nhttp://medical.cloud-
journals.com/index.php/IJAAYUSH/article/download/Med-83/pdf.

215
Samal, J., 2015a. Role of AYUSH workforce, therapeutics, and principles in health care
delivery with special reference to National Rural Health Mission. Ayu, 36(1), pp.5–8.
Available at: http://www.ncbi.nlm.nih.gov/pubmed/26730131 [Accessed September 27,
2016].
Samal, J., 2015b. Situational analysis and future directions of AYUSH: An assessment
through 5-year plans of India. Journal of intercultural ethnopharmacology, 4(4),
pp.348–54. Available at: http://www.ncbi.nlm.nih.gov/pubmed/26649240 [Accessed
August 18, 2016].
Sanneving, L. et al., 2013. Inequity in India: the case of maternal and reproductive health.
Global health action, 6, p.19145. Available at:
http://www.pubmedcentral.nih.gov/articlerender.fcgi?artid=3617912&tool=pmcentrez&
rendertype=abstract [Accessed February 15, 2016].
Sarma, S., 2009. Demand for outpatient healthcare: empirical findings from rural India.
Applied health economics and health policy, 7(4), pp.265–77. Available at:
http://www.ncbi.nlm.nih.gov/pubmed/19905040 [Accessed March 14, 2016].
Sasaki, H., Otsubo, T. & Imanaka, Y., 2013. Widening disparity in the geographic
distribution of pediatricians in Japan. Human resources for health, 11, p.59. Available
at:
http://www.pubmedcentral.nih.gov/articlerender.fcgi?artid=4222807&tool=pmcentrez&
rendertype=abstract [Accessed March 10, 2016].
Satpathy, S.K., 2005. Indian public health standards (IPHS) for community health centres.
Indian journal of public health, 49(3), pp.123–6. Available at:
http://www.ncbi.nlm.nih.gov/pubmed/16468274 [Accessed March 15, 2016].
Saxena, D. et al., 2013. Inequity in maternal health care service utilization in Gujarat:
analyses of district-level health survey data. Global health action, 6, pp.1–9. Available
at:
http://www.pubmedcentral.nih.gov/articlerender.fcgi?artid=3591509&tool=pmcentrez&
rendertype=abstract [Accessed March 4, 2016].
Schmiedeknecht, K. et al., 2015. Predictors of workforce retention among Malawian nurse
graduates of a scholarship program: a mixed-methods study. Global health, science and
practice, 3(1), pp.85–96. Available at: http://www.ghspjournal.org/content/3/1/85.full
[Accessed April 14, 2016].
Sen, A., 2002. Why health equity? Health Economics, 11(8), pp.659–666. Available at:
http://doi.wiley.com/10.1002/hec.762 [Accessed September 27, 2016].
Shakarishvili, G. et al., 2010. Converging Health Systems Frameworks: Towards A
Concepts-to-Actions Roadmap for Health Systems Strengthening in Low and Middle
Income Countries. Global Health Governance, 3(2), pp.1–17.
Sharma, A.K., 2009. National rural health mission: time to take stock. Indian journal of
community medicine : official publication of Indian Association of Preventive & Social
Medicine, 34(3), pp.175–82. Available at:
http://www.pubmedcentral.nih.gov/articlerender.fcgi?artid=2800893&tool=pmcentrez&
rendertype=abstract [Accessed March 15, 2016].
Sharma, B. et al., 2010. The Role of the District Public Health Nurses : A Study from Gujarat,
Working Paper No. 2010-02-04. Indian Institute of Management, Ahmedabad.
Sharma, M.P. et al., 2009. An assessment of institutional deliveries under JSY at different

216
levels of health care in Jaipur District, Rajasthan. Indian journal of public health, 53(3),
pp.177–82. Available at: http://www.ncbi.nlm.nih.gov/pubmed/20108884 [Accessed
March 14, 2016].
Sheikh, A. et al., 2012. Physician migration at its roots: a study on the factors contributing
towards a career choice abroad among students at a medical school in Pakistan.
Globalization and health, 8, p.43. Available at:
http://www.pubmedcentral.nih.gov/articlerender.fcgi?artid=3542032&tool=pmcentrez&
rendertype=abstract [Accessed March 14, 2016].
Sheikh, K. et al., 2016. What rural doctors want : a qualitative study in Chhattisgarh state.
Indian Journal of Medical Ethics, I(3), pp.138–144.
Shorrocks, A.. F.., 1980. The Class of Additively Decomposable Inequality Measures.
Econometrica, 48(3), pp.613–625.
Shrinivasan, R., 2015. Medicine Wars: Questions over science swirl, but AYUSH stands firm
- The Hindu. The Hindu. Available at: http://www.thehindu.com/sunday-
anchor/medicine-wars-homeopathy-allopathy-ayurveda-unani-in-
india/article7141754.ece [Accessed September 11, 2015].
Shukla, M., Verma, S. & Potenziani, D., 2014. Human Resources Information Systems (
HRIS ): A Review across States of India, Washington, DC.
Silverman, D., 2013. Doing qualitative research : a practical handbook,
Singh, A. et al., 2012. Socio-economic inequalities in the use of postnatal care in India. PloS
one, 7(5), p.e37037. Available at:
http://journals.plos.org/plosone/article?id=10.1371/journal.pone.0037037 [Accessed
March 9, 2016].
Singh, A. & Kumar, A., 2014. Factors associated with seeking treatment for postpartum
morbidities in rural India. Epidemiology and health, 36, p.e2014026. Available at:
http://dx.doi.org/10.4178/epih/e2014026 [Accessed March 4, 2016].
Singh, A., Kumar, A. & Pranjali, P., 2014. Utilization of maternal healthcare among
adolescent mothers in urban India: evidence from DLHS-3. PeerJ, 2(1), p.e592.
Available at: https://peerj.com/articles/592 [Accessed March 4, 2016].
Singh, L., Rai, R.K. & Singh, P.K., 2012. Assessing the utilization of maternal and child
health care among married adolescent women: evidence from India. Journal of biosocial
science, 44(1), pp.1–26. Available at:
http://journals.cambridge.org/abstract_S0021932011000472 [Accessed March 9, 2016].
Singh, P.K. et al., 2012. Determinants of maternity care services utilization among married
adolescents in rural India. PloS one, 7(2), p.e31666. Available at:
http://journals.plos.org/plosone/article?id=10.1371/journal.pone.0031666 [Accessed
March 9, 2016].
Sinha, D., 2016. Women, health and public services in India: Why are states different?, New
Delhi: Routledge.
Sinha, N. & Onyatseng, G., 2013. The Nursing Labour Market in Botswana: An Economic
Analysis. Pula: Botswana Journal of African Studies, 26(1), pp.109–129. Available at:
http://www.ub.bw/ojs/index.php/pula/article/view/159 [Accessed March 15, 2016].
Sirinek, K.R., Willis, R. & Stewart, R.M., 2014. Geographic maldistribution of general
surgery PGYI residents: another US surgical desert. American journal of surgery,

217
208(6), pp.1023-8-8. Available at: http://www.ncbi.nlm.nih.gov/pubmed/25450591
[Accessed March 10, 2016].
Smieliauskas, F. et al., 2014. Geographic variation in radiologist capacity and widespread
implementation of lung cancer CT screening. Journal of medical screening, 21(4),
pp.207–15. Available at:
http://www.pubmedcentral.nih.gov/articlerender.fcgi?artid=4407799&tool=pmcentrez&
rendertype=abstract [Accessed March 10, 2016].
Smith, J.P. & Thomas, D., 1998. On the Road: Marriage and Mobility in Malaysia. Journal of
Human Resources, 33(4), pp.805–832. Available at:
http://search.ebscohost.com/login.aspx?direct=true&db=eoh&AN=0485719&lang=ja&s
ite=ehost-live\nhttp://jhr.uwpress.org/archive/.
Snow, R.C. et al., 2011. Key factors leading to reduced recruitment and retention of health
professionals in remote areas of Ghana: a qualitative study and proposed policy
solutions. Human resources for health, 9, p.13. Available at:
http://www.pubmedcentral.nih.gov/articlerender.fcgi?artid=3127976&tool=pmcentrez&
rendertype=abstract [Accessed March 14, 2016].
Snyder, C.L., 2008. Temporal geomapping of pediatric surgeons in the United States. Journal
of Pediatric Surgery, 43(3), pp.424–9. Available at:
http://www.ncbi.nlm.nih.gov/pubmed/18358276 [Accessed March 10, 2016].
Sodani, P.R. & Sharma, K., 2011. Assessing Indian public health standards for community
health centers: a case study with special reference to essential newborn care services.
Indian journal of public health, 55(4), pp.260–6. Available at:
http://www.ncbi.nlm.nih.gov/pubmed/22298134 [Accessed September 14, 2016].
Sood, R., 2012. State to appoint specialist docs at their place of choice. The Tribune.
Available at: http://www.tribuneindia.com/2011/20111013/himachal.htm
Sood, R. & Singh, T., 2012. Assessment in medical education: Evolving perspectives and
contemporary trends. National Medical Journal of India, 25(6), pp.357–364. Available
at: http://www.tandfonline.com/doi/full/10.1080/01421590802139823 [Accessed
September 27, 2016].
Sousa, A., Dal Poz, M.R. & Boschi-Pinto, C., 2013. Reducing inequities in neonatal mortality
through adequate supply of health workers: evidence from newborn health in Brazil.
PloS one, 8(9), p.e74772. Available at:
http://journals.plos.org/plosone/article?id=10.1371/journal.pone.0074772 [Accessed
February 19, 2016].
Sousa, A., Dal Poz, M.R. & Carvalho, C.L., 2012. Monitoring inequalities in the health
workforce: the case study of Brazil 1991-2005. PloS one, 7(3), p.e33399. Available at:
http://journals.plos.org/plosone/article?id=10.1371/journal.pone.0033399 [Accessed
March 10, 2016].
Speybroeck, N. et al., 2012. Inequality in Human Resources for Health: Measurement Issues.
Geographical analysis, 44(2), pp.151–161. Available at:
http://www.pubmedcentral.nih.gov/articlerender.fcgi?artid=3378331&tool=pmcentrez&
rendertype=abstract [Accessed April 8, 2016].
Speybroeck, N. et al., 2006. Reassessing the relationship between human resources for health,
intervention coverage and health outcomes. World Health Organization, Geneva.
Available at: http://www.who.int/entity/hrh/documents/reassessing_relationship.pdf
218
[Accessed March 5, 2012].
Ssengooba, F. et al., 2007. Health sector reforms and human resources for health in Uganda
and Bangladesh: mechanisms of effect. Human resources for health, 5(1), p.3. Available
at: http://human-resources-health.biomedcentral.com/articles/10.1186/1478-4491-5-3
[Accessed March 14, 2016].
Starfield, B., 2011. The hidden inequity in health care. International journal for equity in
health, 10(15). Available at: http://www.ncbi.nlm.nih.gov/pubmed/21507245 [Accessed
September 25, 2016].
StataCorp, 2011. Stata Statistical Software: Release 12. Available at:
http://www.stata.com/support/faqs/resources/citing-software-documentation-faqs/.
Stilwell, B., Diallo, K. & Zurn, P., 2004. Migration of health-care workers from developing
countries: strategic approaches to its management. Bulletin of the World Health
Organization, 82, pp.595–600. Available at:
http://www.scielosp.org/scielo.php?pid=S0042-
96862004000800009&script=sci_arttext&tlng=pt.
Sundararaman, T. & Gupta, G., 2011. Indian approaches to retaining skilled health workers in
rural areas. Bulletin of the World Health Organization, 89(1), pp.73–7. Available at:
http://www.pubmedcentral.nih.gov/articlerender.fcgi?artid=3040013&tool=pmcentrez&
rendertype=abstract [Accessed March 5, 2012].
Susi, L. & Mascarenhas, A.K., 2002. Using a geographical information system to map the
distribution of dentists in Ohio. The Journal of the American Dental Association, 133(5),
pp.636–642. Available at:
http://www.sciencedirect.com/science/article/pii/S0002817714629779 [Accessed March
10, 2016].
Tanikawa, T. et al., 2012. Geographical distribution of radiotherapy resources in Japan:
investigating the inequitable distribution of human resources by using the Gini
coefficient. Journal of radiation research, 53(3), pp.489–91. Available at:
http://www.ncbi.nlm.nih.gov/pubmed/22739017 [Accessed March 9, 2016].
Tankwanchi, A.B.S., Ozden, C. & Vermund, S.H., 2013. Physician emigration from sub-
Saharan Africa to the United States: analysis of the 2011 AMA physician masterfile.
PLoS medicine, 10(9), p.e1001513. Available at:
http://journals.plos.org/plosmedicine/article?id=10.1371/journal.pmed.1001513
[Accessed March 14, 2016].
Tashakkori, A & Teddie, C., 1998. Mixed Methodology: Combining qualitative and
quantitative approaches, Sage.
Tashakkori, A. & Teddlie, C., 2003. Handbook of mixed methods in social & behavioral
research, SAGE Publications.
Teusner, D.N., 2005. Geographic distribution of the dentist labour force. Australian dental
journal, 50(2), pp.119–122.
Teusner, D.N., Chrisopoulos, S. & Brennan, D.S., 2007. Geographic Distribution of the
Australian Dental Labour Force, 2003, Canberra. Available at:
https://arcpoh.adelaide.edu.au/publications/report/statistics/pdf_07/dlf_2003.pdf\nhttp://
books.google.com.au/books?id=noaBLAAACAAJ&dq=geographic+distribution+o
f+dental+labour+force&hl=&cd=1&source=gbs_api.
219
The Britain-nepal Medical Trust, 2010. Health and Well-being: The Britain-Nepal Medical
Trust Annual Report 2010/11, Tornbridge, Kent. Available at:
http://www.elmbridge.gov.uk/yourlife/healthandwellbeing.htm.
The World Bank, 2012. World Development Report 2012: Gender, Equality and
Development, Washington DC.
Theodorakis, P.N. & Mantzavinis, G.D., Inequalities in the distribution of rural primary care
physicians in two remote neighboring prefectures of Greece and Albania. Rural and
remote health, 5(3), p.457. Available at:
http://www.ncbi.nlm.nih.gov/pubmed/16134954 [Accessed March 10, 2016].
Tomblin Murphy, G. et al., 2012. Eliminating the shortage of registered nurses in Canada: an
exercise in applied needs-based planning. Health policy (Amsterdam, Netherlands),
105(2–3), pp.192–202. Available at:
http://www.sciencedirect.com/science/article/pii/S0168851011002491 [Accessed March
15, 2016].
Tuckett, A.G., 2005. Applying thematic analysis theory to practice: A researcher’s
experience. Contemporary Nurse, 19(1–2), pp.75–87. Available at:
http://www.tandfonline.com/doi/abs/10.5172/conu.19.1-2.75 [Accessed September 17,
2016].
Ubach, C. et al., 2003. What do hospital consultants value about their jobs? A discrete choice
experiment. BMJ, 326(7404).
USAIDS, 2012. Strengthening Human Resources Information Systems : Experiences from. ,
(October). Available at: http://www.intrahealth.org/files/media/strengthening-human-
resources-information-systemsexperiences-from-bihar-and-jharkhand-
india/HRIS_Brief_26_10_12.pdf.
Valdivia, M., 2002. Public health infrastructure and equity in the utilization of outpatient
health care services in Peru. Health policy and planning, 17 Suppl, pp.12–9. Available
at: http://www.ncbi.nlm.nih.gov/pubmed/12477737 [Accessed August 11, 2016].
Viegas Andrade, M. et al., 2012. Antenatal care use in Brazil and India: Scale, outreach and
socioeconomic inequality. Health and Place, 18(5), pp.942–950.
Vishnoi, A., 2016. Ayush doctors may get nod to practice at primary health centre - The
Economic Times. The Economic Times. Available at:
http://articles.economictimes.indiatimes.com/2016-03-22/news/71732536_1_ayush-
doctors-health-ministry-bridge-course [Accessed April 2, 2016].
de Vries, E. & Reid, S., 2003. Do South African medical students of rural origin return to
rural practice? South African medical journal = Suid-Afrikaanse tydskrif vir
geneeskunde, 93(10), pp.789–93. Available at:
http://www.ncbi.nlm.nih.gov/pubmed/14652974 [Accessed February 11, 2016].
Wakaba, M. et al., 2014. The public sector nursing workforce in Kenya: a county-level
analysis. Human resources for health, 12(6). Available at:
http://www.pubmedcentral.nih.gov/articlerender.fcgi?artid=3913960&tool=pmcentrez&
rendertype=abstract [Accessed March 10, 2016].
Wall, T.P. & Brown, L.J., 2007. The urban and rural distribution of dentists, 2000. The
Journal of the American Dental Association, 138(7), pp.1003–1011. Available at:
http://www.sciencedirect.com/science/article/pii/S0002817714624284 [Accessed March
10, 2016].
220
Whitehead, M., 1991. The concepts and principles of equity and health. Health Promotion
International, 6(3), pp.217–228. Available at:
http://heapro.oxfordjournals.org/cgi/doi/10.1093/heapro/6.3.217 [Accessed September
27, 2016].
WHO, 2006. Fifth-ninth World Health Assembly: Summary record of committees, Geneva,
Switzerland.
WHO, 2010. Increasing access to health worker in remote and rural areas through improved
retention, Geneva, Switzerland.
Willis-Shattuck, M. et al., 2008. Motivation and retention of health workers in developing
countries: a systematic review. BMC health services research, 8, p.247. Available at:
http://www.pubmedcentral.nih.gov/articlerender.fcgi?artid=2612662&tool=pmcentrez&
rendertype=abstract [Accessed March 5, 2012].
World Health Organization, 2015. Global Strategy on Human Resources for Health:
Workforce 2030. Draft for consultation, Geneva, Switzerland.
World Health Organization, 2006. Working together for health, Available at:
http://scholar.google.com/scholar?hl=en&btnG=Search&q=intitle:Working+together+fo
r+health#1 [Accessed February 29, 2012].
Yang, B.M. & Huh, J., 1989. Physician distribution and health manpower policy in Korea.
Asia-Pacific journal of public health / Asia-Pacific Academic Consortium for Public
Health, 3(1), pp.68–77, 85. Available at: http://www.ncbi.nlm.nih.gov/pubmed/2719875
[Accessed March 10, 2016].
Zhang, X. & Kanbur, R., 2005. Spatial inequality in education and health care in China.
China Economic Review, 16(2), pp.189–204.
Zurn, P., Dal Poz, M.R., Stilwell, B., Adams, O., et al., 2004. Imbalance in the health
workforce. Human Resources for Health, 2(13), pp.1–12. Available at:
http://www.pubmedcentral.nih.gov/articlerender.fcgi?artid=526216&tool=pmcentrez&r
endertype=abstract [Accessed March 5, 2012].
Zurn, P., Dal Poz, M.R., Stilwell, B. & Adams, O., 2004. Imbalance in the health workforce.
Human resources for health, 2(1), p.13. Available at:
http://www.pubmedcentral.nih.gov/articlerender.fcgi?artid=526216&tool=pmcentrez&r
endertype=abstract [Accessed March 5, 2012].

221
10 Appendices
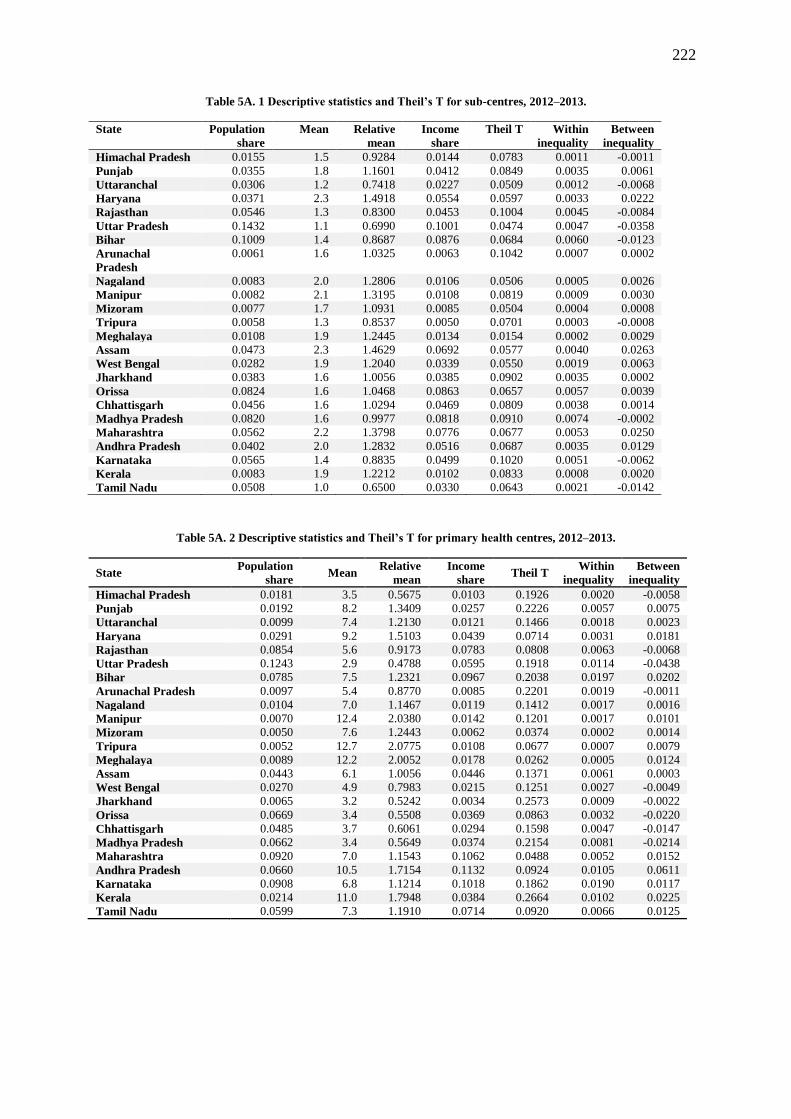
222
Table 5A. 1 Descriptive statistics and Theil’s T for sub-centres, 2012–2013.
State Population
share
Mean Relative
mean
Income
share
Theil T Within
inequality
Between
inequality
Himachal Pradesh 0.0155 1.5 0.9284 0.0144 0.0783 0.0011 -0.0011
Punjab 0.0355 1.8 1.1601 0.0412 0.0849 0.0035 0.0061
Uttaranchal 0.0306 1.2 0.7418 0.0227 0.0509 0.0012 -0.0068
Haryana 0.0371 2.3 1.4918 0.0554 0.0597 0.0033 0.0222
Rajasthan 0.0546 1.3 0.8300 0.0453 0.1004 0.0045 -0.0084
Uttar Pradesh 0.1432 1.1 0.6990 0.1001 0.0474 0.0047 -0.0358
Bihar 0.1009 1.4 0.8687 0.0876 0.0684 0.0060 -0.0123
Arunachal
Pradesh
0.0061 1.6 1.0325 0.0063 0.1042 0.0007 0.0002
Nagaland 0.0083 2.0 1.2806 0.0106 0.0506 0.0005 0.0026
Manipur 0.0082 2.1 1.3195 0.0108 0.0819 0.0009 0.0030
Mizoram 0.0077 1.7 1.0931 0.0085 0.0504 0.0004 0.0008
Tripura 0.0058 1.3 0.8537 0.0050 0.0701 0.0003 -0.0008
Meghalaya 0.0108 1.9 1.2445 0.0134 0.0154 0.0002 0.0029
Assam 0.0473 2.3 1.4629 0.0692 0.0577 0.0040 0.0263
West Bengal 0.0282 1.9 1.2040 0.0339 0.0550 0.0019 0.0063
Jharkhand 0.0383 1.6 1.0056 0.0385 0.0902 0.0035 0.0002
Orissa 0.0824 1.6 1.0468 0.0863 0.0657 0.0057 0.0039
Chhattisgarh 0.0456 1.6 1.0294 0.0469 0.0809 0.0038 0.0014
Madhya Pradesh 0.0820 1.6 0.9977 0.0818 0.0910 0.0074 -0.0002
Maharashtra 0.0562 2.2 1.3798 0.0776 0.0677 0.0053 0.0250
Andhra Pradesh 0.0402 2.0 1.2832 0.0516 0.0687 0.0035 0.0129
Karnataka 0.0565 1.4 0.8835 0.0499 0.1020 0.0051 -0.0062
Kerala 0.0083 1.9 1.2212 0.0102 0.0833 0.0008 0.0020
Tamil Nadu 0.0508 1.0 0.6500 0.0330 0.0643 0.0021 -0.0142
Table 5A. 2 Descriptive statistics and Theil’s T for primary health centres, 2012–2013.
State Population
share Mean
Relative
mean
Income
share Theil T
Within
inequality
Between
inequality
Himachal Pradesh 0.0181 3.5 0.5675 0.0103 0.1926 0.0020 -0.0058
Punjab 0.0192 8.2 1.3409 0.0257 0.2226 0.0057 0.0075
Uttaranchal 0.0099 7.4 1.2130 0.0121 0.1466 0.0018 0.0023
Haryana 0.0291 9.2 1.5103 0.0439 0.0714 0.0031 0.0181
Rajasthan 0.0854 5.6 0.9173 0.0783 0.0808 0.0063 -0.0068
Uttar Pradesh 0.1243 2.9 0.4788 0.0595 0.1918 0.0114 -0.0438
Bihar 0.0785 7.5 1.2321 0.0967 0.2038 0.0197 0.0202
Arunachal Pradesh 0.0097 5.4 0.8770 0.0085 0.2201 0.0019 -0.0011
Nagaland 0.0104 7.0 1.1467 0.0119 0.1412 0.0017 0.0016
Manipur 0.0070 12.4 2.0380 0.0142 0.1201 0.0017 0.0101
Mizoram 0.0050 7.6 1.2443 0.0062 0.0374 0.0002 0.0014
Tripura 0.0052 12.7 2.0775 0.0108 0.0677 0.0007 0.0079
Meghalaya 0.0089 12.2 2.0052 0.0178 0.0262 0.0005 0.0124
Assam 0.0443 6.1 1.0056 0.0446 0.1371 0.0061 0.0003
West Bengal 0.0270 4.9 0.7983 0.0215 0.1251 0.0027 -0.0049
Jharkhand 0.0065 3.2 0.5242 0.0034 0.2573 0.0009 -0.0022
Orissa 0.0669 3.4 0.5508 0.0369 0.0863 0.0032 -0.0220
Chhattisgarh 0.0485 3.7 0.6061 0.0294 0.1598 0.0047 -0.0147
Madhya Pradesh 0.0662 3.4 0.5649 0.0374 0.2154 0.0081 -0.0214
Maharashtra 0.0920 7.0 1.1543 0.1062 0.0488 0.0052 0.0152
Andhra Pradesh 0.0660 10.5 1.7154 0.1132 0.0924 0.0105 0.0611
Karnataka 0.0908 6.8 1.1214 0.1018 0.1862 0.0190 0.0117
Kerala 0.0214 11.0 1.7948 0.0384 0.2664 0.0102 0.0225
Tamil Nadu 0.0599 7.3 1.1910 0.0714 0.0920 0.0066 0.0125

223
Table 5A. 3 Descriptive statistics and Theil’s T for community health centres, 2012–2013.
State Population
share
Mean Relative
mean
Income
share
Theil T Within
inequality
Between
inequality
Himachal Pradesh 0.0161 12.1 0.8803 0.0141 0.1447 0.0020 -0.0018
Punjab 0.0250 15.9 1.1583 0.0290 0.0751 0.0022 0.0043
Uttaranchal 0.0125 10.4 0.7560 0.0095 0.1023 0.0010 -0.0026
Haryana 0.0221 14.9 1.0880 0.0241 0.1177 0.0028 0.0020
Rajasthan 0.0935 13.4 0.9795 0.0916 0.1076 0.0099 -0.0019
Uttar Pradesh 0.1920 9.3 0.6808 0.1307 0.0996 0.0130 -0.0503
Bihar 0.0142 8.1 0.5886 0.0084 0.2872 0.0024 -0.0044
Arunachal Pradesh 0.0111 8.3 0.6091 0.0067 0.1461 0.0010 -0.0033
Nagaland 0.0044 11.4 0.8347 0.0037 0.0688 0.0003 -0.0007
Manipur 0.0033 20.7 1.5110 0.0051 0.0339 0.0002 0.0021
Mizoram 0.0023 13.5 0.9827 0.0023 0.0737 0.0002 0.0000
Tripura 0.0023 18.5 1.3545 0.0031 0.0980 0.0003 0.0009
Meghalaya 0.0029 21.1 1.5390 0.0045 0.0261 0.0001 0.0019
Assam 0.0447 13.9 1.0167 0.0454 0.1778 0.0081 0.0008
West Bengal 0.0764 19.2 1.4013 0.1070 0.1550 0.0166 0.0361
Jharkhand 0.0376 8.0 0.5843 0.0220 0.1278 0.0028 -0.0118
Orissa 0.0751 7.5 0.5504 0.0414 0.1237 0.0051 -0.0247
Chhattisgarh 0.0338 12.0 0.8765 0.0296 0.1014 0.0030 -0.0039
Madhya Pradesh 0.0766 8.7 0.6343 0.0486 0.1244 0.0060 -0.0221
Maharashtra 0.0520 12.7 0.9269 0.0482 0.0480 0.0023 -0.0037
Andhra Pradesh 0.0509 13.0 0.9489 0.0483 0.0973 0.0047 -0.0025
Karnataka 0.0388 11.0 0.8054 0.0313 0.0761 0.0024 -0.0068
Kerala 0.0286 24.4 1.7817 0.0509 0.4280 0.0218 0.0294
Tamil Nadu 0.0839 31.8 2.3218 0.1948 0.5838 0.1137 0.1641

224
Table 6A. 1 Variance inflation factors for the sub-centre model.
Variable Categories VIF 1/VIF
HSC in government building No 1.04 0.96
Electricity supply
Irregular supply 1.78 0.56
No connection 2.11 0.47
Water source Hand pump 2.42 0.41
Well 1.74 0.57
No water 2.04 0.48
Village Health and Sanitation Committee 1.2 0.83
Region Central 3.21 0.31
Northeast 1.72 0.58
East 2.11 0.47
West 1.76 0.56
South 2.19 0.45
Log of catchment population 1.13 0.88
Mean VIF 1.88
Table 6A. 2 Results of the Park test for heteroscedasticity (health sub-centre model).
Test for heteroscedasticity Result of test
Park Test
𝜇𝑖2 = -.4574793 + .1141682 *(estimated number of health workers)
[-28.36] [27.55]
R2 = 0.0423
𝜇𝑖 represents the deviance residuals.
Values in square brackets represent the t-values associated with constant and β coefficient just above them.
Significant t-values of the explanatory variable suggest the presence of heteroscedasticity
Figure 6A. 1 Diagnostic plots for the Poisson regression model for health worker availability at health sub-centres in
India, 2007–2008.
Deviance residual vs. fitted values
Normal quantile plot

225
Table 6A. 3 Results from split samples to validate the final model for health sub-centres.
Variable Sample 1
(n=8,354)
Sample 2
(n=8,308)
t-value
Categories CoefficientA SE CoefficientB SE TAB
HSC in government building Yes
No -0.036 0.012 -0.025 0.013 -0.590
Electricity supply Regular supply
Irregular supply -0.037 0.016 -0.027 0.016 -0.432
No connection -0.035 0.014 -0.050 0.014 0.781
Water source Tap water
Hand pump -0.057 0.017 -0.060 0.017 0.135
Well 0.041 0.017 0.041 0.017 -0.024
No Water 0.023 0.015 0.015 0.015 0.366
VHSC established No
Yes 0.051 0.013 0.042 0.013 0.484
Log of catchment population 0.047 0.011 0.050 0.011 -0.239
Region North
Central -0.154 0.033 -0.161 0.036 0.131
Northeast 0.071 0.042 0.041 0.046 0.489
East -0.147 0.034 -0.182 0.037 0.708
West 0.098 0.041 0.096 0.045 0.036
South -0.040 0.037 -0.046 0.037 0.113
Table 6A. 4 Variance inflation factor for a primary health centre model.
Variable
VIF 1/VIF
Water supply Other 1.40 0.71
No water supply 1.44 0.69
Electricity supply Irregular 1.26 0.80
No connection 1.56 0.64
Functional toilet No 1.24 0.81
Electricity generator Yes 1.36 0.73
Telephone Yes 1.35 0.74
Location Rural 1.03 0.97
24*7 functional Yes 1.26 0.79
Number of residences available One 1.24 0.81
Two 1.36 0.73
Three 1.44 0.69
Four 1.38 0.73
Distance from the headquarters 1.20 0.83
Population served
1.36 0.73
Region North 1.53 0.65
Central 2.13 0.47
Northeast 1.38 0.72
East 1.60 0.62
West 1.69 0.59
Mean VIF
1.41

226
Figure 6A. 2 Diagnostic plots for a Poisson regression model for health worker availability at primary health centres
in India, 2007–2008 (n=8,159)
Deviance residuals vs. Fitted values
Normal quantile plot
Table 6A. 5 Results from the split sample to validate the final model for primary health centres.
Variable Category
Sample 1
(n=4,054)
Sample 2
(n=3,935) t-value
CoefficientA SE CoefficientB SE TAB
Water Tap
Other 0.016 0.016 -0.002 0.016 0.790
No supply -0.050 0.027 -0.039 0.026 -0.275
Electricity Regular
Irregular 0.020 0.017 0.010 0.016 0.405
No connection -0.111 0.029 -0.095 0.028 -0.409
Toilet No
Yes 0.022 0.021 0.044 0.020 -0.769
Generator No
Yes 0.037 0.017 0.030 0.017 0.322
Telephone No
Yes 0.033 0.017 0.049 0.017 -0.690
Location Urban
Rural -0.056 0.029 -0.037 0.029 -0.453
PHC open 24 hours No
Yes 0.063 0.016 0.061 0.016 0.088
Residences None
One 0.010 0.021 0.004 0.021 0.180
Two 0.024 0.022 0.007 0.022 0.554
Three 0.072 0.023 0.077 0.022 -0.151
Four 0.106 0.026 0.169 0.025 -1.725
Distance from headquarters 0.001 0.000 0.000 0.001 0.184
Population served 0.061 0.009 0.056 0.009 0.409
Region South
North -0.181 0.038 -0.178 0.036 -0.056
Central -0.203 0.029 -0.212 0.028 0.219
Northeast 0.059 0.039 0.032 0.039 0.483
East -0.261 0.042 -0.276 0.041 0.254
West -0.135 0.035 -0.126 0.033 -0.183
-4-2
02
4
Devia
nce r
esid
uals
4 6 8 10 12
Predicted number of health workers
-4-2
02
4
Sta
nda
rdiz
ed
devia
nce r
esid
uals
-4 -2 0 2 4Inverse Normal

227
Table 6A. 6 Results of the Park test for heteroscedasticity (primary health centre model).
Test for heteroscedasticity Result of test
Park Test
𝜇𝑖2 = 1.343 – .0002885 *(estimated number of health workers)
[25.12] [6.69]
R2 = 0.0056
𝜇𝑖 represents the deviance residuals.
Values in square brackets represent the t-values associated with constant and β coefficient just above them.
Significant t-values of the explanatory variable suggest the presence of heteroscedasticity.
Table 6A. 7 Variance inflation factors for community health centres.
Variable VIF 1/VIF
Water supply Other 1.15 0.87
No water supply 1.04 0.96
Electricity supply No connection 1.13 0.89
Electricity generator Yes 1.11 0.90
FRU Yes 1.07 0.93
Location Rural 1.10 0.91
Number of residences One 1.65 0.61
Two 1.54 0.65
Three 1.34 0.75
Four 1.27 0.79
Five 1.17 0.85
Six 1.20 0.83
Communication facilities One 2.00 0.50
Two 2.23 0.45
Three 2.13 0.47
Region Central 3.35 0.30
Northeast 1.52 0.66
East 1.95 0.51
West 2.14 0.47
South 2.63 0.38
Population served 1.26 0.79
Mean VIF 1.41
Figure 6A. 3 Diagnostic plots for a negative binomial regression model for health worker availability at community
health centres in India, 2007–2008.
Deviance residuals vs. Fitted values
Normal quantile plot
-2-1
01
2
Sta
nda
rdiz
ed
devia
nce r
esid
uals
5 10 15 20 25
Predicted number of health workers
-2-1
01
2
Sta
nda
rdiz
ed
devia
nce r
esid
uals
-2 -1 0 1 2Inverse Normal

228
Table 6A. 8 Results from split samples for validation of the final model for community health centres.
Variable Category Sample 1 (n=2,023) Sample (n=1,975) t-value
CoefficientA SE CoefficientB SE TAB
Water supply Tap
Other 0.021 0.024 -0.012 0.025 0.938
No supply -0.339 0.091 -0.231 0.089 -0.850
Electricity Yes
No connection -0.301 0.044 -0.256 0.046 -0.696
Toilet No
Yes 0.085 0.028 0.109 0.028 -0.608
Generator No
Yes -0.085 0.030 -0.015 0.031 -1.616
Communication None
One 0.008 0.037 -0.063 0.037 1.355
Two 0.090 0.038 0.023 0.039 1.237
Three 0.128 0.044 0.039 0.045 1.418
Location Rural
Urban 0.148 0.027 0.136 0.027 0.332
FRU No
Yes 0.167 0.023 0.130 0.024 1.122
Residences None
One 0.000 0.032 0.022 0.032 -0.472
Two 0.099 0.036 0.088 0.036 0.205
Three 0.233 0.043 0.211 0.044 0.354
Four 0.251 0.050 0.267 0.051 -0.219
Five 0.242 0.060 0.277 0.060 -0.418
Six 0.324 0.053 0.319 0.060 0.058
Population served 0.040 0.012 0.034 0.013 0.345
Region North
Central -0.087 0.042 -0.167 0.044 1.330
Northeast 0.390 0.064 0.178 0.067 2.296
East 0.107 0.051 0.030 0.055 1.023
West -0.028 0.051 -0.117 0.051 1.237
South -0.105 0.045 -0.159 0.045 0.857

229
Table 6A. 9 Status of human resources at primary health centres in the Sitapur district, Uttar Pradesh, July 2013
S.No. Name of CHC Name of PHC MOIC MOCH Pharm LA ANM NMA Ward Boy Sweeper Sanctioned Filled
S F S F S F S F S F S F S F S F
1 Sidhauli Manwa 1 1 1 1 1 1 1 0 1 1 1 1 1 0 1 1 8 6
Ghazipur 1 1 1 1 1 1 1 1 0 0 1 1 1 1 1 1 7 7
Ataria 1 1 1 1 1 1 1 1 1 1 1 1 1 1 1 1 8 8
2 Gondalamau Terwa 1 0 1 0 1 1 1 0 0 0 1 0 1 0 1 1 7 2
Ramgarh 1 1 1 0 1 1 1 0 0 0 1 0 1 1 1 0 7 3
Sandana 1 1 1 0 1 1 1 1 1 1 1 0 1 0 1 1 7 5
3 Mishrikh Neemsar 1 1 1 0 1 1 1 1 1 2 1 0 1 0 1 0 8 5
Baherwa 1 1 1 0 1 1 1 0 0 0 1 0 1 0 1 0 7 2
Manikapur 1 1 1 0 1 1 1 0 0 0 1 0 1 1 1 1 7 4
4 Pisawan Behat Gaur 1 1 1 0 1 1 1 1 0 0 1 0 1 1 1 1 8 5
Jalalnagar 1 1 1 0 1 1 1 0 1 1 1 0 1 1 1 0 8 4
Bargawa 1 1 1 1 1 1 1 1 1 1 1 1 1 1 1 1 8 8
Neri 1 1 1 0 1 1 1 0 0 0 1 0 1 1 1 0 7 3
5 Maholi Palahapur 1 1 1 0 1 1 1 0 0 0 1 1 1 0 1 1 7 4
Chaturaiyya 1 1 1 0 1 1 1 0 1 1 1 1 1 0 1 0 7 5
Indrauli 1 1 1 0 1 1 1 0 1 1 1 1 1 1 1 1 8 6
6 Hargaon Salaarpur 1 1 1 1 1 1 1 0 1 1 1 1 1 1 1 0 8 6
Kakraahi 1 1 1 0 1 1 1 0 1 1 1 1 1 0 1 0 8 3
Armi 1 1 1 0 1 1 1 1 1 1 1 0 1 1 1 0 8 5
7 Laharpur Bilaria 1 1 1 0 1 1 1 0 1 1 1 0 1 1 1 0 8 3
Dhakhera 1 1 1 0 1 1 1 0 1 0 1 0 1 1 1 0 8 3
Khairullapur 1 1 1 0 1 1 1 0 1 0 1 0 1 1 1 0 8 3
Akbarpur 1 1 1 0 1 1 1 0 1 1 1 1 1 0 1 0 8 4
8 Tambaur Sirkida 1 1 1 1 1 1 1 1 1 0 1 0 1 1 1 0 8 5
Shahpur 1 1 1 1 1 1 1 1 1 0 1 0 1 1 1 0 8 5
Samodideeh 1 1 1 0 1 1 1 0 1 0 1 0 1 0 1 0 8 2
9 Reusa Haleem Nagar 1 1 1 0 1 1 1 0 1 0 1 0 1 0 1 0 8 2
Sweta 1 1 1 0 1 1 1 1 1 1 1 0 1 0 1 1 8 5
Gangapurwa 1 1 1 0 1 1 1 0 1 1 1 0 1 1 1 0 8 4
Kishorganj 1 1 1 0 1 1 1 0 1 0 1 0 1 0 1 0 8 2
10 Rampur Mathura Bansura 1 1 1 0 1 1 1 0 1 1 1 0 1 1 1 0 8 4
Meera Nagar 1 1 1 1 1 1 1 1 1 1 1 1 1 1 1 0 8 7
Note: MOIC – medical officer in charge; MOCH – medical officer community health; Pharm – pharmacist; LA – lab assistant; ANM – auxiliary nurse midwife; S – sanctioned; F – filled

230
Table 6A.9 Contd.
Name of CHC Name of PHC MOIC MOCH Pharm LA ANM NMA Ward Boy Sweeper Total
S F S F S F S F S F S F S F S F S F
Mahmudabad Khurwal 1 1 1 0 1 1 1 1 1 1 1 0 1 0 1 1 8 5
Godaicha 1 0 1 0 1 0 1 0 0 0 1 0 1 0 1 0 0
Paintepr 1 1 1 0 1 1 1 0 1 1 1 0 1 1 1 0 8 4
Pahla Behma 1 1 1 0 1 1 1 0 0 0 1 0 1 1 1 0 7 2
Rampur Kalan 1 1 1 0 1 1 1 0 0 0 1 1 1 1 1 0 7 4
Biswan Jahangirabad 1 1 1 1 1 1 1 1 1 1 1 0 1 1 1 0 7 6
Devakliya 1 1 1 0 1 1 1 0 0 0 1 0 1 0 1 0 7 2
Marsanda 1 1 1 0 1 1 1 0 1 0 1 0 1 1 1 1 7 4
Shivthana 1 1 1 0 1 1 1 0 1 0 1 0 1 1 1 1 7 4
Tikra 1 1 1 1 1 1 1 1 1 1 1 0 1 1 1 1 8 7
Parsendi Angrashi 1 0 1 0 1 1 1 0 1 1 1 1 1 1 1 0 8 4
Rikhauna 1 0 1 0 1 1 1 0 1 1 1 1 1 1 1 0 8 4
Nauwa Mahmoodpur 1 1 1 0 1 1 1 1 1 1 1 0 1 1 1 1 8 6
Khairabad Barai Jalalpur 1 1 1 0 1 1 1 1 1 1 1 0 1 1 1 1 8 6
Saraiya Sani 1 1 1 0 1 1 1 1 1 1 1 0 1 1 1 1 8 6
Ramkot 1 1 1 0 1 1 1 1 1 1 1 0 1 1 1 1 8 6
Machhrehta Lauli 1 1 1 0 1 1 1 1 0 0 1 1 1 1 1 0 7 5
Madhwapur 1 1 1 0 1 1 1 0 0 0 1 1 1 1 1 1 8 5
Bhitaura 1 1 1 0 1 1 1 0 1 0 1 1 1 1 1 0 8 4
Parsada 1 1 1 0 1 1 1 0 0 0 1 0 1 1 1 0 7 3
Ailiya Neri Kalan 1 1 1 0 1 1 1 0 0 0 1 1 1 1 1 1 8 5
Tikra Jaar 1 1 1 0 1 1 1 0 1 0 1 1 1 1 1 0 8 4
Sanda Khanpur 1 0 1 0 1 1 1 0 0 0 1 0 1 0 1 1 7 2
Rewan 1 1 1 0 1 1 1 0 1 1 1 0 1 1 1 1 8 5
Sakaran 1 1 1 0 1 1 1 0 1 1 1 0 1 1 1 1 8 5
Murthana 1 1 1 0 1 1 1 0 1 1 1 1 1 0 1 0 8 4
Maharaj Nagar 1 1 1 1 1 1 1 1 2 2 1 1 1 1 1 1 9 9
Kasmanda Kamalapur 1 1 1 1 1 1 1 1 1 1 1 1 1 1 1 1 8 8
Bamhera 1 1 1 0 1 1 1 0 1 1 1 0 1 1 1 0 8 4
Bhandia 1 1 1 0 1 1 1 0 1 1 1 0 1 1 1 0 8 4
Note: MOIC – medical officer in charge; MOCH – medical officer community health; Pharm – pharmacist; LA – lab assistant; ANM – auxiliary nurse midwife; S – sanctioned; F – filled
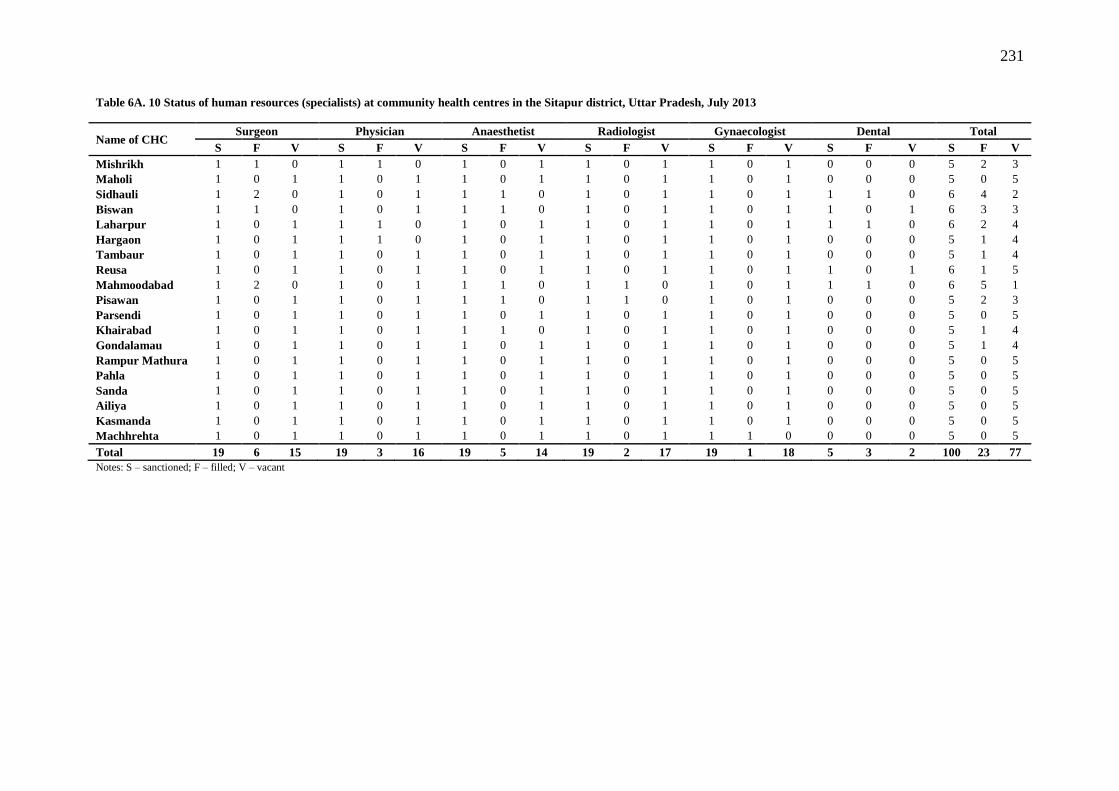
231
Table 6A. 10 Status of human resources (specialists) at community health centres in the Sitapur district, Uttar Pradesh, July 2013
Name of CHC Surgeon Physician Anaesthetist Radiologist Gynaecologist Dental Total
S F V S F V S F V S F V S F V S F V S F V
Mishrikh 1 1 0 1 1 0 1 0 1 1 0 1 1 0 1 0 0 0 5 2 3
Maholi 1 0 1 1 0 1 1 0 1 1 0 1 1 0 1 0 0 0 5 0 5
Sidhauli 1 2 0 1 0 1 1 1 0 1 0 1 1 0 1 1 1 0 6 4 2
Biswan 1 1 0 1 0 1 1 1 0 1 0 1 1 0 1 1 0 1 6 3 3
Laharpur 1 0 1 1 1 0 1 0 1 1 0 1 1 0 1 1 1 0 6 2 4
Hargaon 1 0 1 1 1 0 1 0 1 1 0 1 1 0 1 0 0 0 5 1 4
Tambaur 1 0 1 1 0 1 1 0 1 1 0 1 1 0 1 0 0 0 5 1 4
Reusa 1 0 1 1 0 1 1 0 1 1 0 1 1 0 1 1 0 1 6 1 5
Mahmoodabad 1 2 0 1 0 1 1 1 0 1 1 0 1 0 1 1 1 0 6 5 1
Pisawan 1 0 1 1 0 1 1 1 0 1 1 0 1 0 1 0 0 0 5 2 3
Parsendi 1 0 1 1 0 1 1 0 1 1 0 1 1 0 1 0 0 0 5 0 5
Khairabad 1 0 1 1 0 1 1 1 0 1 0 1 1 0 1 0 0 0 5 1 4
Gondalamau 1 0 1 1 0 1 1 0 1 1 0 1 1 0 1 0 0 0 5 1 4
Rampur Mathura 1 0 1 1 0 1 1 0 1 1 0 1 1 0 1 0 0 0 5 0 5
Pahla 1 0 1 1 0 1 1 0 1 1 0 1 1 0 1 0 0 0 5 0 5
Sanda 1 0 1 1 0 1 1 0 1 1 0 1 1 0 1 0 0 0 5 0 5
Ailiya 1 0 1 1 0 1 1 0 1 1 0 1 1 0 1 0 0 0 5 0 5
Kasmanda 1 0 1 1 0 1 1 0 1 1 0 1 1 0 1 0 0 0 5 0 5
Machhrehta 1 0 1 1 0 1 1 0 1 1 0 1 1 1 0 0 0 0 5 0 5
Total 19 6 15 19 3 16 19 5 14 19 2 17 19 1 18 5 3 2 100 23 77
Notes: S – sanctioned; F – filled; V – vacant

232
Table 7A. 1 Distribution of health sub-centre characteristics, 2007–2008 (n=17,667)
Dependent variable n Percent Dependent variable n Percent Dependent variable n Percent
Health
Auxiliary Nurse Midwife
(ANM) Labour table
Skilled birth
training
personnel None 624 3.53 Available and usable 5,420 30.68 No 11,886 67.28
Only Permanent ANM 13,486 76.33
Available and
unusable 1,028 5.82 Yes 5,781 32.72
Only Contractual ANM 756 4.28 Not available 11,219 63.5
Monitoring by
VHSC
Both 2,801 15.85 Bed screen No 7,000 39.62
Drug Paracetamol Available and usable 4,032 22.82 Yes 10,667 60.38
availability Yes 12,576 71.43
Available and
unusable 643 3.64 Other Region
No 5,030 28.57 Not available 12,992 73.54 variables North 1,911 10.82
Iron and folic acid Infrastructu
re Electricity Central 7,511 42.51
Yes 12,825 72.72 Regular supply 3,756 21.26 Northeast 1,451 8.21
No 4,811 27.28 Irregular supply 5,676 32.13 East 1,815 10.27
Equipment Blood pressure instrument No connection 8,235 46.61 West 1,845 10.44
Yes 13,884 78.59 Water supply South 3,134 17.74
No 3,783 21.41 No 4,721 26.72 ANM's residence from SC (km)
Weighing scale Yes 12,946 73.28 <4 7,197 41.07
Yes 14,101 79.82 Toilet 5–20 6,923 39.51
No 3,566 20.18 No 9,105 51.54 21–40 2,814 16.06
Sims speculum Yes 8,562 48.46 >40 588 3.36
Yes 10,666 60.37 Telephone
No 7,001 39.63 No 15,979 90.45
Examination table Yes 1,688 9.55
Available and usable 9,598 54.33 Quality Integrated skills development training
Available and unusable 996 5.64 variables No 9,034 51.13
Not available 7,073 40.04 Yes 8,633 48.87
Table 7A. 2 Descriptive statistics for each variables (n=17,667)
Variable Mean/Percent SD Minimum Maximum
Essential obstetric drugs 1.5 1.7 0 5 Log of catchment population 8.6 0.7 1.6 13.8
% population in lowest wealth quintile 3.4 6.2 0.0 49.5
Total fertility rate 3.1 1.0 1.4 5.9 % Hindu population 81.6 24.3 0.0 100.0
Average years of schooling among mothers 4.4 2.4 0.5 11.5

233
Table 7A. 3 Unadjusted and adjusted incidence rate ratios for the volume of antenatal care registrations at health
sub-centres in India, 2007–2008 (n=16,537)
Outcome: Number of antenatal registrations.
Unadjusted Adjusted
IRR P-value 95% CI IRR i-value 95% CI
Health personnel
Auxiliary Nurse Midwife (ANM)
None
0.795 0.000 0.745,0.849 0.846 0.001 0.763 0.938
Only Contractual ANM 0.923 0.021 0.862,0.988 0.901 0.014 0.829 0.979
Both
1.085 0.000 1.043,1.128 1.042 0.178 0.982 1.105
Drug availability
Paracetamol
No
1.002 0.884 0.972,1.034 0.997 0.879 0.954 1.041
Iron and folic acid
No
1.013 0.464 0.979,1.048 0.992 0.735 0.946 1.040
Equipment
BP instrument
Yes
1.045 0.002 1.016,1.075 1.047 0.029 1.005 1.092
Weighing scale
Yes
1.044 0.004 1.014,1.074 1.023 0.276 0.982 1.066
Examination table
Available but unusable 0.926 0.003 0.880,0.975 0.943 0.130 0.874 1.017
Not available 0.921 0.000 0.896,0.947 0.956 0.025 0.919 0.994
Bed screen
Available but unusable 0.940 0.064 0.881,1.003 0.968 0.477 0.886 1.058
Not available 0.930 0.000 0.903,0.958 0.956 0.032 0.917 0.996
Infrastructure
Electricity
Irregular supply 0.926 0.000 0.891,0.963 0.933 0.011 0.885 0.984
No connection 0.896 0.000 0.864,0.929 0.915 0.000 0.871 0.962
Water supply
Yes
1.056 0.000 1.028,1.085 1.026 0.180 0.988 1.066
Toilet
Yes
1.045 0.001 1.019,1.072 0.997 0.882 0.961 1.034
Telephone
Yes
1.050 0.164 0.980,1.125 1.039 0.443 0.942 1.145
Quality variables
ISD training in last 5 years
Yes
1.036 0.004 1.011,1.062 1.014 0.416 0.980 1.050
VHSC monitoring work
Yes
1.037 0.010 1.009,1.066 1.054 0.010 1.013 1.096
Other variables
Region
Central
1.458 0.000 1.280,1.661 0.978 0.792 0.832 1.151
Northeast 0.943 0.476 0.801,1.109 1.015 0.845 0.871 1.184
East
1.576 0.000 1.328,1.870 1.006 0.941 0.849 1.193
West
1.232 0.013 1.044,1.455 0.993 0.924 0.860 1.146
South
0.947 0.479 0.815,1.101 0.801 0.004 0.689 0.931
ANM's residence from SC (in km)
5–20
0.974 0.172 0.938 1.011 0.994 0.765 0.956 1.033
21–40
0.916 0.011 0.857 0.98 0.940 0.071 0.879 1.005
>40
0.882 0.063 0.772 1.007 0.906 0.152 0.792 1.037
Log of catchment population 1.303 0.000 1.275,1.332 1.326 0.000 1.267, 1.386
Socioeconomic variables
% population in the lowest wealth quintile 0.993 0.051 0.986,1.000 1.004 0.149 0.999 1.009
Total fertility rate 1.230 0.000 1.183,1.280 1.112 0.000 1.051 1.176
% Hindu population 1.006 0.000 1.004,1.007 1.004 0.000 1.002 1.005
Maternal education (in years) 0.910 0.000 0.895,0.925 0.945 0.000 0.926 0.964
Dispersion parameter (alpha) 0.444 0.000 0.417 0.472
Likelihood-ratio test of alpha=0: Chi2 Statistic = 2230.01 (P = 0.000)
Note: IRR – Incidence Rate Ratio, CI – Confidence Interval, ANM – Auxiliary Nurse Midwife, VHSC – Village Health and
Sanitation Committee, SC – Sub-Centre/Health Sub-Centre, BP – Blood Pressure, ISDT – Integrated Skills Development
Training.

234
Table 7A. 4 Unadjusted and adjusted incidence rate ratios for postnatal care utilization at health sub-centres in
India, 2007–2008. (n=17,112)
Outcome: Number of postnatal care services provided
Unadjusted Adjusted
Health personnel IRR P-value 95% CI IRR P-value 95% CI
Auxiliary Nurse Midwife (ANM)
None 0.783 0.000 0.698 0.877 0.832 0.000 0.775 0.894
Only Contractual ANM 0.887 0.007 0.813 0.968 0.901 0.004 0.839 0.968
Both 1.081 0.003 1.026 1.138 1.052 0.014 1.010 1.095
Drug availability
Essential obstetric drugs 1.002 0.753 0.989 1.015 0.999 0.759 0.989 1.008
Equipment
BP instrument
Yes 1.076 0.000 1.045 1.109 1.053 0.001 1.022 1.086
Weighing scale
Yes 1.068 0.000 1.036 1.101 1.034 0.034 1.003 1.067
Examination table
Available but unusable 0.935 0.014 0.887 0.987 0.984 0.109 0.908 1.010
Not available 0.911 0.000 0.886 0.937 0.939 0.000 0.921 0.976
Bed Screen
Available but unusable 0.951 0.142 0.889 1.017 0.957 0.642 0.920 1.052
Not available 0.904 0.000 0.876 0.932 0.948 0.000 0.910 0.969
Infrastructure
Electricity
Irregular supply 0.997 0.875 0.958 1.038 1.000 0.995 0.961 1.041
No connection 0.936 0.000 0.902 0.971 0.973 0.162 0.936 1.011
Water supply
Yes 1.024 0.099 0.996 1.054 0.984 0.272 0.955 1.013
Toilet
Yes 1.077 0.000 1.049 1.105 1.029 0.040 1.001 1.056
Telephone
Yes 1.163 0.000 1.083 1.248 1.084 0.021 1.012 1.162
Quality variables
ISD training in the last 5 years
Yes 1.067 0.000 1.04 1.094 1.030 0.028 1.003 1.057
SBA training in the last 5 years
Yes 1.075 0.000 1.046 1.105 1.034 0.019 1.006 1.064
VHSC monitoring work
Yes 1.092 0.000 1.061 1.124 1.083 0.000 1.052 1.114
Other variables
Region
Central 1.517 0.000 1.330 1.732 1.149 0.063 0.992 1.330
Northeast 0.893 0.182 0.757 1.054 1.029 0.705 0.887 1.194
East 1.599 0.000 1.345 1.901 1.222 0.025 1.026 1.455
West 1.561 0.000 1.320 1.845 1.268 0.003 1.084 1.482
South 1.458 0.000 1.253 1.698 1.191 0.017 1.031 1.376
ANM's residence from SC (in km)
5–20 0.941 0.000 0.914 0.968 0.962 0.009 0.935 0.991
21–40 0.901 0.000 0.868 0.935 0.940 0.001 0.907 0.976
>40 0.853 0.000 0.795 0.915 0.918 0.015 0.856 0.984
Log of catchment population 1.350 0.000 1.317 1.384 1.318 0.000 1.286 1.352
Socioeconomic variables
% population in lowest wealth quintile 1.005 0.195 0.998 1.012 1.007 0.024 1.001 1.013
Total fertility rate 1.071 0.002 1.026 1.117 1.011 0.675 0.960 1.065
% Hindu population 1.008 0.000 1.006 1.009 1.004 0.000 1.002 1.006
Maternal education (in years) 0.949 0.000 0.933 0.966 0.952 0.000 0.931 0.973
Dispersion parameter (alpha) 0.419 0.000 0.407 0.432
Likelihood-ratio test of alpha=0: Chi2 Statistic = 1894.2 (P = 0.000)
Note: IRR – Incidence Rate Ratio, CI – Confidence Interval, ANM – Auxiliary Nurse Midwife, VHSC – Village Health and
Sanitation Committee, SC – Sub-Centre/Health Sub-Centre, ISDT – Integrated Skills Development Training, SBA – Skilled
Birth Attendance.
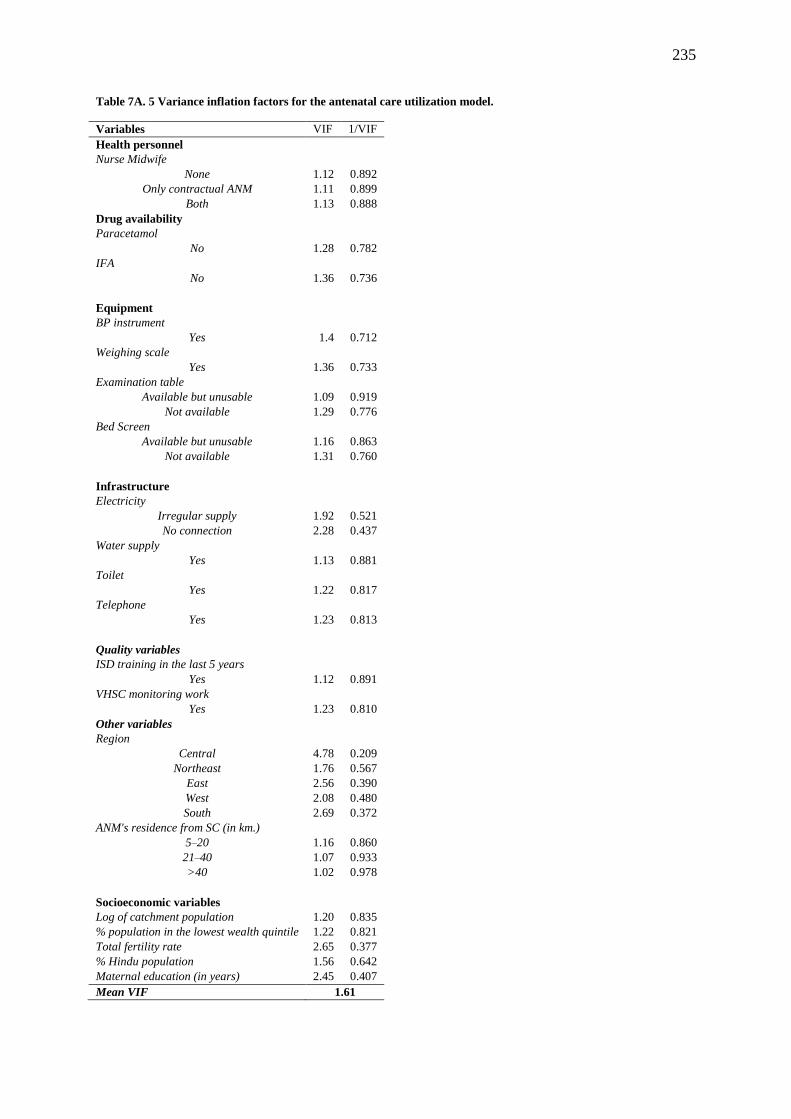
235
Table 7A. 5 Variance inflation factors for the antenatal care utilization model.
Variables VIF 1/VIF
Health personnel
Nurse Midwife
None 1.12 0.892
Only contractual ANM 1.11 0.899
Both 1.13 0.888
Drug availability
Paracetamol
No 1.28 0.782
IFA
No 1.36 0.736
Equipment
BP instrument
Yes 1.4 0.712
Weighing scale
Yes 1.36 0.733
Examination table
Available but unusable 1.09 0.919
Not available 1.29 0.776
Bed Screen
Available but unusable 1.16 0.863
Not available 1.31 0.760
Infrastructure
Electricity
Irregular supply 1.92 0.521
No connection 2.28 0.437
Water supply
Yes 1.13 0.881
Toilet
Yes 1.22 0.817
Telephone
Yes 1.23 0.813
Quality variables
ISD training in the last 5 years
Yes 1.12 0.891
VHSC monitoring work
Yes 1.23 0.810
Other variables
Region
Central 4.78 0.209
Northeast 1.76 0.567
East 2.56 0.390
West 2.08 0.480
South 2.69 0.372
ANM's residence from SC (in km.)
5–20 1.16 0.860
21–40 1.07 0.933
>40 1.02 0.978
Socioeconomic variables
Log of catchment population 1.20 0.835
% population in the lowest wealth quintile 1.22 0.821
Total fertility rate 2.65 0.377
% Hindu population 1.56 0.642
Maternal education (in years) 2.45 0.407
Mean VIF 1.61

236
Table 7A. 6 Variance inflation factors for the postnatal care utilization model
Variables VIF 1/VIF
Health personnel
Auxiliary Nurse Midwife (ANM)
None 1.16 0.864658
Only contractual ANM 1.14 0.879539
Both 1.13 0.888326
Drug availability
Essential obstetric drugs 1.26 0.792
Equipment
BP instrument
Yes 1.39 0.721
Weighing scale
Yes 1.35 0.739
Examination table
Available but unusable 1.09 0.920
Not available 1.29 0.774
Bed Screen
Available but unusable 1.16 0.863
Not available 1.31 0.761
Infrastructure
Electricity
Irregular supply 1.90 0.526
No connection 2.30 0.435
Water supply
Yes 1.14 0.880
Toilet
Yes 1.23 0.811
Telephone
Yes 1.23 0.812
Quality variables
ISD training in the last 5 years
Yes 1.17 0.853
SBA training in the last 5 years
Yes 1.15 0.869
VHSC monitoring work
Yes 1.24 0.808
Other variables
Region
Central 4.92 0.203
Northeast 1.82 0.548
East 2.56 0.390
West 2.14 0.466
South 2.78 0.360
ANM's residence from SC (in km)
5–20 1.37 0.730
21–40 1.27 0.789
>40 1.07 0.933
Socioeconomic variables
Log of catchment population 1.19 0.843
% population in the lowest wealth quintile 1.22 0.817
Total fertility rate 2.61 0.382
% Hindu population 1.56 0.641
Maternal education (in years) 2.50 0.399
Mean VIF 1.63

237
Figure 7A. 1 Diagnostic plots for the antenatal care model for the health sub-centres.
Residuals vs. Fitted
Normal Quantile Plot
Figure 7A. 2 Diagnostic plots for the postnatal care model for the health sub-centres.
Residuals vs. Fitted
Normal Quantile Plot
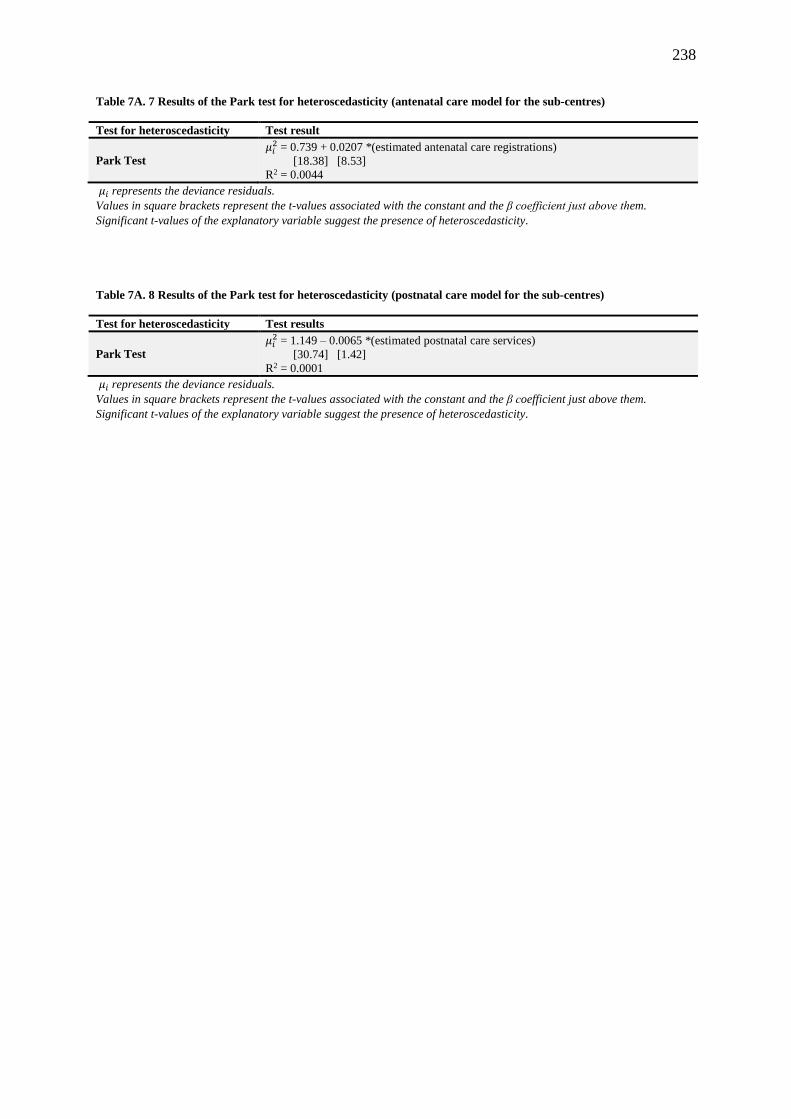
238
Table 7A. 7 Results of the Park test for heteroscedasticity (antenatal care model for the sub-centres)
Test for heteroscedasticity Test result
Park Test
𝜇𝑖2 = 0.739 + 0.0207 *(estimated antenatal care registrations)
[18.38] [8.53]
R2 = 0.0044
𝜇𝑖 represents the deviance residuals.
Values in square brackets represent the t-values associated with the constant and the β coefficient just above them.
Significant t-values of the explanatory variable suggest the presence of heteroscedasticity.
Table 7A. 8 Results of the Park test for heteroscedasticity (postnatal care model for the sub-centres)
Test for heteroscedasticity Test results
Park Test
𝜇𝑖2 = 1.149 – 0.0065 *(estimated postnatal care services)
[30.74] [1.42]
R2 = 0.0001
𝜇𝑖 represents the deviance residuals.
Values in square brackets represent the t-values associated with the constant and the β coefficient just above them.
Significant t-values of the explanatory variable suggest the presence of heteroscedasticity.

239
Table 7A. 9 Cross-validation of the final model of utilization of health services (antenatal care registrations) at health
sub-centres by comparing coefficient and t-values.
Variable
Final model Sample 1 Sample 2 t-statistic
N=16,537 N=8,375 N=8,162
Coefficient SE CoefficientA SE CoefficienB SE TAB
Auxiliary Nurse Midwife (ANM)
None -0.168 0.029 -0.144 0.044 -0.147 0.042 0.060
Only contractual ANM -0.105 0.032 -0.109 0.045 -0.163 0.042 0.876
Both 0.041 0.021 0.065 0.030 0.015 0.028 1.186
Paracetamol
No -0.003 0.016 -0.001 0.023 -0.009 0.022 0.249
Iron and folic acid
No -0.008 0.017 -0.035 0.024 0.014 0.024 -1.412
BP instrument
Yes 0.046 0.016 0.000 0.022 0.092 0.024 -2.847
Weighing scale
Yes 0.023 0.016 0.030 0.023 0.010 0.022 0.626
Electricity
Irregular supply -0.069 0.019 -0.075 0.026 -0.043 0.027 -0.867
No connection -0.089 0.018 -0.117 0.024 -0.085 0.026 -2.090
Water supply
Yes 0.026 0.015 -0.001 0.021 0.046 0.021 -1.555
Toilet
Yes -0.003 0.013 0.001 0.019 -0.009 0.019 0.369
Telephone
Yes 0.039 0.036 -0.007 0.045 0.054 0.048 -0.921
Examination table
Available but unusable -0.059 0.025 -0.097 0.035 -0.020 0.037 -1.526
Not available -0.045 0.014 -0.049 0.020 -0.049 0.019 0.029
Bed screen
Available but unusable -0.032 0.032 -0.031 0.045 -0.011 0.048 -0.312
Not available -0.046 0.015 -0.058 0.021 -0.038 0.021 -0.658
ISD training in the last 5 years
Yes 0.052 0.013 0.080 0.022 0.028 0.021 1.727
VHSC monitoring work
Yes 0.014 0.015 0.010 0.019 0.008 0.018 0.066
Region
Central -0.023 0.071 0.038 0.083 -0.029 0.073 0.607
Northeast 0.016 0.074 -0.007 0.081 0.041 0.080 -0.424
East 0.007 0.088 0.106 0.106 -0.065 0.084 1.266
West -0.008 0.077 0.039 0.089 -0.014 0.080 0.447
South -0.221 0.058 -0.119 0.070 -0.234 0.060 1.248
ANM's residence from SC (in km)
5–20 -0.006 0.014 -0.011 0.019 -0.001 0.019 -0.360
21–40 -0.062 0.025 -0.064 0.036 -0.065 0.034 0.015
>40 -0.097 0.045 -0.066 0.066 -0.110 0.064 0.485
Log of the catchment population 0.282 0.016 0.271 0.022 0.317 0.023 -1.418
Maternal education (in years) -0.057 0.010 -0.053 0.011 -0.057 0.011 0.206
% Hindu population 0.004 0.001 0.003 0.001 0.004 0.001 -0.598
% population in the lowest wealth quintile 0.004 0.003 0.000 0.003 0.006 0.003 -1.276
Total fertility rate 0.107 0.029 0.109 0.031 0.098 0.030 0.257

240
Table 7A. 10 Cross validation of the final model of utilization of health services (postnatal care) at health sub-centres
centres by comparison of coefficient and t values.
Variable
Final model Sample 1 Sample 2 t-stat
TAB
N=16537 N=8375 N=8162
Coefficient SE CoefficientA SE CoefficientB SE
Auxiliary Nurse Midwife (ANM)
None -0.193 0.030 -0.180 0.043 -0.195 0.042 0.246
Only Contractual ANM -0.111 0.032 -0.138 0.044 -0.161 0.044 0.373
Both 0.051 0.022 0.075 0.031 0.031 0.030 1.021
Essential obstetric drugs -0.001 0.005 0.008 0.007 -0.008 0.006 1.728
BP instrument
Yes 0.052 0.017 0.056 0.023 0.057 0.024 -0.036
Weighing scale
Yes 0.034 0.017 0.083 0.025 0.003 0.023 2.390
Electricity
Irregular supply 0.000 0.020 -0.060 0.027 0.016 0.029 -1.947
No connection -0.028 0.019 -0.057 0.026 -0.018 0.028 -1.054
Water supply
Yes -0.017 0.015 -0.026 0.020 -0.019 0.021 -0.234
Toilet
Yes 0.029 0.014 0.031 0.020 0.027 0.020 0.148
Telephone
Yes 0.083 0.038 0.000 0.047 0.098 0.050 -1.430
Examination table
Available but unusable -0.044 0.026 -0.051 0.037 -0.045 0.037 -0.121
Not available -0.054 0.014 -0.070 0.020 -0.055 0.020 -0.535
Bed screen
Available but unusable -0.016 0.034 0.014 0.049 -0.049 0.047 0.922
Not available -0.064 0.015 -0.054 0.022 -0.070 0.021 0.522
ISD training in last 5 years
Yes 0.035 0.014 0.015 0.019 0.055 0.020 -1.457
VHSC monitoring work
Yes 0.081 0.016 0.093 0.023 0.090 0.023 0.082
Region
Central 0.142 0.086 0.126 0.088 0.179 0.095 -0.412
Northeast 0.030 0.078 0.007 0.081 0.048 0.087 -0.345
East 0.198 0.109 0.179 0.110 0.219 0.117 -0.248
West 0.236 0.101 0.208 0.102 0.265 0.110 -0.377
South 0.173 0.088 0.180 0.092 0.214 0.098 -0.249
ANM's residence from SC (in km)
5-20 -0.038 0.014 -0.053 0.020 -0.027 0.020 -0.902
21 -40 -0.062 0.018 -0.061 0.025 -0.056 0.025 -0.151
>40 -0.088 0.032 -0.130 0.045 -0.049 0.047 -1.237
Log of catchment population 0.276 0.017 0.276 0.023 0.304 0.024 -0.838
Maternal education (in years) -0.049 0.011 -0.047 0.011 -0.054 0.011 0.471
% Hindu population 0.004 0.001 0.004 0.001 0.004 0.001 0.543
% population in lowest wealth quintile 0.007 0.003 0.006 0.003 0.008 0.003 -0.528
Total fertility rate 0.012 0.027 0.018 0.028 0.004 0.028 0.349

241
Table 7A. 11 Descriptive statistics of variables, Primary Health Centres, India, 2007–2008
Variable Mean Std. Dev. Min Max
Doctor 1.45 0.82 0 4
Nurse 2.26 1.09 0 4
Allied health professionals 1.20 0.68 0 2
Drug 12.03 3.64 0 18
Equipment 9.75 4.61 0 22
Furniture 10.86 3.97 0 17
Communication 1.20 1.12 0 5
PHC open 24×7 0.53 0.50 0 1
Electricity generator available 0.42 0.49 0 1
Medical officer training 4.13 2.92 0 12
Rural location of PHC 0.95 0.22 0 1
Rogi Kalyan Samiti 0.77 0.42 0 1
% of population in the lowest wealth quintile 4.10 6.70 0 44
Population served by a PHC 42181 44984 200 283,553
% Hindu population 83.19 23.27 0 100
Average years of schooling among mothers 4.67 2.44 1 11
Total fertility rate 2.95 0.95 1.4 5.9

242
Table 7A. 12 Unadjusted and adjusted incidence rate ratios for the volume of patients at Primary Health Centres in
India, 2007–2008
Variable Category
Unadjusted
Adjusted
95% CI 95% CI
IRR P-value Lower Upper
IRR P-value Lower Upper
Human resource
Doctor None®
1 1.376 0.000 1.289 1.469 1.238 0.000 1.159 1.322
2 1.522 0.000 1.418 1.633
1.306 0.000 1.216 1.402
3 1.605 0.000 1.473 1.747
1.378 0.000 1.266 1.501
4 1.626 0.000 1.409 1.877
1.444 0.000 1.257 1.660
Nurse None®
1 1.123 0.001 1.046 1.205
1.072 0.047 1.001 1.149
2 1.254 0.000 1.167 1.347
1.138 0.000 1.061 1.221
3 1.362 0.000 1.263 1.468
1.192 0.000 1.107 1.283
4 1.525 0.000 1.403 1.657
1.292 0.000 1.190 1.403
Allied workers None®
1 1.170 0.000 1.119 1.223
1.119 0.000 1.072 1.169
2 1.311 0.000 1.247 1.379
1.210 0.000 1.151 1.274
Drugs
1.020 0.000 1.015 1.026
1.016 0.000 1.011 1.022
Equipment 1.030 0.000 1.025 1.035
1.012 0.000 1.007 1.018
Furniture/instrument 1.026 0.000 1.020 1.032
1.017 0.000 1.011 1.022
Infrastructure
Communication 1.145 0.000 1.125 1.166
1.087 0.000 1.068 1.108
Facility open 24×7 1.168 0.000 1.131 1.206
1.100 0.000 1.065 1.136
Electricity generator available 1.175 0.000 1.132 1.219
1.108 0.000 1.068 1.149
Quality variables
Rogi Kalyan Samiti
1.030 0.000 1.024 1.036
Medical officer trainings 1.146 0.000 1.102 1.193
1.007 0.017 1.001 1.012
Other variables
Rural location of PHC 0.807 0.000 0.753 0.865
0.886 0.000 0.830 0.946
Region North®
Central 0.814 0.002 0.714 0.929
0.969 0.691 0.827 1.134
Northeast 1.011 0.894 0.858 1.192
0.847 0.045 0.720 0.996
East 1.601 0.000 1.342 1.911
2.180 0.000 1.799 2.643
West 0.957 0.594 0.813 1.126
0.695 0.000 0.587 0.824
South 1.652 0.000 1.420 1.921
1.444 0.000 1.233 1.690
Average years of schooling among mothers 1.072 0.000 1.051 1.093
1.058 0.000 1.036 1.081
% of population in the lowest wealth quintile 0.988 0.002 0.981 0.996
0.978 0.000 0.971 0.985
% Hindu population 1.002 0.027 1.000 1.004
1.002 0.030 1.000 1.004
Note: IRR – Incidence Rate Ratio, CI – Confidence Interval, ® Reference category
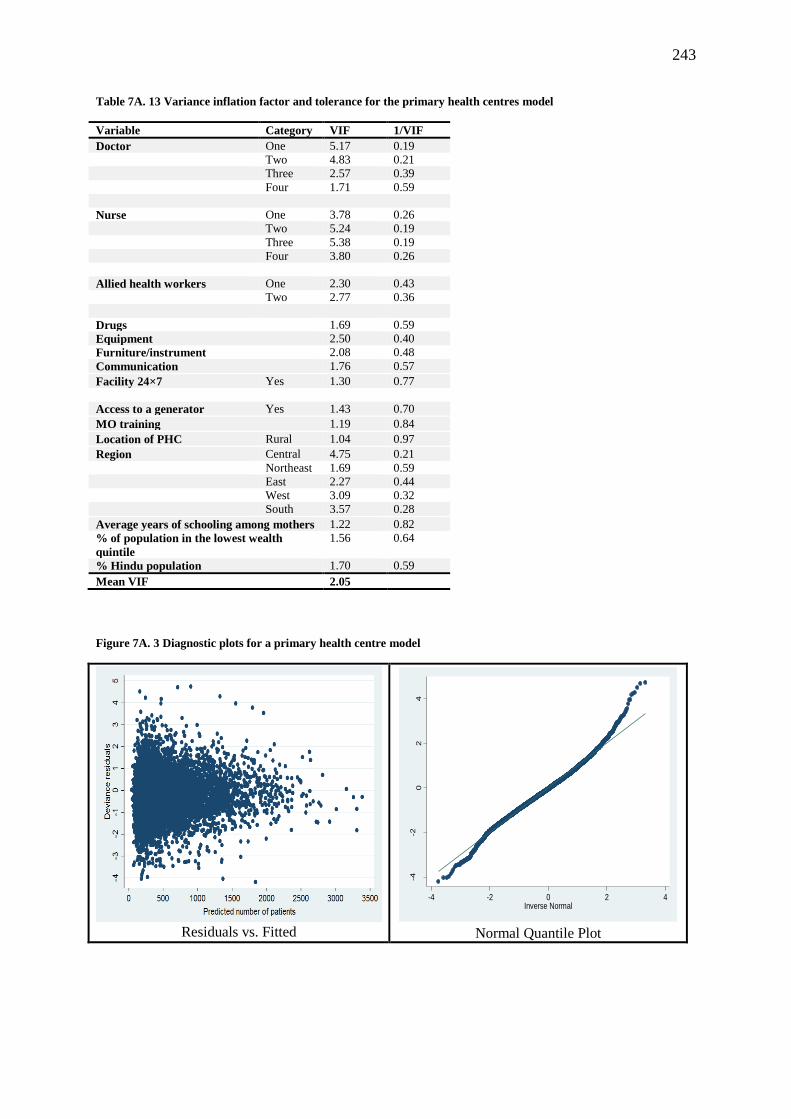
243
Table 7A. 13 Variance inflation factor and tolerance for the primary health centres model
Variable Category VIF 1/VIF
Doctor One 5.17 0.19
Two 4.83 0.21
Three 2.57 0.39
Four 1.71 0.59
Nurse One 3.78 0.26
Two 5.24 0.19
Three 5.38 0.19
Four 3.80 0.26
Allied health workers One 2.30 0.43
Two 2.77 0.36
Drugs 1.69 0.59
Equipment 2.50 0.40
Furniture/instrument 2.08 0.48
Communication 1.76 0.57
Facility 24×7 Yes 1.30 0.77
Access to a generator Yes 1.43 0.70
MO training 1.19 0.84
Location of PHC Rural 1.04 0.97
Region Central 4.75 0.21
Northeast 1.69 0.59
East 2.27 0.44
West 3.09 0.32
South 3.57 0.28
Average years of schooling among mothers 1.22 0.82
% of population in the lowest wealth
quintile
1.56 0.64
% Hindu population 1.70 0.59
Mean VIF 2.05
Figure 7A. 3 Diagnostic plots for a primary health centre model
Residuals vs. Fitted
Normal Quantile Plot
-4-2
02
4
Sta
nda
rdiz
ed
devia
nce r
esid
uals
-4 -2 0 2 4Inverse Normal

244
Table 7A. 14 Results of the Park test for heteroscedasticity
Test for heteroscedasticity Result of test
Park Test
𝜇𝑖2 = 1.06155-0.00015 *(estimated male patients at primary health centres)
[38.18] [3.29]
R2 = 0.0014
𝜇𝑖 represents the deviance residuals.
Values in square brackets represent the t-values associated with the constant and β coefficient just above them.
Significant t-values of the explanatory variable suggest the presence of heteroscedasticity.

245
Table 7A. 15 Cross-validation of the final model of utilization of health services (number of patients) at primary
health centres by comparing coefficients and t-values.
Variables Categories
Final model
N=7,523
Sample 1
N=3,719
Sample 2
N=3,804 t-test
Coefficient SE CoefficientA SE CoefficientB SE TAB
Doctor None
One 0.213 0.042 0.233 0.061 0.229 0.062 0.048
Two 0.267 0.047 0.279 0.069 0.281 0.069 -0.012
Three 0.321 0.060 0.390 0.093 0.292 0.084 0.782
Four 0.368 0.103 0.403 0.141 0.386 0.156 0.085
Nurse None
One 0.070 0.038 0.047 0.053 0.085 0.056 -0.494
Two 0.129 0.041 0.101 0.057 0.142 0.061 -0.490
Three 0.175 0.045 0.154 0.063 0.165 0.065 -0.124
Four 0.257 0.054 0.232 0.076 0.264 0.079 -0.291
Allied health workers None
One 0.113 0.025 0.095 0.035 0.166 0.038 -1.371
Two 0.191 0.031 0.204 0.046 0.237 0.047 -0.496
Drugs
0.016 0.003 0.023 0.004 0.014 0.004 1.748
Equipment 0.012 0.003 0.008 0.004 0.011 0.004 -0.703
Furniture/instrument 0.017 0.003 0.014 0.004 0.015 0.004 -0.237
Communication 0.084 0.010 0.105 0.015 0.061 0.014 2.129
Facility open 24×7 No
Yes 0.096 0.018 0.092 0.026 0.082 0.026 0.253
Access to a generator No
Yes 0.103 0.021 0.051 0.028 0.152 0.031 -2.397
Medical officer training 0.007 0.003 0.005 0.004 0.008 0.004 -0.441
Location of PHC Urban
Rural -0.121 0.030 -0.113 0.044 -0.135 0.041 0.361
Region North
Central -0.032 0.078 0.016 0.090 -0.046 0.081 0.510
Northeast -0.166 0.070 -0.112 0.084 -0.187 0.075 0.665
East 0.779 0.214 0.885 0.266 0.757 0.223 0.367
West -0.364 0.060 -0.352 0.067 -0.332 0.065 -0.220
South 0.367 0.116 0.359 0.127 0.388 0.124 -0.163
Average years of schooling among mothers 0.057 0.003 -0.019 0.004 -0.023 0.004 0.711
% of population in the lowest wealth
quintile -0.022 0.001 0.002 0.001 0.001 0.001 1.019
% Hindu population 0.002 0.012 0.059 0.013 0.058 0.012 0.056
Values in italics indicate that these variables are not significant at the 5% level.

246
Table 7A. 16 Descriptive statistics of the various variables, Community Health Centres, India, 2007–2008
Variable Mean Std. Dev. Min Max
Specialist 2.29 2.63 0 28
Doctor 1.96 1.57 0 12
Nurse 7.69 5.53 0 43
Allied health professionals 3.78 2.28 0 17
Infrastructure 3.12 0.93 0 4
Transport 1.15 1.01 0 7
Furniture 12.97 2.47 0 15
Equipment 1.03 1.90 0 32
Drug 3.43 2.97 0 15
Available number of beds 22.81 13.85 0 93
Rogi Kalyan Samiti 0.85 0.35 0 1
Medical officer training 4.33 4.62 0 87
Paramedical staff training 4.21 7.36 0 120
Rural location of CHC 0.74 0.43 1 0
CHC designated as the first referral unit 0.51 0.50 0 1
% of population in the lowest wealth quintile 3.15 5.69 0 44
% Hindu population 82.76 23.03 0 100
Average years of schooling among mothers 4.73 2.50 1 11
Total fertility rate 3.00 1.00 1.4 5.9
Population served by a CHC 122,775 89,656 15 999,873

247
Table 7A. 17 Unadjusted and adjusted incidence rate ratios for the volume of patients at Community Health Centres
in India, 2007–2008
Variable Categories Unadjusted Adjusted
95% CI 95% CI
IRR P-value Lower Upper IRR P-value Lower Upper
Specialists None®
1–2 1.144 0.000 1.073 1.219 1.068 0.038 1.003 1.136
3–4 1.362 0.000 1.253 1.480 1.174 0.000 1.081 1.276
5–6 1.622 0.000 1.459 1.804 1.303 0.000 1.171 1.450
7+ 1.537 0.000 1.335 1.769 1.232 0.003 1.073 1.416
Medical officers None®
1 0.976 0.590 0.893 1.066 0.981 0.660 0.901 1.068
2 1.036 0.444 0.946 1.136 1.017 0.715 0.931 1.110
3 1.137 0.014 1.026 1.261 1.092 0.083 0.989 1.206
4 1.162 0.022 1.022 1.322 1.069 0.292 0.944 1.210
5+ 1.233 0.002 1.080 1.408 1.104 0.132 0.971 1.255
Nurses None®
1–3 1.300 0.032 1.022 1.653 1.382 0.005 1.101 1.733
4–6 1.592 0.000 1.254 2.022 1.593 0.000 1.272 1.996
7–9 1.755 0.000 1.377 2.235 1.684 0.000 1.340 2.116
10–12 1.827 0.000 1.423 2.346 1.705 0.000 1.346 2.161
13–15 1.784 0.000 1.373 2.317 1.566 0.000 1.222 2.007
16+ 1.672 0.000 1.293 2.161 1.448 0.003 1.135 1.847
Allied health professionals None®
1–2 1.482 0.000 1.214 1.808 1.633 0.000 1.350 1.976
3–4 1.689 0.000 1.383 2.063 1.750 0.000 1.445 2.120
5–6 1.857 0.000 1.507 2.287 1.792 0.000 1.465 2.191
7+ 1.885 0.000 1.501 2.366 1.851 0.000 1.486 2.306
Infrastructure 1.208 0.000 1.171 1.245 1.060 0.000 1.029 1.093
Transport 1.165 0.000 1.126 1.206 1.016 0.359 0.983 1.050
Furniture/Instruments 1.090 0.000 1.077 1.104 1.030 0.000 1.017 1.044
Equipment 1.019 0.011 1.004 1.034 1.011 0.108 0.998 1.024
Essential drugs 0.927 0.000 0.916 0.938 0.958 0.000 0.947 0.970
Available number of beds 1.020 0.000 1.018 1.022 1.010 0.000 1.008 1.012
Rogi Kalyan Samiti 1.215 0.000 1.120 1.317 1.147 0.000 1.065 1.235
Medical officers’ training 0.854 0.000 0.788 0.926 1.003 0.355 0.997 1.009
Paramedical staff training 1.010 0.000 1.006 1.014 1.004 0.032 1.000 1.007
Urban location of the CHC 1.331 0.000 1.247 1.420 1.149 0.000 1.081 1.221
CHC designated as the first referral unit 1.188 0.000 1.122 1.258 1.006 0.837 0.953 1.061
Region North®
Central 0.669 0.003 0.514 0.872 0.706 0.019 0.528 0.943
East 0.639 0.005 0.466 0.875 0.680 0.009 0.508 0.910
Northeast 1.216 0.275 0.856 1.728 1.554 0.015 1.091 2.214
West 1.095 0.552 0.812 1.476 0.900 0.495 0.664 1.219
South 1.351 0.034 1.023 1.785 1.232 0.142 0.932 1.628
% of population in the lowest wealth quintile 1.016 0.018 1.003 1.029 1.002 0.735 0.991 1.014
% Hindu population 1.000 0.980 0.997 1.003 1.000 0.792 0.997 1.004
Average years of schooling among mothers 1.044 0.061 0.998 1.092 1.045 0.039 0.963 1.179
Total fertility rate 0.854 0.000 0.788 0.926 1.065 0.222 0.941 1.158
Log of catchment population of CHC 1.019 0.205 0.990 1.050 0.987 0.366 0.959 1.015
Note: ® Reference category, CHC – Community health centres.

248
Table 7A. 18 Variance inflation factor and tolerance for the Community Health Centre model
Variables VIF 1/VIF
Specialists 1.26 0.79
Medical officers 1.29 0.77
Nurses 1.48 0.67
Allied health professionals 1.23 0.81
Infrastructure 1.21 0.83
Transport 1.54 0.65
Furniture/Instruments 1.02 0.98
Equipment 1.28 0.78
Essential drugs 1.42 0.71
Beds 1.05 0.96
Rogi Kalyan Samiti 1.23 0.81
Medical officers trained 1.17 0.86
Paramedical staff trained 1.11 0.90
First referral unit 1.14 0.88
Urban location 1.45 0.69
Central 5.63 0.18
East 1.65 0.61
Northeast 2.54 0.39
West 2.71 0.37
South 3.16 0.32
Proportion of poor 1.15 0.87
Proportion of Hindus 1.78 0.56
Maternal education 2.76 0.36
Total fertility rate 2.77 0.36
Log of the catchment population 1.31 0.76
Mean VIF 1.79
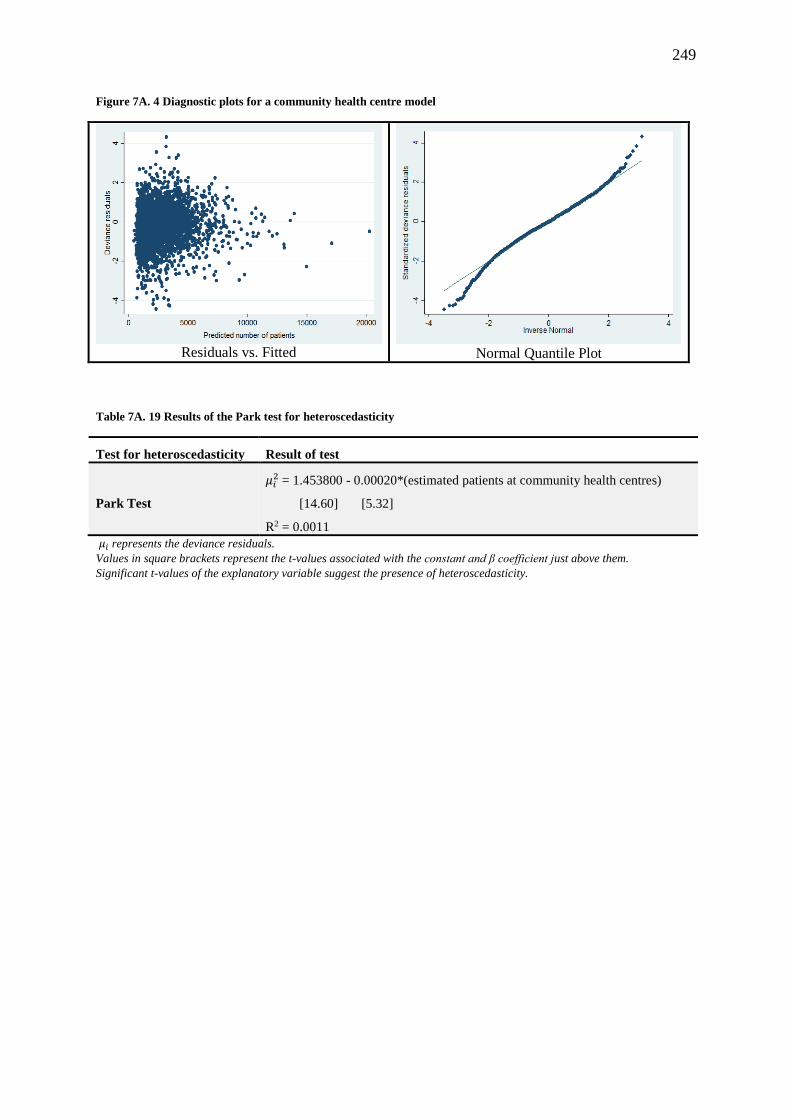
249
Figure 7A. 4 Diagnostic plots for a community health centre model
Residuals vs. Fitted
Normal Quantile Plot
Table 7A. 19 Results of the Park test for heteroscedasticity
Test for heteroscedasticity Result of test
Park Test
𝜇𝑖2 = 1.453800 - 0.00020*(estimated patients at community health centres)
[14.60] [5.32]
R2 = 0.0011
𝜇𝑖 represents the deviance residuals.
Values in square brackets represent the t-values associated with the constant and β coefficient just above them.
Significant t-values of the explanatory variable suggest the presence of heteroscedasticity.
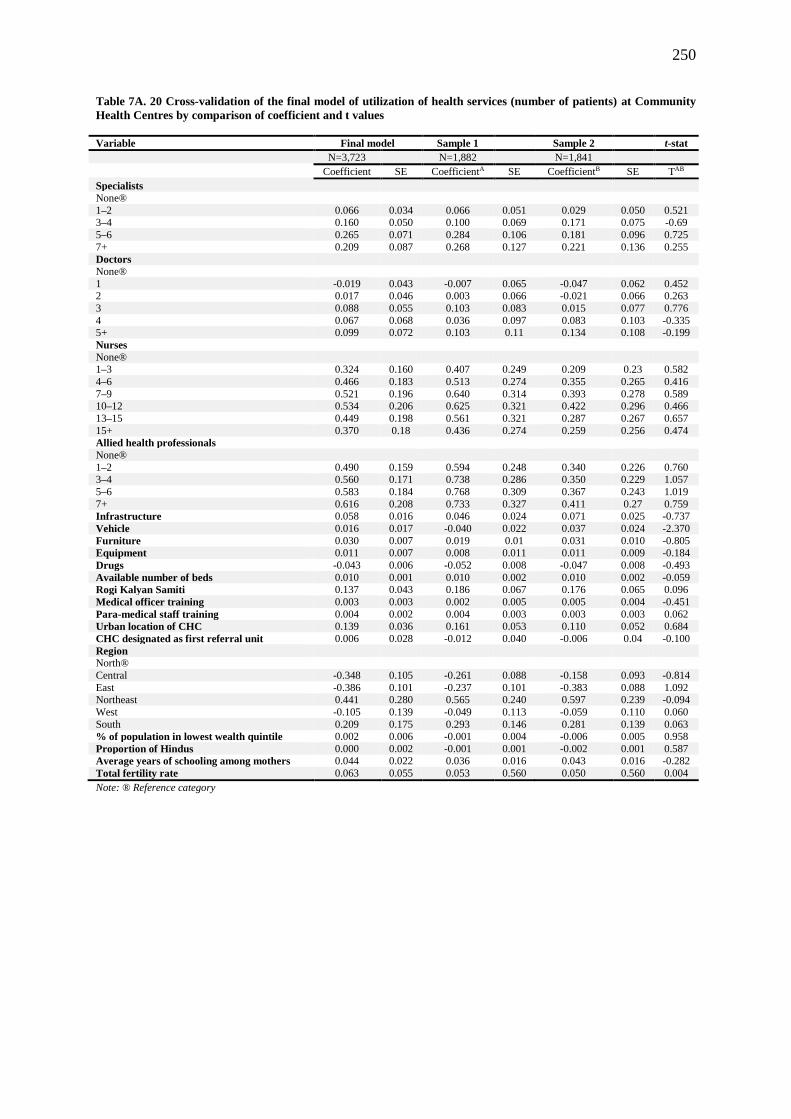
250
Table 7A. 20 Cross-validation of the final model of utilization of health services (number of patients) at Community
Health Centres by comparison of coefficient and t values
Variable Final model Sample 1
Sample 2
t-stat
N=3,723
N=1,882
N=1,841
Coefficient SE CoefficientA SE CoefficientB SE TAB
Specialists
None®
1–2 0.066 0.034 0.066 0.051 0.029 0.050 0.521 3–4 0.160 0.050 0.100 0.069 0.171 0.075 -0.69
5–6 0.265 0.071 0.284 0.106 0.181 0.096 0.725
7+ 0.209 0.087 0.268 0.127 0.221 0.136 0.255
Doctors
None®
1 -0.019 0.043 -0.007 0.065 -0.047 0.062 0.452 2 0.017 0.046 0.003 0.066 -0.021 0.066 0.263
3 0.088 0.055 0.103 0.083 0.015 0.077 0.776
4 0.067 0.068 0.036 0.097 0.083 0.103 -0.335 5+ 0.099 0.072 0.103 0.11 0.134 0.108 -0.199
Nurses
None® 1–3 0.324 0.160 0.407 0.249 0.209 0.23 0.582
4–6 0.466 0.183 0.513 0.274 0.355 0.265 0.416
7–9 0.521 0.196 0.640 0.314 0.393 0.278 0.589 10–12 0.534 0.206 0.625 0.321 0.422 0.296 0.466
13–15 0.449 0.198 0.561 0.321 0.287 0.267 0.657
15+ 0.370 0.18 0.436 0.274 0.259 0.256 0.474
Allied health professionals
None®
1–2 0.490 0.159 0.594 0.248 0.340 0.226 0.760 3–4 0.560 0.171 0.738 0.286 0.350 0.229 1.057
5–6 0.583 0.184 0.768 0.309 0.367 0.243 1.019
7+ 0.616 0.208 0.733 0.327 0.411 0.27 0.759
Infrastructure 0.058 0.016 0.046 0.024 0.071 0.025 -0.737
Vehicle 0.016 0.017 -0.040 0.022 0.037 0.024 -2.370
Furniture 0.030 0.007 0.019 0.01 0.031 0.010 -0.805
Equipment 0.011 0.007 0.008 0.011 0.011 0.009 -0.184
Drugs -0.043 0.006 -0.052 0.008 -0.047 0.008 -0.493
Available number of beds 0.010 0.001 0.010 0.002 0.010 0.002 -0.059
Rogi Kalyan Samiti 0.137 0.043 0.186 0.067 0.176 0.065 0.096
Medical officer training 0.003 0.003 0.002 0.005 0.005 0.004 -0.451
Para-medical staff training 0.004 0.002 0.004 0.003 0.003 0.003 0.062
Urban location of CHC 0.139 0.036 0.161 0.053 0.110 0.052 0.684
CHC designated as first referral unit 0.006 0.028 -0.012 0.040 -0.006 0.04 -0.100
Region
North®
Central -0.348 0.105 -0.261 0.088 -0.158 0.093 -0.814
East -0.386 0.101 -0.237 0.101 -0.383 0.088 1.092 Northeast 0.441 0.280 0.565 0.240 0.597 0.239 -0.094
West -0.105 0.139 -0.049 0.113 -0.059 0.110 0.060
South 0.209 0.175 0.293 0.146 0.281 0.139 0.063
% of population in lowest wealth quintile 0.002 0.006 -0.001 0.004 -0.006 0.005 0.958
Proportion of Hindus 0.000 0.002 -0.001 0.001 -0.002 0.001 0.587
Average years of schooling among mothers 0.044 0.022 0.036 0.016 0.043 0.016 -0.282
Total fertility rate 0.063 0.055 0.053 0.560 0.050 0.560 0.004
Note: ® Reference category
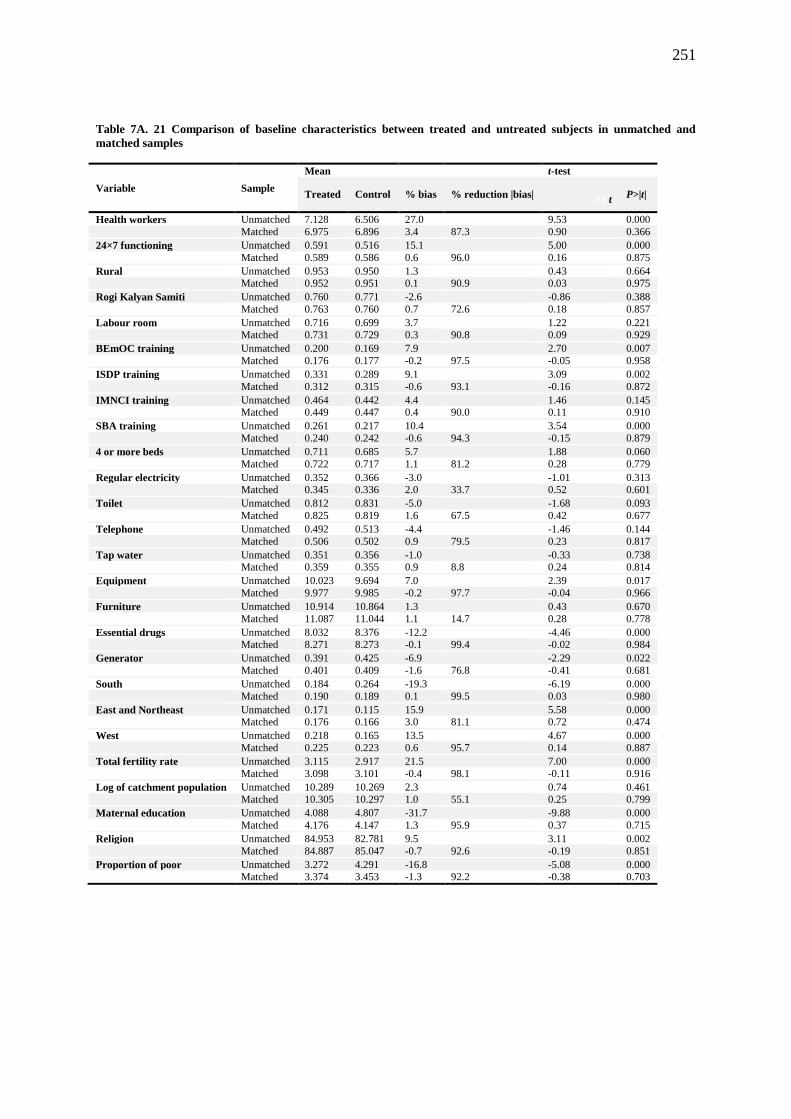
251
Table 7A. 21 Comparison of baseline characteristics between treated and untreated subjects in unmatched and
matched samples
Variable Sample
Mean
t-test
Treated Control % bias % reduction |bias| 11 t
P>|t|
Health workers Unmatched 7.128 6.506 27.0
9.53 0.000
Matched 6.975 6.896 3.4 87.3 0.90 0.366
24×7 functioning Unmatched 0.591 0.516 15.1
5.00 0.000
Matched 0.589 0.586 0.6 96.0 0.16 0.875
Rural Unmatched 0.953 0.950 1.3
0.43 0.664
Matched 0.952 0.951 0.1 90.9 0.03 0.975
Rogi Kalyan Samiti Unmatched 0.760 0.771 -2.6
-0.86 0.388
Matched 0.763 0.760 0.7 72.6 0.18 0.857
Labour room Unmatched 0.716 0.699 3.7
1.22 0.221
Matched 0.731 0.729 0.3 90.8 0.09 0.929
BEmOC training Unmatched 0.200 0.169 7.9
2.70 0.007
Matched 0.176 0.177 -0.2 97.5 -0.05 0.958
ISDP training Unmatched 0.331 0.289 9.1
3.09 0.002
Matched 0.312 0.315 -0.6 93.1 -0.16 0.872
IMNCI training Unmatched 0.464 0.442 4.4
1.46 0.145
Matched 0.449 0.447 0.4 90.0 0.11 0.910
SBA training Unmatched 0.261 0.217 10.4
3.54 0.000
Matched 0.240 0.242 -0.6 94.3 -0.15 0.879
4 or more beds Unmatched 0.711 0.685 5.7
1.88 0.060
Matched 0.722 0.717 1.1 81.2 0.28 0.779
Regular electricity Unmatched 0.352 0.366 -3.0
-1.01 0.313
Matched 0.345 0.336 2.0 33.7 0.52 0.601
Toilet Unmatched 0.812 0.831 -5.0
-1.68 0.093
Matched 0.825 0.819 1.6 67.5 0.42 0.677
Telephone Unmatched 0.492 0.513 -4.4
-1.46 0.144
Matched 0.506 0.502 0.9 79.5 0.23 0.817
Tap water Unmatched 0.351 0.356 -1.0
-0.33 0.738
Matched 0.359 0.355 0.9 8.8 0.24 0.814
Equipment Unmatched 10.023 9.694 7.0
2.39 0.017
Matched 9.977 9.985 -0.2 97.7 -0.04 0.966
Furniture Unmatched 10.914 10.864 1.3
0.43 0.670
Matched 11.087 11.044 1.1 14.7 0.28 0.778
Essential drugs Unmatched 8.032 8.376 -12.2
-4.46 0.000
Matched 8.271 8.273 -0.1 99.4 -0.02 0.984
Generator Unmatched 0.391 0.425 -6.9
-2.29 0.022
Matched 0.401 0.409 -1.6 76.8 -0.41 0.681
South Unmatched 0.184 0.264 -19.3
-6.19 0.000
Matched 0.190 0.189 0.1 99.5 0.03 0.980
East and Northeast Unmatched 0.171 0.115 15.9
5.58 0.000
Matched 0.176 0.166 3.0 81.1 0.72 0.474
West Unmatched 0.218 0.165 13.5
4.67 0.000
Matched 0.225 0.223 0.6 95.7 0.14 0.887
Total fertility rate Unmatched 3.115 2.917 21.5
7.00 0.000
Matched 3.098 3.101 -0.4 98.1 -0.11 0.916
Log of catchment population Unmatched 10.289 10.269 2.3
0.74 0.461
Matched 10.305 10.297 1.0 55.1 0.25 0.799
Maternal education Unmatched 4.088 4.807 -31.7
-9.88 0.000
Matched 4.176 4.147 1.3 95.9 0.37 0.715
Religion Unmatched 84.953 82.781 9.5
3.11 0.002
Matched 84.887 85.047 -0.7 92.6 -0.19 0.851
Proportion of poor Unmatched 3.272 4.291 -16.8
-5.08 0.000
Matched 3.374 3.453 -1.3 92.2 -0.38 0.703

252
12 Appendix 1: Participant Recruitment Letter
Date:
School of Health Sciences and Social Work
James Watson West
King Richard 1st Rd
Portsmouth
Dear ………………,
I am writing to invite you to take part in a research study that intends to explore the causes of
shortages and distributional imbalances of health workers in public health facilities in rural areas.
Since you have been working with health system, your opinions and thoughts about this issue would
be of great value to my research. Therefore, I would like to invite you to a one to one interview in
which you can give your opinions and talk about your experiences.
If you would like to take part in a face-to-face interview, please read the enclosed information sheet
and return the reply slip in the envelope provided. When I receive your reply slip I will arrange to
come and see you at a time that is convenient for you.
The findings of this study will be written up for publication and presented at conferences. When the
results of the study are ready, I will send you a brief summary of the findings. If you would like a full
copy of the report, this can also be arranged. I hope that the results will enhance the understanding
causes of shortages and distributional inequality and help the government in improving human
resources policy in health sector.
Thank you in advance for considering taking part in the research.
Yours sincerely,
Aditya Singh

253
13 Appendix 2: Participant Consent Form
Participant Identification Number:
PARTICIPANT CONSENT FORM
Human resources in primary healthcare in India: distributive imbalances, causes and health
impacts
1. I confirm that I have read and understand the Information Sheet dated 02-02-13 for the above
study. I have had the chance to consider the information, ask questions and have had these answered
to my liking.
2. I understand that it is my free choice to take part in the study and that I am free to withdraw at any
time without giving any reason, without my medical care or legal rights being affected.
3. I understand that if I don’t want to carry on with the study, then I may withdraw from the study.
Any identifiable data that has already been collected will be kept and used in the study but no new
data will be collected from me.
4. I give my permission for the interview to be tape-recorded so the discussion can be analysed by
the researcher/ the members of the research team.
5. I agree for my data that is collected for the above study, once made anonymous, may be securely
stored and used in future research studies, which have been approved by the Research Ethics
Committee.
6. I agree to take part in this study.
___________________ ________________ _________________
Name of the participant Date Signature
___________________ _______________ _________________
Name of the person taking consent Date Signature
When completed, 1 for interviewee; 1 for researcher site file; 1 (original) to be kept in notes.
254
14 Appendix 3: Ethics Favourable Opinion

255
15 Appendix 4: Interview Guide for Medical Officer In-
Charge at Primary Health Centre
I. Basic human resource information (To be collected from PHC) –
Total number – posts sanctioned, in-position, post vacant
II. Data to be collected from interview with MOIC PHC
What are the most
important problems your
PHC is currently facing?
Physical infrastructure
Buildings – residential/hospital
Quality (condition of the buildings – new/old/poor, rented/own)
Quantity (enough space for clinic, wards, treatment rooms, offices, stores, quarters for
doctors, nurses, ward boy and driver)
Security – walled campus, gate
Equipment –
Quantity - Equipment for immunization, operation theatre/labour rooms with new-born
corner, and surgical sets
Quality – present condition, use and underuse, maintenance of equipment; Basic amenities –
drinking water, electricity, sanitation, telephone, emergency lighting, garbage disposal, all
weather road communication; vehicle
Human resources –
Adequate number – of nurses, doctors, paramedical, administrative and support staff
Sanctioned posts filled
In-service training for staff
Workers’ safety
Supply of Drug – adequate/inadequate
Overcrowding – long queues, waiting time etc.
Records indicate that your
facility has almost all the
sanctioned post filled?
What will you attribute
this to?
PHC characteristics –
Location,
Infrastructure – buildings (residential/medical facility)
Water, electricity, sanitation
Adequate clinic infrastructure - drugs, equipment, laboratories, ambulance
Adequacy of support staff
Adequate number of patients
Physical work environment - cleanliness, good furniture, good construction, private cabin
Community characteristics –
Availability of educational facilities,
Good transport and communication
Entertainment facilities
Easy accessibility to market
Family affiliations
Proximity to family (near home town or village)
Job availability for spouse
Proximity to a town or the district headquarter
Security – especially of female doctors/couples
Any other factor –
Location of nearest private and other public health facilities
Policy-related factors – delays in deployment etc.
Records indicate that your
facility has many
sanctioned post vacant?
What will you attribute
this to?
PHC characteristics –
Location (in inner accessible parts)
Poor infrastructure - old buildings, lack of residential/medical facility buildings,
Drinking water
Electricity
Sanitation

256
Clinic infrastructure –
Inadequate supply of drugs
Availability and functional status of equipment
Inadequate administrative and support staff (how does the interdependence of workers affect
availability itself)
Workload – working hours, no shift system, inadequate number of patients
Physical work environment – lack of cleanliness, old/no furniture, poor construction of the
building, no private cabin
Community characteristics –
Lack of educational facilities
Poor transport and communication
Lack of entertainment facilities
Market located far away
Distance from family (near home town or village)
No job availability for spouse
Distance to the town or the district headquarter
Lack of security – theft - especially for female doctors/couples.
Any other factors –
Attrition due to –
punishment transfers
Further medical education
Poor salaries and better jobs in other places
Private practice
Need perception – to be asked especially in the case of pharmacist, number of nurses,
administrative and support staff.
How does the unavailability
(vacant positions) of health
workers affect overall
functioning of PHC?
• Immunization campaigns
• Maternity care – antenatal and postnatal visits to the mothers
• Institutional delivery
• Medicine distribution
• Maintenance of equipment
• Overburdened health workers
What could be done to
reduce the shortage of
health workers?
Questions about shortage of health workers in HSCs –
Health Sub-Centre
(HSC)
Questions
What are the main challenges to HSCs
under your PHC?
Probes Health infrastructure – buildings (hospital,
residential accommodation/quarters, drinking
water, electricity, sanitation)
Supply of drugs/medicines- enough drugs
issues of equipment – availability, use and underuse
Financing-funds for all the above
Staff – availability, absenteeism etc
in-service training of the staff
Monitoring of functioning of HSCs
Among discussed challenges, where do you place the problem of shortage of human resource at
HSC level in the hierarchy? – Low priority, medium priority or high priority.
Additional Auxiliary
Nurse and Midwife
(Additional ANM)
Do you think additional ANMs are in shortage in HSCs? (if the answer is negative – explain IPHS
norms and put data for evidence)
Could you briefly tell us some of the
important reasons behind shortage of
additional ANMs in HSCs?
production (training centres, annual capacity) in the
state
enough sanctioning of the posts
recruitment – the process
deployment policies

257
Other ANM policies in the state
funding of salaries of additional ANMs
Why Additional ANMs are available in some
HSCs and not in others. HSC characteristics
Physical infrastructure – buildings
(residential/medical facility)
water
electricity
sanitation
Security
adequacy of support staff
Workload – working hours (flexible or fixed)
adequate number of patients
Physical work environment - cleanliness, good
furniture
Community characteristics
Educational facilities
Transport- Accessibility by all-weather road
Entertainment facilities
Access to market
Family affiliations
Proximity to family (near home town or village)
Security
Social environment conducive for females
Male Health Workers What could be the reasons of shortage of
male health workers in HSCs?
production (training centres, annual capacity) in the
state
enough sanctioning of the posts
recruitment – the process
deployment policies for MHW
Salary – is it less than what they can earn elsewhere
with the same qualification?
Funding – for salary and incentives etc.
Why they are unequally distributed across
health facilities? Some facilities have MHW
but others don’t?
Similar probes as ANM
Support Worker Support worker is missing from many health
facilities? What do you think could be the
reasons behind vacant posts in some facilities
and filled post in others?
Recruitment – number of applicants
process of recruitment
deployment delays
lack of funds for salary, incentives etc
government and policymakers’ attitude towards
support workers’ importance
attrition if any – why

258
16 Appendix 5: Interview Guide for Medical Officers at the
Community Health Centre
I. Data to be collected from secondary sources
Basic human resource information (To be collected from CHC) –
Total number – posts sanctioned, in-position, post vacant
II. Data to be collected from interview with MOIC CHC.
What are the most important problems your
CHC is currently facing?
PHYSICAL INFRASTRUCTURE –
Buildings – residential/hospital
Quality (condition of the buildings- new/old/poor, rented/own)
quantity (enough space for clinics for various medical disciplines, wards,
treatment rooms, offices, stores, quarters for doctors, nurses, ward boy and
driver)
security – walled campus, gate
EQUIPMENT – Quantity (Refrigerators etc.)
Quality – present condition,
use and underuse,
maintenance of equipment
Blood bank related issues.
Equipment for non-communicable diseases, immunization, radiology,
operation theatre/labour rooms with new-born corner, blood transfusion,
and surgical sets.
BASIC AMENITIES – Drinking water
Electricity
Sanitation
Telephone
Emergency lighting,
Garbage disposal
All weather road
Vehicle
HUMAN RESOURCES – Adequate number
Sanctioned posts filled
Training for staff (in-service)
Workers’ safety
Absenteeism
FOR THE CHC WHERE MAJORITY OF POST ARE FILLED
Records indicate that you facility has almost
all the sanctioned post filled? What will
attribute this to?
CHC CHARACTERISTICS –
Location – distance from headquarter, town
Infrastructure – buildings (residential/medical facility)
Basic amenities - Water,
Electricity,
Sanitation
Adequate clinic infrastructure - drugs,
equipment,
laboratories,
ambulance;
adequacy of support staff;
workload - fixed working hours,
shift system,
adequate number of patients
Physical work environment - cleanliness,
good furniture,
good construction,
private cabin
COMMUNITY AMENITIES – educational facilities,
transport and communication
entertainment facilities
access to market
family affiliations

259
Proximity to family (near home
town or village)
Job availability for spouse
proximity to a town or the district
headquarter
Security – from theft, riots etc. –
especially of female doctors/couples
OTHER FACTORS –
Any other factors that favour the deployment of human resources in your
CHC
Any special administrative support towards this CHC
Are decisions to deploy doctors and nurses anyway influenced by politics?
FOR THE CHC WHERE MAJORITY OF POST ARE NOT FILLED
Records indicate that you facility has a few
sanctioned posts filled? What will attribute
this to?
CHC CHARACTERISTICS –
Location (in inner accessible parts),
Poor infrastructure – old buildings
(lack of residential/medical facility buildings)
Lack of drinking water,
Electricity – connection, availability,
emergency lighting
Sanitation
Clinic infrastructure –
Inadequate supply of drugs and equipment
Poorly equipped and maintained laboratories
Absence of an ambulance or any vehicle
Inadequate number of support staff
Workload – working hours, no shift system
Inadequate number of patients
Physical work environment –
Lack of cleanliness,
Old/no furniture
Poor construction of the building
No private cabin
COMMUNITY CHARACTERISTICS –
Lack of educational facilities,
Lack of transport and communication
facilities
Lack of entertainment facilities
Market located far away
Distance from family (near home town or
village)
No job availability for spouse
Distance to the town or the district
headquarter
Lack of security – theft, riots, threats etc. -
especially of female doctors/couples;
Other factors –
Any other factors affecting deployment of human resources
Any administrative bias towards particular CHCs
Are decisions to deploy doctors and nurses anyway influenced by politics?
What do you think can be done to fill the
vacancies at your CHC? For the CHC where positions are vacant
How do you think the shortage of human
resources affect the overall functioning of you
CHC?
Overload of patients, long lines,
delays in emergency services,
needs multi-tasking
Fallouts of mismatch in qualification and nature of job
Cleanliness
How does it affect immunization in the area covered by this CHC?
How does it affect delivery of antenatal and post natal care?
To what extent delivery facilities are affected?
How does it affect family planning program and conceptive use in the

260
area?
Ask question according to availability and non-availability of the health
worker - for example – if pharmacists are not available or they are less in
number than required.
Then, question might be asked such as how does pharmacist’s availability
affect general functioning of the CHC? Who distributes medicines to the
patients?
Specialist doctors
Nurses
Paramedical workers
Administrative workers
Support workers

261
17 Appendix 6: Interview Guide for Health Sub-Centre ANM
18
I.Data to be collected from secondary sources
Basic human resource information (To be collected from HSC) –
Total number – posts sanctioned, in-position, vacant, duration since vacant
II. Data to be collected using interviews with ANMs.
Question Probes
What are the most important problems your PHC is
currently facing?
Physical infrastructure
Building
Quality (condition of the buildings- new/old/poor, rented/own)
Quantity (enough space),
Security – walled campus, gate
Basic amenities
Drinking water
Electricity
Functional toilet
Telephone
Garbage disposal
Connectivity by all-weather road
Human resources
adequate number
sanctioned posts filled
training for staff
Records indicate that you facility has almost all the
sanctioned post filled? What will attribute this to?
HSC characteristics
Location of the facility
Building
Quality (condition of the buildings- new/old/poor, rented/own)
Quantity (enough space),
Security – walled campus, gate
Basic amenities
Drinking water
Electricity
Functional toilet
Telephone
Garbage disposal
Connectivity by all-weather road
Workload – number of deliveries conducted a month on an average –
more than 20
Community characteristics
Availability of educational facilities
Good transport and communication
Family affiliations
Proximity to family (near home town or village
Proximity to a town or the district headquarters
Other factors
any extra payment should be provided to Staff
no nearby higher level delivery facilities
Records indicate that you facility has sanctioned posts
not filled? What will attribute this to?
HSC characteristics
Location (in inner accessible parts)
Poor infrastructure – old building/rented building/ no building
Lack of drinking water, electricity, functioning toilets
Clinic infrastructure – inadequate supply of drugs and equipment
No support staff

262
Workload - inadequate number of patients
Physical work environment – lack of cleanliness
old/no furniture
Community characteristics
Lack of educational facilities
Poor transport and communication
Distance from family (near home town or village)
No job availability for spouse
Distance to the town or the district headquarter
Lack of security in the area – while working in the villages.
Other factors
higher level health facilities nearby
domination of private facilities in the area
Production (training centres, annual capacity) in the state
enough sanctioning of the posts
recruitment – the process and policies regarding deployment (political
& bureaucratic influences)
Other ANM policies – salary, contract/permanency of job
funding - salaries of ANMs and other workers –not reaches timely
What could be done to fill these vacancies and retain
workers at health facility?

263

264
19 Appendix 7: Interview Guide for Chief/Deputy Medical Officer of the District
Data to be collected from secondary sources
I. Basic human resource information (To be collected from service statistics of CMHO’s office) –
Total number – posts sanctioned, in-position, shortage --- for district as a whole and separately for CHC, PHC and HSC. Also according to cadres – Specialists, Doctors,
Nurses, ANMs, Para-medical staff (Pharmacists, Lab Technicians, and Radiographers) and support workers (see Annex 1)
II. Data to be collected from interview with CMHO/Dy. CMHO
Type of
question Health worker Question Probe
General
1. Can you share with me the major issues that
government health system of this district faces?
Physical infrastructure – buildings (hospital – Functional operation theatre, beds, staff
quarters)
Drinking water, electricity, sanitation
Supplies of drugs- enough drugs
Issues of various medical equipment- availability, use and underuse
Financing - funds for all the above
Staff – shortages, private practice of government doctors etc.
2. Where do you place human resources (staff)
issues in the hierarchy of important
issues/challenges?
CHC
3. Can you give me an idea of the issues that you
think CHCs in this district face?
Physical infrastructure – buildings (hospital, staff quarters, drinking water, electricity,
sanitation);
Supplies of drugs- enough drugs;
Issues of various medical equipment-availability, use and underuse;
Financing-funds for all the above;
Staff – availability etc.
Information and Monitoring Systems - collection and analysis of accurate routine
health information for management decision making
Specialists
(Surgeon,
Ophthalmologist,
Dentist,
4. There are many positions of specialist doctors
still vacant while other filled in CHCs across
the district. What could the reasons behind such
vacancies?
Policy related causes - Training (Medical education) of specialists in the state
Migration to cities and abroad
Recruitment process - sanctioning of the posts (Policy) – advertisement – selection
process – long and tedious

265
Gynaecologist,
Anaesthetist,
Physician,
Paediatrician, IMS)
Chances of further growth professionally
Opportunities for Continual Medical Education (CME)
Job security (permanency of job, pensions)
Regulatory policies (to regulate absenteeism, punctuality of staff)
Policies on leave (inability to take leave when required especially emergency)
Transfer policies and promotions (transparent policy, time of service in rural area not
clearly stated, political interference in transfers)
Private practice related policies
Lack of health information management system – problems in monitoring shortages
and distributional inequalities
Salaries and incentives
Financial Problems with State government
5. Why do we find the post of specialist filled in
some CHCs while in other it is vacant?
• This question is to be asked for every
specialist.
CHC characteristics Location of the CHC - Road connectivity, means of transport
Physical infrastructure - buildings (residential/medical facility), water, electricity,
sanitation
Clinical infrastructure - drugs, equipment, laboratories, ambulance
Workload - fixed working hours, shift system, adequate number of patients
Physical work environment - cleanliness, good furniture, good construction, private
cabin
Community characteristics Educational facilities
Entertainment facilities
Access to market
Family affiliations
Proximity to family (near home town or village)
Job availability for spouse
Proximity to a town or the district headquarter
Security – from theft, riots etc.- especially of female doctors/couples
Private Practice in the community
Nurses 6. Do you think that the number of Nurses in-
position is less than required in this district?
7. What could be the reasons behind overall
shortage of nurses in CHCs?
Policy related factors
Training (Medical education) of Nurses in the state – enough schools/colleges/training
centres?
Recruitment process
sanctioning of the posts (Policy)
advertisement
selection process – long and tedious
Deployment – policy, political influences
Chances of professional growth
266
Promotion policy – problems with career trajectory for nurses
Job security – permanency of job
Pensions
Regulatory policies (to regulate absenteeism, punctuality of staff)
Policies on leave (inability to take leave when required especially emergency)
Transfer policies (transparent policy, time of service in rural area not clearly stated,
interference in transfers)
Salaries and incentives
Financial Problems with State government
8. I have noticed that some CHCs have less
number of Nurses while others have
comparatively more number of Nurses in
position? In your opinion, why such anomaly
occurs?
Community Health Centre characteristics Location of the CHC – Road connectivity, means of transport, interior area/nearby city,
town or market centre
Physical infrastructure – buildings (residential/medical facility), water, electricity,
sanitation
Clinical infrastructure – drugs, equipment, laboratories, ambulance
Workload – fixed working hours, shift system, adequate number of patients
Community characteristics Educational facilities
Entertainment facilities
Access to market
Family affiliations
Proximity to family (near home town or village)
Job availability for spouse
Proximity to a town or the district headquarter
Security – from theft, riots etc.- especially of female doctors/couples
Paramedical Staff
9. How do you see the role of pharmacist in a
CHC?
Perception of the need – role of the pharmacist in the system – do CHCs needs them?
What is your opinion about nurses dispensing drugs in some CHCs?
Pharmacist
10. What could be some of the most important
reasons for the availability of pharmacists in
some CHCs and non-availability in other
CHCs?
Policy-related causes
Training (Medical education) of specialists in the state
Recruitment process – sanctioning of the posts (Policy) – advertisement – selection
process – long and tedious
Chances of further growth professionally
Job security (permanency of job, pensions)
Regulatory policies (to regulate absenteeism, punctuality of staff)
Policies on leave (inability to take leave when required especially emergency)
Transfer policies and promotions (transparent policy, time of service in rural area not
clearly stated, political interference in transfers)
Salaries and incentives – compared to what they can earn in private practice or in

267
private sector
What is the policymakers' attitude towards the issue of need for Pharmacists in health
system
Probe further for AYUSH pharmacists – perception of the need – do systems need
them?
Why was their selection/recruitment recently scrapped by the government?
Lab Technician 11. Why lab technicians’ posts are vacant in some
CHC while these posts are filled in other
CHCs?
Radiographers 12. Why Radiographers’ posts are vacant in some
CHC while these posts are filled in other
CHCs?
Administrative staff
& Assistants
13. Can you give me an idea of the issues that you
think PHCs in this district face nowadays?
Health infrastructure – buildings (hospital, residential accommodation/quarters
,drinking water, electricity, sanitation);
Supplies of drugs – enough drugs
Financing-funds for all the above
Issues of various medical equipment-availability, use and underuse
Staff – availability, inadequate training centres etc.
Lack of information and monitoring systems
14. What are the basic human resource related
challenges at PHC level?
Vacant positions of health workers (doctors, nurses, ANMs, Male Health Workers,
paramedical staff, Support workers)
Absenteeism
Private practice by doctors
Availability of lady doctors and nurses
Skill levels appropriate to the job
Primary
Health
Centre
Medical Officers
(MBBS and
AYUSH)
15. Can you please briefly tell us on the causes of
shortages of health workers at PHC level? Policy related factors Training (Medical education) of doctors in the state – enough schools/colleges/training
centres
Recruitment process – sanctioning of the posts (Policy) – advertisement – selection
process – long and tedious
Deployment – policy, political influences
Chances of further growth – professionally – promotion policy, problems with career
trajectory
Opportunities for Continual Medical Education (CME)
Job security (permanency of job, pensions)
Regulatory policies (to regulate absenteeism, punctuality of staff)
Policies on leave (inability to take leave when required especially emergency)
Transfer policies (transparent policy, time of service in rural area not clearly stated,
268
political interference in transfers)
Salaries and incentives
Financial Problems with State government
PHC characteristics Location (interior area/nearby city, town or market centre)
Physical infrastructure – buildings (residential/medical facility), water, electricity,
sanitation
Adequacy of support staff
Workload – working hours, adequate number of patients
Work environment – cleanliness, good furniture, good construction etc.
Community characteristics
Educational facilities
Transport- Accessibility by all-weather road
Entertainment facilities
Access to market
Family affiliations
Proximity to family (near home town or village)
Security
Social environment conducive for females
Pharmacist
(Allopathic &
AYUSH) &
Laboratory
Technician
16. Can you please briefly tell us on the causes of
shortages of paramedical workers at PHC
level?
Policy related factors
Training (Medical education) in the state
Recruitment process – sanctioning of the posts (Policy) – advertisement – selection
process – long and tedious
Chances of professional growth – promotion policy – carrier trajectory
Job security (permanency/contractual nature of the job, pension)
Regulatory policies (to regulate absenteeism, punctuality of staff)
Policies on leave (inability to take leave when required especially emergency)
Transfer policies and promotions (transparent policy, time of service in rural area not
clearly stated, political interference in transfers)
Salaries – compared to private practice (community pharmacist)
Lack of funding/finance
Policymakers attitude towards the need of Pharmacists in health system Probe further
for AYUSH pharmacists – perception of the need – do system need them? Why was
their selection/recruitment recently scrapped by the government?
PHC characteristics Location (interior area/nearby city, town or market centre)
Physical infrastructure – buildings (residential/medical facility), water, electricity,
sanitation
Adequacy of support staff/administrative staff
Workload - working hours, adequate number of patients
Work environment - cleanliness, good furniture, good construction etc.
Community characteristics

269
Educational facilities
Transport- Accessibility by all-weather road
Entertainment facilities
Access to market
Family affiliations
Proximity to family (near home town or village)
Security
Nurse
Midwife/Lady
Health
Visitor/Health
Assistant (Female)
17. Why are many positions of Nurses and Midwives
vacant in the districts? Policy related factors
Training (Medical education) of Nurses in the state –enough schools/colleges/training
centres
Recruitment process - sanctioning of the posts (Policy) – advertisement – selection
process – long and tedious; deployment - policy, political influences
Chances of professional growth – promotion policy- carrier trajectory
Job security (permanency/contractual nature of the job, pension)
Regulatory policies (to regulate absenteeism, punctuality of staff)
Policies on leave (inability to take leave when required especially emergency)
Transfer policies and promotions (transparent policy, time of service in rural area not
clearly stated, political interference in transfers)
Salaries – compared to private practice (community pharmacist)
Lack of funding/finance
Policymakers attitude towards the need of Pharmacists in health system Probe further
for AYUSH pharmacists – perception of the need – do system need them? Why was
their selection/recruitment recently scrapped by the government?
PHC characteristics
Location (interior area/nearby city, town or market centre)
Physical infrastructure – buildings (residential/medical facility), water, electricity,
sanitation
Adequacy of support staff
Workload – working hours, adequate number of patients
Work environment – cleanliness, good furniture, good construction etc.
Community characteristics Educational facilities
Transport- Accessibility by all-weather road
Entertainment facilities
Access to market
Family affiliations
Proximity to family (near home town or village)
Security
Social environment conducive for females
Multi-skilled
Group D worker
& Sanitary worker
18. Why do some PHCs and CHCs not have support
worker in position?
Recruitment – number of applicants – process of recruitment – deployment delays
Lack of funds for salary, incentives etc

270
cum watchman Government and policymakers’ attitude towards support workers’ importance
Attrition if any – why
Health Sub-Centre (HSC) 19. What are the main challenges at HSC level? Health infrastructure – buildings (hospital, residential Accommodation/quarters,
drinking water, electricity, sanitation)
Supply of drugs/medicines- enough drugs
Issues of equipment – availability, use and underuse
Financing – funds for all the above
Staff – availability, absenteeism etc.
In-service training of the staff
Monitoring of functioning of HSCs
20. Among discussed challenges, where do you place the problem of shortage of human resource at HSC level in the hierarchy? – Low priority, medium
priority or high priority.
Additional Auxiliary Nurse
and Midwife (Additional
ANM)
21. Do you think additional ANMs are in shortage in HSCs in the district? (if the answer is negative – explain IPHS norms and put data for evidence)
22. Could you briefly tell us some of the important reasons
behind shortage of additional ANMs in HSCs?
production (training centres, annual capacity) in the state
enough sanctioning of the posts
recruitment – the process
deployment policies
Other ANM policies in the state
funding of salaries of additional ANMs
23. Why Additional ANMs are available in some HSCs and not
in others.
HSC characteristics
Physical infrastructure – buildings (residential/medical facility)
Water
electricity
Sanitation
271
Security
adequacy of support staff
Workload – working hours (flexible or fixed)
adequate number of patients
Physical work environment – cleanliness, good furniture
Community characteristics
Educational facilities
Transport- Accessibility by all-weather road
Entertainment facilities
Access to market
Family affiliations
Proximity to family (near home town or village)
Security
Social environment conducive for females
Male Health Workers 24. What could be the reasons of shortage of male health workers
in HSCs?
production (training centres, annual capacity) in the state
enough sanctioning of the posts
recruitment – the process
deployment policies for MHW
Salary – is it less than what they can earn elsewhere with the same qualification?
Funding – for salary and incentives etc.
25. Why they are unequally distributed across health facilities?
Some facilities have MHW but others don’t?
Similar probes as ANM
Support Worker 26. Support worker is missing from many health facilities? What
do you think could be the reasons behind vacant posts in some
facilities and filled post in others?
Recruitment – number of applicants
process of recruitment
deployment delays

272
lack of funds for salary, incentives etc.
government and policymakers’ attitude towards support workers’ importance
attrition if any – why
What do you think can be done to fill the vacancies at your CHC?
Ask questions for each specialty doctor, nurses and midwives, by type of
paramedical staff, administrative and support staff - short term solutions and long
terms solutions
What do you think can be done to fill the vacancies at your PHC?
Ask questions for doctor, nurses and midwives, pharmacist, lab technician,
administrative and support staff- short term solutions and long terms solutions
What do you think can be done to fill the vacancies at your HSC?
Ask questions about additional ANMs, Male Health Workers and Support workers
– short term solutions and long terms solutions

273
20 Appendix 8. Human resources in the rural health system
in Sitapur
Type of Health Facility Sanctioned Filled Vacant IPHS Norms
COMMUNITY HEALTH CENTRE
Specialty Services
General Surgeon
Physician
Gynaecologist
Paediatrician
Anaesthetist
Dental Surgeon
General Duty Medical Officer
Medical Officer – AYUSH
Nurses and Paramedical
Staff Nurse
Pharmacist
Pharmacist – AYUSH
Lab. Technician
Radiographer
Dietician
Ophthalmic Assistant
Dental Assistant
Cold Chain & Vaccine Logical Attendant
OT Technician
Counsellor
Administrative Staff
Statistical Assistant
Account Assistant
Administrative Assistant
Group D Staff
Dresser
Ward Boys
Driver
Total
PRIMARY HEALTH CENTRE
Medical Officer – MBBS
Medical Officer –AYUSH
Accountant cum Data Entry Operator
Pharmacist
Pharmacist AYUSH
Nurse-midwife (Staff-Nurse)
Health worker (Female)
Health Assistant. (Male)
Health Assistant (Female)/LHV
Health Educator
Laboratory Technician
Cold Chain & Vaccine Logistic Assistant
Multi-skilled Group D worker
Sanitary worker cum watchman
Total
HEALTH SUB-CENTRE
ANM
Additional ANMs
Male Health Workers
Support Worker
Total
District Total

274
GLIMPSES OF THE FIELD
A typical sub-centre in Uttar Pradesh
Sub-centres are often located a few hundred meters away from the main village

275
A sub-centre ANM on a busy day
Misuse of sub-centre building: such scenes are commonplace.
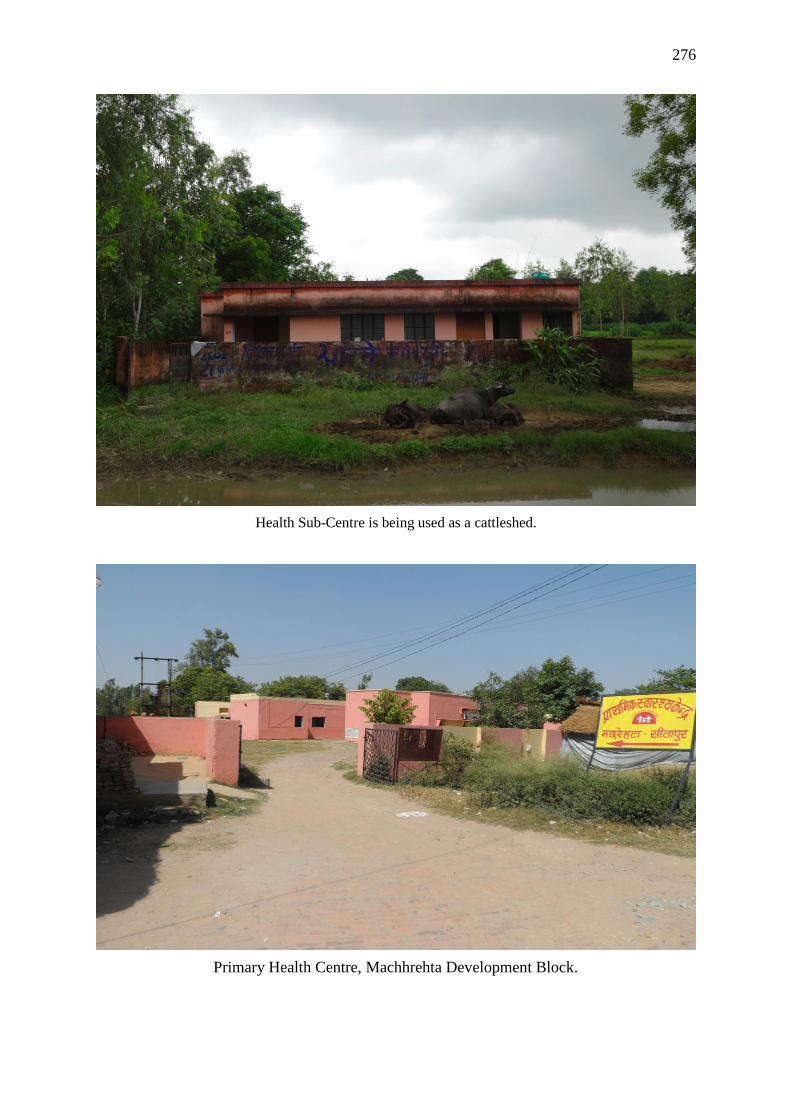
276
Health Sub-Centre is being used as a cattleshed.
Primary Health Centre, Machhrehta Development Block.

277
Community Health Centre, Pisawan Development Block.
Community Health Centre, Tambaur
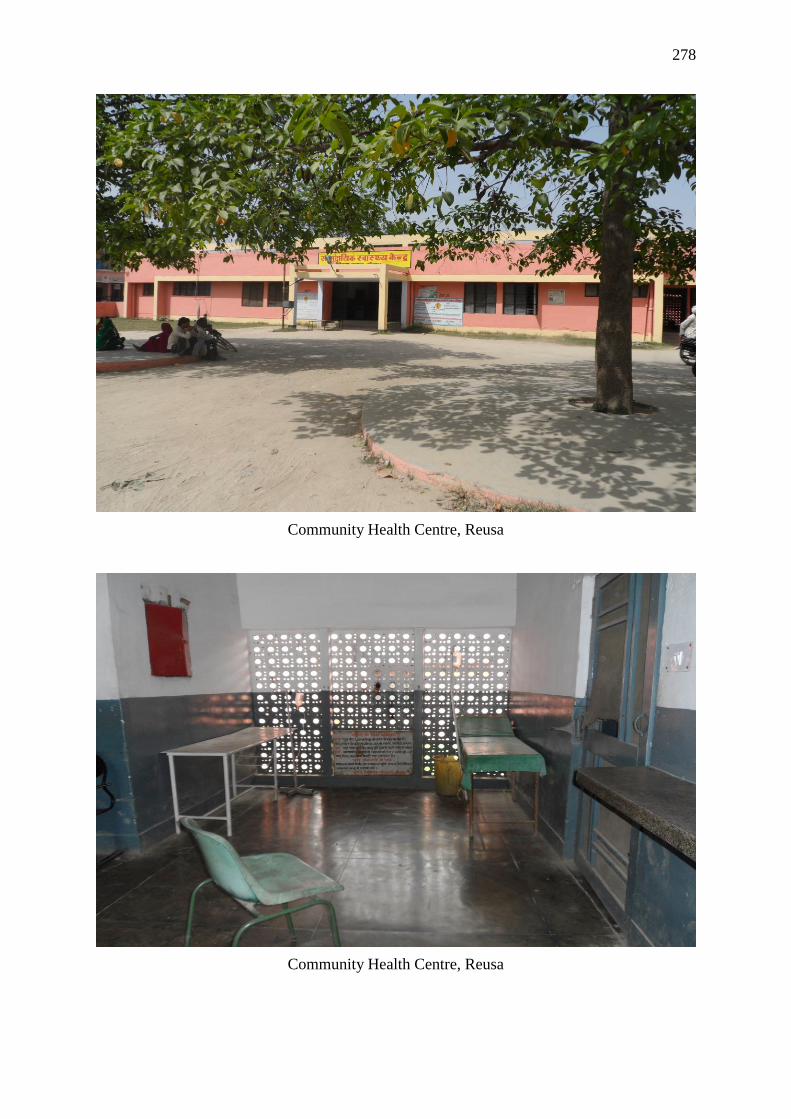
278
Community Health Centre, Reusa
Community Health Centre, Reusa

279
A newsreport in local newspaper describes deplorable conditions prevailing at Community
Health Centre, Tambaur (8th August 2013).
Family members of the patients waiting and resting on the ramp at Community Health
Centre, Tambaur

280
YouTube Links:
1. Primary Health Centre, Behar Gaur, Sitapur –
https://www.youtube.com/watch?v=Ty3ifVcalyc
2. Primary Health Centre, Sirkida, Sitapur -
https://www.youtube.com/watch?v=2cKfQ0eppgA
3. Primary Health Centres, Samodideeh, Sitapur –
https://www.youtube.com/watch?v=2e_UQsXI_Hw
Blog: Rural public health system in Sitapur, Uttar Pradesh - Experiences of a PhD student.
http://aadiatportsmouth.blogspot.co.uk/2014/01/rural-public-health-system-in-sitapur.html