Embed Size (px)
Citation preview
AVAILABILITY AND CHEMICAL QUALITY OF WATER FROM
SURFICIAL AQUIFERS IN SOUTHWEST MINNESOTA
By D. G. Adolphson
U.S. GEOLOGICAL SURVEY
Water-Resources Investigations Report 83-4030
Prepared in cooperation with the
SOUTHWEST REGIONAL DEVELOPMENT COMMISSION and the
MINNESOTA DEPARTMENT OF NATURAL RESOURCES
St. Paul, Minnesota 1983
UNITED STATES DEPARTMENT OF THE INTERIOR
JAMES G. WATT, Secretary
GEOLOGICAL SURVEY
Dallas L. Peck, Director._»
- .; : ?- f
«*
For additonal information write to:
District Chief U.S. Geological Survey 702 Post Office Building St. Paul, Minnesota 55101 Telephone: (612) 725-7841
Copies of this report can be purchased from:
Open-File Services Section Western Distribution Branch U.S. Geological Survey Box 25425, Federal Center Denver, Colorado 80225 Telephone: (303) 234-5888
CONTENTS
Page Abstract ................................................................. 1Introduction.............................................................. 1
Background........................................................... 1Purpose and scope..................................................... 2Location, extent, and climate ........................................... 2Methods ............................................................. 2Previous investigations................................................. 2Well and test-hole numbering system..................................... 4Glossary ............................................................. 4Physiography and surficial geology....................................... 7
Availability of ground-water supplies ........................................ 9Quality of ground water.................................................... 13Presentation of data by counties ............................................ 16
Cottonwood County ................................................... 16Des Moines River valley aquifer ..................................... 18
Jackson County ....................................................... 18Des Moines River valley aquifer ..................................... 18
Lincoln County ....................................................... 20Flandreau Creek-Lake Benton channel aquifer......................... 20Elkton aquifer .................................................... 20Porter aquifer .................................................... 20
Murray County........................................................ 20Des Moines River valley aquifer..................................... 23
Nobles County ........................................................ 23Kanaranzi Creek valley aquifer ..................................... 23Worthington channels .............................................. 26
Pipestone County ..................................................... 26Rock River valley aquifer .......................................... 26Big Sioux tributary aquifers......................................... 28
Redwood County ...................................................... 28Redwood River valley aquifer ....................................... 30Cottonwood River valley aquifer .................................... 30
Rock County ......................................................... 31Rock River valley aquifer .......................................... 31Big Sioux tributary aquifers......................................... 31
Summary and conclusions................................................... 34References............................................................... 35
ILLUSTRATIONS
Plates 1-8. Maps showing hydrogeology of the outwash deposits in:1. Cottonwood County .................................. In back2. Jackson County ...................................... In back3. Lincoln County ...................................... In back4. Murray County....................................... In back
iii
! i
ILLUSTRATIONS Continued
Page Plates 1-8. Maps showing hydrogeology of the outwash deposits in: Continued
5. Nobles County ....................................... In back6. Pipestone County .................................... In back7. Redwood County ..................................... In back8. Rock County ........................................ In back
Figure 1. Map showing location of study area and watersheds ............... 32. Diagram showing well and test-hole numbering system ............ 53. Map showing thickness of drift and predominant glacial features.... 84. Map showing location of surficial aquifers ....................... 105. Map showing location of observation wells and aquifer tests........ 11
1 -!TABLES
i
Table 1. Standards for some of the chemical constituents.................. 132. Chemical analyses of ground water from surficial deposits ......... 14
3-10. Summary of test-hole data for surficial deposits in:3. Cottonwood County .................................... 174. Jackson County ........................................ 195. Lincoln County ........................................ 216. Murray County......................................... 227. Nobles County......................................... 248. Pipestone County ...................................... 279. Redwood County....................................... 29
10. Rock County .......................................... 32
CONVERSION FACTORS
Multiply inch-pound units
inch (in.)foot (ft)acre r.mile (mi)square mile (mi )foot squared per day (ft /d)foot per mile (ft/mi)cubic foot per second (ft /s)gallon per minute (gal/min)
SL
25.400.30480.40471.6092.5900.09200.18940.28320.6309
To obtain SI (metric) units
millimeter (mm) meter (m) hectare kilometer (km) square kilometer (km ) meter squared per day (m /d) meter per kilometer (m/km) cubic meter per second (m /s) liter per second (L/s)
National Geodetic Vertical Datum of 1929 (NGVD of 1929); A geodetic datum derived from a general adjustment of the first-order level nets of both the United States and Canada, formerly called "Mean Sea Level."
iv
AVAILABILITY AND CHEMICAL QUALITY OF WATER FROM SURFICIAL AQUIFERS IN SOUTHWEST MINNESOTA
By D. G. Adolphson
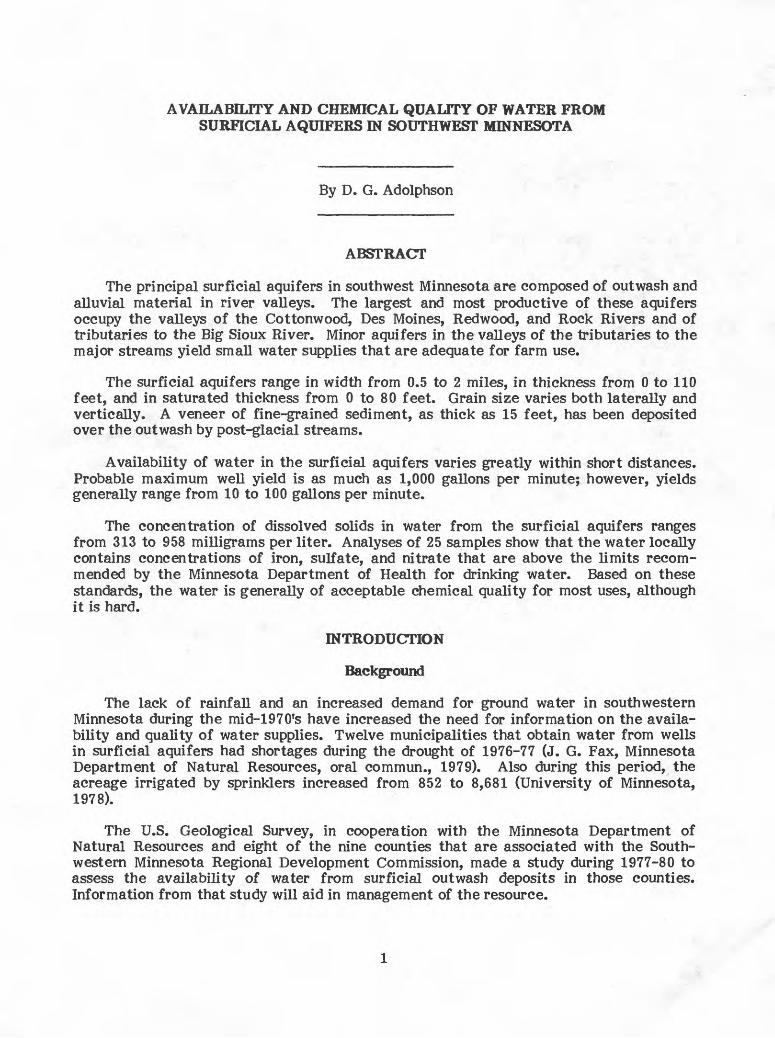
ABSTRACT
The principal surficial aquifers in southwest Minnesota are composed of outwash and alluvial material in river valleys. The largest and most productive of these aquifers occupy the valleys of the Cottonwood, Des Moines, Redwood, and Rock Rivers and of tributaries to the Big Sioux River. Minor aquifers in the valleys of the tributaries to the major streams yield small water supplies that are adequate for farm use.
The surficial aquifers range in width from 0.5 to 2 miles, in thickness from 0 to 110 feet, and in saturated thickness from 0 to 80 feet. Grain size varies both laterally and vertically. A veneer of fine-grained sediment, as thick as 15 feet, has been deposited over the outwash by post-glacial streams.
Availability of water in the surficial aquifers varies greatly within short distances. Probable maximum well yield is as much as 1,000 gallons per minute; however, yields generally range from 10 to 100 gallons per minute.
The concentration of dissolved solids in water from the surficial aquifers ranges from 313 to 958 milligrams per liter. Analyses of 25 samples show that the water locally contains concentrations of iron, sulfate, and nitrate that are above the limits recom mended by the Minnesota Department of Health for drinking water. Based on these standards, the water is generally of acceptable chemical quality for most uses, although it is hard.
INTRODUCTION
Background
The lack of rainfall and an increased demand for ground water in southwestern Minnesota during the mid-1970fs have increased the need for information on the availa bility and quality of water supplies. Twelve municipalities that obtain water from wells in surficial aquifers had shortages during the drought of 1976-77 (J. G. Fax, Minnesota Department of Natural Resources, oral commun., 1979). Also during this period, the acreage irrigated by sprinklers increased from 852 to 8,681 (University of Minnesota, 1978).
The U.S. Geological Survey, in cooperation with the Minnesota Department of Natural Resources and eight of the nine counties that are associated with the South western Minnesota Regional Development Commission, made a study during 1977-80 to assess the availability of water from surficial outwash deposits in those counties. Information from that study will aid in management of the resource.
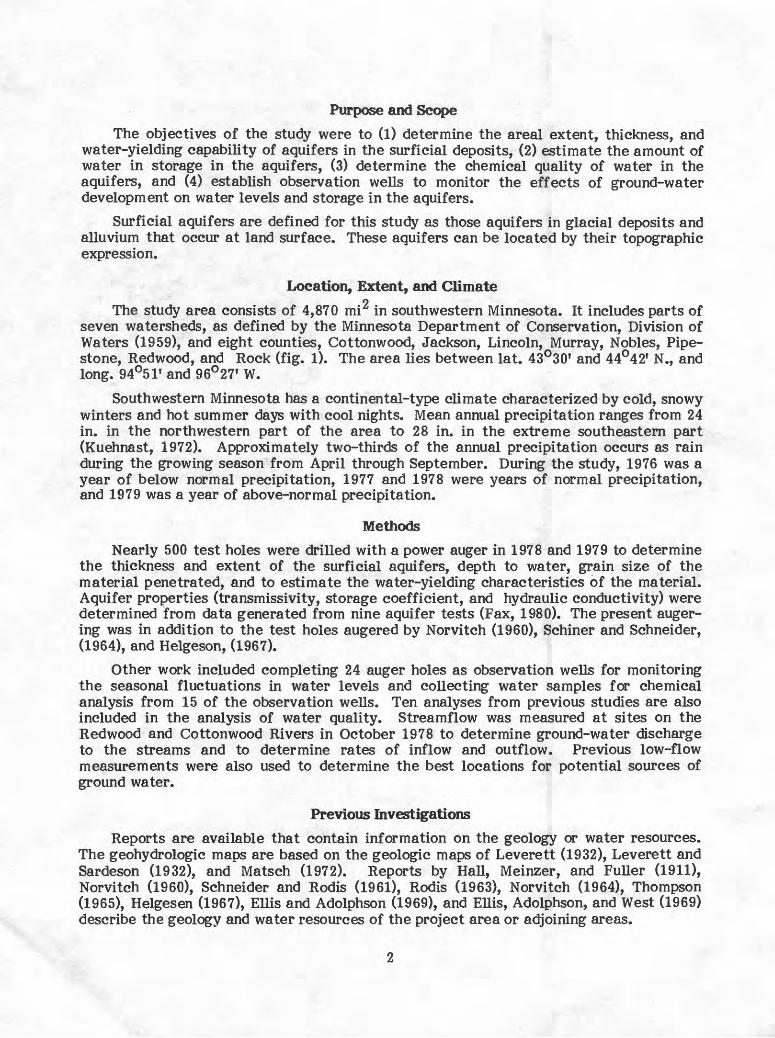
Purpose and ScopeThe objectives of the study were to (1) determine the areal extent, thickness, and
water-yielding capability of aquifers in the surficial deposits, (2) estimate the amount of water in storage in the aquifers, (3) determine the chemical quality of water in the aquifers, and (4) establish observation wells to monitor the effects of ground-water development on water levels and storage in the aquifers. j
Surficial aquifers are defined for this study as those aquifers in glacial deposits and alluvium that occur at land surface. These aquifers can be located by their topographic expression.
Location, Extent, and Climateo
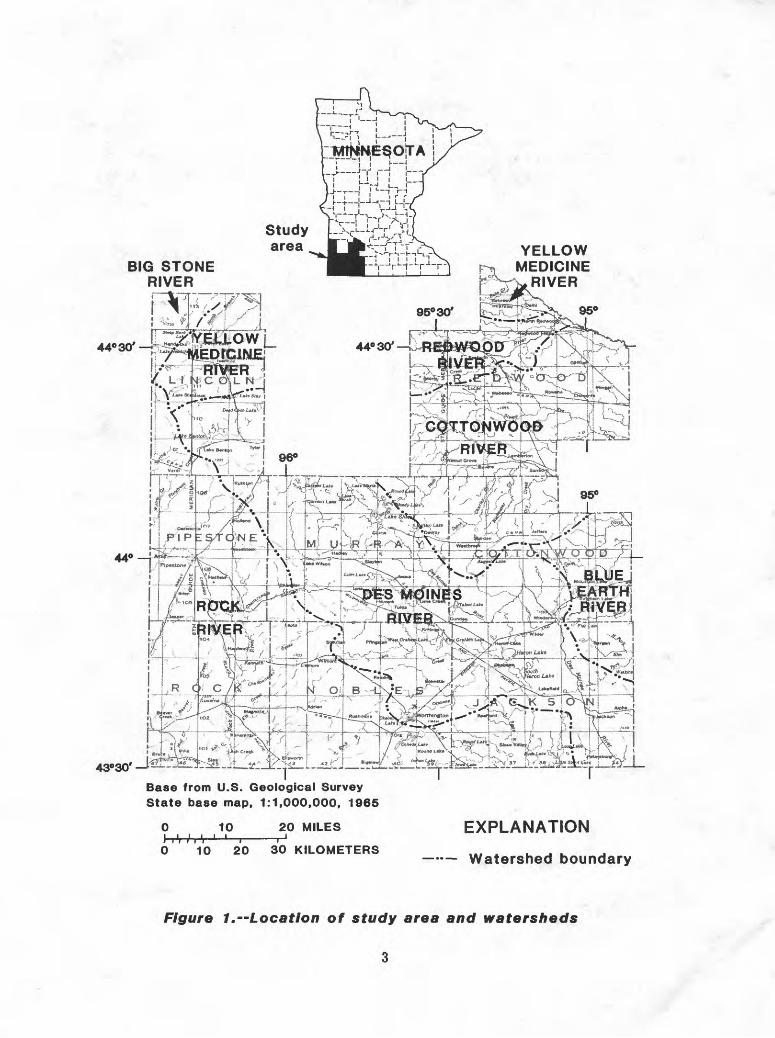
The study area consists of 4,870 mi in southwestern Minnesota. It includes parts of seven watersheds, as defined by the Minnesota Department of Conservation, Division of Waters (1959), and eight counties, Cottonwood, Jackson, Lincoln, Murray, Nobles, Pipe- stone, Redwood, and Rock (fig. 1). The area lies between lat. 43°30? and 44°42' N., and long. 94°51T and 96°27T W.
Southwestern Minnesota has a continental-type climate characterized by cold, snowy winters and hot summer days with cool nights. Mean annual precipitation ranges from 24 in. in the northwestern part of the area to 28 in. in the extreme southeastern part (Kuehnast, 1972). Approximately two-thirds of the annual precipitation occurs as rain during the growing season from April through September. During the study, 1976 was a year of below normal precipitation, 1977 and 1978 were years of normal precipitation, and 1979 was a year of above-normal precipitation.
"i Methods
Nearly 500 test holes were drilled with a power auger in 1978 and 1979 to determine the thickness and extent of the surficial aquifers, depth to water, grain size of the material penetrated, and to estimate the water-yielding characteristics of the material. Aquifer properties (transmissivity, storage coefficient, and hydraulic conductivity) were determined from data generated from nine aquifer tests (Fax, 1980). The present auger- ing was in addition to the test holes augered by Norvitch (1960), Schiner and Schneider,(1964), and Helgeson, (1967).
Other work included completing 24 auger holes as observation wells for monitoring the seasonal fluctuations in water levels and collecting water samples for chemical analysis from 15 of the observation wells. Ten analyses from previous studies are also included in the analysis of water quality. Streamflow was measured at sites on the Redwood and Cottonwood Rivers in October 1978 to determine ground-water discharge to the streams and to determine rates of inflow and outflow. Previous low-flow measurements were also used to determine the best locations for potential sources of ground water.
IPrevious Investigations
Reports are available that contain information on the geology or water resources. The geohydrologic maps are based on the geologic maps of Leverett (1932), Leverett and Sardeson (1932), and Matsch (1972). Reports by Hall, Meinzer, and FuUer (1911), Norvitch (1960), Schneider and Rodis (1961), Rodis (1963), Norvitch (1964), Thompson(1965), Helgesen (1967), Ellis and Adolphson (1969), and EUis, Adolphson, and West (1969) describe the geology and water resources of the project area or adjoining areas.
2 i
43°30'
YELLOWMEDICINE
RIVERBIG STONE
RIVER
. _
Ow " "^" '.jTlTjj^im ] VM v^ ifjH± 1. 1 F" i
44°
*?'" V^<3'_ «^ *** "* **""**<? J . _ _j ._ -____..____.. ..__T-
Base from U.S. Geological Survey State base map, 1:1,000,000, 1965
10 20 MILES
10 20 30 KILOMETERS
EXPLANATION
Watershed boundary
Figure 1. Location of study area and watersheds
The following U.S. Geological Survey hydrologic atlases provide a hydrologic frame work of watersheds: Lac Qui Parle River (Cotter and Bidwell, 1968), Yellow Medicine River (Novitzki and others, 1969), Redwood River (Van Voost and others, 1970), Cotton- wood River (Broussard and others, 1973), Blue Earth River (Anderson and others, 1974), Rock River (Anderson and others, 1976a), and Des Moines River (Anderson and others, 1976b).
Well and Test-Hole Numbering System
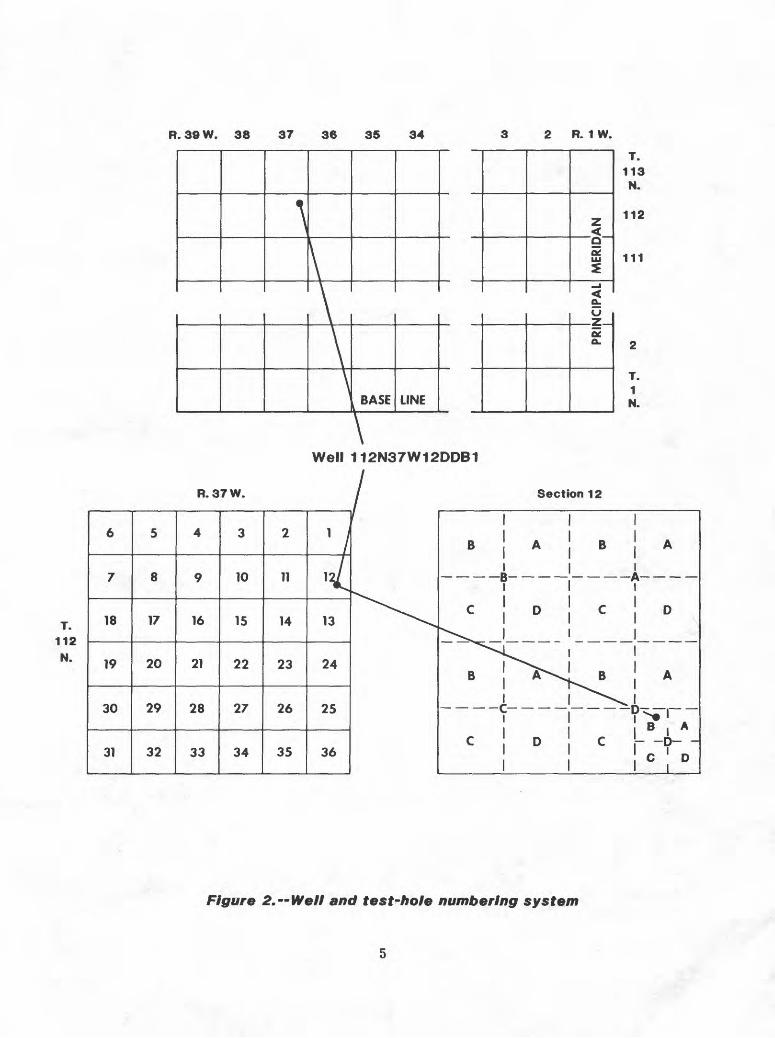
The method of numbering wells and test holes is based on the U.S. Bureau of Land Managements system of subdivision of public lands. The area is in the fifth principal meridian and base-line system. The first segment of a well or test-hole number indicates the township north of the baseline; the second, the range west of the principal meridian; and the third, the section in which the well is situated. The uppercase letters A, B, C, and D, following the section number indicate the location of the well in the section. The first letter denotes the 160-acre tract, the second denotes the 40-acre tract, and the third denotes the 10-acre tract. The letters are assigned in a counterclockwise direction beginning with the northeast quarter. Consecutive numbers beginning with 1 are added as suffixes to distinguish wells within a given 10-acre tract. Figure 2 illustrates the method of numbering. Thus, the number 112N37W12DDB1 identifies the first test hole orwell in the NWsSE^SE* sec. 12, T. 112 N., R. 37 W. t
Glossary
Acre-foot -the quantity of water required to cover 1 acre to a depth of 1 ft; equal to 43,560 ft3 or 325,851 gal. .
Alluvium - sand, gravel, and other material that has been transported and deposited by streams.
Aquifer - a formation, group of formations, or part of a formation that contains suffi cient saturated permeable material to yield significant quantities of water to wells or springs.
Aquifer test - a means for determining the water-bearing properties of an aquifer. One test is to pump a well at a constant rate while measuring the decline and recovery of the water level in the pumped well and in observation wells.
Base flow - sustained or fair-weather runoff. In most streams, base flow is composed largely of ground-water discharge to the stream.
Confining bed - a body of material with low permeability adjacent to one or more aquifers.
Drawdown - the vertical distance between the nonpumping water level and the level caused by pumping.
Drift - all deposits resulting from glacial activity.
Evapotranspiration - the process by which water is withdrawn from a land area by evap oration from water surfaces and moist soil and by transpiration by plants.
R. 39 W. 38 37 36 35 34 3 2 R. 1 W.
T.112N.
R. 37 W.
\Well 112N37W12DDB1
6
7
18
19
30
31
5
8
17
20
29
32
4
9
16
21
28
33
3
10
15
22
27
34
2
11
14
23
26
35
1 I
12/
13
24
25
36
-
T.113N.
112
111
Ak BASE LINE
zDC0. 2
T 1 N
Section 12
Figure 2, Well and test-hole numbering system
Hydraulic conductivity - the rate of flow of water transmitted through a porous medium of unit cross-sectional area under a unit hydraulic gradient at the prevailing kinematicviscosity; measured at right angles to the direction of flow. -«-
Milligrams per liter - a unit for expressing the concentration by weight of a chemical constituent per liter of solution.
Milliequivalants per liter - concentration (in milligrams per liter) divided by the formula weight of the chemical constituent and multiplied by its charge.
Moraine - drift, deposited chiefly by direct glacial action; commonly has constructional topography independent of control by the surface on which it lies.
Outwash - sorted stratified drift deposited beyond the ice front by melt-water streams.
Potential evapotranspiration - water loss that will occur if there is never a deficiency of water in the soil for use by vegetation. -v
Recharge - the processes by which water is added to an aquifer.
Runoff - that part of the precipitation that appears in streams. It is the same as stream flow unaffected by artificial diversions, storage, or other works of man in or on the stream channels or on the drainage area. I
Specific capacity - the rate of discharge of water from a well divided by the drawdown of water level within the well. It varies slowly with duration of discharge, which should be stated when known. If the specific capacity is constant except for time variation, it is roughly proportional to the transmissivity of the aquifer.
Storage coefficient - the volume of water an aquifer releases from or takes into storage per unit surface area of the aquifer per unit change in head. In an unconfined aquifer, it is virtually equal to the specific yield.
Surficial deposits - unconsolidated residual, alluvial, or glacial deposits lying on the bedrock. .
I Till - unsorted, unstratified drift deposited directly by the ice.
Transmissivity - the rate at which water of the prevailing kinematic viscosity is trans mitted through a unit width of an aquifer under a unit hydraulic gradient.
Unconfined conditions - conditions under which the water in an aquifer is not confined by overlying, relatively impermeable strata. Under these conditions, water can be obtained from storage in the aquifer by gravity drainage, that is, by lowering the water level, as in a pumped well.
Water table - the surface in an unconfined water body at which the pressure is atmos pheric. It is defined by the levels at which water stands in wells that penetrate the water body just far enough to hold standing water. In wells that penetrate to greater depths, the water level will stand above or below the water table if an upward or downward component of ground-water flow exists.
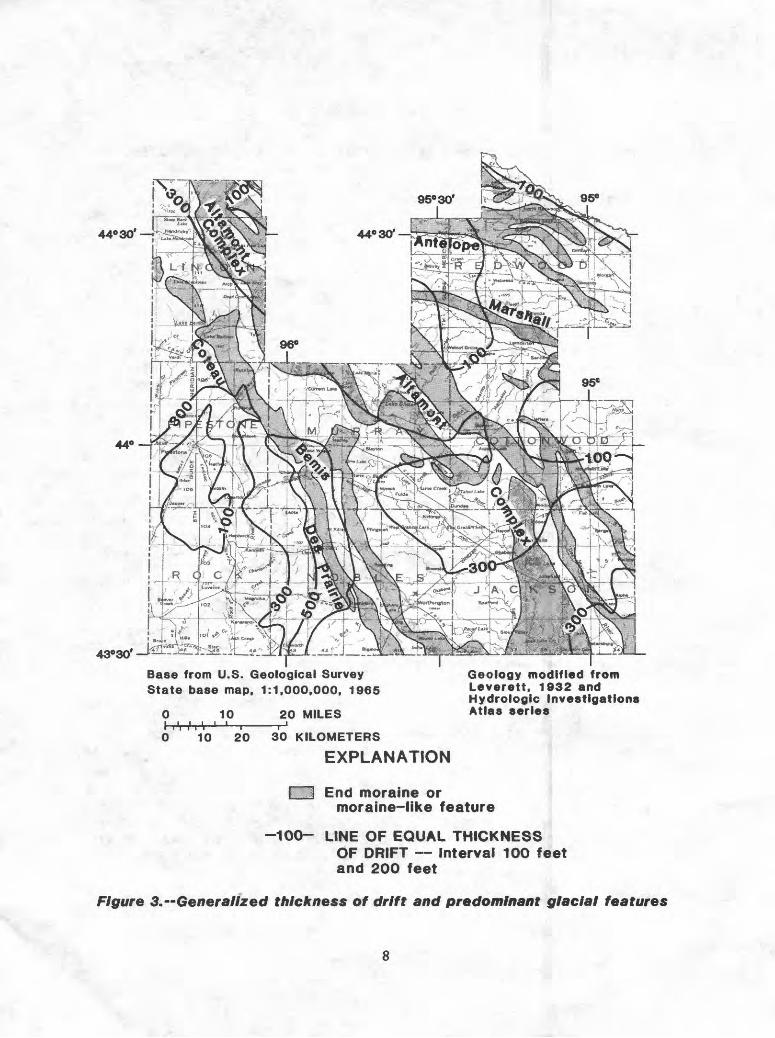
Physiography and Surflcial Geology
The topography of most of southwestern Minnesota is slightly rolling to flat. Alti tudes gently descend from west to east. Marshes and lakes are numerous. The Coteau des Prairie, or Highland Divide of the Prairie, is the most conspicuous surface feature (fig. 3). This highland extends southeastward from the South Dakota border across Lincoln, Murray, and Nobles Counties, and into Iowa. It forms the divide between the Missouri and Mississippi Rivers. Headwaters of the Redwood, Cottonwood, and Des Moines Rivers are on the northern slope of the highland. The Redwood and Cottonwood Rivers flow northeastward into the Mississippi River by way of the Minnesota River. Rock River, Pipestone, and Flandreau Creeks head on the southern slope of the highland. These streams and the Des Moines River, flow south or southwest into the Missouri River.
The physiography is dominated by glacial features that were formed during the pre- Wisconsin and Wisconsin Glaciation of the Pleistocene Epoch (Matsch, 1972). End moraines, which were formed during the recession of the last glacier, are the most prom inent features. They form a series of morainic belts that mark some of the river-basin boundaries. The belts generally trend north-south or northwest-southeast.
The Bemis moraine (fig. 3) is the northeastern boundary of the Coteau des Prairie and is the outer terminal moraine of the last ice advance in southwestern Minnesota (Leverett, 1932). The moraine is well drained and is marked by numerous gullies. After the ice front withdrew, an end moraine of rugged relief and poor drainage was produced on the northeastern flank of the Coteau. Leverett (1932) called this feature the Altamont-Cary moraine; however, Matsch (1972) has designated this dead-ice moraine the Altamont moraine complex. Other features to the northeast, which resulted during the advance and retreat of the glacier, were previously mapped as end moraines (Leverett, 1932). However, these have been re-interpreted by Matsch (1972) to be a "large crevasse filling" (Antelope moraine) and a "trend of higher relief resulting from erosion along a meltwater channel system" (Marshall moraine). The Bemis and Altamont moraines merge gradually to the northeast with intervening ground moraines. The morainal topography is typically irregular, with numerous knolls, hummocks, and closed depressions that contain many marshes and lakes. \
Well-sorted surficial outwash, crevasse fillings, and terrace gravel were also deposited during the last advance and retreat of the Des Moines lobe. The outwash was deposited in a network of long and narrow melt-water channels that commonly occupy the present stream courses. These major outwash deposits constitute the surficial aquifers investigated during this project. . ,
Drift overlies sedimentary rocks of Cretaceous age and igneous and metamorphic rocks of Precambrian age. It ranges in thickness from less than 1 ft locally in Redwood, Rock, Cottonwood, and Pipestone Counties to about 600 ft in a buried bedrock valley in western Nobles County and in places underlying the Coteau (Anderson and others, 1976a).
PsI
44° 30'
43°30*
Base from U.S. Geological Survey State base map, 1:1,000,000, 1965
10 20 MILES
Geology modified from Leverett, 1932 and Hydrologic Investigations Atlas series
10 20 30 KILOMETERS
EXPLANATION
I :l End moraine ormoraine-like feature l
-100- LINE OF EQUAL THICKNESSOF DRIFT Interval 100 feet and 200 feet
Figure 3. Generalized thickness of drift and predominant glacial features
AVAILABILITY OF GROUND-WATER SUPPLIES
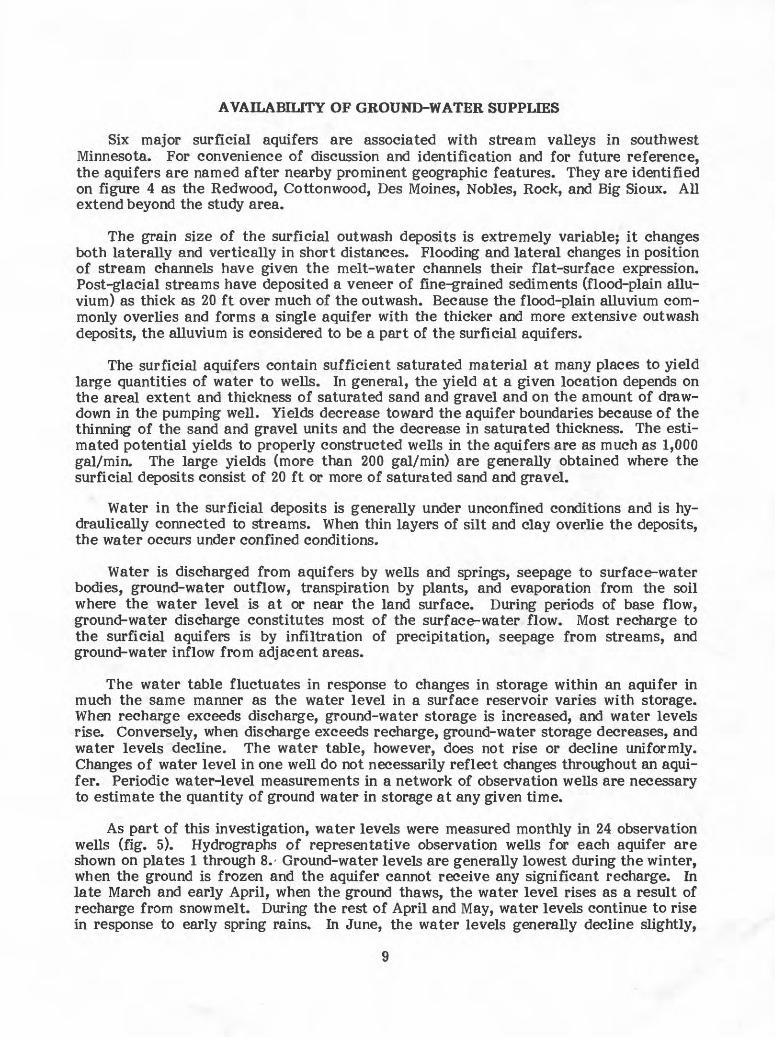
Six major surficial aquifers are associated with stream valleys in southwest Minnesota. For convenience of discussion and identification and for future reference, the aquifers are named after nearby prominent geographic features. They are identified on figure 4 as the Redwood, Cottonwood, Des Moines, Nobles, Rock, and Big Sioux. All extend beyond the study area.
The grain size of the surficial outwash deposits is extremely variable; it changes both laterally and vertically in short distances. Flooding and lateral changes in position of stream channels have given the melt-water channels their flat-surface expression. Post-glacial streams have deposited a veneer of fine-grained sediments (flood-plain allu vium) as thick as 20 ft over much of the outwash. Because the flood-plain alluvium com monly overlies and forms a single aquifer with the thicker and more extensive outwash deposits, the alluvium is considered to be a part of the surficial aquifers.
The surficial aquifers contain sufficient saturated material at many places to yield large quantities of water to wells. In general, the yield at a given location depends on the areal extent and thickness of saturated sand and gravel and on the amount of draw down in the pumping well. Yields decrease toward the aquifer boundaries because of the thinning of the sand and gravel units and the decrease in saturated thickness. The esti mated potential yields to properly constructed wells in the aquifers are as much as 1,000 gal/min. The large yields (more than 200 gal/min) are generally obtained where the surficial deposits consist of 20 ft or more of saturated sand and gravel.
Water in the surficial deposits is generally under unconfined conditions and is hy- draulically connected to streams. When thin layers of silt and clay overlie the deposits, the water occurs under confined conditions.
Water is discharged from aquifers by wells and springs, seepage to surface-water bodies, ground-water outflow, transpiration by plants, and evaporation from the soil where the water level is at or near the land surface. During periods of base flow, ground-water discharge constitutes most of the surface-water flow. Most recharge to the surficial aquifers is by infiltration of precipitation, seepage from streams, and ground-water inflow from adjacent areas.
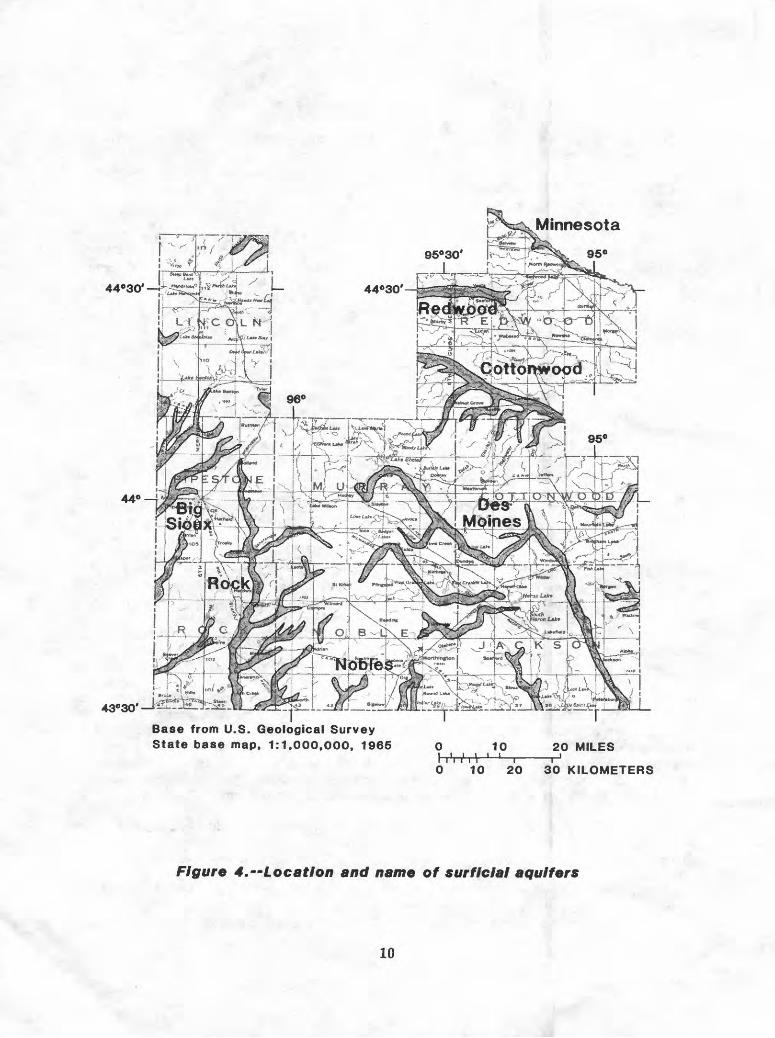
The water table fluctuates in response to changes in storage within an aquifer in much the same manner as the water level in a surface reservoir varies with storage. When recharge exceeds discharge, ground-water storage is increased, and water levels rise. Conversely, when discharge exceeds recharge, ground-water storage decreases, and water levels decline. The water table, however, does not rise or decline uniformly. Changes of water level in one well do not necessarily reflect changes throughout an aqui fer. Periodic water-level measurements in a network of observation wells are necessary to estimate the quantity of ground water in storage at any given time.
As part of this investigation, water levels were measured monthly in 24 observation wells (fig. 5). Hydrographs of representative observation wells for each aquifer are shown on plates 1 through 8.- Ground-water levels are generally lowest during the winter, when the ground is frozen and the aquifer cannot receive any significant recharge. In late March and early April, when the ground thaws, the water level rises as a result of recharge from snowmelt. During the rest of April and May, water levels continue to rise in response to early spring rains. In June, the water levels generally decline slightly,
44-30'
Base from U.S. Geological Survey State base map, 1:1,000,000, 1965 20 MILES
10 20 30 KILOMETERS
t* * »
Figure 4.--Location and name of surflclal aquifers
10
43°30
Base from U.S. Geological SurveyState base map, 1:1,000,000, 1965 0 10 20 MILES
KW. .10 20 30 KILOMETERS
EXPLANATION
8-78 ^S. Observation well
and number Aquifer test
Figure 5."Location of observation wells and aquifer tests
11
although the largest percentage of annual precipitation occurs in June. The decline in water levels that starts in June and continues into September is probably due to large water losses by evapotranspiration and irrigation pumpage. After the first killing frost, generally during early October, ground-water levels commonly rise slightly until the ground freezes. ;
The primary hydraulic characteristics of an aquifer are its hydraulic conductivity, saturated thickness, and storage coefficient. Hydraulic conductivity and saturated thick ness are commonly combined as transmissivity (hydraulic conductivity times saturated thickness), and storage coefficient is virtually equal to specific yield in unconfined (water-table) aquifers. These parameters can be used to determine the rate and the magnitude of water-table declines resulting from withdrawal of water from an aquifer.
Hydraulic characteristics of the surficial aquifers were determined from data col lected during nine aquifer tests (fig. 5). Values of aquifer characteristics determined by the aquifer tests are representative only in the immediate area of the test location. Guided by aquifer test results, however, values were estimated at other locations based on examination of samples collected during test drilling and published data for similar materials. Specific yield of 0.12 was considered to be representative. The relation of particle-size classification to hydraulic conductivity is virtually that used by Larson (1976). This relationship was used to estimate the hydraulic conductivity at the test-hole sites. Lower conductivity values in each range were assigned to relatively poorly sorted material, and higher values were assigned to well-sorted material. Transmissivity was then determined by multiplying the estimated hydraulic conductivity by the saturated thickness.
Calculations of a theoretical optimum yield of a properly constructed well were made to evaluate the surficial aquifer. The following assumptions were made in the calculations: * \.
1. The aquifer is homogeneous and of infinite area! extent.
2. The well is screened over the entire saturated thickness of the aquifer, is 100 percent efficient, and is of large diameter (24 in.).
3. The well is pumped continuously for 30 days.
4. Drawdown, the decrease in water level in the well caused by pumping, is two-thirds of the original saturated thickness. Theoretically, this corresponds to 90 percent of the maximum yield for unconfined aquifers and is generally accepted as the optimum design specification (Edward E. Johnson, Inc., 1966, p. 107-108).
Based on these assumptions, the nonequilibrium equations of Theis (1935), with a draw down correction for unconfined aquifers (Jacob, 1944), can be used to compute well discharge. Although some assumptions may never be fully satisfied, the method produces a quantitative measure of the aquifer's water-yielding potential. Water-yielding poten tial of the surficial aquifer, as shown on plates 1-8 and tables 3-10, closely follows the distribution of saturated thickness. Areal variation of hydraulic conductivity is not as significant as variation of saturated thickness. Well yields in this report are classified as follows: small, less than 50 gal/min; moderate, 50 to 200 gal/min; large, more than 200 gal/min.
12
QUALITY OF GROUND WATER
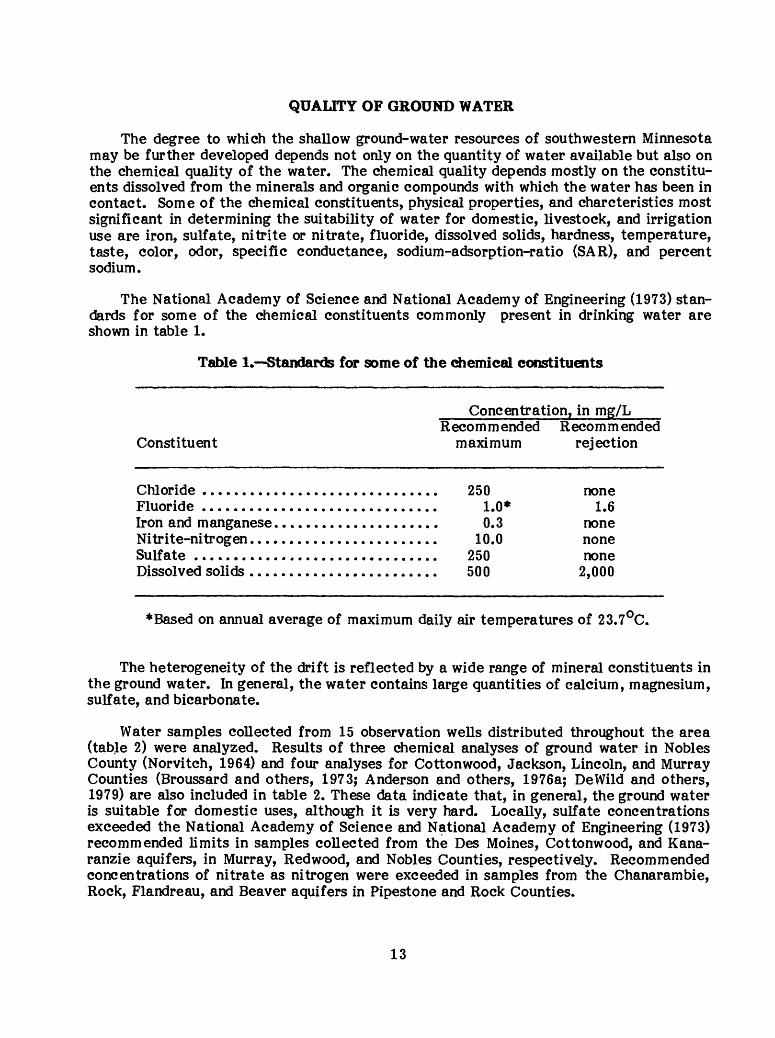
The degree to which the shallow ground-water resources of southwestern Minnesota may be further developed depends not only on the quantity of water available but also on the chemical quality of the water. The chemical quality depends mostly on the constitu ents dissolved from the minerals and organic compounds with which the water has been in contact. Some of the chemical constituents, physical properties, and charcteristics most significant in determining the suitability of water for domestic, livestock, and irrigation use are iron, sulfate, nitrite or nitrate, fluoride, dissolved solids, hardness, temperature, taste, color, odor, specific conductance, sodium-adsorption-ratio (SAR), and percent sodium.
The National Academy of Science and National Academy of Engineering (1973) stan dards for some of the chemical constituents commonly present in drinking water are shown in table 1.
Table 1. Standards for some of the chemical constituents
Concentration, in mg/LRecommended Recommended
Constituent maximum rejection
Chloride .............................. 250 noneFluoride .............................. 1.0* 1.6Iron and manganese..................... 0.3 noneNitrite-nitrogen........................ 10.0 noneSulfate ............................... 250 noneDissolved solids........................ 500 2,000
* Based on annual average of maximum daily air temperatures of 23.7°C.
The heterogeneity of the drift is reflected by a wide range of mineral constituents in the ground water. In general, the water contains large quantities of calcium, magnesium, sulfate, and bicarbonate.
Water samples collected from 15 observation wells distributed throughout the area (table 2) were analyzed. Results of three chemical analyses of ground water in Nobles County (Norvitch, 1964) and four analyses for Cottonwood, Jackson, Lincoln, and Murray Counties (Broussard and others, 1973; Anderson and others, 1976a; DeWild and others, 1979) are also included in table 2. These data indicate that, in general, the ground water is suitable for domestic uses, although it is very hard. Locally, sulfate concentrations exceeded the National Academy of Science and National Academy of Engineering (1973) recommended limits in samples collected from the Des Moines, Cottonwood, and Kana- ranzie aquifers, in Murray, Redwood, and Nobles Counties, respectively. Recommended concentrations of nitrate as nitrogen were exceeded in samples from the Chanarambie, Rock, Flandreau, and Beaver aquifers in Pipestone and Rock Counties.
13
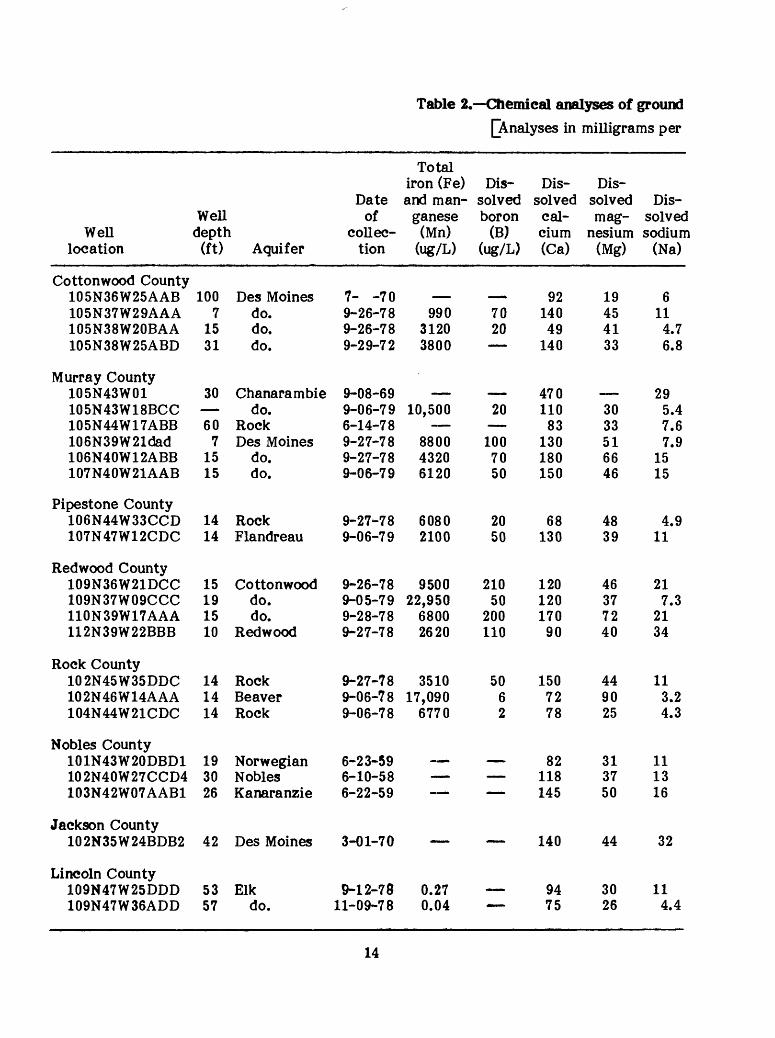
Table 2. Chemical analyses of ground[Analyses in milligrams per
Well location
Cottonwood County 105N36W25AAB105N37W29AAA105N38W20BAA105N38W25ABD
Murray County 105N43W01105N43W18BCC 105N44W17ABB106N39W21dad106N40W12ABB107N40W21AAB
Pipestone County 106N44W33CCD107N47W12CDC
Redwood County 109N36W21DCC109N37W09CCC 110N39W17AAA112N39W22BBB
Rock County 102N45W35DDC102N46W14AAA 104N44W21CDC
Nobles County 101N43W20DBD1 102N40W27CCD4103N42W07AAB1
Well depth (ft)
1007
1531
30
607
1515
1414
1519 1510
1414 14
19 3026
Aquifer
Des Moinesdo.do.do.
Chanarambiedo.
RockDes Moines
do.do.
RockFlandreau
Cottonwooddo. do.
Redwood
RockBeaver Rock
Norwegian NoblesKanaranzie
Date of
collec tion
7- -709-26-789-26-789-29-72
9-08-699-06-79 6-14-789-27-789-27-789-06-79
9-27-789-06-79
9-26-789-05-79 9-28-789-27-78
9-27-789-06-78 9-06-78
6-23-59 6-10-586-22-59
Total iron (Fe) and man
ganese (Mn)
(ug/L)
99031203800
10,500
880043206120
60802100
950022,950
68002620
351017,090
6770
Dis solved boron
(B) (ug/L)
7020
20
1007050
2050
21050
200110
506 2
Dis solved cal cium (Ca)
9214049
140
470110
83130180150
68130
120120 17090
15072 78
82 118145
Dis solved mag
nesium (Mg)
19454133
30 33516646
4839
46377240
4490 25
31 3750
Dis solved sodium
(Na)
6114.76.8
295.4 7.67.9
1515
4.911
217.3
2134
113.2 4.3
11 1316
Jackson County102N35W24BDB2 42 Des Moines 3-01-70
Lincoln County109N47W25DDD 53 Elk 9-12-78 109N47W36ADD 57 do. 11-09-78
0.270.04
140
9475
44
3026
32
114.4
14
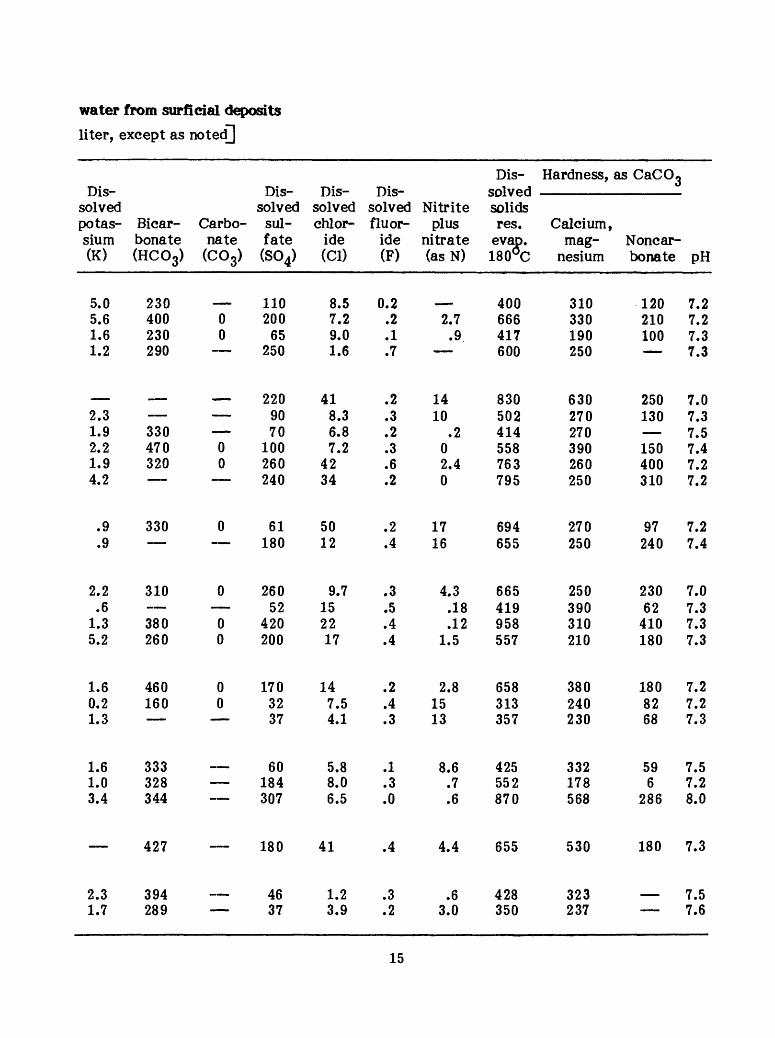
water from surficial depositsliter, except as noted]
Dis solved potas sium (K)
5.05.61.61.2
--
2.31.92.21.94.2
.9
.9
2.2.6
1.35.2
1.60.21.3
1.61.03.4
2.31.7
Bicar bonate (HC03)
230400230290
- 330470320
330
310 380260
460160__
333328344
427
394289
Carbo nate(co3)
00
- -
- 00
_- _
0~ " '
0
00
00 .
T1__rrr_>
.
_ _L _
Dis solved sul- fate(so4)
110200
65250
2209070
100260240
61180
26052
420200
1703237
60184307
180
4637
Dis solved chlor
ide (CD
8.57.29.01.6
418.36.87.2
4234
5012
9.7152217
147.54.1
5.88.06.5
41
1.23.9
Dis solved fluor-
ide (F)
0.2.2.1.7
.2
.3
.2
.3
.6
.2
.2
.4
.3
.5
.4
.4
.2
.4
.3
.1
.3
.0
.4
.3
.2
Nitrite plus
nitrate (asN)
2.7.9
-
1410
.202.40
1716
4.3.18.12
1.5
2.81513
8.6.7.6
4.4
.63.0
Dis solved solids res.
evap. 180°C
400666417600
830502414558763795
694655
665419958557
658313357
425552870
655
428350
Hardness, as CaCO,
Calcium, mag
nesium
310330190250
630270270390260250
270250
250390310210
380240230
332178568
530
323237
Noncar- bonate
120210100 -
250130 150400310
97240
23062
410180
1808268
596
286
180
_
pH
7.27.27.37.3
7.07.37.57.47.27.2
7.27.4
7.07.37.37.3
7.27.27.3
7.57.28.0
7.3
7.57.6
15
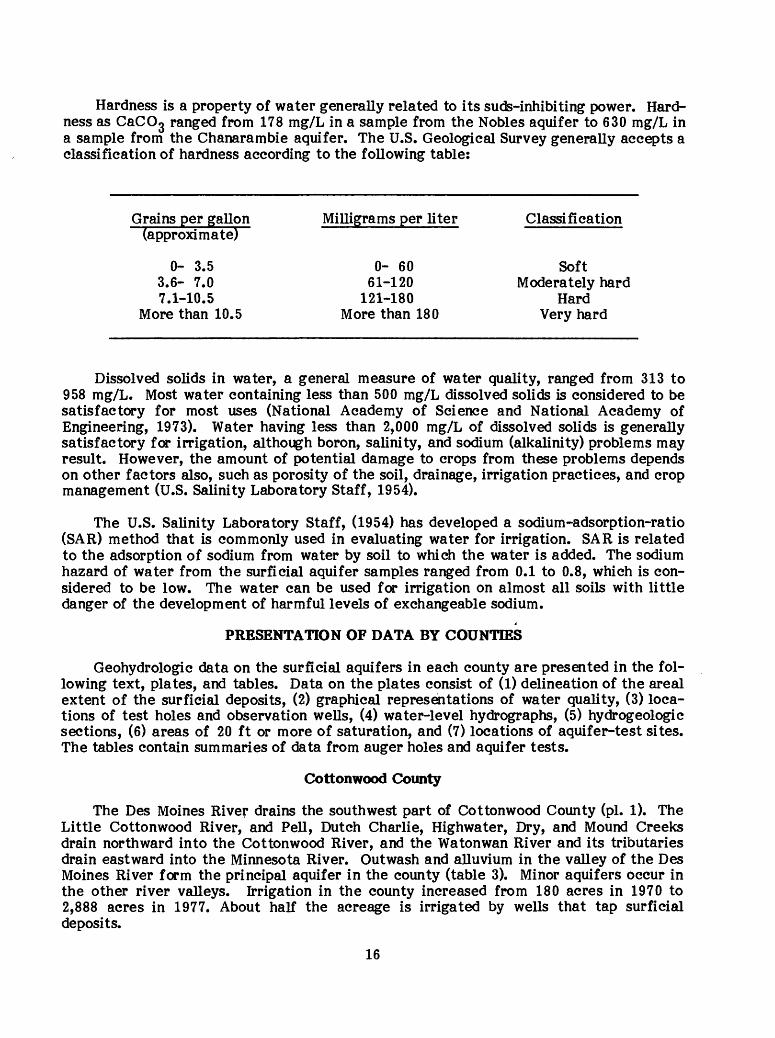
Hardness is a property of water generally related to its suds-inhibiting power. Hard ness as CaCOg ranged from 178 mg/L in a sample from the Nobles aquifer to 630 mg/L in a sample from the Chanarambie aquifer. The U.S. Geological Survey generally accepts a classification of hardness according to the following table:
Grains per gallon Milligrams per liter Classification (approximate)
0- 3.5 0- 60 Soft3.6- 7.0 61-120 Moderately hard7.1-10.5 121-180 Hard
More than 10.5 More than 180 Very hard
Dissolved solids in water, a general measure of water quality, ranged from 313 to 958 mg/L. Most water containing less than 500 mg/L dissolved solids is considered to be satisfactory for most uses (National Academy of Science and National Academy of Engineering, 1973). Water having less than 2,000 mg/L of dissolved solids is generally satisfactory for irrigation, although boron, salinity, and sodium (alkalinity) problems may result. However, the amount of potential damage to crops from these problems depends on other factors also, such as porosity of the soil, drainage, irrigation practices, and crop management (U.S. Salinity Laboratory Staff, 1954).
The U.S. Salinity Laboratory Staff, (1954) has developed a sodium-adsorption-ratio (SAR) method that is commonly used in evaluating water for irrigation. SAR is related to the adsorption of sodium from water by soil to which the water is added. The sodium hazard of water from the surficial aquifer samples ranged from 0.1 to 0.8, which is con sidered to be low. The water can be used for irrigation on almost all soils with little danger of the development of harmful levels of exchangeable sodium.
PRESENTATION OF DATA BY COUNTIES
Geohydrologic data on the surficial aquifers in each county are presented in the fol lowing text, plates, and tables. Data on the plates consist of (1) delineation of the areal extent of the surficial deposits, (2) graphical representations of water quality, (3) loca tions of test holes and observation wells, (4) water-level hydrographs, (5) hydrogeologic sections, (6) areas of 20 ft or more of saturation, and (7) locations of aquifer-test sites. The tables contain summaries of data from auger holes and aquifer tests.
Cottonwood County
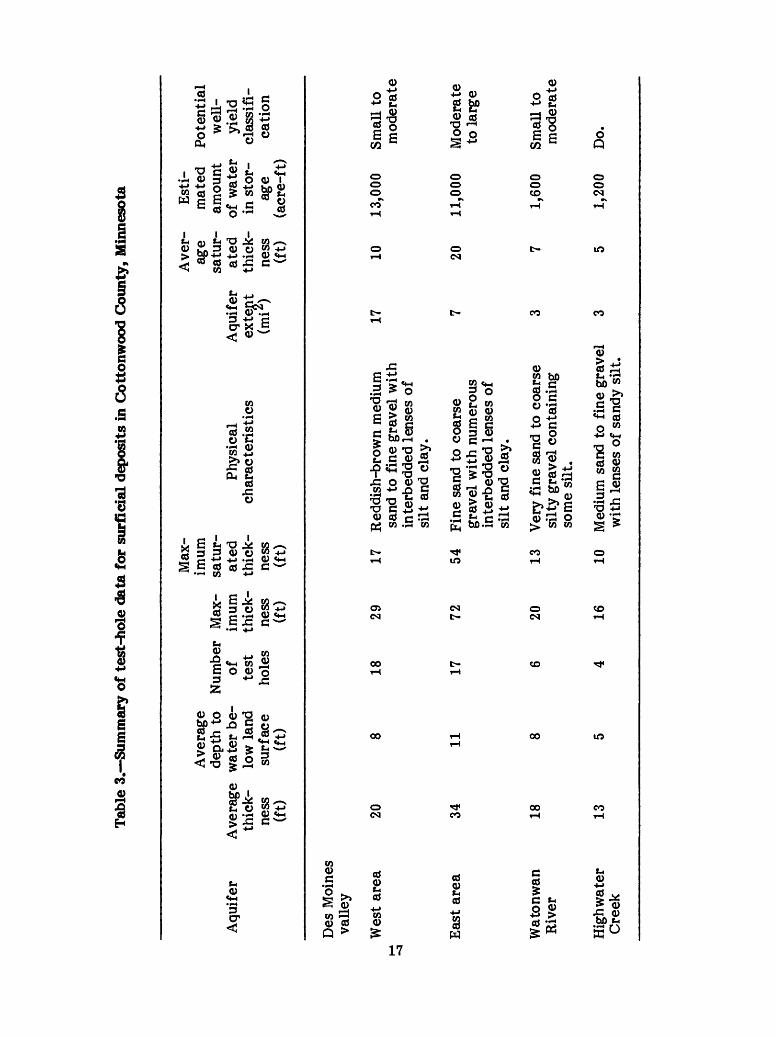
The Des Moines River drains the southwest part of Cottonwood County (pi. 1). The Little Cottonwood River, and Pell, Dutch Charlie, Highwater, Dry, and Mound Creeks drain northward into the Cottonwood River, and the Watonwan River and its tributaries drain eastward into the Minnesota River. Outwash and alluvium in the valley of the Des Moines River form the principal aquifer in the county (table 3). Minor aquifers occur in the other river valleys. Irrigation in the county increased from 180 acres in 1970 to 2,888 acres in 1977. About half the acreage is irrigated by wells that tap surficial deposits.
16
Tab
le 3
. Sum
mar
y of
tes
t-ho
le d
ata
for
surf
icia
l dep
osit
s in
Cot
tonw
ood
Cou
nty,
Min
neso
ta
Aqu
ifer
Des
Moi
nes
valle
y
Ave
rage
thic
kne
ss(f
t)
Ave
rage
dept
h to
wat
er b
elo
w l
and
surf
ace
(ft)
Num
ber
Max
-of test
hole
s
imum
thic
kne
ss(f
t)
Max
im
umsa
tur
ated
thic
kne
ss(f
t)
Phy
sica
lch
arac
teri
stic
sA
quif
erex
tent
(ml4
)
Ave
r
age
satu
rat
edth
ick
ness
(ft)
Est
i
mat
edam
ount
of w
ater
in s
tor
age
(acr
e-ft
)
Pot
enti
alw
ell-
yiel
dcl
assi
fi
cati
on
Wes
t ar
ea
Eas
t ar
ea
Wat
onw
an
Riv
er
Hig
hwat
er
Cre
ek
20 3411
18 13
18
29
17
Red
dish
-bro
wn
med
ium
sand
to
fine
gra
vel
wit
h in
terb
edde
d le
nses
of
silt
and
cla
y.
17
72
54
Fin
e sa
nd t
o co
arse
grav
el w
ith
num
erou
s in
terb
edde
d le
nses
of
silt
and
cla
y.
6 20
13
V
ery
fine
san
d to
coa
rse
silt
y gr
avel
con
tain
ing
som
e si
lt.
4 16
10
M
ediu
m s
and
to f
ine
grav
el
with
len
ses
of s
andy
sil
t.
17
10
13,0
00
Sm
all
tom
oder
ate
20
11,0
00
Mod
erat
e to
lar
ge
1,60
0Sm
all
to
mod
erat
e
1,20
0 D
o.
Des Moines River valley aquifer
The Des Moines River valley ranges from about 0.5- to 2-mi wide and is 24 mi long in Cottonwood County. The area northwest of Windom, where the river makes an abrupt turn to the southeast, is called "Great Bend." In general, deposits in the aquifer are composed of fine sand, silty sand, and sandy gravel interbedded with lenses of silty clay. Test drilling of 35 holes indicates that the aquifer material is coarsest in the "Great Bend". The water-table gradient is about 2 ft/mi in the main valley and as much as 10 ft/mi in the tributaries. Test drilling of 17 holes indicates that the outwash is as thick as 72 ft in the main valley but only 20 ft thick in the tributaries. Irrigation wells penetrated outwash as thick as 85 ft in the aquifer north of the Great Bend. The outwash consists mainly of coarse sand interbedded with clay and gravel. The cross-sectional shape of the valley shows that the thickest part of the aquifer is on the east side of the channel, although thickness varies considerably within short distances. The valley is 2-mi wide at Windom, but decreases to less than 1-mi wide to the north. Water levels in wells were lowest during the winter and highest during May. Fluctuations were about 4 ft in 1978 and 6 ft in 1979. The Great Bend area is the major source of water to wells in the county and is the most promising area for development. Irrigation wells have yields as high as 1,000 gal/min (table 3). The saturated thickness of the aquifer is 20 ft or more (pi. 1). About 11,000 acre-ft of water is stored in the aquifer (table 3). The water is generally a mixed calcium sulf ate bicarbonate type of relatively good chemical quality. The average dissolved-solids concentration among four samples is 545 mg/L.
Jackson County
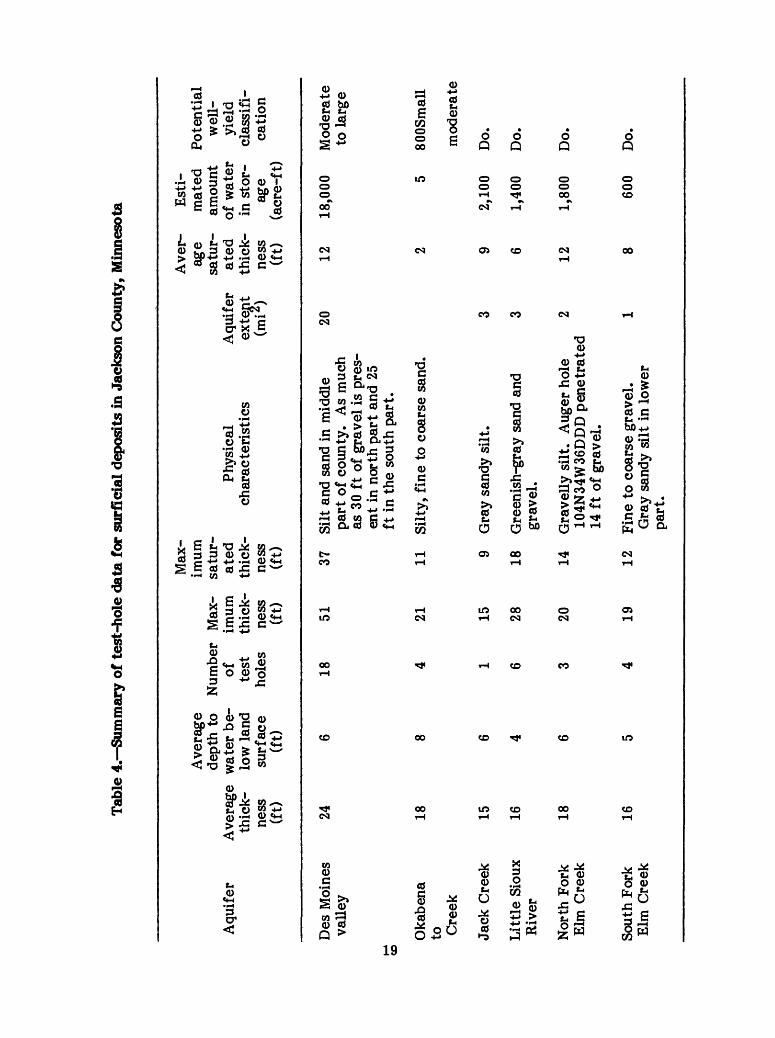
Although the Des Moines River is the main stream in Jackson County, drainage to the river is poor (pi. 2). Drainage in the central part of the county is toward Heron, South Heron, Loon, and Little Spirit Lakes. Irrigated acreage decreased from 52 acres in 1970 to 35 acres in 1977, and the potential for irrigation from wells in surficial aquifers other than in the Des Moines River valley aquifer is small (table 4).
Des Moines River valley aquifer
The Des Moines River valley aquifer ranges from 0.25- to 0.5-mi wide. Throughout most of the county, the valley is incised from 100- to 150-ft deep. Drilling of 18 test holes indicates that the aquifer is as thick as 51 ft in the northern part of the valley and 40-ft thick in the southern part. In the middle part of the county, however, the aquifer is less than 20-ft thick. In general, the aquifer is composed of fine to coarse sand, clayey sand, and silty fine to medium gravel. Test drilling determined that the material is coars est in the northern and southern parts of the river valley. Data from an observation well near the Cottonwood County line indicate that the water level declined 5 ft during 1978 but rose 7 ft during spring 1979. Periodic measurement in an observation well in the southern part of the county indicated that the water level, which is 11 ft below land surface, did not change significantly during the 2-year period of record. The area that has the greatest potential for development, shown on plate 2 as an area of 20 ft or more of saturated sand and gravel, is near the Cottonwood County line. Results of test drilling indicate that the outwash is as thick as 51 ft. Saturated thickness was 45 ft during the summer of 1979, which indicates that large well yields are probably obtainable. Potential yields in other areas are small. Water from the aquifer is fairly low in dissolved solids, which ranges from 350 mg/L in the northern part of the aquifer to 650 mg/L in the south ern part (Anderson and others, 1976b). The water is a mixed calcium sulf ate bicarbonate type.
18
Tab
le 4
. Sum
mar
y of
tes
t-h
ole
data
for
sur
fici
al d
epos
its
in J
acks
on C
ount
y, M
inne
sota
Aqu
ifer
Des
Moi
nes
vall
ey
Oka
bena
to C
reek
Jack
Cre
ek
Lit
tle
Siou
x R
iver
Nor
th F
ork
Elm
Cre
ek
Sout
h Fo
rk
Elm
Cre
ek
Ave
rage
th
ick
ne
ss
(ft) 24 18 15 16 18 16
Ave
rage
de
pth
to
wat
er b
e
low
lan
d su
rfac
e (f
t) 6 8 6 4 6 5
Num
ber
of
test
ho
les
18 4 1 6 3 4
Max
im
um
thic
k
ness
(f
t) 51 21 15 28 20 19
Max
im
um
satu
r
ated
th
ick
ne
ss
(ft) 37 11 9 18 14 12
Phys
ical
A
quif
er
char
acte
rist
ics
exte
nt
(ml*
)
Sil
t an
d sa
nd i
n m
iddl
e 20
pa
rt o
f co
unty
. A
s m
uch
as 3
0 ft
of
grav
el i
s pr
es
ent
in n
orth
par
t an
d 25
ft
in
the
sout
h pa
rt.
Silty
, fi
ne t
o co
arse
san
d.
Gra
y sa
ndy
silt
. 3
Gre
enis
h-gr
ay s
and
and
3 gr
avel
.
Gra
velly
sil
t.
Aug
er h
ole
2 10
4N34
W36
DD
D p
enet
rate
d 14
ft
of g
rave
l.
Fin
e to
coa
rse
grav
el.
1 G
ray
sand
y si
lt i
n lo
wer
Ave
rag
e sa
tur
at
ed
thic
k
ness
(f
t) 12 2 9 6 12 8
Est
im
ated
am
ount
of
wat
er
in s
tor
ag
e (a
cre-
ft)
18,0
00 5
2,10
0
1,40
0
1,80
0
600
Pot
enti
al
wel
l-
yiel
d cl
assi
fi
cati
on
Mod
erat
e to
lar
ge
SOO
SmaU
mod
erat
e
Do.
Do.
Do.
Do.
part
.
Lincoln County
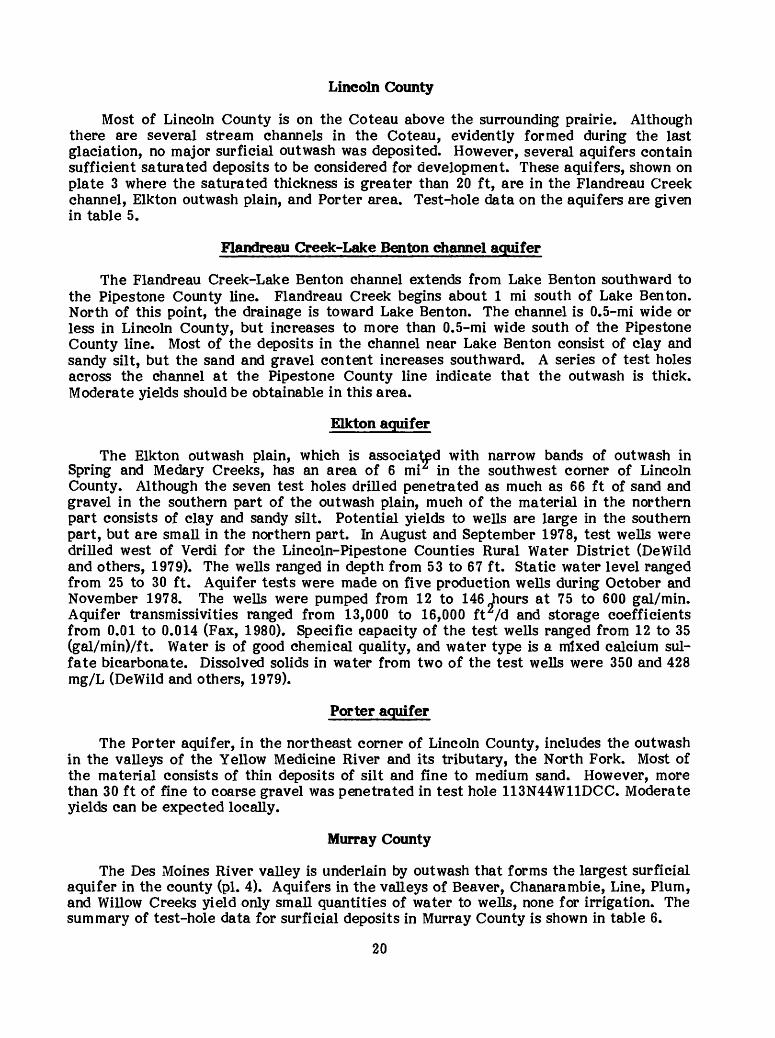
Most of Lincoln County is on the Coteau above the surrounding prairie. Although there are several stream channels in the Coteau, evidently formed during the last glaciation, no major surficial outwash was deposited. However, several aquifers contain sufficient saturated deposits to be considered for development. These aquifers, shown on plate 3 where the saturated thickness is greater than 20 ft, are in the Flandreau Creek channel, Elkton outwash plain, and Porter area. Test-hole data on the aquifers are given in table 5.
Flandreau Creek-Lake Benton channel aquifer
The Flandreau Creek-Lake Benton channel extends from Lake Benton southward to the Pipestone County line. Flandreau Creek begins about 1 mi south of Lake Benton. North of this point, the drainage is toward Lake Benton. The channel is 0.5-mi wide or less in Lincoln County, but increases to more than 0.5-mi wide south of the Pipestone County line. Most of the deposits in the channel near Lake Benton consist of clay and sandy silt, but the sand and gravel content increases southward. A series of test holes across the channel at the Pipestone County line indicate that the outwash is thick. Moderate yields should be obtainable in this area.
Elkton aquifer
The Elkton outwash plain, which is associated with narrow bands of outwash in Spring and Medary Creeks, has an area of 6 mi in the southwest corner of Lincoln County. Although the seven test holes drilled penetrated as much as 66 ft of sand and gravel in the southern part of the outwash plain, much of the material in the northern part consists of clay and sandy silt. Potential yields to wells are large in the southern part, but are small in the northern part. In August and September 1978, test wells were drilled west of Verdi for the Lincoln-Pipestone Counties Rural Water District (DeWild and others, 1979). The wells ranged in depth from 53 to 67 ft. Static water level ranged from 25 to 30 ft. Aquifer tests were made on five production wells during October and November 1978. The wells were pumped from 12 to 146 Jiours at 75 to 600 gal/min. Aquifer transmissivities ranged from 13,000 to 16,000 ft /d and storage coefficients from 0.01 to 0.014 (Fax, 1980). Specific capacity of the test weUs ranged from 12 to 35 (gal/min)/ft. Water is of good chemical quality, and water type is a mixed calcium sul- fate bicarbonate. Dissolved solids in water from two of the test wells were 350 and 428 mg/L (DeWild and others, 1979).
Porter aquifer
The Porter aquifer, in the northeast corner of Lincoln County, includes the outwash in the valleys of the Yellow Medicine River and its tributary, the North Fork. Most of the material consists of thin deposits of silt and fine to medium sand. However, more than 30 ft of fine to coarse gravel was penetrated in test hole 113N44W11DCC. Moderate yields can be expected locally.
Murray County
The Des Moines River valley is underlain by outwash that forms the largest surficial aquifer in the county (pi. 4). Aquifers in the valleys of Beaver, Chanarambie, Line, Plum, and Willow Creeks yield only small quantities of water to wells, none for irrigation. The summary of test-hole data for surficial deposits in Murray County is shown in table 6.
20
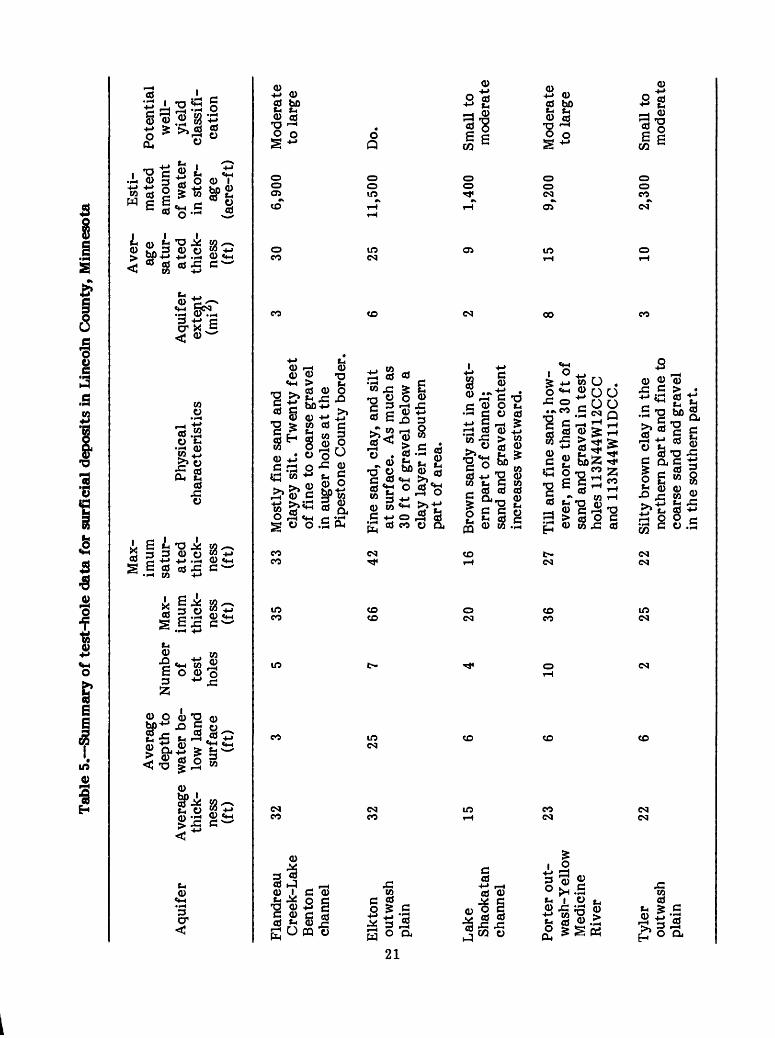
Tab
le 5
. Sum
mar
y of
tes
t-h
ole
data
for
sur
fici
al d
epos
its
in L
inco
ln C
ount
y, M
inne
sota
Aqu
ifer
A
vera
ge
thic
k
ness
(f
t)
Fla
ndre
au
32
Cre
ek-L
ake
Ben
ton
chan
nel
Elk
ton
32
out w
ash
plai
n
Lak
e 15
S
haok
atan
ch
anne
l
Por
ter
out-
23
w
ash-
Yel
low
M
edic
ine
Riv
er
Tyl
er
22
outw
ash
plai
n
Ave
rage
de
pth
to
Num
ber
Max
- w
ater
be-
of
im
um
low
lan
d te
st
thic
k-
surf
ace
hole
s ne
ss
(ft)
(f
t)
3 5
35
25
7 66
6 4
20
6 10
36
6 2
25
Max
im
um
satu
r
ated
Ph
ysic
al
Aqu
ifer
th
ick-
ch
arac
teri
stic
s ex
tent
ne
ss
(mi
) (f
t) 33
Mos
tly f
ine
sand
and
3
clay
ey s
ilt.
T
wen
ty f
eet
of f
ine
to c
oars
e gr
avel
in
aug
er h
oles
at
the
Pip
esto
ne C
ount
y bo
rder
.
42
Fine
san
d, c
lay,
and
sil
t 6
at s
urfa
ce.
As
muc
h as
30 f
t of
gra
vel
belo
w a
cl
ay l
ayer
in
sout
hern
pa
rt o
f ar
ea.
16
Bro
wn
sand
y si
lt i
n ea
st-
2 er
n pa
rt o
f ch
anne
l;
sand
and
gra
vel
cont
ent
incr
ease
s w
estw
ard.
27
TiU
and
fin
e sa
nd;
how
- 8
ever
, m
ore
than
30
ft o
f sa
nd a
nd g
rave
l in
tes
t ho
les
113N
44W
12C
CC
and
113N
44W
11D
CC
.
22
Silty
bro
wn
clay
in
the
3 no
rthe
rn p
art
and
fine
to
coar
se s
and
and
grav
el
in t
he s
outh
ern
part
.
Ave
rag
e sa
tur
at
ed
thic
k
ness
(f
t) 30 25 9 15 10
Est
im
ated
am
ount
of
wat
er
in s
tor
ag
e (a
cre-
ft)
6,90
0
11,5
00
1,40
0
9,20
0
2,30
0
Pot
enti
al
wel
l-
yiel
d cl
assi
fi
cati
on
Mod
erat
e to
lar
ge
Do.
Smal
l to
m
oder
ate
Mod
erat
e to
lar
ge
SmaU
to
mod
erat
e
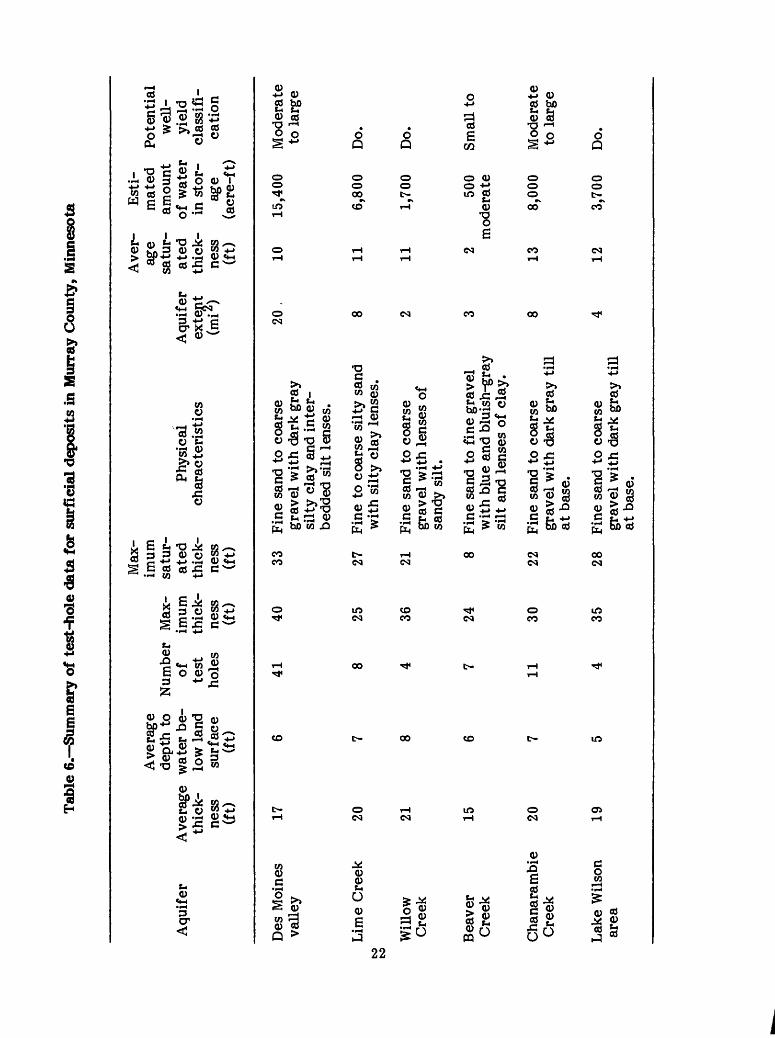
Tab
le 6
. Sum
mar
y of
tes
t-ho
le d
ata
for
surf
icia
l dep
osit
s in
Mur
ray
Cou
nty,
Min
neso
ta
Max
- A
vera
ge
imum
de
pth
to
Num
ber
Max
- sa
tur-
Aqu
ifer
A
vera
ge
wat
er b
e-
of
imum
at
ed
thic
k-
low
lan
d te
st
thic
k-
thic
k
ness
su
rfac
e ho
les
ness
ne
ss
(ft)
(f
t)
(ft)
(f
t)
Phys
ical
ch
arac
teri
stic
s
Ave
r-
Est
i-ag
e m
ated
P
oten
tial
sa
tur-
am
ount
w
ell-
A
quif
er
ated
of
wat
er
yiel
d ex
tent
th
ick-
in
sto
r-
clas
sifi
- (m
iz)
ness
ag
e ca
tion
(f
t)
(acr
e-ft
)
Des
Moi
nes
17
valle
y
Lim
e C
reek
20
to
to
Will
ow
21
Cre
ek
Bea
ver
15
Cre
ek
Cha
nara
mbi
e 20
C
reek
Lak
e W
ilson
19
ar
ea
41
40
33
Fin
e sa
nd t
o co
arse
grav
el w
ith
dark
gra
y si
lty
clay
and
int
er-
bedd
ed s
ilt
lens
es.
8 25
27
F
ine
to c
oars
e si
lty
sand
w
ith s
ilty
cla
y le
nses
.
4 36
21
Fi
ne s
and
to c
oars
e gr
avel
with
len
ses
of
sand
y si
lt.
7 24
8
Fin
e sa
nd t
o fi
ne g
rave
l w
ith
blue
and
blu
ish-
gray
si
lt a
nd l
ense
s of
cla
y.
11
30
22
Fine
san
d to
coa
rse
grav
el w
ith d
ark
gray
til
l at
bas
e.
4 35
28
F
ine
sand
to
coar
segr
avel
wit
h da
rk g
ray
till
at
bas
e.
20 ,
10
15,4
00
Mod
erat
eto
lar
ge
11
6,80
0 D
o.
11
1,70
0 D
o.
2 50
0 Sm
all
to
mod
erat
e
13
8,00
0 M
oder
ate
to l
arge
12
3,70
0 D
o.
Des Moines River valley aquifer
The Des Moines River valley is about 0.5-mi wide near Lake Shetek and increases to 2-mi wide at the Cottonwood County border. The deposits in the valley consist of fine sand to coarse gravel interbedded with dark-gray silty clay and lenses of silt. Analyses of 41 test holes indicate that the deposits range in thickness from 6 to 40 ft and average 17 ft. The maximum saturated thickness was 33 ft in test hole 107N40W35BAB. Hydro- graphs of four observation wells show that the water level rose from 4 to 6 ft in spring 1979, and that the water levels in summer 1979 were 2 to 3 ft above levels in summer 1978. Above-normal precipitation during winter and spring 1979 caused the water levels to rise to all-time highs. Generally, high water levels occur in March and April and low water levels in September. Yields of wells in the aquifer vary greatly. Small yields may be expected from wells in most of the aquifer, but moderate yields may be expected locally where the saturated thickness of the sand and gravel is greater than 20 ft. The most favorable area is shown on plate 4 to extend from Currie southeast for 7 mi. A sample from observation well 107N40W21AAB (August 1977) at the south edge of Currie show that the dissolved-solids concentration was 795 mg/L, and that the water can be classified as a magnesium sulfate type (table 2). Analyses from observation wells 5, 8, and 13 mi below Currie show that the dissolved-solids concentration decreased to 763, 558, and 417 mg/L, respectively.
Nobles County
The physiography of Nobles County is dominated by the Coteau des Prairie, which trends south and southeast from the Murray County border to Iowa. Associated with the Coteau are surficial-outwash deposits that occur as long, narrow bodies following stream courses (pi. 5). The drainageways that head on the east side of the Coteau are relatively narrow and contain fine-grained material. During the Pleistocene age, flow in these streams, which drained the back slopes of the moraines, may have been too small to carry large amounts of gravel (Norvitch, 1960). Drainageways that formed on the front slopes of the Coteau contain gravel deposits.
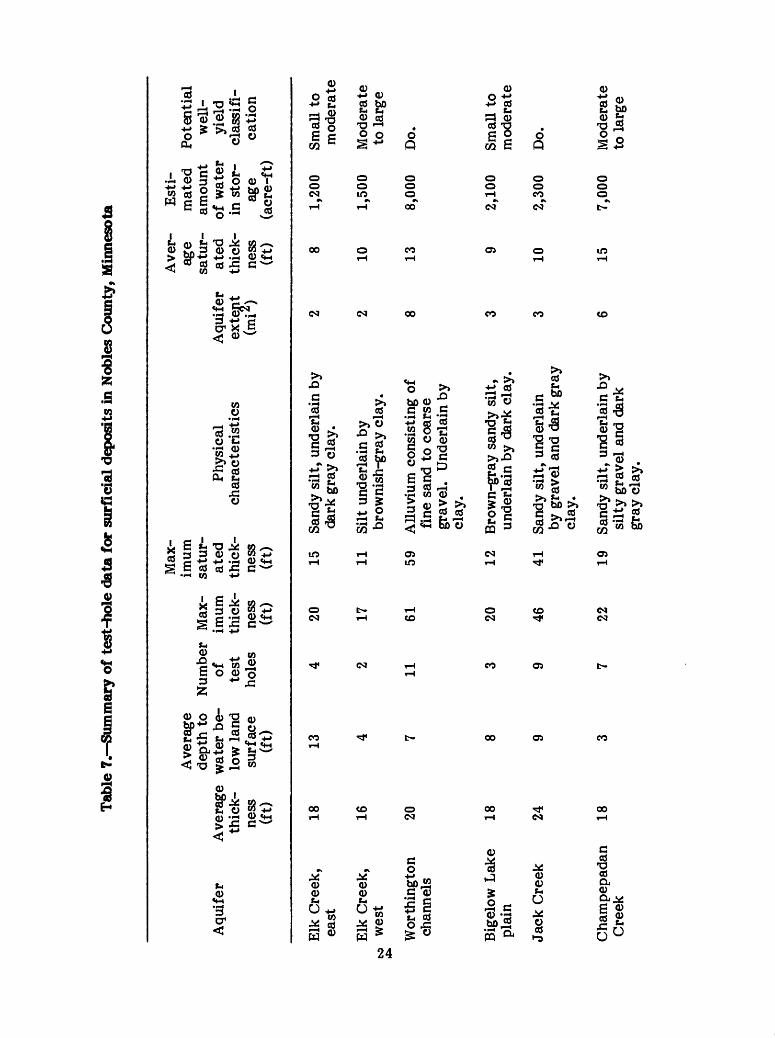
Large water supplies may be obtained from aquifers in the Kanaranzi Creek valley and the Worthington channels. The surficial aquifers are used by Worthington, Bigelow, Lismore, and Adrian. Irrigation from surficial aquifers was about 500 acres in 1977. The summary of test-hole data for surficial deposits in Nobles County is shown in table 7.
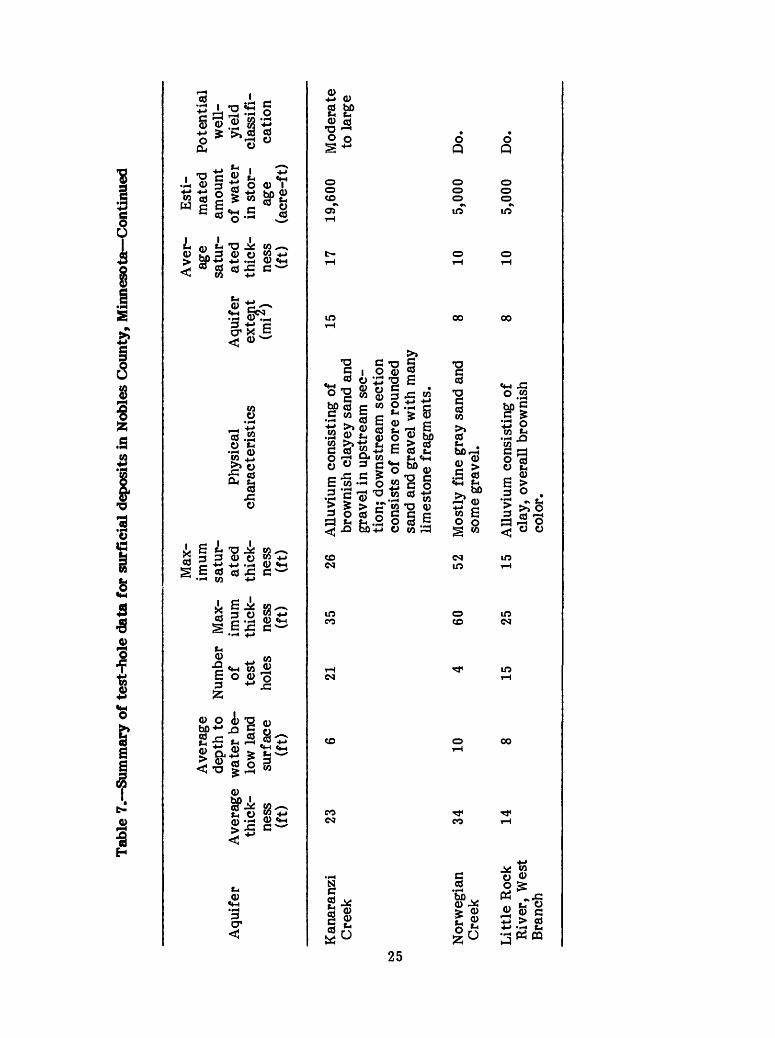
Kanaranzi Creek valley aquifer
Kanaranzi Creek has the largest drainage system in Nobles County. The width of the valley varies from less than 0.5 mi to more than 1 mi near the Rock County border. Logs of 21 test holes show that the thickness of the sand and gravel averages 24 ft from the Rock County border to 4 mi north of Adrian. East of Adrian the deposits become clayey. The saturated thickness is generally 12 ft. Yields to wells will probably be small where the aquifer is narrow; however, large yields should be obtainable where the depos its are greater than 25-ft thick and 1-mi wide. Pumping rates of the Adrian and Lismore wells are 115 and 50 gal/min, respectively. Water from the aquifer is very hard and high in sulfate concentration.
The Norwegian Creek valley ranges from about 0.25-mi wide in the headwaters to about 1-mi wide at the Rock County border. Results of 4 test holes drilled in 1959 show that the outwash ranges from 21- to 60-ft thick and averages 37 ft (Norvitch, 1960).
23
Tab
le 7
. Sum
mar
y of
tes
t-ho
le d
ata
for
surf
icia
l dep
osit
s in
Nob
les
Cou
nty,
Min
neso
ta
Aqu
ifer
Elk
Cre
ek,
east
Elk
Cre
ek,
wes
t
Wor
thin
gton
chan
nels
Big
elow
Lak
epl
ain
Jack
Cre
ek
Ave
rage
thic
kne
ss(f
t) 18 16 20 18 24
Ave
rage
dept
h to
wat
er b
elo
w l
and
surf
ace
(ft) 13 4 7 8 9
Num
ber
Max
-of test
hole
s
4 2 11 3 9
imum
thic
kne
ss(f
t) 20 17 61 20 46
Max
im
umsa
tur
ated
thic
kne
ss(f
t) 15 11 59 12 41
Phys
ical
char
acte
rist
ics
Sand
y si
lt,
unde
rlai
n by
dark
gra
y cl
ay.
Sil
t un
derl
ain
bybr
owni
sh-g
ray
clay
.
Allu
vium
con
sist
ing
offi
ne s
and
to c
oars
egr
avel
. U
nder
lain
by
clay
.
Bro
wn-
gray
san
dy s
ilt,
unde
rlai
n by
dar
k cl
ay.
Sand
y si
lt,
unde
rlai
n
Aqu
ifer
exte
nt(m
i1)
2 2 8 3 3
Ave
r
age
satu
rat
edth
ick
ness
(ft) 8 10 13 9 10
Est
i
mat
edam
ount
of w
ater
in s
tor
age
(acr
e-ft
)
1,20
0
1,50
0
8,00
0
2,10
0
2,30
0
Pot
enti
alw
ell-
yiel
dcl
assi
fi
cati
on
Smal
l to
mod
erat
e
Mod
erat
eto
lar
ge
Do.
Smal
l to
mod
erat
e
Do.
Cha
mpe
pada
n 18
C
reek
by g
rave
l an
d da
rk g
ray
clay
.
7 22
19
Sa
ndy
silt
, un
derl
ain
by
silt
y gr
avel
and
dar
k gr
ay c
lay.
15
7,00
0 M
oder
ate
to l
arge
Tab
le 7
. Sum
mar
y of
tes
t-ho
le d
ata
for
surf
icia
l dep
osit
s in
Nob
les
Cou
nty,
Min
neso
ta C
onti
nued
01
Aqu
ifer
Kan
aran
ziC
reek
Ave
rage
thic
kne
ss(f
t) 23
Ave
rage
dept
h to
wat
er b
elo
w l
and
surf
ace
(ft) 6
Num
ber
Max
-of
im
umte
st
thic
k-ho
les
ness
(ft)
21
35
Max
im
umsa
tur
ated
thic
kne
ss(f
t) 26
Phys
ical
char
acte
rist
ics
Allu
vium
con
sist
ing
ofbr
owni
sh c
laye
y sa
nd a
ndgr
avel
in
upst
ream
sec
tio
n; d
owns
trea
m s
ecti
onco
nsis
ts o
f m
ore
roun
ded
sand
and
gra
vel
with
man
ylim
esto
ne f
ragm
ents
.
Aqu
ifer
exte
nt(m
i2)
15
Ave
r
age
satu
rat
edth
ick
ness
(ft) 17
Est
i
mat
edam
ount
of w
ater
in s
tor
age
(acr
e-ft
)
19,6
00
Pot
enti
alw
ell-
yiel
dcl
assi
fi
cati
on
Mod
erat
eto
lar
ge
Nor
weg
ian
Cre
ek
Lit
tle
Roc
k R
iver
, W
est
Bra
nch
34 14
104
60
52
Mos
tly f
ine
gray
san
d an
d so
me
grav
el.
15
25
15
Allu
vium
con
sist
ing
ofcl
ay,
over
all
brow
nish
co
lor.
10
5,00
0 D
o.
10
5,00
0 D
o.
Three locations, shown on plate 5, where saturated thickness is greater than 20 ft, have a potential for the development of large supplies. The most promising area extends from the Rock County border to Adrian.
Worthington channels
The Worthington channels consist of two outwash valleys that extend south from Okabena Lake to Ocheda Lake. Below Ocheda Lake, the Ocheyeda River flows in the west channel to Lake Bella near the Iowa border. The east channel joins the west chan nel 1 mi north of the border. The valley floors are less than 0.5-mi wide and are less than 20 ft below the prairie. Three test holes drilled in the channel deposits south of the west arm of Ocheda Lake in 1959 (Norvitch, 1960) and eight holes drilled in the same general area in 1978, show that the maximum thickness of the deposits was 61 ft; the average thickness was 20 ft. The deposits consist of sandy silt underlain by gravel. Static water levels average 7 ft, and the saturated thickness averages 13 ft. Yields to wells will vary considerably within short distances because of abrupt changes in lithology and thickness. The city of Worthington had 10 wells pumping from the channel deposits in 1978. The 5 wells located 1 mi south of town yield 35 gal/min each, whereas, the 5 wells 6 mi south of town yield 400 to 500 gal/min each. Saturated thicknesses ranged from 40 to 50 ft in the southernmost wells. The only potential for further development is south of Lake Ocheda. Test hole 101N40W27BAB penetrated 56 ft of fine to coarse gravel. Analyses of water from well 102N40W27CCD4 (table 2) indicate that the dissolved-solids concentration is 552 mg/L. The water is hard and is a calcium sulf ate bicarbonate type. Concentrations of sulfate and calcium are 184 and 118 mg/L, respectively.
Pipestone County
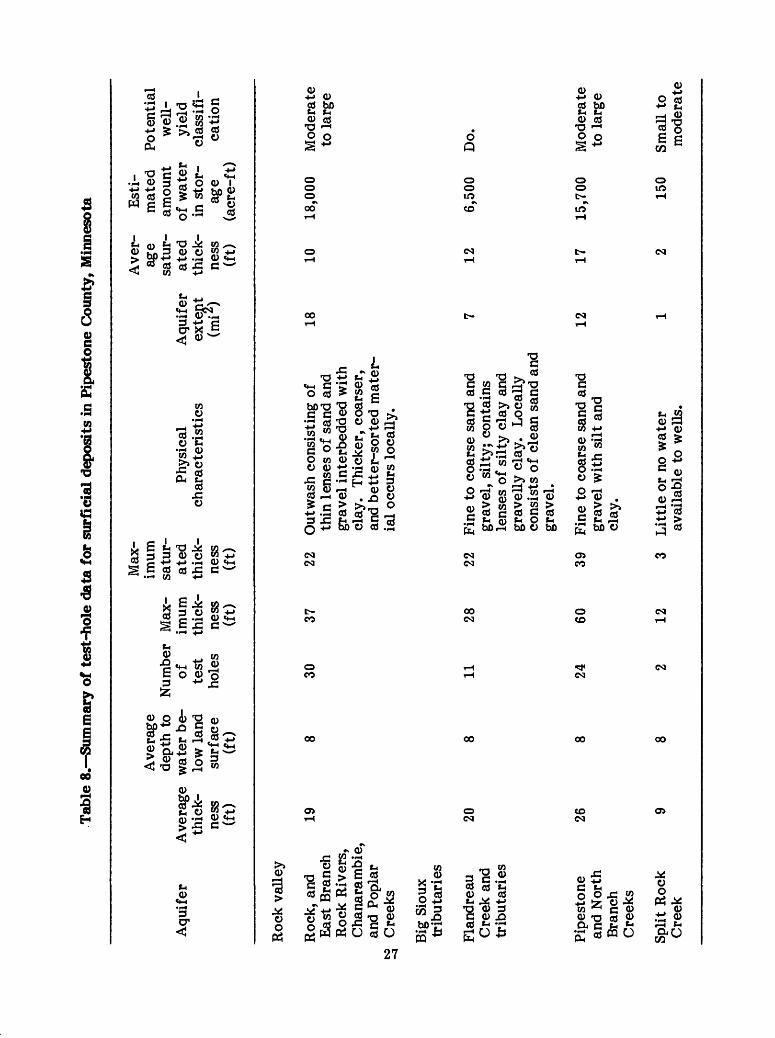
The Coteau des Prairie crosses the northeastern corner of Pipestone County and gives rise to the Redwood River, Rock River, Flandreau Creek, and Pipestone Creek (pi. 6). Water use for irrigation is restricted to the Pipestone Creek aquifer. Irrigation by sprinklers has increased from 120 acres in 1970 to 1,421 acres in 1977. The village of Edgerton wells tap the Rock River valley aquifer. Table 8 contains the summary of test- hole data for surficial deposits in Pipestone County.
Rock River valley aquifer
The Rock River heads on the southwestern flank of the Coteau and flows southward through a 1-mi wide valley near the eastern edge of the county. Results of 20 auger holes indicate that deposits in the Rock River valley aquifer consist of thin lenses of sand and gravel interbedded with clay. The deposits ranged from 4 to 37 ft in thickness and averaged 19 ft. Thicker and coarser material occurs locally. A hydrograph of well 106N44W33CCD (June 1978, pi. 6) shows that the water level was 6 ft below land surface during 1978 but recovered 4 ft during spring 1979. Throughout the rest of the year the water level gradually declined except in July when heavy rains fell. Fluctuations of water levels in observation well 105N43W18BCC (July 1978) at the Murray County line in the Chanarambie Creek valley were similar to those in the Rock River valley aquifer. Analyses of material penetrated in test holes and results of an aquifer test indicate that potential well yields are small. A well tapping coarse gravel deposits 30-ft thick in the headwaters of East Branch Rock River is reported to yield 600 gal/min. However, yields of 100 gal/min can be expected from much of the aquifer because of the limited draw down. A test well 2 mi north of Edgerton was pumped for 24 hours at 68 gal/min (DeWild and others, 1979). The well taps 57 ft of deposits. Transmissivity was 4,000 ft /d. Logs
26
Tab
le 8
. Sum
mar
y of
tes
t-ho
le d
ata
for
surf
icia
l dep
osit
s in
Pip
esto
ne C
ount
y, M
inne
sota
Aqu
ifer
Ave
rage
thic
kne
ss(f
t)
Ave
rage
dept
h to
wat
er b
elo
w l
and
surf
ace
(ft)
Num
ber
Max
-of test
hole
s
imum
thic
kne
ss(f
t)
Max
im
umsa
tur
ated
thic
kne
ss(f
t)
Phys
ical
char
acte
rist
ics
Aqu
ifer
exte
nt(m
i*)
Ave
r
age
satu
rat
edth
ick
ness
(ft)
Est
i
mat
edam
ount
of w
ater
in s
tor
age
(acr
e-ft
)
Pot
enti
alw
ell-
yiel
dcl
assi
fi
cati
on
Roc
k va
lley
Roc
k, a
nd
Eas
t B
ranc
h R
ock
Riv
ers,
C
hana
ram
bie,
an
d P
opla
r ^
Cre
eks
Big
Sio
ux
trib
utar
ies
Fla
ndre
au
Cre
ek a
nd
trib
utar
ies
Pip
esto
ne
and
Nor
th
Bra
nch
Cre
eks
Split
Roc
k C
reek
19 20 26
30
37
22
Out
was
h co
nsis
ting
of
18th
in l
ense
s of
san
d an
d gr
avel
int
erbe
dded
with
cl
ay.
Thi
cker
, co
arse
r,
and
bett
er-s
orte
d m
ater
ia
l oc
curs
loc
ally
.
11
28
22
Fine
to
coar
se s
and
and
7gr
avel
, si
lty;
con
tain
s le
nses
of
silt
y cl
ay a
nd
grav
elly
cla
y.
Loc
ally
co
nsis
ts o
f cl
ean
sand
and
gr
avel
.
24
60
39
Fine
to
coar
se s
and
and
12gr
avel
with
sil
t an
d cl
ay.
12
3 L
ittl
e or
no
wat
er
avai
labl
e to
wel
ls.
10
18,0
00
Mod
erat
e to
lar
ge
12
6,50
0 D
o.
17
15,7
00 150
Mod
erat
e to
lar
ge
Smal
l to
m
oder
ate
of test holes indicate that the deposits are clayey. Chemical analyses of water from observation well 106N44W33CCD (June 1978) and test hole 105N44W17ABB indicate that dissolved-solids concentrations were 694 mg/L and 414 mg/L, respectively (table 2). The water is very hard and is of the calcium bicarbonate type. The National Academy of Science and National Academy of Engineering (1973) recommended limit of nitrite- nitrate concentration was exceeded in well 106N44W33CCD (June 1978).
Big Sioux tributary aquifers
Flandreau, Pipestone, and Split Rock Creeks drain the western half of Pipestone County. All flow southwestward to the Big Sioux River in South Dakota. Deposits in the Split Rock Creek valley do not have sufficient saturated thickness to yield water to wells.
The Flandreau Creek valley is a well-developed channel that is 0.5-mi wide. The valley floor is 50 ft below the prairie. Deposits consisting of silty sand and gravel with lenses of clay range in thickness from 16 to 28 ft and average 20 ft. The water level in observation well 107N47W12CDC (September 1978) rose 4 ft in spring 1978 and 3 ft in spring 1979 but declined 1.5 ft during summer 1978 and 1979. Potential well yields from the deposits are small. Large yields may be available locally where deposits are coarser and thicker; such as the area near the Lincoln County line (pi. 6). The concentration of dissolved solids was 655 mg/L (table 2) from observation well 107N47W12CDC (September 1978). The water, which is of the calcium sulf ate type, exceeds the National Academy of Science and National Academy of Engineering (1973) recommended limit for nitrite-nitrate concentrations.
Pipestone Creek heads on the western slope of the Coteau. The Creek valley is partly filled with water-laid sand and gravel. Data from 24 test holes indicate that the out wash ranges in thickness from 15 to 60 ft and averages 26 ft. Thick deposits of sand and gravel in the drainage system form broad terraces near the confluence of tribu taries. Two holes penetrated 40 and 60 ft of sand and gravel near the confluence of the North Branch and Pipestone Creeks. Saturated thicknesses were 19 and 39 ft, respec tively. Water-level fluctuations in observation well 107N47W12CDC (September 1978) indicate that the annual change is about 4 ft. Water levels rose sharply in spring, were highest in May, and then decreased gradually the rest of the year except as affected by precipitation. Five irrigation wells produce water from the Pipestone Creek valley aqui fer and terrace deposits, which are hydraulically connected. Yields range from 400 to 725 gal/min and depths range from 41 to 62 ft. Aquifer tests were made on two irriga tion wells (Fax, 1980). The well in the upper reach is 56 ft deep and was pumped at 725 gal/min. Drawdown was 27 ft after 72 hours. The average transmissivity was 15,600 ft /d and the storage coefficient was 0.02. The other test was made on well 106N46W08DAB near the South Dakota bonder. The well is 61-ft deep and was pumped at 550 gal/min. Transmissivity was 16,000 ft2 /d.
Redwood County
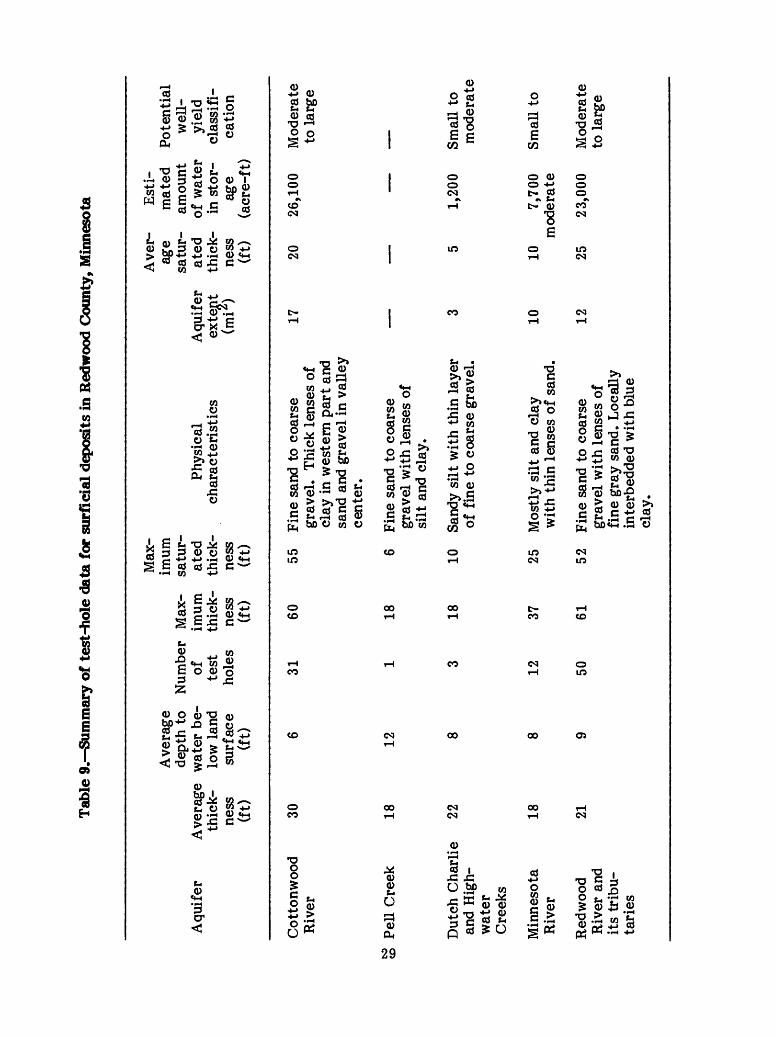
Drift forms a gently undulating plain over the bedrock in Redwood County. The plain is interrupted in part by the Cottonwood River valley and by the large Minnesota River valley and its tributary, the Redwood River valley. The most productive surficial aquifers are in the valleys of the Redwood and Cottonwood Rivers (pi. 7). Irrigation from wells has increased from 340 acres in 1970 to 1,095 acres in 1977. However, only 2 of the 12 wells are completed in the surficial aquifers. Test-hole data are given in table 9.
28
Tab
le 9
. Sum
mar
y of
tes
t-ho
le d
ata
for
surf
icia
l dep
osit
s in
Red
woo
d C
ount
y, M
inne
sota
Aqu
ifer
Cot
tonw
ood
Riv
er
Ave
rage
thic
kne
ss(f
t) 30
Ave
rage
dept
h to
wat
er b
elo
w l
and
surf
ace
(ft) 6
Num
ber
of test
hole
s
31
Max
im
umth
ick
ness
(ft) 60
Max
im
umsa
tur
ated
thic
kne
ss(f
t) 55
Phy
sica
lch
arac
teri
stic
s
Fine
san
d to
coa
rse
grav
el.
Thi
ck l
ense
s of
clay
in
wes
tern
par
t an
dsa
nd a
nd g
rave
l in
val
ley
cent
er.
Aqu
ifer
exte
nt(m
i*)
17
Ave
r
age
satu
rat
edth
ick
ness
(ft) 20
Est
i
mat
edam
ount
of w
ater
in s
tor
age
(acr
e-ft
)
26,1
00
Pot
enti
alw
ell-
yiel
dcl
assi
fi
cati
on
Mod
erat
eto
lar
ge
PeU
Cre
ek18
12
Dut
ch C
harl
ie
22
and
Hig
h-
wat
er
Cre
eks
Min
neso
ta
Riv
er
Red
woo
d R
iver
and
it
s tr
ibu
ta
ries
18 21
12 50
18
6 Fi
ne s
and
to c
oars
e gr
avel
wit
h le
nses
of
silt
and
cla
y.
18
10
Sand
y si
lt w
ith
thin
lay
er
of f
ine
to c
oars
e gr
avel
.
37
25
Mos
tly s
ilt
and
clay
wit
h th
in l
ense
s of
san
d.
61
52
Fin
e sa
nd t
o co
arse
gr
avel
wit
h le
nses
of
fine
gra
y sa
nd.
Loc
ally
in
terb
edde
d w
ith
blue
cl
ay.
5 1,
200
SmaU
to
mod
erat
e
10
10
7,70
0 Sm
aU t
o m
oder
ate
12
25
23,0
00
Mod
erat
eto
lar
ge
Redwood River valley aquifer
The Redwood River flows northeastward across Redwood County and occupies a broad, shallow valley, which ranges in width from 0.5 to 1 mi. The Redwood valley is parallel to the Antelope Moraine (Leverett, 1932) and is associated with a melt-water channel incised in the underlying shale of Cretaceous age to a depth of about 60 ft (Schneider and Rodis, 1961). In places, the outwash in the valley is underlain directly by granite (Helgeson, 1967). The melt-water channel was filled with till, glacio-lake de posits, and thick deposits of highly permeable water-bearing sand and gravel. Results of 50 test holes show that the sand and gravel range in thickness from 10 to 60 ft and aver age 25 ft. Water levels fluctuated only 3 ft during the 2 years of record in observation wells 112N37W21CCB and 112N39W22BBB (pi. 7) Cause of the small fluctuation was probably due to limited water use of the aquifer and high specific yield of the deposits. Water levels in observation well 112N38W21BBC fluctuated 4 ft, probably because the well is developed in less permeable material. Water levels show a seasonal fluctuation closely related to rainfall. Large well yield can be expected from most of the aquifer. The area where the saturated thickness is 20 ft or greater, as shown on plate 7, extends from the Lyon County border to Seaforth. Aquifer tests made near Marshall, Lvon County, indicated transmissivity values of 4,000 ft2 /d (Rodis, 1963) and 5,400 ftr/d (Thompson, 1965). Water from observation well 112N39W22BBB (March 1977) had a dissolved-solids concentration of 557 mg/L. The water is very hard and of the calcium sulfate bicarbonate type (table 2).
Cottonwood River valley aquifer
The Cottonwood River enters Redwood County from the west and flows southeast erly, leaving the county at the southeast corner. Major tributaries are Plum, Pell, Dutch Charlie, Highwater, and Dry Creeks. All tributaries are on the south side because the river is adjacent to the southern edge of Leverett's "Marshall moraine" (1932) and the land surface in the area slopes northeastward from the crest of the Coteau. The Cotton- wood River valley aquifer, which underlies 17 mi , consists of a narrow band of sand, gravel, silt, and clay. The valley floor is about 50 ft below the level of the prairie. Data from 31 test holes indicate that the thickness of the outwash ranges from 12 to 65 ft and averages 27 ft. Drilled in the central part and northern side of the valley generally penetrated thicker and more numerous sand and gravel lenses than those drilled on the southern side. The saturated thickness of the aquifer ranged from 1 to 60 ft, but was generally less than 25 ft. Monthly measurements in four observation wells in the aquifer for 2 years indicate that the annual water level fluctuates 4 ft (pi. 7). Irrigation well 109N37W02DCC, which is 34-ft deep and penetrates 17 ft of sand in the Cottonwood aquifer, was pumped for 72 hours at 300 gal/min. Analyses of the aquifer-test data indicate that the transmissivity was 3,900 ft /d, storage coefficient 5.6 x 10" , and specific capacity 18.1 (gal/min)/ft (Fax, 1980). Potential yields to wells range from moderate to large. Small yields are available from aquifers in the tributaries. Water from observation wells 110N39W17AAA (April 1977), 109N37W09CCC (June 1977), and 109N36W21DCC (November 1977) is a calcium sulfate bicarbonate type that ranges in dissolved-solids concentrations from 419 to 958 mg/L. Sulfate concentrations ranged from 310 to 380 mg/L.
30
Rock County
Surficial aquifers are present in the valleys of the Rock River and its tributaries (Champepadan, Elk, and Kanaranzi Creeks) and the Big Sioux tributaries (Split Rock and Beaver Creeks). The aquifer in the Rock River valley is the largest and most produc tive. During 1970-77, the irrigation acreage increased from 160 to 1,652. The aquifer is also tapped by wells for Luverne. The summary of test-hole data is given in table 10.
Rock River valley aquifer
The Rock River enters Rock County from Pipestone County, and flows southward through the eastern part of the county. The width of the valley increases from 0.5 to 1.5 mi, as shown on plate 8. Deposits in the valley consist of fine to coarse sand with interbedded silt and gravel. The average thickness is 22 ft in the northern part of the county and 24 ft in the southern part. Maximum thickness is 42 ft and maximum satur ated thickness is 38 ft. Water levels are generally less than 8 ft below land surface. Water levels in observation wells rose more than 2 ft during the 1979 spring snowmelt in the valley north of Luverne in well 104N44W21CDC (April 1978) and more than 4 ft in the valley south of Luverne in well 102N45W35DDC (January 1978). Two areas are shown on plate 8 where saturated thickness is greater than 20 ft. One area is east of Hardwick and the other extends from Blue Mounds State Park south to 1 mi from the Iowa border. Data from test holes and aquifer tests indicated that large yields may be expected local ly in these areas. Results of three aquifer tests are also shown on plate 8. Two wells were tested north of Ash Creek by Rock County Rural Water District (DeWild and others, 1979). The wells are 32-ft deep and penetrate fine sand and medium to coarse gravel. Transmissivities were 4,000 and 8,000 ft /d and the storage coefficient was 0.12. Results of the third aquifer test, which used a well in the surficial deposits at Luverne, determined that the transmissivity was 7,300 ft2 /d (Fax, 1980). The well was 38-ft deep and pumped at 200 gal/min. Analysis of a water sample from observation well 104N44W21CDC (April 1978), in the northern part of the aquifer, shows that the dissolved-solids concentration is 357 mg/L. Nitrite-nitrate concentration exceeded the recommended National Academy of Science and National Academy of Engineering (1973) limits. The sample from observation well 102N45W35DDC (January 1978) in the southern part of the aquifer had 658 mg/L dissolved solids and high concentration of sulfate.
Big Sioux tributary aquifers
Beaver Creek drains the west-central part of Rock County. The creek probably was the outlet for the swamp or shallow lake that covered a depression in the northwest part of the county. The valley is 0.5-mi wide in the upper reach and increases to 1-mi wide at the South Dakota border.
Outwash in Beaver Creek valley aquifer ranged from 10- to 40-ft thick, based on logs from eight test holes. The average saturated thickness was 20 ft. The outwash consists of medium to coarse sand, but some silt and very coarse sand occurs. A hydro- graph of observation well 102N46W14AAA shows that the water level fluctuated 4 ft dur ing 1978 and 5 ft during 1979. Water levels averaged 8 ft below land surface during 1978 and 6 ft below land surface during 1979. An analysis of water from observation well 102N46W14AAA (February 1978) shows that the dissolved-solids concentration is 313 mg/L. Concentrations of nitrite-nitrate was 15 mg/L (table 2).
31
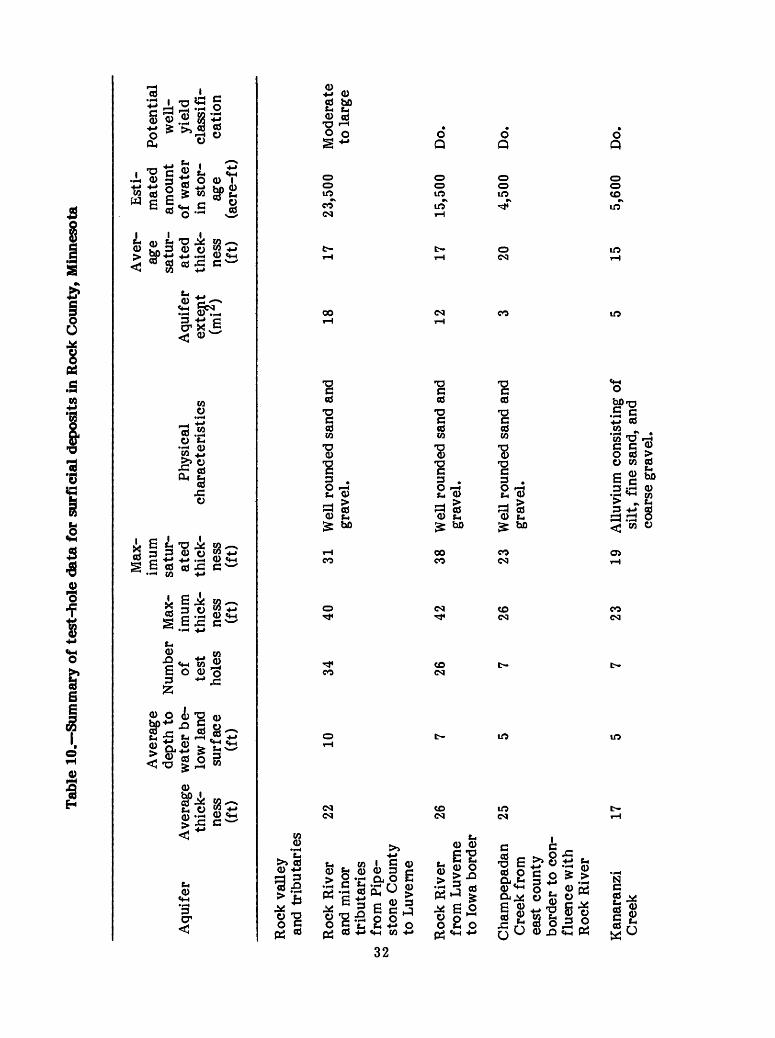
Tab
le 1
0. S
umm
ary
of t
est-
hol
e da
ta f
or s
urfi
cial
dep
osit
s in
Roc
k C
ount
y, M
inne
sota
CO to
Aqu
ifer
Ave
rage
thic
kne
ss(f
t)
Ave
rage
dept
h to
wat
er b
elo
w l
and
surf
ace
(ft)
Num
ber
Max
-of test
hole
s
imum
thic
kne
ss(f
t)
Max
im
umsa
tur
ated
thic
kne
ss(f
t)
Phy
sica
lch
arac
teri
stic
sA
quif
erex
tent
(ml*
)
Ave
r
age
satu
rat
edth
ick
ness
(ft)
Est
i
mat
edam
ount
of w
ater
in s
tor
age
(acr
e-ft
)
Pot
enti
alw
ell-
yiel
dcl
assi
fi
cati
on
Roc
k va
lley
an
d tr
ibut
arie
s
Roc
k R
iver
22
an
d m
inor
tr
ibut
arie
s fr
om P
ipe-
st
one
Cou
nty
to L
uver
ne
Roc
k R
iver
26
fr
om L
uver
ne
to I
owa
bord
er
Cha
mpe
pada
n 25
C
reek
fro
m
east
cou
nty
bord
er t
o co
n
flue
nce
wit
h R
ock
Riv
er
Kan
aran
zi
17
Cre
ek
1034
40
26
42
7 26
7 23
31 38 23 19
Wel
l ro
unde
d sa
nd a
nd
grav
el.
18
17
23,5
00
Mod
erat
eto
lar
ge
Wel
l ro
unde
d sa
nd a
nd
grav
el.
Wel
l ro
unde
d sa
nd a
nd
grav
el.
12
17
15,5
00
Do.
20
4,50
0 D
o.
Allu
vium
con
sist
ing
of
silt
, fi
ne s
and,
and
co
arse
gra
vel.
155,
600
Do.
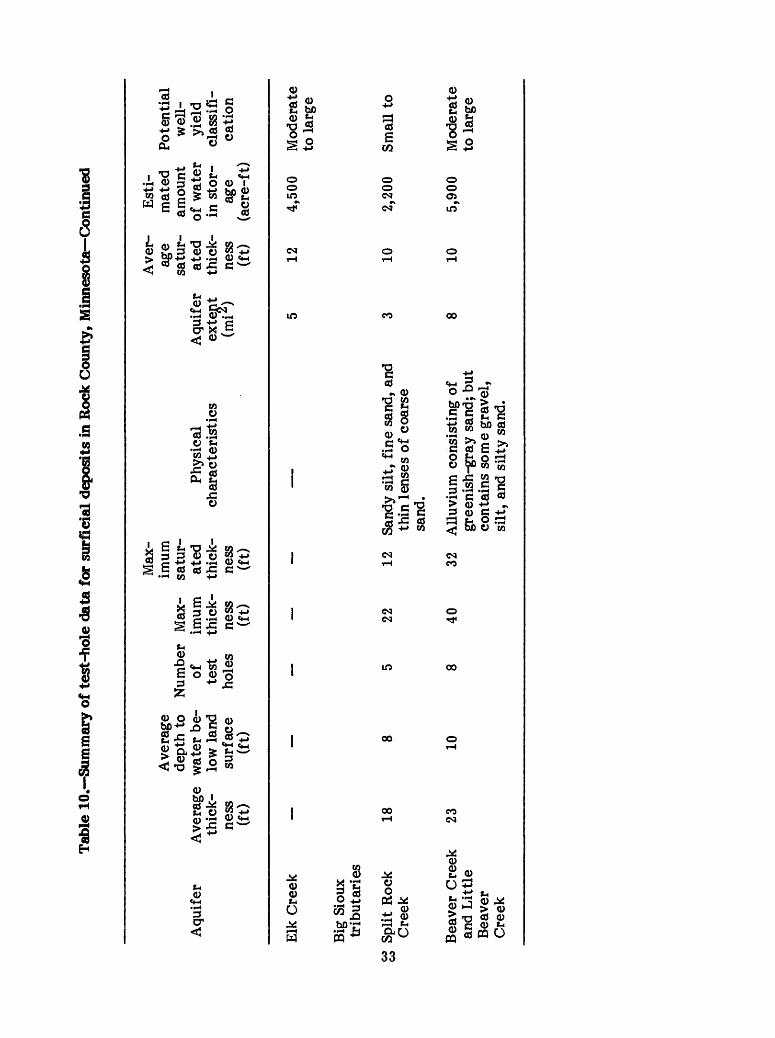
Tab
le 1
0. S
umm
ary
of t
est-
hole
dat
a fo
r su
rfic
ial d
epos
its
in R
ock
Cou
nty,
Min
neso
ta C
onti
nued
Aqu
ifer
Elk
Cre
ek
Big
Sio
uxtr
ibut
arie
s
Split
Roc
kC
reek
Ave
rage
thic
kne
ss(f
t) _ 18
Ave
rage
dept
h to
wat
er b
elo
w l
and
surf
ace
(ft) _ 8
Num
ber
Max
-of
im
umte
st
thic
k-ho
les
ness
(ft)
_
. _
5 22
Max
im
umsa
tur
ated
Ph
ysic
alth
ick-
ch
arac
teri
stic
sne
ss(f
t) __
_ _
12
Sand
y si
lt,
fine
san
d, a
ndth
in l
ense
s of
coa
rse
Aqu
ifer
exte
nt(m
i*)
5 3
Ave
r
age
satu
rat
edth
ick
ness
(ft) 12 10
Est
i
mat
edam
ount
of w
ater
in s
tor
age
(acr
e-ft
)
4,50
0
2,20
0
Pot
enti
alw
ell-
yiel
dcl
assi
fi
cati
on
Mod
erat
eto
lar
ge
SmaU
to
Bea
ver
Cre
ek
and
Lit
tle
Bea
ver
Cre
ek
2310
sand
.
40
32
Allu
vium
con
sist
ing
of
gree
nish
-gra
y sa
nd;
but
cont
ains
som
e gr
avel
, si
lt,
and
silt
y sa
nd.
8 10
5,
900
Mod
erat
eto
lar
ge
SUMMARY AND CONCLUSIONS
Surficial aquifers in southwest Minnesota consist of unconfined surficial outwash and alluvium in stream channels. Principal surficial aquifers are in the Cottonwood, Des Moines, Redwood, and Rock River valleys, the aquifers in Nobles County, and the Big Sioux tributary aquifers in Pipestone and Rock Counties. These aquifers are important sources of water because they contain large deposits of saturated sand and gravel, have large quantities of water in storage, and are readily recharged. Other factors that make the aquifers significant are that the (1) areal extent can be traced with relative ease, (2) water is of fairly good quality, (3) depth of wells is generally less than 100 ft, and (4) yield to individual wells is as much as 1,000 gal/min. Although high yields are obtained locally, yields are generally less than 100 gal/min.
Well yields sufficient for domestic use can generally be obtained wherever the sand- and-gravel aquifers are present. Yields sufficient for municipal, irrigation, or industrial use are possible in parts of the aquifer. Desirable locations for large yields seem to be (1) where the outwash in the valley is the widest, thickest, and most permeable, (2) near a surface-water body such as a lake or stream, (3) near the confluence of two channels, and (4) away from relatively impermeable hydrologic boundaries, such as valley walls. The following summary by counties is a brief description of where potential well yields are moderate to large (200 gal/min or greater).
Cottonwood County has some of the highest yielding wells. North of Windom, irriga tion wells that yield as much as 1,000 gal/min are completed in surficial deposits of the Des Moines River valley.
Jackson County has two areas in the Des Moines aquifer that are favorable for fur ther development. Well yields sufficient for domestic and small industrial supplies are available near the Iowa border. Moderate well yields are available in a small area near the Cottonwood County border.
In Lincoln County, potentially large well yields are available from the more perme able deposits at the county line in the Flandreau aquifer, in the southern part of the Elkton aquifer, and in the southern part of the Porter aquifer.
In Murray County, large well yields can be obtained from surficial deposits only from the Des Moines River valley aquifer near Currie.
Nobles County has four areas where aquifers will potentially yield as much as 200 gal/min. Two are from the Kanaranzi aquifer near Adrian and another is from the Kanaranzi aquifer near Ellsworth. The fourth area is the channel deposits south of Worthington.
In Pipestone County, well yields of as much as 1,000 gal/min are obtained from the Pipestone Creek aquifer. Moderate yields can potentially be obtained from the Flandreau aquifer near the Lincoln County border.
In Redwood County, moderate well yields can be expected from the Redwood and Cottonwood aquifers. Only small yields are available from aquifers in tributaries to the Cottonwood River.
34
In Rock County, moderate well yields are generally obtained from aquifers in the Rock River and its tributaries. However, large yields may be expected locally.
Dissolved-solids concentrations in water from surficial-outwash aquifers is generally less than 800 mg/L. The water is very hard, most ranging from 100 to 630 mg/L as CaCOg. Dissolved iron and manganese concentrations are generally high. Sulfate concentrations in the Kanaranzi Creek valley aquifer and the Cottonwood River valley aquifer are high. Locally, high concentrations of nitrite-nitrate are present in the Chanarambie Creek valley aquifer in Murray County, the Rock River valley and Flan- dreau Creek valley aquifers in Pipestone County, and the Beaver Creek valley and Rock River valley aquifers in Rock County
REFERENCES
Anderson, H. W., Jr., Broussard, W. L., Farrell, D. H., and Felsheim, P. E., 1976a, Water resources of the Rock River watershed, southwestern Minnesota: U.S. Geological Survey Hydrologic Investigations Atlas HA-555.
Anderson, H. W., Jr., Broussard, W. L., Farrell, D. F., and Hult, M. F., 1976b, Water resources of the Des Moines River watershed, southwestern Minnesota: U.S. Geological Survey Hydrologic Investigations Atlas HA-553.
Anderson, H. W., Jr., Farrell, D. F., and Broussard, W. L., 1974, Water resources of the Blue Earth River watershed, south-central Minnesota: U.S. Geological Survey Hydrologic Atlas HA-525.
Broussard, W. L., Anderson, H. W., Jr., and Farrell, D. F., 1973, Water resources of the Cottonwood River watershed, southwestern Minnesota: U.S. Geological Survey Hydrologic Investigations Atlas HA-466.
Cotter, R. D., and Bidwell, L. E., 1968, Water resources of the Lac qui Parle River watershed, southwestern Minnesota: U.S. Geological Survey Hydrologic Investigations Atlas HA-269.
DeWild, Grant, Reckert, and Associates, Co., 1979, Report of exploratory test drilling, electrical resistivity, well construction, and test pumping, Lincoln-Pipestone rural water, Minnesota: Project no. 2688, Rock Rapids, Iowa.
Ellis, M. J., and Adolphson, D. G., 1969, Basic hydrologic data for a part of the Big Sioux drainage basin, eastern South Dakota: South Dakota Geological Survey and South Dakota Water Resources Commission, Water Resources Report 5, 124 p.
Ellis, M. J., Adolphson, D. G., and West, R. E., 1969, Hydrology of a part of the Big Sioux drainage basin, eastern South Dakota: U.S. Geological Survey Hydrologic Investigations Atlas HA-311.
Fax, F. G., 1980, Selected aquifer tests in Minnesota: Minnesota Department of Natural Resources Technical Paper no. 8, 130 p.
Hall, C. W., Meinzer, O. E., and Fuller, M. L., 1911, Geology and underground waters of southern Minnesota: U.S. Geological Survey Water-Supply Paper 206, 406 p.
35
Helgesen, J. O., 1967, Hydrogeolugy of outwash associated with the Antelope moraine, southwestern Minnesota: Master of Science thesis, Colorado State University, Fort Collins, Colorado.
Jacob, C. E., 1944, Notes on determining permeability by pumping tests under water- table conditions: U.S. Geological Survey Bulletin 41, 193 p.
Kuehnast, E. L., 1972, Climate of Minnesota: U.S. Department of Commerce, National Oceanic and Atmospheric Administration, Climatography of the United States no. 60-21, p. 1-3.
Larson, S. P., 1976, An appraisal of ground water for irrigation in the Appleton area, west-central Minnesota: U.S. Geological Survey Water-Supply Paper 2039-B, 34 p.
Leverett, Frank, 1932, Quaternary geology of Minnesota and parts of adjacent States: U.S. Geological Survey Professional Paper 161, 149 p.
Leverett, Frank, and Sardeson, F. W., 1932, Map of the southern part of Minnesota showing surficial deposits in Leverett, Frank, 1932, Quaternary geology of Minnesota and parts of adjacent States: U.S. Geological Survey Professional Paper 161, 149 p.
Matsch, C. L., 1972, Quaternary geology of southwestern Minnesota, in Sims, P. K., and Morey, G. B., eds., Geology of Minnesota a centennial volume: Minnesota Geological Survey, University of Minnesota, p.548-560.
Minnesota Division of Waters, 1959, Hydrologic atlas of Minnesota: Minnesota Division of Waters Bulletin 10, 182 p.
National Academy of Science and National Academy of Engineering, 1973 (1974), Water quality criteria, 1972: U.S. Government Printing Office, Washington, D. C.
Norvitch, R. F., 1960, Ground water in alluvial channel deposits, Nobles County, Minnesota: Minnesota Division of Waters Bulletin 14, 23 p.
__ 1964, Geology and ground-water resources of Nobles County and part of Jackson County, Minnesota: U.S. Geological Survey Water-Supply Paper 1749, 70 p.
Novitzki, R. P., Van Voast, W. A., and Jerabek, L. A., 1969, Water resources of the Yellow Medicine River watershed, southwestern Minnesota: U.S. Geological Survey Hydrologic Investigations Atlas HA-320.
Rodis, H. G., 1961, Availability of ground water in Lyon County, Minnesota: U.S. Geological Survey Circular 444, 7 p.
__ 1963, Geology and occurrence of ground water in Lyon County, Minnesota: U.S. Geological Survey Water-Supply Paper 1619-N, 41 p.
Schiner, G. R., and Schneider, Robert, 1964, Geology and ground-water conditions of the Redwood Falls area, Redwood County, Minnesota: U.S. Geological Survey Water- Supply Paper 1669-R, 46 p.
36
Schneider, Robert, and Rodis, G. H., 1961, Aquifers in melt-water channels along the southwest flank of the Des Moines Lobe, Lyon County, Minnesota: U.S. Geological Survey Water-Supply Paper 1539-F, 11 p.
Theis, C. V., 1935, The relation between the lowering of the piezometric surface and the rate and duration of discharge of a well using ground-water storage: American Geophysical Union Transcript, v. 16, pt 2, p.519-524.
Thiel, G. A., 1944, The geology and underground water of southern Minnesota: Minnesota Geological Survey Bulletin 31, 506 p.
Thompson, G. L., 1965, Hydrology of melt-water channels in southwestern Minnesota: U.S. Geological Survey Water-Supply Paper 1809-K, 11 p.
U.S. Salinity Laboratory Staff, 1954, Diagnosis and improvements of saline and alkaline soils: U.S. Department of Agriculture Handbook 60, 160 p.
Van Voast, W. A., Jerabek, L. A., and Novitzki, R. P., 1970, Water resources of the Redwood River watershed, southwestern Minnesota: U.S. Geological Survey Hydrologic Investigations Atlas HA-345.
U.S. Government Printing Office: 1983 666-094/251 Region No. 6
37


![Downes v. Bidwell (1901) [Insular Cases]](https://img.pdfslide.us/doc/110x75/568165f6550346895dd91c9d/downes-v-bidwell-1901-insular-cases.jpg)