Embed Size (px)
Citation preview
Autotuning GPU Kernels viaStatic and Predictive Analysis
Robert V. Lim, Boyana Norris, and Allen D. MalonyComputer and Information Science
University of OregonEugene, OR, USA
{roblim1, norris, malony}@cs.uoregon.edu
Abstract—Optimizing the performance of GPU kernels ischallenging for both human programmers and code generators.For example, CUDA programmers must set thread and blockparameters for a kernel, but might not have the intuition tomake a good choice. Similarly, compilers can generate workingcode, but may miss tuning opportunities by not targeting GPUmodels or performing code transformations. Although empiricalautotuning addresses some of these challenges, it requires exten-sive experimentation and search for optimal code variants. Thisresearch presents an approach for tuning CUDA kernels basedon static analysis that considers fine-grained code structure andthe specific GPU architecture features. Notably, our approachdoes not require any program runs in order to discover near-optimal parameter settings. We demonstrate the applicabilityof our approach in enabling code autotuners such as Orio toproduce competitive code variants comparable with empirical-based methods, without the high cost of experiments.
I. INTRODUCTION
Heterogeneous computing poses several challenges to theapplication developer. Identifying which parts of an appli-cation are parallelizable on a SIMD accelerator and writingefficient data parallel code are the most difficult tasks. Forinstance, CUDA programmers must set block and thread sizesfor application kernels, but might not have the intuition tomake a good choice. With NVIDIA GPUs, each streamingmultiprocessor (SM) has a finite number of registers, limitedshared memory, a maximum number of allowed active blocks,and a maximum number of allowed active threads. Variationin block and thread sizes results in different utilization ofthese hardware resources. A small block size may not provideenough warps for the scheduler for full GPU utilization,whereas a large block size may lead to more threads competingfor registers and shared memory.
Writing kernel functions requires setting block and threadsizes, and the difficulty is in deciding which settings willyield the best performance. One procedure entails testing thekernel with block sizes suggested by the CUDA OccupancyCalculator (OCC) [1]. Although the OCC takes into accountthe compute capability (NVIDIA virtual architecture) whencalculating block sizes and thread counts, inaccuracies mayarise because variations in runtime behavior may not be con-sidered, which can potentially result in suboptimal suggestedhardware parameters.
How do variations in runtime behavior arise? Acceleratorarchitectures specialize in executing SIMD in lock-step. When
branches occur, threads that do not satisfy branch conditionsare masked out. If the kernel programmer is unaware of thecode structure or the hardware underneath, it will be difficultfor them to make an effective decision about thread and blockparameters.
CUDA developers face two main challenges, which weaim to alleviate with the approach described in this paper.First, developers must correctly select runtime parametersas discussed above. A developer or user may not have theexpertise to decide on parameter settings that will deliverhigh performance. In this case, one can seek guidance froman optimization advisor. The advisor could consult a perfor-mance model based on static analysis of the kernel properties,or possibly use dynamic analysis to investigate alternativeconfigurations. A second concern is whether the kernel im-plementation is not optimized yet. In this case, advice onparameter settings could still be insufficient because what isreally required is a transformation of the kernel code itself toimprove performance. For both concerns, static and dynamicanalysis techniques are applicable. However, to address thesecond concern, an autotuning framework based on codetransformation is required.
This work presents our static analyzer that can be usedby developers, autotuners, and compilers for heterogeneouscomputing applications. Unlike most existing analysis tech-niques, our approach does not require any program runs todiscover optimal parameter settings. The specific contributionsdescribed in this paper include:
• A static analyzer for CUDA programs.• Predictive modeling based on static data.• Example use cases of the new methodology in an auto-
tuning context.Section II provides background information, while Sec-
tion III defines the methodology of our static analyzer tool.Experimental setup and analysis are elaborated in Section IV;related work is discussed in Section V, and Sections VIand VII present our conclusions and future work plans.
II. BACKGROUND
This section briefly discusses the background for ourresearch contributions, including the CUDA programmingmodel, performance measurement approaches, and autotuning.
arX
iv:1
701.
0854
7v3
[cs
.DC
] 2
9 Ju
n 20
17
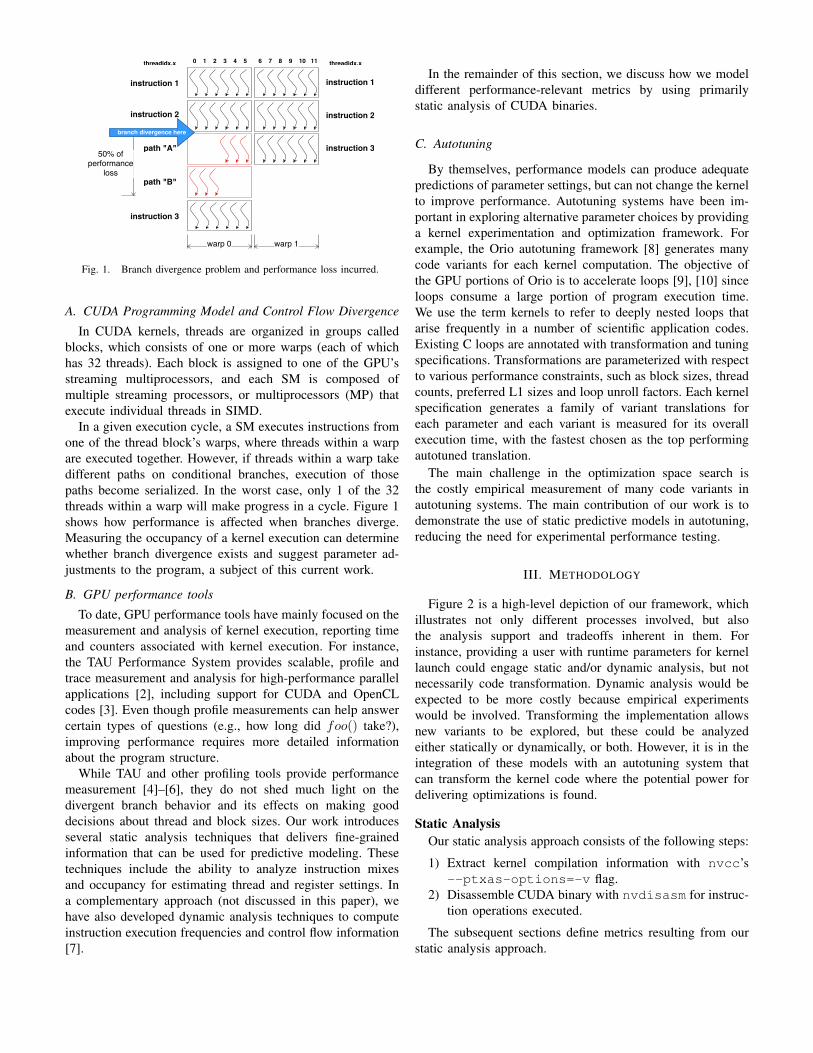
Fig. 1. Branch divergence problem and performance loss incurred.
A. CUDA Programming Model and Control Flow Divergence
In CUDA kernels, threads are organized in groups calledblocks, which consists of one or more warps (each of whichhas 32 threads). Each block is assigned to one of the GPU’sstreaming multiprocessors, and each SM is composed ofmultiple streaming processors, or multiprocessors (MP) thatexecute individual threads in SIMD.
In a given execution cycle, a SM executes instructions fromone of the thread block’s warps, where threads within a warpare executed together. However, if threads within a warp takedifferent paths on conditional branches, execution of thosepaths become serialized. In the worst case, only 1 of the 32threads within a warp will make progress in a cycle. Figure 1shows how performance is affected when branches diverge.Measuring the occupancy of a kernel execution can determinewhether branch divergence exists and suggest parameter ad-justments to the program, a subject of this current work.
B. GPU performance tools
To date, GPU performance tools have mainly focused on themeasurement and analysis of kernel execution, reporting timeand counters associated with kernel execution. For instance,the TAU Performance System provides scalable, profile andtrace measurement and analysis for high-performance parallelapplications [2], including support for CUDA and OpenCLcodes [3]. Even though profile measurements can help answercertain types of questions (e.g., how long did foo() take?),improving performance requires more detailed informationabout the program structure.
While TAU and other profiling tools provide performancemeasurement [4]–[6], they do not shed much light on thedivergent branch behavior and its effects on making gooddecisions about thread and block sizes. Our work introducesseveral static analysis techniques that delivers fine-grainedinformation that can be used for predictive modeling. Thesetechniques include the ability to analyze instruction mixesand occupancy for estimating thread and register settings. Ina complementary approach (not discussed in this paper), wehave also developed dynamic analysis techniques to computeinstruction execution frequencies and control flow information[7].
In the remainder of this section, we discuss how we modeldifferent performance-relevant metrics by using primarilystatic analysis of CUDA binaries.
C. Autotuning
By themselves, performance models can produce adequatepredictions of parameter settings, but can not change the kernelto improve performance. Autotuning systems have been im-portant in exploring alternative parameter choices by providinga kernel experimentation and optimization framework. Forexample, the Orio autotuning framework [8] generates manycode variants for each kernel computation. The objective ofthe GPU portions of Orio is to accelerate loops [9], [10] sinceloops consume a large portion of program execution time.We use the term kernels to refer to deeply nested loops thatarise frequently in a number of scientific application codes.Existing C loops are annotated with transformation and tuningspecifications. Transformations are parameterized with respectto various performance constraints, such as block sizes, threadcounts, preferred L1 sizes and loop unroll factors. Each kernelspecification generates a family of variant translations foreach parameter and each variant is measured for its overallexecution time, with the fastest chosen as the top performingautotuned translation.
The main challenge in the optimization space search isthe costly empirical measurement of many code variants inautotuning systems. The main contribution of our work is todemonstrate the use of static predictive models in autotuning,reducing the need for experimental performance testing.
III. METHODOLOGY
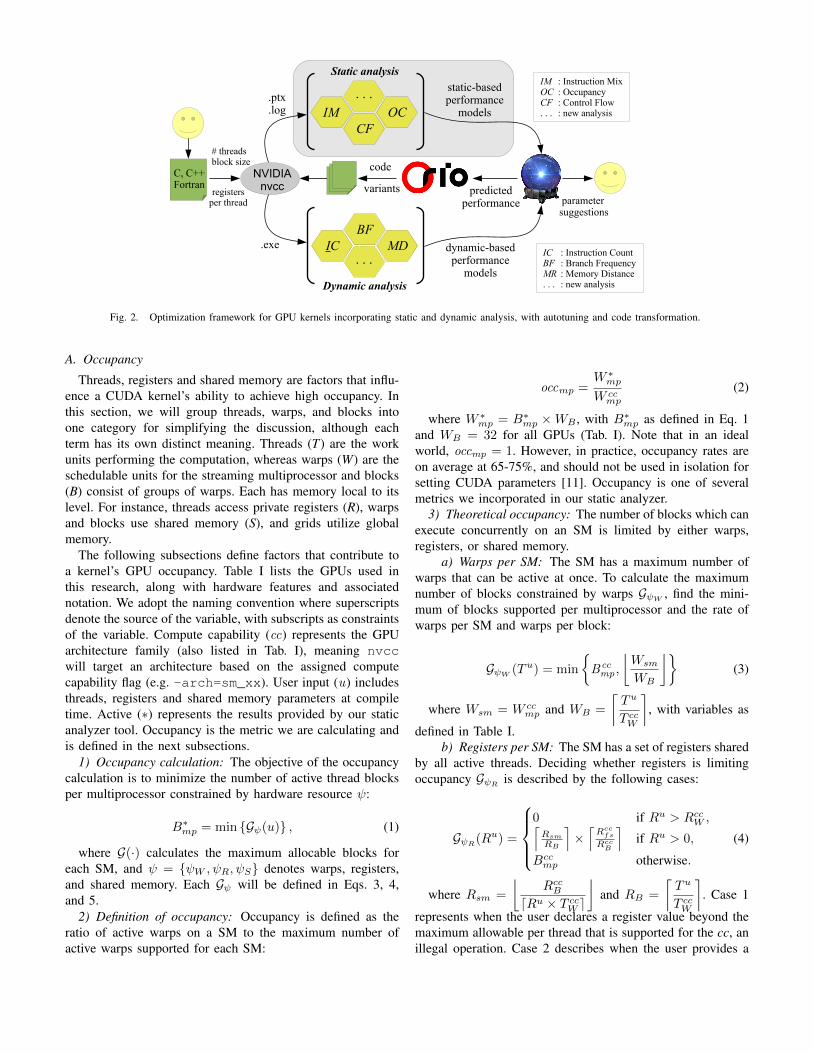
Figure 2 is a high-level depiction of our framework, whichillustrates not only different processes involved, but alsothe analysis support and tradeoffs inherent in them. Forinstance, providing a user with runtime parameters for kernellaunch could engage static and/or dynamic analysis, but notnecessarily code transformation. Dynamic analysis would beexpected to be more costly because empirical experimentswould be involved. Transforming the implementation allowsnew variants to be explored, but these could be analyzedeither statically or dynamically, or both. However, it is in theintegration of these models with an autotuning system thatcan transform the kernel code where the potential power fordelivering optimizations is found.
Static AnalysisOur static analysis approach consists of the following steps:
1) Extract kernel compilation information with nvcc’s--ptxas-options=-v flag.
2) Disassemble CUDA binary with nvdisasm for instruc-tion operations executed.
The subsequent sections define metrics resulting from ourstatic analysis approach.
NVIDIA
nvcc
OC
CF
IM
BF
MDIC.exe
Static analysis
Dynamic analysis
predictedperformance
static-basedperformance
models
dynamic-basedperformance
models
variants
# threadsblock size
parametersuggestions
C, C++Fortran
.ptx
.log
IM : Instruction MixOC : OccupancyCF : Control Flow. . . : new analysis
IC : Instruction CountBF : Branch FrequencyMR : Memory Distance. . . : new analysis
. . .
. . .
code
registersper thread
Fig. 2. Optimization framework for GPU kernels incorporating static and dynamic analysis, with autotuning and code transformation.
A. Occupancy
Threads, registers and shared memory are factors that influ-ence a CUDA kernel’s ability to achieve high occupancy. Inthis section, we will group threads, warps, and blocks intoone category for simplifying the discussion, although eachterm has its own distinct meaning. Threads (T) are the workunits performing the computation, whereas warps (W) are theschedulable units for the streaming multiprocessor and blocks(B) consist of groups of warps. Each has memory local to itslevel. For instance, threads access private registers (R), warpsand blocks use shared memory (S), and grids utilize globalmemory.
The following subsections define factors that contribute toa kernel’s GPU occupancy. Table I lists the GPUs used inthis research, along with hardware features and associatednotation. We adopt the naming convention where superscriptsdenote the source of the variable, with subscripts as constraintsof the variable. Compute capability (cc) represents the GPUarchitecture family (also listed in Tab. I), meaning nvccwill target an architecture based on the assigned computecapability flag (e.g. -arch=sm_xx). User input (u) includesthreads, registers and shared memory parameters at compiletime. Active (∗) represents the results provided by our staticanalyzer tool. Occupancy is the metric we are calculating andis defined in the next subsections.
1) Occupancy calculation: The objective of the occupancycalculation is to minimize the number of active thread blocksper multiprocessor constrained by hardware resource ψ:
B∗mp = min {Gψ(u)} , (1)
where G(·) calculates the maximum allocable blocks foreach SM, and ψ = {ψW , ψR, ψS} denotes warps, registers,and shared memory. Each Gψ will be defined in Eqs. 3, 4,and 5.
2) Definition of occupancy: Occupancy is defined as theratio of active warps on a SM to the maximum number ofactive warps supported for each SM:
occmp =W ∗mp
W ccmp
(2)
where W ∗mp = B∗
mp ×WB , with B∗mp as defined in Eq. 1
and WB = 32 for all GPUs (Tab. I). Note that in an idealworld, occmp = 1. However, in practice, occupancy rates areon average at 65-75%, and should not be used in isolation forsetting CUDA parameters [11]. Occupancy is one of severalmetrics we incorporated in our static analyzer.
3) Theoretical occupancy: The number of blocks which canexecute concurrently on an SM is limited by either warps,registers, or shared memory.
a) Warps per SM: The SM has a maximum number ofwarps that can be active at once. To calculate the maximumnumber of blocks constrained by warps GψW
, find the mini-mum of blocks supported per multiprocessor and the rate ofwarps per SM and warps per block:
GψW(Tu) = min
{Bcc
mp ,
⌊Wsm
WB
⌋}(3)
where Wsm = W ccmp and WB =
⌈Tu
T ccW
⌉, with variables as
defined in Table I.b) Registers per SM: The SM has a set of registers shared
by all active threads. Deciding whether registers is limitingoccupancy GψR
is described by the following cases:
GψR(Ru) =
0 if Ru > RccW ,⌈Rsm
RB
⌉×⌈Rcc
fs
RccB
⌉if Ru > 0,
Bccmp otherwise.
(4)
where Rsm =
⌊RccB
dRu × T ccW e
⌋and RB =
⌈Tu
T ccW
⌉. Case 1
represents when the user declares a register value beyond themaximum allowable per thread that is supported for the cc, anillegal operation. Case 2 describes when the user provides a
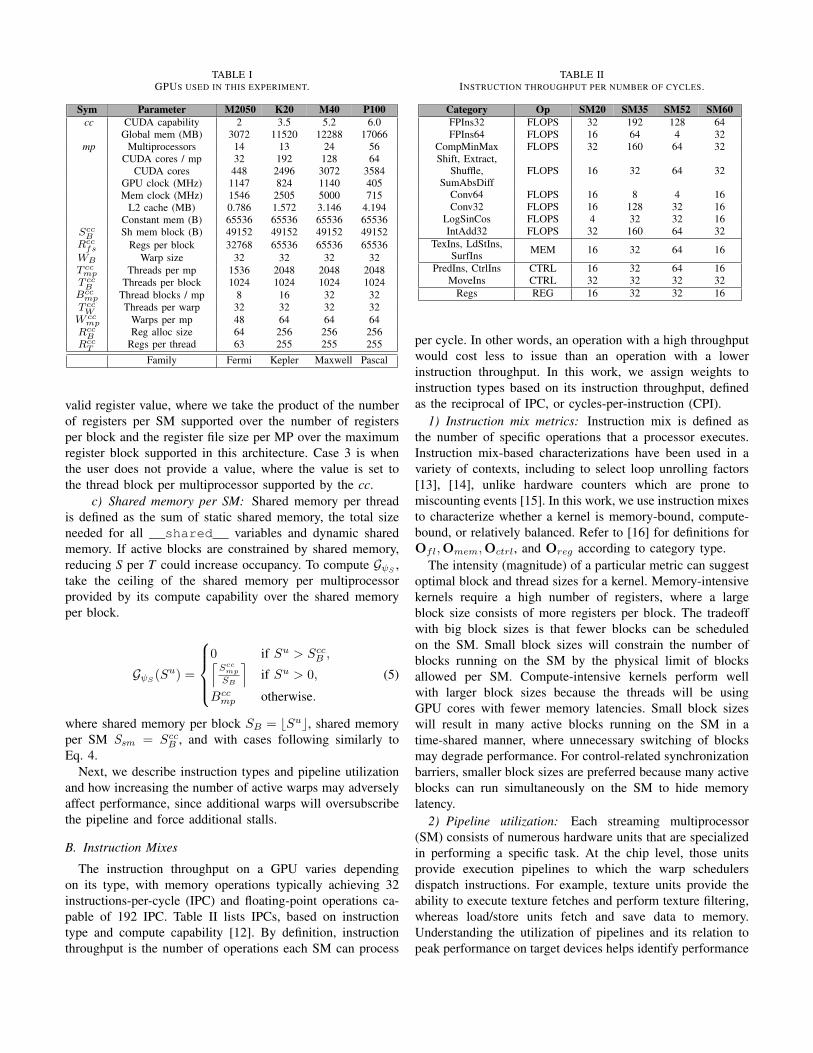
TABLE IGPUS USED IN THIS EXPERIMENT.
Sym Parameter M2050 K20 M40 P100cc CUDA capability 2 3.5 5.2 6.0
Global mem (MB) 3072 11520 12288 17066mp Multiprocessors 14 13 24 56
CUDA cores / mp 32 192 128 64CUDA cores 448 2496 3072 3584
GPU clock (MHz) 1147 824 1140 405Mem clock (MHz) 1546 2505 5000 715
L2 cache (MB) 0.786 1.572 3.146 4.194Constant mem (B) 65536 65536 65536 65536
SccB Sh mem block (B) 49152 49152 49152 49152
Rccfs Regs per block 32768 65536 65536 65536
WB Warp size 32 32 32 32T ccmp Threads per mp 1536 2048 2048 2048T ccB Threads per block 1024 1024 1024 1024
Bccmp Thread blocks / mp 8 16 32 32T ccW Threads per warp 32 32 32 32
W ccmp Warps per mp 48 64 64 64
RccB Reg alloc size 64 256 256 256
RccT Regs per thread 63 255 255 255
Family Fermi Kepler Maxwell Pascal
valid register value, where we take the product of the numberof registers per SM supported over the number of registersper block and the register file size per MP over the maximumregister block supported in this architecture. Case 3 is whenthe user does not provide a value, where the value is set tothe thread block per multiprocessor supported by the cc.
c) Shared memory per SM: Shared memory per threadis defined as the sum of static shared memory, the total sizeneeded for all __shared__ variables and dynamic sharedmemory. If active blocks are constrained by shared memory,reducing S per T could increase occupancy. To compute GψS
,take the ceiling of the shared memory per multiprocessorprovided by its compute capability over the shared memoryper block.
GψS(Su) =
0 if Su > SccB ,⌈Sccmp
SB
⌉if Su > 0,
Bccmp otherwise.
(5)
where shared memory per block SB = bSuc, shared memoryper SM Ssm = SccB , and with cases following similarly toEq. 4.
Next, we describe instruction types and pipeline utilizationand how increasing the number of active warps may adverselyaffect performance, since additional warps will oversubscribethe pipeline and force additional stalls.
B. Instruction Mixes
The instruction throughput on a GPU varies dependingon its type, with memory operations typically achieving 32instructions-per-cycle (IPC) and floating-point operations ca-pable of 192 IPC. Table II lists IPCs, based on instructiontype and compute capability [12]. By definition, instructionthroughput is the number of operations each SM can process
TABLE IIINSTRUCTION THROUGHPUT PER NUMBER OF CYCLES.
Category Op SM20 SM35 SM52 SM60FPIns32 FLOPS 32 192 128 64FPIns64 FLOPS 16 64 4 32
CompMinMax FLOPS 32 160 64 32Shift, Extract,
Shuffle,SumAbsDiff
FLOPS 16 32 64 32
Conv64 FLOPS 16 8 4 16Conv32 FLOPS 16 128 32 16
LogSinCos FLOPS 4 32 32 16IntAdd32 FLOPS 32 160 64 32
TexIns, LdStIns,SurfIns MEM 16 32 64 16
PredIns, CtrlIns CTRL 16 32 64 16MoveIns CTRL 32 32 32 32
Regs REG 16 32 32 16
per cycle. In other words, an operation with a high throughputwould cost less to issue than an operation with a lowerinstruction throughput. In this work, we assign weights toinstruction types based on its instruction throughput, definedas the reciprocal of IPC, or cycles-per-instruction (CPI).
1) Instruction mix metrics: Instruction mix is defined asthe number of specific operations that a processor executes.Instruction mix-based characterizations have been used in avariety of contexts, including to select loop unrolling factors[13], [14], unlike hardware counters which are prone tomiscounting events [15]. In this work, we use instruction mixesto characterize whether a kernel is memory-bound, compute-bound, or relatively balanced. Refer to [16] for definitions forOfl,Omem,Octrl, and Oreg according to category type.
The intensity (magnitude) of a particular metric can suggestoptimal block and thread sizes for a kernel. Memory-intensivekernels require a high number of registers, where a largeblock size consists of more registers per block. The tradeoffwith big block sizes is that fewer blocks can be scheduledon the SM. Small block sizes will constrain the number ofblocks running on the SM by the physical limit of blocksallowed per SM. Compute-intensive kernels perform wellwith larger block sizes because the threads will be usingGPU cores with fewer memory latencies. Small block sizeswill result in many active blocks running on the SM in atime-shared manner, where unnecessary switching of blocksmay degrade performance. For control-related synchronizationbarriers, smaller block sizes are preferred because many activeblocks can run simultaneously on the SM to hide memorylatency.
2) Pipeline utilization: Each streaming multiprocessor(SM) consists of numerous hardware units that are specializedin performing a specific task. At the chip level, those unitsprovide execution pipelines to which the warp schedulersdispatch instructions. For example, texture units provide theability to execute texture fetches and perform texture filtering,whereas load/store units fetch and save data to memory.Understanding the utilization of pipelines and its relation topeak performance on target devices helps identify performance
bottlenecks in terms of oversubscription of pipelines based oninstruction type.
The NVIDIA Kepler GK100 report [12] lists instructionoperations and corresponding pipeline throughputs per cycle.Pipeline utilization describes observed utilization for eachpipeline at runtime. High pipeline utilization would indicatethat the corresponding compute resources were used heavilyand kept busy often during the execution of the kernel.
3) Infer Kernel Execution Time: Because the majority ofCUDA applications are accelerated loops, we hypothesize thatthe execution time of a CUDA program is proportional to theinput problem size N . Hence,
f (N ) = cf ·Ofl + cm ·Omem + cb ·Octrl + cr ·Oreg (6)
where cf , cm, cb, and cr are coefficients that represent thereciprocal of number of instructions that can execute in a cycle,or CPI. Equation 6 represents how a program will perform forinput size N without running the application.
Autotuning Integration
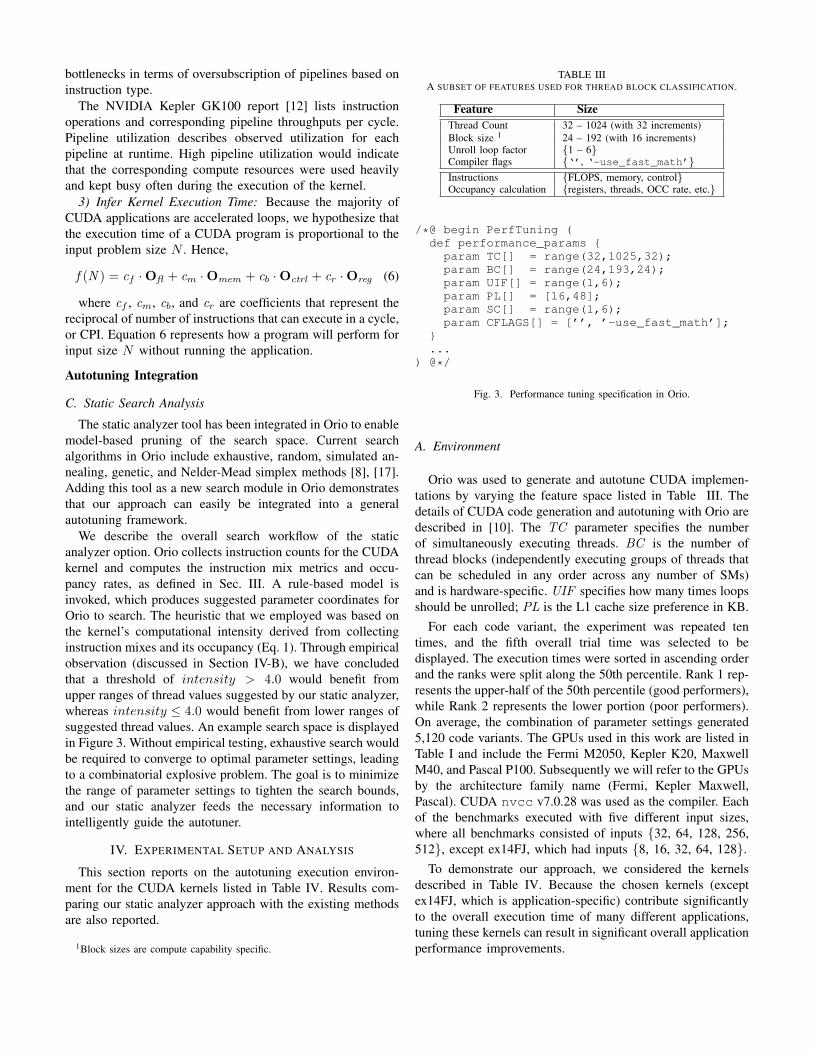
C. Static Search Analysis
The static analyzer tool has been integrated in Orio to enablemodel-based pruning of the search space. Current searchalgorithms in Orio include exhaustive, random, simulated an-nealing, genetic, and Nelder-Mead simplex methods [8], [17].Adding this tool as a new search module in Orio demonstratesthat our approach can easily be integrated into a generalautotuning framework.
We describe the overall search workflow of the staticanalyzer option. Orio collects instruction counts for the CUDAkernel and computes the instruction mix metrics and occu-pancy rates, as defined in Sec. III. A rule-based model isinvoked, which produces suggested parameter coordinates forOrio to search. The heuristic that we employed was based onthe kernel’s computational intensity derived from collectinginstruction mixes and its occupancy (Eq. 1). Through empiricalobservation (discussed in Section IV-B), we have concludedthat a threshold of intensity > 4.0 would benefit fromupper ranges of thread values suggested by our static analyzer,whereas intensity ≤ 4.0 would benefit from lower ranges ofsuggested thread values. An example search space is displayedin Figure 3. Without empirical testing, exhaustive search wouldbe required to converge to optimal parameter settings, leadingto a combinatorial explosive problem. The goal is to minimizethe range of parameter settings to tighten the search bounds,and our static analyzer feeds the necessary information tointelligently guide the autotuner.
IV. EXPERIMENTAL SETUP AND ANALYSIS
This section reports on the autotuning execution environ-ment for the CUDA kernels listed in Table IV. Results com-paring our static analyzer approach with the existing methodsare also reported.
1Block sizes are compute capability specific.
TABLE IIIA SUBSET OF FEATURES USED FOR THREAD BLOCK CLASSIFICATION.
Feature SizeThread Count 32 – 1024 (with 32 increments)Block size 1 24 – 192 (with 16 increments)Unroll loop factor {1 – 6}Compiler flags {‘’, ‘-use_fast_math’}Instructions {FLOPS, memory, control}Occupancy calculation {registers, threads, OCC rate, etc.}
/*@ begin PerfTuning (def performance_params {
param TC[] = range(32,1025,32);param BC[] = range(24,193,24);param UIF[] = range(1,6);param PL[] = [16,48];param SC[] = range(1,6);param CFLAGS[] = [’’, ’-use_fast_math’];
}...
) @*/
Fig. 3. Performance tuning specification in Orio.
A. Environment
Orio was used to generate and autotune CUDA implemen-tations by varying the feature space listed in Table III. Thedetails of CUDA code generation and autotuning with Orio aredescribed in [10]. The TC parameter specifies the numberof simultaneously executing threads. BC is the number ofthread blocks (independently executing groups of threads thatcan be scheduled in any order across any number of SMs)and is hardware-specific. UIF specifies how many times loopsshould be unrolled; PL is the L1 cache size preference in KB.
For each code variant, the experiment was repeated tentimes, and the fifth overall trial time was selected to bedisplayed. The execution times were sorted in ascending orderand the ranks were split along the 50th percentile. Rank 1 rep-resents the upper-half of the 50th percentile (good performers),while Rank 2 represents the lower portion (poor performers).On average, the combination of parameter settings generated5,120 code variants. The GPUs used in this work are listed inTable I and include the Fermi M2050, Kepler K20, MaxwellM40, and Pascal P100. Subsequently we will refer to the GPUsby the architecture family name (Fermi, Kepler Maxwell,Pascal). CUDA nvcc v7.0.28 was used as the compiler. Eachof the benchmarks executed with five different input sizes,where all benchmarks consisted of inputs {32, 64, 128, 256,512}, except ex14FJ, which had inputs {8, 16, 32, 64, 128}.
To demonstrate our approach, we considered the kernelsdescribed in Table IV. Because the chosen kernels (exceptex14FJ, which is application-specific) contribute significantlyto the overall execution time of many different applications,tuning these kernels can result in significant overall applicationperformance improvements.
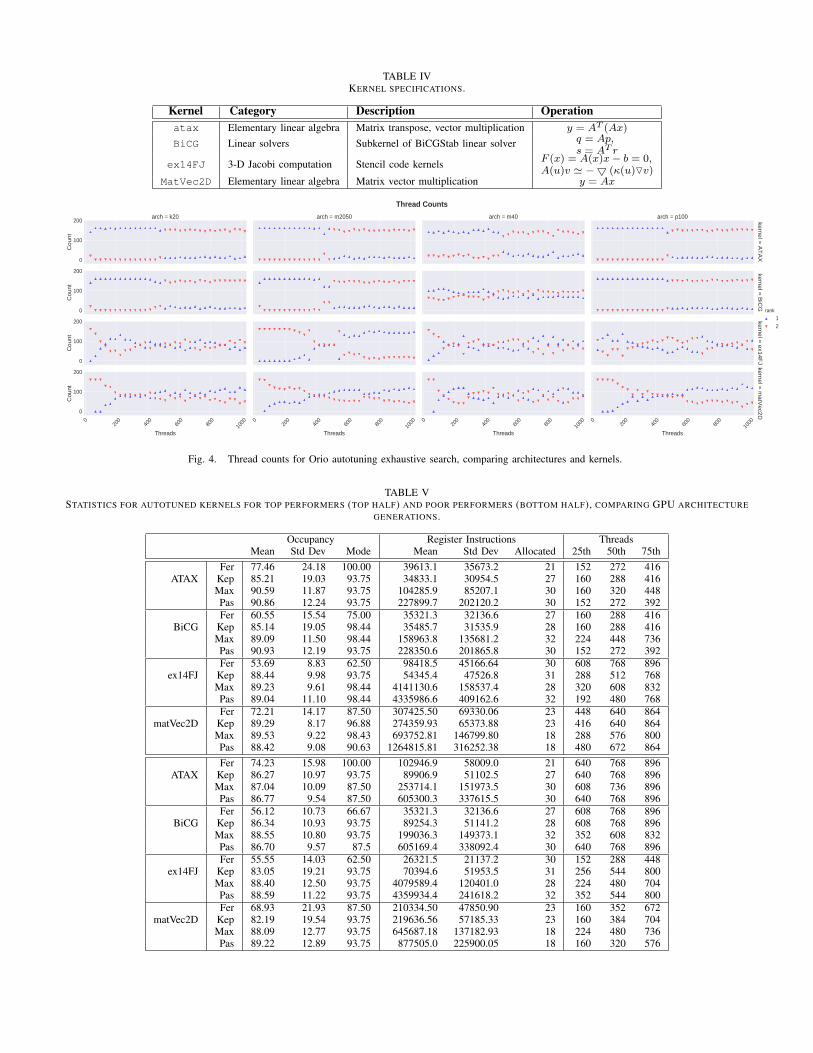
TABLE IVKERNEL SPECIFICATIONS.
Kernel Category Description Operationatax Elementary linear algebra Matrix transpose, vector multiplication y = AT (Ax)
BiCG Linear solvers Subkernel of BiCGStab linear solver q = Ap,s = AT r
ex14FJ 3-D Jacobi computation Stencil code kernels F (x) = A(x)x− b = 0,A(u)v ' −5 (κ(u)Ov)
MatVec2D Elementary linear algebra Matrix vector multiplication y = Ax
0
100
200
Cou
nt
arch = k20 arch = m2050 arch = m40
kernel = A
TA
Xkernel =
AT
AX
arch = p100
0
100
200
Cou
nt
kernel = B
iCG
kernel = B
iCG
0
100
200
Cou
nt
kernel = ex14F
Jkernel =
ex14FJ
020
040
060
080
010
00
Threads
0
100
200
Cou
nt
020
040
060
080
010
00
Threads
020
040
060
080
010
00
Threads
020
040
060
080
010
00
Threads
kernel = m
atVec2D
kernel = m
atVec2D
Thread Counts
rank
12
Fig. 4. Thread counts for Orio autotuning exhaustive search, comparing architectures and kernels.
TABLE VSTATISTICS FOR AUTOTUNED KERNELS FOR TOP PERFORMERS (TOP HALF) AND POOR PERFORMERS (BOTTOM HALF), COMPARING GPU ARCHITECTURE
GENERATIONS.
Occupancy Register Instructions ThreadsMean Std Dev Mode Mean Std Dev Allocated 25th 50th 75th
Fer 77.46 24.18 100.00 39613.1 35673.2 21 152 272 416ATAX Kep 85.21 19.03 93.75 34833.1 30954.5 27 160 288 416
Max 90.59 11.87 93.75 104285.9 85207.1 30 160 320 448Pas 90.86 12.24 93.75 227899.7 202120.2 30 152 272 392Fer 60.55 15.54 75.00 35321.3 32136.6 27 160 288 416
BiCG Kep 85.14 19.05 98.44 35485.7 31535.9 28 160 288 416Max 89.09 11.50 98.44 158963.8 135681.2 32 224 448 736Pas 90.93 12.19 93.75 228350.6 201865.8 30 152 272 392Fer 53.69 8.83 62.50 98418.5 45166.64 30 608 768 896
ex14FJ Kep 88.44 9.98 93.75 54345.4 47526.8 31 288 512 768Max 89.23 9.61 98.44 4141130.6 158537.4 28 320 608 832Pas 89.04 11.10 98.44 4335986.6 409162.6 32 192 480 768Fer 72.21 14.17 87.50 307425.50 69330.06 23 448 640 864
matVec2D Kep 89.29 8.17 96.88 274359.93 65373.88 23 416 640 864Max 89.53 9.22 98.43 693752.81 146799.80 18 288 576 800Pas 88.42 9.08 90.63 1264815.81 316252.38 18 480 672 864Fer 74.23 15.98 100.00 102946.9 58009.0 21 640 768 896
ATAX Kep 86.27 10.97 93.75 89906.9 51102.5 27 640 768 896Max 87.04 10.09 87.50 253714.1 151973.5 30 608 736 896Pas 86.77 9.54 87.50 605300.3 337615.5 30 640 768 896Fer 56.12 10.73 66.67 35321.3 32136.6 27 608 768 896
BiCG Kep 86.34 10.93 93.75 89254.3 51141.2 28 608 768 896Max 88.55 10.80 93.75 199036.3 149373.1 32 352 608 832Pas 86.70 9.57 87.5 605169.4 338092.4 30 640 768 896Fer 55.55 14.03 62.50 26321.5 21137.2 30 152 288 448
ex14FJ Kep 83.05 19.21 93.75 70394.6 51953.5 31 256 544 800Max 88.40 12.50 93.75 4079589.4 120401.0 28 224 480 704Pas 88.59 11.22 93.75 4359934.4 241618.2 32 352 544 800Fer 68.93 21.93 87.50 210334.50 47850.90 23 160 352 672
matVec2D Kep 82.19 19.54 93.75 219636.56 57185.33 23 160 384 704Max 88.09 12.77 93.75 645687.18 137182.93 18 224 480 736Pas 89.22 12.89 93.75 877505.0 225900.05 18 160 320 576
0.025
0.000
0.025M
AE
kernel = AT
AX
0.0
0.1
0.2
MA
E
kernel = matV
ec2D
0.025
0.000
0.025
MA
E
kernel = BiC
G
Order
0.975
1.000
1.025
MA
E
kernel = ex14FJ
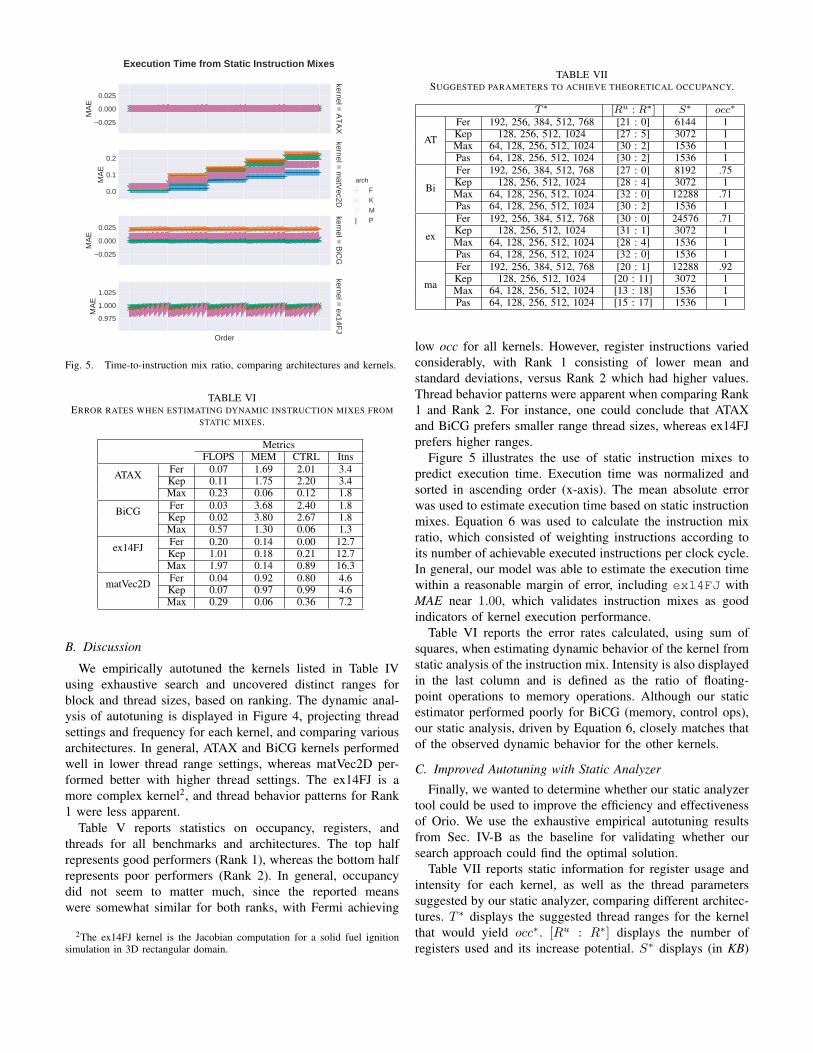
Execution Time from Static Instruction Mixes
arch
FKMP
Fig. 5. Time-to-instruction mix ratio, comparing architectures and kernels.
TABLE VIERROR RATES WHEN ESTIMATING DYNAMIC INSTRUCTION MIXES FROM
STATIC MIXES.
MetricsFLOPS MEM CTRL Itns
ATAX Fer 0.07 1.69 2.01 3.4Kep 0.11 1.75 2.20 3.4Max 0.23 0.06 0.12 1.8
BiCG Fer 0.03 3.68 2.40 1.8Kep 0.02 3.80 2.67 1.8Max 0.57 1.30 0.06 1.3
ex14FJ Fer 0.20 0.14 0.00 12.7Kep 1.01 0.18 0.21 12.7Max 1.97 0.14 0.89 16.3
matVec2D Fer 0.04 0.92 0.80 4.6Kep 0.07 0.97 0.99 4.6Max 0.29 0.06 0.36 7.2
B. Discussion
We empirically autotuned the kernels listed in Table IVusing exhaustive search and uncovered distinct ranges forblock and thread sizes, based on ranking. The dynamic anal-ysis of autotuning is displayed in Figure 4, projecting threadsettings and frequency for each kernel, and comparing variousarchitectures. In general, ATAX and BiCG kernels performedwell in lower thread range settings, whereas matVec2D per-formed better with higher thread settings. The ex14FJ is amore complex kernel2, and thread behavior patterns for Rank1 were less apparent.
Table V reports statistics on occupancy, registers, andthreads for all benchmarks and architectures. The top halfrepresents good performers (Rank 1), whereas the bottom halfrepresents poor performers (Rank 2). In general, occupancydid not seem to matter much, since the reported meanswere somewhat similar for both ranks, with Fermi achieving
2The ex14FJ kernel is the Jacobian computation for a solid fuel ignitionsimulation in 3D rectangular domain.
TABLE VIISUGGESTED PARAMETERS TO ACHIEVE THEORETICAL OCCUPANCY.
T ∗ [Ru : R∗] S∗ occ∗
AT
Fer 192, 256, 384, 512, 768 [21 : 0] 6144 1Kep 128, 256, 512, 1024 [27 : 5] 3072 1Max 64, 128, 256, 512, 1024 [30 : 2] 1536 1Pas 64, 128, 256, 512, 1024 [30 : 2] 1536 1
Bi
Fer 192, 256, 384, 512, 768 [27 : 0] 8192 .75Kep 128, 256, 512, 1024 [28 : 4] 3072 1Max 64, 128, 256, 512, 1024 [32 : 0] 12288 .71Pas 64, 128, 256, 512, 1024 [30 : 2] 1536 1
ex
Fer 192, 256, 384, 512, 768 [30 : 0] 24576 .71Kep 128, 256, 512, 1024 [31 : 1] 3072 1Max 64, 128, 256, 512, 1024 [28 : 4] 1536 1Pas 64, 128, 256, 512, 1024 [32 : 0] 1536 1
ma
Fer 192, 256, 384, 512, 768 [20 : 1] 12288 .92Kep 128, 256, 512, 1024 [20 : 11] 3072 1Max 64, 128, 256, 512, 1024 [13 : 18] 1536 1Pas 64, 128, 256, 512, 1024 [15 : 17] 1536 1
low occ for all kernels. However, register instructions variedconsiderably, with Rank 1 consisting of lower mean andstandard deviations, versus Rank 2 which had higher values.Thread behavior patterns were apparent when comparing Rank1 and Rank 2. For instance, one could conclude that ATAXand BiCG prefers smaller range thread sizes, whereas ex14FJprefers higher ranges.
Figure 5 illustrates the use of static instruction mixes topredict execution time. Execution time was normalized andsorted in ascending order (x-axis). The mean absolute errorwas used to estimate execution time based on static instructionmixes. Equation 6 was used to calculate the instruction mixratio, which consisted of weighting instructions according toits number of achievable executed instructions per clock cycle.In general, our model was able to estimate the execution timewithin a reasonable margin of error, including ex14FJ withMAE near 1.00, which validates instruction mixes as goodindicators of kernel execution performance.
Table VI reports the error rates calculated, using sum ofsquares, when estimating dynamic behavior of the kernel fromstatic analysis of the instruction mix. Intensity is also displayedin the last column and is defined as the ratio of floating-point operations to memory operations. Although our staticestimator performed poorly for BiCG (memory, control ops),our static analysis, driven by Equation 6, closely matches thatof the observed dynamic behavior for the other kernels.
C. Improved Autotuning with Static Analyzer
Finally, we wanted to determine whether our static analyzertool could be used to improve the efficiency and effectivenessof Orio. We use the exhaustive empirical autotuning resultsfrom Sec. IV-B as the baseline for validating whether oursearch approach could find the optimal solution.
Table VII reports static information for register usage andintensity for each kernel, as well as the thread parameterssuggested by our static analyzer, comparing different architec-tures. T ∗ displays the suggested thread ranges for the kernelthat would yield occ∗. [Ru : R∗] displays the number ofregisters used and its increase potential. S∗ displays (in KB)
Static RB0.0
0.2
0.4
0.6
0.8
Impr
ovem
ent (
%)
ATAX
Static RB
BiCG
Static RB
ex14FJ
Static RB
matVec2D
m2050k20m40p100
Fig. 6. Improved search time over exhaustive autotuning, comparing static and rule-based approaches.
the amount of shared memory that could be increased toachieve theoretical occupancy.
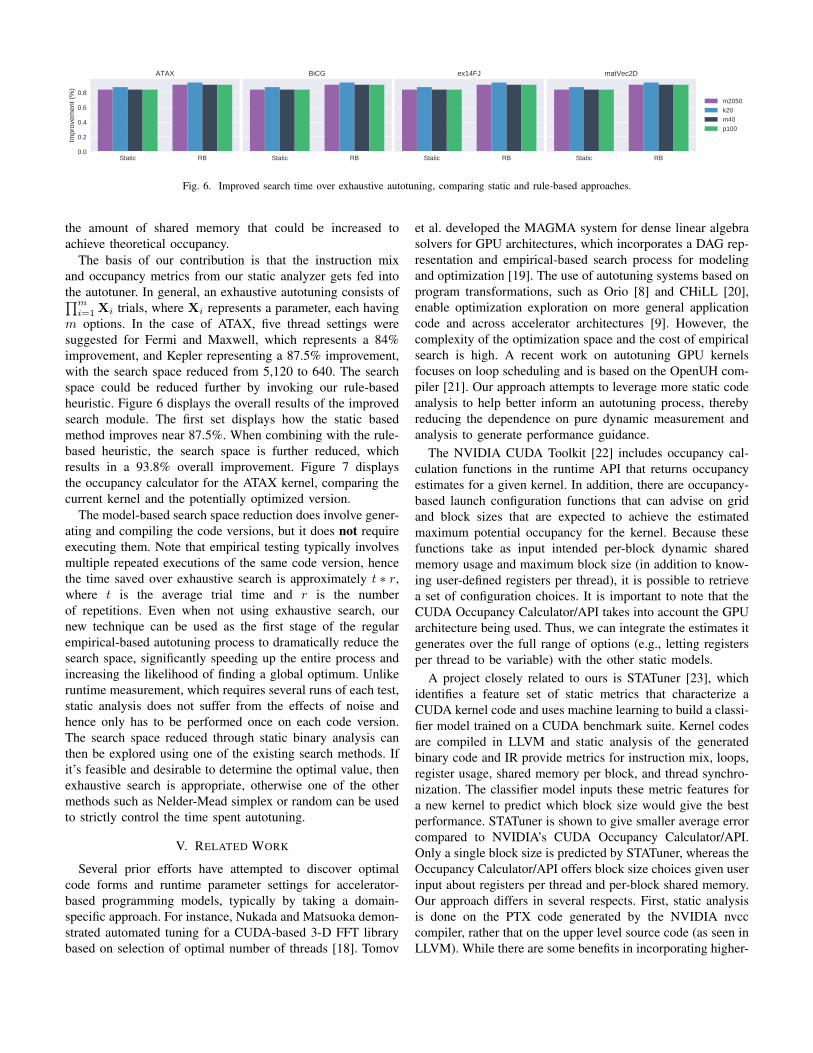
The basis of our contribution is that the instruction mixand occupancy metrics from our static analyzer gets fed intothe autotuner. In general, an exhaustive autotuning consists of∏mi=1 Xi trials, where Xi represents a parameter, each having
m options. In the case of ATAX, five thread settings weresuggested for Fermi and Maxwell, which represents a 84%improvement, and Kepler representing a 87.5% improvement,with the search space reduced from 5,120 to 640. The searchspace could be reduced further by invoking our rule-basedheuristic. Figure 6 displays the overall results of the improvedsearch module. The first set displays how the static basedmethod improves near 87.5%. When combining with the rule-based heuristic, the search space is further reduced, whichresults in a 93.8% overall improvement. Figure 7 displaysthe occupancy calculator for the ATAX kernel, comparing thecurrent kernel and the potentially optimized version.
The model-based search space reduction does involve gener-ating and compiling the code versions, but it does not requireexecuting them. Note that empirical testing typically involvesmultiple repeated executions of the same code version, hencethe time saved over exhaustive search is approximately t ∗ r,where t is the average trial time and r is the numberof repetitions. Even when not using exhaustive search, ournew technique can be used as the first stage of the regularempirical-based autotuning process to dramatically reduce thesearch space, significantly speeding up the entire process andincreasing the likelihood of finding a global optimum. Unlikeruntime measurement, which requires several runs of each test,static analysis does not suffer from the effects of noise andhence only has to be performed once on each code version.The search space reduced through static binary analysis canthen be explored using one of the existing search methods. Ifit’s feasible and desirable to determine the optimal value, thenexhaustive search is appropriate, otherwise one of the othermethods such as Nelder-Mead simplex or random can be usedto strictly control the time spent autotuning.
V. RELATED WORK
Several prior efforts have attempted to discover optimalcode forms and runtime parameter settings for accelerator-based programming models, typically by taking a domain-specific approach. For instance, Nukada and Matsuoka demon-strated automated tuning for a CUDA-based 3-D FFT librarybased on selection of optimal number of threads [18]. Tomov
et al. developed the MAGMA system for dense linear algebrasolvers for GPU architectures, which incorporates a DAG rep-resentation and empirical-based search process for modelingand optimization [19]. The use of autotuning systems based onprogram transformations, such as Orio [8] and CHiLL [20],enable optimization exploration on more general applicationcode and across accelerator architectures [9]. However, thecomplexity of the optimization space and the cost of empiricalsearch is high. A recent work on autotuning GPU kernelsfocuses on loop scheduling and is based on the OpenUH com-piler [21]. Our approach attempts to leverage more static codeanalysis to help better inform an autotuning process, therebyreducing the dependence on pure dynamic measurement andanalysis to generate performance guidance.
The NVIDIA CUDA Toolkit [22] includes occupancy cal-culation functions in the runtime API that returns occupancyestimates for a given kernel. In addition, there are occupancy-based launch configuration functions that can advise on gridand block sizes that are expected to achieve the estimatedmaximum potential occupancy for the kernel. Because thesefunctions take as input intended per-block dynamic sharedmemory usage and maximum block size (in addition to know-ing user-defined registers per thread), it is possible to retrievea set of configuration choices. It is important to note that theCUDA Occupancy Calculator/API takes into account the GPUarchitecture being used. Thus, we can integrate the estimates itgenerates over the full range of options (e.g., letting registersper thread to be variable) with the other static models.
A project closely related to ours is STATuner [23], whichidentifies a feature set of static metrics that characterize aCUDA kernel code and uses machine learning to build a classi-fier model trained on a CUDA benchmark suite. Kernel codesare compiled in LLVM and static analysis of the generatedbinary code and IR provide metrics for instruction mix, loops,register usage, shared memory per block, and thread synchro-nization. The classifier model inputs these metric features fora new kernel to predict which block size would give the bestperformance. STATuner is shown to give smaller average errorcompared to NVIDIA’s CUDA Occupancy Calculator/API.Only a single block size is predicted by STATuner, whereas theOccupancy Calculator/API offers block size choices given userinput about registers per thread and per-block shared memory.Our approach differs in several respects. First, static analysisis done on the PTX code generated by the NVIDIA nvcccompiler, rather that on the upper level source code (as seen inLLVM). While there are some benefits in incorporating higher-
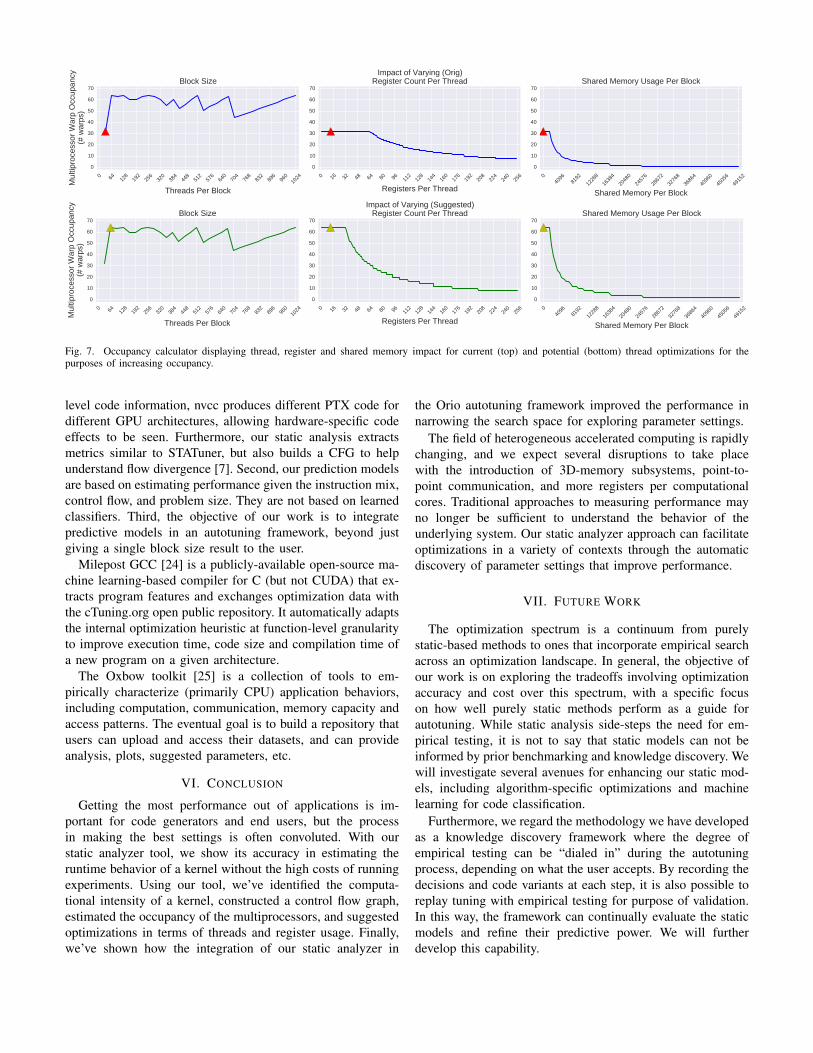
Fig. 7. Occupancy calculator displaying thread, register and shared memory impact for current (top) and potential (bottom) thread optimizations for thepurposes of increasing occupancy.
level code information, nvcc produces different PTX code fordifferent GPU architectures, allowing hardware-specific codeeffects to be seen. Furthermore, our static analysis extractsmetrics similar to STATuner, but also builds a CFG to helpunderstand flow divergence [7]. Second, our prediction modelsare based on estimating performance given the instruction mix,control flow, and problem size. They are not based on learnedclassifiers. Third, the objective of our work is to integratepredictive models in an autotuning framework, beyond justgiving a single block size result to the user.
Milepost GCC [24] is a publicly-available open-source ma-chine learning-based compiler for C (but not CUDA) that ex-tracts program features and exchanges optimization data withthe cTuning.org open public repository. It automatically adaptsthe internal optimization heuristic at function-level granularityto improve execution time, code size and compilation time ofa new program on a given architecture.
The Oxbow toolkit [25] is a collection of tools to em-pirically characterize (primarily CPU) application behaviors,including computation, communication, memory capacity andaccess patterns. The eventual goal is to build a repository thatusers can upload and access their datasets, and can provideanalysis, plots, suggested parameters, etc.
VI. CONCLUSION
Getting the most performance out of applications is im-portant for code generators and end users, but the processin making the best settings is often convoluted. With ourstatic analyzer tool, we show its accuracy in estimating theruntime behavior of a kernel without the high costs of runningexperiments. Using our tool, we’ve identified the computa-tional intensity of a kernel, constructed a control flow graph,estimated the occupancy of the multiprocessors, and suggestedoptimizations in terms of threads and register usage. Finally,we’ve shown how the integration of our static analyzer in
the Orio autotuning framework improved the performance innarrowing the search space for exploring parameter settings.
The field of heterogeneous accelerated computing is rapidlychanging, and we expect several disruptions to take placewith the introduction of 3D-memory subsystems, point-to-point communication, and more registers per computationalcores. Traditional approaches to measuring performance mayno longer be sufficient to understand the behavior of theunderlying system. Our static analyzer approach can facilitateoptimizations in a variety of contexts through the automaticdiscovery of parameter settings that improve performance.
VII. FUTURE WORK
The optimization spectrum is a continuum from purelystatic-based methods to ones that incorporate empirical searchacross an optimization landscape. In general, the objective ofour work is on exploring the tradeoffs involving optimizationaccuracy and cost over this spectrum, with a specific focuson how well purely static methods perform as a guide forautotuning. While static analysis side-steps the need for em-pirical testing, it is not to say that static models can not beinformed by prior benchmarking and knowledge discovery. Wewill investigate several avenues for enhancing our static mod-els, including algorithm-specific optimizations and machinelearning for code classification.
Furthermore, we regard the methodology we have developedas a knowledge discovery framework where the degree ofempirical testing can be “dialed in” during the autotuningprocess, depending on what the user accepts. By recording thedecisions and code variants at each step, it is also possible toreplay tuning with empirical testing for purpose of validation.In this way, the framework can continually evaluate the staticmodels and refine their predictive power. We will furtherdevelop this capability.
While our static analysis tools will working with any CUDAkernel code, the real power of our approach is in the ability totransform the code in Orio. However, this requires the sourceto be in a particular input form. We are exploring sourceanalysis technology [26] to translate kernel code to the inputrequired by Orio, thereby allowing any kernel to be a candidatefor CUDA autotuning.
ACKNOWLEDGMENT
We want to thank the anonymous reviewers for the insightfulcomments. We also want to thank NVIDIA for providing earlyaccess to CUDA 7.5 and to the PSG clusters. This workis supported by American Society of Engineering Education(ASEE) and Department of Energy (Award #de-sc0005360)for the project “Vancouver 2: Improving Programmability ofContemporary Heterogeneous Architectures.”
REFERENCES
[1] “CUDA occupancy calculator,” http://developer.download.nvidia.com/compute/cuda/CUDA Occupancy calculator.xls, 2016.
[2] S. S. Shende and A. D. Malony, “The TAU parallel performance system,”International Journal of High Performance Computing Applications,vol. 20, no. 2, pp. 287–311, 2006.
[3] A. D. Malony, S. Biersdorff, S. Shende, H. Jagode, S. Tomov, G. Juck-eland, R. Dietrich, D. Poole, and C. Lamb, “Parallel performancemeasurement of heterogeneous parallel systems with GPUs,” in 2011International Conference on Parallel Processing, 2011, pp. 176–185.
[4] “Allinea DDT,” http://www.allinea.com/products/ddt.[5] “Nvidia Visual Profiler,” https://developer.nvidia.com/nvidia-visual-
profiler.[6] L. Adhianto, S. Banerjee, M. Fagan, M. Krentel, G. Marin, J. Mellor-
Crummey, and N. R. Tallent, “Hpctoolkit: Tools for performance anal-ysis of optimized parallel programs,” Concurrency and Computation:Practice and Experience, vol. 22, no. 6, pp. 685–701, 2010.
[7] R. Lim, B. Norris, and A. Malony, “Tuning heterogeneous computingarchitectures through integrated performance tools,” in GPU TechnologyConference, 2016, p. poster.
[8] A. Hartono, B. Norris, and P. Sadayappan, “Annotation-based empiricalperformance tuning using Orio,” in Parallel & Distributed Processing,2009. IEEE International Symposium on. IEEE, 2009, pp. 1–11.
[9] N. Chaimov, B. Norris, and A. Malony, “Toward multi-target autotuningfor accelerators,” in Parallel and Distributed Systems (ICPADS), 201420th IEEE International Conference on, Dec 2014, pp. 534–541.
[10] A. Mametjanov, D. Lowell, C.-C. C.C. Ma, and B. Norris, “Autotuningstencil-based computations on GPUs,” in Cluster Computing (CLUS-TER), 2012 IEEE International Conference on, 2012, pp. 266–274.
[11] V. Volkov, “Better performance at lower occupancy,” 2010.[12] “NVIDIA GeForce GTX 680 Whitepaper,” Tech. Rep., 2012, http://bit.
ly/2jzzX13.[13] A. Monsifrot, F. Bodin, and R. Quiniou, “A machine learning approach
to automatic production of compiler heuristics,” in Artificial Intelligence:Methodology, Systems, and Applications. Springer, 2002, pp. 41–50.
[14] M. Stephenson and S. Amarasinghe, “Predicting unroll factors usingsupervised classification,” in Code Generation and Optimization, 2005.CGO 2005. International Symposium on. IEEE, 2005, pp. 123–134.
[15] R. Lim, D. Carrillo-Cisneros, W. Alkowaileet, and I. Scherson, “Com-putationally efficient multiplexing of events on hardware counters,” inLinux Symposium, 2014.
[16] R. Lim, A. Malony, B. Norris, and N. Chaimov, “Identifying optimiza-tion opportunities within kernel execution in GPU codes,” in Euro-Par2015: Parallel Processing Workshops. Springer, 2015.
[17] B. Norris, A. Hartono, and W. Gropp, “Annotations for productivityand performance portability,” in Petascale Computing: Algorithmsand Applications, ser. Computational Science. Chapman & Hall /CRC Press, Taylor and Francis Group, 2007, pp. 443–462, preprintANL/MCS-P1392-0107. [Online]. Available: http://www.mcs.anl.gov/uploads/cels/papers/P1392.pdf
[18] A. Nukada and S. Matsuoka, “Auto-tuning 3-D FFT library for CUDAGPUs,” in Supercomputing Conference (SC 2009), 2015.
[19] S. Tomov, R. Nath, H. Ltaief, and J. Dongarra, “Dense linear algebrasolvers for multicore with GPU accelerators,” in International Paralleland Distributed Processing Symposium (IPDPS 2010), Jan. 2010.
[20] “CHiLL: A Framework for Composing High-Level Loop Transforma-tions,” USC Department of Computer Science, Tech. Rep., Jun. 2008.
[21] R. Xu, S. Chandrasekaran, X. Tian, and B. Chapman, “An analyticalmodel-based auto-tuning framework for locality-aware loop scheduling,”in International Conference on High Performance Computing. Springer,2016, pp. 3–20.
[22] NVIDIA, “CUDA Toolkit,” https://developer.nvidia.com/cuda-toolkit.[23] R. Gupta, I. Laguna, D. Ahn, T. Gamblin, S. Bagchi, and F. Lin,
“STATuner: Efficient Tuning of CUDA Kernels Parameters,” in Super-computing Conference (SC 2015), 2015, p. poster.
[24] G. e. Fursin, “Milepost gcc: Machine learning enabled self-tuningcompiler,” International journal of parallel programming, vol. 39, no. 3,pp. 296–327, 2011.
[25] S. Sreepathi, M. Grodowitz, R. Lim, P. Taffet, P. C. Roth, J. Meredith,S. Lee, D. Li, and J. Vetter, “Application characterization using Oxbowtoolkit and PADS infrastructure,” in Proceedings of the 1st InternationalWorkshop on Hardware-Software Co-Design for High PerformanceComputing. IEEE Press, 2014, pp. 55–63.
[26] P. de Oliveira Castro, C. Akel, E. Petit, M. Popov, and W. Jalby,“CERE: LLVM Based Codelet Extractor and REplayer for PiecewiseBenchmarking and Optimization,” ACM Transactions on Architectureand Code Optimization (TACO), vol. 12, no. 1, p. 6, 2015.

![GPU Kernels for Block-Sparse Weights · block-sparse convolution kernel. Both are wrapped in Tensorflow [Abadi et al., 2016] ops for easy use and the kernels are straightforward](https://img.pdfslide.us/doc/110x75/605afdd995348353e46df7dd/gpu-kernels-for-block-sparse-weights-block-sparse-convolution-kernel-both-are-wrapped.jpg)