Embed Size (px)
Citation preview
Autothermal Oxidative Pyrolysisof Biomass Feedstocks over NobleMetal Catalysts to Liquid Products
A dissertation submitted to the faculty of the
Graduate School of the University of Minnesota
by
Christine Marie Balonek
In partial fulfillment of the requirements for the
degree of Doctor of Philosophy.
Advisor: Lanny D. Schmidt
July, 2011
All rights reserved
INFORMATION TO ALL USERSThe quality of this reproduction is dependent on the quality of the copy submitted.
In the unlikely event that the author did not send a complete manuscriptand there are missing pages, these will be noted. Also, if material had to be removed,
a note will indicate the deletion.
All rights reserved. This edition of the work is protected againstunauthorized copying under Title 17, United States Code.
ProQuest LLC.789 East Eisenhower Parkway
P.O. Box 1346Ann Arbor, MI 48106 - 1346
UMI 3474720
Copyright 2011 by ProQuest LLC.
UMI Number: 3474720

c© Christine Marine Balonek 2011All Rights Reserved
ACKNOWLEDGMENTS
Thank you to my advisor, Professor Lanny Schmidt, for his guidance and advice
during my graduate career. Thank you to the entire Schmidt Group for help and
discussions, both academic and non-academic. To my family and friends who have
always been a source of support and inspiration, thank you.
i
ABSTRACT
Two thermal processing technologies have emerged for processing biomass into re-
newable liquid products: pyrolysis and gasification/Fischer-Tropsch processing. The
work presented here will demonstrate oxidative pyrolysis of biomass as an alternative
process to avoid the intrinsic disadvantages of traditional pyrolysis. Additionally,
work has been conducted to examine the processing of biomass derived synthesis gas
to condensable products, which involves mitigating new challenges when compared
with the processing of conventional coal-based feedstocks during gasification/Fischer-
Tropsch.
The research group of Professor Lanny D. Schmidt has pioneered autothermal
partial oxidation of a variety of gas and liquid feedstocks on noble metal catalysts to
synthesis gas with high selectivity, char-free operation, and on millisecond timescales
at temperatures of 600 - 1000 ◦C. More recently, cellulose has been shown to de-
compose on the catalyst surface to also produce high selectivities to synthesis gas.
Chapter 2 discusses the discovery of an intermediate liquid phase during the autother-
mal processing of cellulose particles over rhodium-based catalysts. Volatilization of
300 µm cellulose particles on a 700 ◦C catalytic surface were filmed using a high
speed camera capable of 1000 frames per second. The cellulose particles decomposed
through an intermediate liquid, which boiled to gaseous species that convected into
the catalyst bed. The high heat transfer rates made possible by the intimate contact
of the boiling liquid and the hot surface allowed rapid reactions without leaving char
residues. This unique insight allows new processes to be designed that exploit this
type of cellulose thermal decomposition.
Experiments were conducted to investigate the extension of catalytic partial oxida-
tion over noble metal catalysts to convert biomass to liquid pyrolysis products, termed
‘oxidative pyrolysis’. Model compounds were chosen to represent the lignin fraction
of lignocellulosic biomass to more easily and accurately study the proposed system.
Chapter 3 discusses the autothermal oxidative pyrolysis of monoaromatics over noble
metal catalysts. Benzene, toluene, ethylbenzene, cumene, and styrene were indepen-
ii
iii
dently studied over five noble metal-based catalysts (Pt, Rh, Rh/γ-Al2O3, Rh-Ce,
and Rh-Ce/γ-Al2O3) while varying the carbon-to-oxygen feed ratio. Aromatic rings
were observed to be very stable in the reactor system, while homogeneous reactions
of the alkyl groups of ethylbenzene and cumene were prevalent.
Chapter 4 addresses the oxidative pyrolysis of microcrystalline cellulose particles
as a model for lignocellulosic biomass to yield liquid products. Cellulose was demon-
strated to autothermally convert to combustion, partial oxidation, and pyrolysis prod-
ucts without char formation. The effects of support geometry, catalyst metal, and
hydrogen addition on product selectivities were studied. Platinum-coated alumina
spheres maximized the yield of pyrolysis products by favoring combustion chemistry
and minimizing reforming activities, as compared with rhodium-based catalysts. Up
to 60 % carbon selectivity to pyrolysis products could be achieved on a Pt catalyst
with hydrogen addition.
As mentioned, previous research in the Schmidt group has shown high selectivities
to synthesis gas by autothermal reforming of cellulose particles. However, utilizing
this biomass-derived syngas, as opposed to traditional coal-based syngas, is not well
studied. Biomass-derived synthesis gas presents a new set of inorganic impurities that
may affect catalyst performance during Fischer-Tropsch processing. Small quantities
(ppm) of typical biomass inorganics (Na, K, Li, and Ca) were loaded onto γ-Al2O3-
supported Co-Re powder catalysts to study the effect on product selectivities (Chap-
ter 5). The inorganic impurities were found to affect the reduction of Co and increase
CO2 and C5+ selectivities, which were largely attributed to electronic effects.
Chapter 6 proposes future research utilizing gas chromatography and mass spec-
trometry to identify and quantify specific components within liquid pyrolysis prod-
ucts, generally termed ‘pyrolysis oil’. This work will build on the research presented in
Chapter 4: the demonstration of oxidative pyrolysis of cellulose to produce up to 50 %
carbon selectivity to pyrolysis products. Further characterization of the pyrolysis oil
will involve pH and water fraction measurements. Preliminary work shows the pres-
ence of several acids, alcohols, phenols, pyrans, among other small oxygenated species
in the pyrolysis oil. Levoglucosan was identified as being the largest carbon-based
fraction of the oil, up to 11 wt% under certain conditions. Additional experiments
extending oxidative pyrolysis to process polymer feedstocks are also proposed.
CONTENTS
Acknowledgments i
Abstract ii
Table of Contents iv
List of Tables vii
List of Figures viii
1 Introduction 11.1 Lignocellulosic Biomass Structure . . . . . . . . . . . . . . . . . . . . 2
1.1.1 Cellulose . . . . . . . . . . . . . . . . . . . . . . . . . . . . . . 21.1.2 Hemicellulose . . . . . . . . . . . . . . . . . . . . . . . . . . . 41.1.3 Lignin . . . . . . . . . . . . . . . . . . . . . . . . . . . . . . . 4
1.2 Thermochemical Processing Techniques . . . . . . . . . . . . . . . . . 61.2.1 Pyrolysis . . . . . . . . . . . . . . . . . . . . . . . . . . . . . . 61.2.2 Gasification and Fischer-Tropsch . . . . . . . . . . . . . . . . 101.2.3 Millisecond Catalytic Autothermal Reforming . . . . . . . . . 12
2 Reactive boiling of cellulose for integrated catalysis through an in-termediate liquid 152.1 Introduction . . . . . . . . . . . . . . . . . . . . . . . . . . . . . . . . 162.2 Experimental . . . . . . . . . . . . . . . . . . . . . . . . . . . . . . . 17
2.2.1 Catalyst preparation . . . . . . . . . . . . . . . . . . . . . . . 172.2.2 Micron-scale particle processing on foam supports . . . . . . . 172.2.3 Micron-scale particle processing on flat supports . . . . . . . . 192.2.4 Centimeter-scale particle processing . . . . . . . . . . . . . . . 192.2.5 High-speed photography . . . . . . . . . . . . . . . . . . . . . 20
2.3 Results and discussion . . . . . . . . . . . . . . . . . . . . . . . . . . 202.4 Conclusions . . . . . . . . . . . . . . . . . . . . . . . . . . . . . . . . 262.5 Acknowledgments . . . . . . . . . . . . . . . . . . . . . . . . . . . . . 28
iv
CONTENTS v
3 Autothermal Oxidative Pyrolysis of Monoaromatics Over Noble Met-als 293.1 Introduction . . . . . . . . . . . . . . . . . . . . . . . . . . . . . . . . 303.2 Experimental . . . . . . . . . . . . . . . . . . . . . . . . . . . . . . . 30
3.2.1 Catalyst Preparation . . . . . . . . . . . . . . . . . . . . . . . 313.2.2 Reactor Startup and Operation . . . . . . . . . . . . . . . . . 323.2.3 Data Acquisition and Analysis . . . . . . . . . . . . . . . . . . 32
3.3 Results . . . . . . . . . . . . . . . . . . . . . . . . . . . . . . . . . . . 333.3.1 Catalyst Temperatures . . . . . . . . . . . . . . . . . . . . . . 333.3.2 Conversion . . . . . . . . . . . . . . . . . . . . . . . . . . . . . 333.3.3 Hydrogen Selectivity . . . . . . . . . . . . . . . . . . . . . . . 333.3.4 Carbon Selectivity . . . . . . . . . . . . . . . . . . . . . . . . 34
3.4 Discussion . . . . . . . . . . . . . . . . . . . . . . . . . . . . . . . . . 373.4.1 Monoaromatics . . . . . . . . . . . . . . . . . . . . . . . . . . 373.4.2 Catalysts . . . . . . . . . . . . . . . . . . . . . . . . . . . . . 39
3.5 Conclusions . . . . . . . . . . . . . . . . . . . . . . . . . . . . . . . . 42
4 Rapid Ablative Pyrolysis of Cellulose in an Autothermal Fixed-bedCatalytic Reactor 454.1 Introduction . . . . . . . . . . . . . . . . . . . . . . . . . . . . . . . . 454.2 Experimental Details . . . . . . . . . . . . . . . . . . . . . . . . . . . 464.3 Results and Discussion . . . . . . . . . . . . . . . . . . . . . . . . . . 484.4 Conclusions . . . . . . . . . . . . . . . . . . . . . . . . . . . . . . . . 534.5 Acknowledgments . . . . . . . . . . . . . . . . . . . . . . . . . . . . . 54
5 Effect of alkali metal impurities on Co-Re catalysts for Fischer-Tropsch synthesis from biomass-derived syngas 555.1 Introduction . . . . . . . . . . . . . . . . . . . . . . . . . . . . . . . . 565.2 Experimental . . . . . . . . . . . . . . . . . . . . . . . . . . . . . . . 57
5.2.1 Catalyst Preparation . . . . . . . . . . . . . . . . . . . . . . . 575.2.2 Hydrogen Chemisorption . . . . . . . . . . . . . . . . . . . . . 585.2.3 Temperature Programmed Reduction . . . . . . . . . . . . . . 585.2.4 Fischer-Tropsch Synthesis . . . . . . . . . . . . . . . . . . . . 58
5.3 Results . . . . . . . . . . . . . . . . . . . . . . . . . . . . . . . . . . . 595.3.1 Hydrogen Chemisorption . . . . . . . . . . . . . . . . . . . . . 595.3.2 Temperature Programmed Reduction . . . . . . . . . . . . . . 595.3.3 Fischer-Tropsch Synthesis . . . . . . . . . . . . . . . . . . . . 59
5.4 Discussion . . . . . . . . . . . . . . . . . . . . . . . . . . . . . . . . . 605.5 Conclusions . . . . . . . . . . . . . . . . . . . . . . . . . . . . . . . . 635.6 Acknowledgments . . . . . . . . . . . . . . . . . . . . . . . . . . . . . 64
6 Future Work 656.1 Selectivity of Cellulosic Pyrolysis Oil . . . . . . . . . . . . . . . . . . 66
6.1.1 Experimental Details . . . . . . . . . . . . . . . . . . . . . . . 676.1.2 Preliminary Data/Discussion . . . . . . . . . . . . . . . . . . . 71
CONTENTS vi
6.2 Oxidative Pyrolysis of Plastics . . . . . . . . . . . . . . . . . . . . . . 766.2.1 Thermoplastics . . . . . . . . . . . . . . . . . . . . . . . . . . 776.2.2 Thermosets . . . . . . . . . . . . . . . . . . . . . . . . . . . . 796.2.3 Experimental Methods . . . . . . . . . . . . . . . . . . . . . . 826.2.4 Preliminary Results . . . . . . . . . . . . . . . . . . . . . . . . 83
Bibliography 86
A Supplementary Information: Chapter 2 98A.1 Method for Cellulose Particles on Foams . . . . . . . . . . . . . . . . 98A.2 Method for Cellulose Feedstock . . . . . . . . . . . . . . . . . . . . . 100A.3 Method for Conversion on Foams . . . . . . . . . . . . . . . . . . . . 104A.4 Method for Conversion on Flat Surfaces . . . . . . . . . . . . . . . . 104A.5 Glycerol Droplets . . . . . . . . . . . . . . . . . . . . . . . . . . . . . 117A.6 Method for Cellulose Rod Experimental Setup . . . . . . . . . . . . . 117
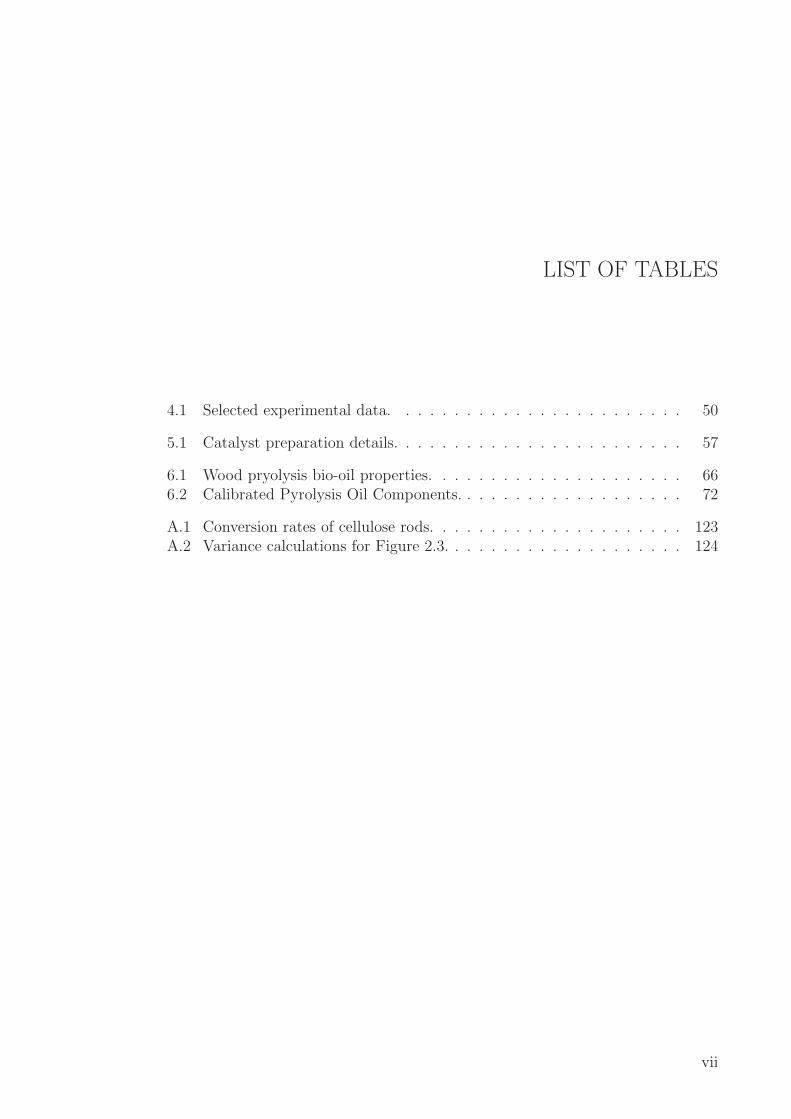
LIST OF TABLES
4.1 Selected experimental data. . . . . . . . . . . . . . . . . . . . . . . . 50
5.1 Catalyst preparation details. . . . . . . . . . . . . . . . . . . . . . . . 57
6.1 Wood pryolysis bio-oil properties. . . . . . . . . . . . . . . . . . . . . 666.2 Calibrated Pyrolysis Oil Components. . . . . . . . . . . . . . . . . . . 72
A.1 Conversion rates of cellulose rods. . . . . . . . . . . . . . . . . . . . . 123A.2 Variance calculations for Figure 2.3. . . . . . . . . . . . . . . . . . . . 124
vii
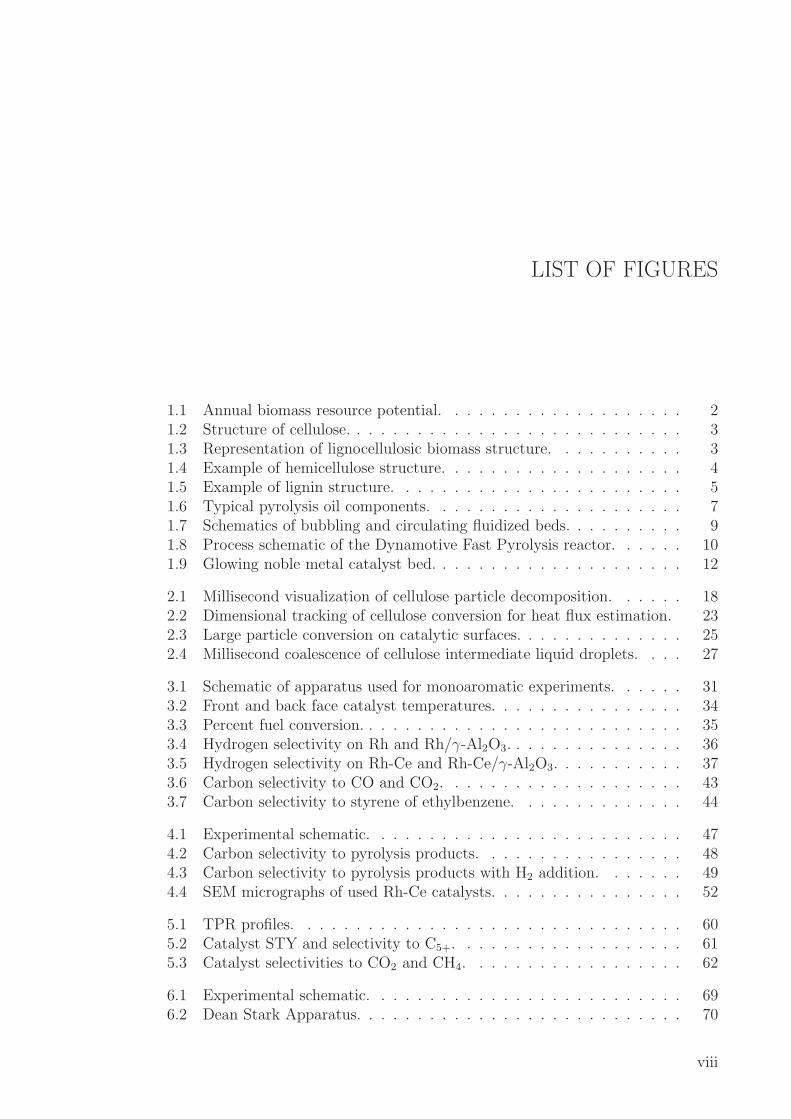
LIST OF FIGURES
1.1 Annual biomass resource potential. . . . . . . . . . . . . . . . . . . . 21.2 Structure of cellulose. . . . . . . . . . . . . . . . . . . . . . . . . . . . 31.3 Representation of lignocellulosic biomass structure. . . . . . . . . . . 31.4 Example of hemicellulose structure. . . . . . . . . . . . . . . . . . . . 41.5 Example of lignin structure. . . . . . . . . . . . . . . . . . . . . . . . 51.6 Typical pyrolysis oil components. . . . . . . . . . . . . . . . . . . . . 71.7 Schematics of bubbling and circulating fluidized beds. . . . . . . . . . 91.8 Process schematic of the Dynamotive Fast Pyrolysis reactor. . . . . . 101.9 Glowing noble metal catalyst bed. . . . . . . . . . . . . . . . . . . . . 12
2.1 Millisecond visualization of cellulose particle decomposition. . . . . . 182.2 Dimensional tracking of cellulose conversion for heat flux estimation. 232.3 Large particle conversion on catalytic surfaces. . . . . . . . . . . . . . 252.4 Millisecond coalescence of cellulose intermediate liquid droplets. . . . 27
3.1 Schematic of apparatus used for monoaromatic experiments. . . . . . 313.2 Front and back face catalyst temperatures. . . . . . . . . . . . . . . . 343.3 Percent fuel conversion. . . . . . . . . . . . . . . . . . . . . . . . . . . 353.4 Hydrogen selectivity on Rh and Rh/γ-Al2O3. . . . . . . . . . . . . . . 363.5 Hydrogen selectivity on Rh-Ce and Rh-Ce/γ-Al2O3. . . . . . . . . . . 373.6 Carbon selectivity to CO and CO2. . . . . . . . . . . . . . . . . . . . 433.7 Carbon selectivity to styrene of ethylbenzene. . . . . . . . . . . . . . 44
4.1 Experimental schematic. . . . . . . . . . . . . . . . . . . . . . . . . . 474.2 Carbon selectivity to pyrolysis products. . . . . . . . . . . . . . . . . 484.3 Carbon selectivity to pyrolysis products with H2 addition. . . . . . . 494.4 SEM micrographs of used Rh-Ce catalysts. . . . . . . . . . . . . . . . 52
5.1 TPR profiles. . . . . . . . . . . . . . . . . . . . . . . . . . . . . . . . 605.2 Catalyst STY and selectivity to C5+. . . . . . . . . . . . . . . . . . . 615.3 Catalyst selectivities to CO2 and CH4. . . . . . . . . . . . . . . . . . 62
6.1 Experimental schematic. . . . . . . . . . . . . . . . . . . . . . . . . . 696.2 Dean Stark Apparatus. . . . . . . . . . . . . . . . . . . . . . . . . . . 70
viii
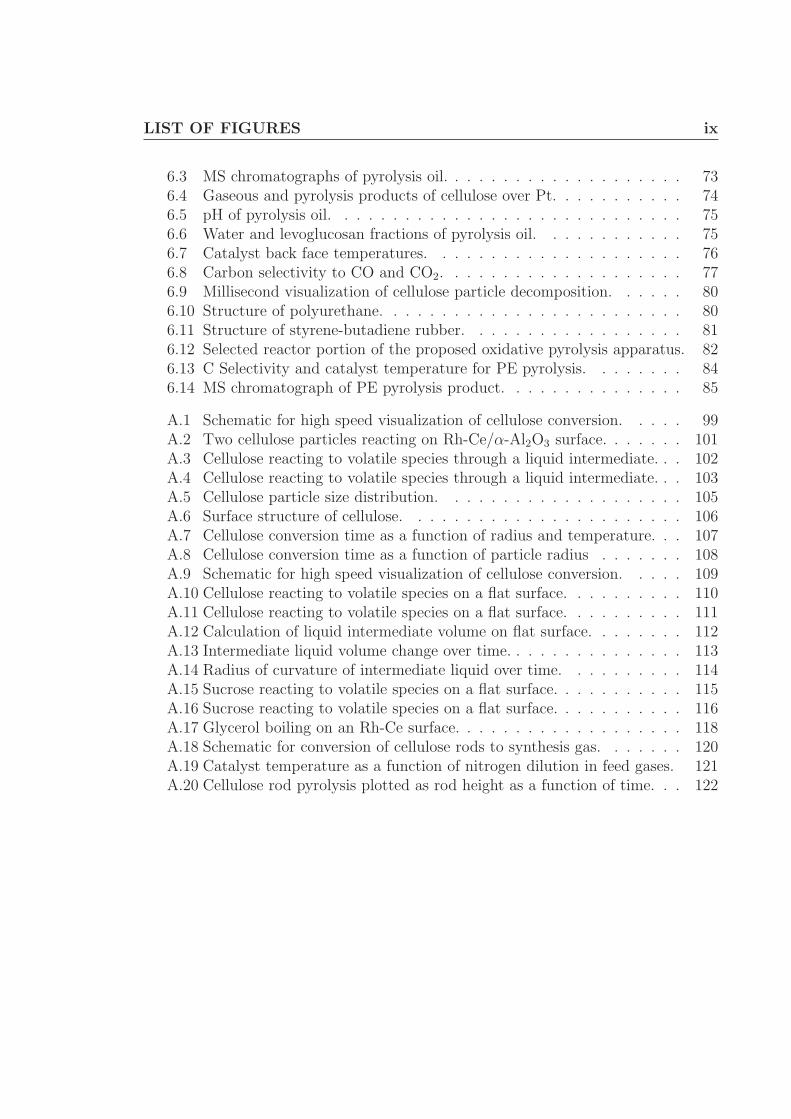
LIST OF FIGURES ix
6.3 MS chromatographs of pyrolysis oil. . . . . . . . . . . . . . . . . . . . 736.4 Gaseous and pyrolysis products of cellulose over Pt. . . . . . . . . . . 746.5 pH of pyrolysis oil. . . . . . . . . . . . . . . . . . . . . . . . . . . . . 756.6 Water and levoglucosan fractions of pyrolysis oil. . . . . . . . . . . . 756.7 Catalyst back face temperatures. . . . . . . . . . . . . . . . . . . . . 766.8 Carbon selectivity to CO and CO2. . . . . . . . . . . . . . . . . . . . 776.9 Millisecond visualization of cellulose particle decomposition. . . . . . 806.10 Structure of polyurethane. . . . . . . . . . . . . . . . . . . . . . . . . 806.11 Structure of styrene-butadiene rubber. . . . . . . . . . . . . . . . . . 816.12 Selected reactor portion of the proposed oxidative pyrolysis apparatus. 826.13 C Selectivity and catalyst temperature for PE pyrolysis. . . . . . . . 846.14 MS chromatograph of PE pyrolysis product. . . . . . . . . . . . . . . 85
A.1 Schematic for high speed visualization of cellulose conversion. . . . . 99A.2 Two cellulose particles reacting on Rh-Ce/α-Al2O3 surface. . . . . . . 101A.3 Cellulose reacting to volatile species through a liquid intermediate. . . 102A.4 Cellulose reacting to volatile species through a liquid intermediate. . . 103A.5 Cellulose particle size distribution. . . . . . . . . . . . . . . . . . . . 105A.6 Surface structure of cellulose. . . . . . . . . . . . . . . . . . . . . . . 106A.7 Cellulose conversion time as a function of radius and temperature. . . 107A.8 Cellulose conversion time as a function of particle radius . . . . . . . 108A.9 Schematic for high speed visualization of cellulose conversion. . . . . 109A.10 Cellulose reacting to volatile species on a flat surface. . . . . . . . . . 110A.11 Cellulose reacting to volatile species on a flat surface. . . . . . . . . . 111A.12 Calculation of liquid intermediate volume on flat surface. . . . . . . . 112A.13 Intermediate liquid volume change over time. . . . . . . . . . . . . . . 113A.14 Radius of curvature of intermediate liquid over time. . . . . . . . . . 114A.15 Sucrose reacting to volatile species on a flat surface. . . . . . . . . . . 115A.16 Sucrose reacting to volatile species on a flat surface. . . . . . . . . . . 116A.17 Glycerol boiling on an Rh-Ce surface. . . . . . . . . . . . . . . . . . . 118A.18 Schematic for conversion of cellulose rods to synthesis gas. . . . . . . 120A.19 Catalyst temperature as a function of nitrogen dilution in feed gases. 121A.20 Cellulose rod pyrolysis plotted as rod height as a function of time. . . 122
CHAPTER
ONE
INTRODUCTION
In the last several years, environmental concerns and the rise of fossil fuel prices
have prompted discussion and research in alternative and renewable energy sources.
Currently, the global economy and infrastructure relies heavily on liquid hydrocarbon
transportation fuels. To ease a transition to a more renewable-based fuel economy, a
suitable liquid fuel that can utilize existing infrastructure would be ideal.
Biomass has emerged as one of the forerunners of renewable energy sources and is
the only source of renewable carbon. According to a study by the US Department of
Agriculture and Department of Energy, 30 % of transportation fuels can be replaced
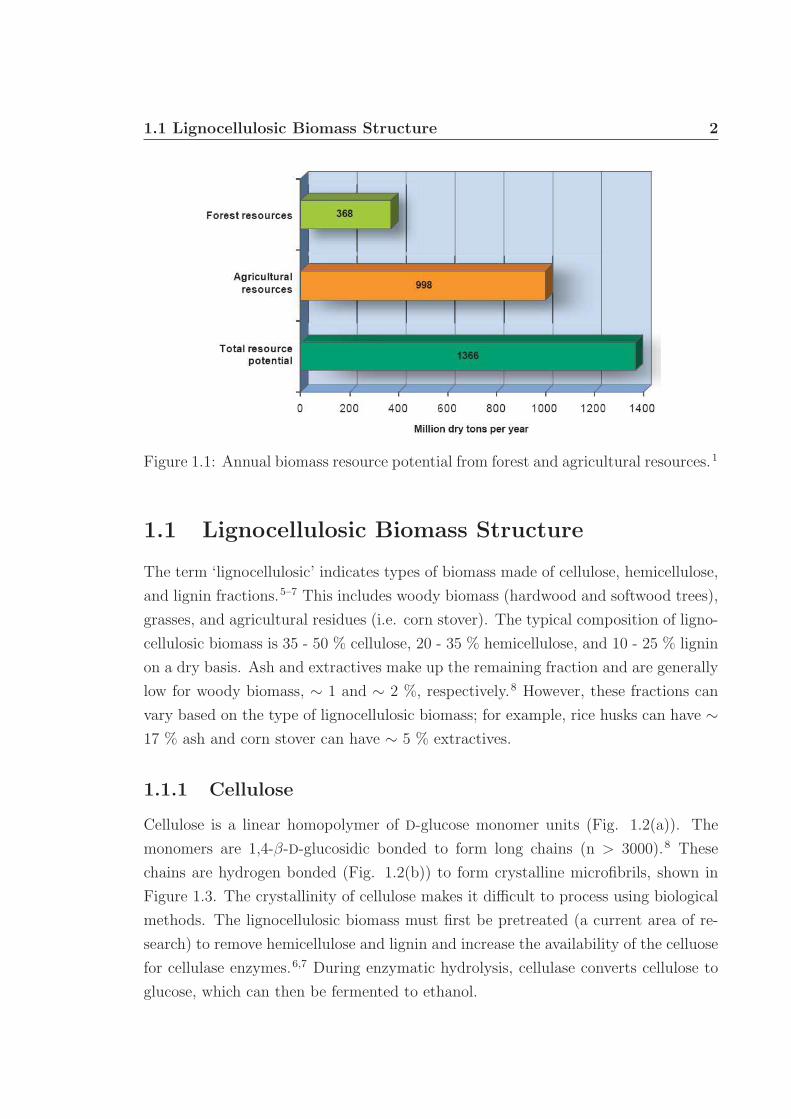
with biomass-based fuels by 2030. This can be accomplished by processing over 1
billion tons of dry biomass from many underutilized sources, such as forestry wastes
and crop residues (Fig. 1.1).1 This study assumes that by 2030 large-scale biorefineries
will exist to process all varieties of biomass, including lignocellulosic. The US EPA
has mandated that by 2020 annual production of renewable fuel should be 30 billion
gallons (ethanol equivalent).2–4 More specifically, nearly a third of the renewable fuel
should be made from cellulosic biomass sources. In 2010, the EPA required that 100
million gallons of renewable fuel be made from cellulosic material, however production
fell far short of this goal, at only 6.5 million gallons. Lignocellulosic biomass is an
important and major source of renewable fuel, but is more difficult to process than
corn starch and other non-lignin biomass feedstocks. More efficient and versatile
technologies are necessary to reach renewable fuel production goals.
1
1.1 Lignocellulosic Biomass Structure 2
Figure 1.1: Annual biomass resource potential from forest and agricultural resources.1
1.1 Lignocellulosic Biomass Structure
The term ‘lignocellulosic’ indicates types of biomass made of cellulose, hemicellulose,
and lignin fractions.5–7 This includes woody biomass (hardwood and softwood trees),
grasses, and agricultural residues (i.e. corn stover). The typical composition of ligno-
cellulosic biomass is 35 - 50 % cellulose, 20 - 35 % hemicellulose, and 10 - 25 % lignin
on a dry basis. Ash and extractives make up the remaining fraction and are generally
low for woody biomass, ∼ 1 and ∼ 2 %, respectively.8 However, these fractions can
vary based on the type of lignocellulosic biomass; for example, rice husks can have ∼
17 % ash and corn stover can have ∼ 5 % extractives.
1.1.1 Cellulose
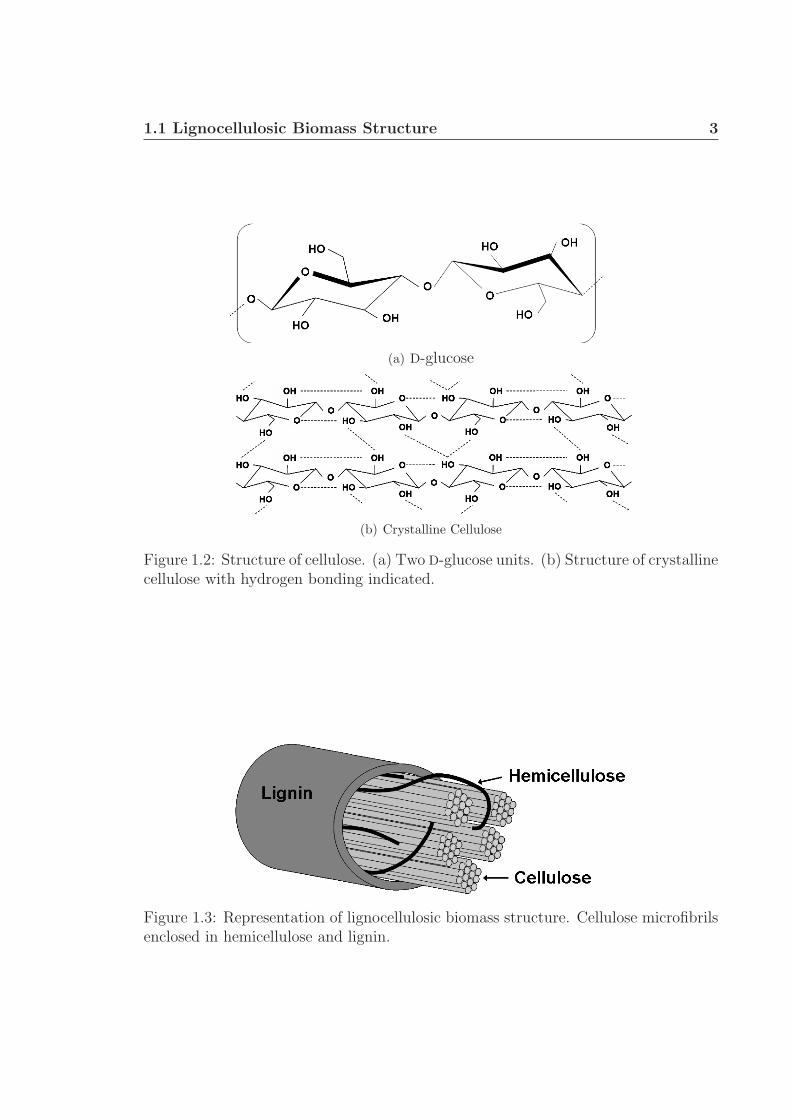
Cellulose is a linear homopolymer of D-glucose monomer units (Fig. 1.2(a)). The
monomers are 1,4-β-D-glucosidic bonded to form long chains (n > 3000).8 These
chains are hydrogen bonded (Fig. 1.2(b)) to form crystalline microfibrils, shown in
Figure 1.3. The crystallinity of cellulose makes it difficult to process using biological
methods. The lignocellulosic biomass must first be pretreated (a current area of re-
search) to remove hemicellulose and lignin and increase the availability of the celluose
for cellulase enzymes.6,7 During enzymatic hydrolysis, cellulase converts cellulose to
glucose, which can then be fermented to ethanol.
1.1 Lignocellulosic Biomass Structure 3
(a) D-glucose
(b) Crystalline Cellulose
Figure 1.2: Structure of cellulose. (a) Two D-glucose units. (b) Structure of crystallinecellulose with hydrogen bonding indicated.
Figure 1.3: Representation of lignocellulosic biomass structure. Cellulose microfibrilsenclosed in hemicellulose and lignin.
1.1 Lignocellulosic Biomass Structure 4
OO
O
O
O
COOH
CH3O
HO
O
O
OH
OH
CH2OH
AcO
HOOH
OO
HO OH O
OO
O
O
O
HO
HOH2C
O
OHOHO
HO OO
HO
HO OH
CH3
HO
AcO
AcO
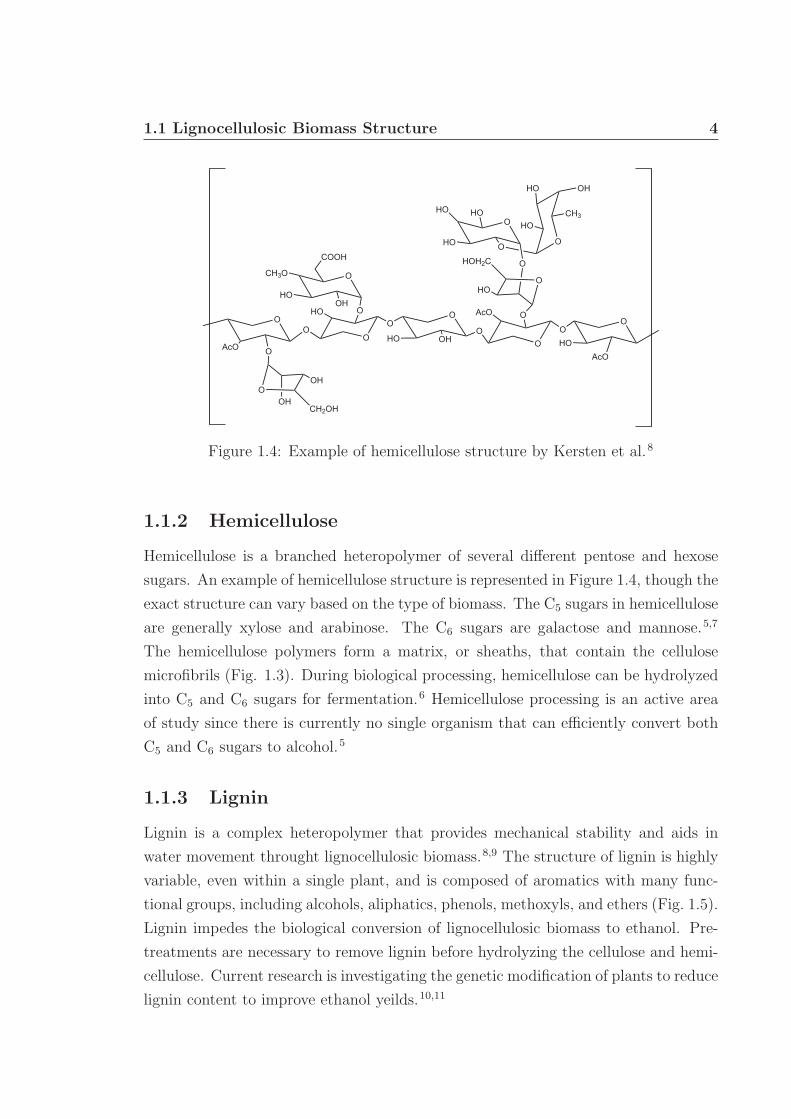
Figure 1.4: Example of hemicellulose structure by Kersten et al.8
1.1.2 Hemicellulose
Hemicellulose is a branched heteropolymer of several different pentose and hexose
sugars. An example of hemicellulose structure is represented in Figure 1.4, though the
exact structure can vary based on the type of biomass. The C5 sugars in hemicellulose
are generally xylose and arabinose. The C6 sugars are galactose and mannose.5,7
The hemicellulose polymers form a matrix, or sheaths, that contain the cellulose
microfibrils (Fig. 1.3). During biological processing, hemicellulose can be hydrolyzed
into C5 and C6 sugars for fermentation.6 Hemicellulose processing is an active area
of study since there is currently no single organism that can efficiently convert both
C5 and C6 sugars to alcohol.5
1.1.3 Lignin
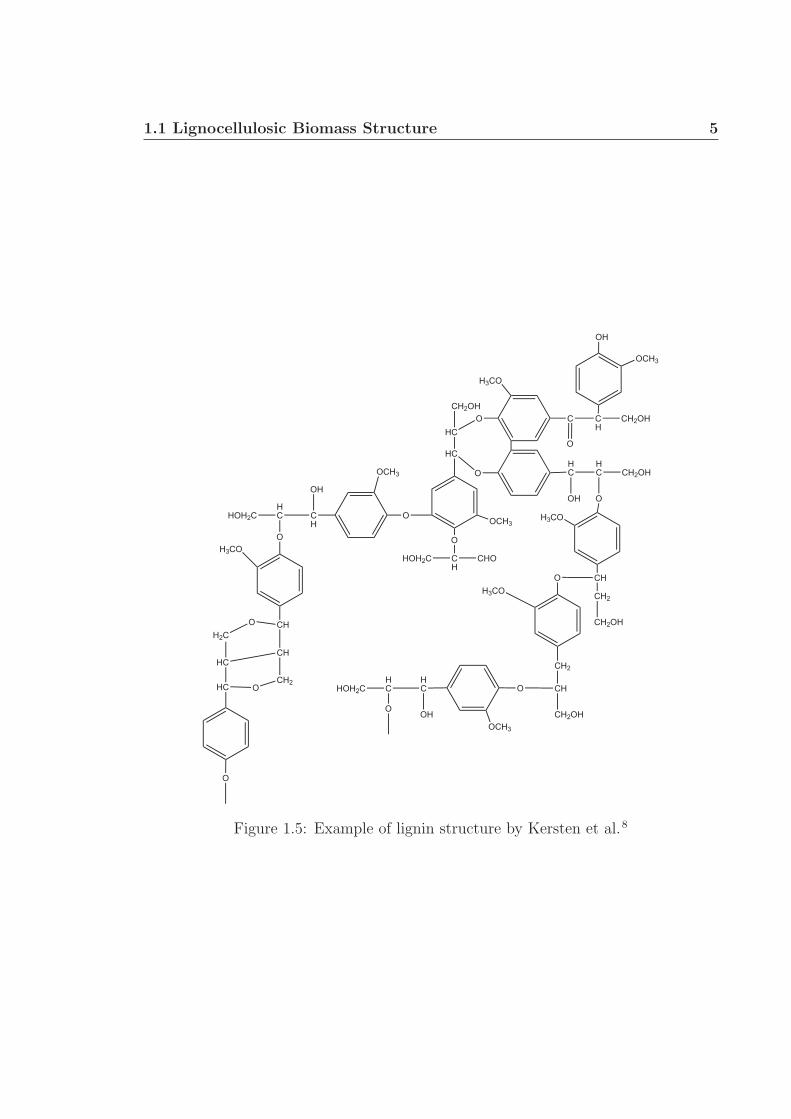
Lignin is a complex heteropolymer that provides mechanical stability and aids in
water movement throught lignocellulosic biomass.8,9 The structure of lignin is highly
variable, even within a single plant, and is composed of aromatics with many func-
tional groups, including alcohols, aliphatics, phenols, methoxyls, and ethers (Fig. 1.5).
Lignin impedes the biological conversion of lignocellulosic biomass to ethanol. Pre-
treatments are necessary to remove lignin before hydrolyzing the cellulose and hemi-
cellulose. Current research is investigating the genetic modification of plants to reduce
lignin content to improve ethanol yeilds.10,11
1.1 Lignocellulosic Biomass Structure 5
OH
OCH3
CH
CH2OHC
O
H3CO
O
HC
CH2OH
HC
OHC
HC CH2OH
OH O
OCH3
O
O
CH
HOH2C CHO
H3CO
CHO
CH2
CH2OH
OCH3
OH
CH
HCHOH2C
O
H3CO
H3CO
CH2
CHO
H2C
CH
CH2O
HC
HC CH
CH2OH
OHC
HCHOH2C
OHO
OCH3
O
Figure 1.5: Example of lignin structure by Kersten et al.8
1.2 Thermochemical Processing Techniques 6
1.2 Thermochemical Processing Techniques
Biomass processing research has largely focused on biological and thermochemical
routes to produce renewable liquid fuels and chemicals. One biological processing
route is the production of ethanol, which can be readily mixed with gasoline as a
transportation fuel additive to displace fossil fuel use. The US Environmental Pro-
tection Agency currently approves 10 % ethanol in gasoline mixtures (E10) for all
transportation uses, and 15 % for light-duty vehicles manufactured after 2001 and
flex-fuel vehicles.12 E10 is widely available and nine states have laws specifically man-
dating the blending of ethanol into gasoline.13
Corn starch is the primary feedstock for ethanol prodcution. Processing of the
starch involves hydrolysis to produce glucose, fermentation to ethanol, and recovery of
the ethanol from the product stream. However, this process does not directly translate
for the processing of lignocellulosic biomass, which can require pretreatments and
additional processing (Section 1.1).
In addition to the difficulties associated with processing of lignocellulosic biomass,
biological processing to ethanol has several intrinsic disadvantages. The process speed
is limited by the enzymes and yeast, which are slow when compared to thermochem-
ical process methods. Distillation of the water and ethanol product stream is energy
intensive and requires additional steps to create a pure ethanol product. Addition-
ally, ethanol has a lower heating value than gasoline, is hydroscopic, and corrosive.14
Thermochemical processing of lignocellulosic biomass feedstocks may be a faster and
more efficient route to produce renewable fuels and chemicals. Two main thermo-
chemical routes discussed in the following sections are pyrolysis and gasification with
Fischer-Tropsch processing.
1.2.1 Pyrolysis
Pyrolysis is an endothermic thermochemical processing method that can utilize bio-
mass to make fuels and chemicals. During pyrolysis, feedstock is thermally decom-
posed at atmospheric pressure and in the absence of oxygen to select primarily for
liquid products. Solid, liquid, and gaseous products can be produced depending on
reaction conditions: lower temperatures and long residence times have high selectivity
to solid carbon products, while high temperatures and short residence times select
for gaseous products.15 Fast pyrolysis has emerged as a particular area of interest to
maximize the yield of liquid hydrocarbons from biomass feedstock. The process is
characterized by high heat transfer rates, temperatures of 400 - 500 ◦C, short resi-
1.2 Thermochemical Processing Techniques 7
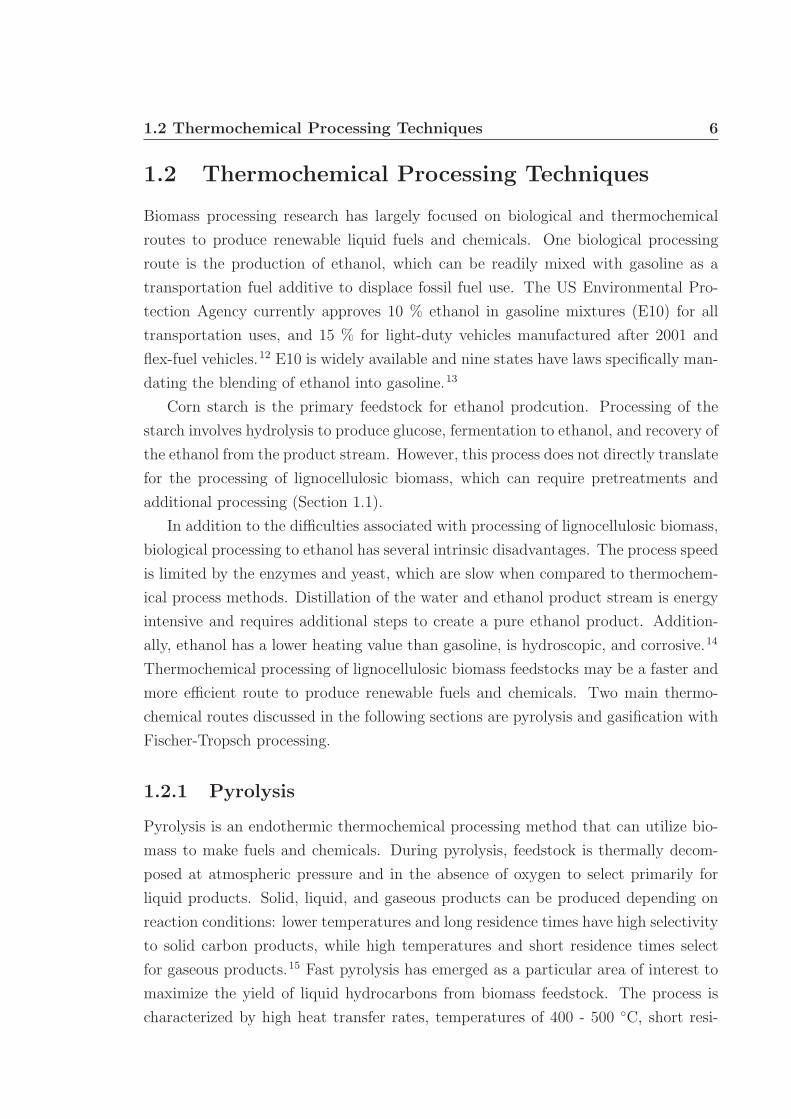
Figure 1.6: Typical wt% of several pyrolysis oil components.
dence times (< 2 s), and rapid cooling to condense products. The resulting liquid
product, referred to as pyrolysis oil or bio-oil, is highly variable depending on the type
of feedstock and can be made up of hundreds of decomposition products of lignin,
hemicellulose, and cellulose (Fig. 1.6). Pyrolysis oil is typically characterized by a
high water content (< 35 %), numerous oxygenated species, and a low pH (∼ 2). This
oil can be upgraded (i.e. deoxygenated and stabilized) to a more desireable product
for use as a transportation fuel.
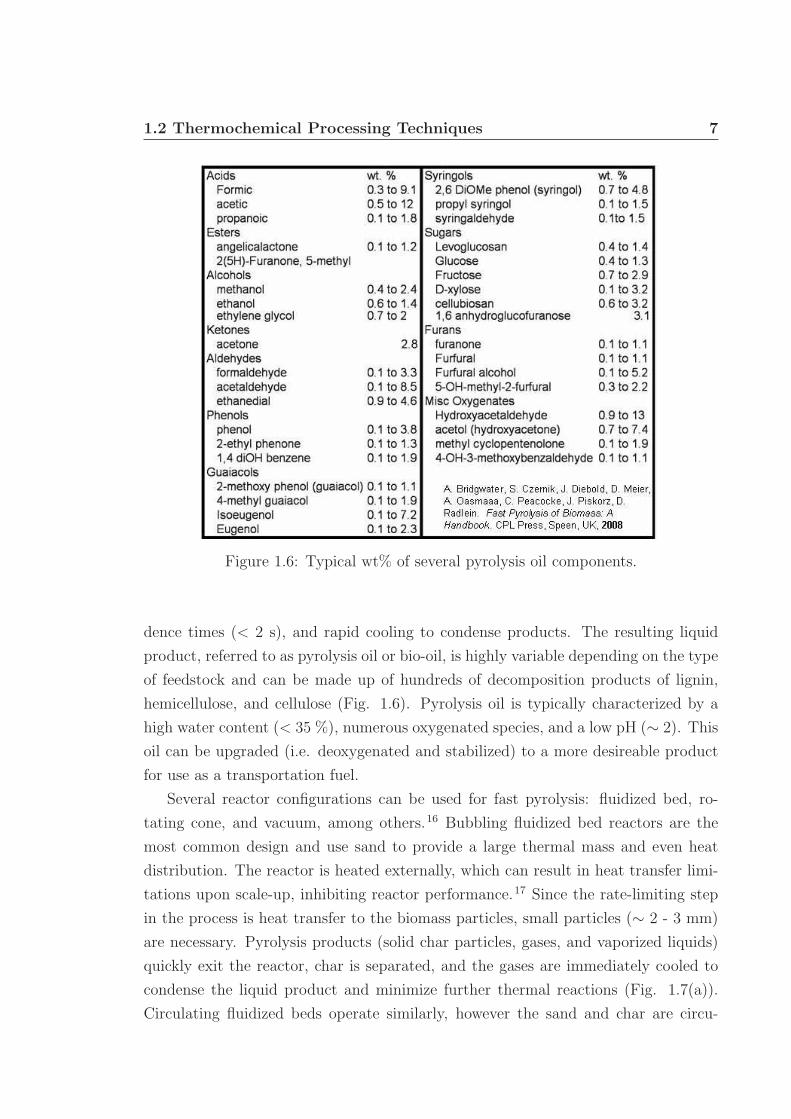
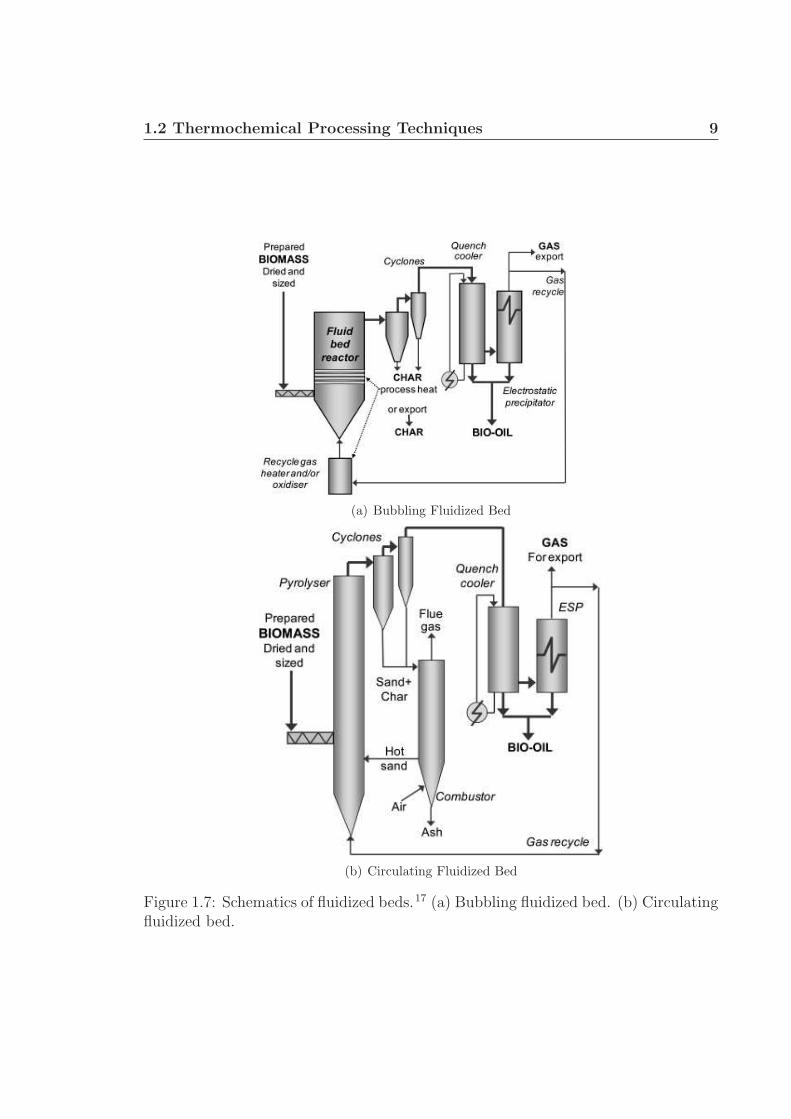
Several reactor configurations can be used for fast pyrolysis: fluidized bed, ro-
tating cone, and vacuum, among others.16 Bubbling fluidized bed reactors are the
most common design and use sand to provide a large thermal mass and even heat
distribution. The reactor is heated externally, which can result in heat transfer limi-
tations upon scale-up, inhibiting reactor performance.17 Since the rate-limiting step
in the process is heat transfer to the biomass particles, small particles (∼ 2 - 3 mm)
are necessary. Pyrolysis products (solid char particles, gases, and vaporized liquids)
quickly exit the reactor, char is separated, and the gases are immediately cooled to
condense the liquid product and minimize further thermal reactions (Fig. 1.7(a)).
Circulating fluidized beds operate similarly, however the sand and char are circu-
1.2 Thermochemical Processing Techniques 8
lated, separated, and the clean sand is recycled to the reactor (Fig. 1.7(b)), which
may be more appropriate for larger reactor throughputs.
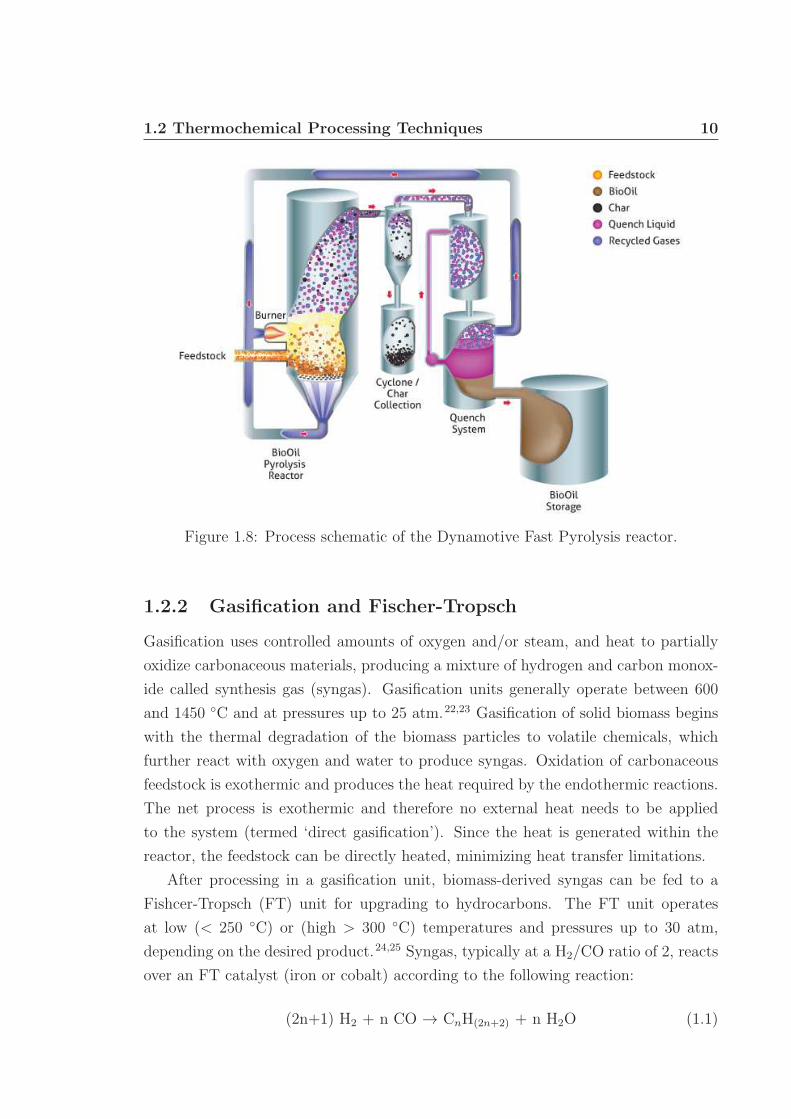
Fluidized bed technology is widely understood and used by many start-up compa-
nies. Dynamotive Energy Systems Corporation currently operates a 200 ton per day
biomass fast pyrolysis unit in Guelph, Ontario (completed in 2007).18 The Dynamo-
tive system (Fig. 1.8) reacts dry biomass (< 10 wt% water) at 450 - 500 ◦C in the
absence of oxygen to pyrolysis vapors and solid char particles.19 Pyrolysis vapors and
char are separated by cyclone and vapors are quickly condensed. Residence time in
the system is ∼ 2 seconds. The process yields 60 - 75 wt% pyrolysis oil, 15 - 20 wt%
solid char, and 10 - 20 wt% gases, depending on the type of biomass feedstock used
(i.e. sawdust or bagasse). Currently a mixture of 80 % pyrolysis oil and 20 % char is
marketed as an industrial fuel to kilns and boilers.20 Further upgrading to minimize
water and oxygen content of the pyrolysis oil is necessary before it can be marketed
as a transportation fuel.
Additional commercial ventures utilize similar fluidized bed technologies as Dy-
namotive. Ensyn operates several biomass pyrolysis plants, including a 150 tonne/day
facility in Renfrew, Ontario that was commissioned in 2007.21 Utilizing a circulat-
ing fluidized bed design, termed ‘Rapid Thermal Processing’, Ensyn converts woody
biomass feedstocks to 60 - 80 wt% pyrolysis oil, 12 - 16 wt% solid char, and 12 -
16 wt% gases, similar to the process yields of Dynamotive. The resulting pyrolysis
oil is also used an an industrial heating fuel, but is not yet suitable for use as a
transportation fuel.
While pyrolysis has the potential to produce liquid fuels from biomass as a renew-
able transportation fuel source, typical pyrolysis methods have several disadvantages
that impair further development. First, pyrolysis reactors can produce large amounts
of solid char and non-condensible gases, limiting carbon selectivity to the desired
pyrolysis oil. Traditional pyrolysis systems also require external heating to react the
biomass. Heating the feed and bed material through the reactor walls can be expen-
sive and inefficient, creating issues during scale-up. Few research groups address this
external heat requirement and the resulting process efficiencies when discussing py-
rolysis oil production. Pyrolysis oil is also corrosive and non-uniform in composition,
making it a poor fuel for typical ignition engines.15
1.2 Thermochemical Processing Techniques 9
(a) Bubbling Fluidized Bed
(b) Circulating Fluidized Bed
Figure 1.7: Schematics of fluidized beds.17 (a) Bubbling fluidized bed. (b) Circulatingfluidized bed.
1.2 Thermochemical Processing Techniques 10
Figure 1.8: Process schematic of the Dynamotive Fast Pyrolysis reactor.
1.2.2 Gasification and Fischer-Tropsch
Gasification uses controlled amounts of oxygen and/or steam, and heat to partially
oxidize carbonaceous materials, producing a mixture of hydrogen and carbon monox-
ide called synthesis gas (syngas). Gasification units generally operate between 600
and 1450 ◦C and at pressures up to 25 atm.22,23 Gasification of solid biomass begins
with the thermal degradation of the biomass particles to volatile chemicals, which
further react with oxygen and water to produce syngas. Oxidation of carbonaceous
feedstock is exothermic and produces the heat required by the endothermic reactions.
The net process is exothermic and therefore no external heat needs to be applied
to the system (termed ‘direct gasification’). Since the heat is generated within the
reactor, the feedstock can be directly heated, minimizing heat transfer limitations.
After processing in a gasification unit, biomass-derived syngas can be fed to a
Fishcer-Tropsch (FT) unit for upgrading to hydrocarbons. The FT unit operates
at low (< 250 ◦C) or (high > 300 ◦C) temperatures and pressures up to 30 atm,
depending on the desired product.24,25 Syngas, typically at a H2/CO ratio of 2, reacts
over an FT catalyst (iron or cobalt) according to the following reaction:
(2n+1) H2 + n CO → CnH(2n+2) + n H2O (1.1)
1.2 Thermochemical Processing Techniques 11
Iron, cobalt, nickel, and ruthenium are the four catalysts typically discussed for
FT reactions. However, nickel and ruthenium are generally disregarded due to their
high methanation activity and very high cost, respectively.24,26,27 Iron is the most
common FT catalyst in commercial applications since it is inexpensive, relatively
insensitive to feed contaminants, and has high water-gas-shift activity (Equation 1.2)
that eliminates the need for H2/CO ratio adjustment prior to the FT reactor. Cobalt,
while more expensive, has several advantages over iron catalysts: longer lifespan
(years vs. months), higher activity, and very high selectivity to normal paraffins.
The product hydrocarbons can be hydrocracked to produce a range of transportation
fuels (gasoline, diesel, jet).
CO + H2O ⇋ CO2 + H2 ∆H = 41 kJ mol−1 (1.2)
Gasification and Fischer-Tropsch processing has several advantages in the con-
version of biomass feedstocks. Gasification is robust to a wide variety of feedstocks,
including various types of biomass such as trees and grasses.28,29 The high tempera-
tures at which gasification processes operate and the producer gas is held minimize
the formation of aromatics, dioxins, and other similar tar compounds.30 No signif-
icant changes to infrastructure is necessary to use the synthetic gasoline and diesel
produced by FT reactions.29 Additionally, since the syngas is required to be of high
quality for FT processing, the product fuel is much cleaner than traditional fossil
fuels.
Gasification of biomass and reaction of syngas through FT methods are indepen-
dently well-understood processes. However, there are very few facilities that incor-
porate the two processes. Rentech has developed and piloted a 400 gallon per day
biomass-to-liquids facility in Commerce City, Colorado.31 The primary products are
renewable jet and diesel fuels for transportation. A 1500 barrel per day facility is
planned for construction in Rialto, California after securing a deal to provide renew-
able diesel to several airlines at the Los Angeles International Airport.32 Additionally,
Rentech has demonstrated a successful test flight with United Airlines using a mixture
of renewable and fossil-based jet fuels (60/40) in April, 2010.33
Despite several advantages, gasification has disadvantages that severely limit its
widespread use on a commercial scale with biomass feedstock. The syngas can contain
tar and char byproducts that require expensive downstream cleanup of the syngas.
Product gases are also strongly affected by process conditions, such as temperature
and pressure.34 Furthermore, it is not well understood how biomass-related inorganic
compounds within the syngas will affect FT catalyst performace as few research
1.2 Thermochemical Processing Techniques 12
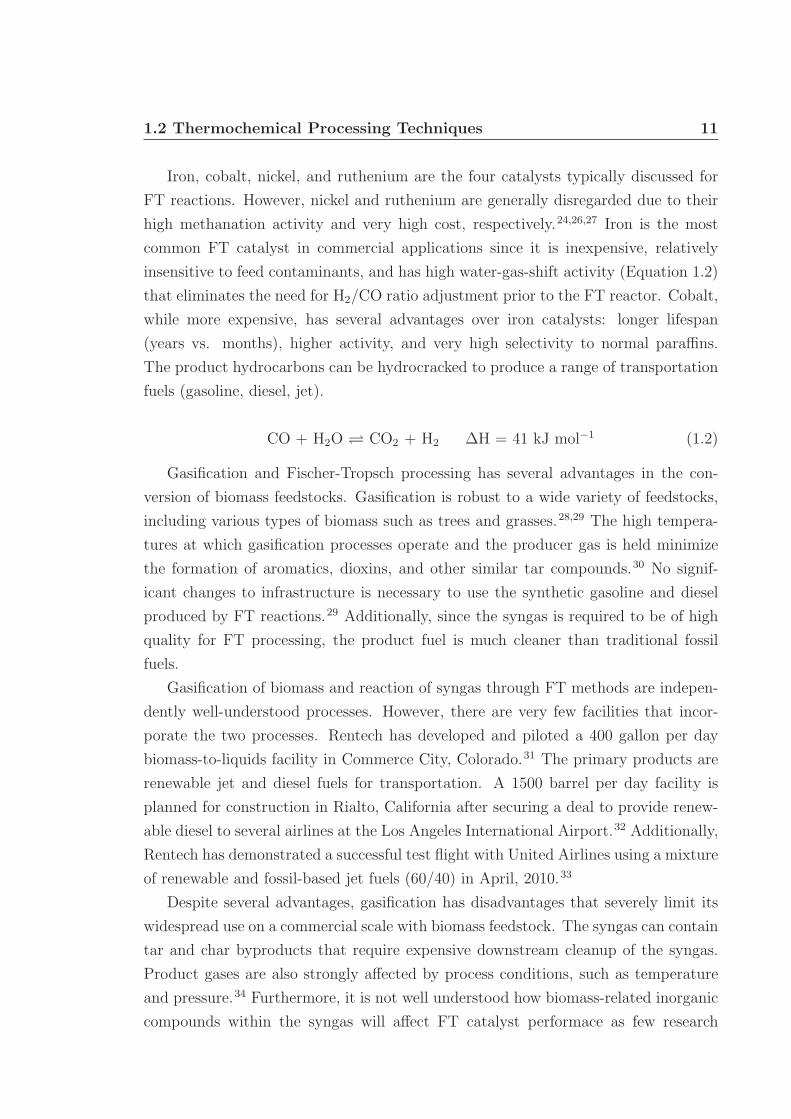
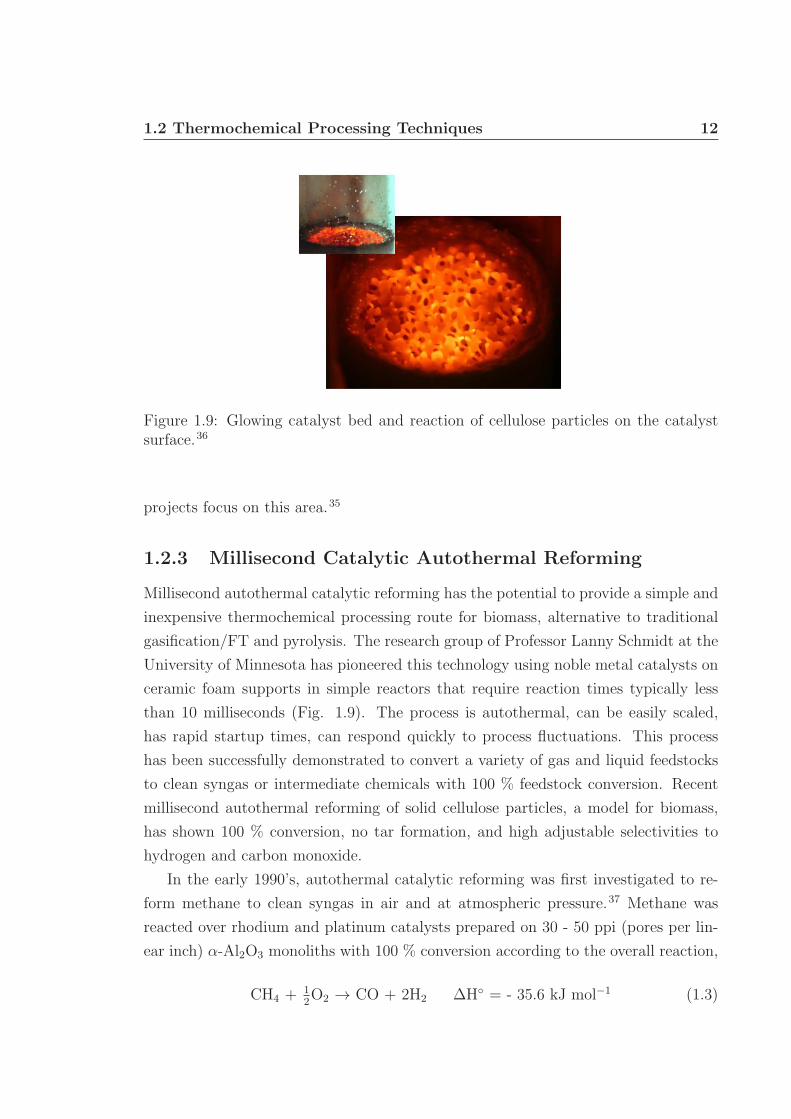
Figure 1.9: Glowing catalyst bed and reaction of cellulose particles on the catalystsurface.36
projects focus on this area.35
1.2.3 Millisecond Catalytic Autothermal Reforming
Millisecond autothermal catalytic reforming has the potential to provide a simple and
inexpensive thermochemical processing route for biomass, alternative to traditional
gasification/FT and pyrolysis. The research group of Professor Lanny Schmidt at the
University of Minnesota has pioneered this technology using noble metal catalysts on
ceramic foam supports in simple reactors that require reaction times typically less
than 10 milliseconds (Fig. 1.9). The process is autothermal, can be easily scaled,
has rapid startup times, can respond quickly to process fluctuations. This process
has been successfully demonstrated to convert a variety of gas and liquid feedstocks
to clean syngas or intermediate chemicals with 100 % feedstock conversion. Recent
millisecond autothermal reforming of solid cellulose particles, a model for biomass,
has shown 100 % conversion, no tar formation, and high adjustable selectivities to
hydrogen and carbon monoxide.
In the early 1990’s, autothermal catalytic reforming was first investigated to re-
form methane to clean syngas in air and at atmospheric pressure.37 Methane was
reacted over rhodium and platinum catalysts prepared on 30 - 50 ppi (pores per lin-
ear inch) α-Al2O3 monoliths with 100 % conversion according to the overall reaction,
CH4 + 12O2 → CO + 2H2 ∆H◦ = - 35.6 kJ mol−1 (1.3)
1.2 Thermochemical Processing Techniques 13
With residence times between 10−4 and 10−2 seconds and temperatures of 827 to
1127 ◦C, hydrogen and carbon monoxide selectivities of 90 and 96 % could be achieved,
respectively. These results presented an efficient and potentially economic syngas
production route, alternative to the slow and endothermic traditional steam reforming
processes.
Other noble and transition metals were investigated for use as autothermal reform-
ing catalysts.38 Rhodium was found to be the best catalyst for syngas production with
high stability and resistance to coke formation. Platinum’s ability to oxidatively de-
hydrogenate molecules was ideal for olefin production. Iridium, nickel, palladium,
cobalt, rhenium, ruthenium, and iron were also examined but found to have lower
selectivities or deactivate by coke and/or metal volatilization. Further research has
confirmed the high selectivity to syngas over Rh, as well as the advantages provided
by the addition of cerium metal and a γ-Al2O3 washcoat to the catalyst.39–42
Catalytic autothermal reforming was found to produce high and tunable selectiv-
ities to syngas as well as a variety of olefins by adjusting the fuel and air feed ratio.
Higher hydrocarbon fuels such as alcohols, cyclohexane, n-hexane, isooctane, gaso-
line, and diesel, among other alkanes, were all successfully converted, exemplifying
the consistence and robustness of the process.42–44 All fuels investigated were shown
to achieve at least 80 % selectivity to syngas or 50 % to olefins, depending on the
catalyst, feed gas compostion, and total flow rate.
Recently, research focus has shifted to the utilization of biomass as a renewable
source of carbon for fuels and energy. Fermentation of biomass to alcohols can be
an effective way to produce liquid fuel, but is slow and inefficient. The pyrolysis of
biomass is also a promising technology and produces liquid products, but the py-
rolysis oil is highly complex and requires upgrading. Current biomass gasification
technologies require three energy intensive steps: volatilization of the feed, cleanup
of carbon-rich tars from the syngas product, and water-gas-shift reaction to alter the
H2/CO syngas ratio before processing to liquid fuels by Fischer-Tropsch. Catalytic
autothermal reforming is capable of completely converting 300 µm cellulose particles
to clean syngas in under 30 ms without tar formation and with the ability to tune the
syngas ratio by adjusting operating conditions.36,45 This technology may by extended
to perform autothermal oxidative pyrolysis, providing an efficient way to convert lig-
nocellulosic biomass to liquid fuels and chemicals.
Lignocellulosic biomass represents a major renewable resource, however traditional
processing methods are frequently inefficient and unprofitable. Therefore, a new cat-
1.2 Thermochemical Processing Techniques 14
alytic process is proposed to convert biomass into useful fuels and chemicals. The
evolution of catalytic autothermal reforming and its ability to process gases, volatile
liquids, nonvolatile liquids, and finally solids, shows potential to be successful in such
a process. Autothermal oxidative pyrolysis could have several advantages over tra-
ditional biomass processing methods to produce liquid products. This process can
potentially produce chemicals with higher selectivity in a fast and inexpensive way.
With millisecond residence times, operations would not require large-scale facilities
and could be operated locally. With small, local facilities, less material would need
to be collected to be economical and fewer transportation requirements would re-
duce costs. As an autothermal process, no expensive heat inputs are required, unlike
traditional pyrolysis. The solid catalytic bed facilitates heat transfer within the re-
actor and the plug flow properties prevent radial product variations. The potential
to produce liquid fuels in a single-stage reactor is also beneficial over the intensive
multi-step processing of gasification and Fischer-Tropsch.
CHAPTER
TWO
REACTIVE BOILING OF CELLULOSE FOR
INTEGRATED CATALYSIS THROUGH AN
INTERMEDIATE LIQUID1
Advanced biomass processing technology integrating fast pyrolysis and inorganic
catalysis requires an improved understanding of the thermal decomposition of biopoly-
mers in contact with porous catalytic surfaces. High speed photography (1000 frames
per second) reveals that direct impingement of microcrystalline cellulose particles (300
µm) with rhodium-based reforming catalysts at high temperature (700 ◦C) produces
an intermediate liquid phase that reactively boils to vapors. The intermediate liquid
maintains contact with the porous surface permitting high heat transfer (MW m−2)
generating an internal thermal gradient visible within the particle as a propagating
wave of solid to liquid conversion. Complete conversion to liquid yields a fluid droplet
on the catalyst surface exhibiting a linear decrease in droplet volume with time leav-
ing behind a clean surface absent of solid residue (char). Under specific interfacial
conditions, conversion with large cellulosic particles on the length-scale of wood chips
(millimeters) occurs continuously as generated liquid and vapors are pushed into the
porous surface.
1Portions of this chapter appear in P.J. Dauenhauer, J.L. Colby, C.M. Balonek, W.J. Suszynski,L.D. Schmidt, “Reactive boiling of cellulose for integrated catalysis through an intermediate liquid,”Green Chemistry 11 (2009) 1555-1561. c© 2009 The Royal Society of Chemistry.
15
2.1 Introduction 16
2.1 Introduction
The search for advanced processing technologies capable of efficiently converting
biomass to fuels and chemicals has led to the combination of solid biomass pyrol-
ysis and catalytic processes. Direct utilization of catalysts with biomass requires the
large biopolymers of lignocellulose to be broken down to species capable of interacting
with catalytic active sites while maintaining catalyst integrity.46 Emerging technolo-
gies have shown that high temperature decomposition (e.g. fast pyrolysis) pairs well
with the use of inorganic catalysts due to similar processing rates, occurring orders
of magnitude faster than existing biological processes (e.g. enzymatic hydrolysis).47,48 Recently, Huber et al. demonstrated mixed pyrolysis/catalysis by rapid heating
of cellulose particles in the presence of aluminosilicates (e.g. ZSM-5), which both
cracked large biopolymers and converted the organic intermediates to highly desir-
able gasoline-like aromatic species.49 Additionally, Schmidt et al. demonstrated that
alumina-supported reforming catalysts combined with cellulose pyrolysis efficiently
produce synthesis gas (H2 + CO) and allow for selective tuning of product ratios.36,45
However, the mechanism by which cellulose thermally decomposes to volatile or-
ganic compounds (VOCs) on catalytic surfaces for downstream processing is unknown,
hindering advancement of catalytic biomass reactors. The process generally occurs
by cellulose particles impacting a high temperature surface, driving endothermic py-
rolysis of the polymer structure to VOCs. These products are then convected from
the particle to the neighboring solid, interacting chemically with the catalyst sur-
face. Unknowns within this complex set of interacting phenomena are the dominant
method of heat transfer to particles (convection, radiation, or conduction), the state
of the cellulose particle over the course of conversion (solid or liquid), the extent of
particle homogeneity, the physical interaction between the particle and surface, and
the rate limiting phenomenon (pyrolysis or some mode of heat transfer). The com-
plex nature of the system prevents substantial understanding by transport models
integrating particle, surrounding gas, and surface chemistry.
This paper examines the conversion of cellulose particles in direct contact with
high-temperature catalytic reforming catalysts in the presence of oxygen. Small,
pure particles of cellulose on the length scale of 10 - 400 µm are observable under
significant optical and temporal magnification (1000 frames per second). Variation
of the catalytic surface between realistic porous foam supports and experimental flat
surfaces permits a clear observation of the particle/surface interaction. Additionally,
dimensional tracking of particles with time reveals the extent of conversion from solid
2.2 Experimental 17
cellulose to intermediate phases, and it permits an indirect measurement of surface-
to-particle heat transfer.
The results show that micron- to millimeter-scale particles decompose to an inter-
mediate liquid droplet before further decomposing and boiling completely to volatile
species. The intermediate particle predominately exists as a heterogeneous mixture
of solid and liquid with linear reduction in height with respect to time indicating a
potential for continuous processing of larger particles. Therefore, additional experi-
ments consider high temperature reforming catalysts in contact with large particles
(rods, 7 x 7 x 500 mm)that extend away from the surface permitting examination of
continuous catalytic processing of cellulose. The processing rate was measured as a
function of the interfacial temperature and the applied pressure between the cellulose
feedstock and the catalytic surface.
2.2 Experimental
Catalytic reforming of cellulose particles was examined in three separate experimental
apparatuses due to the significant difference in cellulose feedstock dimensions (micron-
versus centimeter-scale) and catalyst supports (foam versus flat surfaces).
2.2.1 Catalyst preparation
The catalyst in Figure 2.1(a) was supported on an 80 pores per inch (ppi) α-Al2O3
foam cylinder 17 mm in diameter and 10 mm in length with visible struts and tortuous
pores. The flat catalytic surface (wafer) in Figure 2.1(b) was prepared by compressing
α-Al2O3 powder into a disk 2 mm thick and 22 mm wide, sintering at 800 ◦C for 30
hrs and 1180 ◦C for 8 hrs. Both catalysts were prepared by wet impregnation of
Rh-Ce (2.5 wt% of the support each), drying, and calcination at 600 ◦C for 6 hrs.
2.2.2 Micron-scale particle processing on foam supports
Small particle (< 500 mm) autothermal conversion was examined in a 20 mm I.D.
quartz reactor tube described previously.36 Three foams were stacked on top of each
other along with a fourth blank 80 ppi foam on the bottom, wrapped in ceramic paper
(for friction fit), and slid into the reactor tube. A type-K thermocouple was inserted
10 mm from the leading surface. A 1 cm pyrex tube combined with a size 20 pyrex
reactor tube end cap provided the connection between the reactor and a cellulose
hopper necessary for solid particle delivery. A quartz light pipe was inserted through
2.2 Experimental 18
(a) (b)
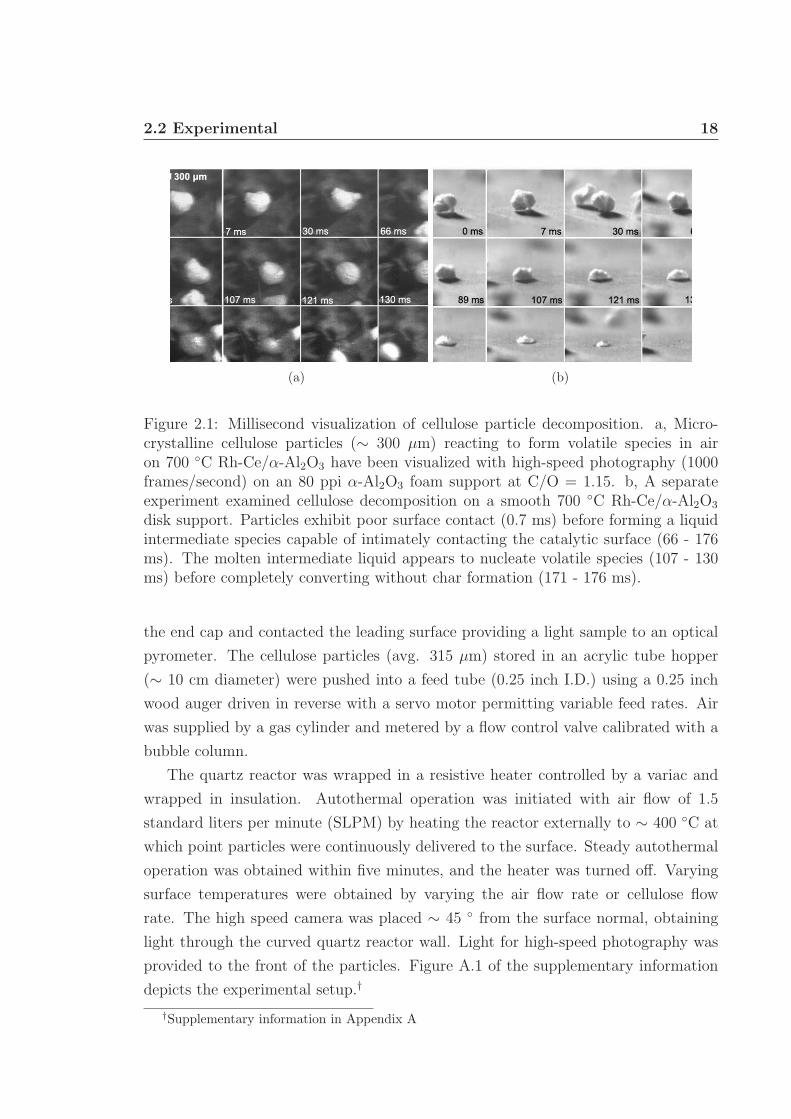
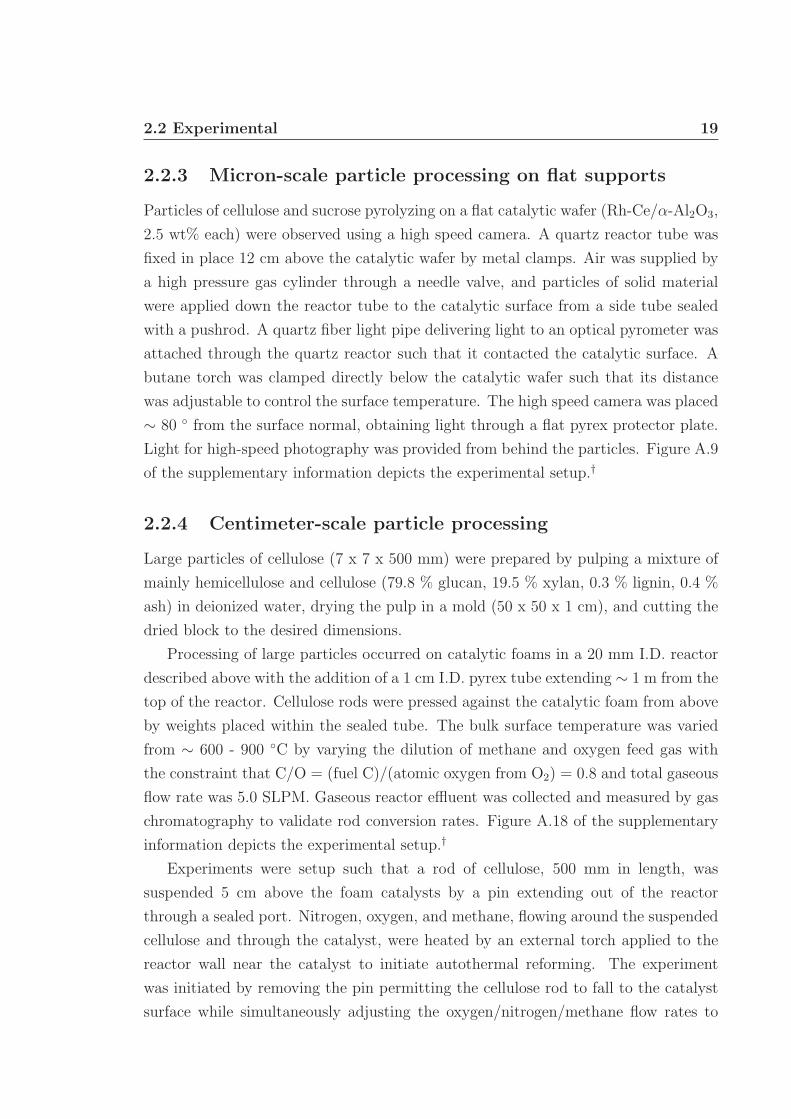
Figure 2.1: Millisecond visualization of cellulose particle decomposition. a, Micro-crystalline cellulose particles (∼ 300 µm) reacting to form volatile species in airon 700 ◦C Rh-Ce/α-Al2O3 have been visualized with high-speed photography (1000frames/second) on an 80 ppi α-Al2O3 foam support at C/O = 1.15. b, A separateexperiment examined cellulose decomposition on a smooth 700 ◦C Rh-Ce/α-Al2O3
disk support. Particles exhibit poor surface contact (0.7 ms) before forming a liquidintermediate species capable of intimately contacting the catalytic surface (66 - 176ms). The molten intermediate liquid appears to nucleate volatile species (107 - 130ms) before completely converting without char formation (171 - 176 ms).
the end cap and contacted the leading surface providing a light sample to an optical
pyrometer. The cellulose particles (avg. 315 µm) stored in an acrylic tube hopper
(∼ 10 cm diameter) were pushed into a feed tube (0.25 inch I.D.) using a 0.25 inch
wood auger driven in reverse with a servo motor permitting variable feed rates. Air
was supplied by a gas cylinder and metered by a flow control valve calibrated with a
bubble column.
The quartz reactor was wrapped in a resistive heater controlled by a variac and
wrapped in insulation. Autothermal operation was initiated with air flow of 1.5
standard liters per minute (SLPM) by heating the reactor externally to ∼ 400 ◦C at
which point particles were continuously delivered to the surface. Steady autothermal
operation was obtained within five minutes, and the heater was turned off. Varying
surface temperatures were obtained by varying the air flow rate or cellulose flow
rate. The high speed camera was placed ∼ 45 ◦ from the surface normal, obtaining
light through the curved quartz reactor wall. Light for high-speed photography was
provided to the front of the particles. Figure A.1 of the supplementary information
depicts the experimental setup.†
†Supplementary information in Appendix A
2.2 Experimental 19
2.2.3 Micron-scale particle processing on flat supports
Particles of cellulose and sucrose pyrolyzing on a flat catalytic wafer (Rh-Ce/α-Al2O3,
2.5 wt% each) were observed using a high speed camera. A quartz reactor tube was
fixed in place 12 cm above the catalytic wafer by metal clamps. Air was supplied by
a high pressure gas cylinder through a needle valve, and particles of solid material
were applied down the reactor tube to the catalytic surface from a side tube sealed
with a pushrod. A quartz fiber light pipe delivering light to an optical pyrometer was
attached through the quartz reactor such that it contacted the catalytic surface. A
butane torch was clamped directly below the catalytic wafer such that its distance
was adjustable to control the surface temperature. The high speed camera was placed
∼ 80 ◦ from the surface normal, obtaining light through a flat pyrex protector plate.
Light for high-speed photography was provided from behind the particles. Figure A.9
of the supplementary information depicts the experimental setup.†
2.2.4 Centimeter-scale particle processing
Large particles of cellulose (7 x 7 x 500 mm) were prepared by pulping a mixture of
mainly hemicellulose and cellulose (79.8 % glucan, 19.5 % xylan, 0.3 % lignin, 0.4 %
ash) in deionized water, drying the pulp in a mold (50 x 50 x 1 cm), and cutting the
dried block to the desired dimensions.
Processing of large particles occurred on catalytic foams in a 20 mm I.D. reactor
described above with the addition of a 1 cm I.D. pyrex tube extending ∼ 1 m from the
top of the reactor. Cellulose rods were pressed against the catalytic foam from above
by weights placed within the sealed tube. The bulk surface temperature was varied
from ∼ 600 - 900 ◦C by varying the dilution of methane and oxygen feed gas with
the constraint that C/O = (fuel C)/(atomic oxygen from O2) = 0.8 and total gaseous
flow rate was 5.0 SLPM. Gaseous reactor effluent was collected and measured by gas
chromatography to validate rod conversion rates. Figure A.18 of the supplementary
information depicts the experimental setup.†
Experiments were setup such that a rod of cellulose, 500 mm in length, was
suspended 5 cm above the foam catalysts by a pin extending out of the reactor
through a sealed port. Nitrogen, oxygen, and methane, flowing around the suspended
cellulose and through the catalyst, were heated by an external torch applied to the
reactor wall near the catalyst to initiate autothermal reforming. The experiment
was initiated by removing the pin permitting the cellulose rod to fall to the catalyst
surface while simultaneously adjusting the oxygen/nitrogen/methane flow rates to
2.3 Results and discussion 20
satisfy C/O = 0.8. The rate at which the cellulose sample ablated on the catalyst
was measured by recording the movement of the cellulose end as it passed graduations
on the feed tube with time. Downstream gas samples were collected and analyzed
by gas chromatography for carbon monoxide and carbon dioxide to verify carbon
processing rates.
2.2.5 High-speed photography
Digital video was obtained by focusing a Photron Fastcam Ultima APX with color
image through a curved quartz reactor or pyrex plate. The four optical devices placed
in series to obtain the presented magnification were: 1) a Micro-NIKKOR 105 mm
lens by Nikon of Japan, 2) a Nikon PN-11 extension tube by Nikon of Japan, 3) a
Kenko extension tube for Nikon/AF 36 mm by Kenko of Japan, and 4) a Kenko 2x
Teleplus MC7 telephoto extension tube by Kenko of Japan. Light was provided to the
catalyst necessary for high speed imaging by a Solarc Light LB-50 by Welch Allyn,
Inc. of New York, USA.
Visualization videos of particle conversion on catalytic foams were collected through
the 2 mm thick quartz reactor tube, while particles on wafers were obtained through
0.5 cm pyrex glass used to protect the camera. Particle sizes were obtained by relating
the measured number of pixels within a frame to known sizes of objects (thermocouple
or quartz light pipe).
2.3 Results and discussion
In the integrated pyrolysis/catalysis process examined here, particles of cellulose in air
impact a glowing (∼ 700 ◦C) Rh-Ce/α-Al2O3 foam catalyst in a quartz reactor tube
and pyrolyze completely under extreme thermal gradients to VOCs at millisecond
time-scales. The VOCs flow into the catalyst, react with oxygen exothermically, and
generate sufficient heat to maintain the catalyst at 700 - 800 ◦C driving endothermic
pyrolysis in an overall exothermic, autothermal process.36 This arrangement has been
shown to efficiently produce equilibrium selectivity to clean synthesis gas without
detectable char formation.45
Through the use of ultra high-speed imaging (1000 frames per second) we defini-
tively demonstrate the existence of a liquid intermediate during the rapid heating of
cellulose particles. Figure 2.1(a) shows the conversion of a single ∼ 300 µm diameter
cellulose particle on an operating foam catalyst at ∼ 700 ◦C from ∼ 45 ◦ relative
2.3 Results and discussion 21
to the catalyst surface. After coming to rest on the surface (0 ms), the particle ap-
pears to initially rotate (7 & 30 ms) before the appearance of a smooth liquid layer
along the bottom right edge (66 ms) distinguishable by its specular highlight. The
development of a liquid phase continues to progress from the bottom of the particle
(89 & 107 ms) until the entire particle exists as a hemispherical liquid droplet (121
ms). Clearly visible within the liquid layer are gaseous bubbles developing within
the liquid sphere (107, 121, and 130 ms) moving to the surface and eventually the
surrounding gas until the entire particle volatilizes leaving a clean surface (171 ms).
In a different experiment (Fig. 2.1(b)) we examined the impact of cellulose parti-
cles in air on a flat Rh-Ce/α-Al2O3 surface heated from below by a butane torch to
700 ◦C. Viewed at 80 ◦ from the surface normal, the particle initially exhibits poor
surface contact (0.7 ms) before forming a liquid clearly in intimate contact with the
catalyst (66 - 107 ms). Conversion to a liquid at 130 ms produces a hemispherical
shape, which fully volatilizes leaving a clean surface at 176 ms.
The existence of a liquid intermediate from cellulose, often referred to as “active
cellulose,” has elicited controversy.50–53 Several multi-step cellulose decomposition
mechanisms include an intermediate cellulose-like biopolymer of reduced degree of
polymerization to fit empirical data.54–57 Further depolymerization and fragmenta-
tion to organic liquids (e.g. methanol, hydroxyacetaldehyde, levoglucosan) dominates
around 500 ◦C in seconds, while higher temperatures favor gases (e.g. CO, H2, CO2)
and lower temperatures favor dehydration chemistry to solid char. Previous evidence
for depolymerized liquid intermediate formation was observed by showing that cel-
lulose rods, similar to ice or meltable polymers, can be ablated on hot surfaces.58 A
different set of experiments exposed small particles of cellulose to very short dura-
tions of applied heat and observed solid products with smooth surfaces, indicative of
intermediate liquids.51,59 However, the present evidence clearly shows a liquid state
forming spherical conformations and interacting with surfaces and other particles.†
Dimensional tracking of several particles (Fig. 2.2(a)) on the catalytic foam shows
that the conversion time is directly proportional to the square of the initial particle
diameter, even for particles as small as 100 µm. Furthermore, measurements shown
in Figure 2.2(b) (height and width) depict the lifetime of both particles in Figure 2.1
and reveal three stages in particle volatilization. In region A, the particle exhibits
poor surface contact and no apparent change in size. In region B, intermediate liquid
formation propagates up the particle, coinciding with a nearly linear reduction in
height. Finally, in region C, the liquid droplet undergoes further pyrolysis to gases
and volatile organics, exhibiting constant decrease in width and volume as shown in
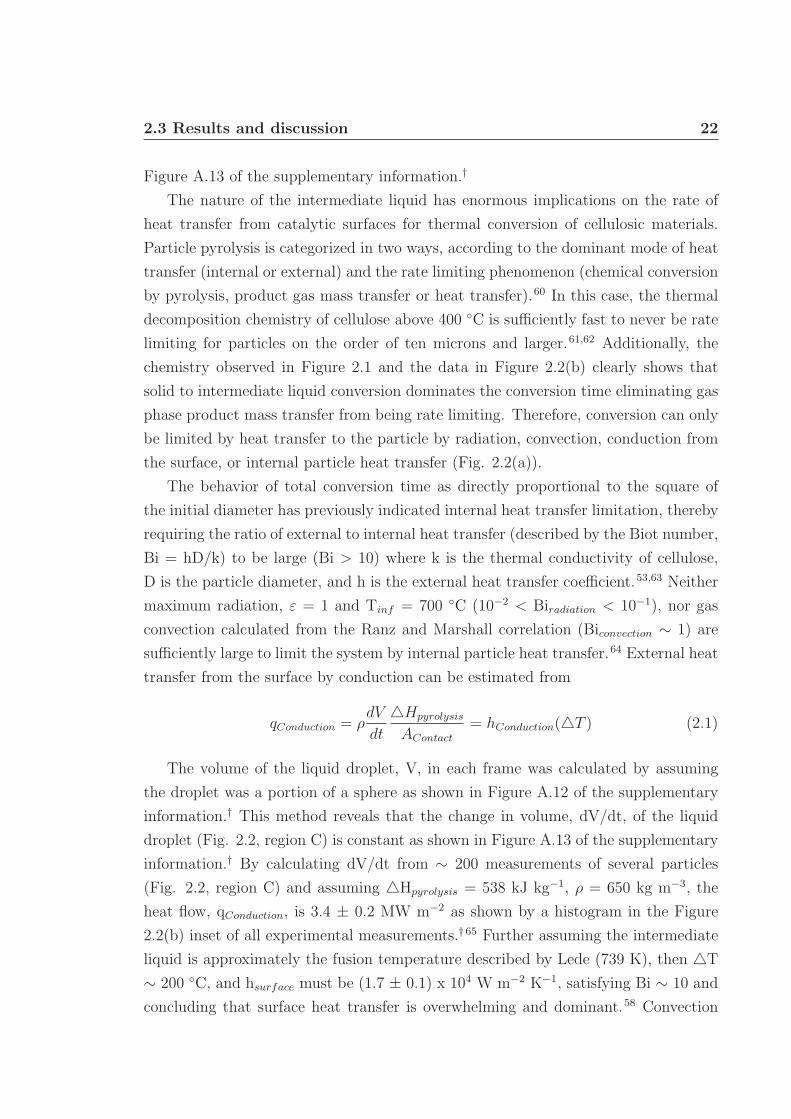
2.3 Results and discussion 22
Figure A.13 of the supplementary information.†
The nature of the intermediate liquid has enormous implications on the rate of
heat transfer from catalytic surfaces for thermal conversion of cellulosic materials.
Particle pyrolysis is categorized in two ways, according to the dominant mode of heat
transfer (internal or external) and the rate limiting phenomenon (chemical conversion
by pyrolysis, product gas mass transfer or heat transfer).60 In this case, the thermal
decomposition chemistry of cellulose above 400 ◦C is sufficiently fast to never be rate
limiting for particles on the order of ten microns and larger.61,62 Additionally, the
chemistry observed in Figure 2.1 and the data in Figure 2.2(b) clearly shows that
solid to intermediate liquid conversion dominates the conversion time eliminating gas
phase product mass transfer from being rate limiting. Therefore, conversion can only
be limited by heat transfer to the particle by radiation, convection, conduction from
the surface, or internal particle heat transfer (Fig. 2.2(a)).
The behavior of total conversion time as directly proportional to the square of
the initial diameter has previously indicated internal heat transfer limitation, thereby
requiring the ratio of external to internal heat transfer (described by the Biot number,
Bi = hD/k) to be large (Bi > 10) where k is the thermal conductivity of cellulose,
D is the particle diameter, and h is the external heat transfer coefficient.53,63 Neither
maximum radiation, ε = 1 and Tinf = 700 ◦C (10−2 < Biradiation < 10−1), nor gas
convection calculated from the Ranz and Marshall correlation (Biconvection ∼ 1) are
sufficiently large to limit the system by internal particle heat transfer.64 External heat
transfer from the surface by conduction can be estimated from
qConduction = ρdV
dt
△Hpyrolysis
AContact
= hConduction(△T ) (2.1)
The volume of the liquid droplet, V, in each frame was calculated by assuming
the droplet was a portion of a sphere as shown in Figure A.12 of the supplementary
information.† This method reveals that the change in volume, dV/dt, of the liquid
droplet (Fig. 2.2, region C) is constant as shown in Figure A.13 of the supplementary
information.† By calculating dV/dt from ∼ 200 measurements of several particles
(Fig. 2.2, region C) and assuming △Hpyrolysis = 538 kJ kg−1, ρ = 650 kg m−3, the
heat flow, qConduction, is 3.4 ± 0.2 MW m−2 as shown by a histogram in the Figure
2.2(b) inset of all experimental measurements.† 65 Further assuming the intermediate
liquid is approximately the fusion temperature described by Lede (739 K), then △T
∼ 200 ◦C, and hsurface must be (1.7 ± 0.1) x 104 W m−2 K−1, satisfying Bi ∼ 10 and
concluding that surface heat transfer is overwhelming and dominant.58 Convection
2.3 Results and discussion 23
(a) (b)
Figure 2.2: Dimensional tracking of cellulose particle conversion for surface heat fluxestimation. (a) The time for observed particles to completely convert was proportionalto the square of the initial particle diameter (Tc =kD2
◦) consistent with internalparticle heat transfer control thereby requiring the ratio of external to internal heattransfer (Biot Number) to be larger than ∼ 10. Only a conductive heat transfercoefficient of h = 104 - 105 W m−2 K−1(shaded region) can result in a Biot >> 1describing the thermal and reacting wave observed in Figure 1. (b), The conversionof a single cellulose particle (∼ 300 µm) on a 700 ◦C surface appears to occur inthree phases (A, B, and C) shown as a cartoon and described by height and width forflat surfaces (data points) and foams (grey line). (A) Initial impact with a catalyticsurface exhibits very poor surface contact and slow initial heating. (B) Particle surfacecontact points eventually pyrolyze to a biopolymer liquid (active cellulose) which cancontact the surface and permit rapid pyrolysis with a linear decrease in height. Gasnucleation was observed in the height around 140 - 150 ms. (C) An active cellulosedrop exhibits linear decrease in volume (and radius of curvature) with time and anenormous heat flux of 3.4 ± 0.2 MW m−2 (inset).
2.3 Results and discussion 24
and radiation are included by this method of estimating the heat transfer rate, but
their magnitude is on the order of the experimental error or less.
The mechanism permitting high conductive heat transfer to the particle can be
observed in Figure 2.1. Droplets of volatile fluids such as glycerol, heptane, or dode-
cane commonly exhibit film boiling (the Leidenfrost effect) which lift them off very
hot surfaces, slowing conductive heat transfer.† 66,67 However, experiments with cel-
lulose (and additional experiments with sucrose available as Figures A.15 and A.16
in the supplementary information†) show that the liquid intermediate on a ∼ 700 ◦C
catalytic surface maintains contact, dramatically improving conductive heat transfer
to the particle.
High heat flux through an intermediate liquid species has unique implications for
the chemistry of cellulose decomposition. As observed in Figure 2.1, cellulose con-
version occurs as a thermal wave passing through the particle. For small particles
considered here (< 500 µm), no portion of the particle exists sufficiently long at low
temperature (∼ 300 - 400 ◦C) for char forming chemistry to occur appreciably. How-
ever, as a particle increases in size to 1 mm or greater (e.g. wood chips), it becomes
unavoidable that a portion of the solid biopolymer away from the hot surface will exist
within the char-producing temperature range. One demonstrated solution to this fun-
damental problem utilizes high heat transfer rates between a large (thermally-thick)
particle and a hot non-catalytic surface moving relative to the sample to mechanically
sweep away pyrolysis products.68–70 However, more simple processing of cellulose can
occur with a stationary surface utilizing a catalyst on a porous surface.
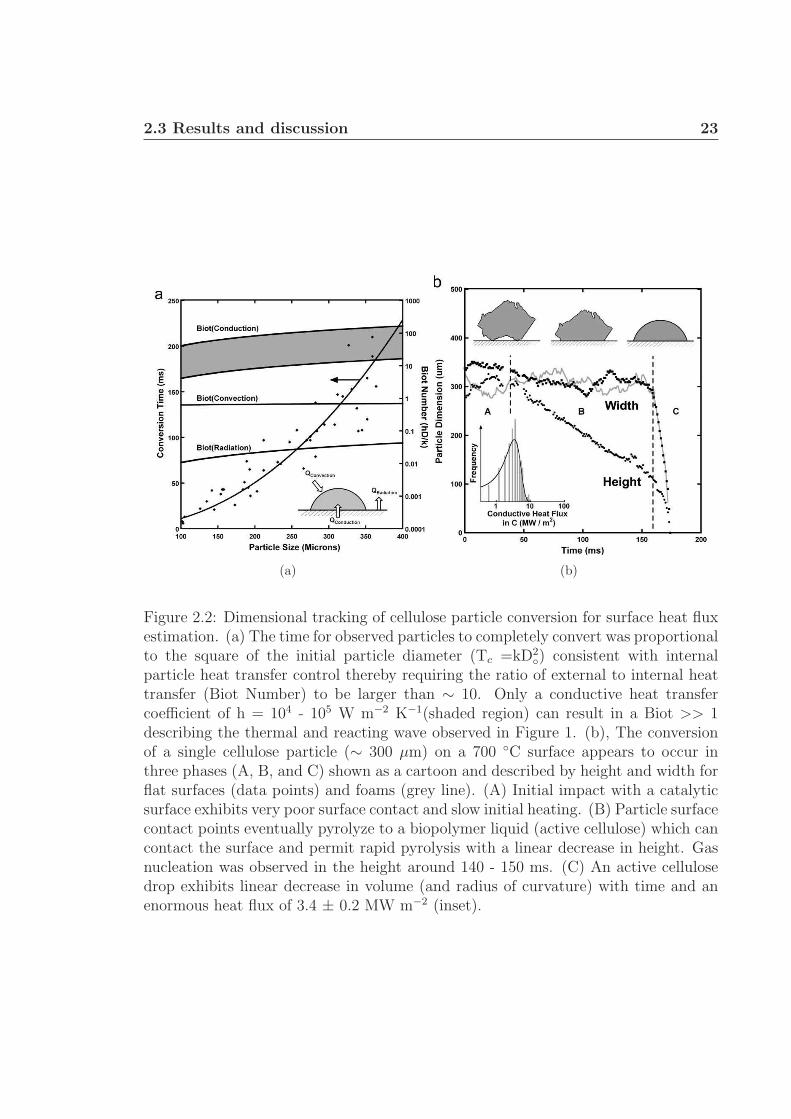
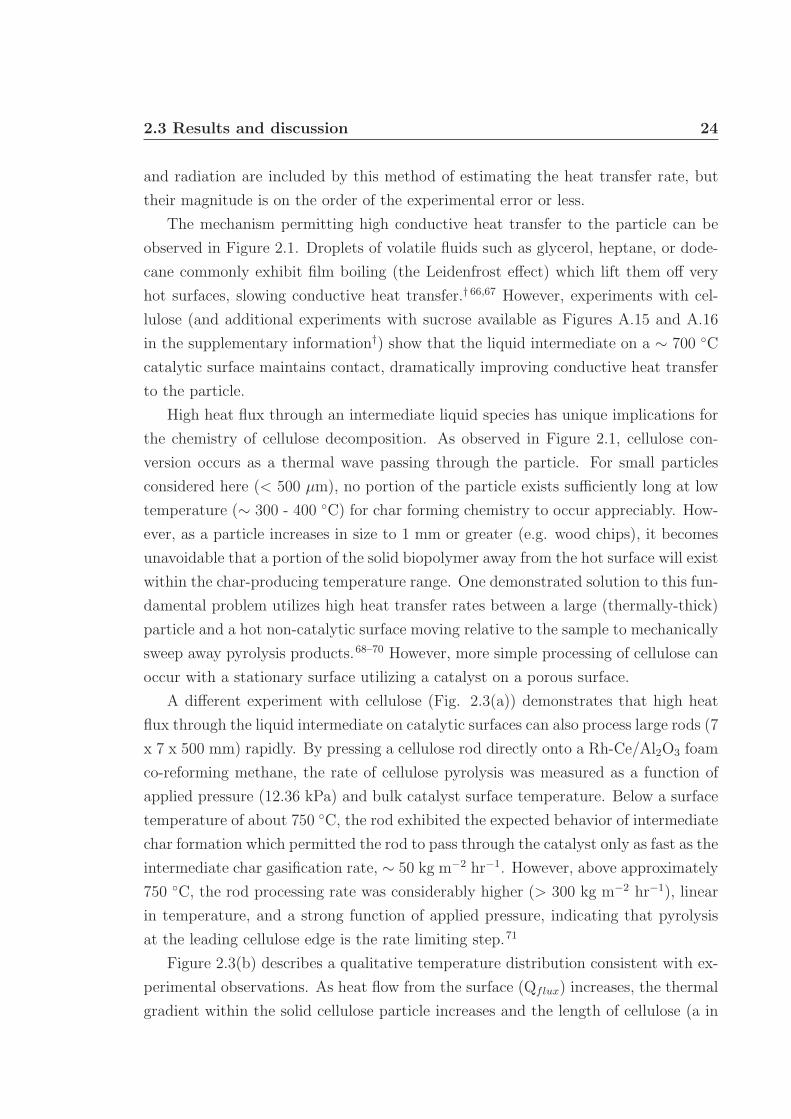
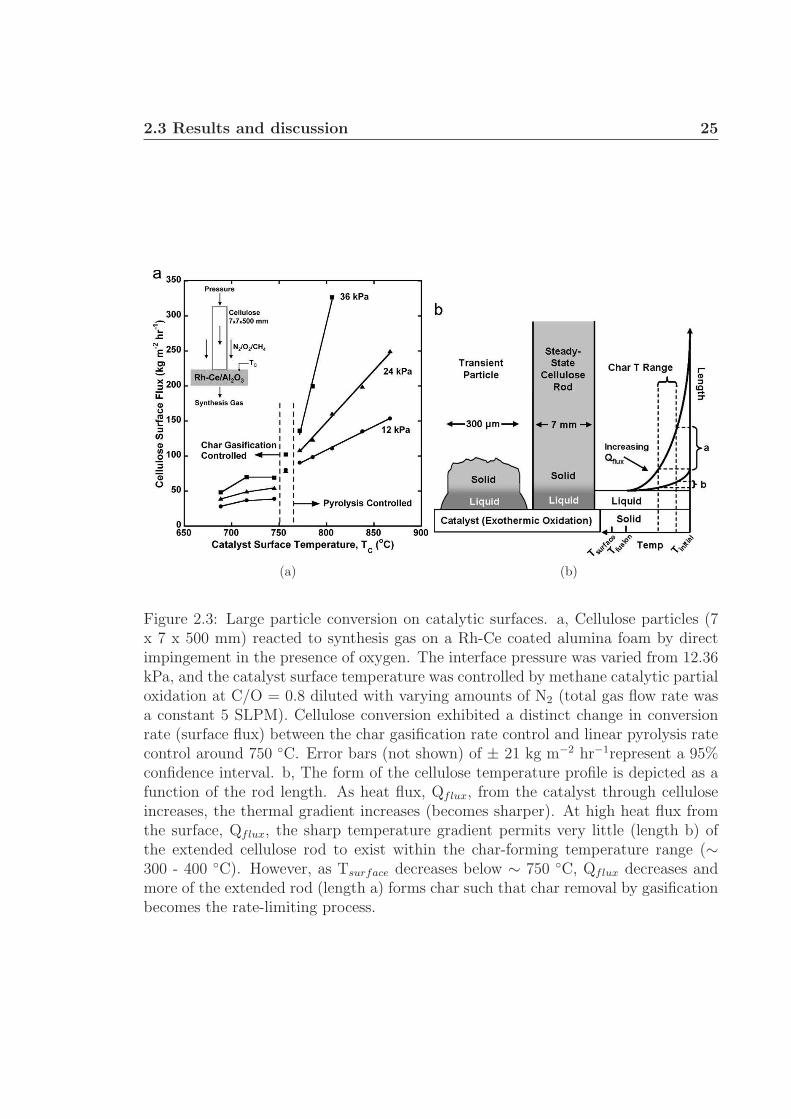
A different experiment with cellulose (Fig. 2.3(a)) demonstrates that high heat
flux through the liquid intermediate on catalytic surfaces can also process large rods (7
x 7 x 500 mm) rapidly. By pressing a cellulose rod directly onto a Rh-Ce/Al2O3 foam
co-reforming methane, the rate of cellulose pyrolysis was measured as a function of
applied pressure (12.36 kPa) and bulk catalyst surface temperature. Below a surface
temperature of about 750 ◦C, the rod exhibited the expected behavior of intermediate
char formation which permitted the rod to pass through the catalyst only as fast as the
intermediate char gasification rate, ∼ 50 kg m−2 hr−1. However, above approximately
750 ◦C, the rod processing rate was considerably higher (> 300 kg m−2 hr−1), linear
in temperature, and a strong function of applied pressure, indicating that pyrolysis
at the leading cellulose edge is the rate limiting step.71
Figure 2.3(b) describes a qualitative temperature distribution consistent with ex-
perimental observations. As heat flow from the surface (Qflux) increases, the thermal
gradient within the solid cellulose particle increases and the length of cellulose (a in
2.3 Results and discussion 25
(a) (b)
Figure 2.3: Large particle conversion on catalytic surfaces. a, Cellulose particles (7x 7 x 500 mm) reacted to synthesis gas on a Rh-Ce coated alumina foam by directimpingement in the presence of oxygen. The interface pressure was varied from 12.36kPa, and the catalyst surface temperature was controlled by methane catalytic partialoxidation at C/O = 0.8 diluted with varying amounts of N2 (total gas flow rate wasa constant 5 SLPM). Cellulose conversion exhibited a distinct change in conversionrate (surface flux) between the char gasification rate control and linear pyrolysis ratecontrol around 750 ◦C. Error bars (not shown) of ± 21 kg m−2 hr−1represent a 95%confidence interval. b, The form of the cellulose temperature profile is depicted as afunction of the rod length. As heat flux, Qflux, from the catalyst through celluloseincreases, the thermal gradient increases (becomes sharper). At high heat flux fromthe surface, Qflux, the sharp temperature gradient permits very little (length b) ofthe extended cellulose rod to exist within the char-forming temperature range (∼300 - 400 ◦C). However, as Tsurface decreases below ∼ 750 ◦C, Qflux decreases andmore of the extended rod (length a) forms char such that char removal by gasificationbecomes the rate-limiting process.
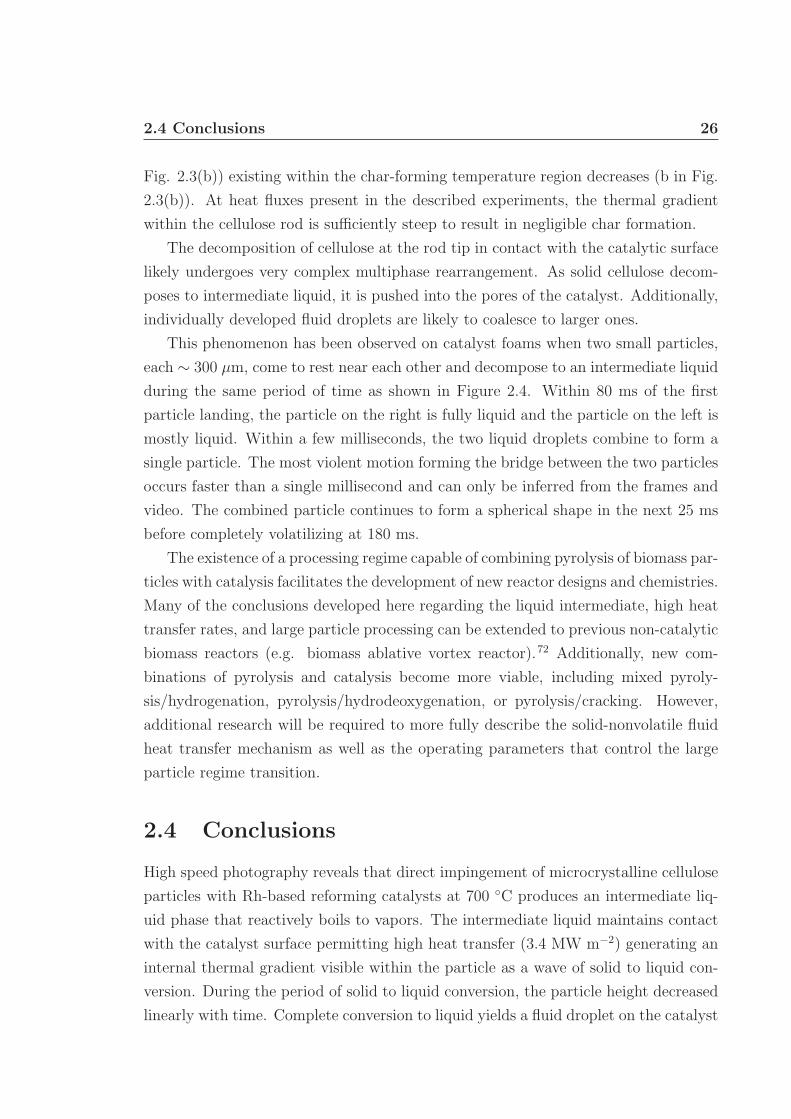
2.4 Conclusions 26
Fig. 2.3(b)) existing within the char-forming temperature region decreases (b in Fig.
2.3(b)). At heat fluxes present in the described experiments, the thermal gradient
within the cellulose rod is sufficiently steep to result in negligible char formation.
The decomposition of cellulose at the rod tip in contact with the catalytic surface
likely undergoes very complex multiphase rearrangement. As solid cellulose decom-
poses to intermediate liquid, it is pushed into the pores of the catalyst. Additionally,
individually developed fluid droplets are likely to coalesce to larger ones.
This phenomenon has been observed on catalyst foams when two small particles,
each ∼ 300 µm, come to rest near each other and decompose to an intermediate liquid
during the same period of time as shown in Figure 2.4. Within 80 ms of the first
particle landing, the particle on the right is fully liquid and the particle on the left is
mostly liquid. Within a few milliseconds, the two liquid droplets combine to form a
single particle. The most violent motion forming the bridge between the two particles
occurs faster than a single millisecond and can only be inferred from the frames and
video. The combined particle continues to form a spherical shape in the next 25 ms
before completely volatilizing at 180 ms.
The existence of a processing regime capable of combining pyrolysis of biomass par-
ticles with catalysis facilitates the development of new reactor designs and chemistries.
Many of the conclusions developed here regarding the liquid intermediate, high heat
transfer rates, and large particle processing can be extended to previous non-catalytic
biomass reactors (e.g. biomass ablative vortex reactor).72 Additionally, new com-
binations of pyrolysis and catalysis become more viable, including mixed pyroly-
sis/hydrogenation, pyrolysis/hydrodeoxygenation, or pyrolysis/cracking. However,
additional research will be required to more fully describe the solid-nonvolatile fluid
heat transfer mechanism as well as the operating parameters that control the large
particle regime transition.
2.4 Conclusions
High speed photography reveals that direct impingement of microcrystalline cellulose
particles with Rh-based reforming catalysts at 700 ◦C produces an intermediate liq-
uid phase that reactively boils to vapors. The intermediate liquid maintains contact
with the catalyst surface permitting high heat transfer (3.4 MW m−2) generating an
internal thermal gradient visible within the particle as a wave of solid to liquid con-
version. During the period of solid to liquid conversion, the particle height decreased
linearly with time. Complete conversion to liquid yields a fluid droplet on the catalyst
2.4 Conclusions 27
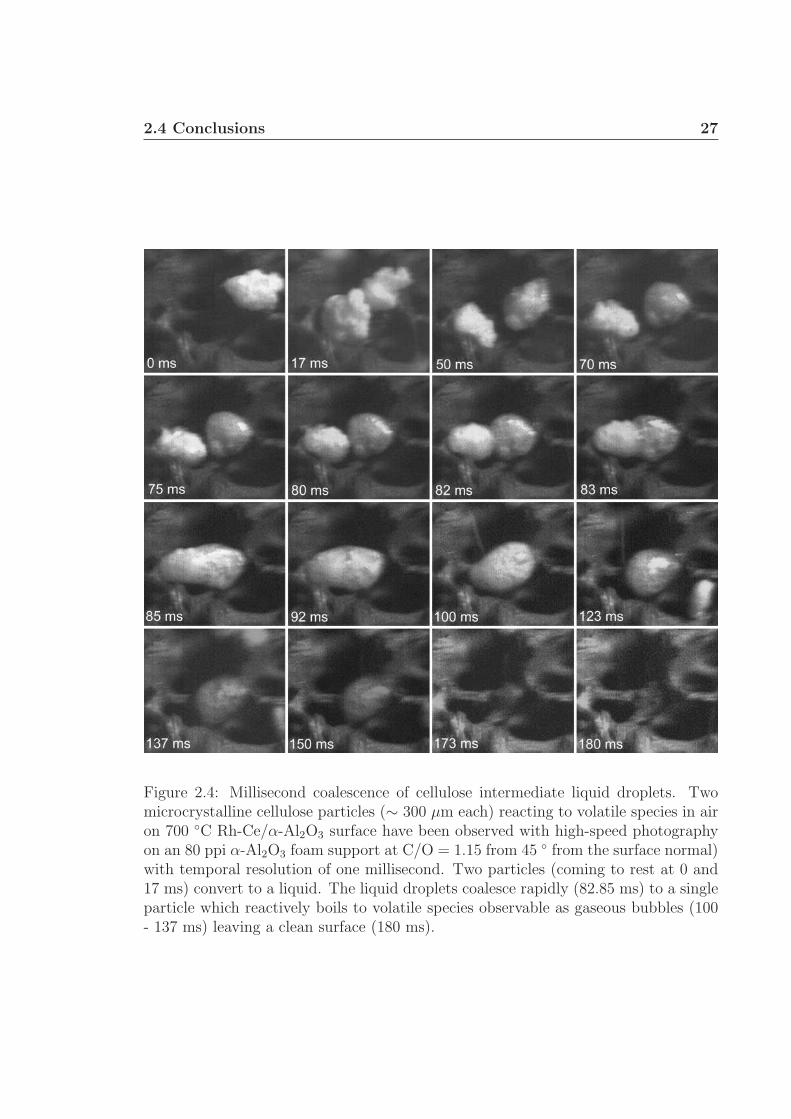
Figure 2.4: Millisecond coalescence of cellulose intermediate liquid droplets. Twomicrocrystalline cellulose particles (∼ 300 µm each) reacting to volatile species in airon 700 ◦C Rh-Ce/α-Al2O3 surface have been observed with high-speed photographyon an 80 ppi α-Al2O3 foam support at C/O = 1.15 from 45 ◦ from the surface normal)with temporal resolution of one millisecond. Two particles (coming to rest at 0 and17 ms) convert to a liquid. The liquid droplets coalesce rapidly (82.85 ms) to a singleparticle which reactively boils to volatile species observable as gaseous bubbles (100- 137 ms) leaving a clean surface (180 ms).
2.5 Acknowledgments 28
surface exhibiting linear decrease in droplet volume with time leaving behind a clean
surface absent solid residue (char). Under specific interfacial conditions, conversion
with large cellulosic particles on the length-scale of wood chips occurs continuously
as generated liquid and vapors are pushed into the porous surface.
2.5 Acknowledgments
We acknowledge funding from the U.S. Department of Energy and the Initiative for
Renewable Energy and the Environment (IREE) at the University of Minnesota. We
also acknowledge assistance from Professor Ulrike Tschirner in preparing and analyz-
ing cellulose samples. We also thank Jennifer Dederich for photographic assistance.
CHAPTER
THREE
AUTOTHERMAL OXIDATIVE PYROLYSIS OF
MONOAROMATICS OVER NOBLE METALS 1
To examine the possiblity of processing lignocellulosic biomass by oxidative pyroly-
sis, model compounds are vital to simplify experiments and provide clear insights.
As discussed in Section 1.1.3, lignin is a complex structure of aromatics and a vari-
ety of functional groups. Benzene, toluene, ethylbenzene, cumene, and styrene were
chosen as lignin surrogates for the research presented in this chapter. The autother-
mal oxidative pyrolysis these monoaromatics were independently studied over five
noble metal-based catalysts: Pt, Rh, Rh/γ-Al2O3, Rh-Ce, and Rh-Ce/γ-Al2O3, as
a function of carbon-to-oxygen feed ratio. The Rh-Ce/γ-Al2O3 catalyst exhibited
the highest feedstock conversion as well as selectivities to both synthesis gas and
hydrocarbon products (lowest selectivities to H2O and CO2). Experimental results
demonstrate a high stability of aromatic rings within the reactor system. Benzene
and toluene appear to react primarily heterogeneously, producing only syngas and
combustion products. Ethylbenzene and cumene behaved similarly, with higher con-
versions than benzene and toluene, and high product selectivity to styrene, likely
due to homogeneous reactions involving their alkyl groups. Styrene exhibited low
conversions over Rh-Ce/γ-Al2O3, emphasizing the stability of styrene in the reactor
system.
1Portions of this chapter appear in C.M. Balonek, J.L. Colby, L.D. Schmidt, “Millisecond cat-alytic reforming of monoaromatics over noble metals,” AIChE Journal 56 (2010) 979-988. c© 2009American Institute of Chemical Engineers.
29
3.1 Introduction 30
3.1 Introduction
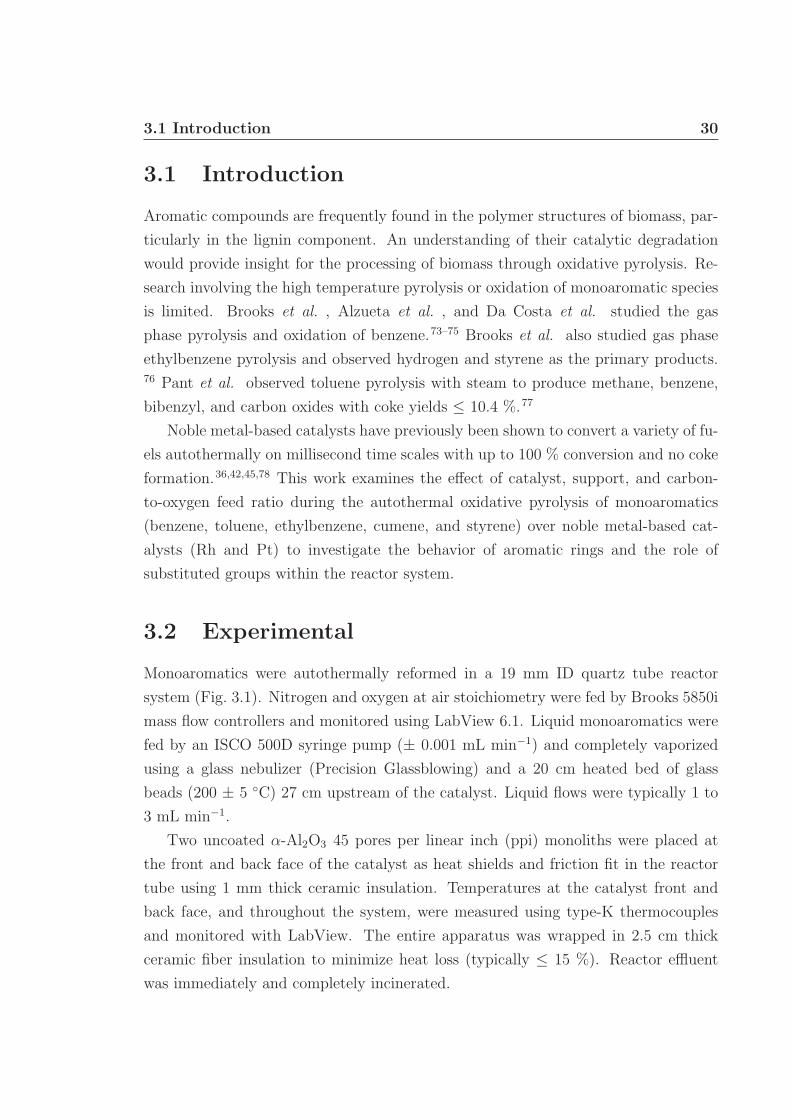
Aromatic compounds are frequently found in the polymer structures of biomass, par-
ticularly in the lignin component. An understanding of their catalytic degradation
would provide insight for the processing of biomass through oxidative pyrolysis. Re-
search involving the high temperature pyrolysis or oxidation of monoaromatic species
is limited. Brooks et al. , Alzueta et al. , and Da Costa et al. studied the gas
phase pyrolysis and oxidation of benzene.73–75 Brooks et al. also studied gas phase
ethylbenzene pyrolysis and observed hydrogen and styrene as the primary products.76 Pant et al. observed toluene pyrolysis with steam to produce methane, benzene,
bibenzyl, and carbon oxides with coke yields ≤ 10.4 %.77
Noble metal-based catalysts have previously been shown to convert a variety of fu-
els autothermally on millisecond time scales with up to 100 % conversion and no coke
formation.36,42,45,78 This work examines the effect of catalyst, support, and carbon-
to-oxygen feed ratio during the autothermal oxidative pyrolysis of monoaromatics
(benzene, toluene, ethylbenzene, cumene, and styrene) over noble metal-based cat-
alysts (Rh and Pt) to investigate the behavior of aromatic rings and the role of
substituted groups within the reactor system.
3.2 Experimental
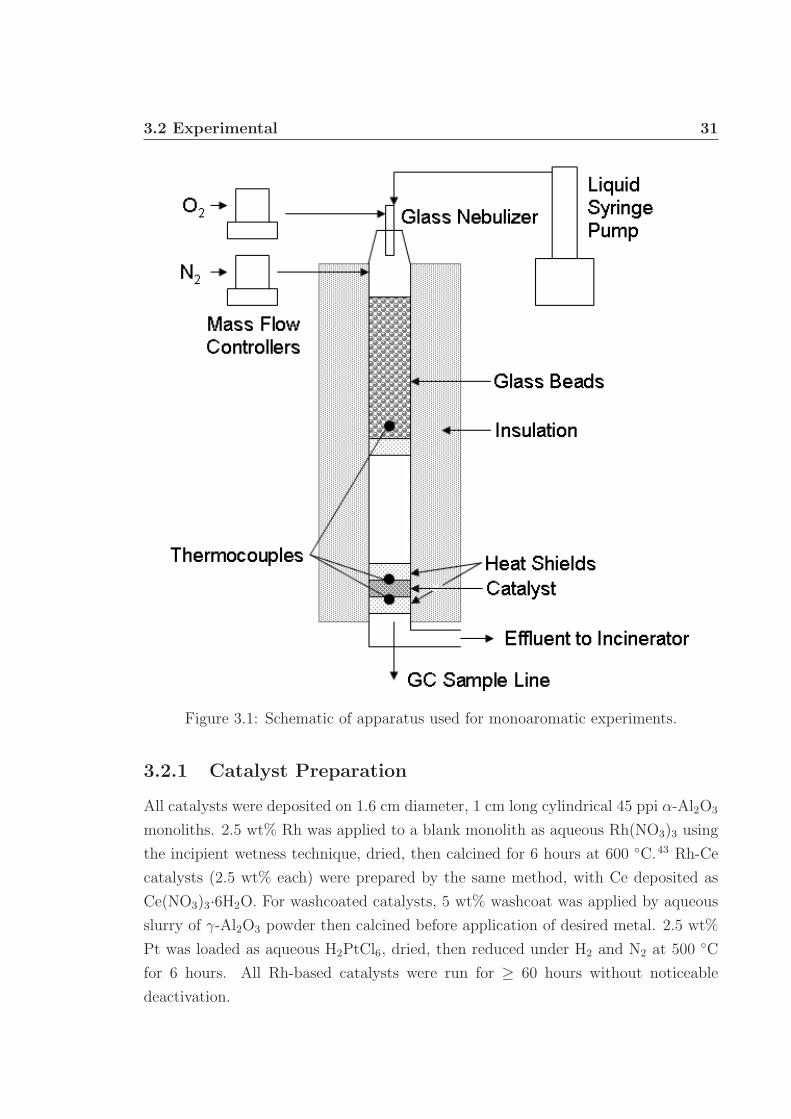
Monoaromatics were autothermally reformed in a 19 mm ID quartz tube reactor
system (Fig. 3.1). Nitrogen and oxygen at air stoichiometry were fed by Brooks 5850i
mass flow controllers and monitored using LabView 6.1. Liquid monoaromatics were
fed by an ISCO 500D syringe pump (± 0.001 mL min−1) and completely vaporized
using a glass nebulizer (Precision Glassblowing) and a 20 cm heated bed of glass
beads (200 ± 5 ◦C) 27 cm upstream of the catalyst. Liquid flows were typically 1 to
3 mL min−1.
Two uncoated α-Al2O3 45 pores per linear inch (ppi) monoliths were placed at
the front and back face of the catalyst as heat shields and friction fit in the reactor
tube using 1 mm thick ceramic insulation. Temperatures at the catalyst front and
back face, and throughout the system, were measured using type-K thermocouples
and monitored with LabView. The entire apparatus was wrapped in 2.5 cm thick
ceramic fiber insulation to minimize heat loss (typically ≤ 15 %). Reactor effluent
was immediately and completely incinerated.
3.2 Experimental 31
Figure 3.1: Schematic of apparatus used for monoaromatic experiments.
3.2.1 Catalyst Preparation
All catalysts were deposited on 1.6 cm diameter, 1 cm long cylindrical 45 ppi α-Al2O3
monoliths. 2.5 wt% Rh was applied to a blank monolith as aqueous Rh(NO3)3 using
the incipient wetness technique, dried, then calcined for 6 hours at 600 ◦C.43 Rh-Ce
catalysts (2.5 wt% each) were prepared by the same method, with Ce deposited as
Ce(NO3)3·6H2O. For washcoated catalysts, 5 wt% washcoat was applied by aqueous
slurry of γ-Al2O3 powder then calcined before application of desired metal. 2.5 wt%
Pt was loaded as aqueous H2PtCl6, dried, then reduced under H2 and N2 at 500 ◦C
for 6 hours. All Rh-based catalysts were run for ≥ 60 hours without noticeable
deactivation.
3.2 Experimental 32
3.2.2 Reactor Startup and Operation
The apparatus was first externally heated under nitrogen flow sufficiently above the
boiling point of the liquid feed. The desired flow conditions were chosen based on
the feed C/O ratio, defined as the ratio of the inlet carbon atoms to the inlet oxygen
atoms. C/O ratios between 1.0 (fuel lean) and 3.0 (fuel rich), in increments of 0.2,
were tested for each feed and catalyst combination. The total inlet flow was held
constant at 4 SLPM with N2 and O2 at air stoichiometry. C/O = 1.6 was chosen for
reactor startup to be outside the combustion zone and to prevent coke formation.
Once the reactor was heated and the desired feed ratio was flowing, an isolated
portion of the catalyst was heated externally to ∼ 250 ◦C with a butane torch to begin
autothermal catalytic reaction of the feed. The heat and reaction then propagated
throughout the catalyst bed, noted by a dramatic increase in catalyst temperature.
After reactor startup, the system was allowed to reach steady state for 30 minutes
before data acquisition.
Reactor shutdown was initiated by turning off the oxygen, followed by the liquid
feed. Nitrogen was flowed at 2 SLPM until the entire system cooled below 150 ◦C.
3.2.3 Data Acquisition and Analysis
Products were sampled directly below the catalyst bed through a quartz capillary to
a stainless steel line heated to 200 ± 5 ◦C, preventing effluent condensation. The res-
idence time in the sample line was varied to confirm there was negligible downstream
chemistry during sampling.
An HP 6890 Gas Chromatograph equipped with autosampling, a 30 m, 320 µm ID
HP-Plot Q capillary column, and a thermal conductivity detector was used to identify
and quantify permanent gases, C2 hydrocarbons, and unreacted monoaromatics.
Three effluent samples (generally ≤ 5 % carbon error each) were analyzed and
averaged for each data point. Product selectivities were measured and defined as
the ratio of atoms in the product species to the atoms in the converted aromatic
feed. Unidentified effluent species were grouped according to number of carbon atoms
(verified by a separate HP 5890 Gas Chromatograph Mass Spectrometer with the
same column) and used to estimate carbon error. To ensure data reproducibility and
negligible catalyst deactivation, C/O ratios were repeated periodically and duplicate
catalysts were tested.
3.3 Results 33
3.3 Results
Each of the five monoaromatic feeds were tested on each of the five noble metal-
based catalysts. Benzene, toluene, ethylbenzene, and cumene were run stably on
all Rh-based catalysts with no observable coke formation. Experiments on Pt cata-
lysts were unsuccessful due to coking and will not be included in references to “all
data/experiments” hereafter. Styrene was run without severe coke formation on Rh-
Ce/γ-Al2O3 only.
3.3.1 Catalyst Temperatures
Catalyst back face temperatures were consistently hotter than the front face and
both temperatures decreased as C/O ratio increased for all experiments (Fig. 3.2). All
feeds produced similar catalyst temperatures, although benzene and toluene typically
had higher temperatures than ethylbenzene and cumene (∼ 50 - 100 ◦C). The Rh
catalyst had the smallest axial temperature gradient, as well as the lowest back face
temperatures. Generally, catalyst back face temperatures increased and front face
temperatures decreased in the order of Rh/γ-Al2O3, Rh-Ce, and Rh-Ce/γ-Al2O3.
3.3.2 Conversion
Conversion of each feed decreased as C/O ratio increased (Fig. 3.3). Benzene and
toluene behaved very similarly on all catalysts with the lowest conversions of all fuels.
Ethylbenzene and cumene had consistently higher conversion, reaching 100 % at low
C/O ratios on some catalysts. Styrene conversions on Rh-Ce/γ-Al2O3 were similar
to benzene and toluene. Conversion increased in the order of Rh < Rh/γ-Al2O3 <
Rh-Ce < Rh-Ce/γ-Al2O3.
3.3.3 Hydrogen Selectivity
Benzene and toluene produced similar selectivity to hydrogen-containing products, as
did ethylbenzene and cumene. For all experiments, hydrogen selectivity to H2 (SH2)
decreased with increasing C/O ratio (Fig. 3.4 and 3.5). As benzene and toluene
generally produced only hydrogen and water, changes in SH2were met with equal
and opposite changes in selectivity to water. Ethylbenzene and cumene had lower
SH2, as a variety of hydrocarbons were observed in the effluent. Styrene converted on
Rh-Ce/γ-Al2O3 had a large range of values for SH2, varying between ∼ 20 and 80 %
over all C/O ratios.
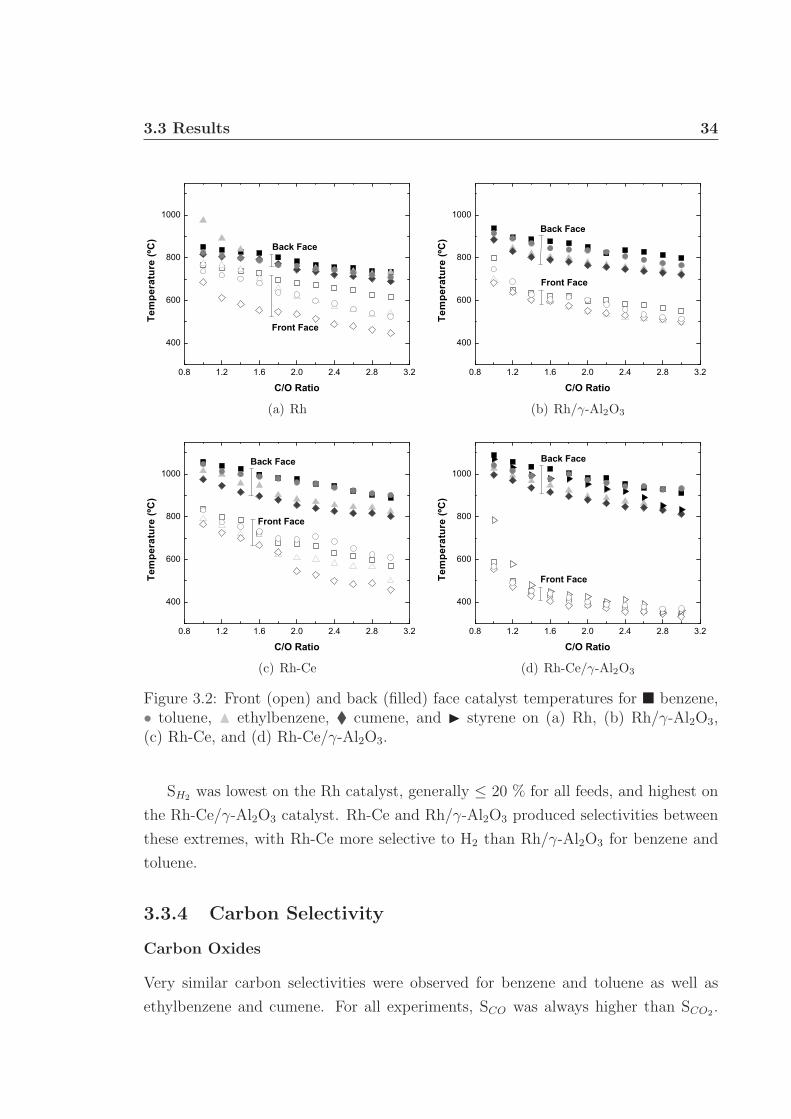
3.3 Results 34
0.8 1.2 1.6 2.0 2.4 2.8 3.2
400
600
800
1000
Front Face
Back Face
Tem
pera
ture
(ºC
)
C/O Ratio
(a) Rh
0.8 1.2 1.6 2.0 2.4 2.8 3.2
400
600
800
1000
Tem
pera
ture
(ºC
)
C/O Ratio
Front Face
Back Face
(b) Rh/γ-Al2O3
0.8 1.2 1.6 2.0 2.4 2.8 3.2
400
600
800
1000
Tem
pera
ture
(ºC
)
C/O Ratio
Front Face
Back Face
(c) Rh-Ce
0.8 1.2 1.6 2.0 2.4 2.8 3.2
400
600
800
1000
Tem
pera
ture
(ºC
)
C/O Ratio
Front Face
Back Face
(d) Rh-Ce/γ-Al2O3
Figure 3.2: Front (open) and back (filled) face catalyst temperatures for � benzene,• toluene, N ethylbenzene, � cumene, and ◮ styrene on (a) Rh, (b) Rh/γ-Al2O3,(c) Rh-Ce, and (d) Rh-Ce/γ-Al2O3.
SH2was lowest on the Rh catalyst, generally ≤ 20 % for all feeds, and highest on
the Rh-Ce/γ-Al2O3 catalyst. Rh-Ce and Rh/γ-Al2O3 produced selectivities between
these extremes, with Rh-Ce more selective to H2 than Rh/γ-Al2O3 for benzene and
toluene.
3.3.4 Carbon Selectivity
Carbon Oxides
Very similar carbon selectivities were observed for benzene and toluene as well as
ethylbenzene and cumene. For all experiments, SCO was always higher than SCO2.
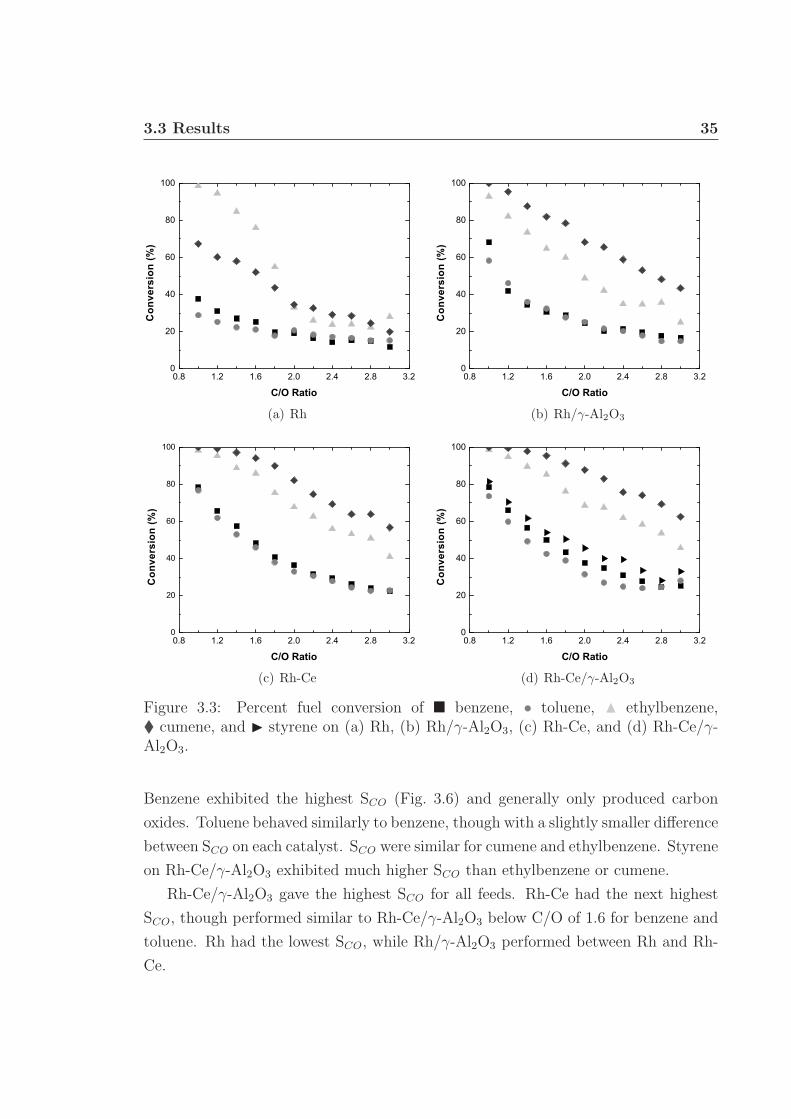
3.3 Results 35
0.8 1.2 1.6 2.0 2.4 2.8 3.20
20
40
60
80
100
Con
vers
ion
(%)
C/O Ratio
(a) Rh
0.8 1.2 1.6 2.0 2.4 2.8 3.20
20
40
60
80
100
Con
vers
ion
(%)
C/O Ratio
(b) Rh/γ-Al2O3
0.8 1.2 1.6 2.0 2.4 2.8 3.20
20
40
60
80
100
Con
vers
ion
(%)
C/O Ratio
(c) Rh-Ce
0.8 1.2 1.6 2.0 2.4 2.8 3.20
20
40
60
80
100C
onve
rsio
n (%
)
C/O Ratio
(d) Rh-Ce/γ-Al2O3
Figure 3.3: Percent fuel conversion of � benzene, • toluene, N ethylbenzene,� cumene, and ◮ styrene on (a) Rh, (b) Rh/γ-Al2O3, (c) Rh-Ce, and (d) Rh-Ce/γ-Al2O3.
Benzene exhibited the highest SCO (Fig. 3.6) and generally only produced carbon
oxides. Toluene behaved similarly to benzene, though with a slightly smaller difference
between SCO on each catalyst. SCO were similar for cumene and ethylbenzene. Styrene
on Rh-Ce/γ-Al2O3 exhibited much higher SCO than ethylbenzene or cumene.
Rh-Ce/γ-Al2O3 gave the highest SCO for all feeds. Rh-Ce had the next highest
SCO, though performed similar to Rh-Ce/γ-Al2O3 below C/O of 1.6 for benzene and
toluene. Rh had the lowest SCO, while Rh/γ-Al2O3 performed between Rh and Rh-
Ce.
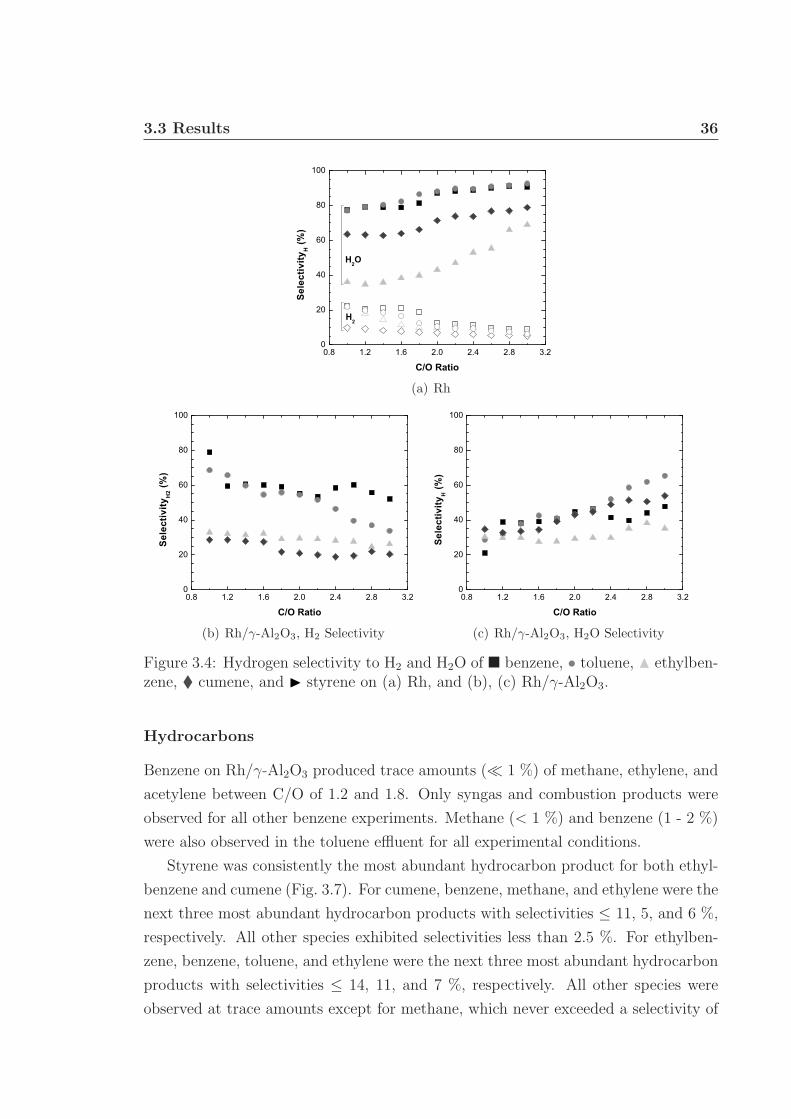
3.3 Results 36
0.8 1.2 1.6 2.0 2.4 2.8 3.20
20
40
60
80
100
Sele
ctiv
ityH (%
)
C/O Ratio
H2
H2O
(a) Rh
0.8 1.2 1.6 2.0 2.4 2.8 3.20
20
40
60
80
100
Sele
ctiv
ityH
2 (%)
C/O Ratio
(b) Rh/γ-Al2O3, H2 Selectivity
0.8 1.2 1.6 2.0 2.4 2.8 3.20
20
40
60
80
100
Sele
ctiv
ityH (%
)
C/O Ratio
(c) Rh/γ-Al2O3, H2O Selectivity
Figure 3.4: Hydrogen selectivity to H2 and H2O of � benzene, • toluene, N ethylben-zene, � cumene, and ◮ styrene on (a) Rh, and (b), (c) Rh/γ-Al2O3.
Hydrocarbons
Benzene on Rh/γ-Al2O3 produced trace amounts (≪ 1 %) of methane, ethylene, and
acetylene between C/O of 1.2 and 1.8. Only syngas and combustion products were
observed for all other benzene experiments. Methane (< 1 %) and benzene (1 - 2 %)
were also observed in the toluene effluent for all experimental conditions.
Styrene was consistently the most abundant hydrocarbon product for both ethyl-
benzene and cumene (Fig. 3.7). For cumene, benzene, methane, and ethylene were the
next three most abundant hydrocarbon products with selectivities ≤ 11, 5, and 6 %,
respectively. All other species exhibited selectivities less than 2.5 %. For ethylben-
zene, benzene, toluene, and ethylene were the next three most abundant hydrocarbon
products with selectivities ≤ 14, 11, and 7 %, respectively. All other species were
observed at trace amounts except for methane, which never exceeded a selectivity of
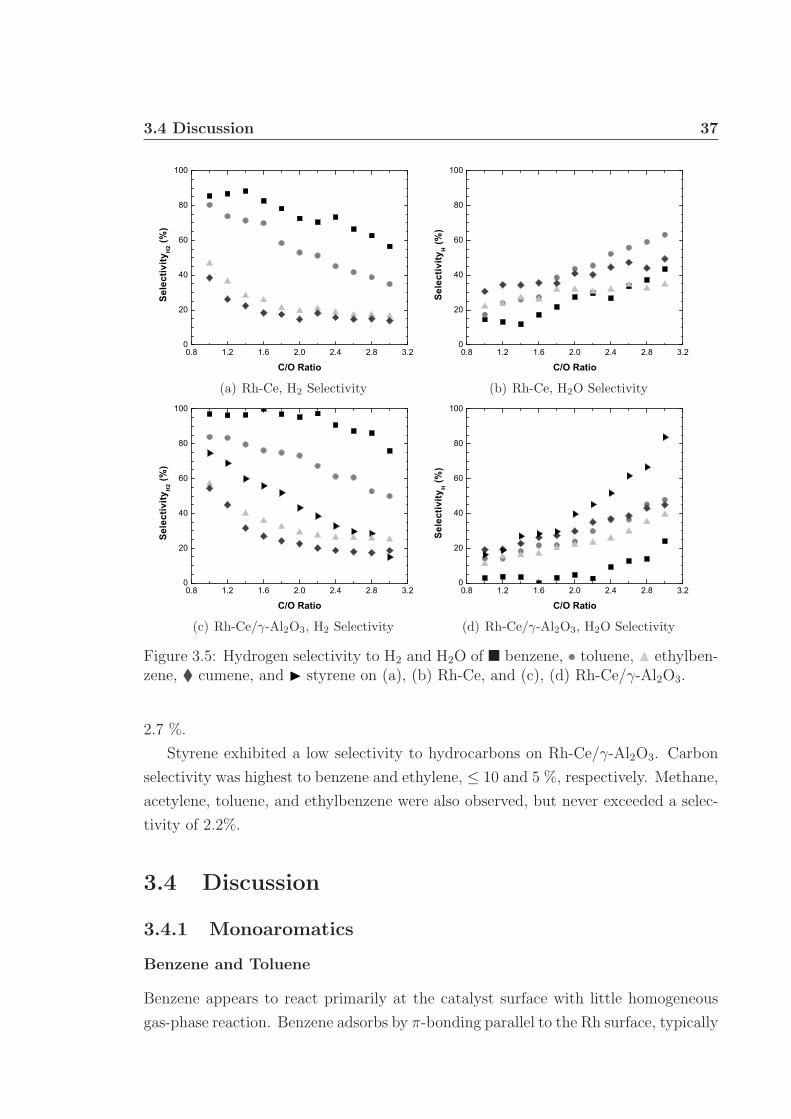
3.4 Discussion 37
0.8 1.2 1.6 2.0 2.4 2.8 3.20
20
40
60
80
100Se
lect
ivity
H2 (%
)
C/O Ratio
(a) Rh-Ce, H2 Selectivity
0.8 1.2 1.6 2.0 2.4 2.8 3.20
20
40
60
80
100
Sele
ctiv
ityH (%
)
C/O Ratio
(b) Rh-Ce, H2O Selectivity
0.8 1.2 1.6 2.0 2.4 2.8 3.20
20
40
60
80
100
Sele
ctiv
ityH
2 (%)
C/O Ratio
(c) Rh-Ce/γ-Al2O3, H2 Selectivity
0.8 1.2 1.6 2.0 2.4 2.8 3.20
20
40
60
80
100
Sele
ctiv
ityH (%
)
C/O Ratio
(d) Rh-Ce/γ-Al2O3, H2O Selectivity
Figure 3.5: Hydrogen selectivity to H2 and H2O of � benzene, • toluene, N ethylben-zene, � cumene, and ◮ styrene on (a), (b) Rh-Ce, and (c), (d) Rh-Ce/γ-Al2O3.
2.7 %.
Styrene exhibited a low selectivity to hydrocarbons on Rh-Ce/γ-Al2O3. Carbon
selectivity was highest to benzene and ethylene, ≤ 10 and 5 %, respectively. Methane,
acetylene, toluene, and ethylbenzene were also observed, but never exceeded a selec-
tivity of 2.2%.
3.4 Discussion
3.4.1 Monoaromatics
Benzene and Toluene
Benzene appears to react primarily at the catalyst surface with little homogeneous
gas-phase reaction. Benzene adsorbs by π-bonding parallel to the Rh surface, typically
3.4 Discussion 38
over a three-fold hollow site with very limited molecular desorption.79–83 Decomposi-
tion begins by C-C bond cleavage and surface carbon species can react with adsorbed
oxygen.80,82,83 The presence of hydrocarbon surface species facilitates carbon move-
ment on the metal surface for further reaction, limiting coke formation.82 CO, CO2,
H2, and H2O are produced primarily through heterogeneous catalytic reactions.
The large bond dissociation energies and high resonance stability associated with
an aromatic ring limit homogeneous reactions.74 This stability requires higher tem-
peratures and longer residence times to homogeneously react benzene than those
present in the experimental system.74,76 However, temperatures throughout the cat-
alyst were sufficient to initiate benzene oxidation for all C/O ranges. Therefore only
trace amounts of benzene reacted homogeneously to produce methane, ethylene, and
acetylene.75,76
Toluene has been shown previously to behave similar to benzene on metal catalytic
surfaces, in agreement with the presented experimental results.81–84 For all catalysts
and feed ratios, benzene and toluene had nearly identical conversions and selectivities.
Carbon selectivity to methane and benzene from toluene were 1 - 2 % for all C/O
ratios, likely produced from homogeneous reactions, as routes to products > C1 on
Rh from toluene are unknown at the presented experimental conditions.80,81
Ethylbenzene and Cumene
Addition of a functional group to an aromatic ring can increase homogeneous and
heterogeneous reactivity.85,86 The larger alkyl groups and the weak secondary and
tertiary C-H bonds of ethylbenzene and cumene can participate in homogeneous re-
actions and also adsorb more favorably onto the catalyst surface than benzene. Ho-
mogeneous reactions of these alkyl groups produce the wide range of hydrocarbons
observed in the effluent during experiments.87
Ethylbenzene and cumene had similar conversion trends on all catalysts (Fig. 3.3),
excluding low C/O ratios on Rh. Both fuels consistently had higher conversion than
benzene or toluene due to higher homogeneous reactivity. High styrene selectivity
(Fig. 3.7) may indicate homogeneous dehydrogenation of ethylbenzene for all exper-
iments. Benzene and ethylene may have been produced by homogeneous cleavage of
the alkyl group from the aromatic ring. Toluene and methane were also observed as
gas phase products. Of the converted fuel, at least one third survived as an aromatic
ring.
Cumene generally had higher conversion than ethylbenzene due to the increased
homogeneous reactivity of the larger alkyl group. Again, styrene was the major
3.4 Discussion 39
homogeneous product, resulting from the cleavage of one carbon from the isopropyl
group. Benzene and ethylene were also observed in equal molar amounts in the
effluent of cumene experiments, possibly as a result of further homogeneous reaction
of styrene.
Styrene
On Rh-Ce/γ-Al2O3, styrene exhibited conversion similar to that of toluene and ben-
zene across all C/O ratios, much lower than ethylbenzene or cumene (Fig. 3.3). Hy-
drogen and carbon oxide species were the main products, resulting primarily from
catalytic reactions. The only hydrocarbon selectivities larger than ∼ 2 % were those
to benzene and ethylene, resulting from the homogeneous cleaving of the ethenyl
group from the aromatic ring. The high selectivity to styrene of both ethylbenzene
and cumene in combination with styrene’s lower conversion may indicate a higher
gas phase stability, resulting from the higher bond energy associated with the carbon
double bond of the ethenyl group.
3.4.2 Catalysts
Platinum
Data were not collected on Pt catalysts due to severe coking and catalyst deactivation
during operation. Benzene and other aromatics adsorb on Pt in the same manner
as on Rh.79,88 However, C-H bonds are the first to break on Pt, rather than the C-
C bonds.82,88,89 The formation of strong C-C networks and the lack of mobile C-H
surface species contribute to the formation of unreactive coke, which deactivates the
catalyst.
Pt was successfully lit off, but deactivated within 90 s of startup. Deactivation
likely began at the front face (as indicated by an initial front face temperature drop)
where cooler temperatures facilitated solid carbon formation. Catalyst coking prop-
agated rapidly through the catalyst, quenching the reaction. Similar results were
observed previously.38
Rhodium
The rhodium catalyst reformed all monoaromatics autothermally, excluding styrene,
to a mixture of syngas and hydrocarbons.
3.4 Discussion 40
Generally, benzene and toluene were observed to have higher front and back face
temperatures than the higher alkylated aromatics (excluding styrene on Rh-Ce/γ-
Al2O3). Reforming reactions with steam generated in the catalyst bed and endother-
mic homogeneous cracking of ethylbenzene, cumene, and their gas phase products
may have resulted in lower temperatures throughout the catalyst (Fig. 3.2). The
higher gas phase stability of benzene, toluene, and styrene limited endothermic reac-
tions, maintaining high catalyst temperatures.
Rh generally exhibited high SCO, especially for benzene and toluene (Fig. 3.6).
Ethylbenzene and cumene exhibited lower SCO due to their high gas phase reactivity
to hydrocarbons. SCO2was very similar for all feeds and much lower than SCO. As
discussed earlier, the majority of carbon oxide products are believed to be produced
on the catalyst surface. High temperatures observed at low C/O ratios reduce species’
surface residence time on the catalyst, resulting in higher fuel conversion and higher
selectivity to CO, as CO will more likely desorb on Rh than react with an additional
surface oxygen.82 As C/O ratio increases, the system becomes more fuel rich, decreas-
ing temperatures and lengthening the surface residence time, producing more CO2
and less CO.
Similar to SCO, SH2on Rh was highest for benzene and toluene (Fig. 3.4). However,
SH2O was consistently higher than SH2for all feeds, possibly due to reactions of O2
with desorbed H2 throughout the catalyst bed. Ethylbenzene and cumene had lower
SH2and SH2O than benzene and toluene due to their high selectivity to hydrocarbons.
Rh/γ-Al2O3
The addition of a γ-Al2O3 washcoat to Rh catalysts has been shown to increase cat-
alytic sites and maintain catalytic performance at high temperatures by preventing
metal sintering.42,43,90 Compared to the Rh catalyst, the addition of a washcoat in-
creased benzene and toluene back face temperatures by ∼ 60 - 80 ◦C and conversions
by ∼ 10 % at all C/O ratios (Fig. 3.2 and 3.3). Despite an increase in conversion for
ethylbenzene and cumene as well, the back face temperature of Rh/γ-Al2O3 was very
similar to Rh. This may be due to higher rates of endothermic homogeneous cracking
balancing the increase in exothermic catalytic conversion.
Washcoat addition generally decreased the catalyst front face temperature. This
change, though only ∼ 20 ◦C, may be caused by an increase in reforming at the
front face. Rh has been shown to be a very active steam reforming catalyst, and
the addition of washcoat increases reforming activity by increasing the number of
catalyst sites.91 The increase in catalytic activity also increased the selectivity to
3.4 Discussion 41
syngas products for all feeds. A dramatic increase in SH2was observed, especially for
benzene and toluene, which was matched by an equal drop in SH2O (Fig. 3.4).
Rh-Ce
Cerium addition to a Rh catalyst has been shown to stabilize the Rh metal, in-
crease catalyst selectivities to syngas, and prevent coke formation by increasing ox-
idation rates at the surface.40–42,90,92,93 For all fuels, addition of Ce gave the same,
or slightly higher front face temperatures than the Rh catalyst. However, the back
face temperatures increased dramatically, higher than either Rh or Rh/γ-Al2O3 by
100 - 200 ◦C(Fig. 3.2). Overall conversions for all fuels were also significantly higher
at all C/O ratios.
For benzene and toluene, Ce addition increased selectivity to syngas and decreased
SH2O and SCO2more than the addition of a washcoat (Fig. 3.4-3.6). However, the
selectivity differences between Ce and washcoat addition were difficult to distinguish
for ethylbenzene and cumene due to the high rates of homogeneous chemistry for
both.
Rh-Ce/γ-Al2O3
The Rh-Ce/γ-Al2O3 catalyst was the only catalyst able to reform styrene for all C/O
ratios without severe coke formation. This catalyst also experienced the largest tem-
perature gradient of all catalysts. The front face temperature was significantly lower,
below 400 ◦C at high C/O ratios (Fig. 3.2). As with Rh/γ-Al2O3, the lower temper-
atures may be explained by an increase in endothermic steam reforming activity at
the front face, facilitated by washcoat addition.78 The back face temperatures and
conversions, higher than both Rh and Rh/γ-Al2O3, were very similar to those of the
Rh-Ce catalyst. Addition of Ce to Rh appears to have a stronger effect on increasing
exothermic surface oxidation reaction rates than does addition of washcoat.
For benzene and toluene, Rh-Ce/γ-Al2O3 had the highest selectivity to syngas
and the lowest to H2O and CO2 of any catalyst (Fig. 3.4-3.6). The same was true
for ethylbenzene and cumene, however the difference was considerably smaller. The
combination of washcoat and Ce increased catalytic sites and activity to maximize
syngas selectivity and minimize total oxidation products.
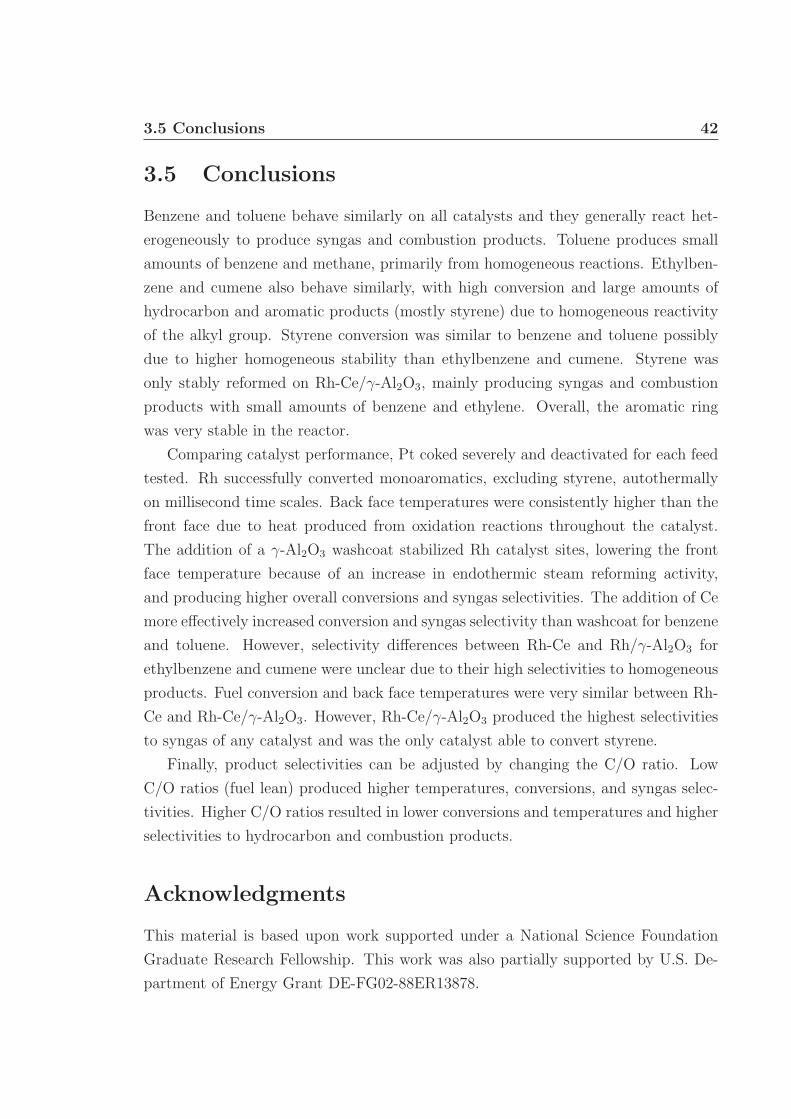
3.5 Conclusions 42
3.5 Conclusions
Benzene and toluene behave similarly on all catalysts and they generally react het-
erogeneously to produce syngas and combustion products. Toluene produces small
amounts of benzene and methane, primarily from homogeneous reactions. Ethylben-
zene and cumene also behave similarly, with high conversion and large amounts of
hydrocarbon and aromatic products (mostly styrene) due to homogeneous reactivity
of the alkyl group. Styrene conversion was similar to benzene and toluene possibly
due to higher homogeneous stability than ethylbenzene and cumene. Styrene was
only stably reformed on Rh-Ce/γ-Al2O3, mainly producing syngas and combustion
products with small amounts of benzene and ethylene. Overall, the aromatic ring
was very stable in the reactor.
Comparing catalyst performance, Pt coked severely and deactivated for each feed
tested. Rh successfully converted monoaromatics, excluding styrene, autothermally
on millisecond time scales. Back face temperatures were consistently higher than the
front face due to heat produced from oxidation reactions throughout the catalyst.
The addition of a γ-Al2O3 washcoat stabilized Rh catalyst sites, lowering the front
face temperature because of an increase in endothermic steam reforming activity,
and producing higher overall conversions and syngas selectivities. The addition of Ce
more effectively increased conversion and syngas selectivity than washcoat for benzene
and toluene. However, selectivity differences between Rh-Ce and Rh/γ-Al2O3 for
ethylbenzene and cumene were unclear due to their high selectivities to homogeneous
products. Fuel conversion and back face temperatures were very similar between Rh-
Ce and Rh-Ce/γ-Al2O3. However, Rh-Ce/γ-Al2O3 produced the highest selectivities
to syngas of any catalyst and was the only catalyst able to convert styrene.
Finally, product selectivities can be adjusted by changing the C/O ratio. Low
C/O ratios (fuel lean) produced higher temperatures, conversions, and syngas selec-
tivities. Higher C/O ratios resulted in lower conversions and temperatures and higher
selectivities to hydrocarbon and combustion products.
Acknowledgments
This material is based upon work supported under a National Science Foundation
Graduate Research Fellowship. This work was also partially supported by U.S. De-
partment of Energy Grant DE-FG02-88ER13878.
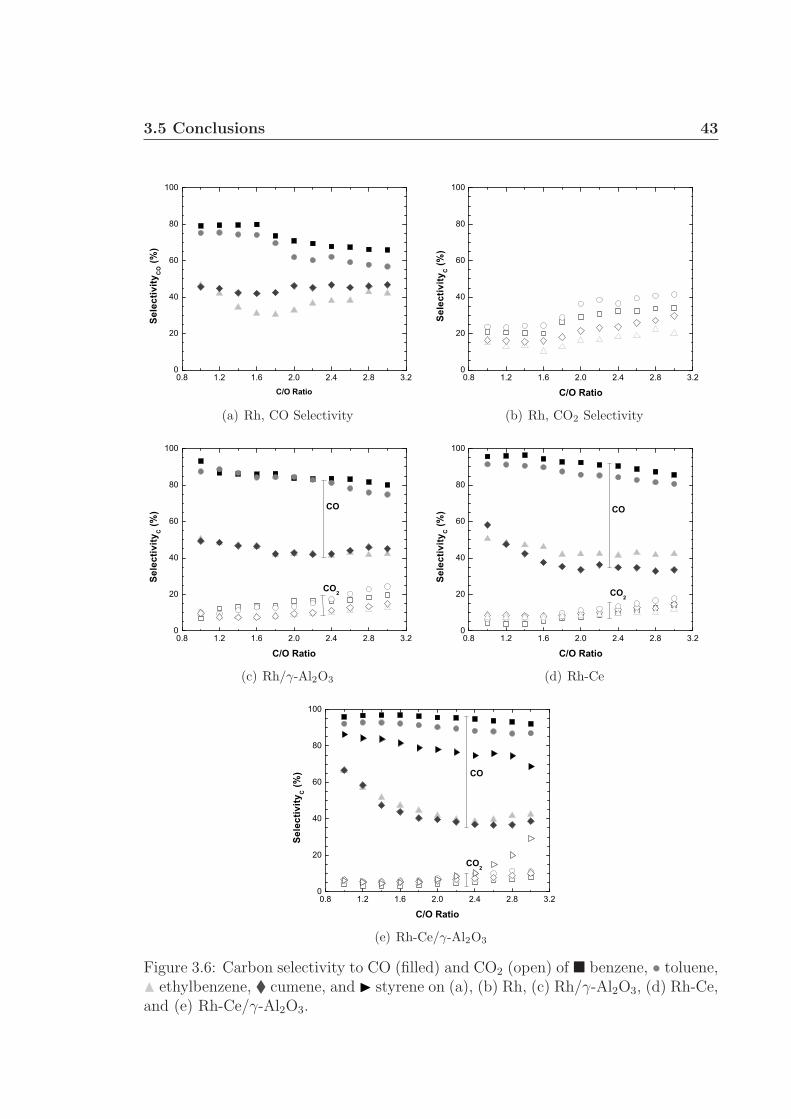
3.5 Conclusions 43
0.8 1.2 1.6 2.0 2.4 2.8 3.20
20
40
60
80
100
Sele
ctiv
ityC
O (%
)
C/O Ratio
(a) Rh, CO Selectivity
0.8 1.2 1.6 2.0 2.4 2.8 3.20
20
40
60
80
100
Sele
ctiv
ityC (%
)
C/O Ratio
(b) Rh, CO2 Selectivity
0.8 1.2 1.6 2.0 2.4 2.8 3.20
20
40
60
80
100
CO2
CO
Sele
ctiv
ityC (%
)
C/O Ratio
(c) Rh/γ-Al2O3
0.8 1.2 1.6 2.0 2.4 2.8 3.20
20
40
60
80
100
CO2
CO
Sele
ctiv
ityC (%
)
C/O Ratio
(d) Rh-Ce
0.8 1.2 1.6 2.0 2.4 2.8 3.20
20
40
60
80
100
CO2
CO
Sele
ctiv
ityC (%
)
C/O Ratio
(e) Rh-Ce/γ-Al2O3
Figure 3.6: Carbon selectivity to CO (filled) and CO2 (open) of � benzene, • toluene,N ethylbenzene, � cumene, and ◮ styrene on (a), (b) Rh, (c) Rh/γ-Al2O3, (d) Rh-Ce,and (e) Rh-Ce/γ-Al2O3.
3.5 Conclusions 44
0.8 1.2 1.6 2.0 2.4 2.8 3.20
10
20
30
40
Sele
ctiv
ityC (%
)
C/O Ratio
(a) Rh
0.8 1.2 1.6 2.0 2.4 2.8 3.20
10
20
30
40
Sele
ctiv
ityC (%
)
C/O Ratio
(b) Rh/γ-Al2O3
0.8 1.2 1.6 2.0 2.4 2.8 3.20
10
20
30
40
Sele
ctiv
ityC (%
)
C/O Ratio
(c) Rh-Ce
0.8 1.2 1.6 2.0 2.4 2.8 3.20
10
20
30
40
Sele
ctiv
ityC (%
)
C/O Ratio
(d) Rh-Ce/γ-Al2O3
Figure 3.7: Carbon selectivity to styrene of ethylbenzene (filled) and cumene (open)on (a) Rh, (b) Rh/γ-Al2O3, (c) Rh-Ce, and (d) Rh-Ce/γ-Al2O3.
CHAPTER
FOUR
RAPID ABLATIVE PYROLYSIS OF CELLULOSE IN AN
AUTOTHERMAL FIXED-BED CATALYTIC REACTOR1
Chapter 3 discussed the behavior of lignin surrogates during oxidative pyrolysis. Cel-
lulose is another major component of lignocellulosic biomass and is easily obtained
in a pure form. Here, a fixed bed Pt or Rh-Ce catalytic reactor has been shown to
produce high carbon selectivity to pyrolysis oil from cellulosic feedstock. Heat was
generated in situ by the sacrificial oxidation of pyrolysis vapors. High heat transfer
rates within the catalyst bed allowed for 100 % conversion of the cellulose feed while
maintaining char-free and autothermal operation. Variations in support geometry,
catalyst, and H2 addition were investigated to manipulate the yield of pyrolysis prod-
ucts. Carbon selectivity to pyrolysis products as high as 60 % was achieved with a
Pt combustion catalyst.
4.1 Introduction
Many biological, chemical, and thermal pathways have been investigated as poten-
tially efficient processing methods to utilize biomass as a renewable feedstock. Pyrol-
ysis of biomass has been investigated as a process to produce gas and liquid products
using fluidized bed, rotary kiln, and plate ablative reactors, among others.94,95 How-
ever, many pyrolysis reactors are hindered by char production resulting from limited
heat transfer rates to the reactor. As a result, reactors are difficult to scale up due
1Portions of this chapter appear in C.M. Balonek, J.L. Colby, N.E. Persson, L.D. Schmidt,“Rapid ablative pyrolysis of cellulose in an autothermal fixed-bed catalytic reactor,” ChemSusChem
3 (2010) 1355-1358. c© 2010 WILEY-VCH Verlag GmbH & Co.
45
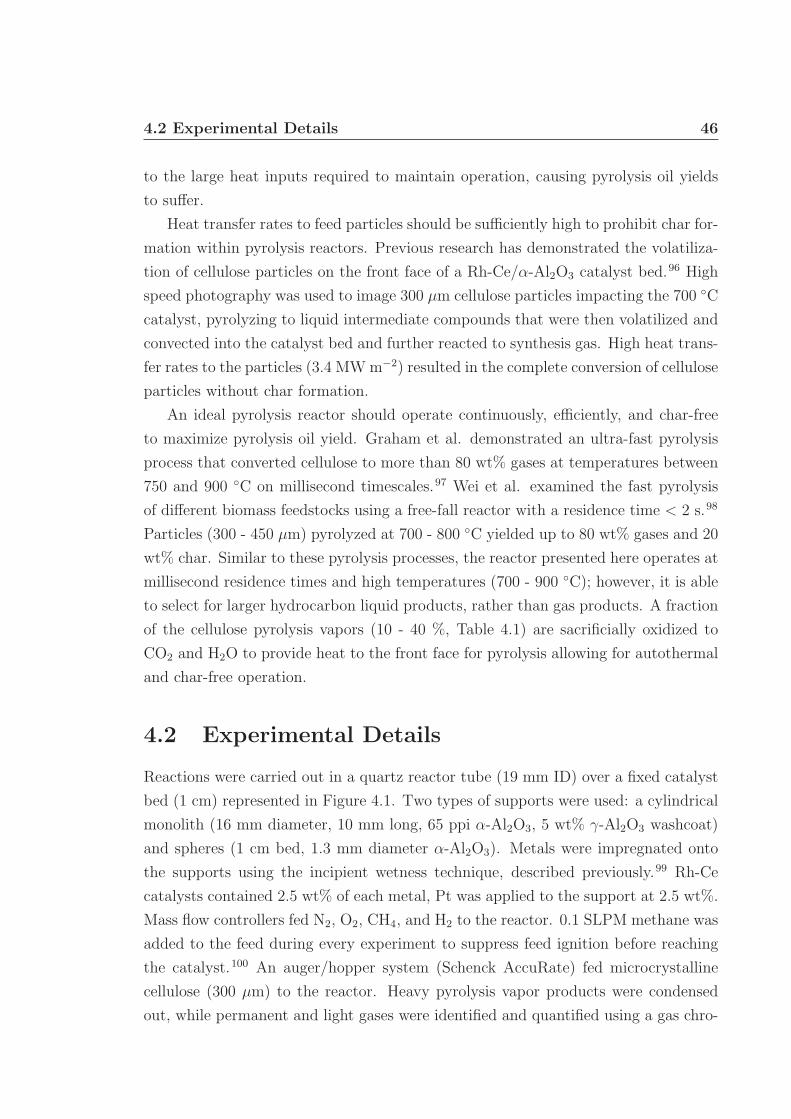
4.2 Experimental Details 46
to the large heat inputs required to maintain operation, causing pyrolysis oil yields
to suffer.
Heat transfer rates to feed particles should be sufficiently high to prohibit char for-
mation within pyrolysis reactors. Previous research has demonstrated the volatiliza-
tion of cellulose particles on the front face of a Rh-Ce/α-Al2O3 catalyst bed.96 High
speed photography was used to image 300 µm cellulose particles impacting the 700 ◦C
catalyst, pyrolyzing to liquid intermediate compounds that were then volatilized and
convected into the catalyst bed and further reacted to synthesis gas. High heat trans-
fer rates to the particles (3.4 MWm−2) resulted in the complete conversion of cellulose
particles without char formation.
An ideal pyrolysis reactor should operate continuously, efficiently, and char-free
to maximize pyrolysis oil yield. Graham et al. demonstrated an ultra-fast pyrolysis
process that converted cellulose to more than 80 wt% gases at temperatures between
750 and 900 ◦C on millisecond timescales.97 Wei et al. examined the fast pyrolysis
of different biomass feedstocks using a free-fall reactor with a residence time < 2 s.98
Particles (300 - 450 µm) pyrolyzed at 700 - 800 ◦C yielded up to 80 wt% gases and 20
wt% char. Similar to these pyrolysis processes, the reactor presented here operates at
millisecond residence times and high temperatures (700 - 900 ◦C); however, it is able
to select for larger hydrocarbon liquid products, rather than gas products. A fraction
of the cellulose pyrolysis vapors (10 - 40 %, Table 4.1) are sacrificially oxidized to
CO2 and H2O to provide heat to the front face for pyrolysis allowing for autothermal
and char-free operation.
4.2 Experimental Details
Reactions were carried out in a quartz reactor tube (19 mm ID) over a fixed catalyst
bed (1 cm) represented in Figure 4.1. Two types of supports were used: a cylindrical
monolith (16 mm diameter, 10 mm long, 65 ppi α-Al2O3, 5 wt% γ-Al2O3 washcoat)
and spheres (1 cm bed, 1.3 mm diameter α-Al2O3). Metals were impregnated onto
the supports using the incipient wetness technique, described previously.99 Rh-Ce
catalysts contained 2.5 wt% of each metal, Pt was applied to the support at 2.5 wt%.
Mass flow controllers fed N2, O2, CH4, and H2 to the reactor. 0.1 SLPM methane was
added to the feed during every experiment to suppress feed ignition before reaching
the catalyst.100 An auger/hopper system (Schenck AccuRate) fed microcrystalline
cellulose (300 µm) to the reactor. Heavy pyrolysis vapor products were condensed
out, while permanent and light gases were identified and quantified using a gas chro-
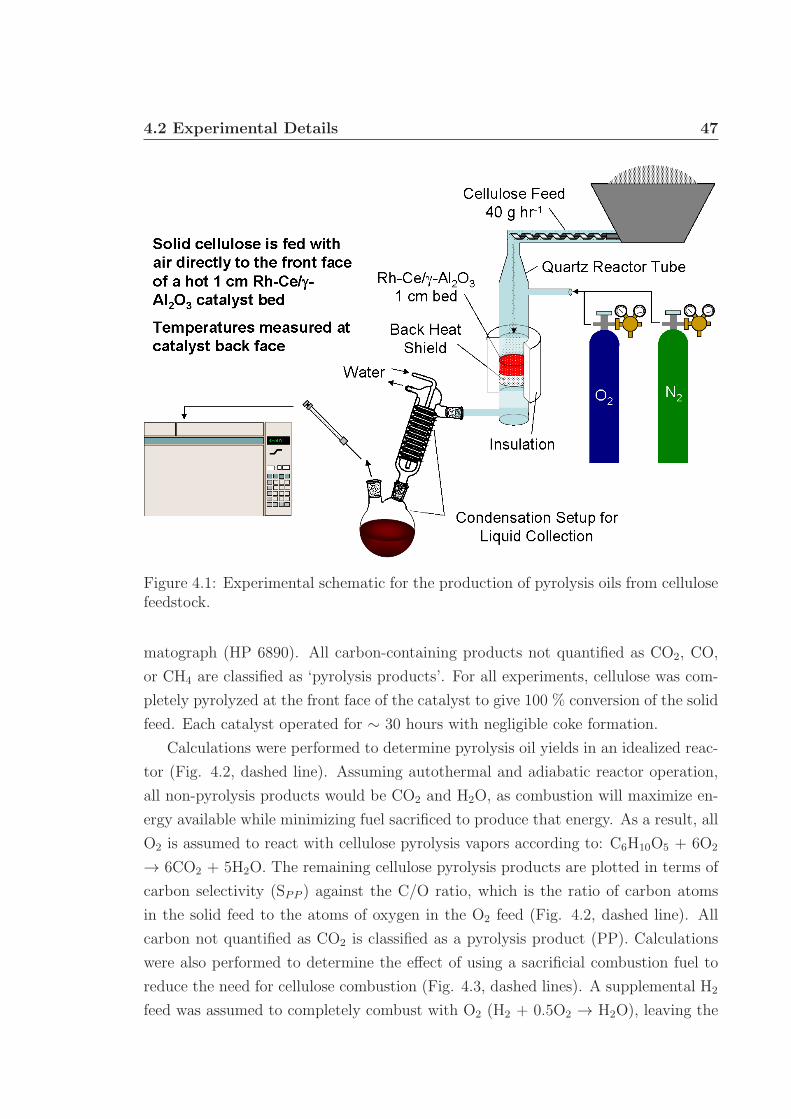
4.2 Experimental Details 47
Figure 4.1: Experimental schematic for the production of pyrolysis oils from cellulosefeedstock.
matograph (HP 6890). All carbon-containing products not quantified as CO2, CO,
or CH4 are classified as ‘pyrolysis products’. For all experiments, cellulose was com-
pletely pyrolyzed at the front face of the catalyst to give 100 % conversion of the solid
feed. Each catalyst operated for ∼ 30 hours with negligible coke formation.
Calculations were performed to determine pyrolysis oil yields in an idealized reac-
tor (Fig. 4.2, dashed line). Assuming autothermal and adiabatic reactor operation,
all non-pyrolysis products would be CO2 and H2O, as combustion will maximize en-
ergy available while minimizing fuel sacrificed to produce that energy. As a result, all
O2 is assumed to react with cellulose pyrolysis vapors according to: C6H10O5 + 6O2
→ 6CO2 + 5H2O. The remaining cellulose pyrolysis products are plotted in terms of
carbon selectivity (SPP ) against the C/O ratio, which is the ratio of carbon atoms
in the solid feed to the atoms of oxygen in the O2 feed (Fig. 4.2, dashed line). All
carbon not quantified as CO2 is classified as a pyrolysis product (PP). Calculations
were also performed to determine the effect of using a sacrificial combustion fuel to
reduce the need for cellulose combustion (Fig. 4.3, dashed lines). A supplemental H2
feed was assumed to completely combust with O2 (H2 + 0.5O2 → H2O), leaving the
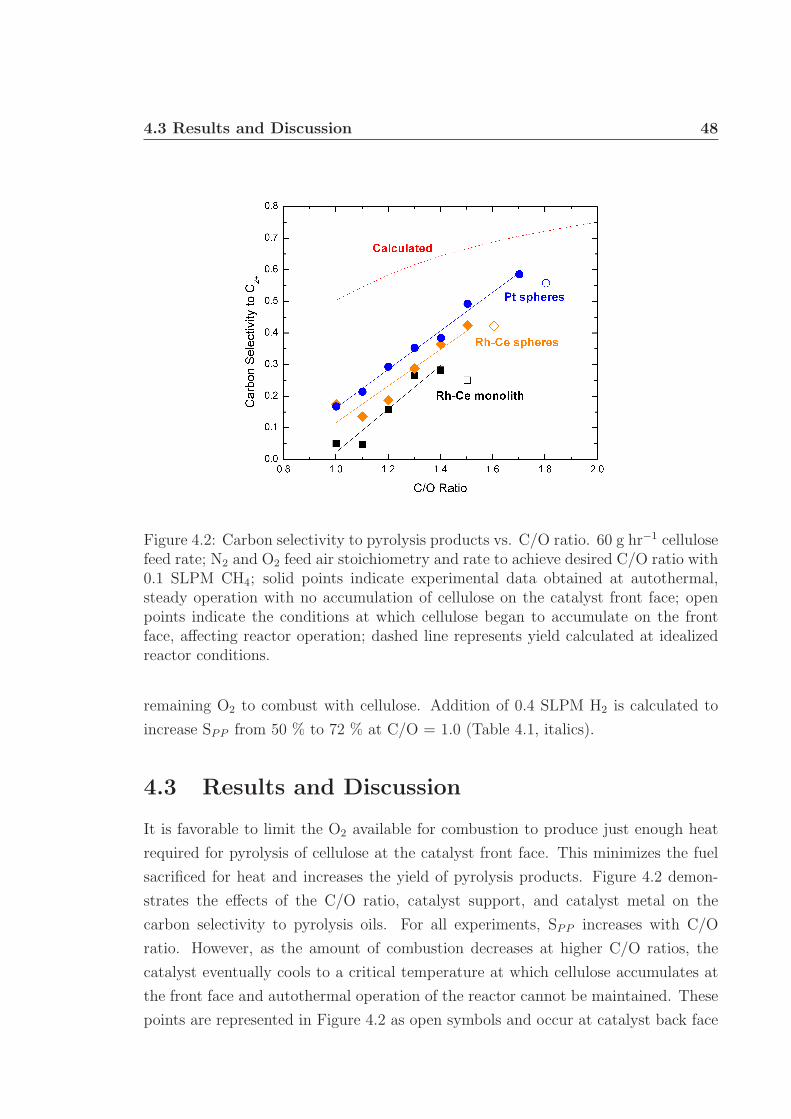
4.3 Results and Discussion 48
Figure 4.2: Carbon selectivity to pyrolysis products vs. C/O ratio. 60 g hr−1 cellulosefeed rate; N2 and O2 feed air stoichiometry and rate to achieve desired C/O ratio with0.1 SLPM CH4; solid points indicate experimental data obtained at autothermal,steady operation with no accumulation of cellulose on the catalyst front face; openpoints indicate the conditions at which cellulose began to accumulate on the frontface, affecting reactor operation; dashed line represents yield calculated at idealizedreactor conditions.
remaining O2 to combust with cellulose. Addition of 0.4 SLPM H2 is calculated to
increase SPP from 50 % to 72 % at C/O = 1.0 (Table 4.1, italics).
4.3 Results and Discussion
It is favorable to limit the O2 available for combustion to produce just enough heat
required for pyrolysis of cellulose at the catalyst front face. This minimizes the fuel
sacrificed for heat and increases the yield of pyrolysis products. Figure 4.2 demon-
strates the effects of the C/O ratio, catalyst support, and catalyst metal on the
carbon selectivity to pyrolysis oils. For all experiments, SPP increases with C/O
ratio. However, as the amount of combustion decreases at higher C/O ratios, the
catalyst eventually cools to a critical temperature at which cellulose accumulates at
the front face and autothermal operation of the reactor cannot be maintained. These
points are represented in Figure 4.2 as open symbols and occur at catalyst back face
4.3 Results and Discussion 49
Figure 4.3: Carbon selectivity to pyrolysis products vs. C/O ratio on 2.5 wt% Pt/α-Al2O3 spheres. N2, O2, and CH4 feed rates were held constant at 2.5, 0.452, and 0.1SLPM; cellulose flow rate was varied (top x axis) to achieve the desired C/O ratio;0.4 SLPM H2 was added to the feed as indicated; solid points indicate experimentaldata obtained at autothermal, steady operation with no accumulation of cellulose onthe catalyst front face; dashed line represents yield calculated at idealized reactorconditions.
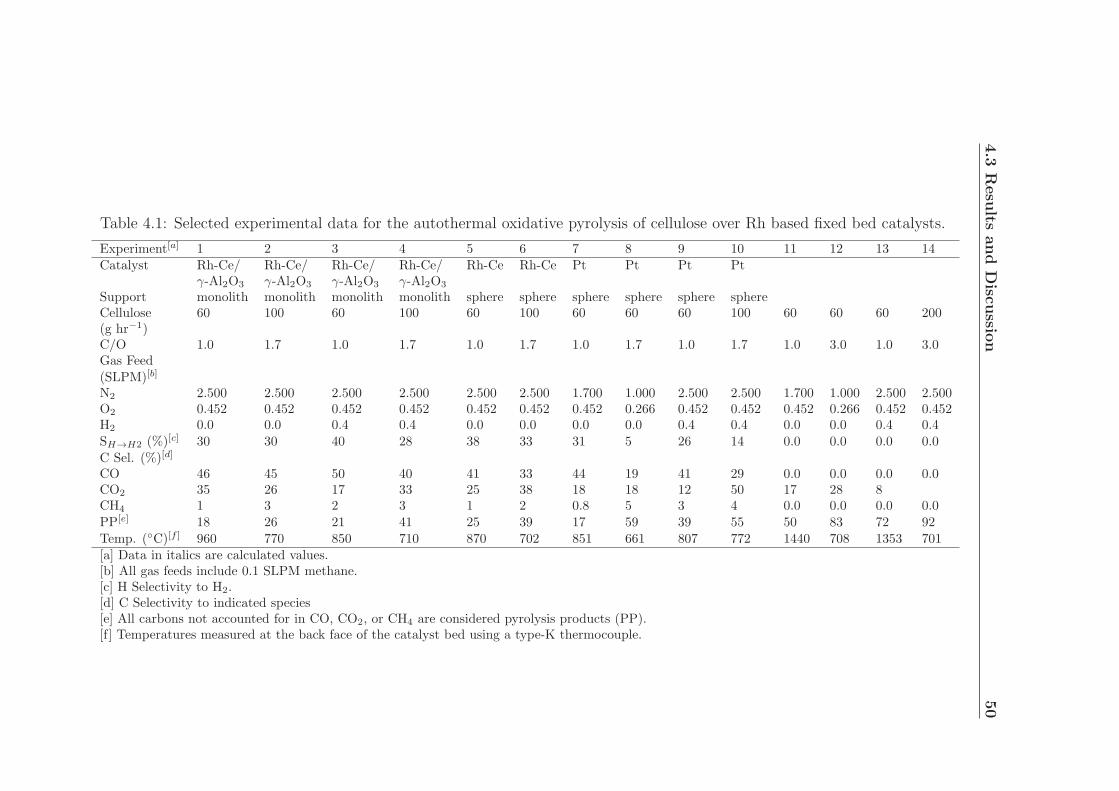
4.3
Resu
ltsand
Discu
ssion
50
Table 4.1: Selected experimental data for the autothermal oxidative pyrolysis of cellulose over Rh based fixed bed catalysts.
Experiment[a] 1 2 3 4 5 6 7 8 9 10 11 12 13 14Catalyst Rh-Ce/ Rh-Ce/ Rh-Ce/ Rh-Ce/ Rh-Ce Rh-Ce Pt Pt Pt Pt
γ-Al2O3 γ-Al2O3 γ-Al2O3 γ-Al2O3
Support monolith monolith monolith monolith sphere sphere sphere sphere sphere sphereCellulose 60 100 60 100 60 100 60 60 60 100 60 60 60 200(g hr−1)C/O 1.0 1.7 1.0 1.7 1.0 1.7 1.0 1.7 1.0 1.7 1.0 3.0 1.0 3.0Gas Feed(SLPM)[b]
N2 2.500 2.500 2.500 2.500 2.500 2.500 1.700 1.000 2.500 2.500 1.700 1.000 2.500 2.500O2 0.452 0.452 0.452 0.452 0.452 0.452 0.452 0.266 0.452 0.452 0.452 0.266 0.452 0.452H2 0.0 0.0 0.4 0.4 0.0 0.0 0.0 0.0 0.4 0.4 0.0 0.0 0.4 0.4SH→H2 (%)[c] 30 30 40 28 38 33 31 5 26 14 0.0 0.0 0.0 0.0C Sel. (%)[d]
CO 46 45 50 40 41 33 44 19 41 29 0.0 0.0 0.0 0.0CO2 35 26 17 33 25 38 18 18 12 50 17 28 8CH4 1 3 2 3 1 2 0.8 5 3 4 0.0 0.0 0.0 0.0PP[e] 18 26 21 41 25 39 17 59 39 55 50 83 72 92Temp. (◦C)[f ] 960 770 850 710 870 702 851 661 807 772 1440 708 1353 701[a] Data in italics are calculated values.[b] All gas feeds include 0.1 SLPM methane.[c] H Selectivity to H2.[d] C Selectivity to indicated species[e] All carbons not accounted for in CO, CO2, or CH4 are considered pyrolysis products (PP).[f] Temperatures measured at the back face of the catalyst bed using a type-K thermocouple.
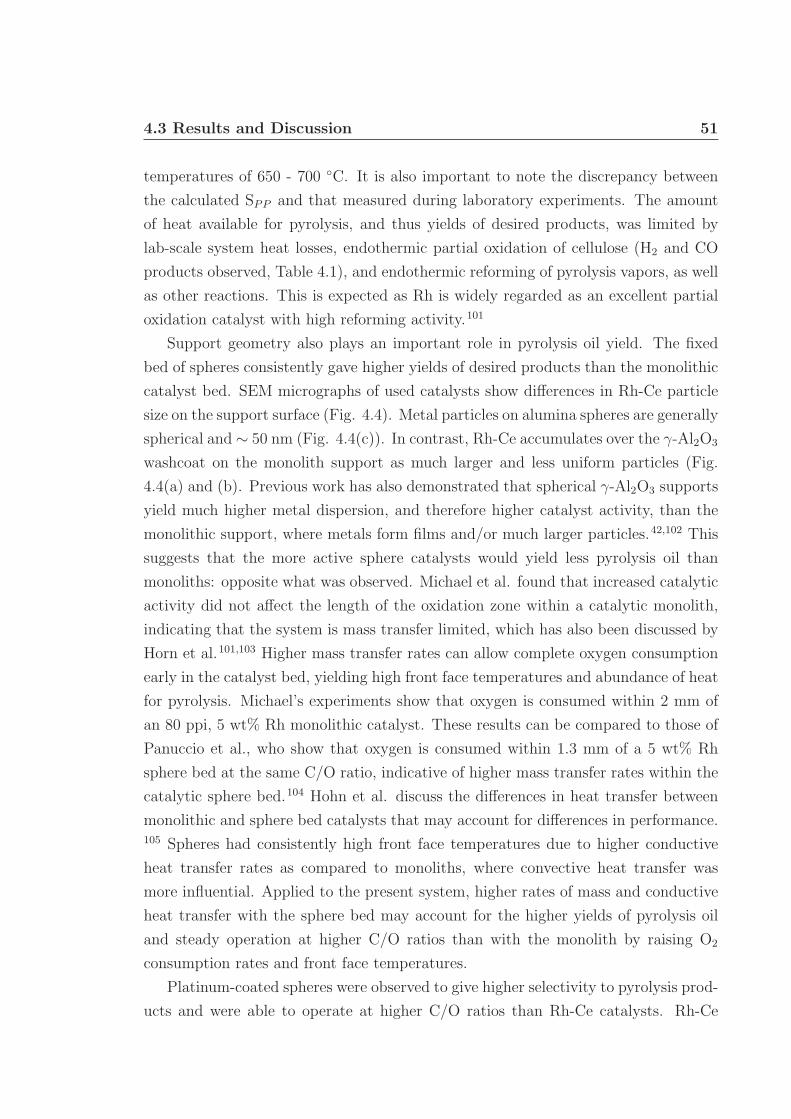
4.3 Results and Discussion 51
temperatures of 650 - 700 ◦C. It is also important to note the discrepancy between
the calculated SPP and that measured during laboratory experiments. The amount
of heat available for pyrolysis, and thus yields of desired products, was limited by
lab-scale system heat losses, endothermic partial oxidation of cellulose (H2 and CO
products observed, Table 4.1), and endothermic reforming of pyrolysis vapors, as well
as other reactions. This is expected as Rh is widely regarded as an excellent partial
oxidation catalyst with high reforming activity.101
Support geometry also plays an important role in pyrolysis oil yield. The fixed
bed of spheres consistently gave higher yields of desired products than the monolithic
catalyst bed. SEM micrographs of used catalysts show differences in Rh-Ce particle
size on the support surface (Fig. 4.4). Metal particles on alumina spheres are generally
spherical and ∼ 50 nm (Fig. 4.4(c)). In contrast, Rh-Ce accumulates over the γ-Al2O3
washcoat on the monolith support as much larger and less uniform particles (Fig.
4.4(a) and (b). Previous work has also demonstrated that spherical γ-Al2O3 supports
yield much higher metal dispersion, and therefore higher catalyst activity, than the
monolithic support, where metals form films and/or much larger particles.42,102 This
suggests that the more active sphere catalysts would yield less pyrolysis oil than
monoliths: opposite what was observed. Michael et al. found that increased catalytic
activity did not affect the length of the oxidation zone within a catalytic monolith,
indicating that the system is mass transfer limited, which has also been discussed by
Horn et al.101,103 Higher mass transfer rates can allow complete oxygen consumption
early in the catalyst bed, yielding high front face temperatures and abundance of heat
for pyrolysis. Michael’s experiments show that oxygen is consumed within 2 mm of
an 80 ppi, 5 wt% Rh monolithic catalyst. These results can be compared to those of
Panuccio et al., who show that oxygen is consumed within 1.3 mm of a 5 wt% Rh
sphere bed at the same C/O ratio, indicative of higher mass transfer rates within the
catalytic sphere bed.104 Hohn et al. discuss the differences in heat transfer between
monolithic and sphere bed catalysts that may account for differences in performance.105 Spheres had consistently high front face temperatures due to higher conductive
heat transfer rates as compared to monoliths, where convective heat transfer was
more influential. Applied to the present system, higher rates of mass and conductive
heat transfer with the sphere bed may account for the higher yields of pyrolysis oil
and steady operation at higher C/O ratios than with the monolith by raising O2
consumption rates and front face temperatures.
Platinum-coated spheres were observed to give higher selectivity to pyrolysis prod-
ucts and were able to operate at higher C/O ratios than Rh-Ce catalysts. Rh-Ce
4.3 Results and Discussion 52
(a) (b)
(c)
Figure 4.4: SEM micrographs of used Rh-Ce catalysts. All scale bars are 500 nm. (a).Secondary electron detection image of Rh-Ce/γ-Al2O3 monolith. Smooth surfacesare the α-Al2O3 monolith and clusters are γ-Al2O3 washcoat and Rh-Ce particles.(SEI, 2.5 kV, x30,000, WD 10.2 mm) (b). Backscattered electron detection of thesame location as image ((a)). Rh-Ce is dispersed on washcoated areas. (BSE, 2.5 kV,x30,000, WD 10.2 mm) (c). Secondary electron detection image of Rh-Ce impregnatedspheres. Arrows point out two particles of Rh-Ce on the support surface. (SEI, 2.5kV, x100,000, WD 3.7 mm)
4.4 Conclusions 53
catalysts were investigated as they have been shown to be stable for long periods of
time at high operating temperatures without signs of coke formation or catalyst de-
activation.106 However, it is desirable to minimize the endothermic partial oxidation
and reforming activity of the catalyst in order to maximize the extent of pyrolysis
reactions. Pt is frequently used as a combustion catalyst and has been shown to have
minimal reforming activity downstream of the oxidation zone in the catalyst bed.107,108 Experiments 3, 4, 9, and 10 of Table 4.1 show that Pt spheres select for 10 %
less CO than the same experiments over a Rh-Ce/γ-Al2O3 monolith. Pt spheres also
yielded lower CO2 and H2 selectivities, indicating less overall partial oxidation rather
than consumption of CO by the water-gas-shift reaction.109
Hydrogen was added to the feed gases to investigate the effect of a sacrificial fuel
on SPP . Experiments were performed with a constant gas flow rate and an increased
N2 flow (2.5 SLPM) as a safety precaution for lab-scale operation. The cellulose
flow rate was varied to obtain the desired C/O ratio (Fig. 4.3). Over the Pt sphere
fixed bed, autothermal, steady state operation was achieved at cellulose flow rates
up to 100 g hr−1with SPP of 45 % without addition of H2. Addition of 0.4 SLPM
H2 consistently increased SPP by 10-15 %. A similar trend was seen for H2 addition
over Rh-Ce/γ-Al2O3 monoliths (Table 4.1). The rapid consumption of O2 by reaction
with H2 limited the O2 available to react with cellulose pyrolysis vapors. Previous
work by Donazzi et al. shows the selective oxidation of H2 over Rh/α-Al2O3 during
the catalytic partial oxidation of CH4.110 Additionally, Michael et al. demonstrated
the sacrificial oxidation of H2 in a catalytic partial oxidation system to increase the
yield of olefin products.111 This effect is attributed to the higher sticking coefficient
on noble metal catalysts and the higher diffusion coefficient of H2 than alkanes in a
mass transfer limited system.
4.4 Conclusions
Experiments have demonstrated that a fixed-bed catalytic pyrolysis reactor can run
autothermally to produce high yields of pyrolysis oil from cellulose with no observable
char formation. These properties allow for continuous operation without the need for
external heating, thus increasing the overall energy efficiency of pyrolysis oil produc-
tion. The use of platinum spheres, which favor combustion and have low reforming
activity, along with a high C/O feed ratio of 1.7 maximizes carbon selectivity to py-
rolysis oil. H2 addition as a sacrificial fuel improved reactor performance at higher
cellulose feed rates and lower C/O ratios. Preliminary product characterization has
4.5 Acknowledgments 54
revealed a very acidic liquid product (pH ∼ 2) with acetic acid, formic acid, propanoic
acid, phenol, and levoglucosan as major products, which agrees with previous work.112,113 However, a much more detailed analysis is required. Future experimentation
and characterization of the pyrolysis oil product is proposed and discussed in Chap-
ter 6.
4.5 Acknowledgments
We would like to thank Reetam Chakrabarti for obtaining the SEM micrographs
printed in this article. Parts of this work were carried out in the Characterization
Facility, University of Minnesota, which receives partial support from NSF through
the MRSEC program.This article is also based on work supported under a National
Science Foundation Graduate Research Fellowship and partially supported by U.S.
Department of Energy Grant DE-FG02-88ER13878.
CHAPTER
FIVE
EFFECT OF ALKALI METAL IMPURITIES ON CO-RE
CATALYSTS FOR FISCHER-TROPSCH SYNTHESIS
FROM BIOMASS-DERIVED SYNGAS1
Chapters 2, 3, and 4 discussed catalytic oxidative pyrolysis of lignocellulosic biomass
as an alternative technology to traditional pyrolysis. Gasification of biomass followed
by Fischer-Tropsch (FT) processing is another means to produce liquid products. The
Schmidt group has previously demonstrated the ability to produce clean synthesis
gas with high selectivity from biomass (Section 1.2.3). Here, the effect of biomass
inorganics is discussed in the context of processing biomass-derived synthesis gas over
a Co-based Fischer-Tropsch catalyst. The effects of Na, K, Li, and Ca impurities on
γ-Al2O3-supported CoRe powder catalysts were studied at impurity loadings between
25 and 1,000 ppm. Impurity addition did not have any effect on H2 chemisorption, but
the catalyst activity decreased during FT synthesis experiments. The impurities were
also found to slightly increase the reduction temperatures of Co. Carbon selectivities
to CH4 decreased with increasing impurity loading, while CO2 and C5+ hydrocarbon
selectivities increased. Catalyst behavior was attributed mostly to electronic effects
from the alkali addition, leading to decreased surface H concentrations and increased
CO adsorption and dissociation.
1Portions of this chapter appear in C.M. Balonek, A.H. Lillebo, S Rane, E. Rytter, L.D. Schmidt,A. Holmen, “Effect of alkali metal impurities on Co-Re catalysts for Fischer-Tropsch synthesis frombiomass-derived syngas,” Catalysis Letters 138 (2010) 8-13. c© 2010 Springer Science + BusinessMedia, LLC.
55
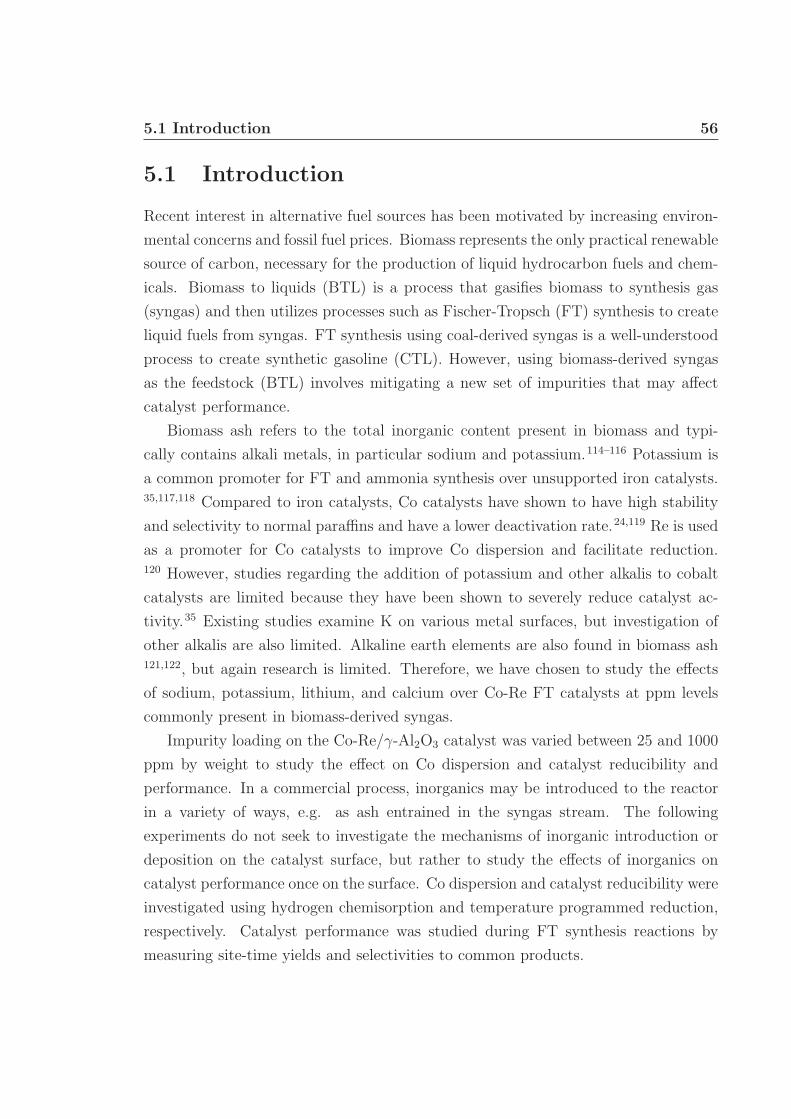
5.1 Introduction 56
5.1 Introduction
Recent interest in alternative fuel sources has been motivated by increasing environ-
mental concerns and fossil fuel prices. Biomass represents the only practical renewable
source of carbon, necessary for the production of liquid hydrocarbon fuels and chem-
icals. Biomass to liquids (BTL) is a process that gasifies biomass to synthesis gas
(syngas) and then utilizes processes such as Fischer-Tropsch (FT) synthesis to create
liquid fuels from syngas. FT synthesis using coal-derived syngas is a well-understood
process to create synthetic gasoline (CTL). However, using biomass-derived syngas
as the feedstock (BTL) involves mitigating a new set of impurities that may affect
catalyst performance.
Biomass ash refers to the total inorganic content present in biomass and typi-
cally contains alkali metals, in particular sodium and potassium.114–116 Potassium is
a common promoter for FT and ammonia synthesis over unsupported iron catalysts.35,117,118 Compared to iron catalysts, Co catalysts have shown to have high stability
and selectivity to normal paraffins and have a lower deactivation rate.24,119 Re is used
as a promoter for Co catalysts to improve Co dispersion and facilitate reduction.120 However, studies regarding the addition of potassium and other alkalis to cobalt
catalysts are limited because they have been shown to severely reduce catalyst ac-
tivity.35 Existing studies examine K on various metal surfaces, but investigation of
other alkalis are also limited. Alkaline earth elements are also found in biomass ash121,122, but again research is limited. Therefore, we have chosen to study the effects
of sodium, potassium, lithium, and calcium over Co-Re FT catalysts at ppm levels
commonly present in biomass-derived syngas.
Impurity loading on the Co-Re/γ-Al2O3 catalyst was varied between 25 and 1000
ppm by weight to study the effect on Co dispersion and catalyst reducibility and
performance. In a commercial process, inorganics may be introduced to the reactor
in a variety of ways, e.g. as ash entrained in the syngas stream. The following
experiments do not seek to investigate the mechanisms of inorganic introduction or
deposition on the catalyst surface, but rather to study the effects of inorganics on
catalyst performance once on the surface. Co dispersion and catalyst reducibility were
investigated using hydrogen chemisorption and temperature programmed reduction,
respectively. Catalyst performance was studied during FT synthesis reactions by
measuring site-time yields and selectivities to common products.
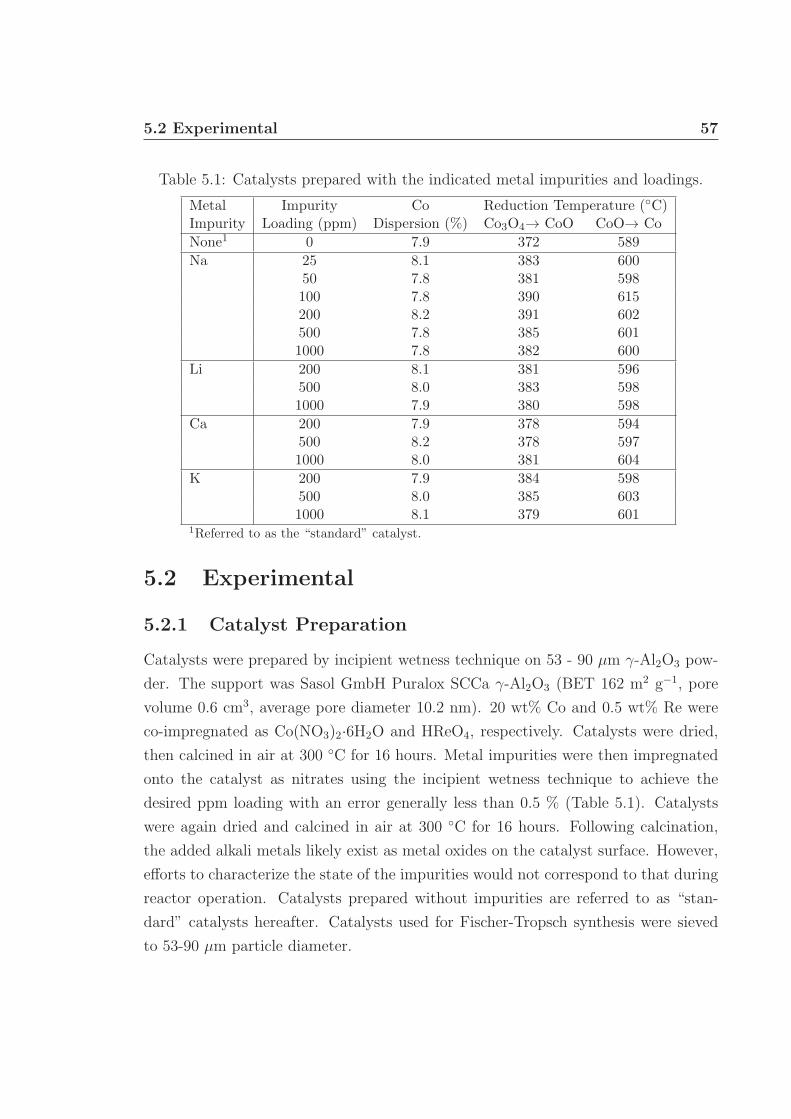
5.2 Experimental 57
Table 5.1: Catalysts prepared with the indicated metal impurities and loadings.
Metal Impurity Co Reduction Temperature (◦C)Impurity Loading (ppm) Dispersion (%) Co3O4→ CoO CoO→ Co
None1 0 7.9 372 589
Na 25 8.1 383 60050 7.8 381 598100 7.8 390 615200 8.2 391 602500 7.8 385 6011000 7.8 382 600
Li 200 8.1 381 596500 8.0 383 5981000 7.9 380 598
Ca 200 7.9 378 594500 8.2 378 5971000 8.0 381 604
K 200 7.9 384 598500 8.0 385 6031000 8.1 379 601
1Referred to as the “standard” catalyst.
5.2 Experimental
5.2.1 Catalyst Preparation
Catalysts were prepared by incipient wetness technique on 53 - 90 µm γ-Al2O3 pow-
der. The support was Sasol GmbH Puralox SCCa γ-Al2O3 (BET 162 m2 g−1, pore
volume 0.6 cm3, average pore diameter 10.2 nm). 20 wt% Co and 0.5 wt% Re were
co-impregnated as Co(NO3)2·6H2O and HReO4, respectively. Catalysts were dried,
then calcined in air at 300 ◦C for 16 hours. Metal impurities were then impregnated
onto the catalyst as nitrates using the incipient wetness technique to achieve the
desired ppm loading with an error generally less than 0.5 % (Table 5.1). Catalysts
were again dried and calcined in air at 300 ◦C for 16 hours. Following calcination,
the added alkali metals likely exist as metal oxides on the catalyst surface. However,
efforts to characterize the state of the impurities would not correspond to that during
reactor operation. Catalysts prepared without impurities are referred to as “stan-
dard” catalysts hereafter. Catalysts used for Fischer-Tropsch synthesis were sieved
to 53-90 µm particle diameter.
5.2 Experimental 58
5.2.2 Hydrogen Chemisorption
To study the effect of metal impurities on Co dispersion, hydrogen chemisorption
was performed on a Micromeritics ASAP 2010 unit. Prior to chemisorption, the
catalysts were reduced in situ under H2 at 350 ◦C for 16 hours (ramp rate of 1 ◦C
min−1 from 20 ◦C), then cooled to 40 ◦C under vacuum. To calculate the dispersion
from the resulting adsorption isotherms between 0.020 and 0.667 bar, it was assumed
that one Co site is occupied by one H atom and that neither Re nor the impurity
adsorb hydrogen.120,123 Reported dispersion data are an average of two chemisorption
measurements.
5.2.3 Temperature Programmed Reduction
Temperature programmed reduction (TPR) was performed in a quartz reactor tube
under a flow of 7 % H2 in Ar. The catalyst and reactor tube were heated in a furnace
at 10 ◦C min−1 from 20 ◦C to 935 ◦C. Effluent passed through a 2-propanol and dry
ice cold trap before hydrogen consumption was analyzed using a thermal conductivity
detector (TCD).
5.2.4 Fischer-Tropsch Synthesis
FT synthesis was carried out in a stainless steel, 10 mm ID fixed bed reactor at 210 ◦C
and 20 bar with a syngas feed of H2/CO = 2.1. 1 g of catalyst was mixed with 4 g of
inert SiC to improve heat distribution throughout the catalyst bed, then loaded with
quartz wool into the reactor tube.
The catalyst was reduced in situ under H2 with a temperature ramp of 1 ◦C min−1
to 350 ◦C and held for 16 hours. The catalyst was then cooled to 170 ◦C, pressurized
to 20 bar, and the syngas feed was introduced at 0.25 SLPM. The temperature was
then ramped at 0.5 ◦C min−1 to 190 ◦C, then 5 ◦C h−1 to 200 ◦C, and finally 0.1 ◦C
min−1 to 210 ◦C. The synthesis experiments were run in two stages. First, a constant
syngas feed rate of 0.25 SLPM was maintained. Next, the feed rate was adjusted
to maintain ∼ 50 % conversion of inlet CO as measured by a gas chromatograph.
Reported data were obtained after ∼ 30 hours on stream at constant volumetric
syngas feed rate and at ∼ 24 hours on stream at constant CO conversion (∼ 54 total
hours on stream), i.e. after the feed had been adjusted to give a CO conversion of ∼
50 %.
Two traps were maintained downstream of the catalyst bed at 90 ◦C and 20 ◦C to
5.3 Results 59
condense heavy hydrocarbon and liquid products, respectively. Gases lighter than C5
hydrocarbons were then fed to an HP 6890 gas chromatograph with a GS-Alumina
PLOT column, TCD, and flame ionization detector (FID) for identification and quan-
tification. The GC quantified species to within 0.5 %. The ∼ 3 % N2 present in the
feed gas served as an internal standard for quantification.
5.3 Results
5.3.1 Hydrogen Chemisorption
Dispersion of Co metal on the catalysts calculated from H2 chemisorption data is
presented in Table 5.1. All catalysts had a dispersion of ∼ 8 ± 0.5 % and the
impurity metals had an indistinguishable effect on Co dispersion, even at 1000 ppm
loading. Previous work demonstrated that potassium loading of 0.4 wt% over γ-
Al2O3-supported Co decreased dispersion by 1.2 %, which was assumed to be due to
blockage or poisoning of the cobalt sites by the alkali.117 However, this loading was
4 times greater than the 1000 ppm loading examined here, and it is likely that the
effect of such low alkali loadings falls within the error of the chemisorption unit.
5.3.2 Temperature Programmed Reduction
The hydrogen consumption profiles obtained during temperature programmed reduc-
tion of the standard and 1000 ppm-loaded catalysts are plotted in Figure 5.1. The two
main peaks of the profiles are associated with the two-step reduction of cobalt(II,III)
oxide to cobalt metal: at ∼ 385 ◦C Co3O4 is reduced to CoO, and at ∼ 600 ◦C CoO is
reduced to Co metal.117,120 The much smaller third peak present at ∼ 310 ◦C results
from the reduction of residual nitrates present after calcination. The temperatures of
the cobalt reduction peaks for all catalysts are listed in Table 5.1. While the shape of
the profiles was consistent for all catalysts, the peak temperatures of catalysts loaded
with impurities increased ∼ 5 - 15 ◦C compared to those of the standard catalyst.
This indicates that adding alkali impurities to the catalyst hinders its reducibility.
5.3.3 Fischer-Tropsch Synthesis
FT synthesis data is reported after ∼ 30 hours of catalyst operation at constant feed
rate and ∼ 24 hours at 50 % conversion of CO feed. Catalyst activity is reported
as site-time yields (STY = mol CO converted·mol Co sites−1 s−1) and plotted in
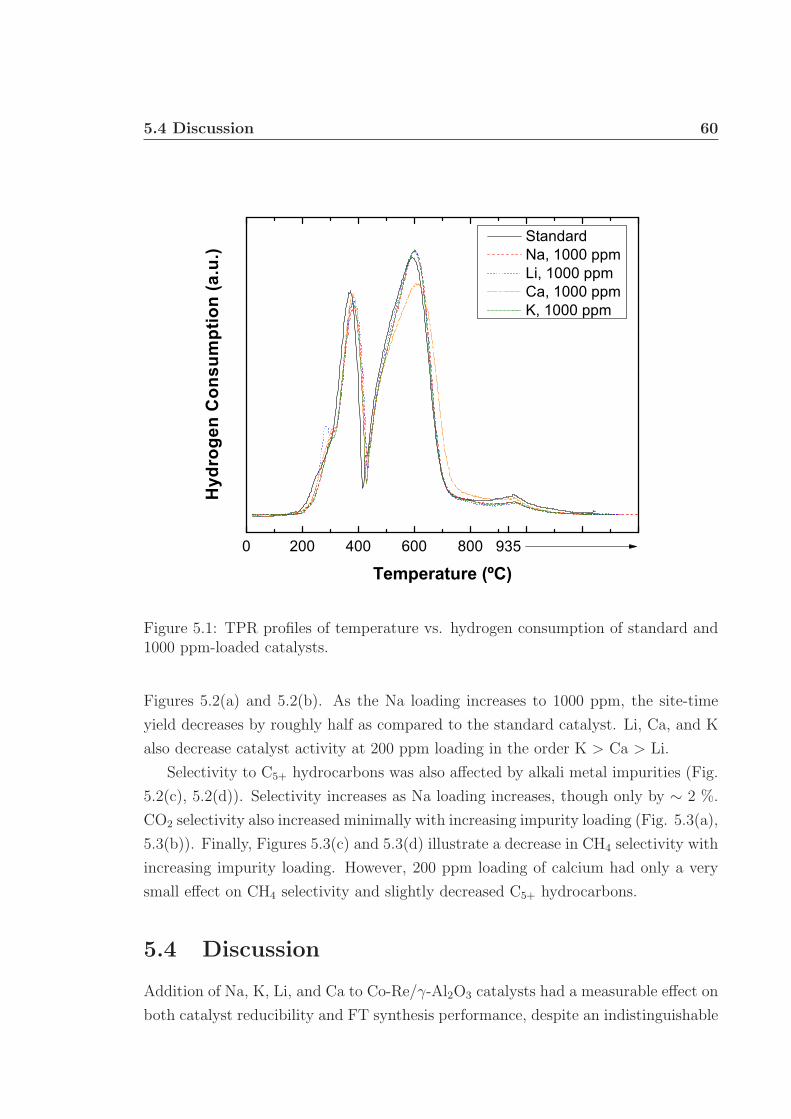
5.4 Discussion 60
0 200 400 600 800 9351000 1200 1400
Hyd
roge
n C
onsu
mpt
ion
(a.u
.)
Temperature (ºC)
Standard Na, 1000 ppm Li, 1000 ppm Ca, 1000 ppm K, 1000 ppm
935
Figure 5.1: TPR profiles of temperature vs. hydrogen consumption of standard and1000 ppm-loaded catalysts.
Figures 5.2(a) and 5.2(b). As the Na loading increases to 1000 ppm, the site-time
yield decreases by roughly half as compared to the standard catalyst. Li, Ca, and K
also decrease catalyst activity at 200 ppm loading in the order K > Ca > Li.
Selectivity to C5+ hydrocarbons was also affected by alkali metal impurities (Fig.
5.2(c), 5.2(d)). Selectivity increases as Na loading increases, though only by ∼ 2 %.
CO2 selectivity also increased minimally with increasing impurity loading (Fig. 5.3(a),
5.3(b)). Finally, Figures 5.3(c) and 5.3(d) illustrate a decrease in CH4 selectivity with
increasing impurity loading. However, 200 ppm loading of calcium had only a very
small effect on CH4 selectivity and slightly decreased C5+ hydrocarbons.
5.4 Discussion
Addition of Na, K, Li, and Ca to Co-Re/γ-Al2O3 catalysts had a measurable effect on
both catalyst reducibility and FT synthesis performance, despite an indistinguishable
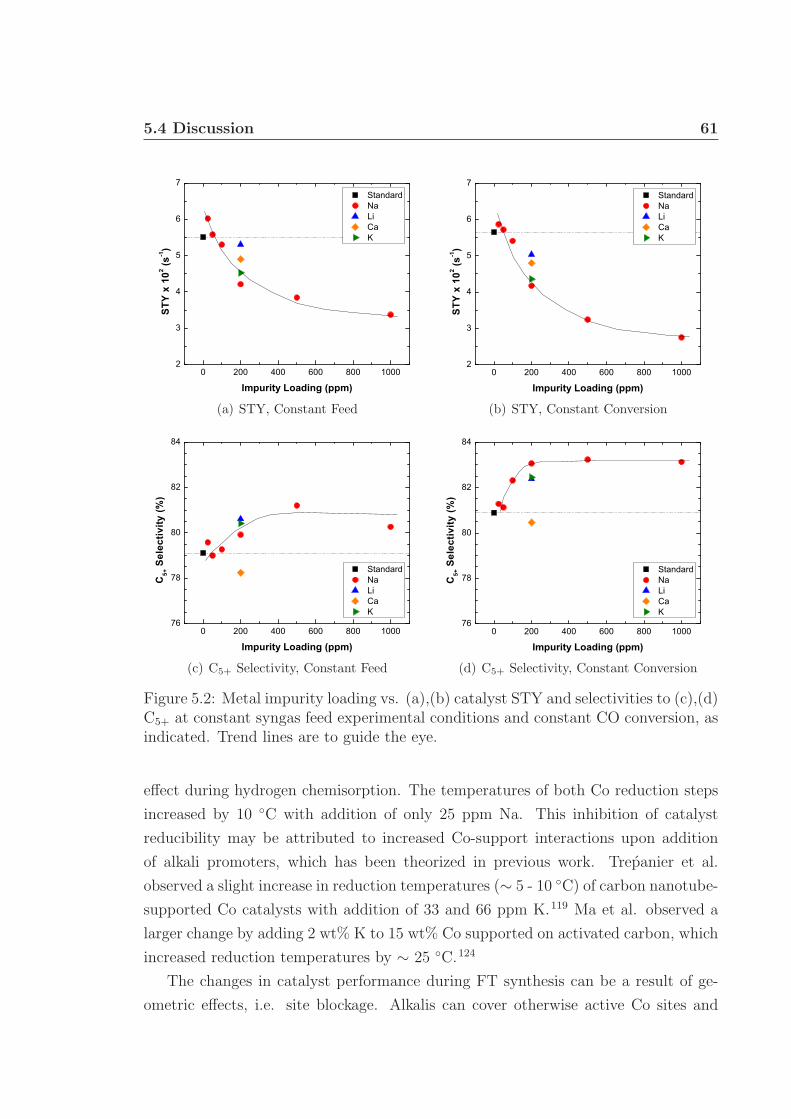
5.4 Discussion 61
0 200 400 600 800 10002
3
4
5
6
7
Standard Na Li Ca K
STY
x 10
2 (s-1)
Impurity Loading (ppm)
(a) STY, Constant Feed
0 200 400 600 800 10002
3
4
5
6
7
Standard Na Li Ca K
STY
x 10
2 (s-1)
Impurity Loading (ppm)
(b) STY, Constant Conversion
0 200 400 600 800 100076
78
80
82
84
Standard Na Li Ca K
C5+
Sel
ectiv
ity (%
)
Impurity Loading (ppm)
(c) C5+ Selectivity, Constant Feed
0 200 400 600 800 100076
78
80
82
84
Standard Na Li Ca K
C5+
Sel
ectiv
ity (%
)
Impurity Loading (ppm)
(d) C5+ Selectivity, Constant Conversion
Figure 5.2: Metal impurity loading vs. (a),(b) catalyst STY and selectivities to (c),(d)C5+ at constant syngas feed experimental conditions and constant CO conversion, asindicated. Trend lines are to guide the eye.
effect during hydrogen chemisorption. The temperatures of both Co reduction steps
increased by 10 ◦C with addition of only 25 ppm Na. This inhibition of catalyst
reducibility may be attributed to increased Co-support interactions upon addition
of alkali promoters, which has been theorized in previous work. Trepanier et al.
observed a slight increase in reduction temperatures (∼ 5 - 10 ◦C) of carbon nanotube-
supported Co catalysts with addition of 33 and 66 ppm K.119 Ma et al. observed a
larger change by adding 2 wt% K to 15 wt% Co supported on activated carbon, which
increased reduction temperatures by ∼ 25 ◦C.124
The changes in catalyst performance during FT synthesis can be a result of ge-
ometric effects, i.e. site blockage. Alkalis can cover otherwise active Co sites and
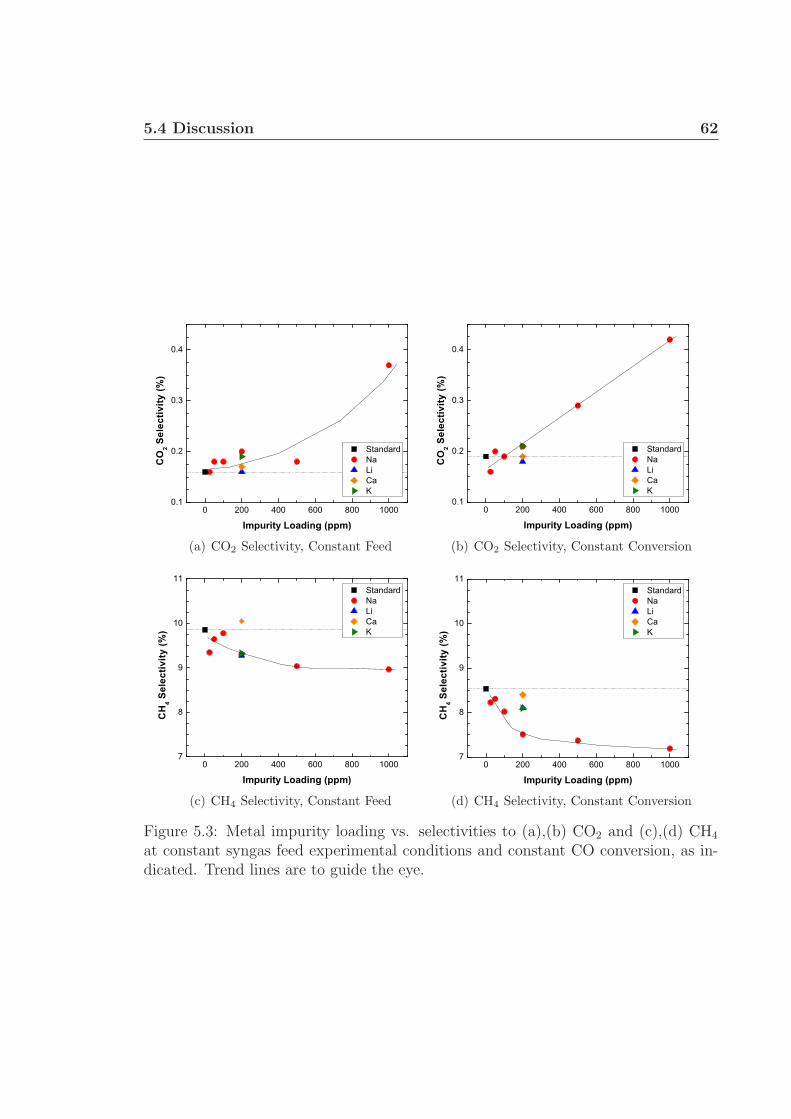
5.4 Discussion 62
0 200 400 600 800 10000.1
0.2
0.3
0.4
Standard Na Li Ca K
CO
2 Sel
ectiv
ity (%
)
Impurity Loading (ppm)
(a) CO2 Selectivity, Constant Feed
0 200 400 600 800 10000.1
0.2
0.3
0.4
Standard Na Li Ca K
CO
2 Sel
ectiv
ity (%
)
Impurity Loading (ppm)
(b) CO2 Selectivity, Constant Conversion
0 200 400 600 800 10007
8
9
10
11
CH
4 Sel
ectiv
ity (%
)
Impurity Loading (ppm)
Standard Na Li Ca K
(c) CH4 Selectivity, Constant Feed
0 200 400 600 800 10007
8
9
10
11
Standard Na Li Ca K
CH
4 Sel
ectiv
ity (%
)
Impurity Loading (ppm)
(d) CH4 Selectivity, Constant Conversion
Figure 5.3: Metal impurity loading vs. selectivities to (a),(b) CO2 and (c),(d) CH4
at constant syngas feed experimental conditions and constant CO conversion, as in-dicated. Trend lines are to guide the eye.
5.5 Conclusions 63
discourage H2 dissociation, as H2 generally requires two adjacent metal sites to disso-
ciate.123,125 A decrease in available surface H reduces CH4 selectivity and increases se-
lectivity to larger hydrocarbon products124,126,127, both observed in the present work.
However, the chemisorption results indicated that the addition of up to 1000 ppm of
impurity did not affect the hydrogen adsorption. Considering the very low impurity
loadings examined here in combination with negligible changes in the amount of hy-
drogen adsorbed, we surmise that geometric effects from alkali loadings were minimal
and electronic effects were largely responsible for the changes observed during FT
synthesis.
We postulate that the electronic effects can be attributed to the changes in the
adsorption of the reactants on the catalyst surface. Electropositive alkalis added
to the Co catalyst transfer charge to the catalyst surface, inducing “long-range elec-
tronic effects” and influencing H2 and CO adsorption and dissociation.118,123,125,128–131
K addition to Fe(100), Fe(111), Pt(111), and Pd(100) has shown to increase the ad-
sorption energy of H2, decrease the sticking coefficient of H2, stabilize H2 on the
surface, and discourage dissociation due to electron donation from K to the bulk
metal.118,123,125,128,130 Blekkan et al. associated this decrease in available surface H
with less catalytic activity and a higher hydrocarbon selectivity for K on Co.117
A study by Ma et al. showed that the selectivity to CO2 increased with increased
K loading on activated carbon-supported Co catalysts, which was attributed to an
increase in water gas shift activity resulting from an increase in adsorbed CO species.124 Several other studies discuss the increased adsorption and dissociation of CO on
Fe and Co.35,118,126,129 Previous work credited these adsorption effects for reducing
methane formation on activated carbon-supported Co124 and Fe126 catalysts, increas-
ing water-gas-shift activity124, and increasing selectivity to large hydrocarbons on Fe126,127, carbon nanotube-supported Co119, and other supported FT catalysts.117 In
agreement with these studies, we observed significant reduction in catalyst activity,
increased selectivity to C5+ hydrocarbons, decreased selectivity to methane, and a
slight increase in CO2 production.
5.5 Conclusions
This work examined the effect of ppm-level alkali impurities on Co-based FT catalysts.
The behavior of such impurities, specifically sodium, is important for understanding
the effects that biomass-derived syngas may have on FT synthesis over Co-Re cata-
lysts. Alkalis had a negligible effect on Co dispersion and slightly hindered catalyst
5.6 Acknowledgments 64
reducibility by increasing the Co reduction temperatures. Na was found to greatly
decrease catalyst activity and selectivity to CH4, while increasing selectivity to CO2
and C5+ hydrocarbons. Such effects are attributed minimally to geometric effects of
surface alkalis, which can block active catalyst sites, and mostly to electronic effects
which have been shown previously to affect H2 and CO adsorption and dissociation.
5.6 Acknowledgments
This material is based upon work supported under a National Science Foundation
Graduate Research Fellowship. Support was also received from the Research Coun-
cil of Norway and the Norwegian University of Science and Technology. Statoil is
acknowledged for providing the standard catalysts.
CHAPTER
SIX
FUTURE WORK
Current thermochemical methods for converting lignocellulosic biomass to liquid
products include pyrolysis and gasification/Fischer-Tropsch. However, both meth-
ods have challenges that limit their use on a commercial scale. Pyrolysis technologies
are energy intensive, create undesirable solid char, and are not chemically selective.
Gasification operations require large-scale facilities to be economical and extensive
downstream cleanup of the syngas before reaction in a Fischer-Tropsch unit. Cat-
alytic oxidative pyrolysis of solid biomass to liquid products may provide a small-scale,
efficient, and economical alternative to traditional technologies.
Chapter 1 introduced millisecond catalytic autothermal reforming technology af-
ter discussing the disadvantages and current state of commercial biomass to liquid
technologies. Chapter 2 demonstrated the existence of an intermediate liquid during
the catalytic reforming of cellulose, while Chapters 3 and 4 examined the extension
of this technology to perform autothermal oxidative pyrolysis of biomass models for
liquid production. After successful demonstration of pyrolysis oil production from cel-
lulose in an autothermal catlaytic reactor, it is of interest to be able to characterize
the resulting pyrolysis products. Chapter 6 will discuss characterization of cellulosic
pyrolysis oil and examine the effect of operating conditions and catalyst metal on
product selectivity and tunability. Also discussed in this chapter are experiments to
study oxidative pyrolysis of plastic feedstocks.
65
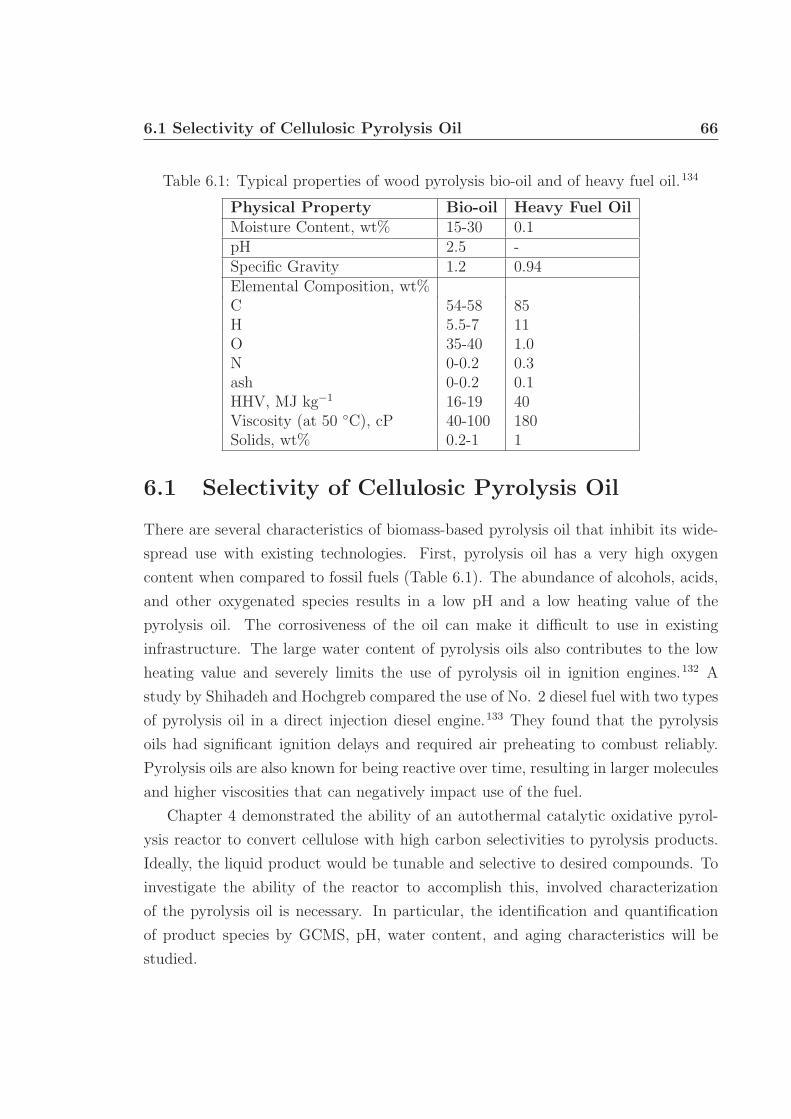
6.1 Selectivity of Cellulosic Pyrolysis Oil 66
Table 6.1: Typical properties of wood pyrolysis bio-oil and of heavy fuel oil.134
Physical Property Bio-oil Heavy Fuel OilMoisture Content, wt% 15-30 0.1pH 2.5 -Specific Gravity 1.2 0.94Elemental Composition, wt%C 54-58 85H 5.5-7 11O 35-40 1.0N 0-0.2 0.3ash 0-0.2 0.1HHV, MJ kg−1 16-19 40Viscosity (at 50 ◦C), cP 40-100 180Solids, wt% 0.2-1 1
6.1 Selectivity of Cellulosic Pyrolysis Oil
There are several characteristics of biomass-based pyrolysis oil that inhibit its wide-
spread use with existing technologies. First, pyrolysis oil has a very high oxygen
content when compared to fossil fuels (Table 6.1). The abundance of alcohols, acids,
and other oxygenated species results in a low pH and a low heating value of the
pyrolysis oil. The corrosiveness of the oil can make it difficult to use in existing
infrastructure. The large water content of pyrolysis oils also contributes to the low
heating value and severely limits the use of pyrolysis oil in ignition engines.132 A
study by Shihadeh and Hochgreb compared the use of No. 2 diesel fuel with two types
of pyrolysis oil in a direct injection diesel engine.133 They found that the pyrolysis
oils had significant ignition delays and required air preheating to combust reliably.
Pyrolysis oils are also known for being reactive over time, resulting in larger molecules
and higher viscosities that can negatively impact use of the fuel.
Chapter 4 demonstrated the ability of an autothermal catalytic oxidative pyrol-
ysis reactor to convert cellulose with high carbon selectivities to pyrolysis products.
Ideally, the liquid product would be tunable and selective to desired compounds. To
investigate the ability of the reactor to accomplish this, involved characterization
of the pyrolysis oil is necessary. In particular, the identification and quantification
of product species by GCMS, pH, water content, and aging characteristics will be
studied.
6.1 Selectivity of Cellulosic Pyrolysis Oil 67
6.1.1 Experimental Details
Catalyst Selection
Pyrolysis oil production will be conducted over Rh, Rh-Ce, Pt, and Pt-Sn catalysts.
The catalyst bed will be 3.1 g (equivalent to 1 cm bed height) of 1.3 mm diameter
α-Al2O3 spheres. Results in Chapter 4 showed that catalyst deposited on α-Al2O3
spheres, rather than monoliths, had higher carbon selectivity to pyrolysis products,
which may be a consequence of higher O2 consumption rates and front face tempera-
tures. Therefore, spheres are chosen for these experiments to maximize pyrolysis oil
yields.
Rhodium catalysts used in catalytic partial oxidation have consistently demon-
strated high fuel conversions, high syngas yields, high stability, and resistance to coke
deposition.38,39,41,135 Rh has a high tendency to produce H2 since the activation bar-
rier to dimerize hydrogen is lower than that of OH and H2O. Previous experiments
have shown that catalyst loadings between 0.05 and 15 wt% Rh loading had very
little effect on fuel conversion and product selectivities.38,42,43 2.5 wt% Rh loading is
chosen for experiments to be well within this region.
Addition of cerium to a Rh catalyst is chosen based on cerium’s ability to stabi-
lize the noble metal catalyst, improve desired product selectivities, and prevent coke
formation. Previous research has consistently shown that metal catalysts have signifi-
cantly higher selectivities to syngas upon cerium addition due to increased water-gas-
shift activity.40–42 Addition of cerium also increases the stability of metal catalysts
by increasing oxidation rates on the surface, preventing coke formation.90 As an ac-
tive oxidation catalyst, cerium can store and donate oxygen for reactions on Rh
sites.41,90,92,93
Platinum was chosen as the second noble metal catalyst based on its ability to
select for larger hydrocarbons and combustion products, rather than synthesis gas.
Minimizing partial oxidation of cellulose, which is endothermic, and selecting for com-
plete oxidation can maximize heat available for pyrolysis reactions while sacrificing
the least amount of feedstock. Pt has previously been shown to be a very effective
catalyst for olefin production by oxidative dehydrogenation, as well as an effective
combustion catalyst with minimal endothermic reforming activity.38,107,108 Chapter
4 discusses the higher yields of pyrolysis products obtained over a Pt catalyst when
compared to Rh-based catalysts. Finally, Sn is proposed as an additive to Pt to
further promote oxidation activity.136
6.1 Selectivity of Cellulosic Pyrolysis Oil 68
Catalyst Preparation
Catalysts will be prepared on 1.3 mm diameter α-Al2O3 spheres. Rhodium catalysts
with a desired loading of 2.5 wt% are prepared by creating an aqueous solution of Rh,
as Rh(NO3)3, and using an incipient wetness technique to apply the solution dropwise
to the blank α-Al2O3 spheres. The coated and dried spheres are then calcined for
6 hours at 600 ◦C in air at atomspheric pressure. Rh-Ce catalysts are also prepared
in a similar manner, with a desired loading of 2.5 wt% each of Rh and Ce, using an
aqueous solution of Rh and Ce, as Ce(NO3)3·6H2O, to coat blank spheres. Platinum
catalysts are prepared similarly, with a desired loading of 2.5 wt%, using an aqueous
solution of Pt, as H2PtCl6, but rather than calcining in air, Pt catalysts are reduced
under a mixture of hydrogen and nitrogen by ramping the temperature 5 ◦C min−1
from 25 ◦C to 500 ◦C and holding at 500 ◦C for 6 hours. Pt-Sn catalysts are 2.5 wt%
Pt and 2.5 wt% Sn (Tin(II) chloride) and are reduced in the same manner.
Reactor Setup
Similar to experiments discussed in Chapter 4, cellulose pyrolysis will be conducted
over a fixed bed catalyst contained in a 19 mm ID quartz reactor tube (Fig. 6.1).
The catalyst bed will be 3.1 g of coated spheres, equivalent to a 1 cm bed. Mass flow
controllers will feed O2 and N2 to the reactor with air stoichiometry. A 0.1 SLPM
CH4 feed will suppress cellulose ignition before reacting the catalyst bed.100 A Schenck
AccuRate auger/hopper system will feed 60 g h−1 of 300 µm microcrystalline cellulose
to the reactor. A round bottom flask will collect liquid products and be placed into
a dry-ice bath to maximize condensation. The effects of N2 and O2 feed rates and
catalyst metal on the pyrolysis oil yields and composition will be studied.
During reactor operation a HP 6890 GC will be used to identify and quantify gas
samples of oxidation and C1 products. All carbon species not identified as CO, CO2,
or CH4 will be grouped and identified as pyrolysis products. Pyrolysis oil collected
during reactor operation will be characterized using several different methods. All
characterization will be conducted within 6 hours of pyrolysis oil collection. pH will be
measured with a Corning Model 430 pH meter. Water content will be measured by the
Dean-Stark method, Figure 6.2.137 The water fraction collected will be characterized
with a GCMS to account for any other species that may have remained in the aqueous
phase.
In addition to pH and water content measurements, the pyrolysis oil will be an-
alyzed by GCMS. Pyrolysis oil will be filtered using a 0.45 µm PTFE syringe filter
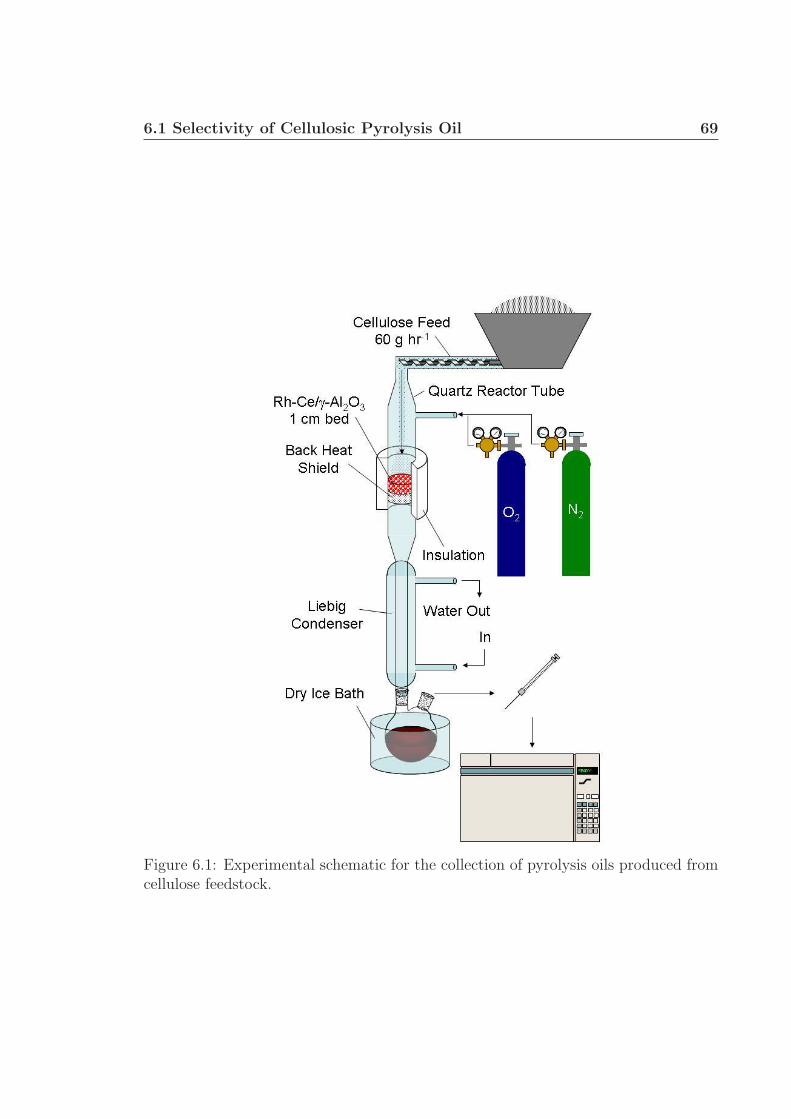
6.1 Selectivity of Cellulosic Pyrolysis Oil 69
Figure 6.1: Experimental schematic for the collection of pyrolysis oils produced fromcellulose feedstock.
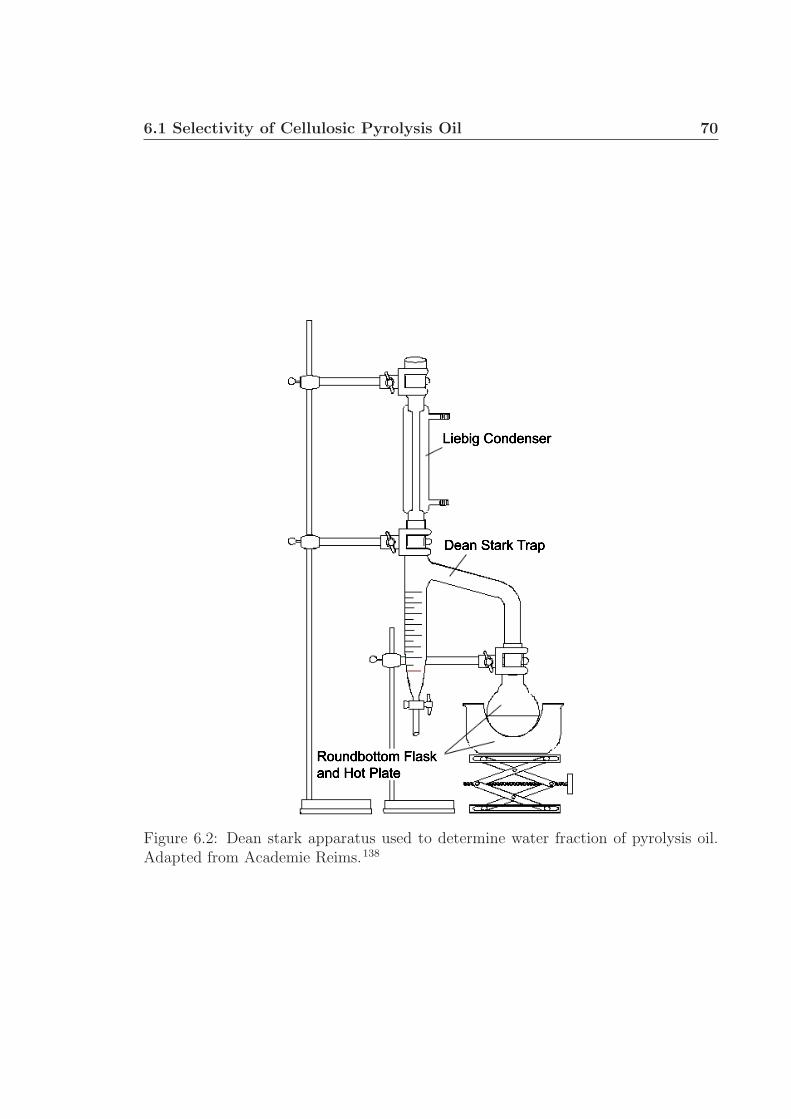
6.1 Selectivity of Cellulosic Pyrolysis Oil 70
Figure 6.2: Dean stark apparatus used to determine water fraction of pyrolysis oil.Adapted from Academie Reims.138
6.1 Selectivity of Cellulosic Pyrolysis Oil 71
before analysis. An optical microscope was used to identify small particles (2 µm) in
the pyrolysis oil during preliminary experiments, which are capable of clogging a GC
column. 1 wt% iso-propanol is added to the pyrolysis oil sample as an internal stan-
dard. The GCMS is equipped with a 30 m x 0.32 mm x 0.50 µm DB-WAX column
to separate pyrolysis species. Peaks were identified on the MS and the twelve largest
peaks were selected for calibration (Table 6.2). Example chromatographs (MS Scan
mode) with selected species are shown in Figure 6.3. Selected Ion Monitoring (SIM)
mode on the MS is used to identify the five most abundant ions for each species for
quantification (Table 6.1).139 Compared to scan mode, SIM mode offers longer dwell
times, lower detection limits, and less noise, allowing for more accurate quantification
of species.
6.1.2 Preliminary Data/Discussion
Preliminary experiments have been conducted with the 2.5 wt% Pt catalyst. Data
has been obtained for both gas and liquid products for C/O ratios (carbon atoms
in cellulose feedstock/oxygen atoms in oxygen feed) of 1.2 to 1.8 in 0.1 increments.
Cellulose was fed at 60 g hr−1 and the catalyst was operated for 20+ hours without
observable char formation or deactivation.
Data for non-condensible gases was obtained with a HP 6890 gas chromatograph.
H2, CO, CO2, and CH4 were quantified and lumped to determine the mass fraction of
gaseous products. Figure 6.4 shows the mass fraction of gaseous products based on
the cellulose feed (black squares). The remaining fraction is designated as pyrolysis
products. Research groups investigating pyrolysis oil production frequently report
mass yields of products. However, pyrolysis oils can contain large amounts of water
that contribute to liquid yield, but not to valuable products. Carbon selectivity may
be a better metric and therefore the selectivity to gaseous products (CO, CO2, CH4)
is also shown in Figure 6.4 (gray squares). Again, the remaining portion is attributed
to pyrolysis products.
Pyrolysis products were condensed and collected for analysis at each C/O ratio.
All samples were a single aqueous phase and did not phase separate with age. Pyrol-
ysis liquids collected at the lowest C/O ratios tested had a light gold/tan color and
were semi-transparent. Liquids collected at the highest C/O ratios were dark brown
in color and completely opaque. Opaqueness in the samples is attributed to small
particles (2 µm), which were filtered before analysis by GCMS. Particulate matter
within the liquid product is assumed to be a result of the condensation apparatus
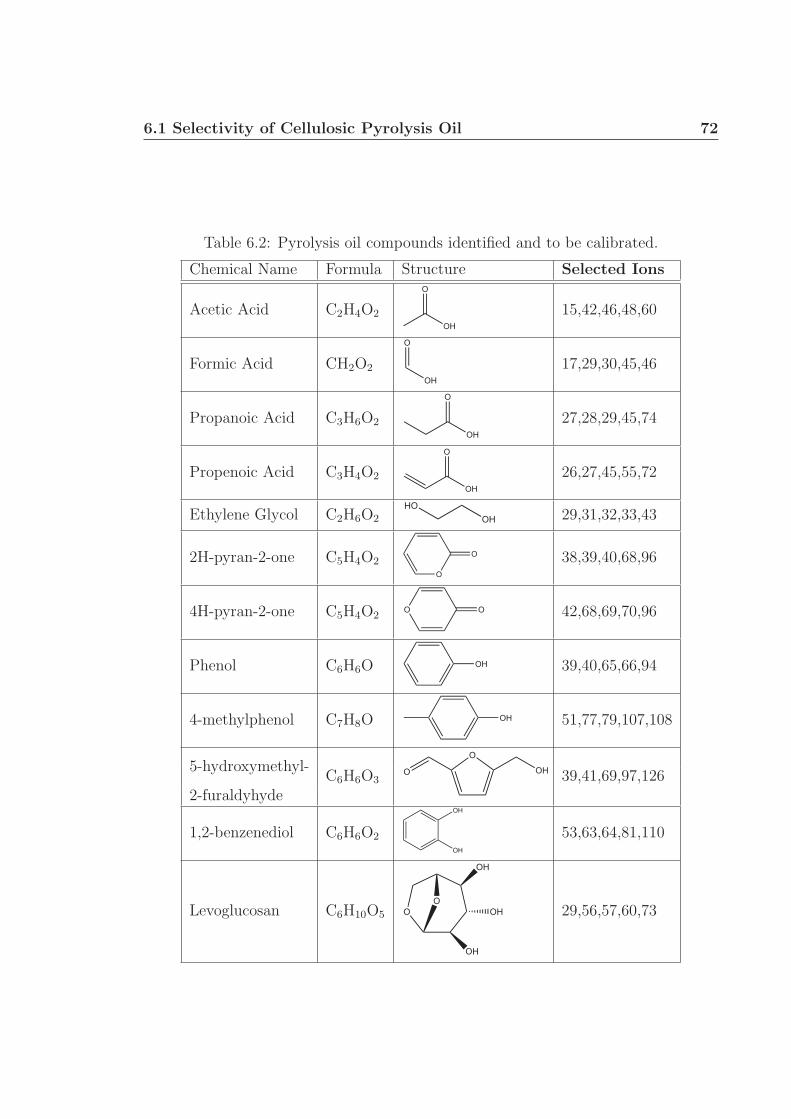
6.1 Selectivity of Cellulosic Pyrolysis Oil 72
Table 6.2: Pyrolysis oil compounds identified and to be calibrated.
Chemical Name Formula Structure Selected Ions
Acetic Acid C2H4O2OH
O
15,42,46,48,60
Formic Acid CH2O2
O
OH
17,29,30,45,46
Propanoic Acid C3H6O2
O
OH
27,28,29,45,74
Propenoic Acid C3H4O2
O
OH
26,27,45,55,72
Ethylene Glycol C2H6O2 OH
HO29,31,32,33,43
2H-pyran-2-one C5H4O2O
O 38,39,40,68,96
4H-pyran-2-one C5H4O2O O 42,68,69,70,96
Phenol C6H6O OH 39,40,65,66,94
4-methylphenol C7H8O OH 51,77,79,107,108
5-hydroxymethyl-C6H6O3
O
OHO 39,41,69,97,1262-furaldyhyde
1,2-benzenediol C6H6O2
OH
OH
53,63,64,81,110
Levoglucosan C6H10O5 O
OH
OH
OHO
29,56,57,60,73
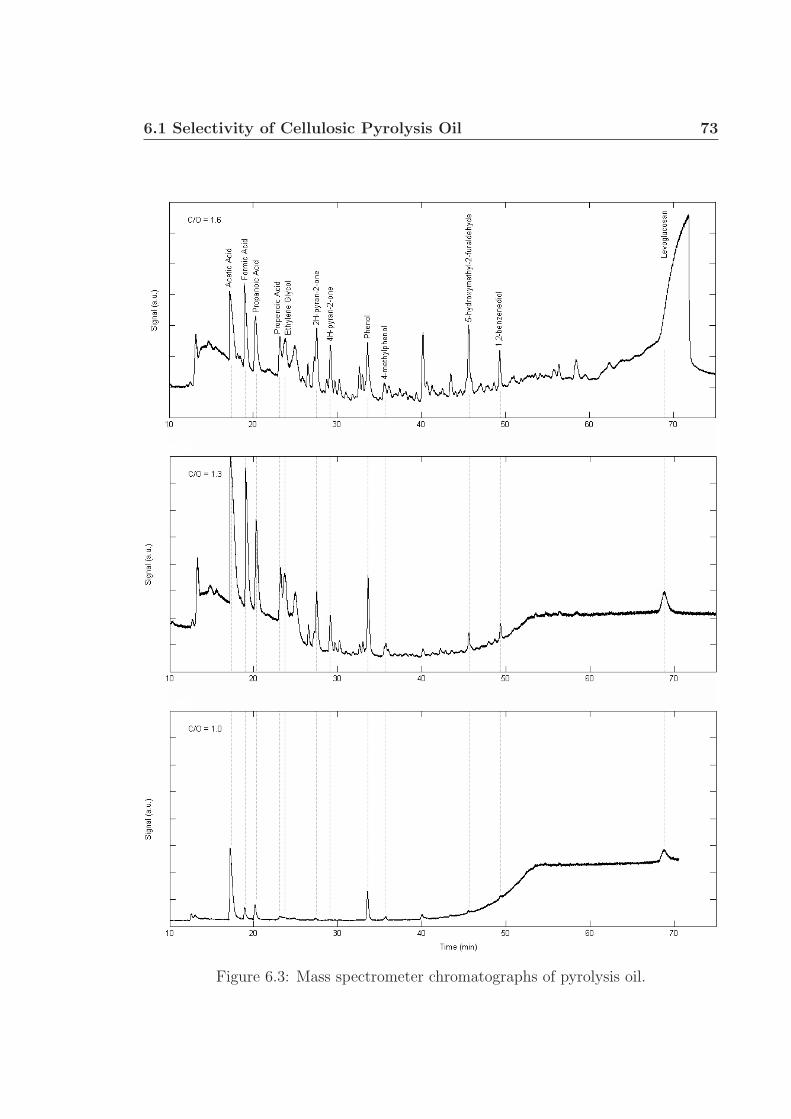
6.1 Selectivity of Cellulosic Pyrolysis Oil 73
Figure 6.3: Mass spectrometer chromatographs of pyrolysis oil.
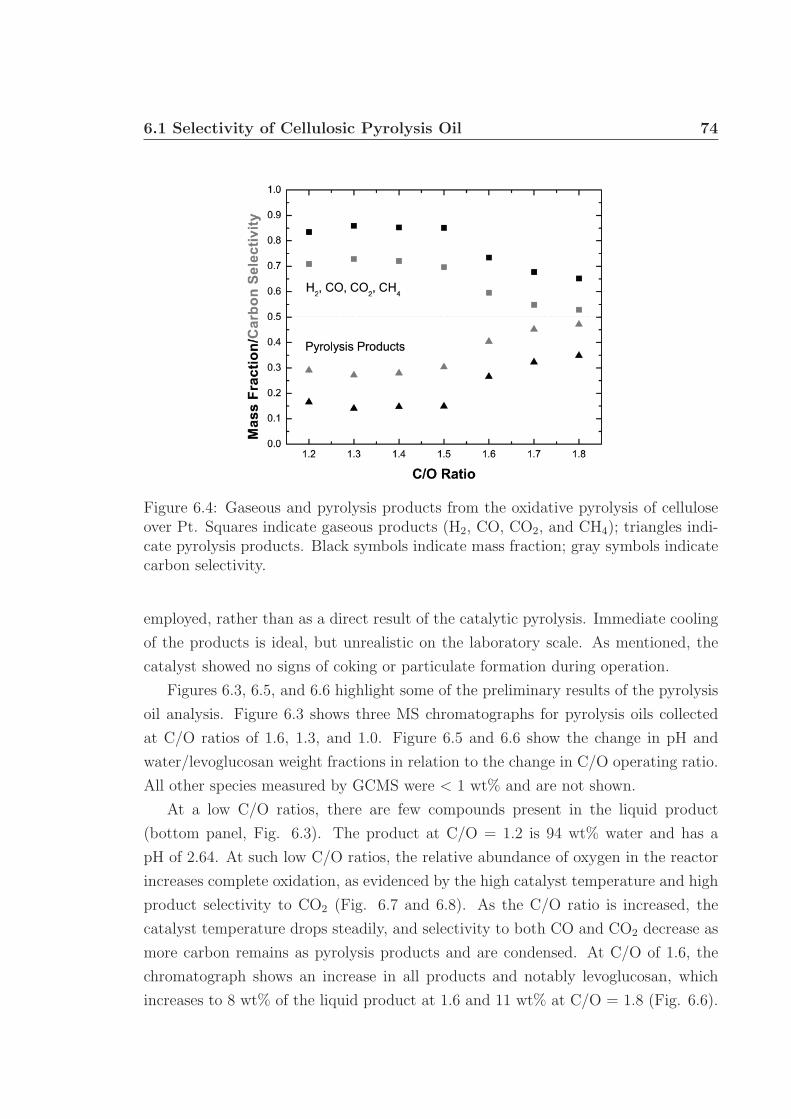
6.1 Selectivity of Cellulosic Pyrolysis Oil 74
Figure 6.4: Gaseous and pyrolysis products from the oxidative pyrolysis of celluloseover Pt. Squares indicate gaseous products (H2, CO, CO2, and CH4); triangles indi-cate pyrolysis products. Black symbols indicate mass fraction; gray symbols indicatecarbon selectivity.
employed, rather than as a direct result of the catalytic pyrolysis. Immediate cooling
of the products is ideal, but unrealistic on the laboratory scale. As mentioned, the
catalyst showed no signs of coking or particulate formation during operation.
Figures 6.3, 6.5, and 6.6 highlight some of the preliminary results of the pyrolysis
oil analysis. Figure 6.3 shows three MS chromatographs for pyrolysis oils collected
at C/O ratios of 1.6, 1.3, and 1.0. Figure 6.5 and 6.6 show the change in pH and
water/levoglucosan weight fractions in relation to the change in C/O operating ratio.
All other species measured by GCMS were < 1 wt% and are not shown.
At a low C/O ratios, there are few compounds present in the liquid product
(bottom panel, Fig. 6.3). The product at C/O = 1.2 is 94 wt% water and has a
pH of 2.64. At such low C/O ratios, the relative abundance of oxygen in the reactor
increases complete oxidation, as evidenced by the high catalyst temperature and high
product selectivity to CO2 (Fig. 6.7 and 6.8). As the C/O ratio is increased, the
catalyst temperature drops steadily, and selectivity to both CO and CO2 decrease as
more carbon remains as pyrolysis products and are condensed. At C/O of 1.6, the
chromatograph shows an increase in all products and notably levoglucosan, which
increases to 8 wt% of the liquid product at 1.6 and 11 wt% at C/O = 1.8 (Fig. 6.6).
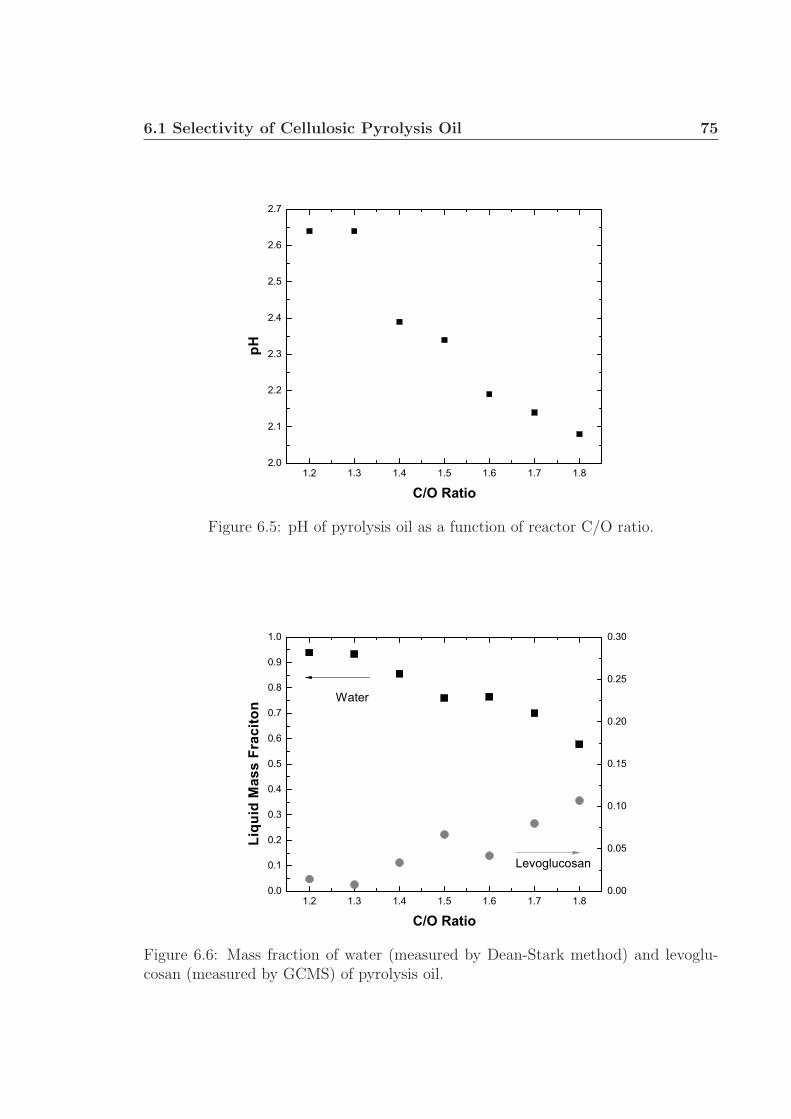
6.1 Selectivity of Cellulosic Pyrolysis Oil 75
1.2 1.3 1.4 1.5 1.6 1.7 1.82.0
2.1
2.2
2.3
2.4
2.5
2.6
2.7
pH
C/O Ratio
Figure 6.5: pH of pyrolysis oil as a function of reactor C/O ratio.
1.2 1.3 1.4 1.5 1.6 1.7 1.80.0
0.1
0.2
0.3
0.4
0.5
0.6
0.7
0.8
0.9
1.0
Water
Liqu
id M
ass
Frac
iton
C/O Ratio
Levoglucosan
0.00
0.05
0.10
0.15
0.20
0.25
0.30
Figure 6.6: Mass fraction of water (measured by Dean-Stark method) and levoglu-cosan (measured by GCMS) of pyrolysis oil.
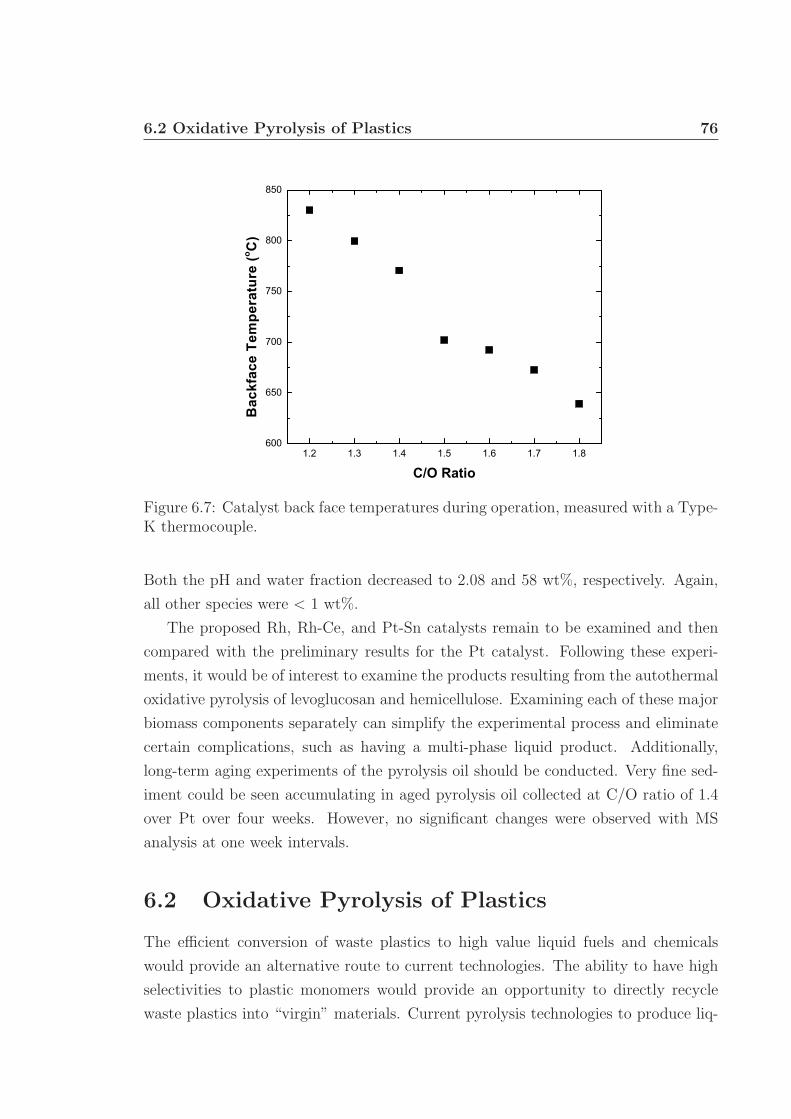
6.2 Oxidative Pyrolysis of Plastics 76
1.2 1.3 1.4 1.5 1.6 1.7 1.8600
650
700
750
800
850
Bac
kfac
e Te
mpe
ratu
re (o C
)
C/O Ratio
Figure 6.7: Catalyst back face temperatures during operation, measured with a Type-K thermocouple.
Both the pH and water fraction decreased to 2.08 and 58 wt%, respectively. Again,
all other species were < 1 wt%.
The proposed Rh, Rh-Ce, and Pt-Sn catalysts remain to be examined and then
compared with the preliminary results for the Pt catalyst. Following these experi-
ments, it would be of interest to examine the products resulting from the autothermal
oxidative pyrolysis of levoglucosan and hemicellulose. Examining each of these major
biomass components separately can simplify the experimental process and eliminate
certain complications, such as having a multi-phase liquid product. Additionally,
long-term aging experiments of the pyrolysis oil should be conducted. Very fine sed-
iment could be seen accumulating in aged pyrolysis oil collected at C/O ratio of 1.4
over Pt over four weeks. However, no significant changes were observed with MS
analysis at one week intervals.
6.2 Oxidative Pyrolysis of Plastics
The efficient conversion of waste plastics to high value liquid fuels and chemicals
would provide an alternative route to current technologies. The ability to have high
selectivities to plastic monomers would provide an opportunity to directly recycle
waste plastics into “virgin” materials. Current pyrolysis technologies to produce liq-
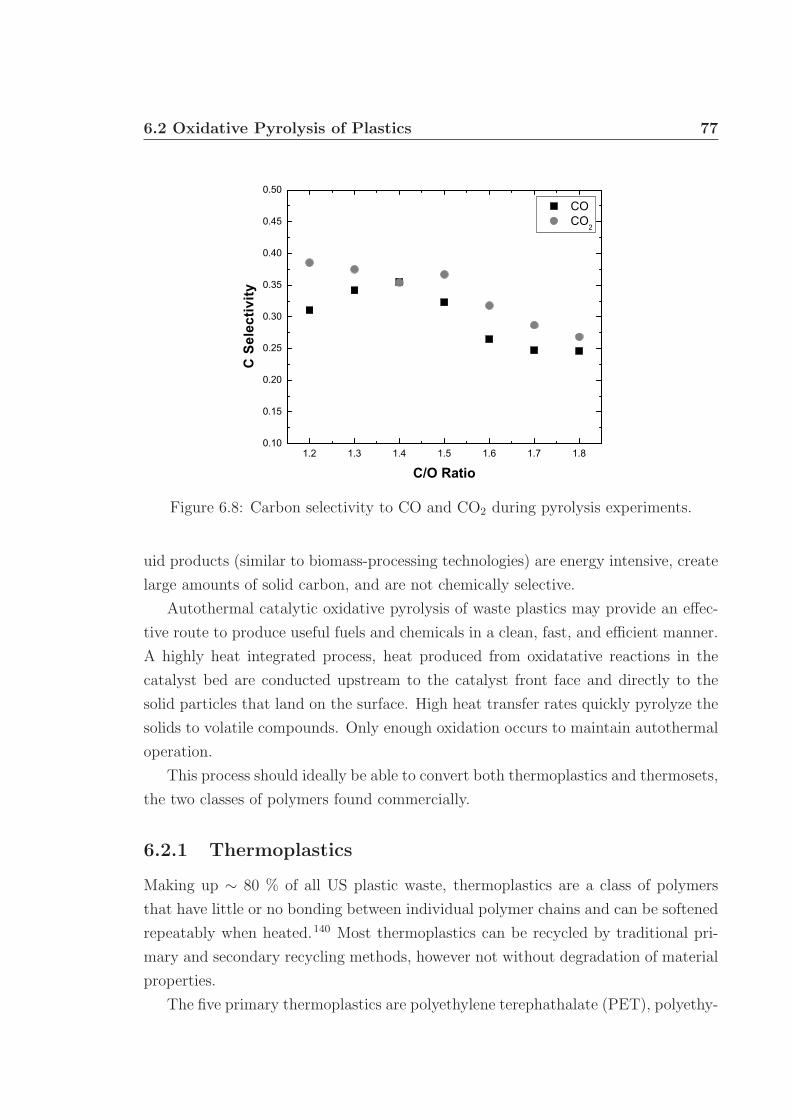
6.2 Oxidative Pyrolysis of Plastics 77
1.2 1.3 1.4 1.5 1.6 1.7 1.80.10
0.15
0.20
0.25
0.30
0.35
0.40
0.45
0.50
CO CO
2
C S
elec
tivity
C/O Ratio
Figure 6.8: Carbon selectivity to CO and CO2 during pyrolysis experiments.
uid products (similar to biomass-processing technologies) are energy intensive, create
large amounts of solid carbon, and are not chemically selective.
Autothermal catalytic oxidative pyrolysis of waste plastics may provide an effec-
tive route to produce useful fuels and chemicals in a clean, fast, and efficient manner.
A highly heat integrated process, heat produced from oxidatative reactions in the
catalyst bed are conducted upstream to the catalyst front face and directly to the
solid particles that land on the surface. High heat transfer rates quickly pyrolyze the
solids to volatile compounds. Only enough oxidation occurs to maintain autothermal
operation.
This process should ideally be able to convert both thermoplastics and thermosets,
the two classes of polymers found commercially.
6.2.1 Thermoplastics
Making up ∼ 80 % of all US plastic waste, thermoplastics are a class of polymers
that have little or no bonding between individual polymer chains and can be softened
repeatably when heated.140 Most thermoplastics can be recycled by traditional pri-
mary and secondary recycling methods, however not without degradation of material
properties.
The five primary thermoplastics are polyethylene terephathalate (PET), polyethy-
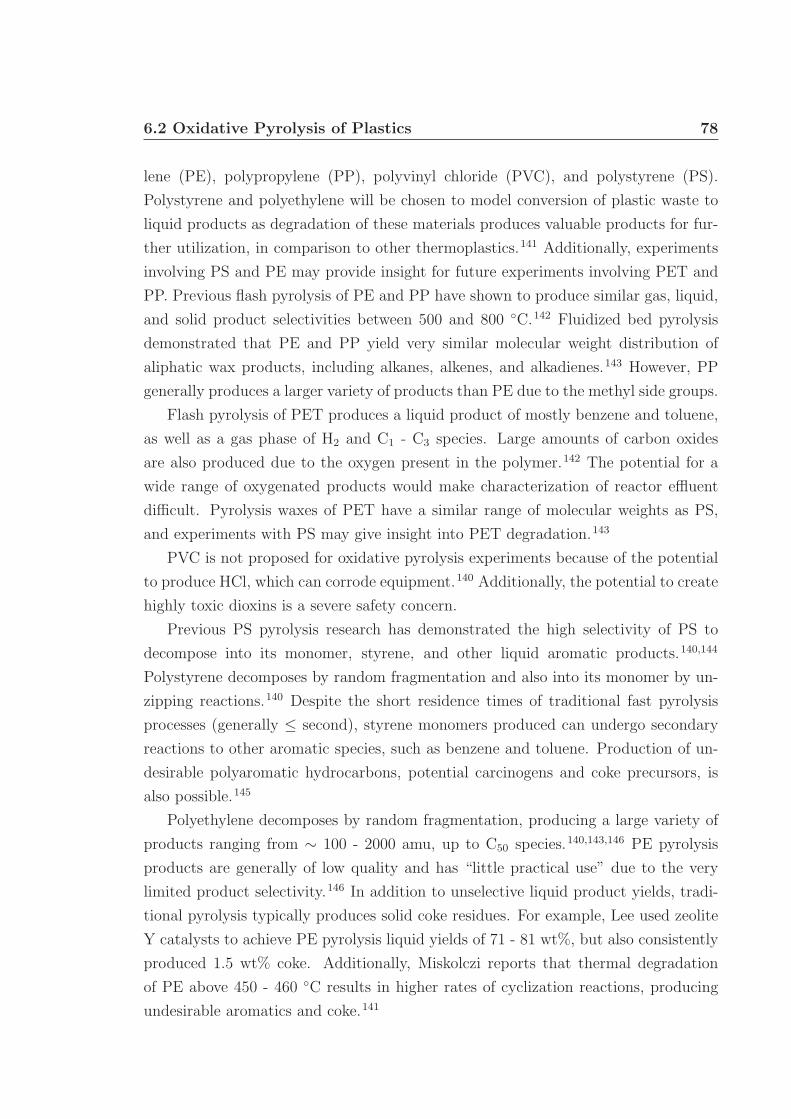
6.2 Oxidative Pyrolysis of Plastics 78
lene (PE), polypropylene (PP), polyvinyl chloride (PVC), and polystyrene (PS).
Polystyrene and polyethylene will be chosen to model conversion of plastic waste to
liquid products as degradation of these materials produces valuable products for fur-
ther utilization, in comparison to other thermoplastics.141 Additionally, experiments
involving PS and PE may provide insight for future experiments involving PET and
PP. Previous flash pyrolysis of PE and PP have shown to produce similar gas, liquid,
and solid product selectivities between 500 and 800 ◦C.142 Fluidized bed pyrolysis
demonstrated that PE and PP yield very similar molecular weight distribution of
aliphatic wax products, including alkanes, alkenes, and alkadienes.143 However, PP
generally produces a larger variety of products than PE due to the methyl side groups.
Flash pyrolysis of PET produces a liquid product of mostly benzene and toluene,
as well as a gas phase of H2 and C1 - C3 species. Large amounts of carbon oxides
are also produced due to the oxygen present in the polymer.142 The potential for a
wide range of oxygenated products would make characterization of reactor effluent
difficult. Pyrolysis waxes of PET have a similar range of molecular weights as PS,
and experiments with PS may give insight into PET degradation.143
PVC is not proposed for oxidative pyrolysis experiments because of the potential
to produce HCl, which can corrode equipment.140 Additionally, the potential to create
highly toxic dioxins is a severe safety concern.
Previous PS pyrolysis research has demonstrated the high selectivity of PS to
decompose into its monomer, styrene, and other liquid aromatic products.140,144
Polystyrene decomposes by random fragmentation and also into its monomer by un-
zipping reactions.140 Despite the short residence times of traditional fast pyrolysis
processes (generally ≤ second), styrene monomers produced can undergo secondary
reactions to other aromatic species, such as benzene and toluene. Production of un-
desirable polyaromatic hydrocarbons, potential carcinogens and coke precursors, is
also possible.145
Polyethylene decomposes by random fragmentation, producing a large variety of
products ranging from ∼ 100 - 2000 amu, up to C50 species.140,143,146 PE pyrolysis
products are generally of low quality and has “little practical use” due to the very
limited product selectivity.146 In addition to unselective liquid product yields, tradi-
tional pyrolysis typically produces solid coke residues. For example, Lee used zeolite
Y catalysts to achieve PE pyrolysis liquid yields of 71 - 81 wt%, but also consistently
produced 1.5 wt% coke. Additionally, Miskolczi reports that thermal degradation
of PE above 450 - 460 ◦C results in higher rates of cyclization reactions, producing
undesirable aromatics and coke.141
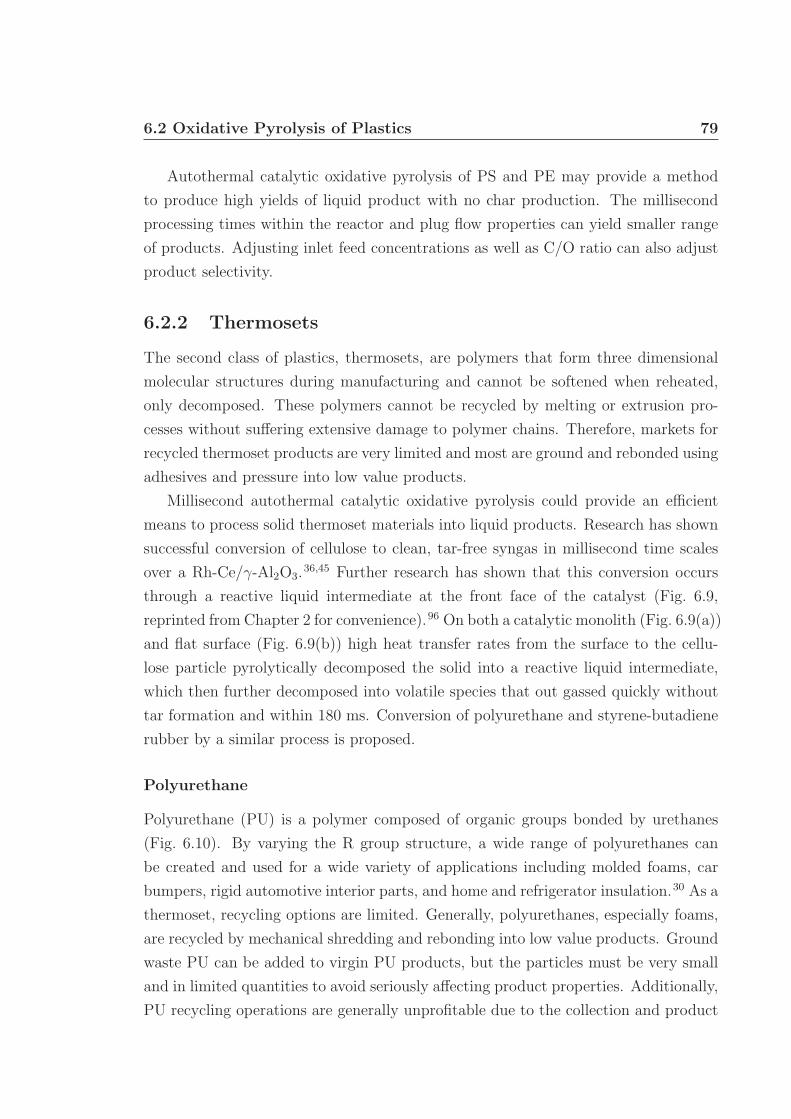
6.2 Oxidative Pyrolysis of Plastics 79
Autothermal catalytic oxidative pyrolysis of PS and PE may provide a method
to produce high yields of liquid product with no char production. The millisecond
processing times within the reactor and plug flow properties can yield smaller range
of products. Adjusting inlet feed concentrations as well as C/O ratio can also adjust
product selectivity.
6.2.2 Thermosets
The second class of plastics, thermosets, are polymers that form three dimensional
molecular structures during manufacturing and cannot be softened when reheated,
only decomposed. These polymers cannot be recycled by melting or extrusion pro-
cesses without suffering extensive damage to polymer chains. Therefore, markets for
recycled thermoset products are very limited and most are ground and rebonded using
adhesives and pressure into low value products.
Millisecond autothermal catalytic oxidative pyrolysis could provide an efficient
means to process solid thermoset materials into liquid products. Research has shown
successful conversion of cellulose to clean, tar-free syngas in millisecond time scales
over a Rh-Ce/γ-Al2O3.36,45 Further research has shown that this conversion occurs
through a reactive liquid intermediate at the front face of the catalyst (Fig. 6.9,
reprinted from Chapter 2 for convenience).96 On both a catalytic monolith (Fig. 6.9(a))
and flat surface (Fig. 6.9(b)) high heat transfer rates from the surface to the cellu-
lose particle pyrolytically decomposed the solid into a reactive liquid intermediate,
which then further decomposed into volatile species that out gassed quickly without
tar formation and within 180 ms. Conversion of polyurethane and styrene-butadiene
rubber by a similar process is proposed.
Polyurethane
Polyurethane (PU) is a polymer composed of organic groups bonded by urethanes
(Fig. 6.10). By varying the R group structure, a wide range of polyurethanes can
be created and used for a wide variety of applications including molded foams, car
bumpers, rigid automotive interior parts, and home and refrigerator insulation.30 As a
thermoset, recycling options are limited. Generally, polyurethanes, especially foams,
are recycled by mechanical shredding and rebonding into low value products. Ground
waste PU can be added to virgin PU products, but the particles must be very small
and in limited quantities to avoid seriously affecting product properties. Additionally,
PU recycling operations are generally unprofitable due to the collection and product
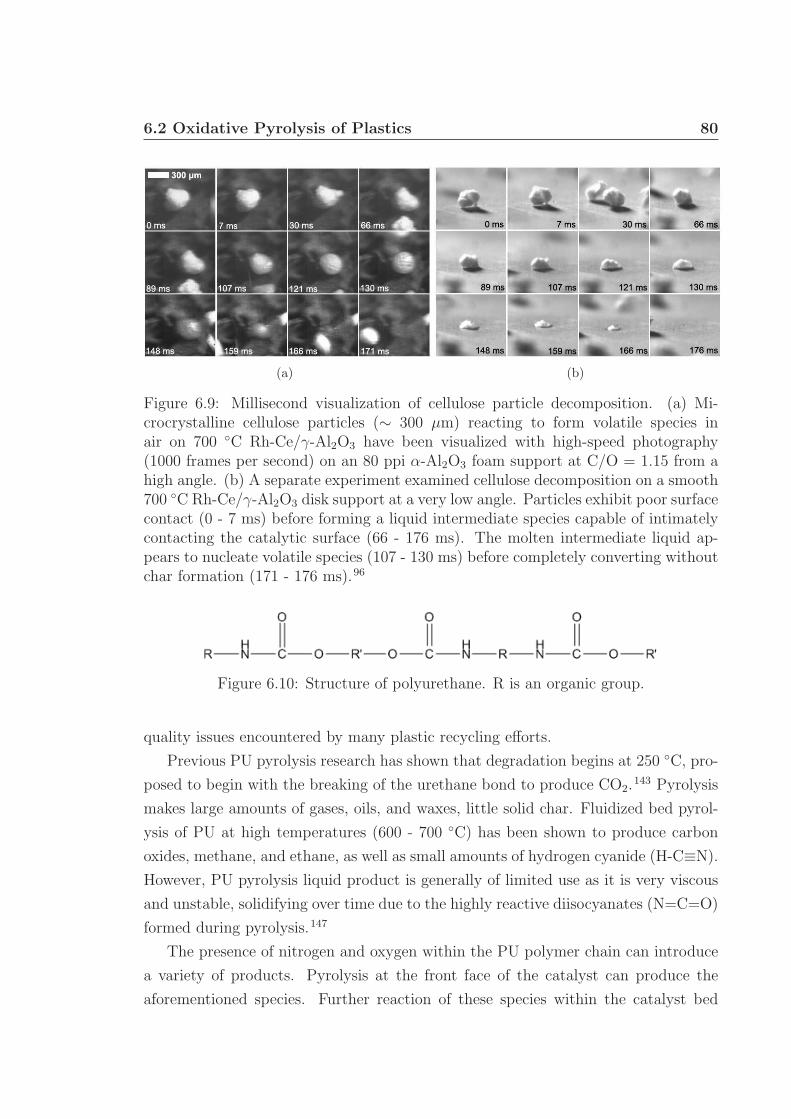
6.2 Oxidative Pyrolysis of Plastics 80
(a) (b)
Figure 6.9: Millisecond visualization of cellulose particle decomposition. (a) Mi-crocrystalline cellulose particles (∼ 300 µm) reacting to form volatile species inair on 700 ◦C Rh-Ce/γ-Al2O3 have been visualized with high-speed photography(1000 frames per second) on an 80 ppi α-Al2O3 foam support at C/O = 1.15 from ahigh angle. (b) A separate experiment examined cellulose decomposition on a smooth700 ◦C Rh-Ce/γ-Al2O3 disk support at a very low angle. Particles exhibit poor surfacecontact (0 - 7 ms) before forming a liquid intermediate species capable of intimatelycontacting the catalytic surface (66 - 176 ms). The molten intermediate liquid ap-pears to nucleate volatile species (107 - 130 ms) before completely converting withoutchar formation (171 - 176 ms).96
Figure 6.10: Structure of polyurethane. R is an organic group.
quality issues encountered by many plastic recycling efforts.
Previous PU pyrolysis research has shown that degradation begins at 250 ◦C, pro-
posed to begin with the breaking of the urethane bond to produce CO2.143 Pyrolysis
makes large amounts of gases, oils, and waxes, little solid char. Fluidized bed pyrol-
ysis of PU at high temperatures (600 - 700 ◦C) has been shown to produce carbon
oxides, methane, and ethane, as well as small amounts of hydrogen cyanide (H-C≡N).
However, PU pyrolysis liquid product is generally of limited use as it is very viscous
and unstable, solidifying over time due to the highly reactive diisocyanates (N=C=O)
formed during pyrolysis.147
The presence of nitrogen and oxygen within the PU polymer chain can introduce
a variety of products. Pyrolysis at the front face of the catalyst can produce the
aforementioned species. Further reaction of these species within the catalyst bed
6.2 Oxidative Pyrolysis of Plastics 81
Figure 6.11: Structure of styrene-butadiene rubber.
may be able to react the isocyanate species.
Scrap Tires
Automotive tires are composed of styrene-butadiene rubber (SBR), synthetic or nat-
ural polyisoprene rubber, as well as steel, carbon black, and other additives.140 Tires
also contain ∼ 2 % sulfur, which is used to vulcanize rubber, creating crosslinked
polymers with higher strength and desirable qualities.30
The use of recycled tire material in the production of new tires has significantly
decreased in recent years due to increased liability concerns and use of synthetic
rubbers.30 In addition to mechanical grinding and rebonding recycling applications,
devulcanization of tires can be used to “reverse” the vulcanization process and recover
material. However, current devulcanization techniques generally degrade between 30 -
70 % of the polymer, severely affecting material properties.
Pyrolysis of whole tires has also been the focus of previous research. Pyrolysis
of whole tires produces large amounts of carbon black due to its use an additive
in original tire production. Liquid pyrolysis product, produced from the reactions
of the rubber components, contains large amounts of benzene, toluene, and xylene,
and is commonly referred to as BTX.30 As pyrolysis temperatures increase, the con-
centration of aromatics in the liquid product increases, however total liquid product
decreases in favor of gaseous products.147 Benzene, toluene, and xylene are valuable
products individually, however distillation of these aromatics is too difficult and ex-
pensive to justify and BTX is generally used as a co-feed to oil refineries. On a
commercial scale, Goodyear developed a pyrolysis facility to process whole tires. The
facility was unable to be profitable and eventually shut down because the pyroly-
sis oil product was of very low quality and could only be used as a crude oil blend
component.30
The sulfur used to vulcanize rubber for use in tires can create small amounts of
hydrogen sulfide gas during pyrolysis.30 Generally, sulfur presents an experimental
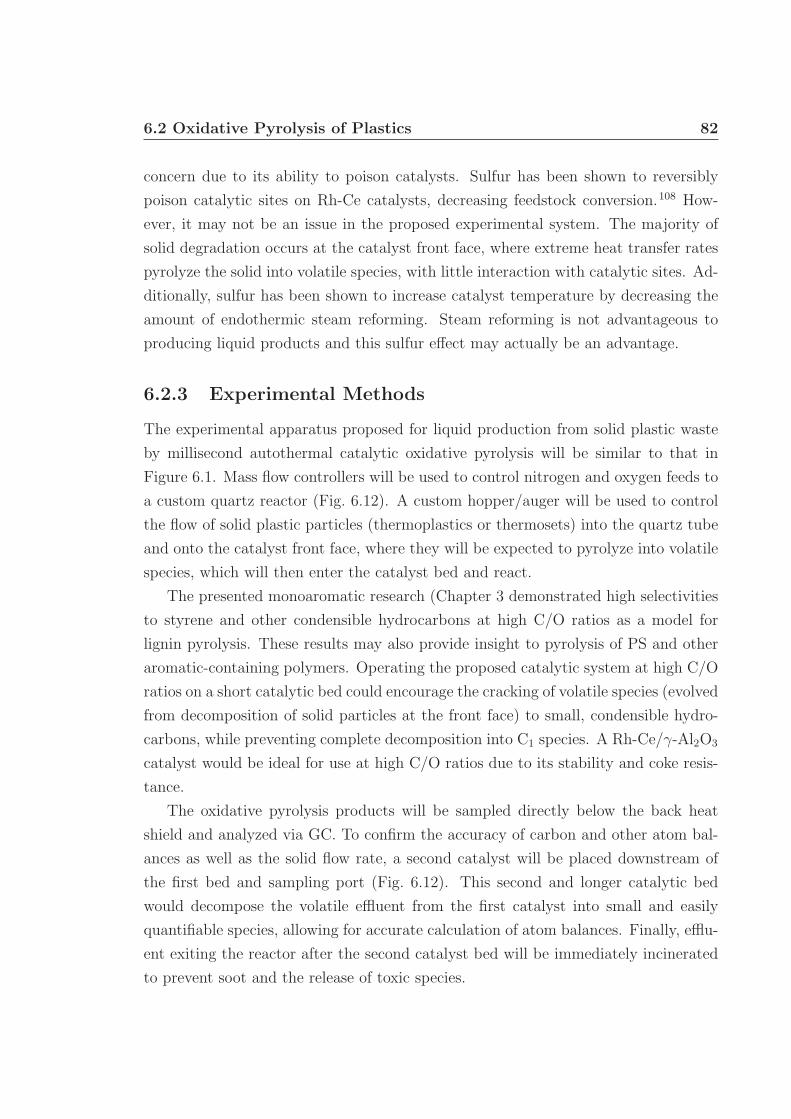
6.2 Oxidative Pyrolysis of Plastics 82
concern due to its ability to poison catalysts. Sulfur has been shown to reversibly
poison catalytic sites on Rh-Ce catalysts, decreasing feedstock conversion.108 How-
ever, it may not be an issue in the proposed experimental system. The majority of
solid degradation occurs at the catalyst front face, where extreme heat transfer rates
pyrolyze the solid into volatile species, with little interaction with catalytic sites. Ad-
ditionally, sulfur has been shown to increase catalyst temperature by decreasing the
amount of endothermic steam reforming. Steam reforming is not advantageous to
producing liquid products and this sulfur effect may actually be an advantage.
6.2.3 Experimental Methods
The experimental apparatus proposed for liquid production from solid plastic waste
by millisecond autothermal catalytic oxidative pyrolysis will be similar to that in
Figure 6.1. Mass flow controllers will be used to control nitrogen and oxygen feeds to
a custom quartz reactor (Fig. 6.12). A custom hopper/auger will be used to control
the flow of solid plastic particles (thermoplastics or thermosets) into the quartz tube
and onto the catalyst front face, where they will be expected to pyrolyze into volatile
species, which will then enter the catalyst bed and react.
The presented monoaromatic research (Chapter 3 demonstrated high selectivities
to styrene and other condensible hydrocarbons at high C/O ratios as a model for
lignin pyrolysis. These results may also provide insight to pyrolysis of PS and other
aromatic-containing polymers. Operating the proposed catalytic system at high C/O
ratios on a short catalytic bed could encourage the cracking of volatile species (evolved
from decomposition of solid particles at the front face) to small, condensible hydro-
carbons, while preventing complete decomposition into C1 species. A Rh-Ce/γ-Al2O3
catalyst would be ideal for use at high C/O ratios due to its stability and coke resis-
tance.
The oxidative pyrolysis products will be sampled directly below the back heat
shield and analyzed via GC. To confirm the accuracy of carbon and other atom bal-
ances as well as the solid flow rate, a second catalyst will be placed downstream of
the first bed and sampling port (Fig. 6.12). This second and longer catalytic bed
would decompose the volatile effluent from the first catalyst into small and easily
quantifiable species, allowing for accurate calculation of atom balances. Finally, efflu-
ent exiting the reactor after the second catalyst bed will be immediately incinerated
to prevent soot and the release of toxic species.
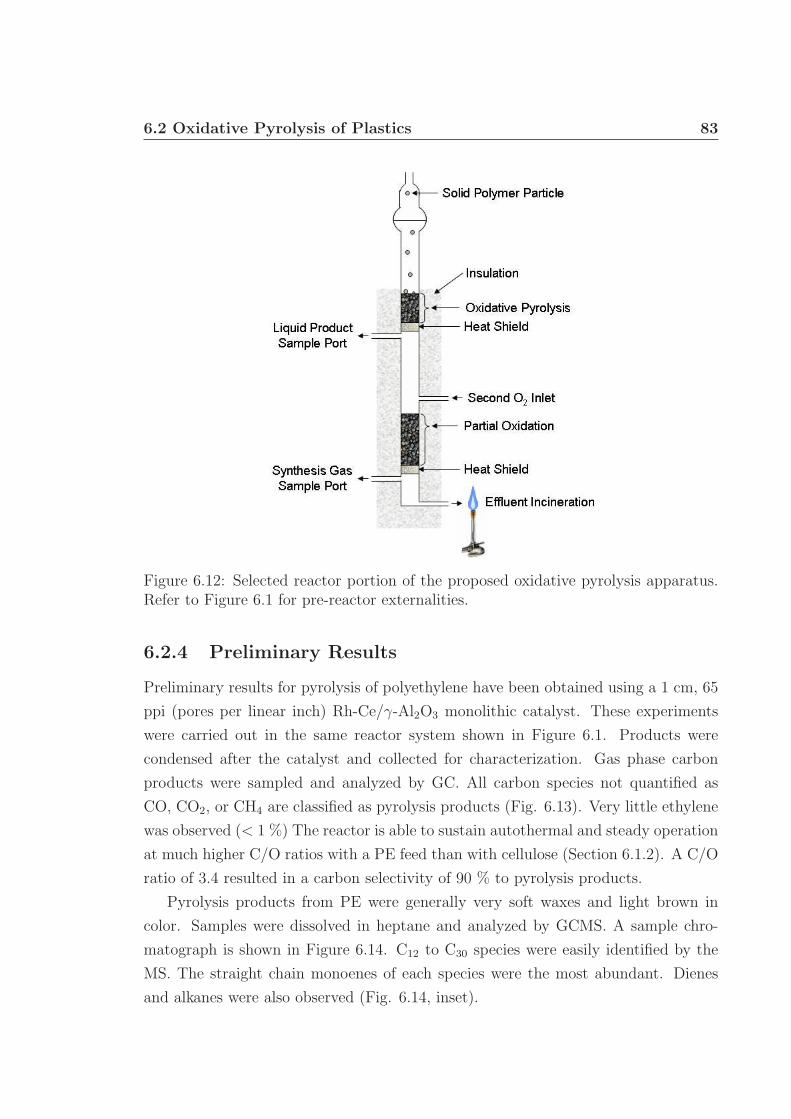
6.2 Oxidative Pyrolysis of Plastics 83
Figure 6.12: Selected reactor portion of the proposed oxidative pyrolysis apparatus.Refer to Figure 6.1 for pre-reactor externalities.
6.2.4 Preliminary Results
Preliminary results for pyrolysis of polyethylene have been obtained using a 1 cm, 65
ppi (pores per linear inch) Rh-Ce/γ-Al2O3 monolithic catalyst. These experiments
were carried out in the same reactor system shown in Figure 6.1. Products were
condensed after the catalyst and collected for characterization. Gas phase carbon
products were sampled and analyzed by GC. All carbon species not quantified as
CO, CO2, or CH4 are classified as pyrolysis products (Fig. 6.13). Very little ethylene
was observed (< 1 %) The reactor is able to sustain autothermal and steady operation
at much higher C/O ratios with a PE feed than with cellulose (Section 6.1.2). A C/O
ratio of 3.4 resulted in a carbon selectivity of 90 % to pyrolysis products.
Pyrolysis products from PE were generally very soft waxes and light brown in
color. Samples were dissolved in heptane and analyzed by GCMS. A sample chro-
matograph is shown in Figure 6.14. C12 to C30 species were easily identified by the
MS. The straight chain monoenes of each species were the most abundant. Dienes
and alkanes were also observed (Fig. 6.14, inset).
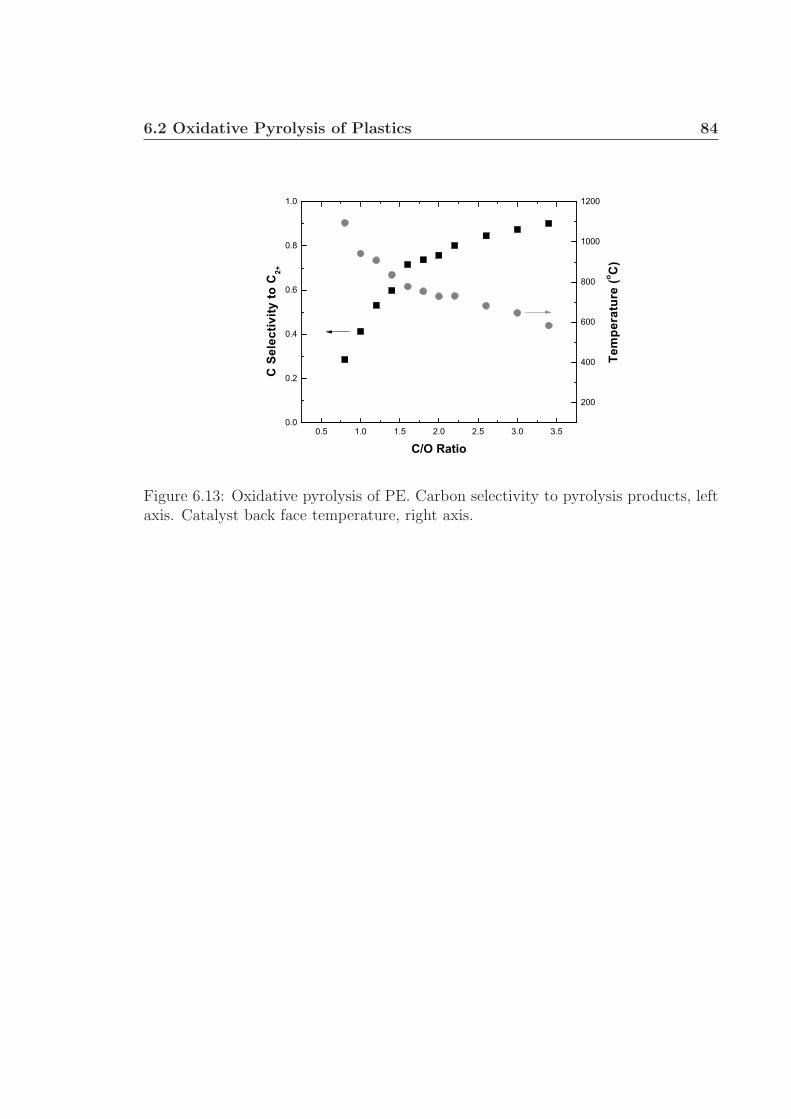
6.2 Oxidative Pyrolysis of Plastics 84
0.5 1.0 1.5 2.0 2.5 3.0 3.50.0
0.2
0.4
0.6
0.8
1.0
Tem
pera
ture
(o C)
C S
elec
tivity
to C
2+
C/O Ratio
200
400
600
800
1000
1200
Figure 6.13: Oxidative pyrolysis of PE. Carbon selectivity to pyrolysis products, leftaxis. Catalyst back face temperature, right axis.
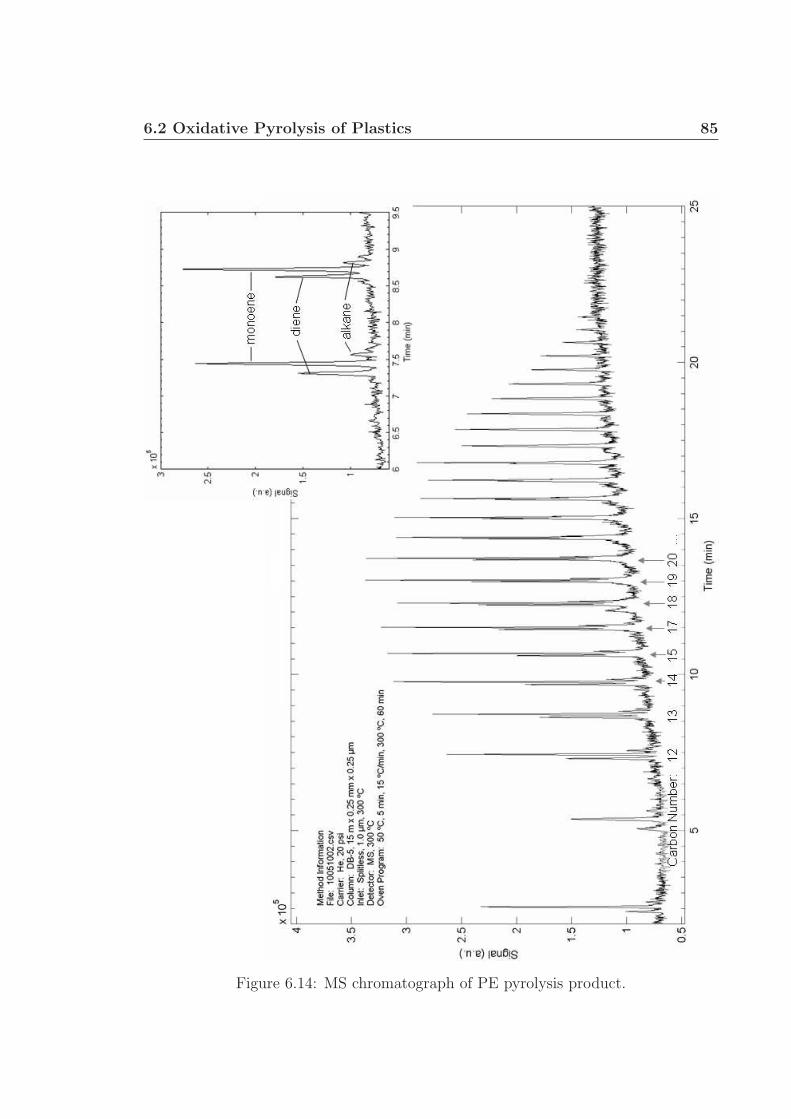
6.2 Oxidative Pyrolysis of Plastics 85
Figure 6.14: MS chromatograph of PE pyrolysis product.

6.2 Oxidative Pyrolysis of Plastics 86
Autothermal catalytic oxidative pyrolysis is proposed to convert biomass models
and waste plastics into useful liquid products. The results presented in Chapters 3 to
5 demonstrate and give insight to the posibility of processing lignocellulosic biomass
in such a reactor system. This processes may be able to provide a small-scale, efficient,
and economical alternative to traditional processing methods. The preliminary results
combined with the proposed work presented in Chapter 6 may provide valuable insight
to the capabilities of catalytic oxidative pyrolysis in the future.
BIBLIOGRAPHY
[1] R. D. Perlack, L. L. Wright, A. F. Turhollow, R. L. Graham, B. J. Stokes, andD. C. Erbach. Biomass as feedstock for a bioenergy and bioproducts industry:the tecnical feasibility of a billion-ton annual supply. Technical report, USDepartment of Energy and Department of Agriculture, April 2005.
[2] Office of Transportation and Air Quality. EPA finalizes regulations for thenational renewable fuel standard program for 2010 and beyond. Regulatoryannouncement, US Environmental Protection Agency, February 2010.
[3] US Environmental Protection Agency. Regulation of fuels and fuel additives:Chnages to renwable fuel standard program. Final rule, US Federal Register,March 2010.
[4] US Environmental Protection Agency. Regulation of fuels and fuel additives:2011 renewable fuel standards. Federal register, rules and regulations, US Fed-eral Register, December 2010.
[5] K. Rao, S. Chelikani, P. Relue, and S. Varanasi. Biotechnology for fuels andchemicals: the twenty-ninth symposium, Chapter: A novel technique that en-ables efficient conduct of simultaneous isomerization and fermentation (SIF) ofxylose, pages 101–117. Humana Press, 2008.
[6] D. Takara, P. Shrestha, and S. K. Khanal. Bioenergy and Biofuel from Biowastesand Biomass, Chapter: Lignocellulosic Biomass Pretreatment, pages 172–200.ASCE Publications, 2010.
[7] Z. L. Liu, B. C. Saha, and P. J. Slininger. Bioenergy, Chapter: Lignocellulosicbiomass conversion to ethanol by Saccharomyces, pages 17–36. ASM Press,2008.
[8] S. R. A. Kersten, W. P. M. van Swaaij, L. Lefferts, and K. Seshan. Catalysis forrenewables: from feedstock to energy production, Chapter: Options for catalysisin the thermochemical conversion of biomass into fuels, pages 119–145. Wiley-VCH, 2007.
87
BIBLIOGRAPHY 88
[9] C. Heitner and D. Dimmel. Lignin and Lignans: Advances in Chemistry. CRCPress, 2009.
[10] C. Fu, J. R. Mielenz, X. Xiao, Y. Ge, C. Y. Hamilton, M. Rodriguez, F. Chen,M. Foston, A. Ragauskas, J. Bouton, R. A. Dixon, and Z.-Y. Wang. Geneticmanipulation of lignin reduces recalcitrance and improves ethanol productionfrom switchgrass. Proceedings of the National Academy of Sciences of the US,108:3803–3808, 2010.
[11] B. S. Dien, G. Sarath, J. F. Pedersen, S. E. Sattler, H. Chen, D. L. Funnell-Harris, N. N. Nichols, and M. A. Cotta. Improved sugar conversion and ethanolyield for Forage Sorghum (Sorghum bicolor L. Moench) lines with reduced lignincontents. Bioenergy Research, 2:153–164, 2009.
[12] US Environmental Protection Agency. Partial grant of clean air act waiverapplication submitted by Growth Energy to increase the allowable ethanol con-tent of gasoline to 15 percent; Decision of the administrator. Notice, US FederalRegister, January 2011.
[13] US Department of Energy. Ethanol incentives and laws. Online, September2010. URL: http://www.afdc.energy.gov.
[14] L. Reijnders and M. A. J. Huijbregts. Biofuels for road transport: a seed towheel perspective. Springer, 2009.
[15] A.V. Bridgwater. Biomass fast pyrolysis. Thermal Science, 8:21–49, 2004.
[16] S. Czernik. Review of fast pyrolysis of biomass. Online, 2010. URL:www.nh.gov.
[17] A. V. Bridgwater. Review of fast pyrolysis of biomass and product upgrading.Biomass and Bioenergy, 2011.
[18] Dynamotive Energy Systems Corporation. Corporate history. Online, 2011.URL: www.dynamotive.com.
[19] Dynamotive Energy Systems Corporation. Fast pyrolysis. Online, 2011. URL:www.dynamotive.com.
[20] Dynamotive Energy Systems Corporation. Biooil plus. Online, 2011. URL:www.dynamotive.com.
[21] Ensyn. Multiple RTP facilities with commercial scale operations. Online, 2011.URL: www.ensyn.com.
[22] Wisconsin Biorefining Development Initiative. Biorefining process: Biomassgasification. www.wisbiorefine.org.
[23] J. T. Cobb. Survey of commercial biomass gasifiers. In AIChE Annual Meeting.AIChE, November 2007.
BIBLIOGRAPHY 89
[24] J. Warzel. Fischer-Tropsch (FT) workshop for turbine engine applications,Oklahoma City, Oklahoma. 2006.
[25] H. Schulz. Short history and present trends of Fischer-Tropsch synthesis. Ap-plied Catalysis A: General, 186:3–12, 1999.
[26] National Energy Technology Laboratory of the US Department of En-ergy. Fischer-Tropsch (FT) synthesis. Online, June 2011. URL:http://www.netl.doe.gov.
[27] E. van Steen and M. Claeys. Fischer-Tropsch catalysts for the biomass-to-liquidprocess. Chemical Engineering & Technology, 31:655–666, 2008.
[28] A. Bridgwater. Progress in Thermochemical Biomass Conversion. Wiley-Blackwell, 2008.
[29] T. G. Kreutz, E. D. Larson, G. Liu, and R. H. Williams. Fischer-tropschfuels from coal and biomass. In 25th Annual International Pittsburgh CoalConference, September 2008.
[30] J. Scheirs, editor. Polymer Recycling. Science, Technology and Applications.John Wiley & Sons, 1998.
[31] Rentech. Product demonstration unit. Online, 2009. URL:http://www.rentechinc.com.
[32] R. Penning. New developments in synthetic fuels. In CTL/GTL Conference2010, December 2009.
[33] Rentech. Fuels, 2009. URL: http://www.rentechinc.com.
[34] R. Ray and R. B. Thorpe. A comparison of gasification with pyrolysis forthe recycling of plastic containing wastes. International Journal of ChemicalReactor Engineering, 5, 2007.
[35] J. Gaube and H. F. Klein. The promoter effect of alkali in Fischer-Tropsch ironand cobalt catalysts. Applied Catalysis, A: General, 350:126, 2008.
[36] P. J. Dauenhauer, B. J. Dreyer, N. J. Degenstein, and L. D. Schmidt. Millisec-ond reforming of solid biomass for sustainable fuels. Angewandte Chemie, 46:5864–5867, 2007.
[37] D. A. Hickman, E. A. Haupfear, and L. D. Schmidt. Synthesis gas formationby direct oxidation of methane of Rh monoliths. Catalysis Letters, 17:223–237,1993.
[38] P. M. Torniainen, X. Chu, and L. D. Schmidt. Comparison of monolith-supported metals for the direct oxidation of methane to syngas. Journal ofCatalysis, 146:1–10, 1994.
BIBLIOGRAPHY 90
[39] R. P. O’Connor, E. J. Klein, and L. D. Schmidt. High yields of synthesis gasby millisecond partial oxidation of higher hydrocarbons. Catalysis Letters, 70:99–107, 2000.
[40] C. Wheeler, A. Jhalani, E. J. Klein, S. Tummala, and L. D. Schmidt. Thewater-gas-shift reaction at short contact times. Journal of Catalysis, 223:191–199, 2004.
[41] J. R. Salge, G. A. Deluga, and L. D. Schmidt. Catalytic partial oxidation ofethanol over noble metal catalysts. Journal of Catalysis, 235:69–78, 2005.
[42] N. J. Degenstein, R. Subramanian, and L. D. Schmidt. Partial oxidation of n-hexadecane at short contact times: Catalyst and washcoat loading and catalystmorphology. Applied Catalysis, A: General, 305:146–159, 2006.
[43] A. S. Bodke, S. S. Bharadwaj, and L. D. Schmidt. The effect of ceramic supportson partial oxidation of hydrocarbons over noble metal coated monoliths. Journalof Catalysis, 179:138–149, 1998.
[44] E. C. Wanat, B. Suman, and L. D. Schmidt. Partial oxidation of alcohols toproduce hydrogen and chemicals in millisecond-contact time reactors. Journalof Catalysis, 235:18–27, 2005.
[45] J. L. Colby, P. J. Dauenhauer, and L. D. Schmidt. Millisecond autothermalsteam reforming of cellulose for synthetic biofuels by reactive flash volatilization.Green Chemistry, 10:773–783, 2008.
[46] G. W. Huber, S. Iborra, and A. Corma. Synthesis of transportation fuels frombiomass: Chemistry, catalysts, and engineering. Chemical Reviews, 106:4044–4098, 2006.
[47] In G. Huber, editor, Breaking the Chemical and Engineering Barriers to Lig-nocellulosic Biofuels: Next Generation Hydrocarbon Biorefineries. NSF, 2008.
[48] B. C. Gates, G. W. Huber, C. L. Marshall, P. N. Ross, J. Siirola, and Y. Wang.Catalysts for emerging energy applications. MRS Bulletin, 33:429–435, 2008.
[49] T. R. Carlson, T. P. Vispute, and G. W. Huber. Green gasoline by catalyticfast pyrolysis of solid biomass derived compounds. ChemSusChem, 1:397–400,2008.
[50] G. Varhegyi, E. Jakab, and M. J. Antal Jr. Is the Broido-Shafizadeh model forcellulose pyrolysis true? Energy & Fuels, 8:1345–1352, 1994.
[51] J. Piskorz, P. Majerski, D. Radlein, A. Vladars-Usas, and D. S. Scott. Flashpyrolysis of cellulose for production of anhydro-oligomers. Journal of Analyticaland Applied Pyrolysis, 56:145–166, 2000.
BIBLIOGRAPHY 91
[52] J. Lede, J. P. Diebold, G. V. C. Peacocke, and J. Piskorz. Deveopments inthermochemical biomass conversion, Chapter: The nature and properties ofintermediate and unvaporized biomass pyrolysis material, pages 27–42. BlackieAcademic & Professional, 1997.
[53] C. DiBlasi. Modeling of chemical and physical processes of wood and biomasspyrolysis. Progress in Energy and Combustion Science, 34:47–90, 2008.
[54] A. G. W. Bradbury, Y. Sakai, and F. Shafizadeh. A kinetic model for pyrolysisof cellulose. Journal of Applied Polymer Science, 23:3271–3280, 1979.
[55] J. P. Diebold. A unified, global model for the pyrolysis of cellulose. Biomassand Bioenergy, 7:75–85, 1994.
[56] A. G. Liden, F. Berruti, and D. S. Scott. A kinetic model for the production ofliquids from the flash pyrolysis of biomass. Chemical Engineering Communica-tions, 65:207–221, 1988.
[57] J. Piskorz, D. Radlein, and D. S. Scott. On the mechanism of the rapid pyrolysisof cellulose. Journal of Analytical and Applied Pyrolysis, 9:121–137, 1986.
[58] J. Lede, H. Z. Li, and J. Villermaux. Fusion-like behavior of wood pyrolysis.Journal of Analytical and Applied Pyrolysis, 10:291–308, 1987.
[59] O. Boutin, M. Ferrer, and J. Lede. Radiant flash pyrolysis of cellulose – evi-dence for the formation of short-lifetime intermediate liquid species. Journal ofAnalytical and Applied Pyrolysis, 47:13–31, 1998.
[60] D. L. Pyle and C. A. Zaror. Heat transfer and kinetics in the low temperaturepyrolysis of solids. Chemical Engineering Science, 39:147–158, 1984.
[61] C. DiBlasi. Kinetic and heat transfer control in the slow and flash pyrolysis ofsolids. Industrial & Engineering Chemistry Research, 35:37–46, 1996.
[62] A. M. C. Janse, R. W. J. Westerhout, and W. Prins. Modelling of flash pyrolysisof a single wood particle. Chemical Engineering and Processing, 39:239–252,2000.
[63] A. M. Kanury. Combustion characteristics of biomass fuels. Combustion Scienceand Technology, 97:469–491, 1994.
[64] W. E. Ranz and W. R. Marshall. Evaporation from drops I. Chemical Engi-neering Progress, 48:141–146, 1952.
[65] I. Milosavljevic, V. Oja, and E. M. Suuberg. Thermal effects in cellulose py-rolysis: Relationship to char formation processes. Industrial & EngineeringChemistry Research, 35:653–662, 1996.
BIBLIOGRAPHY 92
[66] S. Chandra and C. T. Avedisian. Observations of droplet impingement on aceramic porous surface. International Journal of Heat and Mass Transfer, 35:2377–2388, 1992.
[67] Y. M. Arifin, T. Furuhata, M. Saito, and M. Arai. Diesel and biodiesel fueldeposits on a hot surface. Fuel, 87:1601–1609, 2008.
[68] J. Lede, J. Panagopoulos, H. Z. Li, and J. Villermaux. Fast pyrolysis of wood:direct measurement and study of ablation rate. Fuel, 64:1514–1520, 1985.
[69] G. V. C. Peacocke and A. V. Bridgwater. Ablative plate pyrolysis of biomassfor liquids. Biomass and Bioenergy, 7:147–154, 1994.
[70] C. DiBlasi. Heat transfer mechanisms and multi-step kinetics in the ablativepyrolysis of cellulose. Chemical Engineering Science, 51:2211–2220, 1996.
[71] C. DiBlasi. The state of the art of transport models for charring solid degrada-tion. Polymer International, 49:1133–1146, 2000.
[72] R. S. Miller and J. Bellan. Numerical simulation of vortex pyrolysis reactorsfor condensable tar production from biomass. Energy & Fuels, 12:25–40, 1998.
[73] C. T. Brooks, S. J. Peacock, and B. G. Reuben. Pyrolysis of benzene. Jour-nal of the Chemical Society, Faraday Transactions 1: Physical Chemistry inCondensed Phases, 75(3):652–62, 1979.
[74] M. U. Alzueta, P. Glarborg, and K. Dam-Johansen. Experimental and kineticmodeling study of the oxidation of benzene. International Journal of ChemicalKinetics, 32(8):498–522, 2000.
[75] I. Da Costa, R. Fournet, F. Billaud, and F. Battin-Leclerc. Experimental andmodeling study of the oxidation of benzene. International Journal of ChemicalKinetics, 35(10):503–524, 2003.
[76] C. T. Brooks and S. J. Peacock. Pyrolysis of ethylbenzene. Journal of theChemical Society, Faraday Transactions 1: Physical Chemistry in CondensedPhases, 78:3187–3202, 1982.
[77] K. K. Pant and D. Kunzru. Noncatalytic and catalytic pyrolysis of toluene.The Canadian Journal of Chemical Engineering, 77:150–155, 1999.
[78] A. Donazzi, B. C. Michael, and L. D. Schmidt. Chemical and geometric effectsof Ce and washcoat addition on catalytic partial oxidation of CH4 on Rh probedby spatially resolved measurements. Journal of Catalysis, 260:270–275, 2008.
[79] B. E. Koel. A high-resolution electron energy loss spectroscopy study of thesurface structure of benzene adsorbed on the rhodium(111) crystal face. Journalof Physical Chemistry, 88:1988–1996, 1984.
BIBLIOGRAPHY 93
[80] B. E. Koel. Thermal decomposition of benzene on the Rh(111) crystal surface.Journal of Physical Chemistry, 90:2949–2956, 1986.
[81] C. Minot and P. Gallezot. Competitive hydrogenation of benzene and toluene:Theoretical study of their adsorption on ruthenium, rhodium, and palladium.Journal of Catalysis, 123:341–348, 1990.
[82] M. E. Viste, K. D. Gibson, and S. J. Sibener. Heterogeneous combustion of ben-zene on Rh(111): Kinetics and dynamics of CO and CO2 production. Journalof Catalysis, 191:237–244, 2000.
[83] T. Ioannides and X. E. Verykios. The interaction of benzene and toluene withRh dispersed on SiO2, Al2O3, and TiO2 carriers. Journal of Catalysis, 143:175–186, 1993.
[84] C. M. Friend and E. L. Muetterties. Coordination chemistry of metal surfaces. 3.Benzene and toluene interactions with nickel surfaces. Journal of the AmericanChemical Society, 103:773–779, 1981.
[85] M. J. Patterson, D. E. Angove, and N. W. Cant. The effect of carbon monoxideon the oxidation of four C6 to C8 hydrocarbons over platinum, palladium andrhodium. Appl Catal B: Environ, 26:47–57, 2000.
[86] M. J. Patterson, D. E. Angove, and N. W. Cant. The effect of metal orderon the oxidation of a hydrocarbon mixture over alumina-supported combinedplatinum/rhodium catalysts. Appl Catal B: Environ, 35:53–58, 2001.
[87] S. B. Domke, R. F. Pogue, F. J. R. Van Neer, and C. M. Smith. Investigationof the kinetics of ethylbenzene pyrolysis using a temperature-scanning reactor.Industrial & Engineering Chemistry Research, 40:5878–5884, 2001.
[88] M.-C. Tsai and E. L. Muetterities. Coordination chemistry of benzene, toluene,cyclohexadienes, cyclohexene, and cyclohexane on Pt(100). Journal of PhysicalChemistry, 86:5067–5071, 1982.
[89] D. Duprez, A. Miloudi, G. Delahay, and R. Maurel. Selective steam reformingof aromatic hydrocarbons. Journal of Catalysis, 101:56–66, 1986.
[90] P. J. Dauenhauer, J. R. Salge, and L. D. Schmidt. Renewable hydrogen byautothermal steam reforming of volatile carbohydrates. Journal of Catalysis,244:238–247, 2006.
[91] D. Duprez. Selective steam reforming of aromatic compounds on metal cata-lysts. Applied Catalysis A: General, 82:111–157, 1992.
[92] H. Cordatos, T. Bunluesin, J. Stubenrauch, J. M. Vohs, and R. J. Gorte. Ef-fect of ceria structure on oxygen migration for Rh/ceria catalysts. Journal ofPhysical Chemistry, 100:785–789, 1996.
BIBLIOGRAPHY 94
[93] T. Zhu and M. Flytzani-Stephanopoulos. Catalytic partial oxidation of methaneto synthesis gas over Ni-CeO2. Applied Catalysis A: General, 208(1-2):403 – 417,2001. ISSN 0926-860X.
[94] A. V. Bridgwater. Renewable fuels and chemicals by thermal processing ofbiomass. Chemical Engineering Journal, 91:87 – 102, 2003.
[95] A. V. Bridgwater, D. Meier, and D. Radlein. An overview of fast pyrolysis ofbiomass. Organic Geochemistry, 30:1479 – 1493, 1999.
[96] P. J. Dauenhauer, J. L. Colby, C. M. Balonek, W. J. Suszynski, and L. D.Schmidt. Reactive boiling of cellulose for integrated catalysis through an inter-mediate liquid. Green Chemistry, 11:1555–1561, 2009.
[97] R. G. Graham, L. K. Mok, M. A. Bergougnou, H. I. De Lasa, and B. A. Freel.Fast pyrolysis (ultrapyrolysis) of cellulose. Journal of Analytical and AppliedPyrolysis, 6:363–374, 1984.
[98] L. Wei, S. Xu, L. Zhang, H. Zhang, C. Liu, H. Zhu, and S. Liu. Characteristicsof fast pyrolysis of biomass in a free fall reactor. Fuel Processing Technology,87:863–871, 2006.
[99] C. M. Balonek, J. L. Colby, and L. D. Schmidt. Millisecond catalytic reformingof monoaromatics over noble metals. AIChE Journal, 56:979–988, 2010.
[100] C. K. Law and O. C. Kwon. Effects of hydrocarbon substitution on atmospherichydrogen-air flame propagation. International Journal of Hydrogen Energy, 29:867–879, 2004.
[101] B. C. Michael, A. Donazzi, and L. D. Schmidt. Effects of H2O and CO2 additionin catalytic partial oxidation of methane on Rh. Journal of Catalysis, 265:117–129, 2009.
[102] J. L. Colby. Catalytic Autothermal Reforming of Biomass to Synthesis Gas.PhD thesis, University of Minnesota, 2010.
[103] R. Horn, K. A. Williams, N. J. Degenstein, A. Bitsch-Larsen, D. Dalle Nogare,S. A. Tupy, and L. D. Schmidt. Methane catalytic partial oxidation on au-tothermal Rh and Pt foam catalysts: Oxidation and reforming zones, transporteffects, and approach to thermodynamic equilibrium. Journal of Catalysis, 249:380–393, 2007.
[104] G. J. Panuccio and L. D. Schmidt. Species and temperature profiles in a differ-ential sphere bed reactor for the catalytic partial oxidation of n-octane. AppliedCatalysis, A: General, 332:171–182, 2007.
[105] K. L. Hohn and L. D. Schmidt. Partial oxidation of methane to syngas at highspace velocities over Rh-coated spheres. Applied Catalysis, A: General, 211:53–68, 2001.
BIBLIOGRAPHY 95
[106] G. A. Deluga, J. R. Salge, L. D. Schmidt, and X. E. Verykios. Renewablehydrogen from ethanol by autothermal reforming. Science, 303:993–997, 2004.
[107] J. Warnatz, M. D. Allendorf, R. J. Kee, and M. E. Coltrin. A model of elemen-tary chemistry and fluid mechanics in the combustion of hydrogen on platinumsurfaces. Combustion and Flame, 96:393–406, 1994.
[108] A. Bitsch-Larsen, N. J. Degenstein, and L. D. Schmidt. Effect of sulfur in cat-alytic partial oxidation of methane over Rh-Ce coated foam monoliths. AppliedCatalysis B: Environmental, 78:364–370, 2008.
[109] R. P. O’Connor, E. J. Klein, D. Henning, and L. D. Schmidt. Tuning millisecondchemical reactors for the catalytic partial oxidation of cyclohexane. AppliedCatalysis, A: General, 238:29–40, 2003.
[110] A. Donazzi, A. Beretta, G. Groppi, and P. Forzatti. Catalytic partial oxidationof methane over a 4% Rh/α-Al2O3 catalyst. Journal of Catalysis, 255:241–258,2008.
[111] B. C. Michael, D. N. Nare, and L. D. Schmidt. Catalytic partial oxidation ofethane to ethylene and syngas over Rh and Pt coated monoliths: Spatial profilesof temperature and composition. Chemical Engineering Science, 65:3893–3902,2010.
[112] D. Mohan, C. U. Pittman, and P. H. Steele. Pyrolysis of wood/biomass forbio-oil: A critical review. Energy & Fuels, 20:848–889, 2006.
[113] E. M. Hassan, P. H. Steele, and L. Ingram. Characterization of fast pyrol-ysis bio-oils produced from pretreated pine wood. Applied Biochemistry andBiotechnology, 154:182–192, 2009.
[114] S. Arvelakis and E. G. Koukios. Physicochemical upgrading of agroresiduesas feedstocks for energy production via thermochemical conversion methods.Biomass and Bioenergy, 22:331, 2002.
[115] S. Xiong, J. Burvall, H. Orberg, G. Kalen, M. Thyrel, M. Ohman, andD. Bostrom. Slagging characteristics during combustion of corn stovers withand without kaolin and calcite. Energy and Fuels, 22:3465, 2008.
[116] L. Hoskinson, D. L. Karlen, S. J. Birrellc, C. W. Radtke, and W. W. Wilhelm.Engineering, nutrient removal, and feedstock conversion evaluations of four cornstover harvest scenarios. Biomass and Bioenergy, 31:126, 2007.
[117] E. A. Blekkan, A. Holmen, and S. Vada. Alumina-supported cobalt catalystscharacterized by TPR, TPD and pulse chemisorption. Acta Chemica Scandi-navica, 47:275, 1993.
BIBLIOGRAPHY 96
[118] H. P. Bonzel, G. Broden, and H. J. Krebs. X-ray photoemission spectroscopy ofpotassium-promoted iron and platinum surfaces after hydrogen reduction andcarbon monoxide-hydrogen reaction. Applications of Surface Science, 16:373,1983.
[119] M. Trpanier, A. Tavasoli, A. K. Dalai, and N. Abatzoglou. Co, Ru and Kloadings effects on the activity and selectivity of carbon nanotubes supportedcobalt catalyst in Fischer-Tropsch synthesis. Applied Catalysis, A: General,353:193, 2009.
[120] O. Borg, N. Hammer, S. Eri, O. A. Lindvaag, R. Myrstad, E. A. Blekkan,M. Roenning, E. Rytter, and A. Holmen. Fischer-Tropsch synthesis over un-promoted and Re-promoted γ-Al2O3 supported cobalt catalysts with differentpore sizes. Catalysis Today, 142:1, 2009.
[121] R. R. Baker and H. W. Elbersen. 14th European Biomass Conference andExhibition. 2005.
[122] H. Mansilla, R. Garcia, J. Tapia, H. Duran, and S. Urzua. Chemical character-ization of chilean hardwoods. Wood Science and Technology, 25:145, 1991.
[123] X. L. Zhou and J. M. White. Stabilization by potassium of adsorbed hydrogenon platinum(111). Surface Science, 185:450, 1987.
[124] W.-P. Ma, Y.-J. Ding, and L.-W. Lin. Fischer-Tropsch synthesis over activated-carbon-supported cobalt catalysts: Effect of Co loading and promoters on cata-lyst performance. Industrial & Engineering Chemistry Research, 43:2391, 2004.
[125] F. Solymosi and I. Kovacs. Effects of potassium adlayer on the adsorptionand desorption of hydrogen on a palladium(100) surface. Journal of PhysicalChemistry, 93:7537, 1989.
[126] H. P. Bonzel and H. J. Krebs. Enhanced rate of carbon deposition duringFischer-Tropsch synthesis on potassium-promoted iron. Surface Science, 109:L527, 1981.
[127] I. Rodriguez-Ramos, A. Guerrero-Ruiz, J. L. G. Fierro, P. R. de la Piscina,and N. Homs. Carbon monoxide hydrogenation over potassium-promoted iron,cobalt and nickel catalysts prepared from cyanide complexes. Zeitschrift fuerAnorganische und Allgemeine Chemie, 582:197, 1990.
[128] J. K. Brown, A. C. Luntz, and P. A. Schultz. Long-range poisoning of moleculardeuterium dissociative chemisorption on platinum(111) by coadsorbed potas-sium. Journal of Chemical Physics, 95:3767, 1991.
[129] D. A. Wesner, G. Linden, and H. P. Bonzel. Alkali promotion on cobalt: surfaceanalysis of the effects of potassium on carbon monoxide adsorption and Fischer-Tropsch reaction. Applied Surface Science, 26:335, 1986.
BIBLIOGRAPHY 97
[130] G. Ertl, S. B. Lee, and M. Weiss. The influence of potassium on the adsorptionof hydrogen on iron. Surface Science, 111:L711, 1981.
[131] N. D. Lang, S. Holloway, and J. K. Norskov. Electrostatic adsorbate-adsorbateinteractions: the poisoning and promotion of the molecular adsorption reaction.Surface Science, 150:24, 1985.
[132] S. Yaman. Pyrolysis of biomass to produce fuels and chemical feedstocks. EnergyConversion and Management, 45:651–671, 2004.
[133] A. Shihadeh and S. Hochgreb. Diesel engine combustion of biomass pyrolysisoils. Energy & Fuels, 14:260–274, 2000.
[134] S. Czernik and A. V. Bridgwater. Overview of applications of biomass fastpyrolysis oil. Energy & Fuels, 18:590–598, 2004.
[135] R. K. Kaila, A. Gutierrez, S.T. Korhonen, and A.O.I. Krause. Autothermalreforming of n-dodecane, toluene, and their mixture on mono- and bimetallicnoble metal zirconia catalysts. Catalysis Letters, 115(1-2):70–78, May 2007.
[136] C. Jeyabharathi, P. Venkateshkumar, J. Mathiyarasu, and K.L.N. Phani.Platinum-tin bimetallic nanoparticles for methanol tolerant oxygen-reductionactivity. Electrochimica Acta, 54:448–454, 2008.
[137] E. W. Dean and D. D. Stark. A convenient method for the determination ofwater in petroleum and other organic emulsions. The Journal of Industrial andEngineering Chemistry, 12:486–490, 1920.
[138] Academie Reims. Principaux montages de chimie. Online, June 2011. URL:http://www.ac-reims.fr.
[139] Z. Wang and S. A. Stout. Oil spill environmental forensics: fingerprinting andsource identification. Academic Press, 2007.
[140] A. Buekens. Feedstock Recycling and Pyrolysis of Waste Plastics: ConvertingWaste Plastics into Diesel and Other Fuels, Chapter: Introduction to FeedstockRecycling of Plastics, pages 3–41. John Wiley & Sons, 2006.
[141] N. Miskolczi. Feedstock Recycling and Pyrolysis of Waste Plastics: ConvertingWaste Plastics into Diesel and Other Fuels, Chapter: Kinetic Model of theChemical and Catalytic Recycling of Waste Polyethylene into Fuels, pages 225–247. John Wiley & Sons, 2006.
[142] C. G. Jung and A. Fontana. Feedstock Recycling and Pyrolysis of Waste Plas-tics: Converting Waste Plastics into Diesel and Other Fuels, Chapter: Pro-duction of Gaseous and Liquid Fuels by Pyrolysis and Gasification of Plastics:Technological Approach, pages 251–283. John Wiley & Sons, 2006.
BIBLIOGRAPHY 98
[143] P. T. Williams. Feedstock Recycling and Pyrolysis of Waste Plastics: ConvertingWaste Plastics into Diesel and Other Fuels, Chapter: Yield and Compositionof Gases and Oils/Waxes from the Feedstock Recycling of Waste Plastic, pages285–313. John Wiley & Sons, 2006.
[144] E. A. Williams and P. T. Williams. The pyrolysis of individual plastics anda plastic mixture in a fixed bed reactor. Journal of Chemical Technology &Biotechnology, 70(1):9–20, 1997.
[145] P. T. Williams and R. Bagri. Hydrocarbon gases and oils from the recyclingof polystyrene waste by catalytic pyrolysis. International Journal of EnergyResearch, 28(1):31–44, 2004.
[146] K.-H. Lee. Feedstock Recycling and Pyrolysis of Waste Plastics: ConvertingWaste Plastics into Diesel and Other Fuels, Chapter: Thermal and CatalyticDegradation of Waste HDPE, pages 129–160. John Wiley & Sons, 2006.
[147] M. Blazso. Feedstock Recycling and Pyrolysis of Waste Plastics: ConvertingWaste Plastics into Diesel and Other Fuels, Chapter: Composition of LiquidFuels Derived from the Pyrolysis of Plastics, pages 315–344. John Wiley &Sons, 2006.
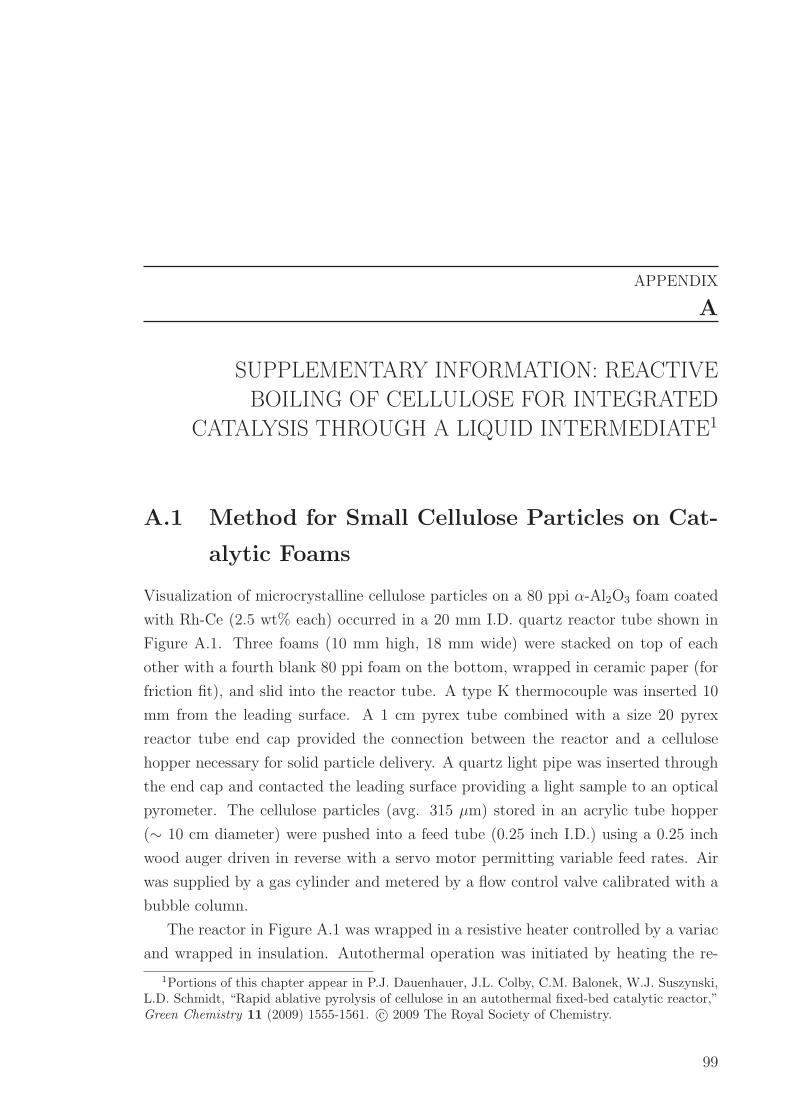
APPENDIX
A
SUPPLEMENTARY INFORMATION: REACTIVE
BOILING OF CELLULOSE FOR INTEGRATED
CATALYSIS THROUGH A LIQUID INTERMEDIATE1
A.1 Method for Small Cellulose Particles on Cat-
alytic Foams
Visualization of microcrystalline cellulose particles on a 80 ppi α-Al2O3 foam coated
with Rh-Ce (2.5 wt% each) occurred in a 20 mm I.D. quartz reactor tube shown in
Figure A.1. Three foams (10 mm high, 18 mm wide) were stacked on top of each
other with a fourth blank 80 ppi foam on the bottom, wrapped in ceramic paper (for
friction fit), and slid into the reactor tube. A type K thermocouple was inserted 10
mm from the leading surface. A 1 cm pyrex tube combined with a size 20 pyrex
reactor tube end cap provided the connection between the reactor and a cellulose
hopper necessary for solid particle delivery. A quartz light pipe was inserted through
the end cap and contacted the leading surface providing a light sample to an optical
pyrometer. The cellulose particles (avg. 315 µm) stored in an acrylic tube hopper
(∼ 10 cm diameter) were pushed into a feed tube (0.25 inch I.D.) using a 0.25 inch
wood auger driven in reverse with a servo motor permitting variable feed rates. Air
was supplied by a gas cylinder and metered by a flow control valve calibrated with a
bubble column.
The reactor in Figure A.1 was wrapped in a resistive heater controlled by a variac
and wrapped in insulation. Autothermal operation was initiated by heating the re-
1Portions of this chapter appear in P.J. Dauenhauer, J.L. Colby, C.M. Balonek, W.J. Suszynski,L.D. Schmidt, “Rapid ablative pyrolysis of cellulose in an autothermal fixed-bed catalytic reactor,”Green Chemistry 11 (2009) 1555-1561. c© 2009 The Royal Society of Chemistry.
99
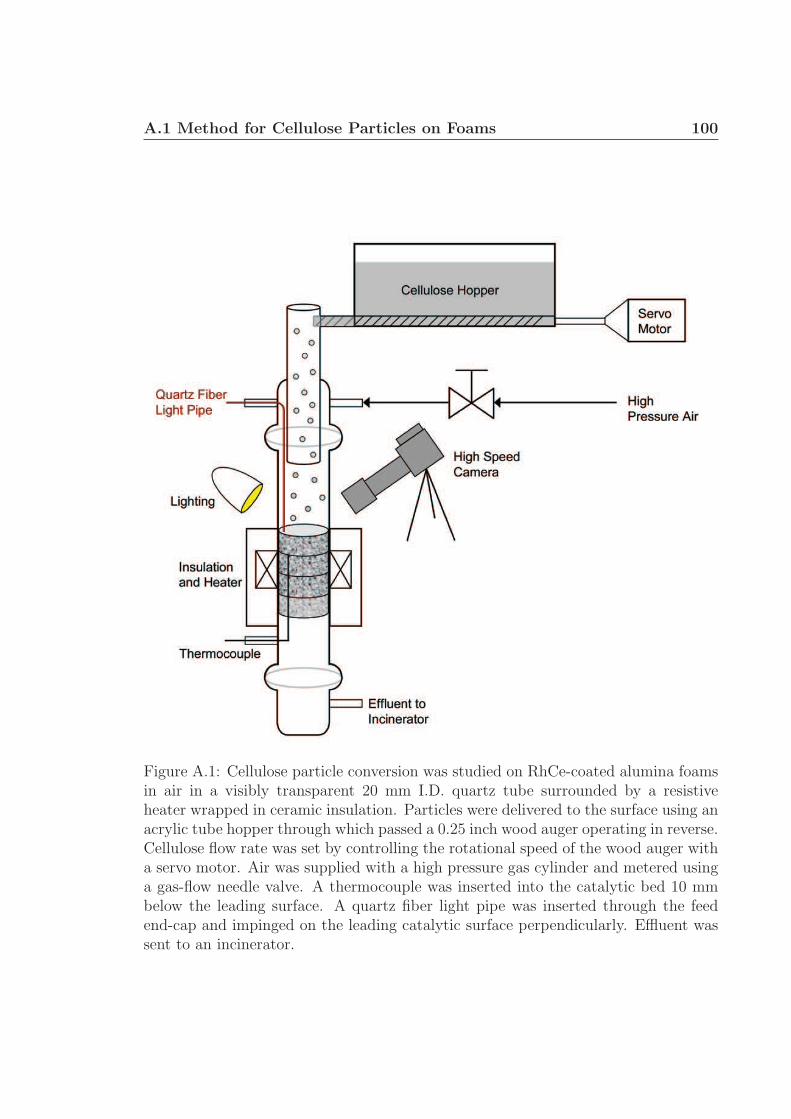
A.1 Method for Cellulose Particles on Foams 100
Figure A.1: Cellulose particle conversion was studied on RhCe-coated alumina foamsin air in a visibly transparent 20 mm I.D. quartz tube surrounded by a resistiveheater wrapped in ceramic insulation. Particles were delivered to the surface using anacrylic tube hopper through which passed a 0.25 inch wood auger operating in reverse.Cellulose flow rate was set by controlling the rotational speed of the wood auger witha servo motor. Air was supplied with a high pressure gas cylinder and metered usinga gas-flow needle valve. A thermocouple was inserted into the catalytic bed 10 mmbelow the leading surface. A quartz fiber light pipe was inserted through the feedend-cap and impinged on the leading catalytic surface perpendicularly. Effluent wassent to an incinerator.
A.2 Method for Cellulose Feedstock 101
actor externally with air flow to ∼ 400 ◦C, at which point particles were delivered to
the surface. Steady operation was obtained within ∼ 5 minutes, and the heater was
turned off. Varying surface temperatures were obtained by varying the air flow rate
or cellulose flow rate.
Digital video was obtained by focusing a Photron Fastcam Ultima APX with color
image through the curved quartz reactor. The four optical lenses placed in series to
obtain the presented magnification were: 1) a Micro-NIKKOR 105 mm lens by Nikon
of Japan, 2) a Nikon PN-11 extension tube by Nikon of Japan, 3) a Kenko extension
tube for Nikon/AF 36 mm by Kenko of Japan, and 4) a Kenko 2x Teleplus MC7
telephoto extension tube by Kenko of Japan. Light was provided to the catalyst
necessary for high speed imaging by a Solarc Light LB-50 by Welch Allyn, Inc. of
New York, U.S.A.
Additional videos are shown as Figures A.2 and A.3, and Figure 2.1(a) from
Chapter 2 is repeated as Figure A.4. Figure A.2 shows the behavior of two particles
impacting and coming to rest near each other on a the catalytic foam within ∼ 20
ms. After converting to an intermediate liquid, the two particles combine in about 3
ms to form a larger liquid particle which ultimately volatilizes at ∼ 180 ms. Gaseous
evolution is clearly visible from 100 137 ms. The frames illustrate the particles
tendency to form spherical liquid droplets. White streaks in frames 100 and 123
ms are small particles passing through the frame before contacting the surface and
volatilizing. Figure A.3 shows a lone, irregularly shaped particle coming to rest on an
alumina strut, converting to a liquid, and volatilizing to gases in ∼ 123 milliseconds.
The particle forms an intermediate liquid overhanging the narrower strut, but surface
tension pulls the liquid into a more spherical conformation.
A.2 Method for Small Particle Cellulose Feedstock
Microcrystalline cellulose obtained from FMC biopolymer (Lattice NT-200) was sieved
to average size ∼ 315 µm. As shown in Figure A.5, the particles are not perfectly
spherical, but rather have an aspect ratio (defined as length/width) of 1.39 ± 0.05 (95
% confidence interval) when considering only particles large enough for examination
with high speed photography (> 20 µm). Examination of cellulose particles by light
scattering reveals in the size distribution (vol %) that most of the mass of the cellulose
exists as large particles (> 200 µm). However, most of the particles are small (∼ 1
µm). Figure A.6 includes scanning electron micrographs of microcrystalline particles
coated in Pt. The particles clearly exhibit high porosity with large void spaces (10 -
A.2 Method for Cellulose Feedstock 102
Figure A.2: Microcrystalline cellulose particles (∼ 300 µm) reacting to volatile speciesin air on a 700 ◦C Rh-Ce/α-Al2O3 surface have been visualized with high-speedphotography on an 80 ppi Al2O3 foam support at C/O = 1.15 at 45◦ from the surfacenormal with temporal resolution of one millisecond. Two particles (impacting at 0and 17 ms) convert to a liquid and combine (82 - 85 ms) to a single particle whichreactively volatilizes completely (180 ms).
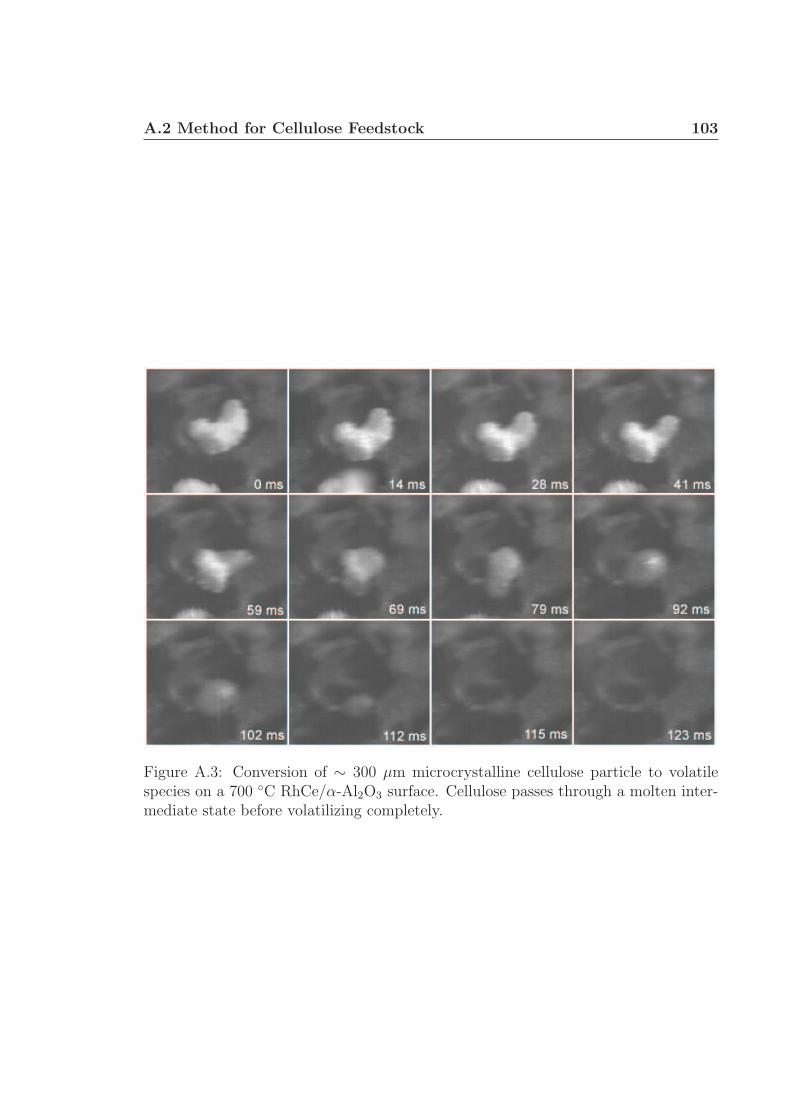
A.2 Method for Cellulose Feedstock 103
Figure A.3: Conversion of ∼ 300 µm microcrystalline cellulose particle to volatilespecies on a 700 ◦C RhCe/α-Al2O3 surface. Cellulose passes through a molten inter-mediate state before volatilizing completely.
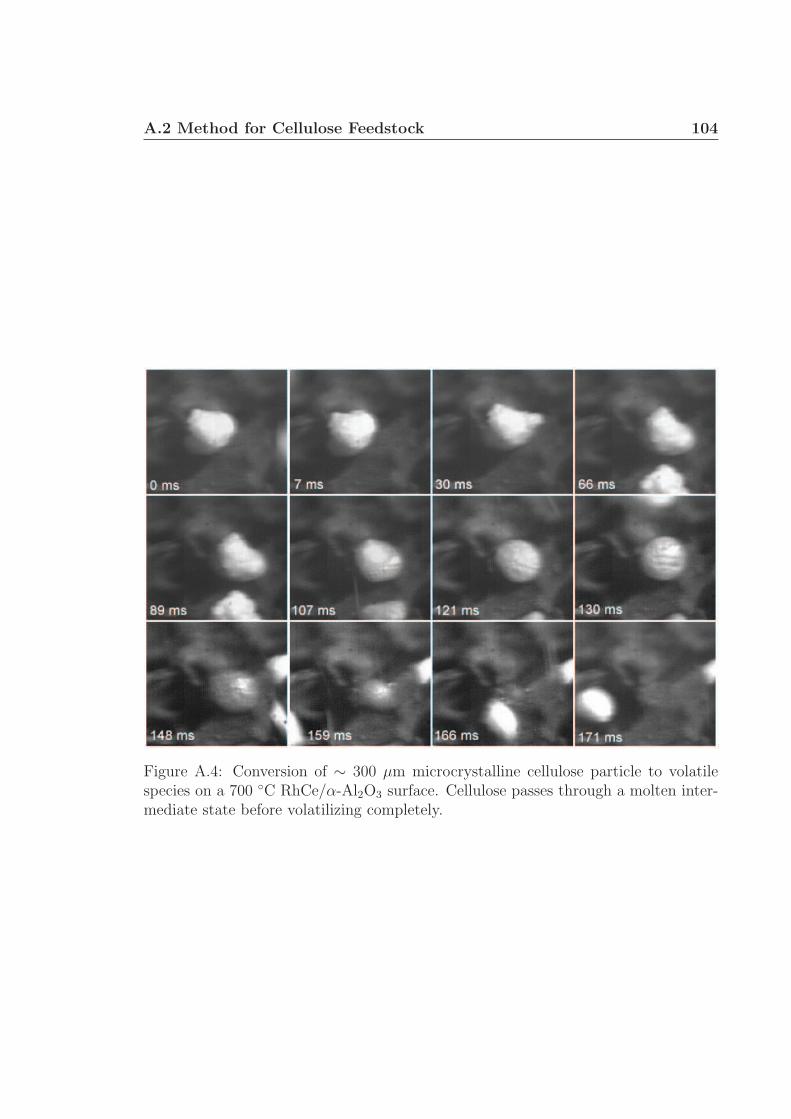
A.2 Method for Cellulose Feedstock 104
Figure A.4: Conversion of ∼ 300 µm microcrystalline cellulose particle to volatilespecies on a 700 ◦C RhCe/α-Al2O3 surface. Cellulose passes through a molten inter-mediate state before volatilizing completely.
A.3 Method for Conversion on Foams 105
40 microns) within the particle.
A.3 Method for Small Particle Conversion on Cat-
alytic Foams
Three video files with Tsurface = 700, 825, and 900 ◦C were obtained by varying the
cellulose and air flow rates as listed in Figure A.7. At each of the listed conditions,
approximately 50 particles were tracked from resting impact (not moving on the
surface) to the point in time when no visual trace of the particle was evident. At
each of the three conditions, the total conversion time was directly proportional to
the square of the initial particle radius (measured at the point of resting impact). The
difference between the measured conversion times and a linear fit appears to increase
with increasing particle dimensions. As shown in the first three panels of Figure A.7,
the proportionality constant decreased with increasing surface temperature. In other
words, a hotter surface resulted in faster heat transfer approximately consistent with
qconduction=hsurface(∆T). The fourth panel shows a frame of video captured through
the reactor wall. The thermocouple is clearly visible in the upper left corner for size
comparison (∼ 300 µm). The limitation of the depth of field of the camera only
permits the measurement of particles that fall on the foam located in the center of
the video frame.
Particles landing on struts of the catalytic foam within the depth of field of the
camera were clearly visible and measurable during their conversion lifetime as shown
in Figure 2.1. The width of four additional particles of varying size are included in
Figure A.8 to show that the behavior of the particle in Figure 2.1 was representative
of other particles. All observable particles exhibited nearly constant (or only slightly
decreasing) width for most of their lifetime through the conversion from solid to
liquid. Near the end of the particle conversion, fast linear decrease in particle width
was observed.
A.4 Method for Small Particle Conversion on Cat-
alytic Flat Surfaces
Particles of cellulose and sucrose pyrolyzing on a flat catalytic wafer (Rh-Ce/α-Al2O3,
2.5 wt% each) were also recorded using a high speed camera using the experimental
setup depicted in Figure A.9. A quartz reactor was held in place 1 - 2 cm above the
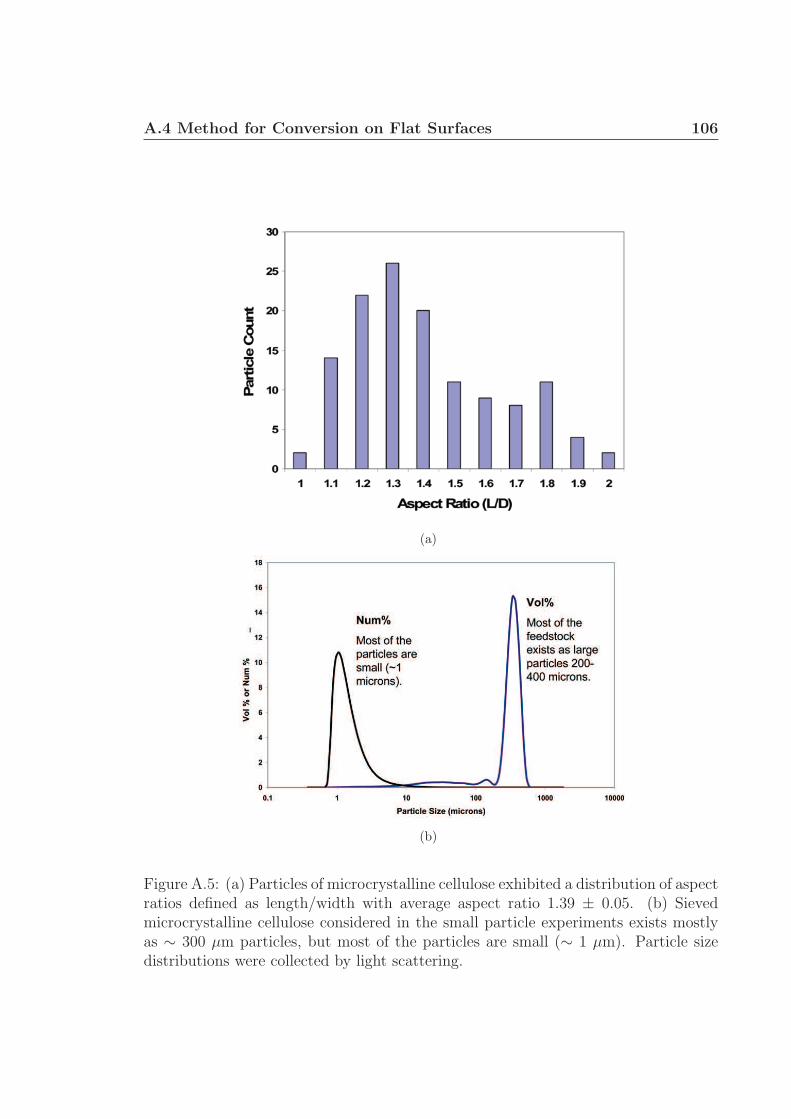
A.4 Method for Conversion on Flat Surfaces 106
(a)
(b)
Figure A.5: (a) Particles of microcrystalline cellulose exhibited a distribution of aspectratios defined as length/width with average aspect ratio 1.39 ± 0.05. (b) Sievedmicrocrystalline cellulose considered in the small particle experiments exists mostlyas ∼ 300 µm particles, but most of the particles are small (∼ 1 µm). Particle sizedistributions were collected by light scattering.
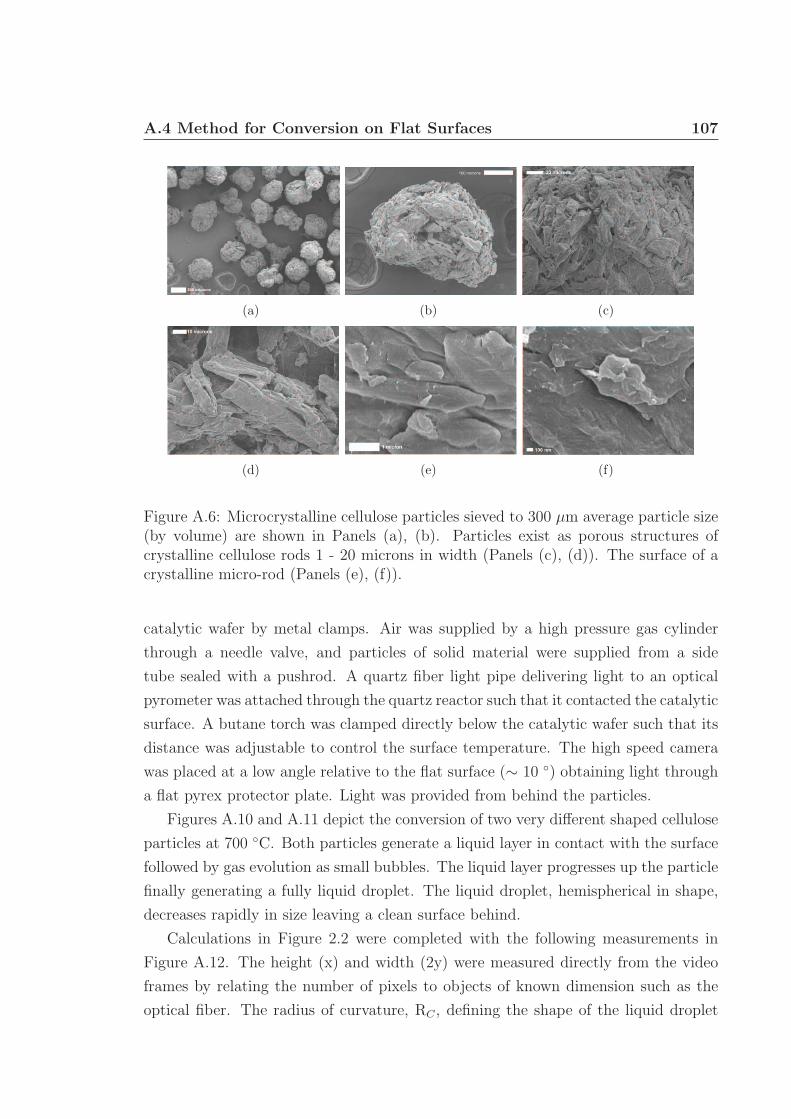
A.4 Method for Conversion on Flat Surfaces 107
(a) (b) (c)
(d) (e) (f)
Figure A.6: Microcrystalline cellulose particles sieved to 300 µm average particle size(by volume) are shown in Panels (a), (b). Particles exist as porous structures ofcrystalline cellulose rods 1 - 20 microns in width (Panels (c), (d)). The surface of acrystalline micro-rod (Panels (e), (f)).
catalytic wafer by metal clamps. Air was supplied by a high pressure gas cylinder
through a needle valve, and particles of solid material were supplied from a side
tube sealed with a pushrod. A quartz fiber light pipe delivering light to an optical
pyrometer was attached through the quartz reactor such that it contacted the catalytic
surface. A butane torch was clamped directly below the catalytic wafer such that its
distance was adjustable to control the surface temperature. The high speed camera
was placed at a low angle relative to the flat surface (∼ 10 ◦) obtaining light through
a flat pyrex protector plate. Light was provided from behind the particles.
Figures A.10 and A.11 depict the conversion of two very different shaped cellulose
particles at 700 ◦C. Both particles generate a liquid layer in contact with the surface
followed by gas evolution as small bubbles. The liquid layer progresses up the particle
finally generating a fully liquid droplet. The liquid droplet, hemispherical in shape,
decreases rapidly in size leaving a clean surface behind.
Calculations in Figure 2.2 were completed with the following measurements in
Figure A.12. The height (x) and width (2y) were measured directly from the video
frames by relating the number of pixels to objects of known dimension such as the
optical fiber. The radius of curvature, RC , defining the shape of the liquid droplet
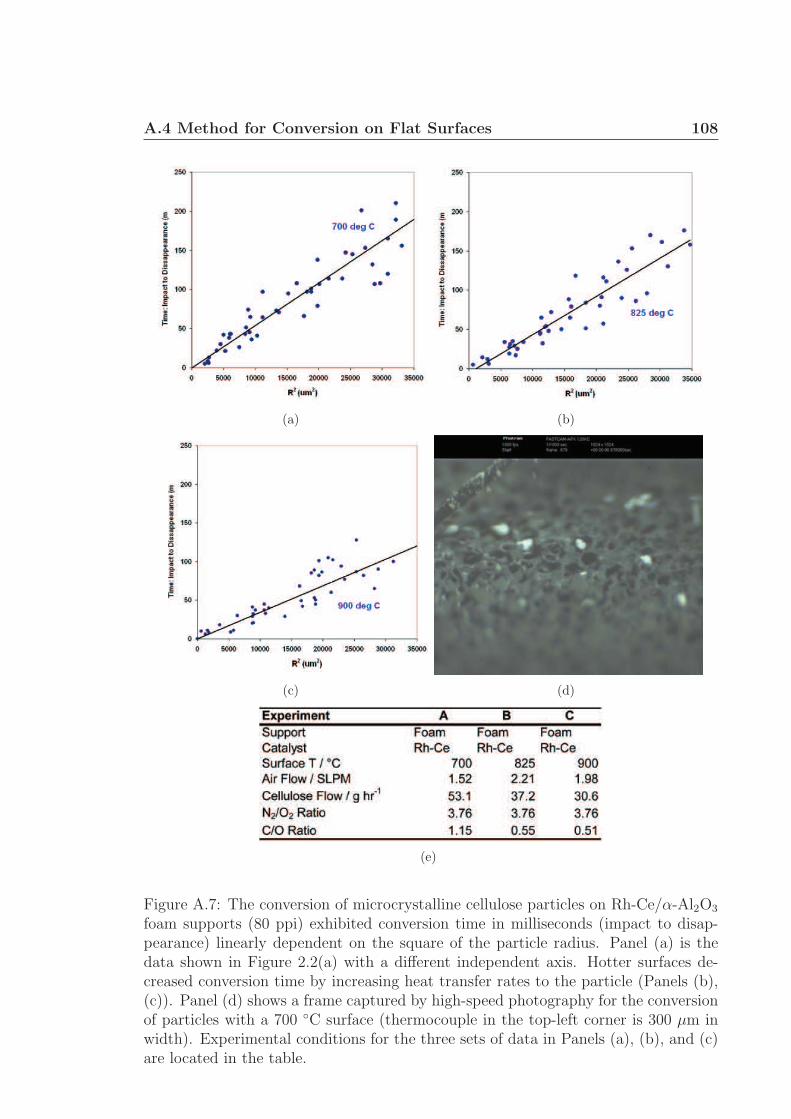
A.4 Method for Conversion on Flat Surfaces 108
(a) (b)
(c) (d)
(e)
Figure A.7: The conversion of microcrystalline cellulose particles on Rh-Ce/α-Al2O3
foam supports (80 ppi) exhibited conversion time in milliseconds (impact to disap-pearance) linearly dependent on the square of the particle radius. Panel (a) is thedata shown in Figure 2.2(a) with a different independent axis. Hotter surfaces de-creased conversion time by increasing heat transfer rates to the particle (Panels (b),(c)). Panel (d) shows a frame captured by high-speed photography for the conversionof particles with a 700 ◦C surface (thermocouple in the top-left corner is 300 µm inwidth). Experimental conditions for the three sets of data in Panels (a), (b), and (c)are located in the table.
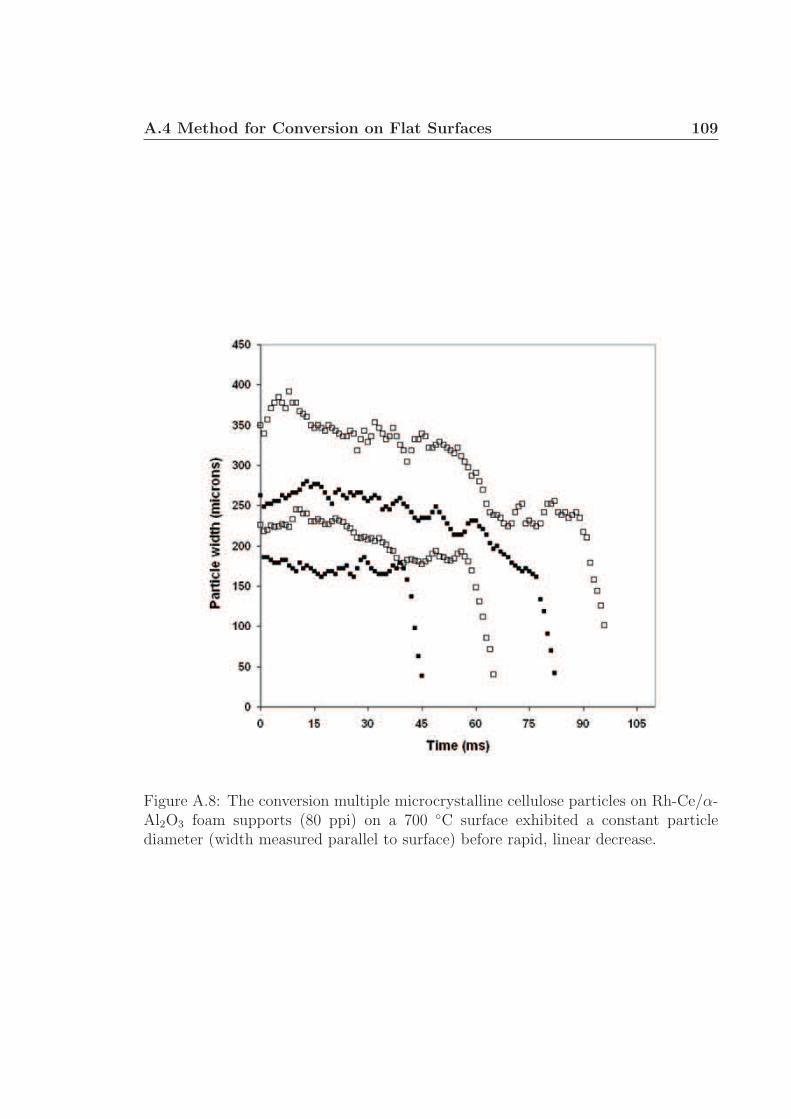
A.4 Method for Conversion on Flat Surfaces 109
Figure A.8: The conversion multiple microcrystalline cellulose particles on Rh-Ce/α-Al2O3 foam supports (80 ppi) on a 700 ◦C surface exhibited a constant particlediameter (width measured parallel to surface) before rapid, linear decrease.
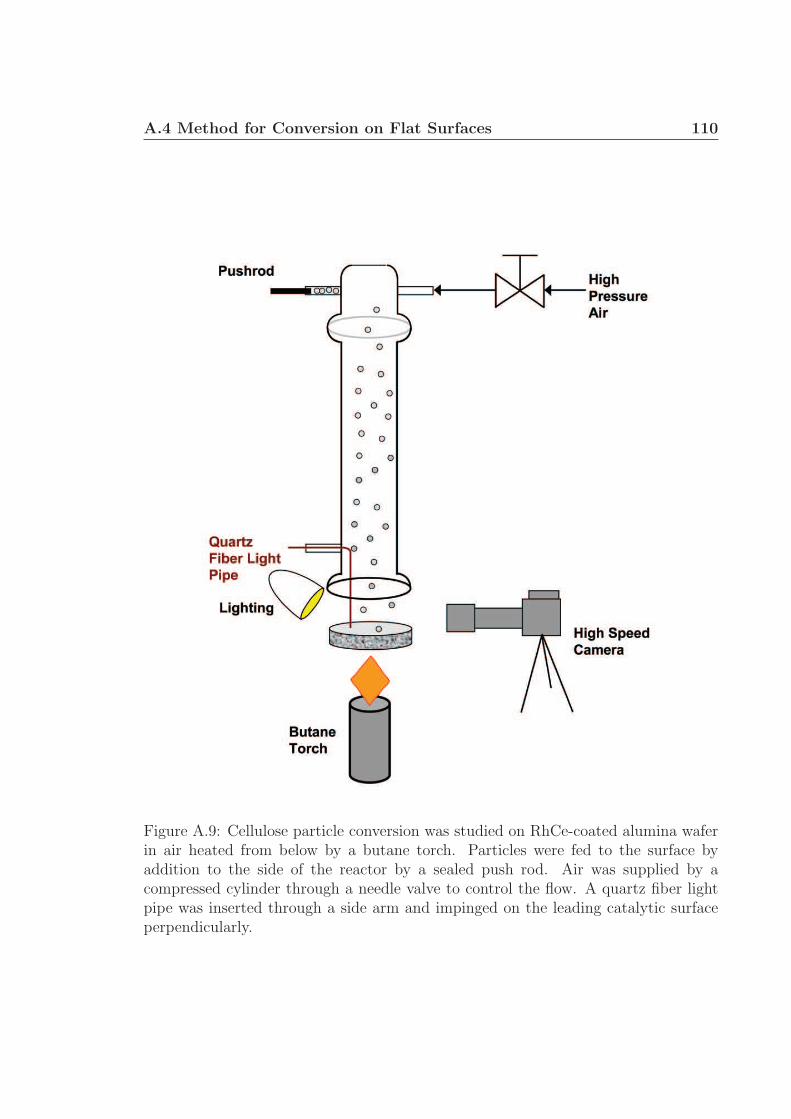
A.4 Method for Conversion on Flat Surfaces 110
Figure A.9: Cellulose particle conversion was studied on RhCe-coated alumina waferin air heated from below by a butane torch. Particles were fed to the surface byaddition to the side of the reactor by a sealed push rod. Air was supplied by acompressed cylinder through a needle valve to control the flow. A quartz fiber lightpipe was inserted through a side arm and impinged on the leading catalytic surfaceperpendicularly.
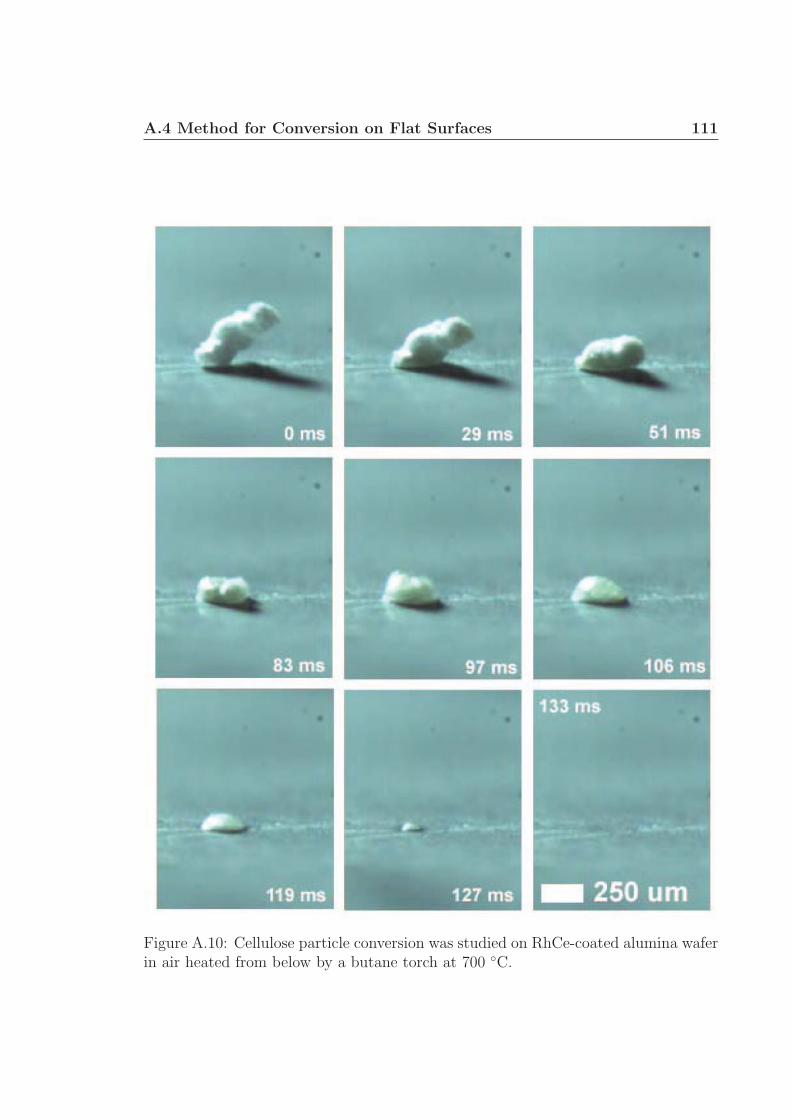
A.4 Method for Conversion on Flat Surfaces 111
Figure A.10: Cellulose particle conversion was studied on RhCe-coated alumina waferin air heated from below by a butane torch at 700 ◦C.
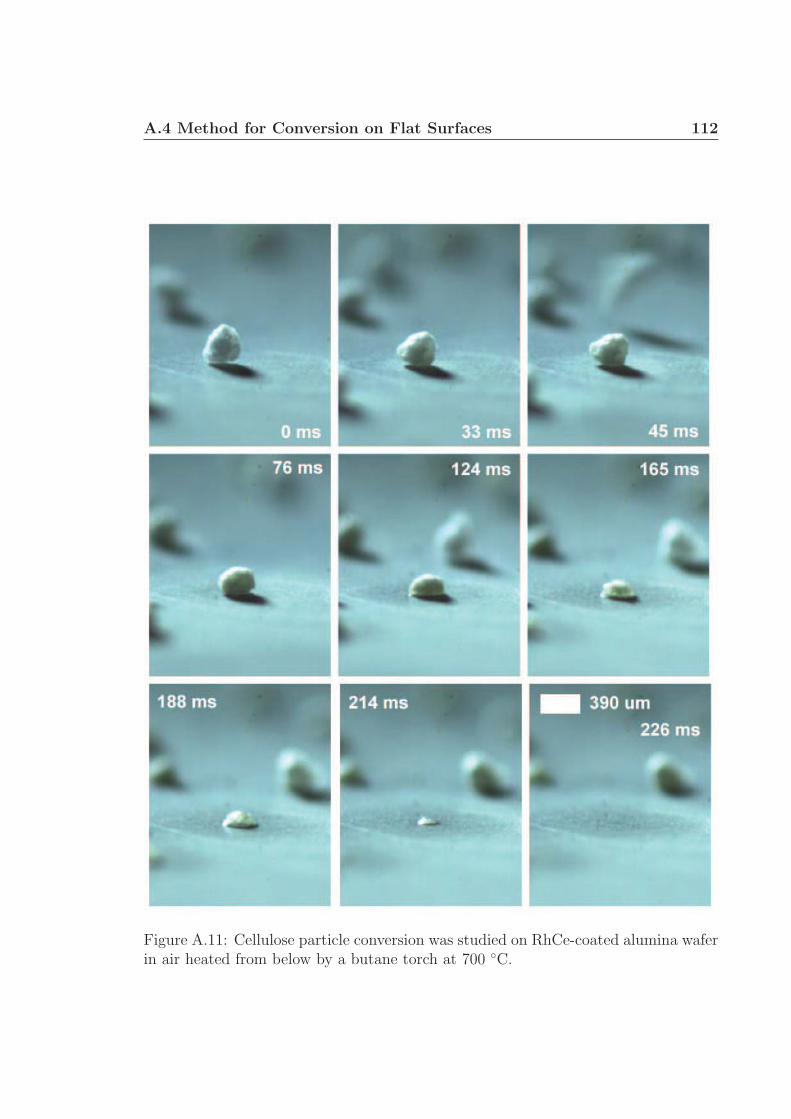
A.4 Method for Conversion on Flat Surfaces 112
Figure A.11: Cellulose particle conversion was studied on RhCe-coated alumina waferin air heated from below by a butane torch at 700 ◦C.
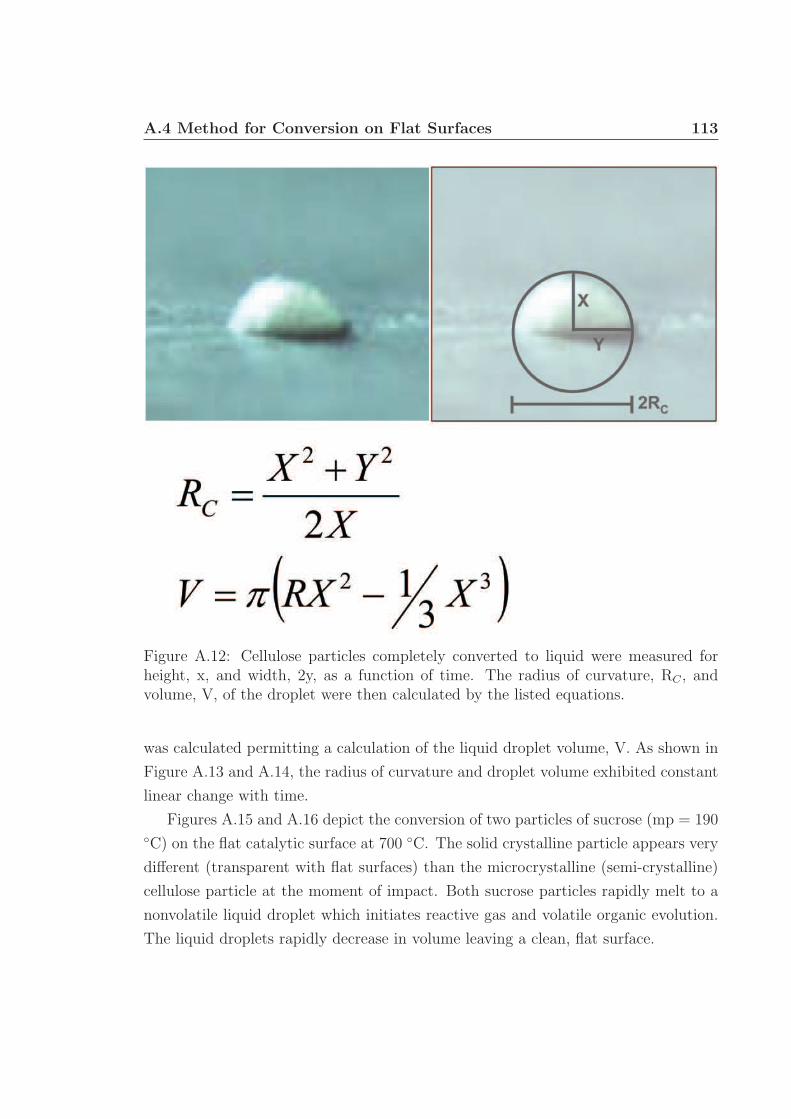
A.4 Method for Conversion on Flat Surfaces 113
Figure A.12: Cellulose particles completely converted to liquid were measured forheight, x, and width, 2y, as a function of time. The radius of curvature, RC , andvolume, V, of the droplet were then calculated by the listed equations.
was calculated permitting a calculation of the liquid droplet volume, V. As shown in
Figure A.13 and A.14, the radius of curvature and droplet volume exhibited constant
linear change with time.
Figures A.15 and A.16 depict the conversion of two particles of sucrose (mp = 190◦C) on the flat catalytic surface at 700 ◦C. The solid crystalline particle appears very
different (transparent with flat surfaces) than the microcrystalline (semi-crystalline)
cellulose particle at the moment of impact. Both sucrose particles rapidly melt to a
nonvolatile liquid droplet which initiates reactive gas and volatile organic evolution.
The liquid droplets rapidly decrease in volume leaving a clean, flat surface.
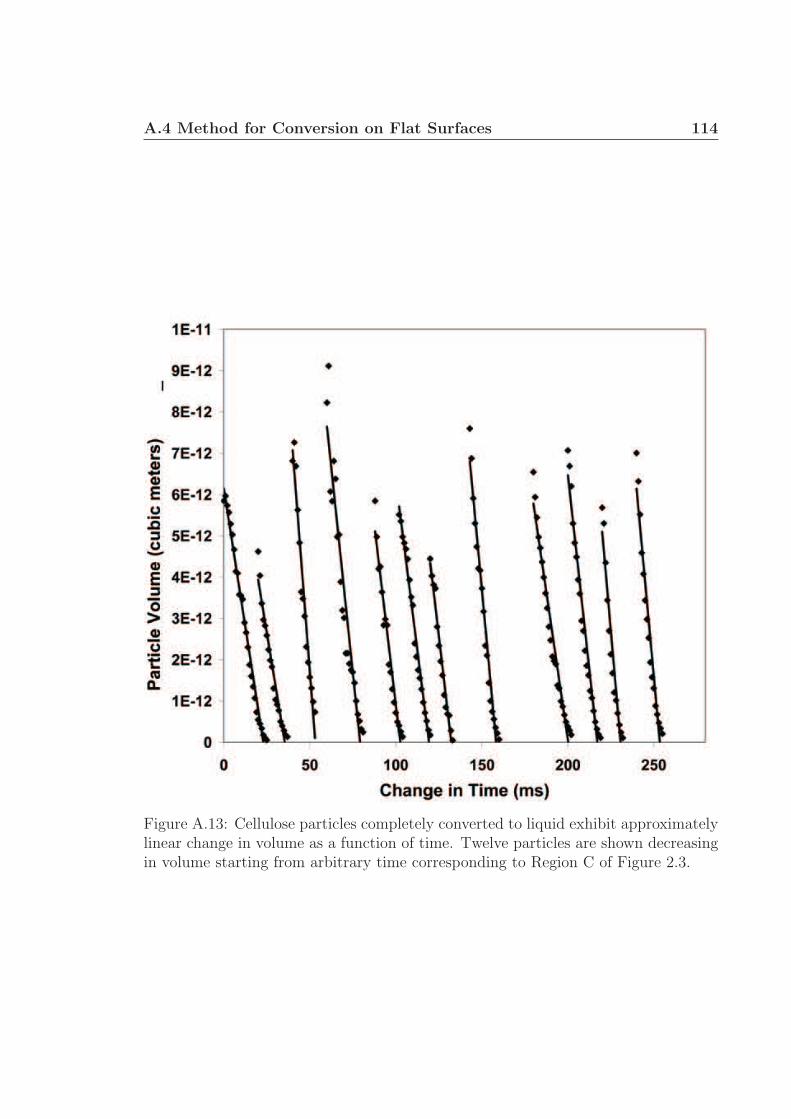
A.4 Method for Conversion on Flat Surfaces 114
Figure A.13: Cellulose particles completely converted to liquid exhibit approximatelylinear change in volume as a function of time. Twelve particles are shown decreasingin volume starting from arbitrary time corresponding to Region C of Figure 2.3.
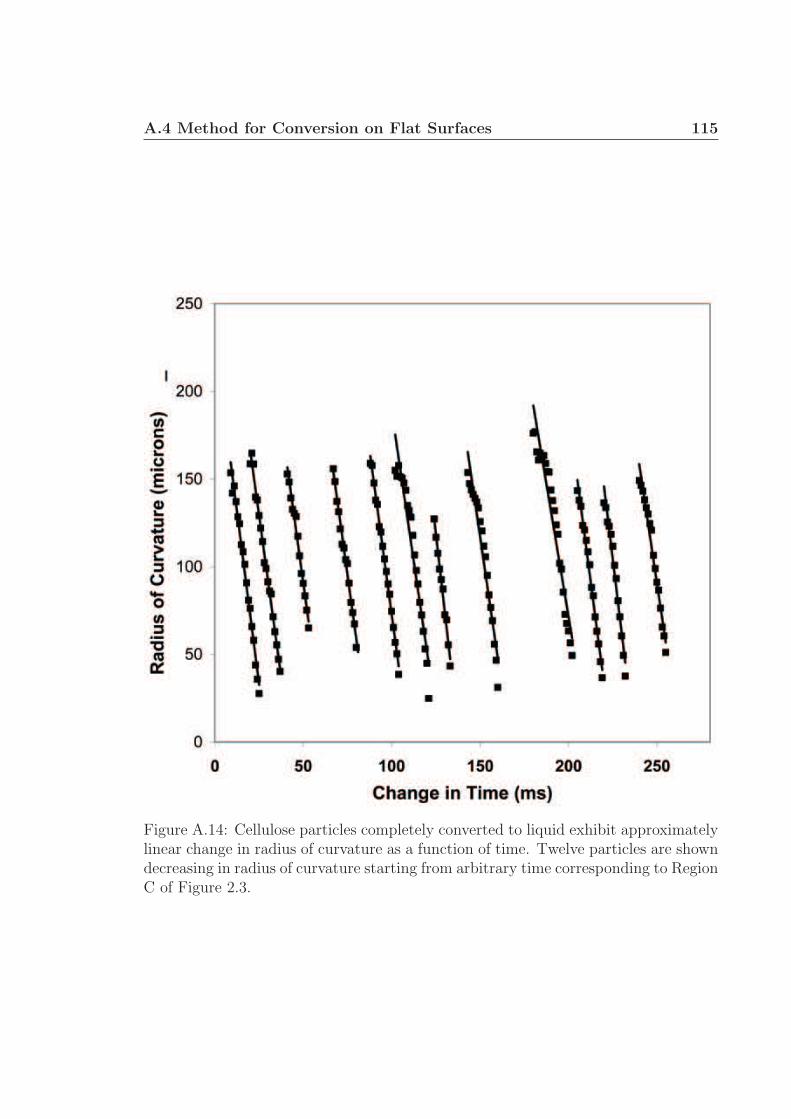
A.4 Method for Conversion on Flat Surfaces 115
Figure A.14: Cellulose particles completely converted to liquid exhibit approximatelylinear change in radius of curvature as a function of time. Twelve particles are showndecreasing in radius of curvature starting from arbitrary time corresponding to RegionC of Figure 2.3.
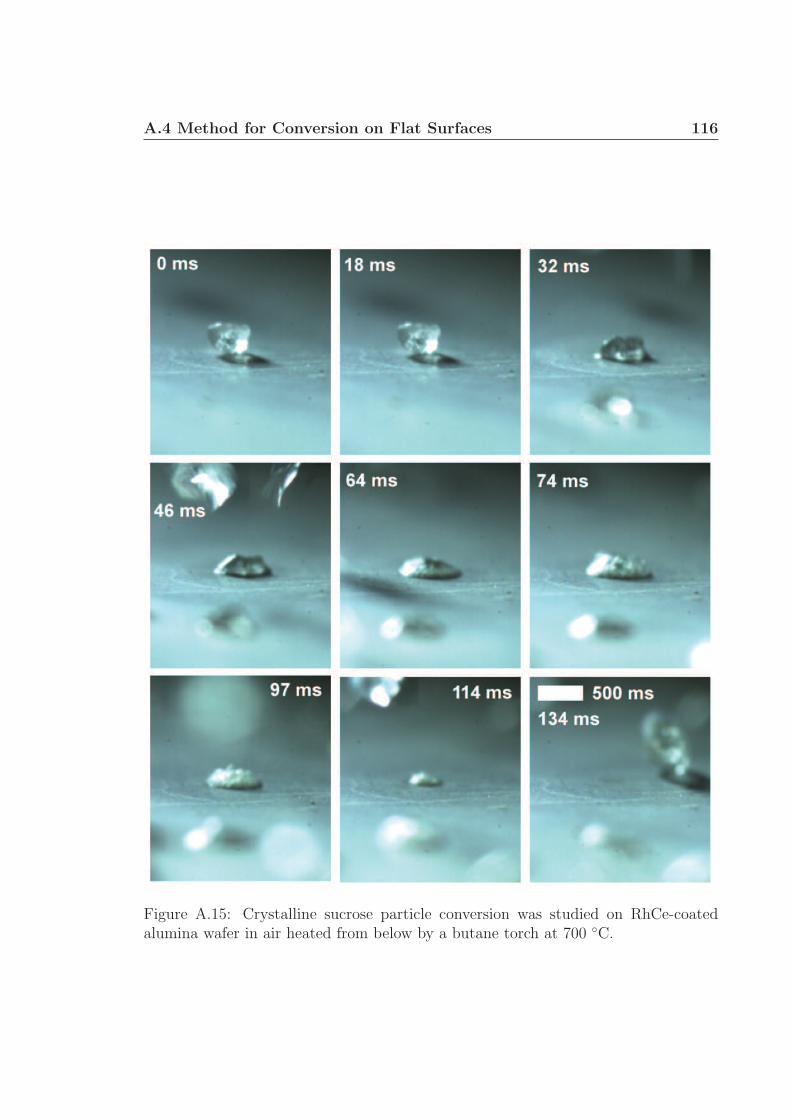
A.4 Method for Conversion on Flat Surfaces 116
Figure A.15: Crystalline sucrose particle conversion was studied on RhCe-coatedalumina wafer in air heated from below by a butane torch at 700 ◦C.
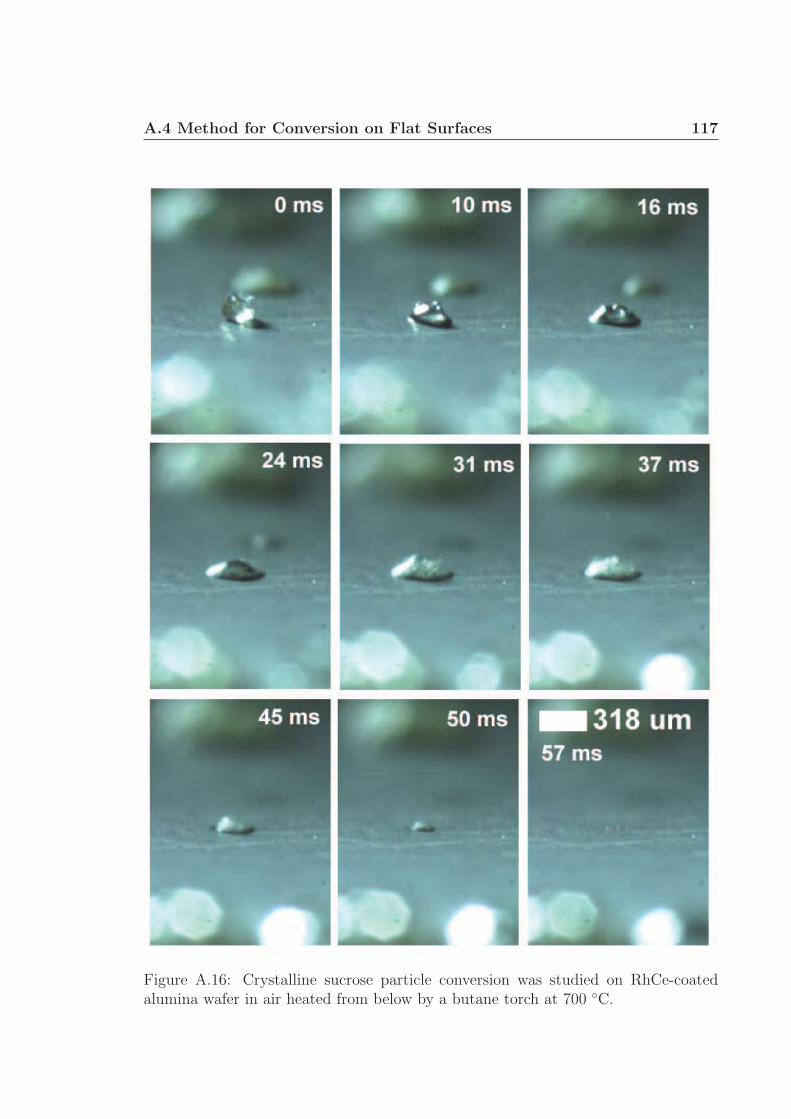
A.4 Method for Conversion on Flat Surfaces 117
Figure A.16: Crystalline sucrose particle conversion was studied on RhCe-coatedalumina wafer in air heated from below by a butane torch at 700 ◦C.

A.5 Glycerol Droplets 118
A.5 Glycerol Droplets on Catalytic Foams and
Wafers
The paper refers to glycerol droplets converting by reactive flash volatilization to
volatile species. Glycerol boils under atmospheric pressure at ∼ 290 ◦C permitting a
liquid particle to form a gaseous film between itself and a hot surface. Figure A.17
shows the impact dynamics (impact and breakup) of a large particle (∼ 800 µm)
of glycerol on a catalytic foam at 650 ◦C. Due to its boiling point restriction, the
temperature difference between the surface and the particle must be approximately
350 ◦C. The key observation of the frames (particularly 27 - 47 ms) is the absence of
the nucleating gaseous bubbles.
A.6 Method for Cellulose Rod Experimental
Setup
Cellulose rods were prepared by pulping (grinding at high speed in the presence of
distilled water) prepared sheets of cellulose-rich biopolymer. Analysis of the cellulose-
rich sheets showed that some hemicellulose was still mixed with cellulose (79.8 %
glucan, 19.5 % xylan, 0.3 % lignin, 0.4 % ash). The liquid pulp was poured into a
mold with a mesh bottom (50 cm x 50 cm x 1 cm deep), compressed with a board,
and dried for two days. The semi-dry slab was removed from the mold, and air-dried
in the presence of a fan for three additional days. The board was then cut using a
table saw in the following manner. All four edges were lightly trimmed (1 - 2 mm)
creating a square slab. Strips of cellulose were cut with a saw to 7 mm width. The
strips were then trimmed with a razor blade to 7 mm cross width, creating a cellulose
rod 7 mm x 7 mm x 500 mm.
Processing of the cellulose rods was performed in the setup outlined in Figure
A.18. Three catalytic foams and one blank heat shield were wrapped in ceramic
paper and held in place inside a quartz reactor by friction fit. A thermocouple was
placed 10 mm down from the leading edge of the catalytic bed. The reactor was
wrapped in insulation. Attached to the top of the reactor was a size 20 pyrex reactor
endcap fused to a 1 cm I.D. pyrex tube extending ∼ 1 m from the top of the reactor.
Gases (N2, O2, and CH4) flowed into the cap through the outside of the annulus to
the catalyst. A quartz light pipe was inserted into the outside of the annulus and
down to the leading edge of the catalyst. The long pyrex tube was graduated (∆x =
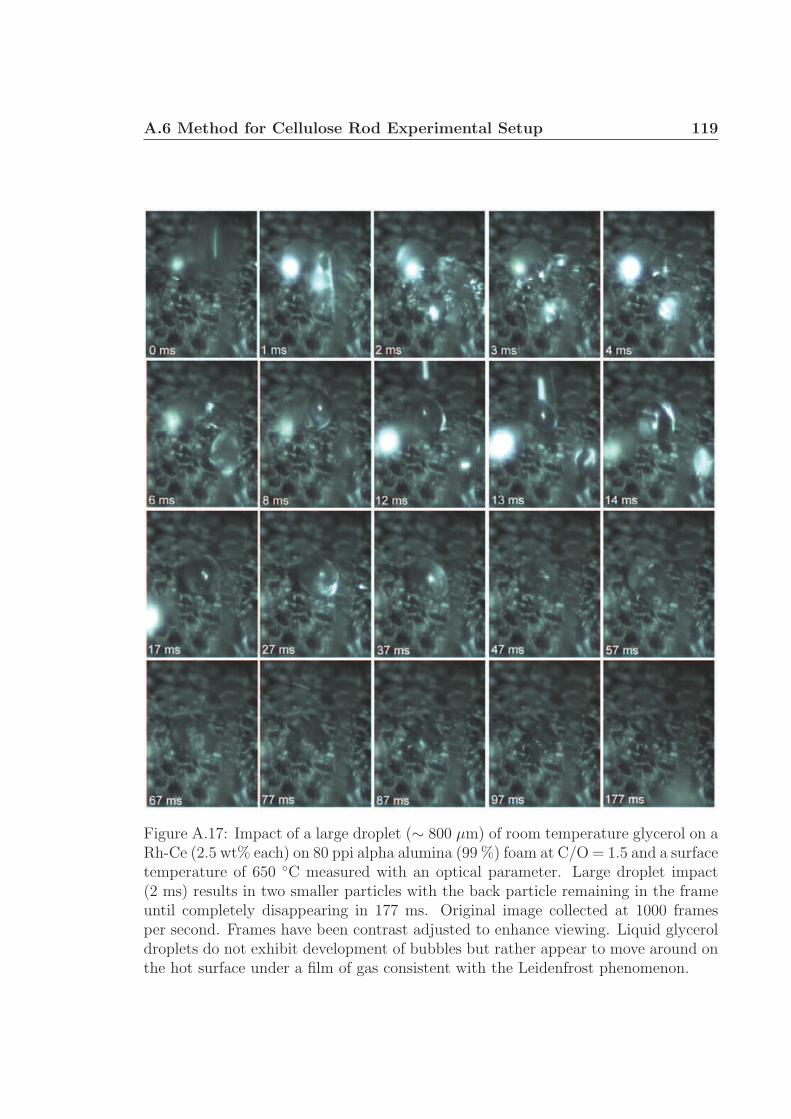
A.6 Method for Cellulose Rod Experimental Setup 119
Figure A.17: Impact of a large droplet (∼ 800 µm) of room temperature glycerol on aRh-Ce (2.5 wt% each) on 80 ppi alpha alumina (99 %) foam at C/O = 1.5 and a surfacetemperature of 650 ◦C measured with an optical parameter. Large droplet impact(2 ms) results in two smaller particles with the back particle remaining in the frameuntil completely disappearing in 177 ms. Original image collected at 1000 framesper second. Frames have been contrast adjusted to enhance viewing. Liquid glyceroldroplets do not exhibit development of bubbles but rather appear to move around onthe hot surface under a film of gas consistent with the Leidenfrost phenomenon.
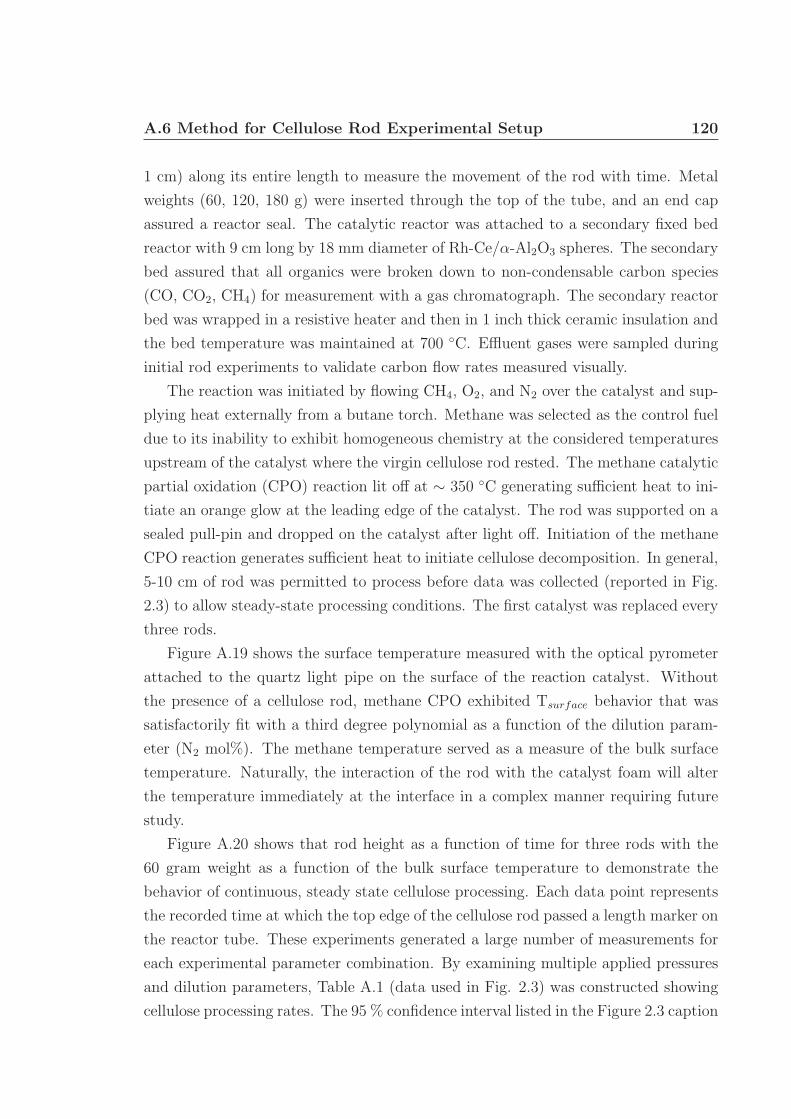
A.6 Method for Cellulose Rod Experimental Setup 120
1 cm) along its entire length to measure the movement of the rod with time. Metal
weights (60, 120, 180 g) were inserted through the top of the tube, and an end cap
assured a reactor seal. The catalytic reactor was attached to a secondary fixed bed
reactor with 9 cm long by 18 mm diameter of Rh-Ce/α-Al2O3 spheres. The secondary
bed assured that all organics were broken down to non-condensable carbon species
(CO, CO2, CH4) for measurement with a gas chromatograph. The secondary reactor
bed was wrapped in a resistive heater and then in 1 inch thick ceramic insulation and
the bed temperature was maintained at 700 ◦C. Effluent gases were sampled during
initial rod experiments to validate carbon flow rates measured visually.
The reaction was initiated by flowing CH4, O2, and N2 over the catalyst and sup-
plying heat externally from a butane torch. Methane was selected as the control fuel
due to its inability to exhibit homogeneous chemistry at the considered temperatures
upstream of the catalyst where the virgin cellulose rod rested. The methane catalytic
partial oxidation (CPO) reaction lit off at ∼ 350 ◦C generating sufficient heat to ini-
tiate an orange glow at the leading edge of the catalyst. The rod was supported on a
sealed pull-pin and dropped on the catalyst after light off. Initiation of the methane
CPO reaction generates sufficient heat to initiate cellulose decomposition. In general,
5-10 cm of rod was permitted to process before data was collected (reported in Fig.
2.3) to allow steady-state processing conditions. The first catalyst was replaced every
three rods.
Figure A.19 shows the surface temperature measured with the optical pyrometer
attached to the quartz light pipe on the surface of the reaction catalyst. Without
the presence of a cellulose rod, methane CPO exhibited Tsurface behavior that was
satisfactorily fit with a third degree polynomial as a function of the dilution param-
eter (N2 mol%). The methane temperature served as a measure of the bulk surface
temperature. Naturally, the interaction of the rod with the catalyst foam will alter
the temperature immediately at the interface in a complex manner requiring future
study.
Figure A.20 shows that rod height as a function of time for three rods with the
60 gram weight as a function of the bulk surface temperature to demonstrate the
behavior of continuous, steady state cellulose processing. Each data point represents
the recorded time at which the top edge of the cellulose rod passed a length marker on
the reactor tube. These experiments generated a large number of measurements for
each experimental parameter combination. By examining multiple applied pressures
and dilution parameters, Table A.1 (data used in Fig. 2.3) was constructed showing
cellulose processing rates. The 95 % confidence interval listed in the Figure 2.3 caption
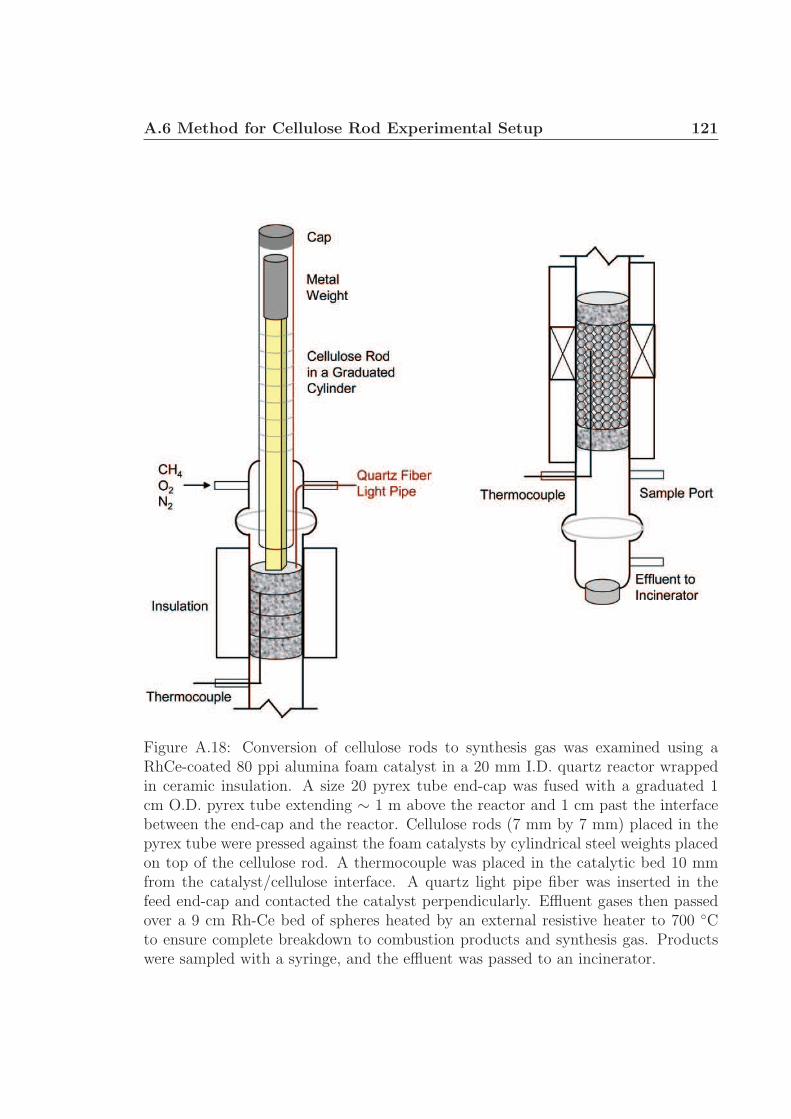
A.6 Method for Cellulose Rod Experimental Setup 121
Figure A.18: Conversion of cellulose rods to synthesis gas was examined using aRhCe-coated 80 ppi alumina foam catalyst in a 20 mm I.D. quartz reactor wrappedin ceramic insulation. A size 20 pyrex tube end-cap was fused with a graduated 1cm O.D. pyrex tube extending ∼ 1 m above the reactor and 1 cm past the interfacebetween the end-cap and the reactor. Cellulose rods (7 mm by 7 mm) placed in thepyrex tube were pressed against the foam catalysts by cylindrical steel weights placedon top of the cellulose rod. A thermocouple was placed in the catalytic bed 10 mmfrom the catalyst/cellulose interface. A quartz light pipe fiber was inserted in thefeed end-cap and contacted the catalyst perpendicularly. Effluent gases then passedover a 9 cm Rh-Ce bed of spheres heated by an external resistive heater to 700 ◦Cto ensure complete breakdown to combustion products and synthesis gas. Productswere sampled with a syringe, and the effluent was passed to an incinerator.
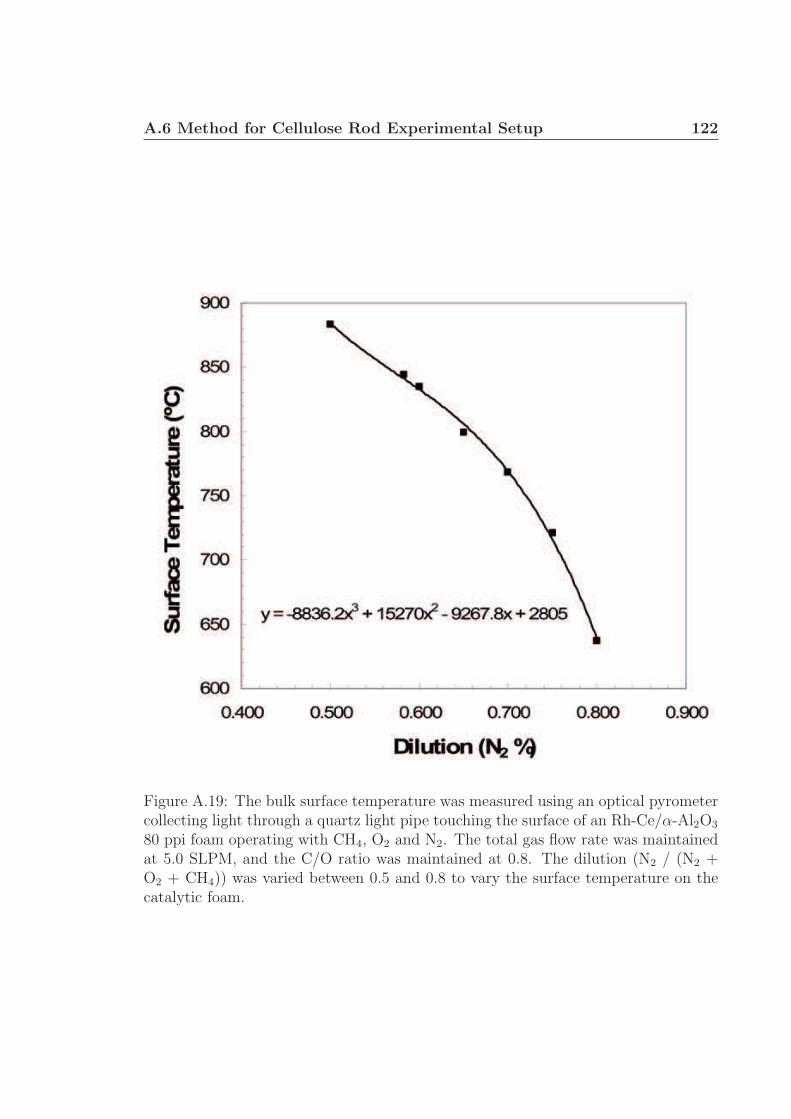
A.6 Method for Cellulose Rod Experimental Setup 122
Figure A.19: The bulk surface temperature was measured using an optical pyrometercollecting light through a quartz light pipe touching the surface of an Rh-Ce/α-Al2O3
80 ppi foam operating with CH4, O2 and N2. The total gas flow rate was maintainedat 5.0 SLPM, and the C/O ratio was maintained at 0.8. The dilution (N2 / (N2 +O2 + CH4)) was varied between 0.5 and 0.8 to vary the surface temperature on thecatalytic foam.
A.6 Method for Cellulose Rod Experimental Setup 123
Figure A.20: Rods of cellulose (7 mm x 7 mm x 500 mm) were pressed against anoperating Rh-Ce/α-Al2O3 80 ppi foam catalyst operating with CH4, N2 and O2. Therate of rod pyrolysis was measured as rod height as a function of time.
was calculated by the method of Table A.2.
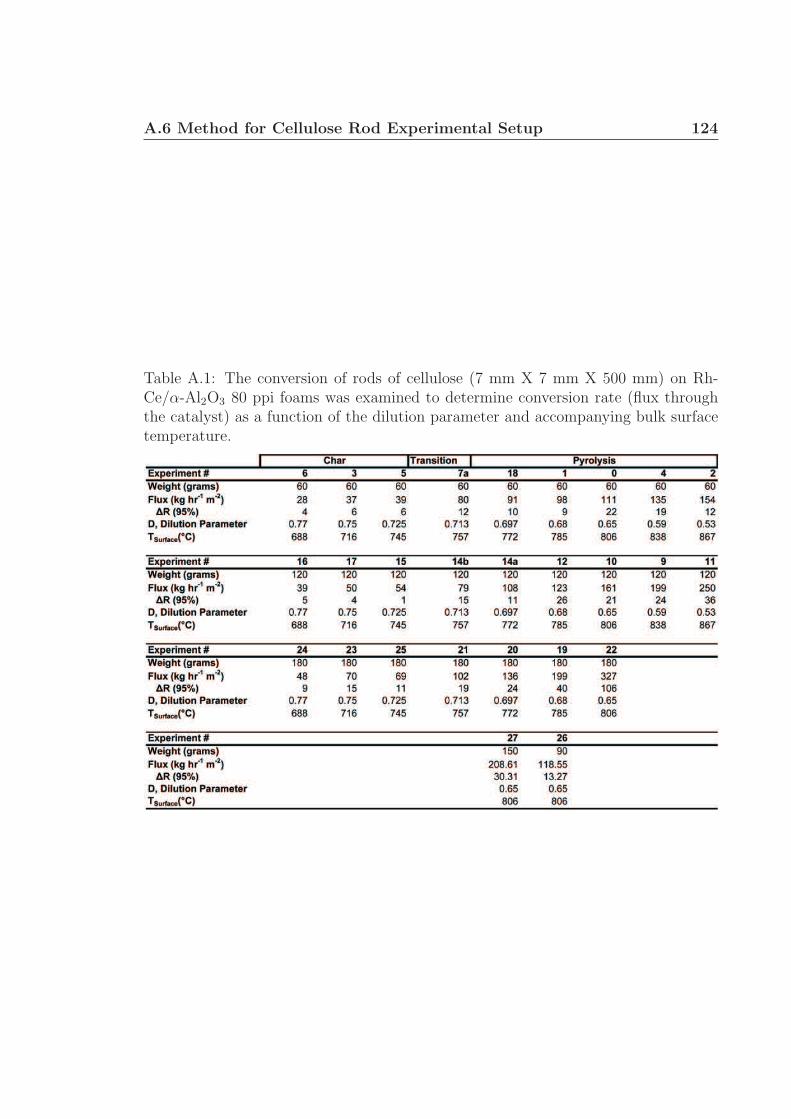
A.6 Method for Cellulose Rod Experimental Setup 124
Table A.1: The conversion of rods of cellulose (7 mm X 7 mm X 500 mm) on Rh-Ce/α-Al2O3 80 ppi foams was examined to determine conversion rate (flux throughthe catalyst) as a function of the dilution parameter and accompanying bulk surfacetemperature.
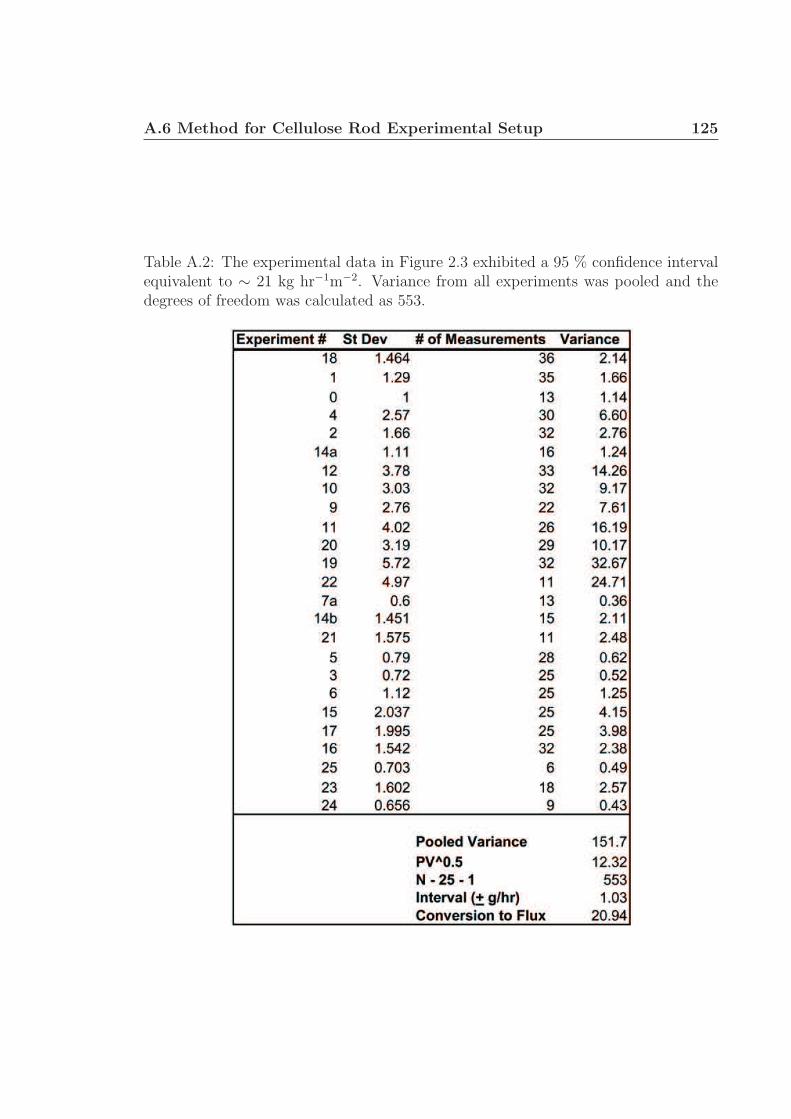
A.6 Method for Cellulose Rod Experimental Setup 125
Table A.2: The experimental data in Figure 2.3 exhibited a 95 % confidence intervalequivalent to ∼ 21 kg hr−1m−2. Variance from all experiments was pooled and thedegrees of freedom was calculated as 553.