Embed Size (px)
Citation preview
AUTOSTRADA TORINO – MILANO
SOCIETA’ INIZIATIVE AUTOSTRADALI E SERVIZI GAVIO GROUP
February 2012

1. KEY FACTS
2. GROUP STRUCTURE
3. FINANCIAL RESULTS
4. CONCESSION AGREEMENTS
5. GROUP FINANCIAL STRUCTURE
6. CHILEAN ASSETS
7. CLOSING REMARKS
APPENDIX
Agenda
2

1. KEY FACTS
2. GROUP STRUCTURE
3. FINANCIAL RESULTS
4. CONCESSION AGREEMENTS
5. GROUP FINANCIAL STRUCTURE
6. CHILEAN ASSETS
7. CLOSING REMARKS
APPENDIX
Agenda
3
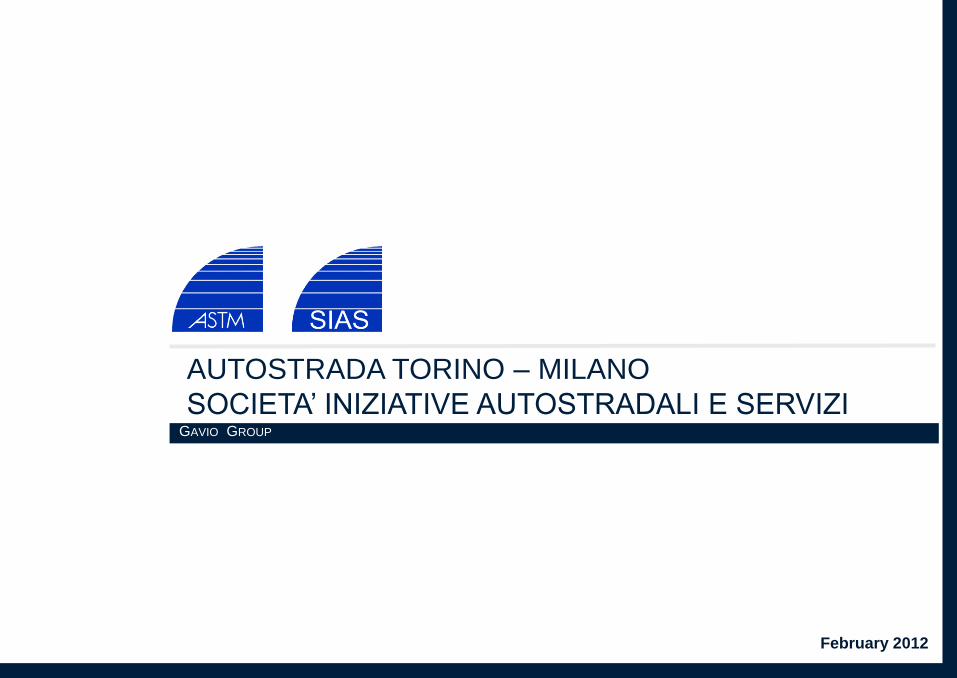
“COMPETITION LAW” FOR THE TRANSPORTATION SECTOR(2)
THE BOD OF SIAS APPROVED AN INTERIM DIVIDEND OF 0.16 EURO PER SHARE (+14%)
THE BOD OF ASTM APPROVED AN INTERIM DIVIDEND OF 0.15 EURO PER SHARE (+7%)
ARGO RESERVED THE RIGHT TO DESIGNATE ASTM AS BUYER IN THE PURCHASE OF
IGLI(1) SHARES FROM FONDIARIA-SAI GROUP
2012 TARIFF HIKES EFFECTIVE FROM JANUARY 1, 2012
Q4 2011 / Jan 2012 - KEY FACTS
(1) Main shareholder of Impregilo
(2) As published in the Official Journal on January 24, 2012
Jan 2012
4
Q4 2011

Agenda
5
1. KEY FACTS
2. GROUP STRUCTURE
3. FINANCIAL RESULTS
4. CONCESSION AGREEMENTS
5. GROUP FINANCIAL STRUCTURE
6. CHILEAN ASSETS
7. CLOSING REMARKS
APPENDIX
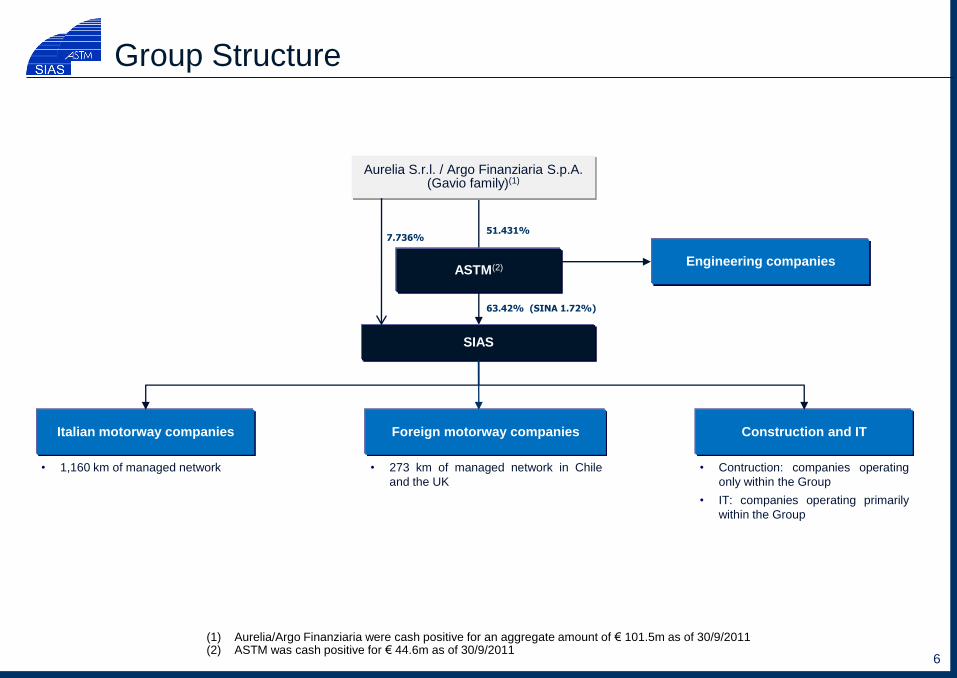
Group Structure
(1) Aurelia/Argo Finanziaria were cash positive for an aggregate amount of € 101.5m as of 30/9/2011 (2) ASTM was cash positive for € 44.6m as of 30/9/2011
6
ASTM(2)
Italian motorway companies
SIAS
Construction and IT Foreign motorway companies
Aurelia S.r.l. / Argo Finanziaria S.p.A. (Gavio family)(1)
• 1,160 km of managed network • 273 km of managed network in Chile
and the UK
• Contruction: companies operating
only within the Group
• IT: companies operating primarily
within the Group
51.431%
63.42% (SINA 1.72%)
7.736%
Engineering companies
7
SATAP A4
SATAP A21
SAV
ASTI-CUNEO
ADF
CISA
SALT
ATIVA
SITAF
SITRASB
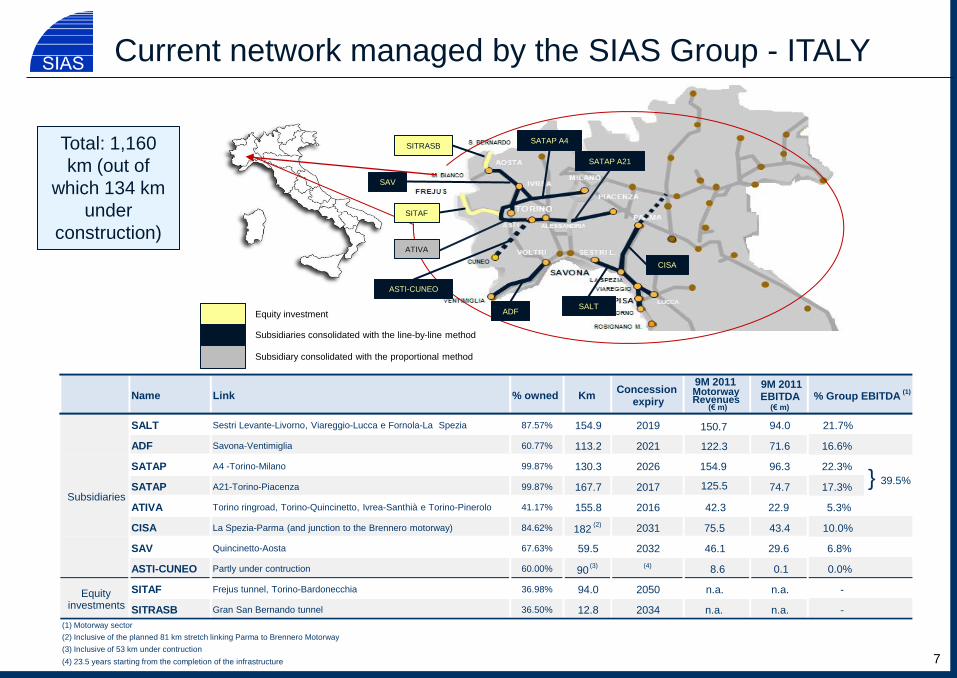
Equity investment
Subsidiaries consolidated with the line-by-line method
Subsidiary consolidated with the proportional method
Total: 1,160
km (out of
which 134 km
under
construction)
Current network managed by the SIAS Group - ITALY
Name Link % owned Km Concession
expiry
9M 2011 Motorway Revenues
(€ m)
9M 2011 EBITDA
(€ m)
SALT Sestri Levante-Livorno, Viareggio-Lucca e Fornola-La Spezia 87.57% 154.9 2019 94.0 21.7%
ADF Savona-Ventimiglia 60.77% 113.2 2021 71.6 16.6%
SATAP A4 -Torino-Milano 99.87% 130.3 2026 154.9 96.3 22.3%
SATAP A21-Torino-Piacenza 99.87% 167.7 2017 74.7 17.3%
ATIVA Torino ringroad, Torino-Quincinetto, Ivrea-Santhià e Torino-Pinerolo 41.17% 155.8 2016 42.3 22.9 5.3%
CISA La Spezia-Parma (and junction to the Brennero motorway) 84.62% 182 (2) 2031 75.5 43.4 10.0%
SAV Quincinetto-Aosta 67.63% 59.5 2032 46.1 29.6 6.8%
ASTI-CUNEO Partly under contruction 60.00% 90 (3) (4) 8.6 0.1 0.0%
SITAF Frejus tunnel, Torino-Bardonecchia 36.98% 94.0 2050 n.a. n.a. -
SITRASB Gran San Bernando tunnel 36.50% 12.8 2034 n.a. n.a. -
(4) 23.5 years starting from the completion of the infrastructure
% Group EBITDA (1)
(1) Motorway sector
(3) Inclusive of 53 km under contruction
Subsidiaries
Equity investments
(2) Inclusive of the planned 81 km stretch linking Parma to Brennero Motorway
} 39.5% 125.5
122.3
150.7
8
Name % owned Km Concession
expiry 9M 2011 Revenues
(€ m) 9M 2011 EBITDA
(€ m)
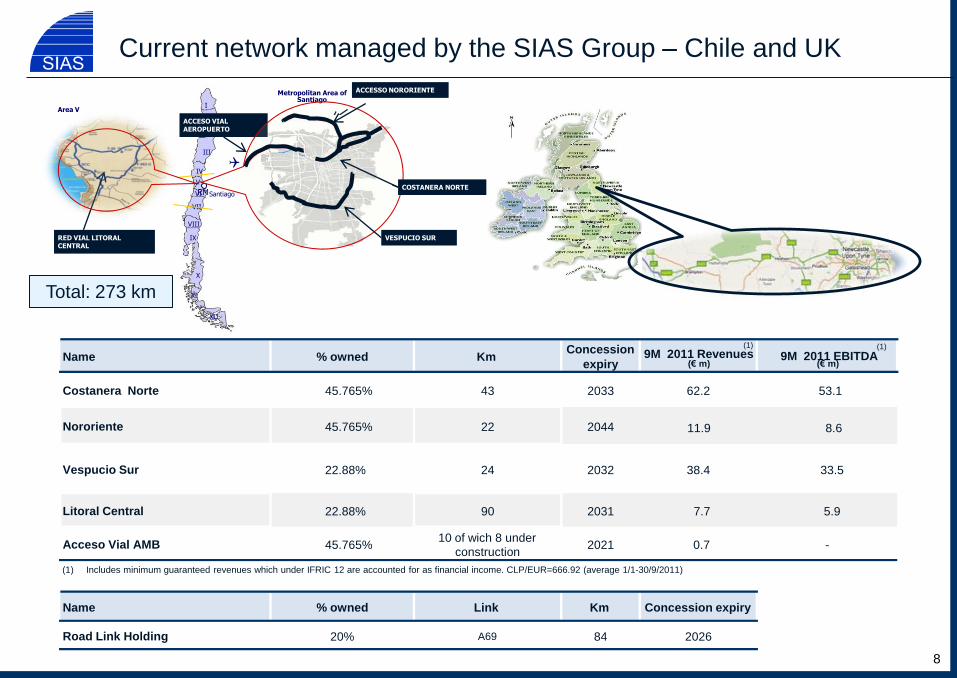
Costanera Norte 45.765% 43 2033 62.2 53.1
Nororiente 45.765% 22 2044 11.9
(1)
8.6
(1)
Vespucio Sur 22.88% 24 2032 38.4 33.5
Litoral Central 22.88% 90 2031 7.7 5.9
Acceso Vial AMB 45.765% 10 of wich 8 under
construction 2021 0.7 -
Name % owned Link Km Concession expiry
Road Link Holding 20% A69 84 2026
(1) Includes minimum guaranteed revenues which under IFRIC 12 are accounted for as financial income. CLP/EUR=666.92 (average 1/1-30/9/2011)
Current network managed by the SIAS Group – Chile and UK
I
II
III
IV
V
RM VI
VII
VIII
IX
X
XI
XII
Santiago
Metropolitan Area of Santiago
ACCESO VIAL AEROPUERTO
VESPUCIO SUR RED VIAL LITORAL CENTRAL
Area V
ACCESSO NORORIENTE
COSTANERA NORTE
Total: 273 km

Agenda
9
1. KEY FACTS
2. GROUP STRUCTURE
3. FINANCIAL RESULTS
4. CONCESSION AGREEMENTS
5. GROUP FINANCIAL STRUCTURE
6. CHILEAN ASSETS
7. CLOSING REMARKS
APPENDIX
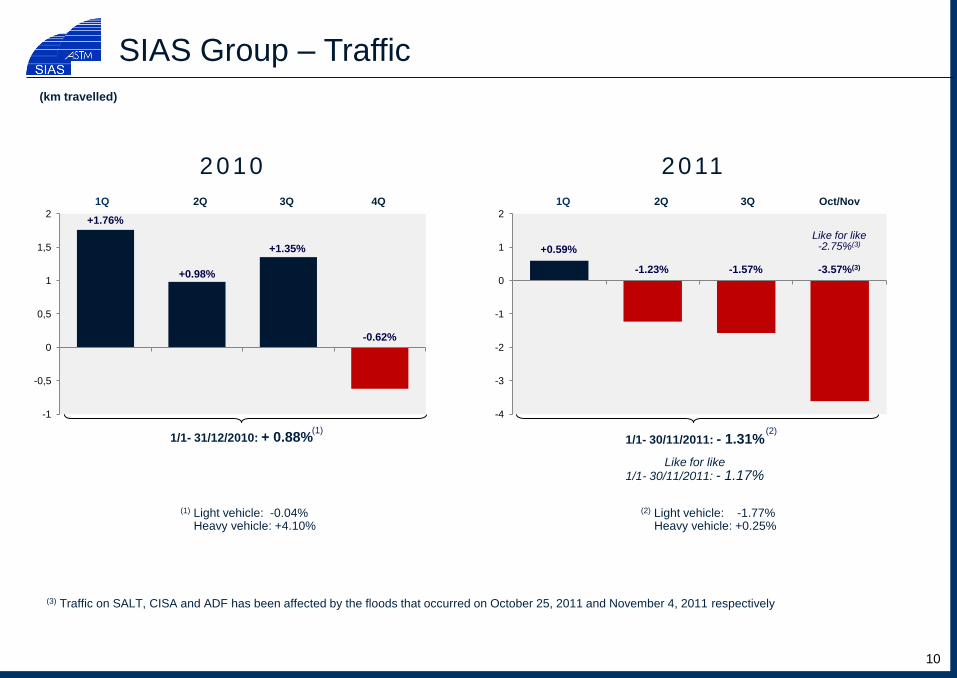
SIAS Group – Traffic
(1) Light vehicle: -0.04% Heavy vehicle: +4.10%
(km travelled)
-1
-0,5
0
0,5
1
1,5
2
2010
1Q 2Q
1/1- 31/12/2010: + 0.88%
3Q 4Q
(1)
+1.76%
+0.98%
+1.35%
-0.62%
10
-4
-3
-2
-1
0
1
2
2011
1Q 2Q
1/1- 30/11/2011: - 1.31%
3Q Oct/Nov
(2)
+0.59%
-1.23% -1.57% -3.57%(3)
Like for like 1/1- 30/11/2011: - 1.17%
Like for like -2.75%(3)
(3) Traffic on SALT, CISA and ADF has been affected by the floods that occurred on October 25, 2011 and November 4, 2011 respectively
(2) Light vehicle: -1.77% Heavy vehicle: +0.25%
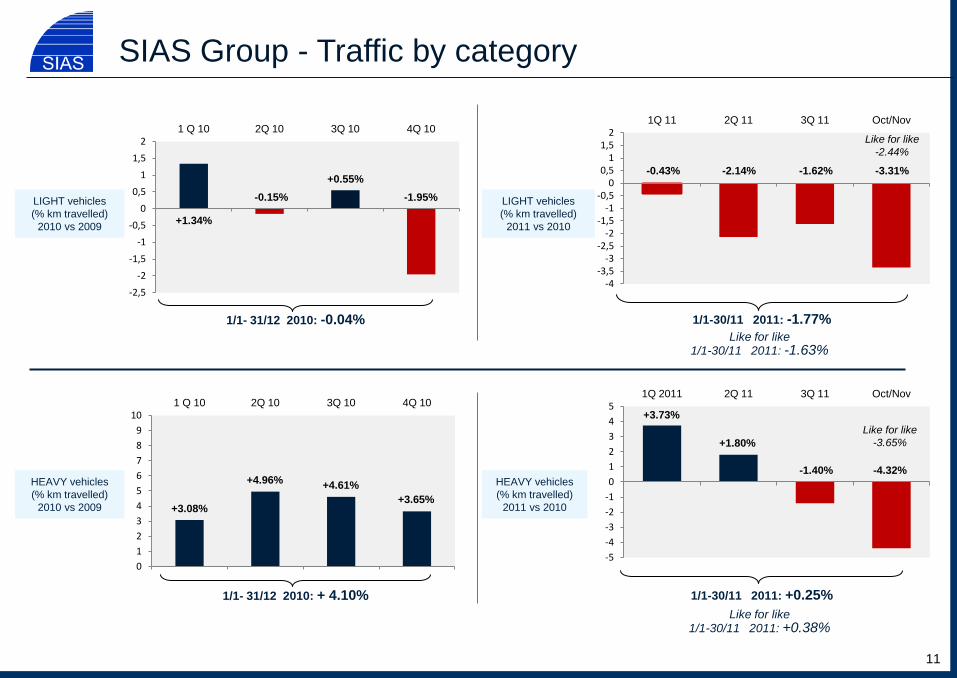
LIGHT vehicles
(% km travelled)
2010 vs 2009
HEAVY vehicles
(% km travelled)
2010 vs 2009
LIGHT vehicles
(% km travelled)
2011 vs 2010
HEAVY vehicles
(% km travelled)
2011 vs 2010
11
SIAS Group - Traffic by category
-2,5
-2
-1,5
-1
-0,5
0
0,5
1
1,5
2 1 Q 10 2Q 10 3Q 10 4Q 10
+1.34%
-0.15%
+0.55%
-1.95%
1/1- 31/12 2010: -0.04%
3,08
4,96 4,61
3,65
0
1
2
3
4
5
6
7
8
9
10 1 Q 10 2Q 10 3Q 10 4Q 10
+4.96%
+3.08%
+4.61%
+3.65%
1/1- 31/12 2010: + 4.10%
-4 -3,5
-3 -2,5
-2 -1,5
-1 -0,5
0 0,5
1 1,5
2 1Q 11 2Q 11 3Q 11 Oct/Nov
-0.43% -2.14%
1/1-30/11 2011: -1.77%
-1.62% -3.31%
Like for like 1/1-30/11 2011: -1.63%
Like for like
-2.44%
-5
-4
-3
-2
-1
0
1
2
3
4
5 1Q 2011 2Q 11 3Q 11 Oct/Nov
+3.73%
-1.40%
1/1-30/11 2011: +0.25%
+1.80%
-4.32%
Like for like 1/1-30/11 2011: +0.38%
Like for like
-3.65%
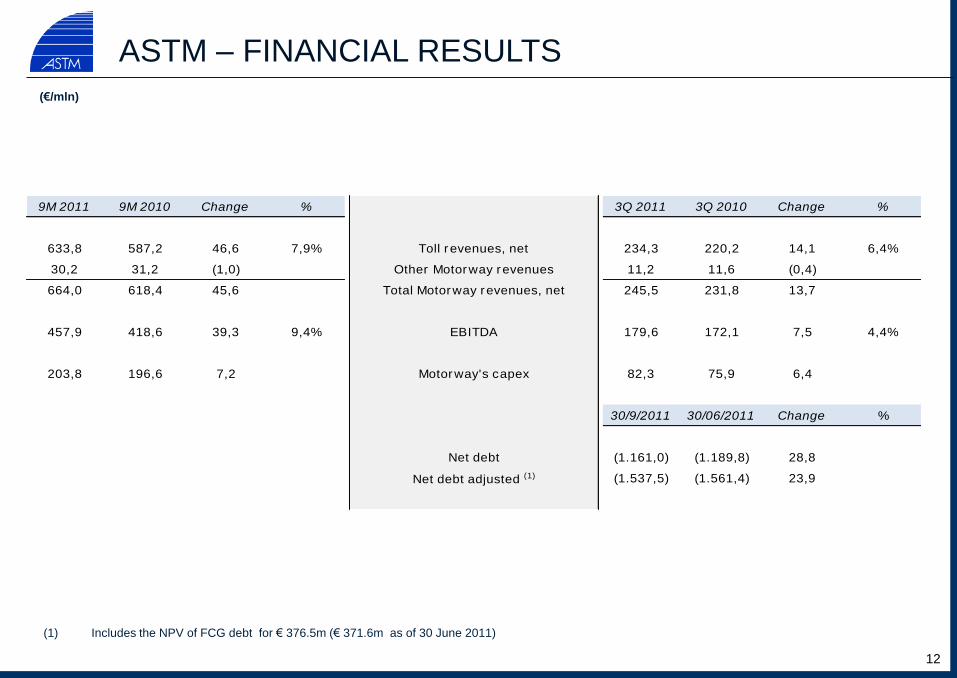
ASTM – FINANCIAL RESULTS
12
(1) Includes the NPV of FCG debt for € 376.5m (€ 371.6m as of 30 June 2011)
(€/mln)
9M 2011 9M 2010 Change % 3Q 2011 3Q 2010 Change %
633,8 587,2 46,6 7,9% 234,3 220,2 14,1 6,4%
30,2 31,2 (1,0) 11,2 11,6 (0,4)
664,0 618,4 45,6 245,5 231,8 13,7
457,9 418,6 39,3 9,4% 179,6 172,1 7,5 4,4%
203,8 196,6 7,2 82,3 75,9 6,4
30/9/2011 30/06/2011 Change %
(1.161,0) (1.189,8) 28,8
(1.537,5) (1.561,4) 23,9Net debt adjusted (1)
Toll r evenues, net
Other Motorway revenues
Total Motorway revenues, net
EBITDA
Motorway's capex
Net debt
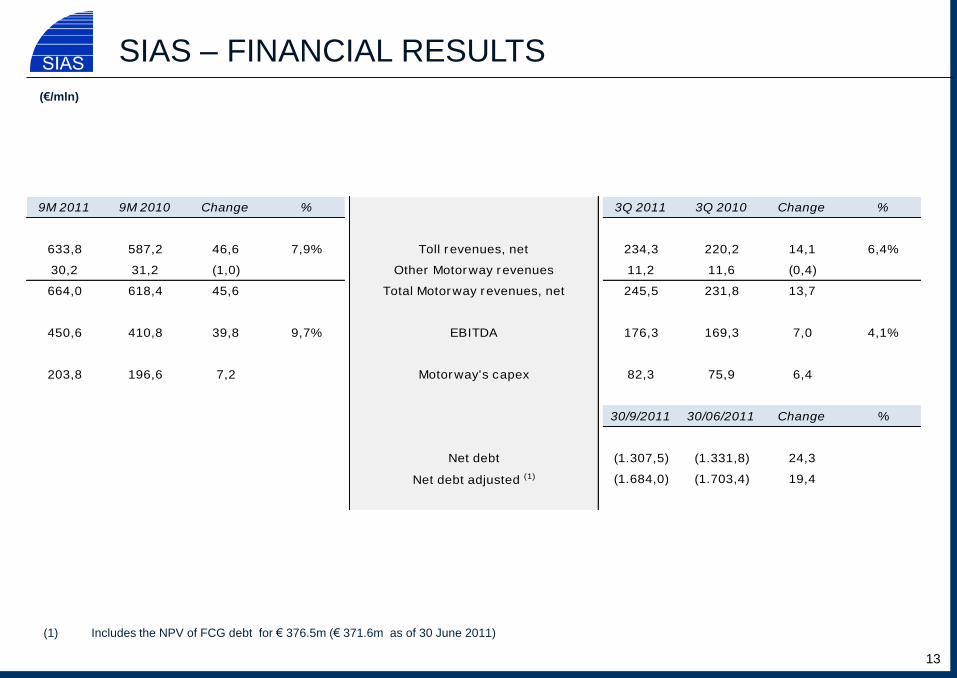
SIAS – FINANCIAL RESULTS
(1) Includes the NPV of FCG debt for € 376.5m (€ 371.6m as of 30 June 2011)
13
(€/mln)
9M 2011 9M 2010 Change % 3Q 2011 3Q 2010 Change %
633,8 587,2 46,6 7,9% 234,3 220,2 14,1 6,4%
30,2 31,2 (1,0) 11,2 11,6 (0,4)
664,0 618,4 45,6 245,5 231,8 13,7
450,6 410,8 39,8 9,7% 176,3 169,3 7,0 4,1%
203,8 196,6 7,2 82,3 75,9 6,4
30/9/2011 30/06/2011 Change %
(1.307,5) (1.331,8) 24,3
(1.684,0) (1.703,4) 19,4
Net debt
Net debt adjusted (1)
Toll r evenues, net
Other Motorway revenues
Total Motorway revenues, net
EBITDA
Motorway's capex
0
50
100
150
200
250
300
350
400
450
500
9M 2010 Tariff Traffic >Payroll costs >Other costs, net 9M 2011 >Personnel costs
0
50
100
150
200
250
300
350
400
450
500
9M 2010 Tariff Traffic >Payroll costs >Other costs, net 9M 2011
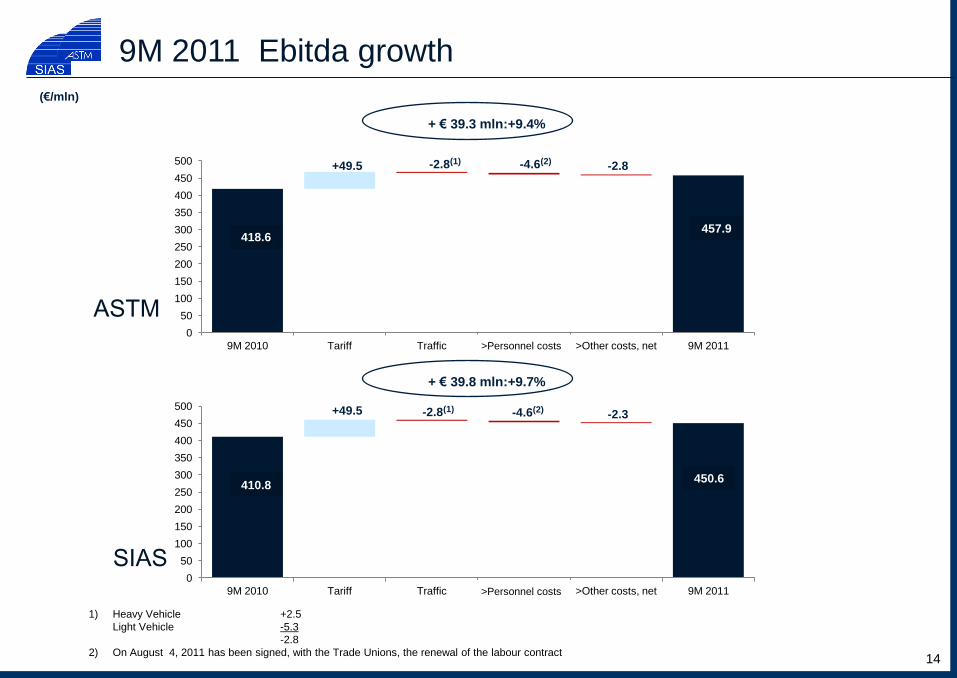
9M 2011 Ebitda growth
(€/mln)
14
ASTM
SIAS
+ € 39.3 mln:+9.4%
+ € 39.8 mln:+9.7%
1) Heavy Vehicle +2.5
Light Vehicle -5.3
-2.8
2) On August 4, 2011 has been signed, with the Trade Unions, the renewal of the labour contract
+49.5 -2.8(1) -2.8
457.9 418.6
-4.6(2)
410.8 450.6
+49.5 -2.8(1) -2.3 -4.6(2)
>Personnel costs
Agenda
15
1. KEY FACTS
2. GROUP STRUCTURE
3. FINANCIAL RESULTS
4. CONCESSION AGREEMENTS
5. GROUP FINANCIAL STRUCTURE
6. CHILEAN ASSETS
7. CLOSING REMARKS
APPENDIX
16
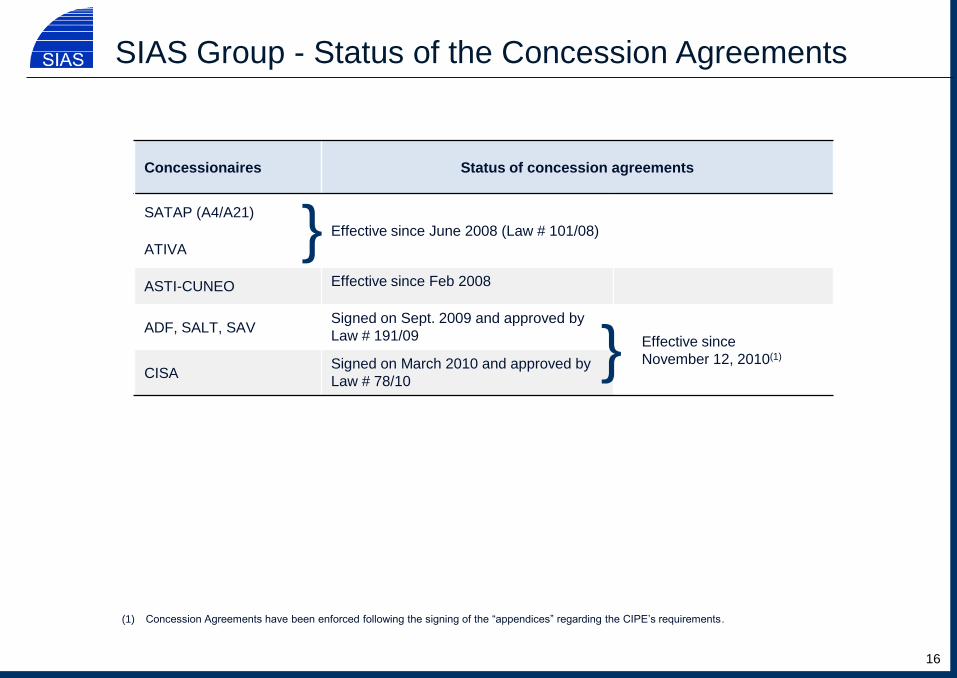
Concessionaires Status of concession agreements
SATAP (A4/A21)
Effective since June 2008 (Law # 101/08)
ATIVA
ASTI-CUNEO Effective since Feb 2008
ADF, SALT, SAV Signed on Sept. 2009 and approved by
Law # 191/09 Effective since
November 12, 2010(1) CISA
Signed on March 2010 and approved by
Law # 78/10 }
}
(1) Concession Agreements have been enforced following the signing of the “appendices” regarding the CIPE’s requirements.
SIAS Group - Status of the Concession Agreements
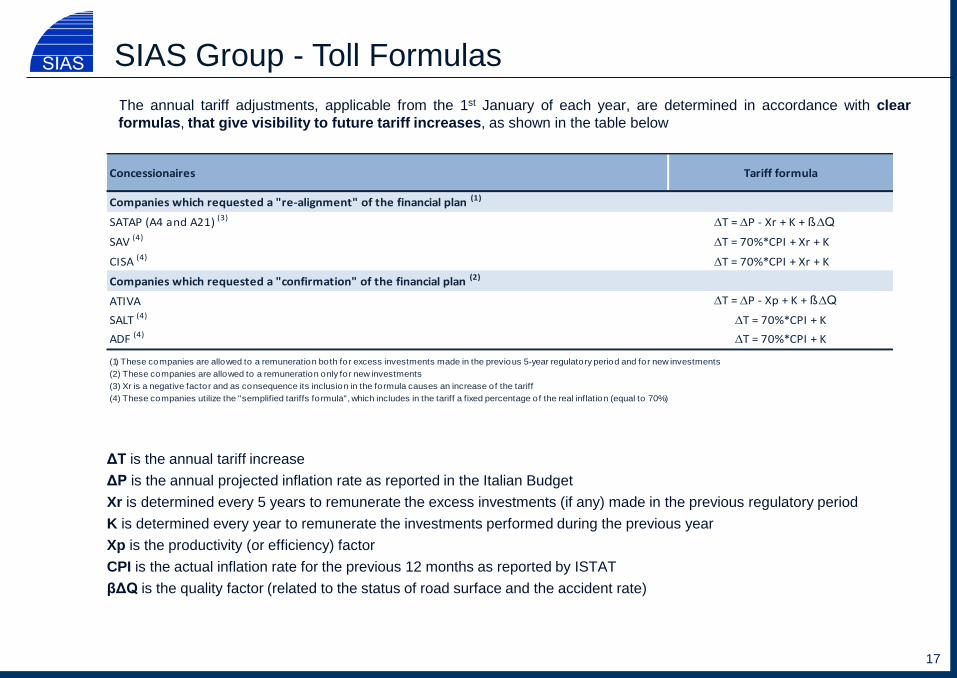
• The annual tariff adjustments, applicable from the 1st January of each year, are determined in accordance with clear
formulas, that give visibility to future tariff increases, as shown in the table below
ΔT is the annual tariff increase
ΔP is the annual projected inflation rate as reported in the Italian Budget
Xr is determined every 5 years to remunerate the excess investments (if any) made in the previous regulatory period
K is determined every year to remunerate the investments performed during the previous year
Xp is the productivity (or efficiency) factor
CPI is the actual inflation rate for the previous 12 months as reported by ISTAT
βΔQ is the quality factor (related to the status of road surface and the accident rate)
17
SIAS Group - Toll Formulas
Concessionaires Tariff formula
Companies which requested a "re-alignment" of the financial plan (1)
SATAP (A4 and A21) (3) ∆T = ∆P - Xr + K + ß∆Q
SAV (4) ∆T = 70%*CPI + Xr + K
CISA (4) ∆T = 70%*CPI + Xr + K
Companies which requested a "confirmation" of the financial plan (2)
ATIVA ∆T = ∆P - Xp + K + ß∆Q
SALT (4) ∆T = 70%*CPI + K
ADF (4) ∆T = 70%*CPI + K
(1) These companies are allowed to a remuneration both for excess investments made in the previous 5-year regulatory period and for new investments
(2) These companies are allowed to a remuneration only for new investments
(3) Xr is a negative factor and as consequence its inclusion in the formula causes an increase of the tariff
(4) These companies utilize the "semplified tariffs formula", which includes in the tariff a fixed percentage of the real inflation (equal to 70%)
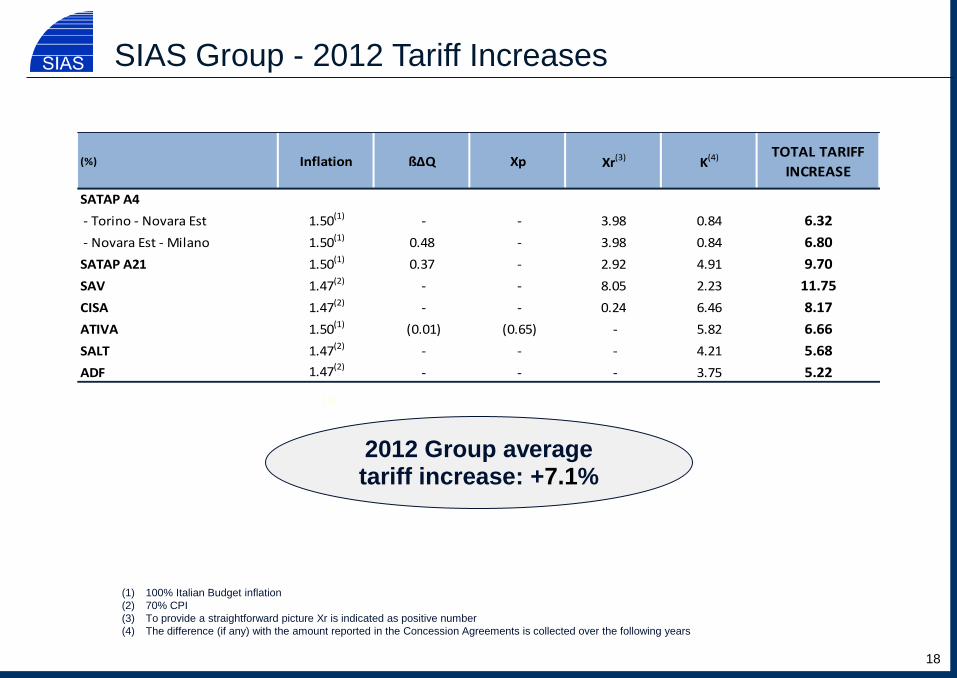
(1)
(1) 100% Italian Budget inflation
(2) 70% CPI
(3) To provide a straightforward picture Xr is indicated as positive number
(4) The difference (if any) with the amount reported in the Concession Agreements is collected over the following years
2012 Group average tariff increase: +7.1%
18
SIAS Group - 2012 Tariff Increases
(%) Inflation ß∆Q Xp Xr(3) K(4) TOTAL TARIFF
INCREASE
SATAP A4
- Torino - Novara Est 1.50(1) - - 3.98 0.84 6.32
- Novara Est - Milano 1.50(1) 0.48 - 3.98 0.84 6.80
SATAP A21 1.50(1) 0.37 - 2.92 4.91 9.70
SAV 1.47(2) - - 8.05 2.23 11.75
CISA 1.47(2) - - 0.24 6.46 8.17
ATIVA 1.50(1) (0.01) (0.65) - 5.82 6.66
SALT 1.47(2) - - - 4.21 5.68
ADF 1.47(2) - - - 3.75 5.22
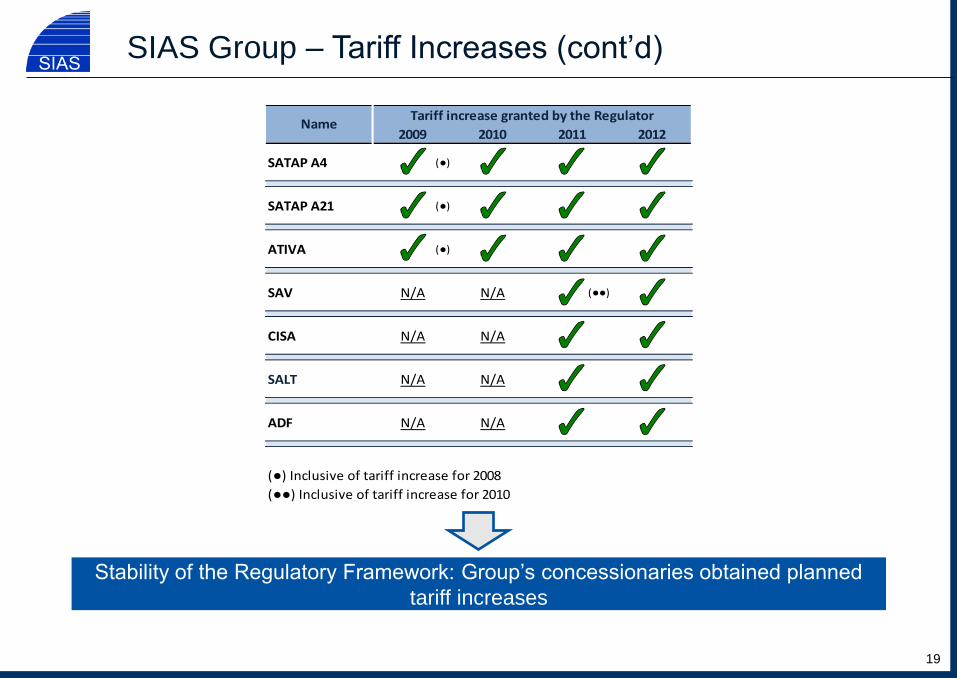
SIAS Group – Tariff Increases (cont’d)
Stability of the Regulatory Framework: Group’s concessionaries obtained planned
tariff increases
2009 2010 2011 2012
SATAP A4 (●)
SATAP A21 (●)
ATIVA (●)
SAV N/A N/A (●●)
CISA N/A N/A
SALT N/A N/A
ADF N/A N/A
(●) Inclusive of tariff increase for 2008
(●●) Inclusive of tariff increase for 2010
NameTariff increase granted by the Regulator
19
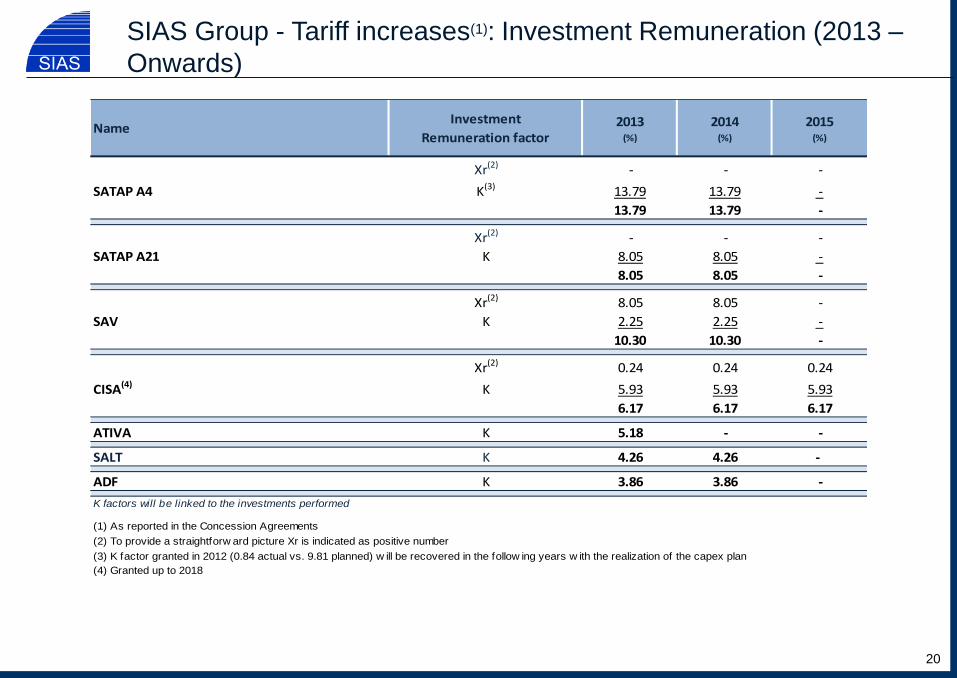
NameInvestment
Remuneration factor2013
(%)
2014 (%)
2015 (%)
Xr(2) - - -
SATAP A4 K(3) 13.79 13.79 -
13.79 13.79 -
Xr(2) - - -
SATAP A21 K 8.05 8.05 -
8.05 8.05 -
Xr(2) 8.05 8.05 -
SAV K 2.25 2.25 -
10.30 10.30 -
Xr(2) 0.24 0.24 0.24
CISA(4) K 5.93 5.93 5.93
6.17 6.17 6.17
ATIVA K 5.18 - -
SALT K 4.26 4.26 -
ADF K 3.86 3.86 -
K factors will be linked to the investments performed
(1) As reported in the Concession Agreements
(2) To provide a straightforw ard picture Xr is indicated as positive number
(3) K factor granted in 2012 (0.84 actual vs. 9.81 planned) w ill be recovered in the follow ing years w ith the realization of the capex plan
(4) Granted up to 2018
SIAS Group - Tariff increases(1): Investment Remuneration (2013 –
Onwards)
20
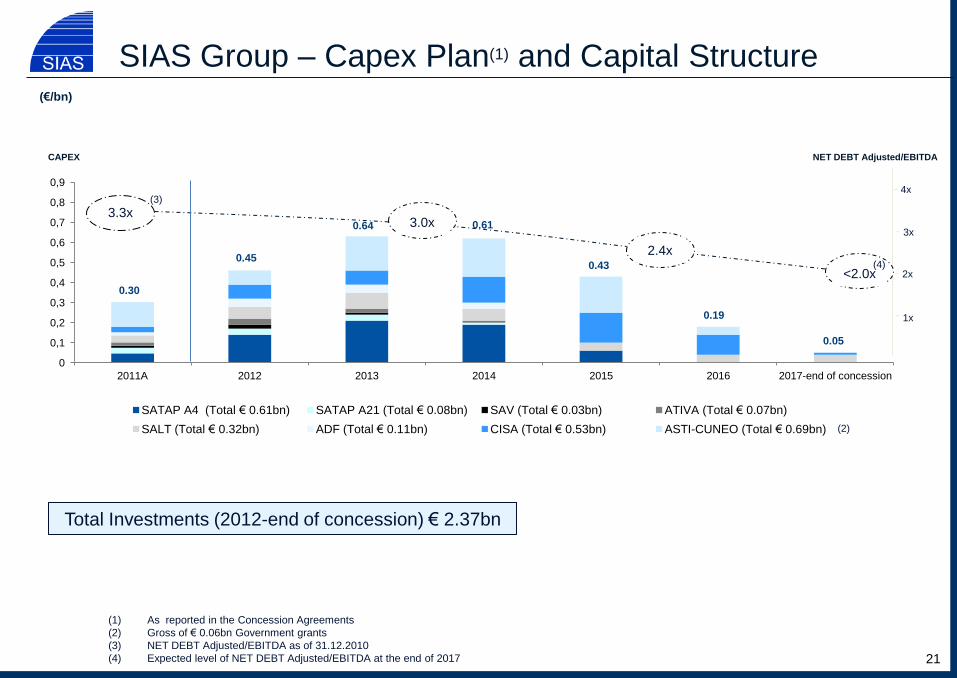
0
0,1
0,2
0,3
0,4
0,5
0,6
0,7
0,8
0,9
2011A 2012 2013 2014 2015 2016 2017-end of concession
SATAP A4 (Total € 0.61bn) SATAP A21 (Total € 0.08bn) SAV (Total € 0.03bn) ATIVA (Total € 0.07bn)
SALT (Total € 0.32bn) ADF (Total € 0.11bn) CISA (Total € 0.53bn) ASTI-CUNEO (Total € 0.69bn)
(1) As reported in the Concession Agreements
(2) Gross of € 0.06bn Government grants
(3) NET DEBT Adjusted/EBITDA as of 31.12.2010
(4) Expected level of NET DEBT Adjusted/EBITDA at the end of 2017
21
Total Investments (2012-end of concession) € 2.37bn
3.3x (3)
4x
CAPEX NET DEBT Adjusted/EBITDA
SIAS Group – Capex Plan(1) and Capital Structure
3x
2x
1x
0.45
0.64 0.61
0.43
(2)
0.19
0.05
<2.0x
2.4x (4)
(€/bn)
3.0x
0.30
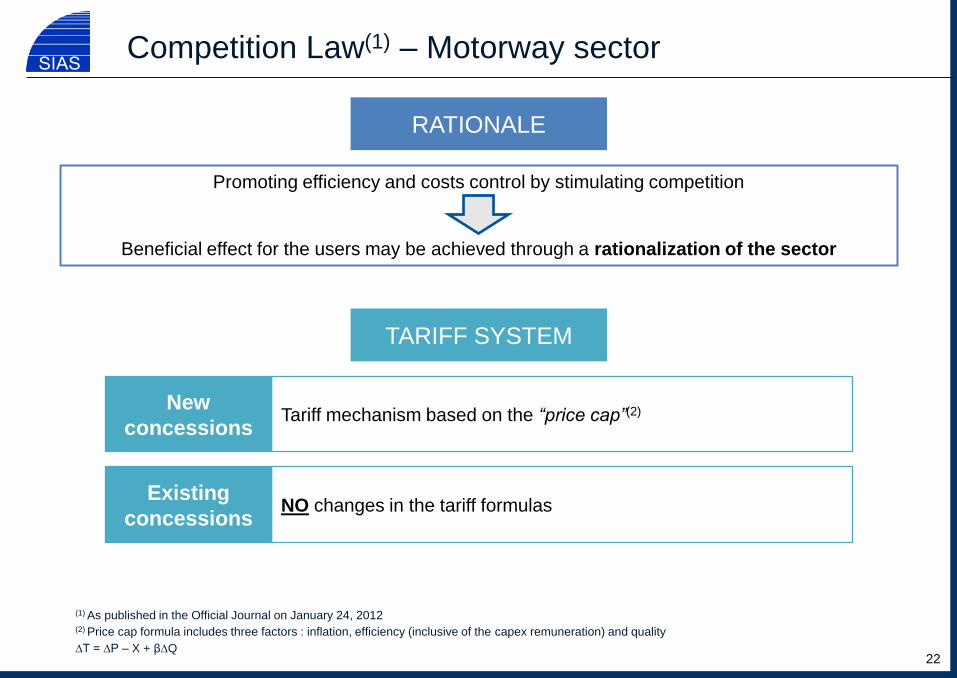
Competition Law(1) – Motorway sector
New
concessions Tariff mechanism based on the “price cap”(2)
Existing
concessions NO changes in the tariff formulas
22
TARIFF SYSTEM
RATIONALE
Promoting efficiency and costs control by stimulating competition
Beneficial effect for the users may be achieved through a rationalization of the sector
(1) As published in the Official Journal on January 24, 2012
(2) Price cap formula includes three factors : inflation, efficiency (inclusive of the capex remuneration) and quality
∆T = ∆P – X + β∆Q
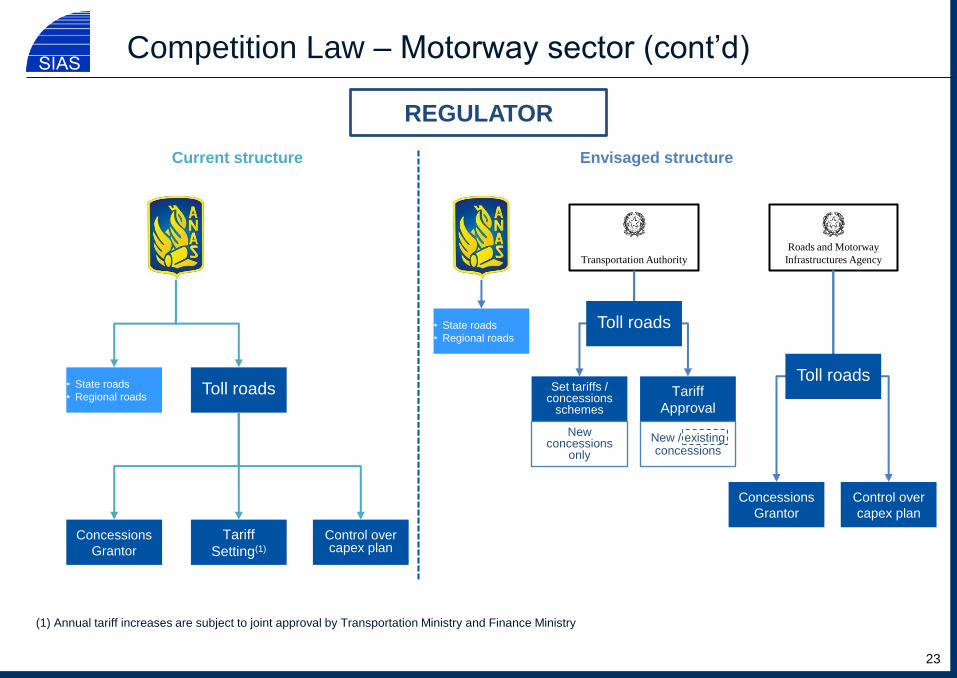
Competition Law – Motorway sector (cont’d)
Current structure Envisaged structure
Roads and Motorway
Infrastructures Agency Transportation Authority
(1) Annual tariff increases are subject to joint approval by Transportation Ministry and Finance Ministry
23
• State roads
• Regional roads Toll roads
Concessions
Grantor
Control over capex plan
Tariff
Setting(1)
• State roads
• Regional roads
Toll roads
REGULATOR
Set tariffs / concessions
schemes
Tariff
Approval
Control over
capex plan
Concessions
Grantor
Toll roads
New concessions
only
New / existing concessions
Agenda
24
1. KEY FACTS
2. GROUP STRUCTURE
3. FINANCIAL RESULTS
4. CONCESSION AGREEMENTS
5. GROUP FINANCIAL STRUCTURE
6. CHILEAN ASSETS
7. CLOSING REMARKS
APPENDIX
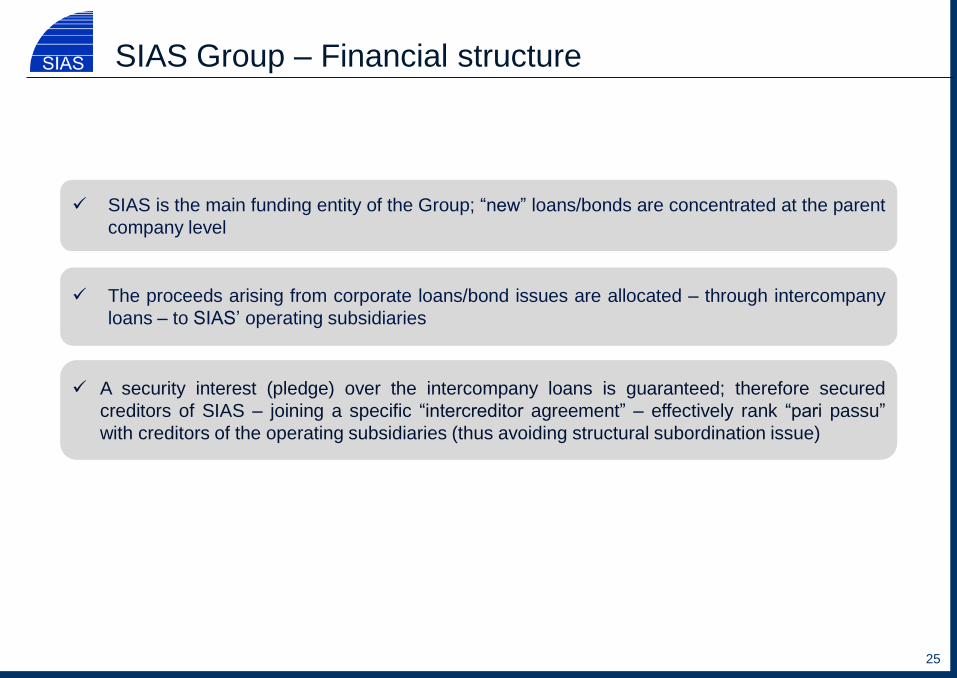
SIAS is the main funding entity of the Group; “new” loans/bonds are concentrated at the parent
company level
25
A security interest (pledge) over the intercompany loans is guaranteed; therefore secured
creditors of SIAS – joining a specific “intercreditor agreement” – effectively rank “pari passu”
with creditors of the operating subsidiaries (thus avoiding structural subordination issue)
SIAS Group – Financial structure
The proceeds arising from corporate loans/bond issues are allocated – through intercompany
loans – to SIAS’ operating subsidiaries
26
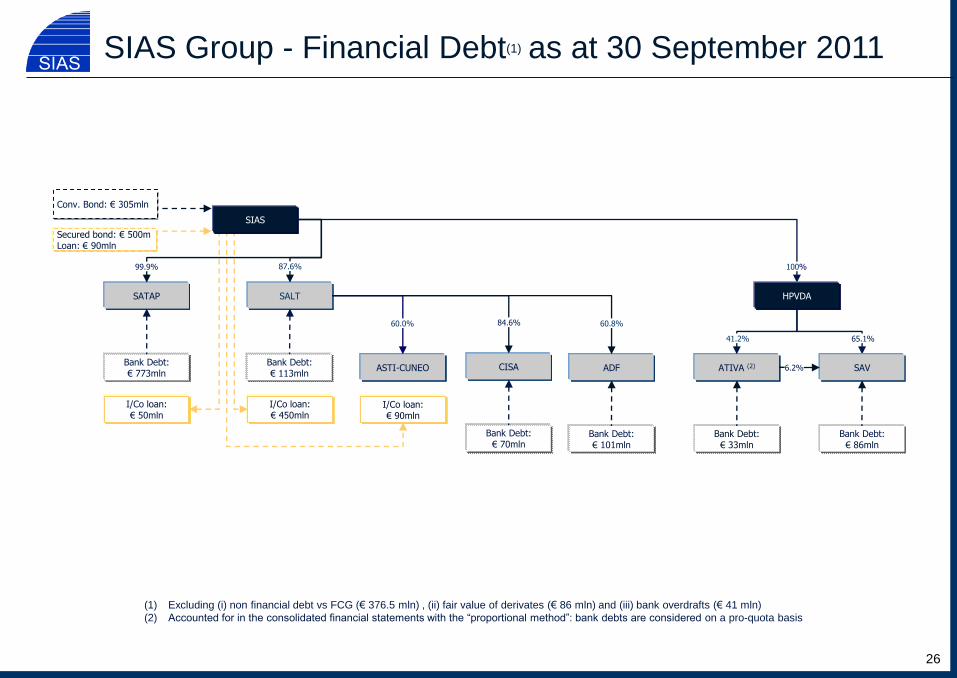
(1) Excluding (i) non financial debt vs FCG (€ 376.5 mln) , (ii) fair value of derivates (€ 86 mln) and (iii) bank overdrafts (€ 41 mln)
(2) Accounted for in the consolidated financial statements with the “proportional method”: bank debts are considered on a pro-quota basis
SIAS Group - Financial Debt(1) as at 30 September 2011
SATAP
CISA
SALT
ADF ASTI-CUNEO
60.8%
65.1%
60.0%
SAV ATIVA (2) 6.2%
HPVDA
41.2%
100%
Conv. Bond: € 305mln
Bank Debt: € 773mln
Bank Debt: € 70mln
Bank Debt: € 113mln
Bank Debt: € 86mln
Bank Debt: € 33mln
Bank Debt: € 101mln
I/Co loan: € 50mln
I/Co loan: € 450mln
I/Co loan: € 90mln
Secured bond: € 500m Loan: € 90mln
SIAS
84.6%
87.6% 99.9%
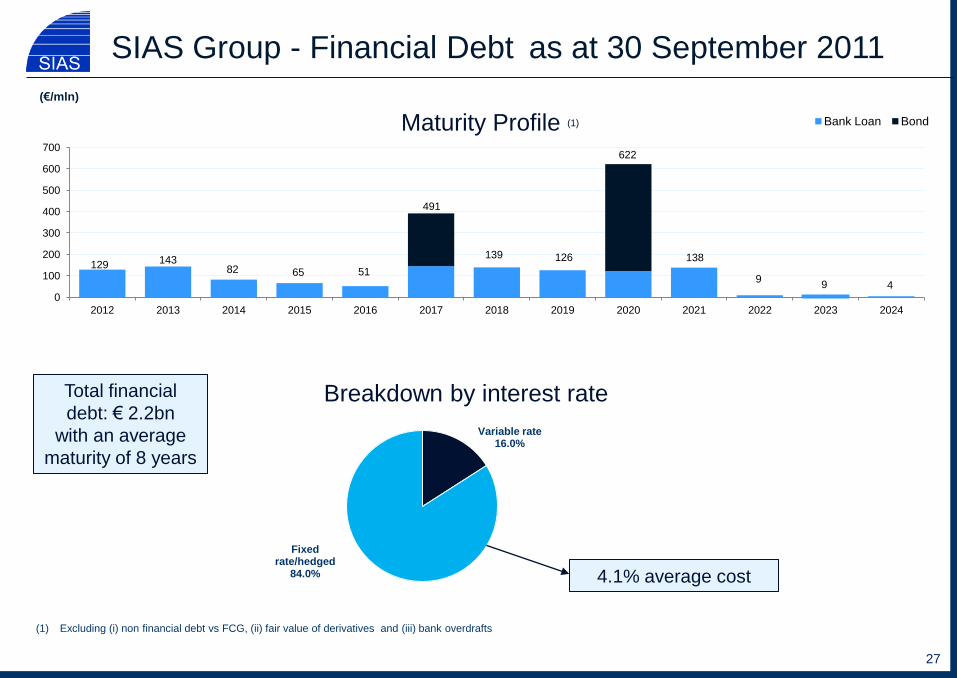
Breakdown by interest rate
4.1% average cost
Variable rate 16.0%
Fixed rate/hedged
84.0%
Maturity Profile (1)
27
(1) Excluding (i) non financial debt vs FCG, (ii) fair value of derivatives and (iii) bank overdrafts
Total financial
debt: € 2.2bn
with an average
maturity of 8 years
SIAS Group - Financial Debt as at 30 September 2011
129 143 82 65 51
491
126 138
622
9 9 4
0
100
200
300
400
500
600
700
2012 2013 2014 2015 2016 2017 2018 2019 2020 2021 2022 2023 2024
Bank Loan Bond
139
(€/mln)
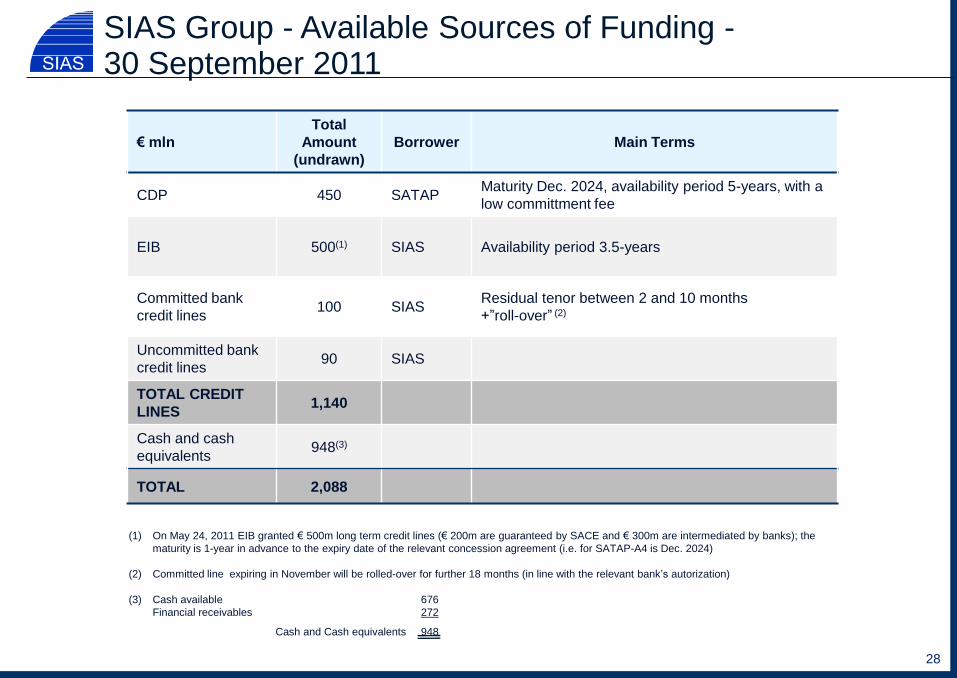
€ mln
Total
Amount
(undrawn)
Borrower Main Terms
CDP 450 SATAP Maturity Dec. 2024, availability period 5-years, with a
low committment fee
EIB 500(1) SIAS Availability period 3.5-years
Committed bank
credit lines 100 SIAS
Residual tenor between 2 and 10 months
+”roll-over” (2)
Uncommitted bank
credit lines 90 SIAS
TOTAL CREDIT
LINES 1,140
Cash and cash
equivalents 948(3)
TOTAL 2,088
28
SIAS Group - Available Sources of Funding - 30 September 2011
(1) On May 24, 2011 EIB granted € 500m long term credit lines (€ 200m are guaranteed by SACE and € 300m are intermediated by banks); the
maturity is 1-year in advance to the expiry date of the relevant concession agreement (i.e. for SATAP-A4 is Dec. 2024)
(2) Committed line expiring in November will be rolled-over for further 18 months (in line with the relevant bank’s autorization)
(3) Cash available as at 30/6/2011 676
Financial receivables as at 30/6/2011 272
Cash and Cash equivalents 948
Agenda
29
1. KEY FACTS
2. GROUP STRUCTURE
3. FINANCIAL RESULTS
4. CONCESSION AGREEMENTS
5. GROUP FINANCIAL STRUCTURE
6. CHILEAN ASSETS
7. CLOSING REMARKS
APPENDIX
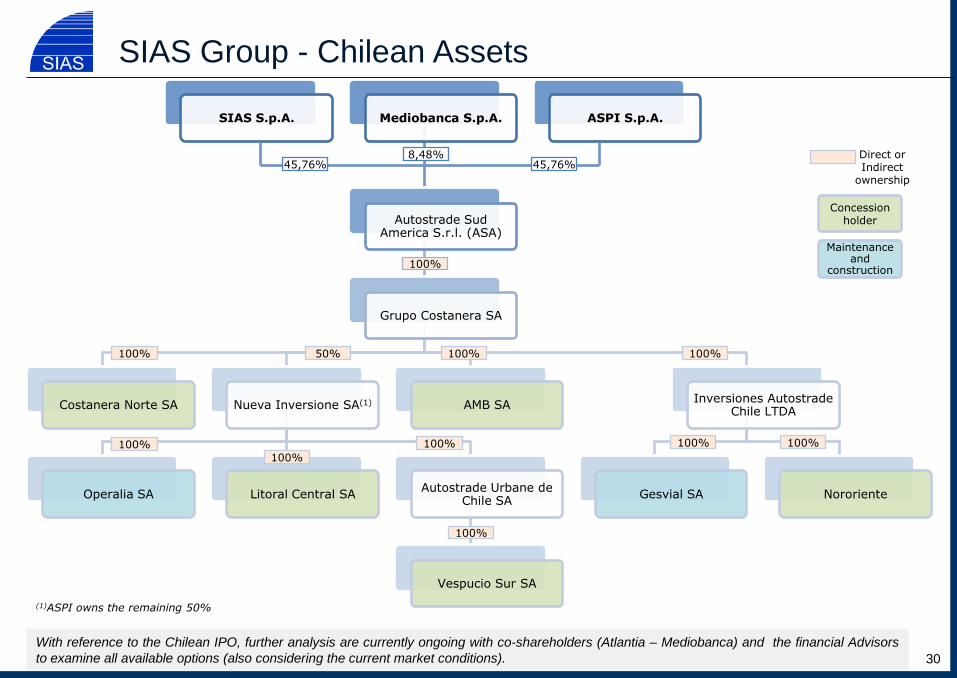
SIAS S.p.A. Mediobanca S.p.A.
Autostrade Sud America S.r.l. (ASA)
Grupo Costanera SA
Costanera Norte SA Nueva Inversione SA(1)
Operalia SA Litoral Central SA Autostrade Urbane de
Chile SA
Vespucio Sur SA
AMB SA Inversiones Autostrade
Chile LTDA
Gesvial SA Nororiente
ASPI S.p.A.
SIAS Group - Chilean Assets
With reference to the Chilean IPO, further analysis are currently ongoing with co-shareholders (Atlantia – Mediobanca) and the financial Advisors
to examine all available options (also considering the current market conditions).
45,76% 45,76% 8,48%
100%
100% 50% 100% 100%
100%
100%
100%
100%
100% 100%
Concession holder
Maintenance and
construction
Direct or Indirect
ownership
(1)ASPI owns the remaining 50%
30
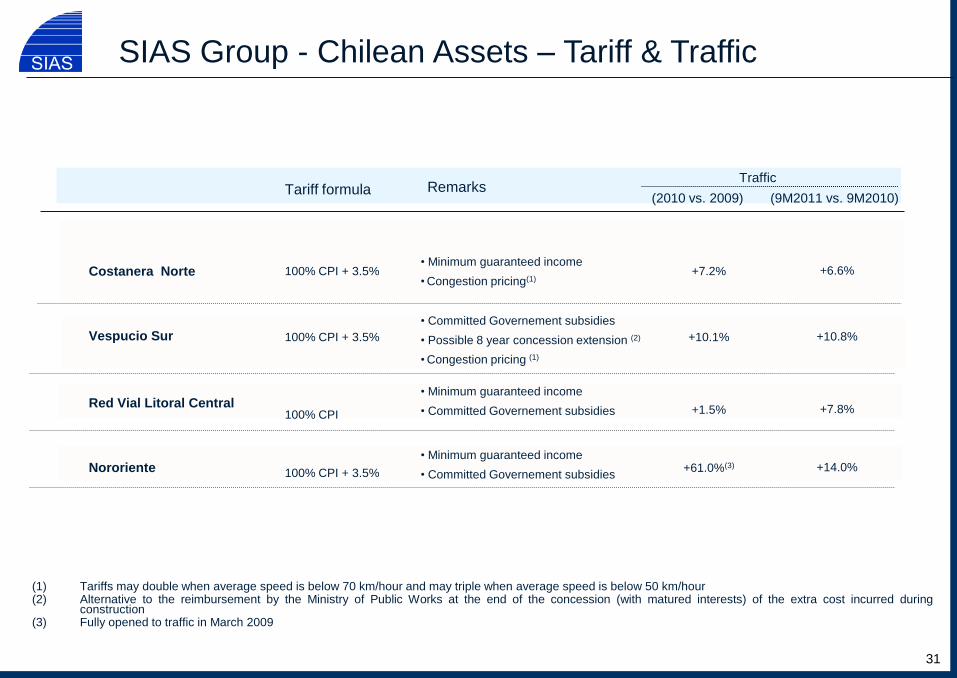
Costanera Norte
Vespucio Sur
Red Vial Litoral Central
Nororiente
• Minimum guaranteed income
• Committed Governement subsidies
Remarks
100% CPI + 3.5%
100% CPI + 3.5%
100% CPI
100% CPI + 3.5%
• Committed Governement subsidies
• Possible 8 year concession extension (2)
• Congestion pricing (1)
• Minimum guaranteed income
• Committed Governement subsidies
Tariff formula
SIAS Group - Chilean Assets – Tariff & Traffic
(1) Tariffs may double when average speed is below 70 km/hour and may triple when average speed is below 50 km/hour (2) Alternative to the reimbursement by the Ministry of Public Works at the end of the concession (with matured interests) of the extra cost incurred during
construction (3) Fully opened to traffic in March 2009
• Minimum guaranteed income
• Congestion pricing(1)
31
+7.2%
+10.1%
+1.5%
+61.0%(3)
(2010 vs. 2009) (9M2011 vs. 9M2010)
+6.6%
+10.8%
+7.8%
+14.0%
Traffic
32
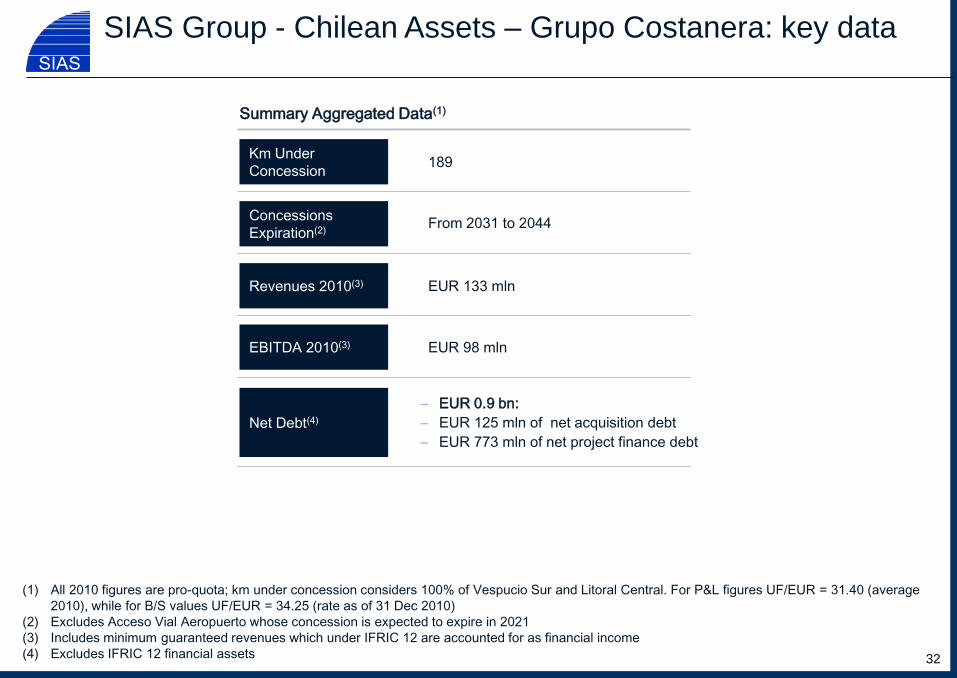
Km Under
Concession
Summary Aggregated Data(1)
189
Revenues 2010(3) EUR 133 mln
EBITDA 2010(3) EUR 98 mln
Net Debt(4)
– EUR 0.9 bn:
– EUR 125 mln of net acquisition debt
– EUR 773 mln of net project finance debt
Concessions
Expiration(2) From 2031 to 2044
(1) All 2010 figures are pro-quota; km under concession considers 100% of Vespucio Sur and Litoral Central. For P&L figures UF/EUR = 31.40 (average
2010), while for B/S values UF/EUR = 34.25 (rate as of 31 Dec 2010)
(2) Excludes Acceso Vial Aeropuerto whose concession is expected to expire in 2021
(3) Includes minimum guaranteed revenues which under IFRIC 12 are accounted for as financial income
(4) Excludes IFRIC 12 financial assets
SIAS Group - Chilean Assets – Grupo Costanera: key data

Agenda
33
1. KEY FACTS
2. GROUP STRUCTURE
3. FINANCIAL RESULTS
4. CONCESSION AGREEMENTS
5. GROUP FINANCIAL STRUCTURE
6. CHILEAN ASSETS
7. CLOSING REMARKS
APPENDIX
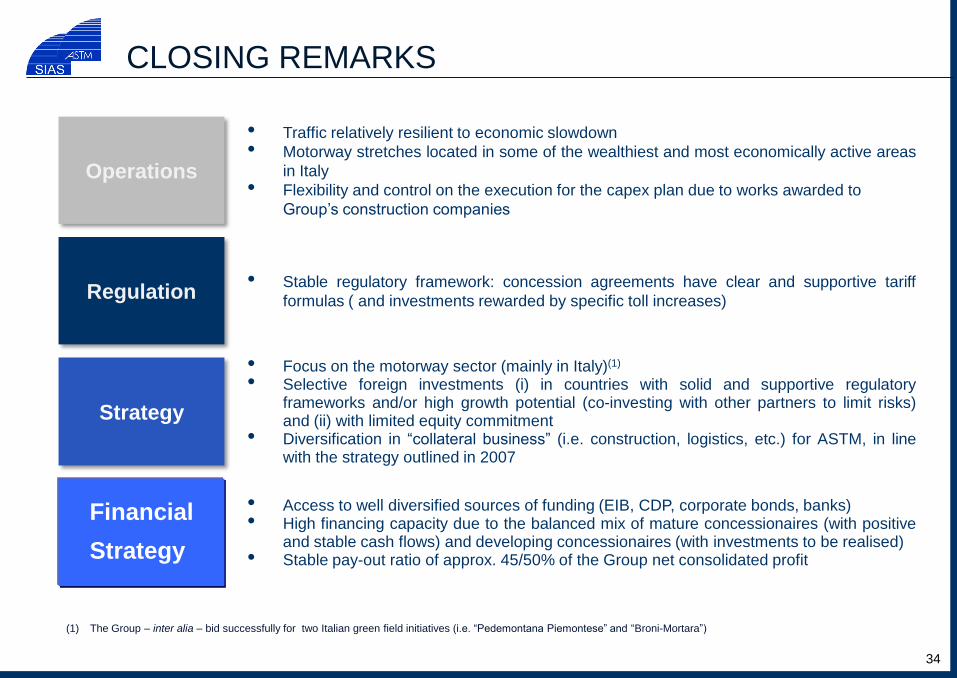
Operations
Regulation
• Traffic relatively resilient to economic slowdown
• Motorway stretches located in some of the wealthiest and most economically active areas
in Italy
• Flexibility and control on the execution for the capex plan due to works awarded to
Group’s construction companies
Financial
Strategy
• Focus on the motorway sector (mainly in Italy)(1) • Selective foreign investments (i) in countries with solid and supportive regulatory
frameworks and/or high growth potential (co-investing with other partners to limit risks) and (ii) with limited equity commitment
• Diversification in “collateral business” (i.e. construction, logistics, etc.) for ASTM, in line with the strategy outlined in 2007
Strategy
• Access to well diversified sources of funding (EIB, CDP, corporate bonds, banks) • High financing capacity due to the balanced mix of mature concessionaires (with positive
and stable cash flows) and developing concessionaires (with investments to be realised) • Stable pay-out ratio of approx. 45/50% of the Group net consolidated profit
CLOSING REMARKS
34
(1) The Group – inter alia – bid successfully for two Italian green field initiatives (i.e. “Pedemontana Piemontese” and “Broni-Mortara”)
• Stable regulatory framework: concession agreements have clear and supportive tariff
formulas ( and investments rewarded by specific toll increases)
APPENDIX
35
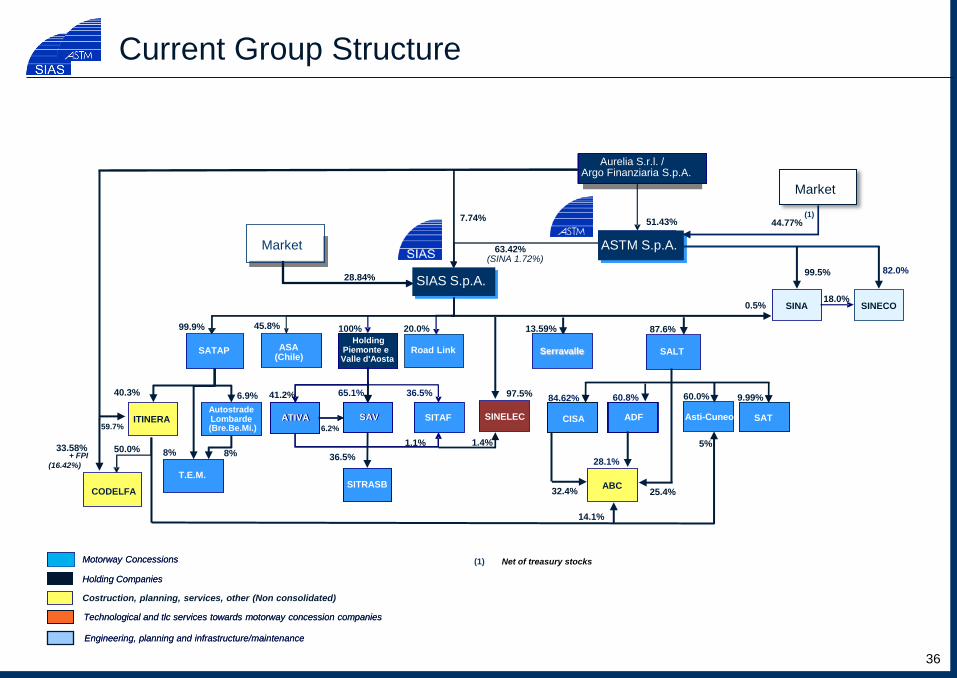
Current Group Structure
Motorway Concessions
Technological and tlc services towards motorway concession companies
Holding Companies
Engineering, planning and infrastructure/maintenance
Costruction, planning, services, other (Non consolidated)
Motorway Concessions
Technological and tlc services towards motorway concession companies
Holding Companies
Engineering, planning and infrastructure/maintenance
(1) Net of treasury stocks
36
ASTM S.p.A.
Aurelia S.r.l. / Argo Finanziaria S.p.A.
51.43%
SIAS S.p.A.
SAV ATIVA
65.1% 41.2%
ITINERA
Holding Piemonte e Valle d'Aosta
20.0%
SITRASB
36.5%
84.62%
87.6%
60.8%
SITAF
36.5%
6.2%
1.1%
100%
(Chile)
45.8%
Market ASTM S.p.A.
SIAS S.p.A.
63.42% (SINA 1.72%)
SATAP
SAV ATIVA
Road Link
SINECO SINA
82.0% 99.5%
SITRASB
SALT
ADF
97.5%
50.0%
SITAF 59.7%
0.5%
CODELFA
18.0%
7.74%
ASA
28.84%
1.4%
Market
Asti-Cuneo
60.0%
SINELEC
33.58%
(16.42%)
+ FPI
ABC
14.1%
32.4% 25.4%
28.1%
Serravalle
13.59%
Market
44.77% (1)
SABROM
99.9%
40.3%
SAT
9.99%
5%
6.9%
8%
T.E.M.
8%
Autostrade Lombarde (Bre.Be.Mi.)
CISA
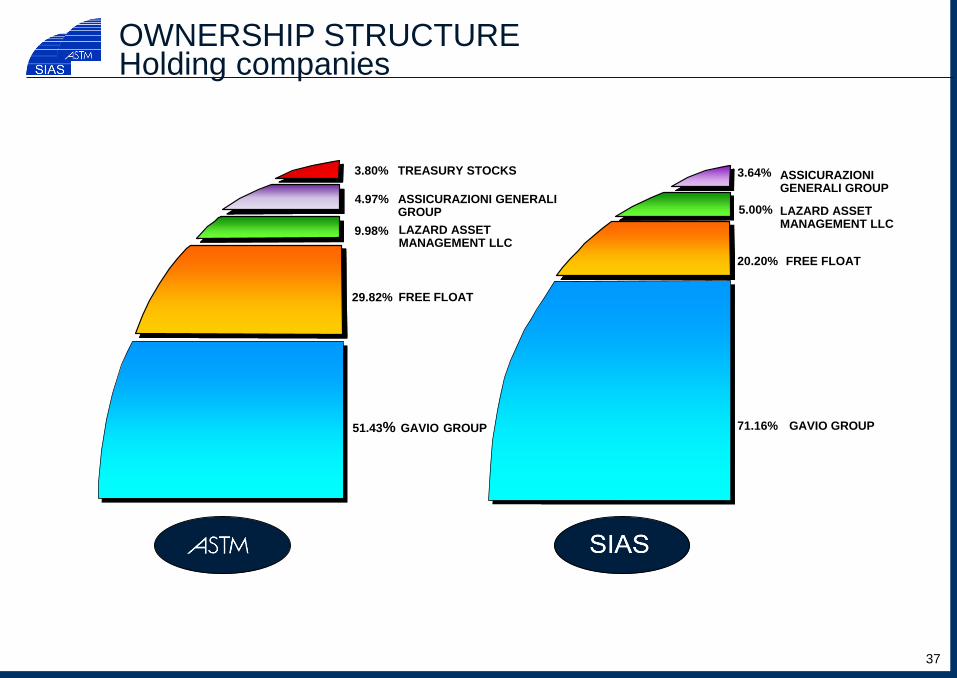
OWNERSHIP STRUCTURE Holding companies
TREASURY STOCKS
ASSICURAZIONI GENERALI GROUP
FREE FLOAT
GAVIO GROUP 51.43%
29.82%
9.98%
3.80%
4.97%
LAZARD ASSET MANAGEMENT LLC
ASSICURAZIONI GENERALI GROUP
5.00%
FREE FLOAT 20.20%
GAVIO GROUP 71.16%
3.64%
LAZARD ASSET MANAGEMENT LLC
37
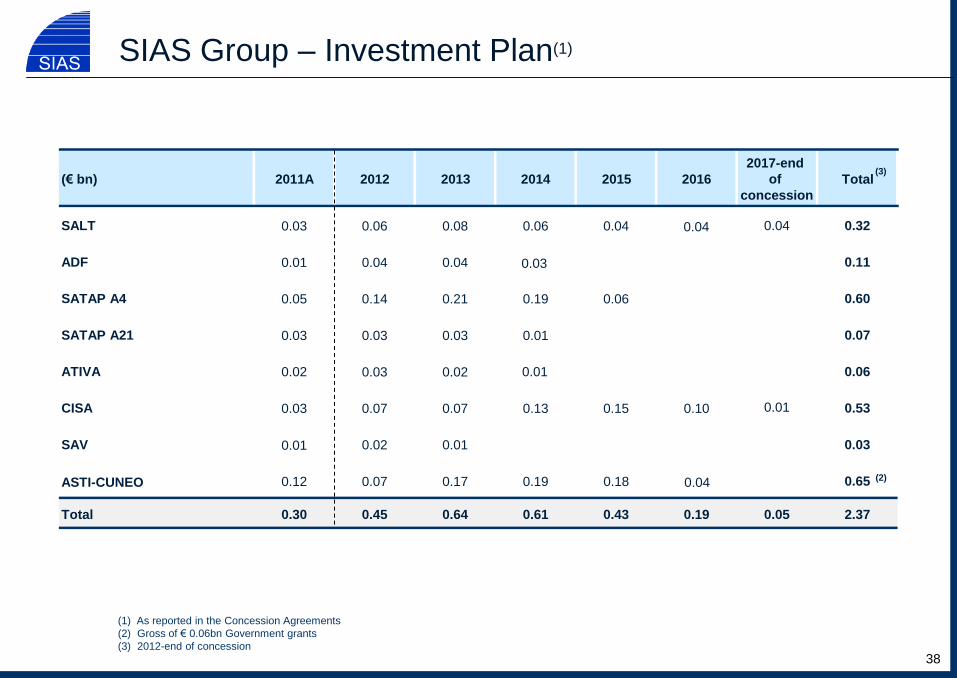
(1) As reported in the Concession Agreements
(2) Gross of € 0.06bn Government grants
(3) 2012-end of concession
SIAS Group – Investment Plan(1)
38
(€ bn) 2011A 2012 2013 2014 2015 2016
2017-end
of
concession
Total
SALT 0.03 0.06 0.08 0.06 0.04 0.32
ADF 0.01 0.04 0.04 0.11
SATAP A4 0.05 0.14 0.21 0.19 0.06 0.60
SATAP A21 0.03 0.03 0.03 0.01 0.07
ATIVA 0.03 0.02 0.06
CISA 0.03 0.07 0.07 0.13 0.15 0.10 0.01 0.53
SAV 0.02 0.01 0.03
ASTI-CUNEO (2) 0.12 0.07 0.17 0.19 0.65
Total 0.30 0.45 0.64 0.61 0.43 0.19 0.05 2.37
0.18
0.03
0.04
0.01
0.04
0.04
0.02
0.01
(3)
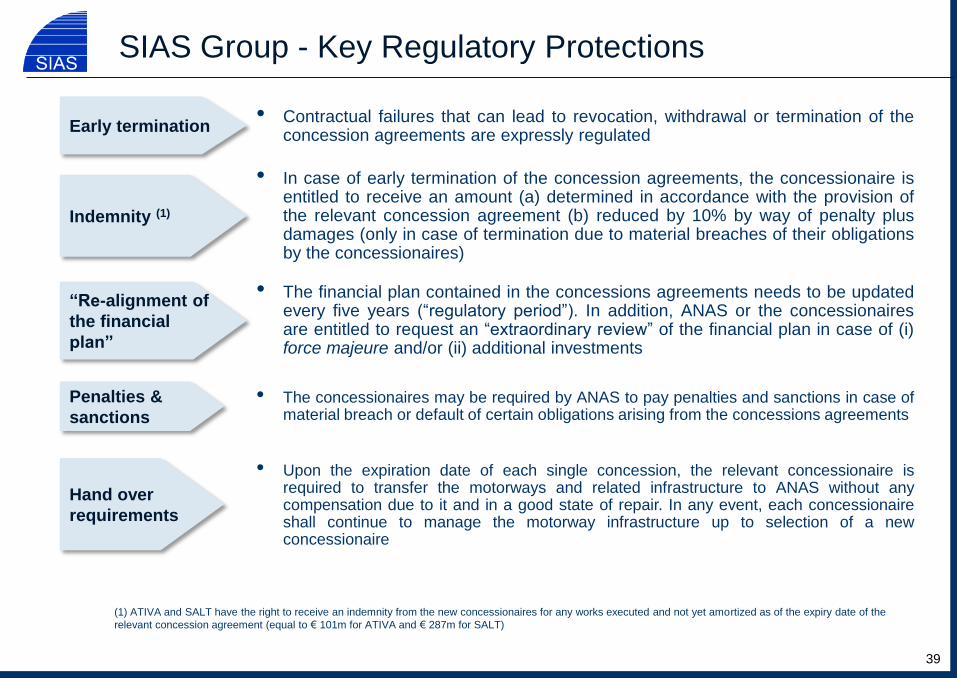
Early termination
Indemnity (1)
• In case of early termination of the concession agreements, the concessionaire is entitled to receive an amount (a) determined in accordance with the provision of the relevant concession agreement (b) reduced by 10% by way of penalty plus damages (only in case of termination due to material breaches of their obligations by the concessionaires)
• Contractual failures that can lead to revocation, withdrawal or termination of the concession agreements are expressly regulated
“Re-alignment of
the financial
plan”
SIAS Group - Key Regulatory Protections
• The financial plan contained in the concessions agreements needs to be updated every five years (“regulatory period”). In addition, ANAS or the concessionaires are entitled to request an “extraordinary review” of the financial plan in case of (i) force majeure and/or (ii) additional investments
39
(1) ATIVA and SALT have the right to receive an indemnity from the new concessionaires for any works executed and not yet amortized as of the expiry date of the
relevant concession agreement (equal to € 101m for ATIVA and € 287m for SALT)
Penalties &
sanctions
Hand over
requirements
• The concessionaires may be required by ANAS to pay penalties and sanctions in case of material breach or default of certain obligations arising from the concessions agreements
• Upon the expiration date of each single concession, the relevant concessionaire is required to transfer the motorways and related infrastructure to ANAS without any compensation due to it and in a good state of repair. In any event, each concessionaire shall continue to manage the motorway infrastructure up to selection of a new concessionaire
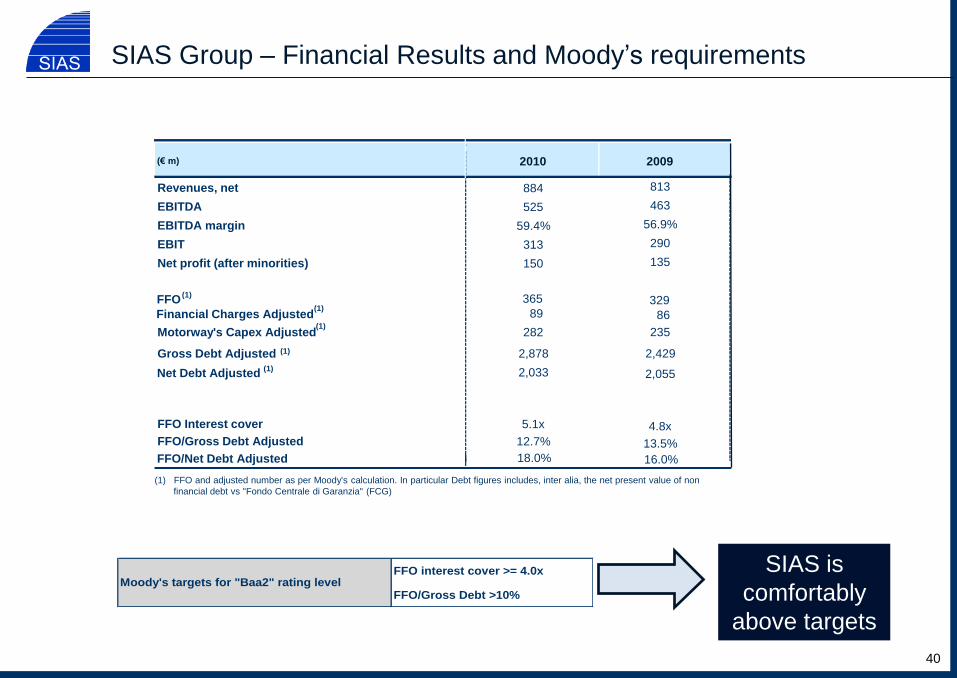
SIAS Group – Financial Results and Moody’s requirements
SIAS is
comfortably
above targets
FFO interest cover >= 4.0x
FFO/Gross Debt >10%Moody's targets for "Baa2" rating level
(€ m) 2010 2009
Revenues, net 884
EBITDA 525
EBITDA margin 59.4%
EBIT 313
Net profit (after minorities) 150
Financial Charges Adjusted 89
Motorway's Capex Adjusted (1)
282
Gross Debt Adjusted (1) 2,878
FFO Interest cover 5.1x
FFO/Gross Debt Adjusted 12.7%
(1) FFO and adjusted number as per Moody's calculation. In particular Debt figures includes, inter alia, the net present value of non
financial debt vs "Fondo Centrale di Garanzia" (FCG)
813
463
56.9%
290
135
86
235
2,429
4.8x
13.5%
FFO (1) 365 329
Net Debt Adjusted (1) 2,033 2,055
FFO/Net Debt Adjusted 18.0% 16.0%
(1)
40
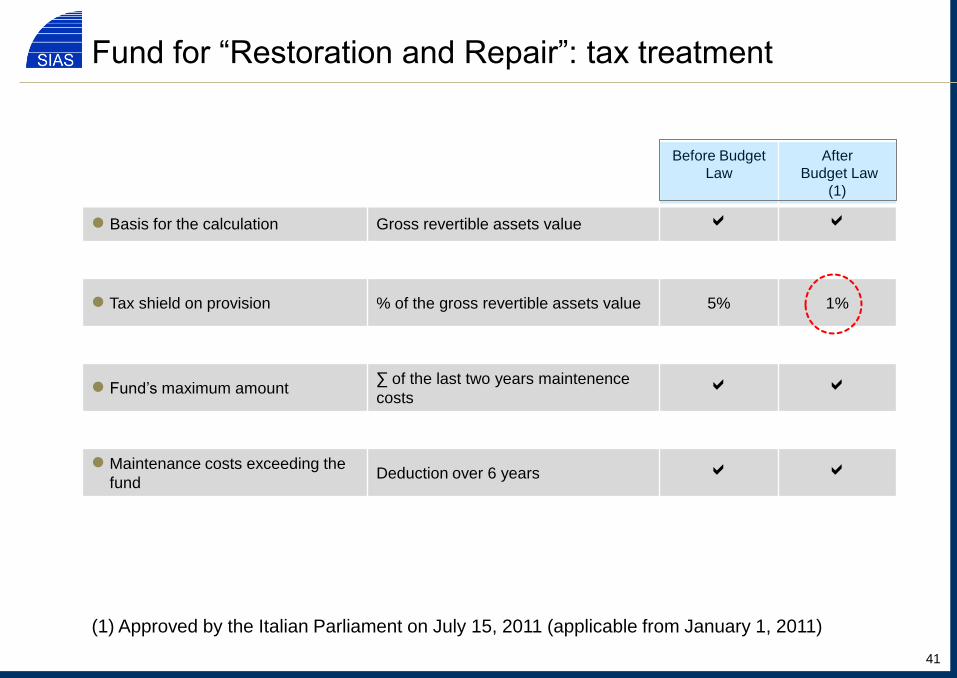
Before Budget
Law
After
Budget Law
(1)
● Basis for the calculation Gross revertible assets value
● Tax shield on provision % of the gross revertible assets value 5% 1%
● Fund’s maximum amount ∑ of the last two years maintenence
costs
● Maintenance costs exceeding the
fund Deduction over 6 years
(1) Approved by the Italian Parliament on July 15, 2011 (applicable from January 1, 2011)
Fund for “Restoration and Repair”: tax treatment
41
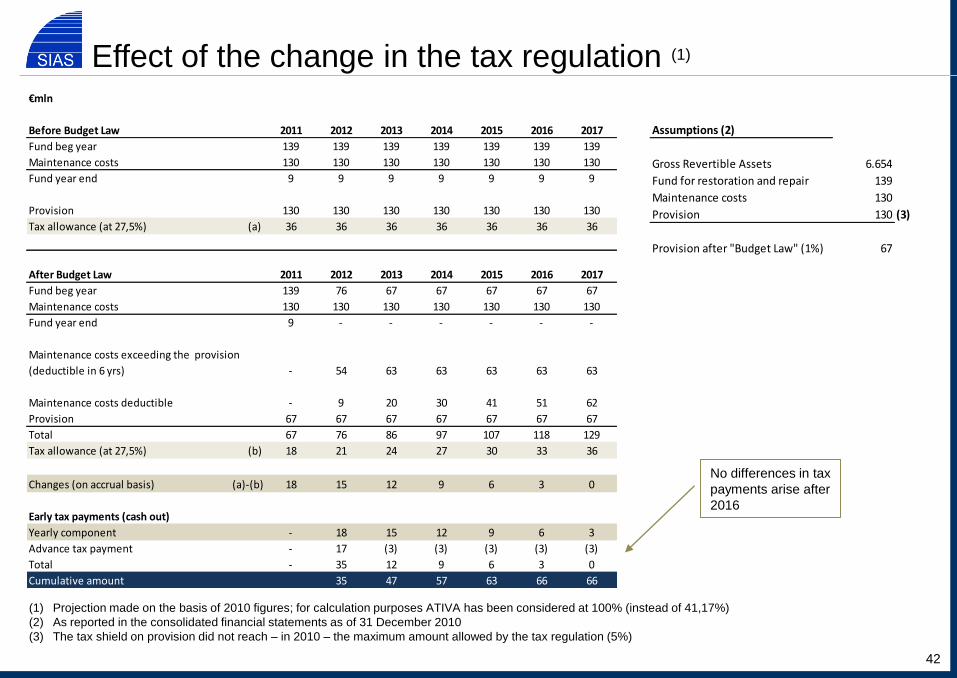
No differences in tax
payments arise after
2016
(1) Projection made on the basis of 2010 figures; for calculation purposes ATIVA has been considered at 100% (instead of 41,17%)
(2) As reported in the consolidated financial statements as of 31 December 2010
(3) The tax shield on provision did not reach – in 2010 – the maximum amount allowed by the tax regulation (5%)
Assumptions (2)
Gross Revertible Assets 6.654
Fund for restoration and repair 139
Maintenance costs 130
Provision 130 (3)
Provision after "Budget Law" (1%) 67
€mln
Before Budget Law 2011 2012 2013 2014 2015 2016 2017
Fund beg year 139 139 139 139 139 139 139
Maintenance costs 130 130 130 130 130 130 130
Fund year end 9 9 9 9 9 9 9
Provision 130 130 130 130 130 130 130
Tax allowance (at 27,5%) (a) 36 36 36 36 36 36 36
After Budget Law 2011 2012 2013 2014 2015 2016 2017
Fund beg year 139 76 67 67 67 67 67
Maintenance costs 130 130 130 130 130 130 130
Fund year end 9 - - - - - -
Maintenance costs exceeding the provision
(deductible in 6 yrs) - 54 63 63 63 63 63
Maintenance costs deductible - 9 20 30 41 51 62
Provision 67 67 67 67 67 67 67
Total 67 76 86 97 107 118 129
Tax allowance (at 27,5%) (b) 18 21 24 27 30 33 36
Changes (on accrual basis) (a)-(b) 18 15 12 9 6 3 0
Early tax payments (cash out)
Yearly component - 18 15 12 9 6 3
Advance tax payment - 17 (3) (3) (3) (3) (3)
Total - 35 12 9 6 3 0
Cumulative amount 35 47 57 63 66 66
Effect of the change in the tax regulation (1)
42
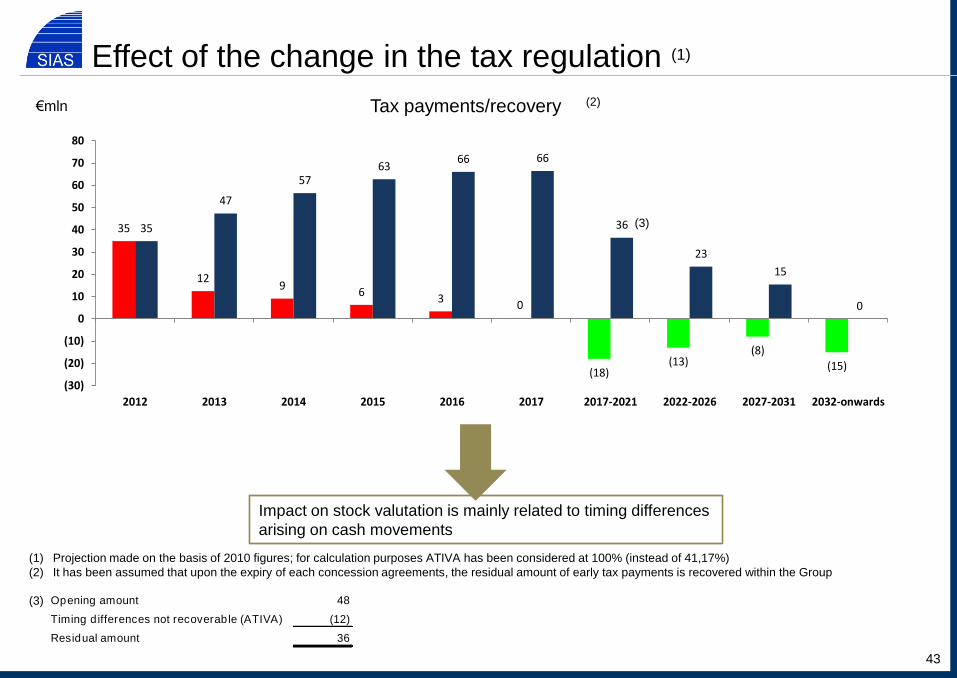
Effect of the change in the tax regulation (1)
€mln Tax payments/recovery
(1) Projection made on the basis of 2010 figures; for calculation purposes ATIVA has been considered at 100% (instead of 41,17%)
(2) It has been assumed that upon the expiry of each concession agreements, the residual amount of early tax payments is recovered within the Group
Impact on stock valutation is mainly related to timing differences
arising on cash movements
35
129
63
0
(18)(13)
(8)(15)
35
47
5763
66 66
36
23
15
0
(30)
(20)
(10)
0
10
20
30
40
50
60
70
80
2012 2013 2014 2015 2016 2017 2017-2021 2022-2026 2027-2031 2032-onwards
(3)
(3) Opening amount 48
Timing d ifferences not recoverable (ATIVA) (12)
Residual amount 36
(2)
43
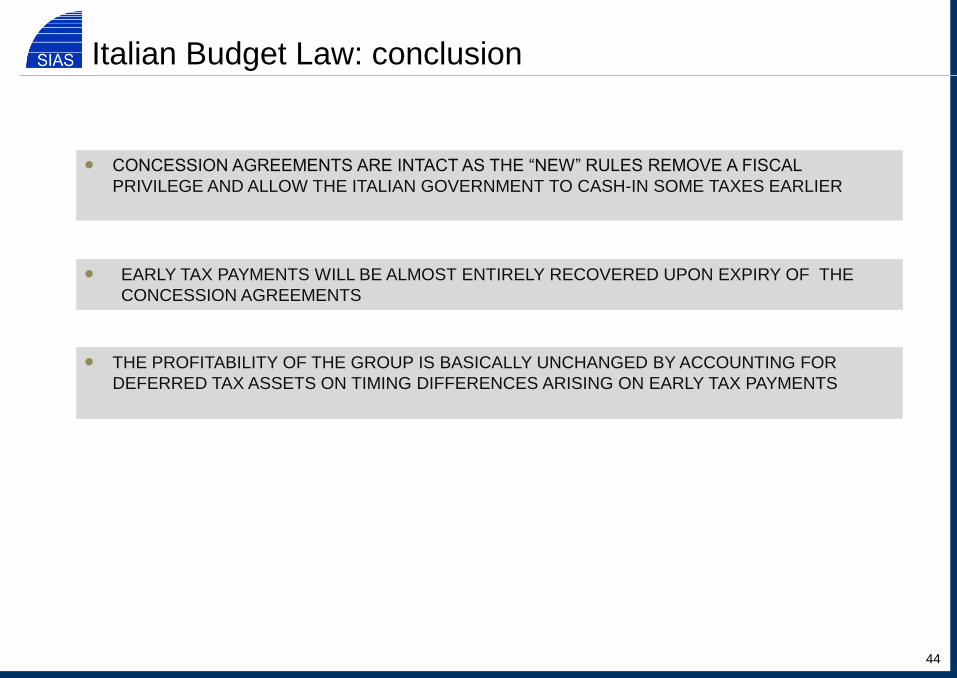
Italian Budget Law: conclusion
● CONCESSION AGREEMENTS ARE INTACT AS THE “NEW” RULES REMOVE A FISCAL
PRIVILEGE AND ALLOW THE ITALIAN GOVERNMENT TO CASH-IN SOME TAXES EARLIER
● EARLY TAX PAYMENTS WILL BE ALMOST ENTIRELY RECOVERED UPON EXPIRY OF THE
CONCESSION AGREEMENTS
● THE PROFITABILITY OF THE GROUP IS BASICALLY UNCHANGED BY ACCOUNTING FOR
DEFERRED TAX ASSETS ON TIMING DIFFERENCES ARISING ON EARLY TAX PAYMENTS
44
Disclaimer
THIS DOCUMENT HAS BEEN PREPARED BY ASTM S.P.A. AND SIAS S.P.A. (THE “COMPANIES”) FOR THE SOLE PURPOSE
DESCRIBED HEREIN. IN NO CASE MAY IT BE INTERPRETED AS AN OFFER OR INVITATION TO SELL OR PURCHASE ANY SECURITY
ISSUED BY THE COMPANY OR ITS SUBSIDIARIES.
THE CONTENT OF THIS DOCUMENT HAS A MERELY INFORMATIVE AND PROVISIONAL NATURE AND THE STATEMENTS CONTAINED
HEREIN HAVE NOT BEEN INDEPENDENTLY VERIFIED. NEITHER THE COMPANIES NOR ANY OF ITS REPRESENTATIVES SHALL
ACCEPT ANY LIABILITY WHATSOEVER (WHETHER IN NEGLIGENCE OR OTHERWISE) ARISING IN ANY WAY FROM THE USE OF THIS
DOCUMENT. THIS DOCUMENT MAY NOT BE REPRODUCED OR REDISTRIBUTED, IN WHOLE OR IN PART, TO ANY OTHER PERSON.
THE INFORMATION CONTAINED HEREIN AND OTHER MATERIAL DISCUSSED AT THE PRESENTATION MAY INCLUDE FORWARD-
LOOKING STATEMENTS THAT ARE NOT HISTORICAL FACTS, INCLUDING STATEMENTS ABOUT THE COMPANIES’ BELIEFS AND
EXPECTATIONS. THESE STATEMENTS ARE BASED ON CURRENT PLANS, ESTIMATES AND PROJECTIONS, AND PROJECTS.
HOWEVER, FORWARD-LOOKING STATEMENTS INVOLVE INHERENT RISKS AND UNCERTAINTIES. WE CAUTION YOU THAT A
NUMBER OF FACTORS COULD CAUSE THE COMPANIES’ ACTUAL RESULTS TO DIFFER MATERIALLY FROM THOSE CONTAINED IN
ANY FORWARD-LOOKING STATEMENT. THEREFORE, YOU SHOUD NOT PLACE UNDUE RELIANCE ON SUCH FORWARD-LOOKING
STATEMENTS.
45
www.autostradatomi.it www.grupposias.it
46