Embed Size (px)
Citation preview
Annual Report 2011 31/07/2011
The Italian Regulatory Authority for Electricity and Gas (AEEG) Page 1 of 106
Autorità per l'energia elettrica and il gas
ANNUAL REPORT
TO THE EUROPEAN COMMISSION
ON REGULATORY ACTIVITIES AND THE STATE OF SERVICES
IN THE ELECTRICITY AND GAS SECTORS
________________________________________________________________________________
31 July 2011
CONTENTS 31/07/2011
The Italian Regulatory Authority for Electricity and Gas (AEEG) Page 2 of 106
CONTENTS
1 FOREWORD .................................................................................................................................3
2 SUMMARY/ MAIN DEVELOPMENTS OVER THE LAST YEAR ........................................................4
3 REGULATION AND PERFORMANCE OF THE ELECTRICITY MARKET...........................................12
3.1 Regulatory issues ................................................................................................................12
3.1.1 Allocation of interconnection capacity and mechanisms to deal with congestion...12
3.1.2 Regulation of transmission and distribution companies ...........................................16
3.1.3 Unbundling.................................................................................................................23
3.2 Competition ........................................................................................................................24
3.2.1 Description of the wholesale electricity market........................................................24
3.2.2 Description of the retail electricity market................................................................37
3.2.3 Measures to avoid abuses of dominance ..................................................................41
4 REGULATION AND PERFORMANCE OF THE NATURAL GAS MARKET .......................................44
4.1 Regulation ...........................................................................................................................44
4.1.1 Allocation of interconnection capacity and mechanisms to deal with congestion...44
4.1.2 Regulation of transmission and distribution companies ...........................................46
4.1.3 Unbundling.................................................................................................................62
4.2 Competition ........................................................................................................................62
4.2.1 Description of the wholesale market.........................................................................62
4.2.2 Description of the retail market ................................................................................69
4.2.3 Measures to avoid abuses of dominance ..................................................................79
5 SECURITY OF SUPPLY.................................................................................................................81
5.1 Electricity..................................................................................................................................81
5. 2 Gas .......................................................................................................................................88
6 PUBLIC SERVICE ISSUES AND CONSUMER PROTECTION ..........................................................99
1. Foreword 31/07/2011
The Italian Regulatory Authority for Electricity and Gas (AEEG) Page 3 of 106
1 FOREWORD
In this report, the Italian Regulatory Authority for Electricity and Gas provides the Commission with an account of the current state of the Italian electricity and gas markets in compliance with the provisions of articles 3, 4, 23(1) and 23(8) of Directive 2003/54/EC for the electricity sector and articles 3, 5 and 25(1) of Directive 2003/55/EC.
The report structure follows the guidelines issued by the European Commission’s Directorate‐General for Energy and Transport. It opens with a short description of the institutional role of the Authority and of recent normative developments in the energy market. This is followed with an analysis of the principal structural developments in the two markets, electricity and gas, relative to regulatory activities and the current state of competition. The report also provides an update on security of supply and on public service obligations.
2. Summary 31/07/2011
The Italian Regulatory Authority for Electricity and Gas (AEEG) Page 4 of 106
2 SUMMARY/ MAIN DEVELOPMENTS OVER THE LAST YEAR
Developments in the Electricity Market
In 2010, after a significant contraction the previous year, electricity demand started to grow again, in conjunction with a moderate recovery in the Italian economy. According to provisional data published by the national Transmission System Operator (TSO), in 2010 demand was about 326.2 TWh, 1.8% higher than in 2009. The peak‐time power capacity requirement reached a maximum in July, of 56.4 GW.
Net domestic electricity generation increased by 1.9%, whereas net imports from abroad were 43.9 TWh, 2.3% down on the previous year. The Enel Group’s market share of net electricity production shrank from 29.8% in 2009 to 27.9% in 2010. Of the other four main competitors, Edison (11.0%) and Eni (10.0%) maintained their market share, while E.On (5.7%) and Edipower (5.5%) lost ground to small and medium‐sized electricity producers.
The Herfindahl‐Hirschman Index (HHI), calculated in relation to net electricity generation, shows a further decrease in market concentration. In 2010, the HHI was equal to 1,119, compared with 1,240 in 2009.
The maximum net installed generating capacity on 31 December 2010 was equal to 106,938 MW, while net available capacity (for at least 50% of the time) was 91,074 MW.
With reference to net installed capacity, operators with a market share higher than 5% are five in number: Enel (37.2%), Edipower (7.6%), Edison (7.0%), Eni (5.9 %) and E. On (5.2%). The share held by the main three operators was about 51.8%. The HHI for net installed capacity decreased in comparison to 2009: the value of the index in 2010 was 1,595, compared with 1,819 the previous year.
As regards net available capacity, operators with a market share higher than 5% are again five in number: Enel (40.7%), Edison (8.2%), Edipower (8.0%), Eni (6.4%) and E.On (5.8%). Consequently, the share of capacity held by the main three operators is equal to 56.8%. The HHI for net available capacity was 1,910 in 2010, showing a decrease in comparison with 2009 (2,089).
Electricity trading, with a view to planning generation and consumption units, is carried out on both spot and forward markets.
In 2010, electricity demand on the Day‐Ahead Market amounted to 318.6 TWh, 1.6% higher than in 2009. The average purchase price in the Italian power exchange (PUN) was equal to 64.12 €/MWh, a slight increase on the previous year (+0.6%).
During the year, electricity trading volumes on the Intra‐Day Market totalled 14.6 TWh, of which 9.5 TWh during the first trading session and 5.1 TWh during the second. The average purchase prices were 63.69 €/MWh and 63.66 €/MWh respectively during the two sessions.
Official figures for 2010 are only available ex ante for the Ancillary Services Market, in which the TSO accepts energy demand bids and supply offers in order to relieve residual congestions and create reserve margins. Power trading volumes decreased significantly in 2010 in comparison with the previous year, from 27.2 TWh to 21.8 TWh.
In 2010 contracts traded on the forward electricity market managed by the electricity exchange (GME) amounted to 2,366 MW, corresponding to 6.3 TWh of energy. Volumes traded on IDEX, the
2. Summary 31/07/2011
The Italian Regulatory Authority for Electricity and Gas (AEEG) Page 5 of 106
forward market managed by the Italian financial exchange, were 15.4 TWh, in great part relating to annual contracts (9.8 TWh).
In 2010, the number of operators registered on the electricity exchange reached a new maximum of 202 participants (+41 compared with 2009).
Turning to the retail market, according to the TSO’s provisional statistics electricity sales to final customers were about 288 TWh in 2010. Total electricity consumption reached about 305.5 TWh when self‐consumption was included.
In 2010, electricity sales to customers benefiting from protected tariffs amounted to about 79 TWh, more than 5% down on the previous year. About 68% of total volumes (54 TWh) and 83% of customers within this regime refer to the residential sector.
Some 110,000 customers (estimated on the basis of the days‐of‐use criterion) were covered by safeguard provisions, corresponding to a total electricity consumption of about 6.3 TWh (12.7% down on the previous year).
Sales on the liberalised market were about 202 TWh, up nearly 6% on the 2009 level.
In the retail market, 3 electricity operators held a market share higher than 5%: Enel (40.0%), Edison (8.9%) and Acea/Electrabel (5.6%).
Electricity distributors active in the Italian market at 31 December 2010 were 144 in number. 141 of them took part in the survey organized by the Authority, corresponding to a volume of distributed electricity equal to 286 TWh. Enel Distribuzione confirmed its leading share of the market (86.3%) in 2010, followed by A2A Reti Elettriche (4.0%), Acea Distribuzione (3.4%) and Aem Torino Distribuzione (1.3%). Other operators held just minor market shares.
In 2010 the average tariff covering transmission, distribution and metering costs decreased by 0.6% compared with 2009, from 2.281 c€/kWh to 2.267 c€/kWh.
With regard to the quality of the electricity service, in 2010 the average duration of interruptions per low‐voltage customer amounted to 89 minutes (78 minutes in 2009), while the average number of long power outages per year per low‐voltage customer was 2.3 (2.4 in 2009).
Over the period 1 April 2010–31 March 2011, the number of communications to the “Sportello per il consumatore”, a consumer help‐desk established to offer assistance on consumers’ energy inquiries and complaints, amounted to 33,970. Of these, 16,533 (48.6%) referred to the electricity sector. Inquiries and complaints mainly referred to the following issues: the electricity bonus for vulnerable customers (25%), market issues (23%), billing (23%), contractual arrangements (13%), connections (6%) and electricity prices and tariffs (3%).
In 2010, the Authority passed several resolutions in the field of renewable energy sources, aimed at: introducing new regulatory incentives for the development of smart grids; improving network connection arrangements for generation plants; optimising dispatching arrangements for wind plants; setting incentives for photovoltaic (PV) generation; and establishing a regulatory framework for green offerings to final customers.
Turning to competition issues, the Italian antitrust authority conducted two separate proceedings in 2010 to verify whether the major electricity producers in Sicily were responsible for anti‐competitive practices on the electricity wholesale market in the period November 2008‐January 2009. Both proceedings followed an alert from the AEEG, which had observed potential abusive practices in the market. In December 2010, the Antitrust authority adopted a decision relating to
2. Summary 31/07/2011
The Italian Regulatory Authority for Electricity and Gas (AEEG) Page 6 of 106
both proceedings which made binding the commitments offered by the operators under investigation (ENEL, Edipower and the latter’s “tolling” partners).
Developments in the gas market
Based on preliminary calculations using the data collected in the annual survey conducted by the Authority on the state of the electricity and gas markets, in 2010 there were 105 gas suppliers in the wholesale market against 94 the previous year. This number has almost tripled since the complete opening of the gas market in 2003. Overall, wholesalers traded 130.5 G(m3), of which 43.0 to final consumers and 87.5 to other wholesalers. The overall volume traded by wholesalers increased by 17% with respect to 2009, but this was the result of a 28.7% increase in sales on the wholesale market and a reduction of 1.1% in direct sales to final consumers.
The reduction in volumes sold directly to consumers and the increase in those sold on the wholesale market has been an ongoing trend for a few years now.
This appears to confirm an increasing specialisation in the wholesale market. The growth in sales volumes, however, is not evenly distributed by size among the different operators. With respect to 2009, the overall gas volumes sold by Eni and by medium‐size wholesalers, i.e. those with sales between 1 and 10 G(m3), declined in favour of those traded by large and very small suppliers1. Particularly significant is the decrease in volumes sold by Eni, equal to 11.2% this year, following the 25% reduction recorded in 2009.
In 2010, 37 companies (up from 29 in 2009) declared sales volumes on the wholesale market greater than 500 M(m³). These companies accounted for 93.4% of total sales in this market, which continues to be highly concentrated, albeit decreasingly so. More specifically, the share of the first 3 companies – Eni, Enel Trade and Edison – fell to 31.1% (compared with 39.2% last year); that of the first 5 companies, which also include Sinergie Italiane and Plurigas, dropped to 40.6% (from 50.6% in 2009).
Direct imports account for 51% of wholesalers’ gas procurement. Some 20% of the gas procured on the wholesale market is purchased from other traders (at the border or at the city gate), 5.7% is produced domestically and almost 22% is purchased at the PSV (Virtual Balancing Point)2. The significance of the PSV is increasing: in 2009 its share was 15.4%. Imports are the main source of supply, particularly for large companies, while purchases on the wholesale market and at the PSV increase in importance with decreasing company size. Purchases at the PSV are concentrated with medium sized wholesalers, who accounted for 35% of these sales.
The share of gas imports held by the Eni group (38.1%) remained dominant in 2010, especially if we take sales made outside Italian territory into account: they bring the share of gas supplied by the Eni Group up to 50.6%. However, the full operation of the Rovigo regasification terminal — which has greatly boosted imports by Edison — as well as increased imports by other operators, are greatly reducing ENI’s dominance in gas procurement from abroad.
As for the two largest companies’ position in supplying the national market, ENI’s share fell to 14.5% (from 19.7% in 2009) while Edison’s increased to 8% (from 7.5%). The average share of gas purchased from the remaining wholesale companies rose to 77.5%. Taken overall, this indicates a dynamic wholesale market. A very small part of the gas purchased by wholesalers from Eni (0.6
1 Large suppliers are those with sales up to 10 G(m3); very small suppliers are those with sales less than 0.1 G(m3). 2 Purchases at the PSV also include those made on the new platform and P‐GAS and M‐GAS, whose value for 2010 is very low, having started in December (see Chapter 4).
2. Summary 31/07/2011
The Italian Regulatory Authority for Electricity and Gas (AEEG) Page 7 of 106
G(m3)) is related to gas release, the gas it supplied to the PVS on a compulsory basis between October 2009 and September 2010 as a result of antitrust enforcement.
The share for gas that the various groups purchase from Eni (both on the national market and outside the border), taken a proportion of the total gas available to each, fell to 8.8%, from 12.3% in 2009. This illustrates a dynamic market in which each player is looking for ways to differentiate their individual supply. In the case of Edison, this share plummeted to 5%, from 20% in 2009.
With regard to consumption, 2010 was a year of recovery for the natural gas sector, after the fall recorded in 2009. The Ministry for Economic Development (MSE) puts the figure for gross domestic consumption (inclusive of losses) at 83 G(m3), compared with 78 G(m3) in 2009. This equates to an increase of 6.4%, a positive change the likes of which, after years when the industry had been accustomed to high growth rates and stable over time, had not been seen since 2005.
Based on the preliminary results of the Authority’s annual survey on the evolution of the gas sector, sales to the retail market amounted to 71.96 G(m3) in 2010. If we add 13.89 G(m3) of self‐consumption (gas directly consumed in manufacturing companies’ generating plants), then the overall volume of gas consumed in Italy comes to 85.85 G(m3), higher than the value of 82.98 G(m3) indicated by the MSE.
The level of market concentration (inclusive of self‐consumption) diminished in comparison with the previous year: the share of the first three groups fell to 52.0%, from 57.4% in 2009. Moreover, as in the previous year, the market share of Eni sales has fallen further (27.1% against 32.5% in 2009), to the benefit of Edison (13.9% against 12.4% in 2008). ENEL’s share also decreased (11.0% against 12.5% in 2009). In addition, the number of companies with a share exceeding 5% of the market increased by one unit compared with 2009: along with the first three just mentioned and A2A, this year also saw the addition of the GdF Suez group, with a share of 5.2%.
The gas retail market consists of almost 21 million customers: 92.2% are domestic customers, 1.3% are central heating providers, 5.2% are trade and services businesses, 1.2% are in manufacturing and less than 1% are power generators (in terms of volumes the shares obviously tend to reverse).
As we shift away from the domestic segment to industrial segments which use gas as an input to their production processes, the share of volumes purchased on the free market increases accordingly. It goes from 8% in the domestic segment, to 32.6% in central heating, 69.5% in trade and services, 96% in manufacturing and 61.7% in power generation (self‐consumption explains the figure here). The share of volumes purchased on the free market appears to have increased in the domestic and commercial segments in 2010, while it remained stable in the manufacturing sector and in power generation, where it was already very high.
Around 4.5% of all final customers changed supplier in 2010, corresponding to 33.1% in terms of gas volumes. Domestic customers, usually more cautious in shifting to the free market, were more responsive to new offers in 2010: the percentage who chose a new supplier rose to 4.4%, compared with 1.8% in 2009 and 1.1% in 2008. In volume terms, the percentages are slightly higher and amounted respectively to 4.8% in 2010, 2.4% in 2009 and 1.3% in 2008.
Central heating and other‐use customers appear to be more dynamic. In 2010, central heating customers switching supplier were 5.2% of the total (7.7% in terms of consumption), while other‐use customers switching on the free market accounted for 5.1% of the total (in terms of customer numbers) and 43.4% in volume terms.
Switching rates increase strongly with customer size. Higher gas volumes imply higher expenditure: the opportunity to make significant savings, normally the main reason for changing
2. Summary 31/07/2011
The Italian Regulatory Authority for Electricity and Gas (AEEG) Page 8 of 106
supplier, increases in line with knowledge of the sector and customers’ ability to make informed choices.
In 2010, the average price of gas (net of taxes and weighted by quantity sold) quoted by sales companies and wholesalers operating on the retail market was 34.85 €c/m3. The equivalent price in 2009 was 36.59 €c/m3. As a whole, therefore, the price of gas in Italy fell by 4.8%. Customers in the protected market paid 44.77 €c/m3 on average for gas, while the average price paid by those in the liberalised market was 30.52 €c/m3. The price differential is therefore just over 14 c€/m3.
Given that the price on the free market fell with respect to the previous year to a lesser degree than the price on the protected market, a comparison with the figures for 2009 shows that the price differential increased and indeed returned to the 2007 levels.
The magnitude of the difference in price paid in the two markets is mostly due to: the average size of customers, which is higher on the free market; the greater presence in the free market of customers directly connected to the network, who do not pay distribution costs; and the presence on the free market of a more flexible pricing system which responds more closely and more rapidly to changes in international fuel prices. The protection mechanism established by the Authority (linked to variations in the long‐term moving average of a price‐basket and revised in 2010 to even more calming effect) can attenuate the effects on the gas price of steep oil‐market price increases.
As mentioned earlier, from April 2010 to March 2011 the Authority received 33,970 complaints, petitions and notifications from individual consumers and consumers’ associations. Of these, 15,769 referred to the gas sector (46.6% of the total), where complaints increased at more than triple the rate seen the previous year. This was largely due to the number of complaints relating to the implementation of the gas bonus, the compensation scheme to support gas consumption by economically disadvantaged households.
On the matter of tariff regulation in the gas sector, in 2010 the Authority approved the criteria for the regulation of storage tariffs for the third regulatory period (2011‐2014).
With the intention of establishing more effective incentive mechanisms for the development of natural gas storage facilities, the Authority has also started, under the same resolution, to identify mechanisms to accelerate the entry into operation of investments in capacity storage.
After an extensive consultation phase in April 2011, the Authority approved the rules governing the merit‐order balancing market for natural gas by introducing market mechanisms to increase the flexibility and liquidity of gas supply. The new mechanism provides for the creation of a platform at the central level and accessible to all operators. The aim is in order to acquire, on an economic merit basis, the resources needed to balance their positions and ensure that the network is balanced at all times, for system security purposes.
Initially scheduled for 1 July, the start of this new system was then postponed until 1 December 2011, to ensure that there is enough time to complete the regulatory framework necessary for its operation.
The Authority also made changes to the regulations governing the emergency service and the measurement of gas by distributors.
Security of supply issues
Although some early signs of economic recovery were seen in 2010, electricity consumption over the year remained lower than in 2006, while the winter peak had still not returned to the level of
2. Summary 31/07/2011
The Italian Regulatory Authority for Electricity and Gas (AEEG) Page 9 of 106
2005 or the summer peak to that of 2007. Capacity expansion nevertheless continued, bringing total installed power to 106.9 GW compared with 85.5 in 2005. Continued growth in generating capacity in recent years has led to strong improvements in power availability at peak periods. The power deficits of 2003 and 2004 have turned into growing surpluses, of as much as 12.6 GW in 2009, a value that was however swollen by the steep fall in peak demand due to the economic crisis.
At the end of 2010, 40 new thermal generating plants with capacity greater than 300 MW and contributing 19 GW to generating power were at various stages of authorisation. As a consequence, the country should not be in danger of power deficits in the current decade.
Although the prospects for generation appear to be favourable, problems remain in transmission due to network congestions in the north and centre/north and deficiencies in the south.
The task of resolving these critical issues is being slowed down mainly by local authorisation issues. Terna’s network development plan aims at eliminating congestions in the areas currently experiencing the greatest problems, but over a timescale that goes beyond its Strategic Plan for 2011‐15.
The increase in natural gas consumption in 2010 is due essentially to the effects of the harsh winter weather on the residential sector. Inputs to power generation were still below those of 2005 and industrial consumption had not yet regained the level of the years immediately preceding and including 2008. Developments in the first six months of 2011 do not indicate a pick‐up in consumption in the near term. Demand is nevertheless expected to increase substantially over the decade, fuelled by demand in the power generation sector, particularly after the vote in the May referendum to halt the nuclear power generation programme.
Significant progress has been achieved in the development of new storage projects and gas import pipelines and regasification terminals, notwithstanding the uncertainties caused by the decline in demand and increase in supplies. A final decision on import infrastructure nevertheless awaits confirmation of the quantities of gas actually available, particularly in the case of pipeline projects. If the import infrastructure currently under construction or in the final stages of authorisation were to be completed as planned, import capacity would increase by at least 20 billion m3/year, which is more than enough to meet Italy’s requirements.
Public service issues and consumer protection
In 2010 the Authority continued its efforts to achieve an improved level of customer protection in the electricity and gas sectors. Regulation was reinforced, with a twofold aim. First, to enhance customers’ ability to make informed choices from the different commercial offerings on the market. And second, to progressively harmonize the regulation of commercial aspects of the services, with due respect for the structural differences between the two sectors.
In this regard, during 2010 a common Commercial Code of Conduct for sales in the two sectors was completed. This extended the tools for comparing prices and commercial offers to the gas sector and to dual fuel contracts, which are becoming increasingly widespread in the free market. New rules for the harmonisation and transparency of billing documents for the two sectors, issued in 2009, were implemented in 2010.
The Sportello per i consumatori dell’energia elettrica e il gas has been in operation since 2009. Managed by the Single Buyer on the basis of a Regulation issued by the Authority, it provides prompt responses to written observations and complaints from customers in the liberalized markets. The volume of observations and complaints treated by the Sportello per i consumatori
2. Summary 31/07/2011
The Italian Regulatory Authority for Electricity and Gas (AEEG) Page 10 of 106
dell’energia elettrica e il gas increased also in 2010 (from 417,000 in April 2009 – March 2010 to 740,131 in April 2010 – March 2011) confirming the effectiveness of the service provided.
Trova‐Offerte, the online tool set up by the Authority in April 2009 to enable customers to compare and take advantage of different market offers for their electricity supply, was extended to the gas sector and to dual fuel offers (gas–electricity) in April 2010.
Again in 2010, the Authority continued to update the Atlas of Consumers’ Rights in the Electricity and Gas Sectors, also available on‐line.
Finally, in order to enhance the quality of companies’ customer complaints services, the Authority issued a consultation document containing proposals for the regular publication of comparative efficiency and performance data for these services.
Issued in 2009 and implemented in 2010, the new rules governing defaulting electricity customers introduced a new regime more suited, both for customers and suppliers, to the new liberalised context in which the number of defaults is increasing. The number of requests recorded by the Authority for reactivation of the service following disconnections for default has been constantly and gradually increasing in the two sectors since 2008.
The new rules for vulnerable electricity and gas customers entered into force on 1 January 2009. More than 2 million applications, representing 1.5 million households, for electricity tariff discounts (the “social bonus”) for vulnerable customers had been submitted and approved by 31 March 2010. The estimated cumulative value of electricity tariff reductions allowed for vulnerable customers in the period 2008–2010 is around 233 million euros.
In the natural gas sector, applications from vulnerable customers for tariff discounts managed by Municipalities were over 700,000 in number. The estimated total cumulative value of gas tariff reductions granted to vulnerable customers in the period 2009–2010 is around 75 million euros.
Domestic consumers still buy high volumes of energy in the protected market (86% in electricity and 92% in gas), although they appear to have been decreasing, at a very slow but constant pace, since 2007. Conversely, non‐domestic consumers are mainly supplied by the free market and in volume terms only a residual share, which has remained relatively stable over the last two years, remains in the protected market.
Information on the most recent status of the transposition of the 3rd Package
Legislative decree no. 93 of 1 June 2011 implemented Directives 2009/72/CE, 2009/73/CE and 2008/92/EC concerning common rules for the internal market in electricity and gas. It also implemented the Community procedure to improve the transparency of gas and electricity prices charged to industrial end‐users and repealed Directives 2003/54/EC and 2003/55/EC.
Referring to the choice of unbundling model, for the natural gas sector the decree states that the main transmission company, i.e. the owner of the national transmission network and, as such, provider of transmission services over the bulk of that network, must by 3 March 2012 comply with the measures regarding the Independent Transmission Operator in accordance with Chapter IV of Directive 2009/73/EC of 13 July 2009.
Again by 3 March 2012, companies owning natural gas transmission networks (other than the main one) in operation at 3 September 2009 may propose an Independent System Operator in place of the model envisaging an Independent Transmission Operator. If the network‐owning companies choose the main transmission company as their Independent System Operator, the transmission company shall operate under rules set by the Regulatory Authority for Electricity and
2. Summary 31/07/2011
The Italian Regulatory Authority for Electricity and Gas (AEEG) Page 11 of 106
Gas. The network owners may of course choose the ownership unbundling model at any time. Transmission companies that were already operating under an ownership unbundling regime at 3 September 2009 may not, however, choose any other form of unbundling model.
The decree does not specify any rule for companies that began operating after 3 September 2009. Directive 2009/73/EC provides that all companies shall comply with ownership unbundling with effect from 3 March 2012. Only for companies already in operation at 3 September 2009 may member states choose to provide the options of Independent System Operator or Independent Transmission Operator.
For the electricity sector, the decree provides for ownership unbundling: the Transmission System Operator may not, either directly or indirectly, engage in the generation or supply of electricity, or operate – even on a temporary basis – generation infrastructure or plants. The Regulatory Authority for Electricity and Gas certifies the companies according to the criteria set by art. 9 of Directive 2009/72/EC.
With reference to the human and financial resources of the Regulatory Authority, the implementing decree does not provide for any increase in the present number of employees, as set by existing legislation, even in light of the new duties and competencies attributed to the Authority by that very same decree.
3.Regulation and performance of the electricity market 31/07/2011
The Italian Regulatory Authority for Electricity and Gas (AEEG) Page 12 of 106
3 REGULATION AND PERFORMANCE OF THE ELECTRICITY MARKET
3.1 Regulatory issues
3.1.1 Allocation of interconnection capacity and mechanisms to deal with congestion
With Resolution ARG/elt 194/09 of 18 December 2009, the Authority established the arrangements for the allocation of interconnection capacity for 2010, in compliance with the criteria set forth in the Ministry for Economic Development’s decree of 18 December 2009.
More specifically, the Authority approved the rules drawn up jointly by network operators and by the regulatory authorities of the countries taking part in the regional initiative for Central‐South Europe (Italy, Austria, Germany, France, Greece and Slovenia) under the umbrella of the European Regulators’ Group for Electricity and Gas (ERGEG). As in 2009, interconnection capacity for 2010 was allocated through explicit annual, monthly and daily auctions run by each network operator for exports in its area of competence.
With a view to fostering increasing harmonisation of the allocation rules in Central‐South Europe, during the first half of 2010 total available capacity at the French border (for imports and exports) was managed solely by Terna.
The auctions for the allocation of interconnection capacity assign certificates, known as Transmission Capacity Rights (TCRs), to market operators. These allow operators to import or export electricity in quantities corresponding to the total TCRs acquired. TCRs can be freely transferred from one dispatching user to another. Since 2009, for TCRs purchased at the annual or monthly auctions and remaining unused, the “use it or get paid for it” criterion has been applied. This means that unused TCRs are automatically sold by grid operators at the daily auction and the revenue from the sale is transferred to the original holders.
With resolution ARG/elt 194/09, the Authority also introduced different arrangements for Terna to manage the revenue from cross‐border capacity allocation auctions. Starting from 2010 this revenue, which until 2009 was returned pro‐rata to dispatching users, has been used to cover any costs incurred to ensure that the assigned capacity was actually available. It is therefore used to offset the costs incurred by Terna in providing dispatching resources.
The rules for 2011 governing access to the interconnection network with neighbouring countries were approved with Resolution ARG/elt 241/10 of 15 December 2010. As is customary, the rules were drawn up by Terna and the network operators of neighbouring countries and will enable further progress towards the creation of a true regional market. For 2011, alongside the provisions, similar to those introduced for 2010, concerning reserves for imports and the use of congestion revenue, a number of changes were introduced.
Most notably, under the rules approved by Resolution ARG/elt 241/10, the task of running the auctions for the allocation of available transmission capacity should be transferred, with effect from April 2011, to the Capacity Allocating Service Company (CASC). The new rules comply with the Minister for Economic Development’s decree of 14 December 2010. Based in Luxembourg, the CASC is co‐owned by the network operators directly involved.
By using an external company to manage capacity allocation, it is possible to have a single commercial interface for all operators active on the frontiers concerned. Since the CASC already
3.Regulation and performance of the electricity market 31/07/2011
The Italian Regulatory Authority for Electricity and Gas (AEEG) Page 13 of 106
operates in central‐western Europe (France, Belgium, Holland, Luxembourg and Germany), it will facilitate greater harmonisation of the allocation rules beyond Italy’s borders also.
As regards daily allocations on the Slovenian border, the rules have been amended to take into account the introduction, with effect from 1 January 2011, of market coupling between the Italian and Slovenian exchanges for daily capacity allocation through implicit auctions.
In May 2009 a bilateral working group was set up to begin work on implementing the market coupling project on the Slovenia‐Italy border. The group is chaired by delegates from the regulatory authorities and composed of delegates from the ministries concerned, network operators and market operators. The group was required to operate in parallel on all aspects of the project implementation process and to keep the organisations concerned with the Centre‐South regional initiative constantly informed of progress.
On 9 November 2009 the Italian and Slovenian Foreign Ministries signed a joint declaration on behalf of their governments expressing their support for the goal of integrating their two countries’ electricity markets. In the first half of 2010 the working group drew up a roadmap for the implementation of the market‐coupling project on the Slovenia‐Italy interconnection. The roadmap was implemented in the following stages:
27 August 2010: Italy’s Minister for Economic Development and Slovenia’s Minister for the Economy signed a Memorandum of Understanding on behalf of their respective governments;
13 September 2010: with Resolution ARG/elt 143/10, the Authority approved the outline framework agreement proposed by the network and market operators (the Slovenian regulator ratified it on 13 October), which in turn signed it officially;
3 November 2010: the network and market operators published the Market Coupling on the Italian‐Slovenian Border 2011 document on their websites; on 16 November, at the 3rd meeting of the Centre‐South region’s Stakeholder Group, the regulators and the network and market operators officially presented the model to operators;
15 December 2010: with Resolution ARG/elt 241/10, the Authority approved the access rules for 2011;
16 December 2010: with Resolution ARG/elt 243/10, the Authority approved the five‐party outline agreement submitted by network and market operators (the Slovenian regulator ratified the agreement on 15 December).
The market coupling arrangement is between the day‐ahead market (Italian initials MGP) run by the Italian power exchange (Energy Market Operator –GME) and the MGP run by the Slovenian power exchange (BSP). Envisaging the implicit allocation of daily transit rights on the Slovenia‐Italy interconnection, it finally began operating on 1 January 2011. The integration of the two markets is based on the following principles and criteria:
a price‐coupling mechanism implemented using a decentralised approach. Each exchange is responsible for managing its own MGP, taking into account the following criteria:
sales and purchase bids/offers submitted by their market participants;
sales and purchase bids/offers submitted anonymously by participants in the other exchange’s market;
the configuration of Italy and Slovenia’s network topology, as defined by the network operators;
3.Regulation and performance of the electricity market 31/07/2011
The Italian Regulatory Authority for Electricity and Gas (AEEG) Page 14 of 106
transmission capacity between the zones within each country’s network, as defined by their network operators;
available transmission capacity between Italy and Slovenia for the MGP, as jointly defined by their network operators.
the exchanges share all relevant information;
on the basis of this shared information, each exchange:
uses the same calculation algorithm, which takes into account the rules for accepting bids on first the Italian and then the Slovenian MGP;
calculates the results for its own MGP and those for the other exchange;
defines the hourly exchange programme on the Italy‐Slovenia border, on the basis of the difference between the price of the “Slovenia zone” of the Italian network model, as calculated by the GME, and the price of the “BSP zone” of the Slovenian network model, as calculated by their power exchange.
the grid operators are jointly responsible for calculating available transmission capacity between the “Slovenian zone” of the Italian network model and the “BSP zone” of the Slovenian network model, for allocation by coupling the two MGPs.
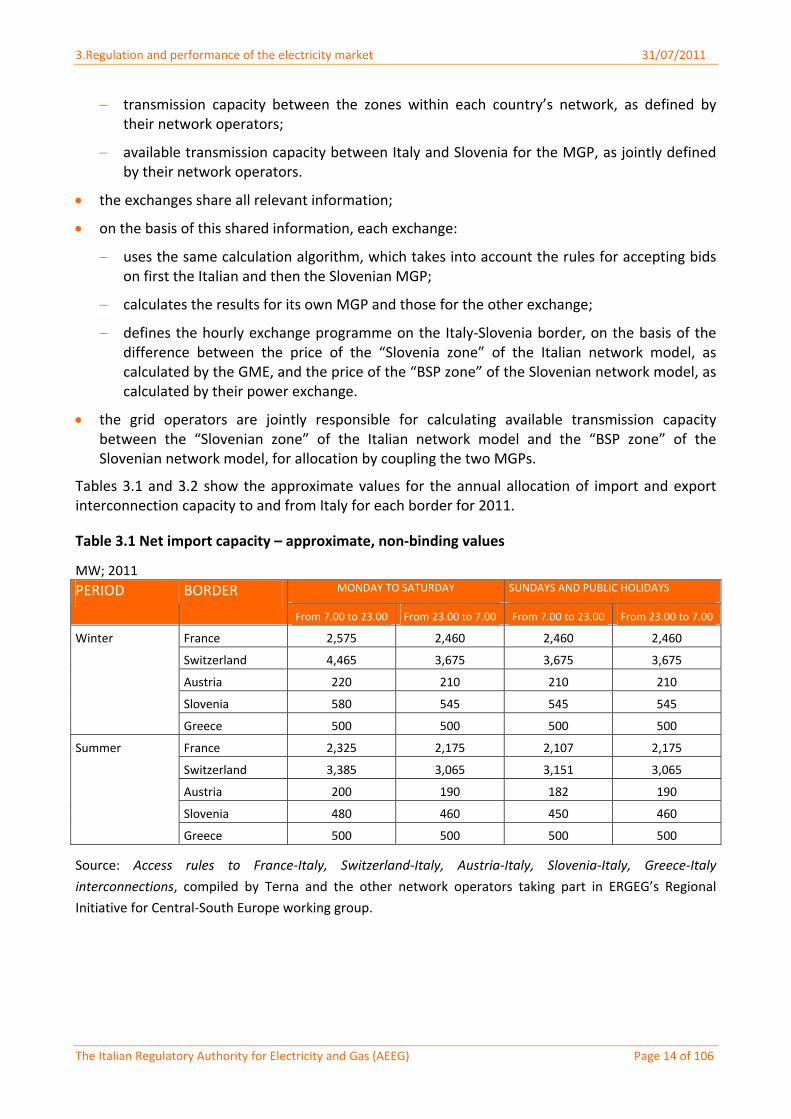
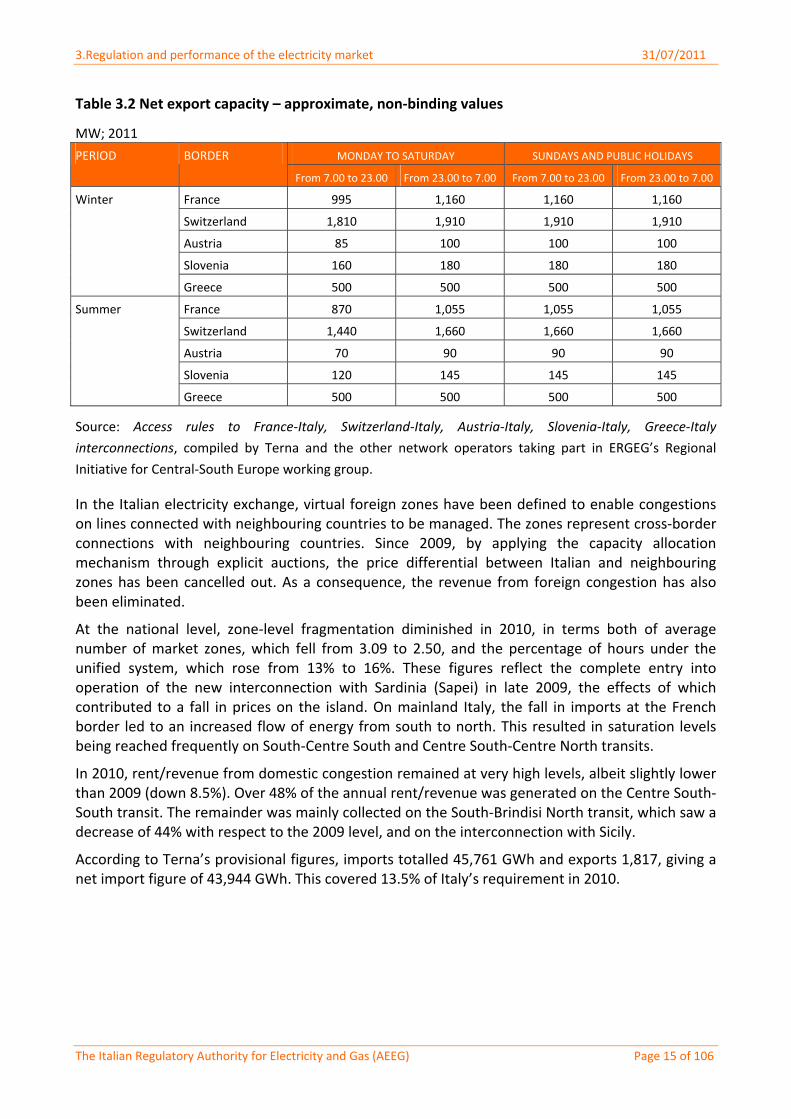
Tables 3.1 and 3.2 show the approximate values for the annual allocation of import and export interconnection capacity to and from Italy for each border for 2011.
Table 3.1 Net import capacity – approximate, non‐binding values
MW; 2011 MONDAY TO SATURDAY SUNDAYS AND PUBLIC HOLIDAYS PERIOD BORDER
From 7.00 to 23.00 From 23.00 to 7.00 From 7.00 to 23.00 From 23.00 to 7.00
France 2,575 2,460 2,460 2,460
Switzerland 4,465 3,675 3,675 3,675
Austria 220 210 210 210
Slovenia 580 545 545 545
Winter
Greece 500 500 500 500
France 2,325 2,175 2,107 2,175
Switzerland 3,385 3,065 3,151 3,065
Austria 200 190 182 190
Slovenia 480 460 450 460
Summer
Greece 500 500 500 500
Source: Access rules to France‐Italy, Switzerland‐Italy, Austria‐Italy, Slovenia‐Italy, Greece‐Italy
interconnections, compiled by Terna and the other network operators taking part in ERGEG’s Regional
Initiative for Central‐South Europe working group.
3.Regulation and performance of the electricity market 31/07/2011
The Italian Regulatory Authority for Electricity and Gas (AEEG) Page 15 of 106
Table 3.2 Net export capacity – approximate, non‐binding values
MW; 2011
MONDAY TO SATURDAY SUNDAYS AND PUBLIC HOLIDAYS PERIOD BORDER
From 7.00 to 23.00 From 23.00 to 7.00 From 7.00 to 23.00 From 23.00 to 7.00
France 995 1,160 1,160 1,160
Switzerland 1,810 1,910 1,910 1,910
Austria 85 100 100 100
Slovenia 160 180 180 180
Winter
Greece 500 500 500 500
France 870 1,055 1,055 1,055
Switzerland 1,440 1,660 1,660 1,660
Austria 70 90 90 90
Slovenia 120 145 145 145
Summer
Greece 500 500 500 500
Source: Access rules to France‐Italy, Switzerland‐Italy, Austria‐Italy, Slovenia‐Italy, Greece‐Italy
interconnections, compiled by Terna and the other network operators taking part in ERGEG’s Regional
Initiative for Central‐South Europe working group.
In the Italian electricity exchange, virtual foreign zones have been defined to enable congestions on lines connected with neighbouring countries to be managed. The zones represent cross‐border connections with neighbouring countries. Since 2009, by applying the capacity allocation mechanism through explicit auctions, the price differential between Italian and neighbouring zones has been cancelled out. As a consequence, the revenue from foreign congestion has also been eliminated.
At the national level, zone‐level fragmentation diminished in 2010, in terms both of average number of market zones, which fell from 3.09 to 2.50, and the percentage of hours under the unified system, which rose from 13% to 16%. These figures reflect the complete entry into operation of the new interconnection with Sardinia (Sapei) in late 2009, the effects of which contributed to a fall in prices on the island. On mainland Italy, the fall in imports at the French border led to an increased flow of energy from south to north. This resulted in saturation levels being reached frequently on South‐Centre South and Centre South‐Centre North transits.
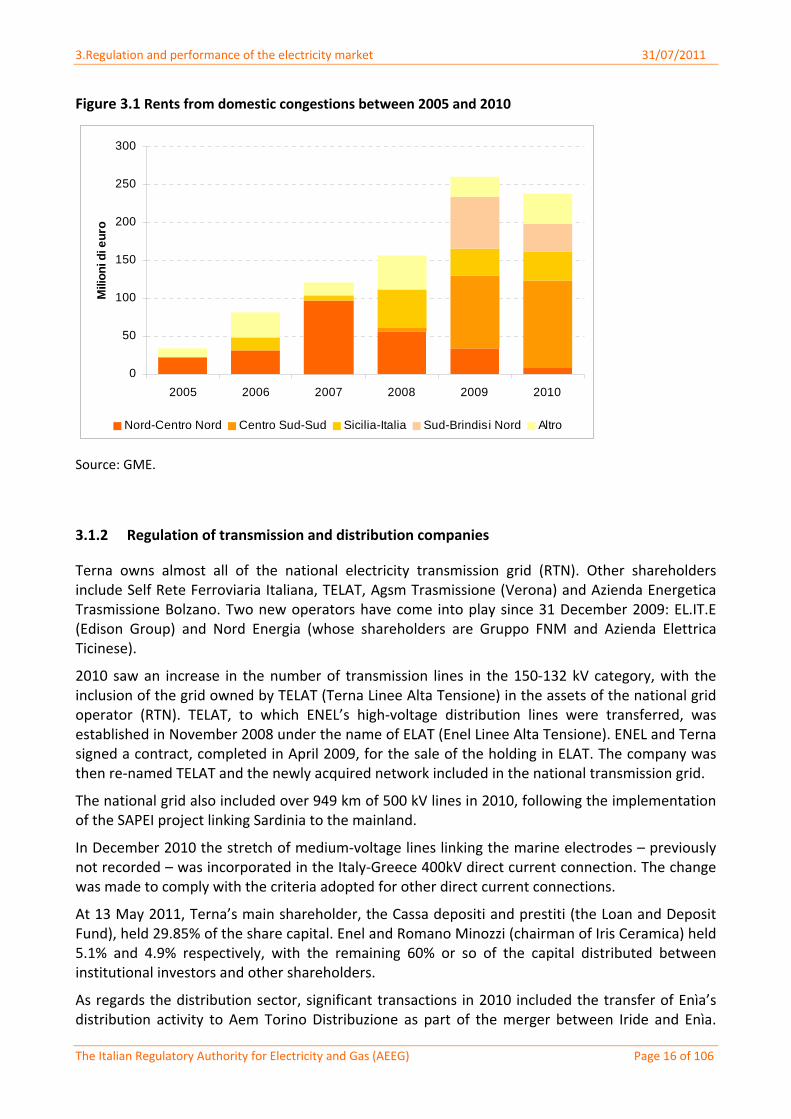
In 2010, rent/revenue from domestic congestion remained at very high levels, albeit slightly lower than 2009 (down 8.5%). Over 48% of the annual rent/revenue was generated on the Centre South‐South transit. The remainder was mainly collected on the South‐Brindisi North transit, which saw a decrease of 44% with respect to the 2009 level, and on the interconnection with Sicily.
According to Terna’s provisional figures, imports totalled 45,761 GWh and exports 1,817, giving a net import figure of 43,944 GWh. This covered 13.5% of Italy’s requirement in 2010.
3.Regulation and performance of the electricity market 31/07/2011
The Italian Regulatory Authority for Electricity and Gas (AEEG) Page 16 of 106
Figure 3.1 Rents from domestic congestions between 2005 and 2010
0
50
100
150
200
250
300
2005 2006 2007 2008 2009 2010
Mili
on
i di e
uro
Nord-Centro Nord Centro Sud-Sud Sicilia-Italia Sud-Brindisi Nord Altro
Source: GME.
3.1.2 Regulation of transmission and distribution companies
Terna owns almost all of the national electricity transmission grid (RTN). Other shareholders include Self Rete Ferroviaria Italiana, TELAT, Agsm Trasmissione (Verona) and Azienda Energetica Trasmissione Bolzano. Two new operators have come into play since 31 December 2009: EL.IT.E (Edison Group) and Nord Energia (whose shareholders are Gruppo FNM and Azienda Elettrica Ticinese).
2010 saw an increase in the number of transmission lines in the 150‐132 kV category, with the inclusion of the grid owned by TELAT (Terna Linee Alta Tensione) in the assets of the national grid operator (RTN). TELAT, to which ENEL’s high‐voltage distribution lines were transferred, was established in November 2008 under the name of ELAT (Enel Linee Alta Tensione). ENEL and Terna signed a contract, completed in April 2009, for the sale of the holding in ELAT. The company was then re‐named TELAT and the newly acquired network included in the national transmission grid.
The national grid also included over 949 km of 500 kV lines in 2010, following the implementation of the SAPEI project linking Sardinia to the mainland.
In December 2010 the stretch of medium‐voltage lines linking the marine electrodes – previously not recorded – was incorporated in the Italy‐Greece 400kV direct current connection. The change was made to comply with the criteria adopted for other direct current connections.
At 13 May 2011, Terna’s main shareholder, the Cassa depositi and prestiti (the Loan and Deposit Fund), held 29.85% of the share capital. Enel and Romano Minozzi (chairman of Iris Ceramica) held 5.1% and 4.9% respectively, with the remaining 60% or so of the capital distributed between institutional investors and other shareholders.
As regards the distribution sector, significant transactions in 2010 included the transfer of Enìa’s distribution activity to Aem Torino Distribuzione as part of the merger between Iride and Enìa.
3.Regulation and performance of the electricity market 31/07/2011
The Italian Regulatory Authority for Electricity and Gas (AEEG) Page 17 of 106
Also in 2010, Deval acquired the distribution activity of the municipality of Lillianes (Aosta), while the municipalities of Palù del Fersina (TN) and Tres (TN) ceded their distribution operations to Stet (Servizi Territoriali Est Trentino) and Set Distribuzione respectively.
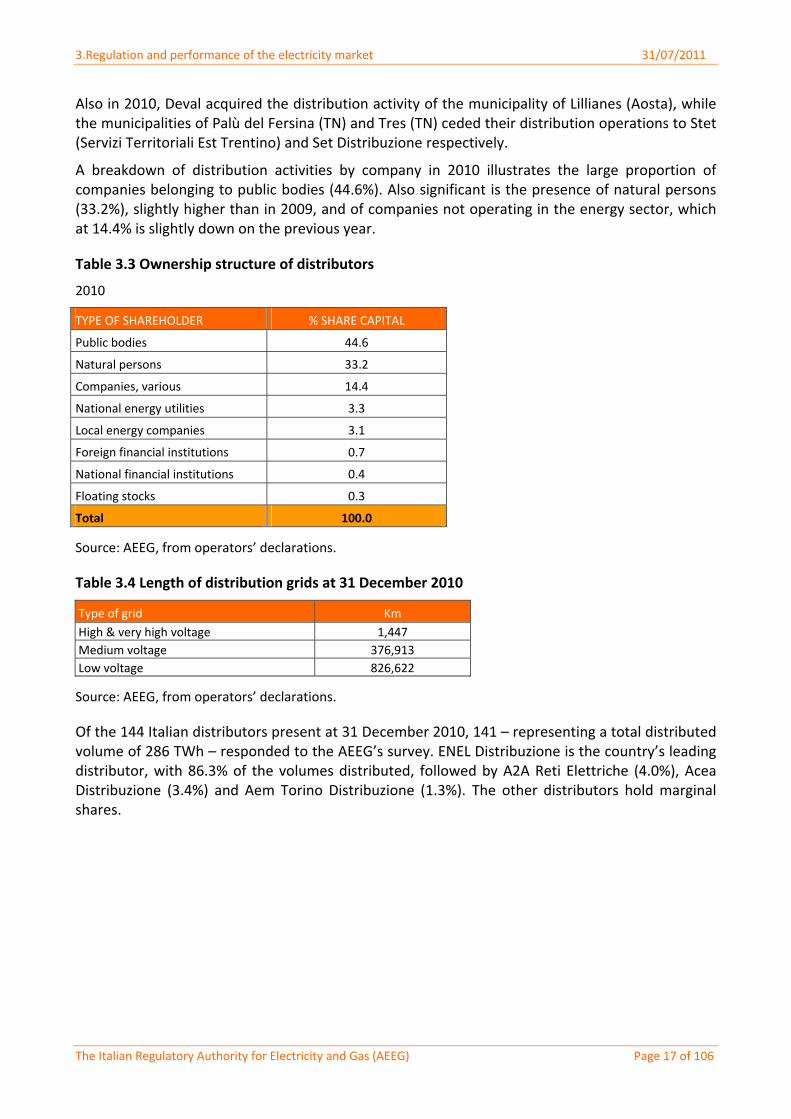
A breakdown of distribution activities by company in 2010 illustrates the large proportion of companies belonging to public bodies (44.6%). Also significant is the presence of natural persons (33.2%), slightly higher than in 2009, and of companies not operating in the energy sector, which at 14.4% is slightly down on the previous year.
Table 3.3 Ownership structure of distributors
2010
TYPE OF SHAREHOLDER % SHARE CAPITAL
Public bodies 44.6
Natural persons 33.2
Companies, various 14.4
National energy utilities 3.3
Local energy companies 3.1
Foreign financial institutions 0.7
National financial institutions 0.4
Floating stocks 0.3
Total 100.0
Source: AEEG, from operators’ declarations.
Table 3.4 Length of distribution grids at 31 December 2010
Type of grid Km
High & very high voltage 1,447
Medium voltage 376,913
Low voltage 826,622
Source: AEEG, from operators’ declarations.
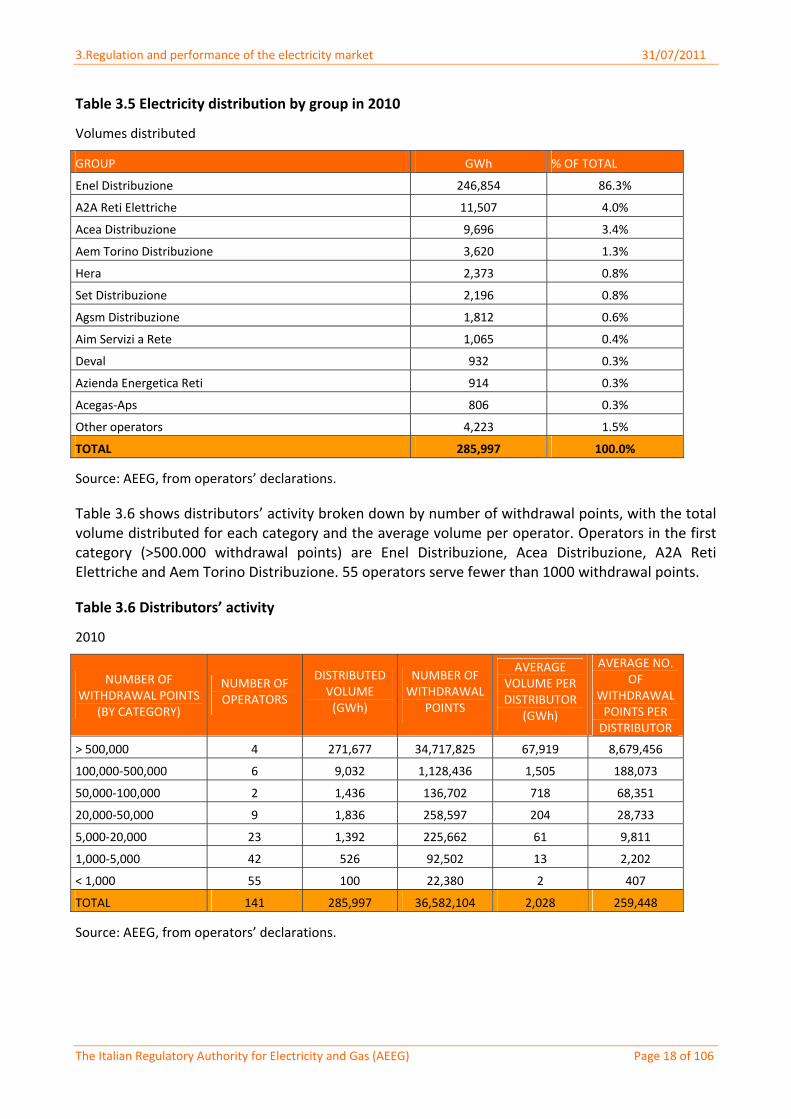
Of the 144 Italian distributors present at 31 December 2010, 141 – representing a total distributed volume of 286 TWh – responded to the AEEG’s survey. ENEL Distribuzione is the country’s leading distributor, with 86.3% of the volumes distributed, followed by A2A Reti Elettriche (4.0%), Acea Distribuzione (3.4%) and Aem Torino Distribuzione (1.3%). The other distributors hold marginal shares.
3.Regulation and performance of the electricity market 31/07/2011
The Italian Regulatory Authority for Electricity and Gas (AEEG) Page 18 of 106
Table 3.5 Electricity distribution by group in 2010
Volumes distributed
GROUP GWh % OF TOTAL
Enel Distribuzione 246,854 86.3%
A2A Reti Elettriche 11,507 4.0%
Acea Distribuzione 9,696 3.4%
Aem Torino Distribuzione 3,620 1.3%
Hera 2,373 0.8%
Set Distribuzione 2,196 0.8%
Agsm Distribuzione 1,812 0.6%
Aim Servizi a Rete 1,065 0.4%
Deval 932 0.3%
Azienda Energetica Reti 914 0.3%
Acegas‐Aps 806 0.3%
Other operators 4,223 1.5%
TOTAL 285,997 100.0%
Source: AEEG, from operators’ declarations.
Table 3.6 shows distributors’ activity broken down by number of withdrawal points, with the total volume distributed for each category and the average volume per operator. Operators in the first category (>500.000 withdrawal points) are Enel Distribuzione, Acea Distribuzione, A2A Reti Elettriche and Aem Torino Distribuzione. 55 operators serve fewer than 1000 withdrawal points.
Table 3.6 Distributors’ activity
2010
NUMBER OF WITHDRAWAL POINTS
(BY CATEGORY)
NUMBER OF OPERATORS
DISTRIBUTED VOLUME (GWh)
NUMBER OF WITHDRAWAL
POINTS
AVERAGE VOLUME PER DISTRIBUTOR
(GWh)
AVERAGE NO. OF
WITHDRAWAL POINTS PER DISTRIBUTOR
> 500,000 4 271,677 34,717,825 67,919 8,679,456
100,000‐500,000 6 9,032 1,128,436 1,505 188,073
50,000‐100,000 2 1,436 136,702 718 68,351
20,000‐50,000 9 1,836 258,597 204 28,733
5,000‐20,000 23 1,392 225,662 61 9,811
1,000‐5,000 42 526 92,502 13 2,202
< 1,000 55 100 22,380 2 407
TOTAL 141 285,997 36,582,104 2,028 259,448
Source: AEEG, from operators’ declarations.
3.Regulation and performance of the electricity market 31/07/2011
The Italian Regulatory Authority for Electricity and Gas (AEEG) Page 19 of 106
Transmission and distribution tariffs
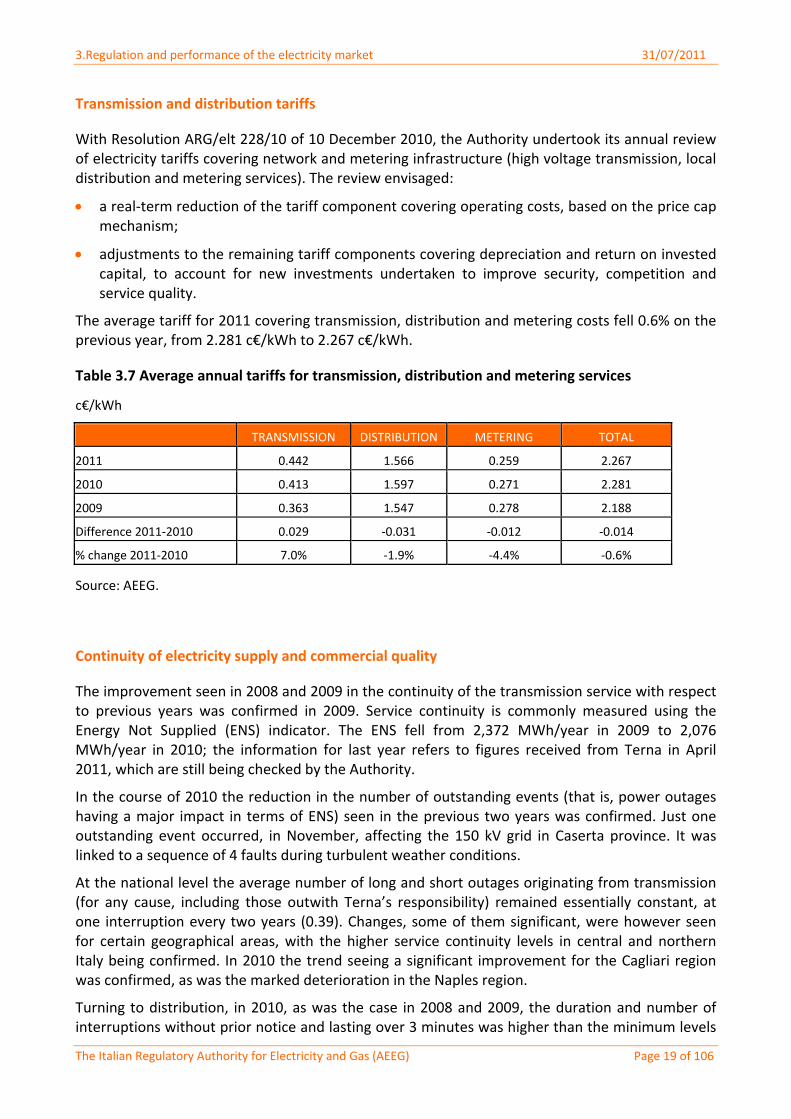
With Resolution ARG/elt 228/10 of 10 December 2010, the Authority undertook its annual review of electricity tariffs covering network and metering infrastructure (high voltage transmission, local distribution and metering services). The review envisaged:
a real‐term reduction of the tariff component covering operating costs, based on the price cap mechanism;
adjustments to the remaining tariff components covering depreciation and return on invested capital, to account for new investments undertaken to improve security, competition and service quality.
The average tariff for 2011 covering transmission, distribution and metering costs fell 0.6% on the previous year, from 2.281 c€/kWh to 2.267 c€/kWh.
Table 3.7 Average annual tariffs for transmission, distribution and metering services
c€/kWh
TRANSMISSION DISTRIBUTION METERING TOTAL
2011 0.442 1.566 0.259 2.267
2010 0.413 1.597 0.271 2.281
2009 0.363 1.547 0.278 2.188
Difference 2011‐2010 0.029 ‐0.031 ‐0.012 ‐0.014
% change 2011‐2010 7.0% ‐1.9% ‐4.4% ‐0.6%
Source: AEEG.
Continuity of electricity supply and commercial quality
The improvement seen in 2008 and 2009 in the continuity of the transmission service with respect to previous years was confirmed in 2009. Service continuity is commonly measured using the Energy Not Supplied (ENS) indicator. The ENS fell from 2,372 MWh/year in 2009 to 2,076 MWh/year in 2010; the information for last year refers to figures received from Terna in April 2011, which are still being checked by the Authority.
In the course of 2010 the reduction in the number of outstanding events (that is, power outages having a major impact in terms of ENS) seen in the previous two years was confirmed. Just one outstanding event occurred, in November, affecting the 150 kV grid in Caserta province. It was linked to a sequence of 4 faults during turbulent weather conditions.
At the national level the average number of long and short outages originating from transmission (for any cause, including those outwith Terna’s responsibility) remained essentially constant, at one interruption every two years (0.39). Changes, some of them significant, were however seen for certain geographical areas, with the higher service continuity levels in central and northern Italy being confirmed. In 2010 the trend seeing a significant improvement for the Cagliari region was confirmed, as was the marked deterioration in the Naples region.
Turning to distribution, in 2010, as was the case in 2008 and 2009, the duration and number of interruptions without prior notice and lasting over 3 minutes was higher than the minimum levels
3.Regulation and performance of the electricity market 31/07/2011
The Italian Regulatory Authority for Electricity and Gas (AEEG) Page 20 of 106
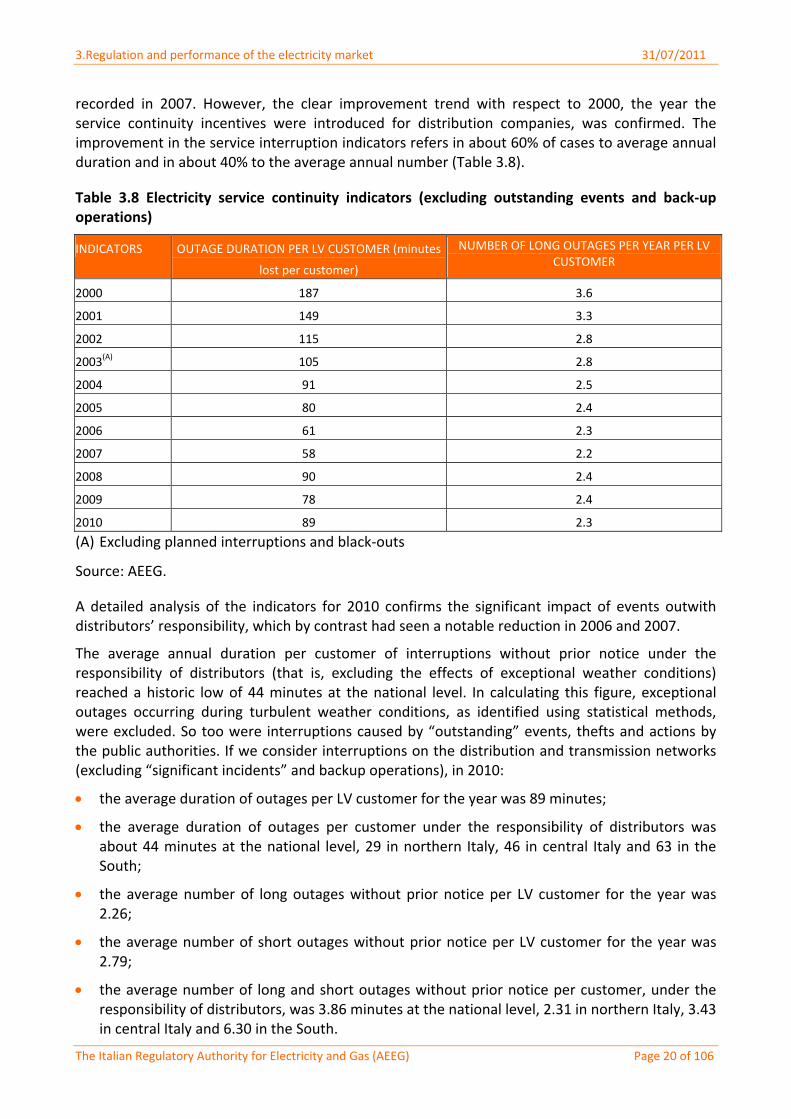
recorded in 2007. However, the clear improvement trend with respect to 2000, the year the service continuity incentives were introduced for distribution companies, was confirmed. The improvement in the service interruption indicators refers in about 60% of cases to average annual duration and in about 40% to the average annual number (Table 3.8).
Table 3.8 Electricity service continuity indicators (excluding outstanding events and back‐up operations)
INDICATORS OUTAGE DURATION PER LV CUSTOMER (minutes
lost per customer)
NUMBER OF LONG OUTAGES PER YEAR PER LV CUSTOMER
2000 187 3.6
2001 149 3.3
2002 115 2.8
2003(A) 105 2.8
2004 91 2.5
2005 80 2.4
2006 61 2.3
2007 58 2.2
2008 90 2.4
2009 78 2.4
2010 89 2.3
(A) Excluding planned interruptions and black‐outs
Source: AEEG.
A detailed analysis of the indicators for 2010 confirms the significant impact of events outwith distributors’ responsibility, which by contrast had seen a notable reduction in 2006 and 2007.
The average annual duration per customer of interruptions without prior notice under the responsibility of distributors (that is, excluding the effects of exceptional weather conditions) reached a historic low of 44 minutes at the national level. In calculating this figure, exceptional outages occurring during turbulent weather conditions, as identified using statistical methods, were excluded. So too were interruptions caused by “outstanding” events, thefts and actions by the public authorities. If we consider interruptions on the distribution and transmission networks (excluding “significant incidents” and backup operations), in 2010:
the average duration of outages per LV customer for the year was 89 minutes;
the average duration of outages per customer under the responsibility of distributors was about 44 minutes at the national level, 29 in northern Italy, 46 in central Italy and 63 in the South;
the average number of long outages without prior notice per LV customer for the year was 2.26;
the average number of short outages without prior notice per LV customer for the year was 2.79;
the average number of long and short outages without prior notice per customer, under the responsibility of distributors, was 3.86 minutes at the national level, 2.31 in northern Italy, 3.43 in central Italy and 6.30 in the South.
3.Regulation and performance of the electricity market 31/07/2011
The Italian Regulatory Authority for Electricity and Gas (AEEG) Page 21 of 106
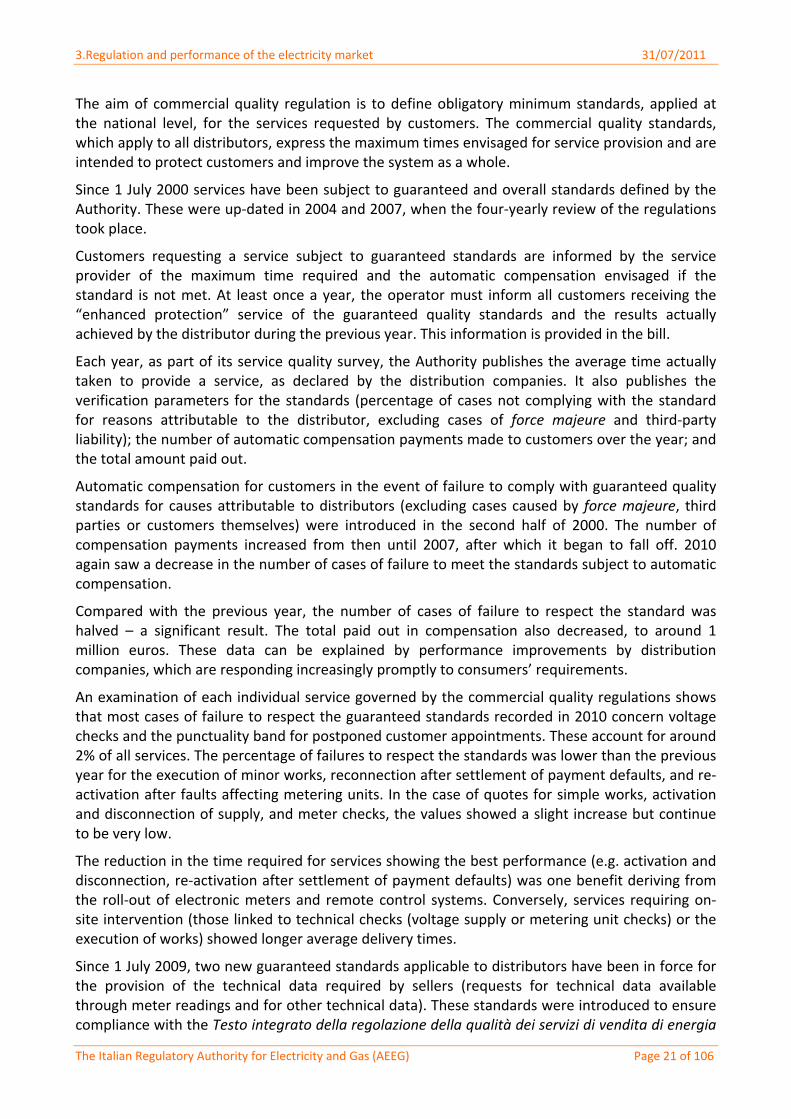
The aim of commercial quality regulation is to define obligatory minimum standards, applied at the national level, for the services requested by customers. The commercial quality standards, which apply to all distributors, express the maximum times envisaged for service provision and are intended to protect customers and improve the system as a whole.
Since 1 July 2000 services have been subject to guaranteed and overall standards defined by the Authority. These were up‐dated in 2004 and 2007, when the four‐yearly review of the regulations took place.
Customers requesting a service subject to guaranteed standards are informed by the service provider of the maximum time required and the automatic compensation envisaged if the standard is not met. At least once a year, the operator must inform all customers receiving the “enhanced protection” service of the guaranteed quality standards and the results actually achieved by the distributor during the previous year. This information is provided in the bill.
Each year, as part of its service quality survey, the Authority publishes the average time actually taken to provide a service, as declared by the distribution companies. It also publishes the verification parameters for the standards (percentage of cases not complying with the standard for reasons attributable to the distributor, excluding cases of force majeure and third‐party liability); the number of automatic compensation payments made to customers over the year; and the total amount paid out.
Automatic compensation for customers in the event of failure to comply with guaranteed quality standards for causes attributable to distributors (excluding cases caused by force majeure, third parties or customers themselves) were introduced in the second half of 2000. The number of compensation payments increased from then until 2007, after which it began to fall off. 2010 again saw a decrease in the number of cases of failure to meet the standards subject to automatic compensation.
Compared with the previous year, the number of cases of failure to respect the standard was halved – a significant result. The total paid out in compensation also decreased, to around 1 million euros. These data can be explained by performance improvements by distribution companies, which are responding increasingly promptly to consumers’ requirements.
An examination of each individual service governed by the commercial quality regulations shows that most cases of failure to respect the guaranteed standards recorded in 2010 concern voltage checks and the punctuality band for postponed customer appointments. These account for around 2% of all services. The percentage of failures to respect the standards was lower than the previous year for the execution of minor works, reconnection after settlement of payment defaults, and re‐activation after faults affecting metering units. In the case of quotes for simple works, activation and disconnection of supply, and meter checks, the values showed a slight increase but continue to be very low.
The reduction in the time required for services showing the best performance (e.g. activation and disconnection, re‐activation after settlement of payment defaults) was one benefit deriving from the roll‐out of electronic meters and remote control systems. Conversely, services requiring on‐site intervention (those linked to technical checks (voltage supply or metering unit checks) or the execution of works) showed longer average delivery times.
Since 1 July 2009, two new guaranteed standards applicable to distributors have been in force for the provision of the technical data required by sellers (requests for technical data available through meter readings and for other technical data). These standards were introduced to ensure compliance with the Testo integrato della regolazione della qualità dei servizi di vendita di energia
3.Regulation and performance of the electricity market 31/07/2011
The Italian Regulatory Authority for Electricity and Gas (AEEG) Page 22 of 106
elettrica e di gas naturale (service quality code for the electricity and natural gas services), which envisages that sellers should be the only customer care interface for consumers.
The services have differentiated guaranteed standards, depending on whether the seller’s request concerns meter readings or other technical data. In the event of failure to comply with the standard for causes other than force majeure or third parties, the distributor must pay the seller an automatic compensation. The actual average times recorded in 2010 were lower than required by the standards and the number of compensation payments was extremely small, compared with total data requests.
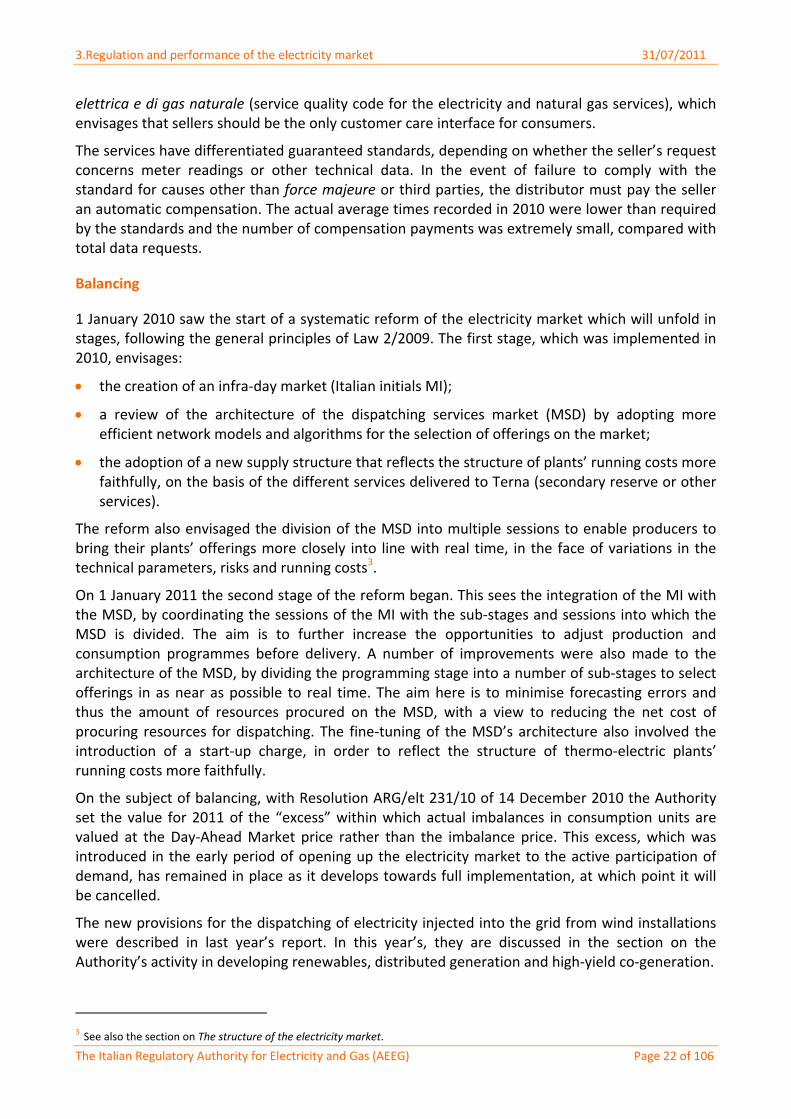
Balancing
1 January 2010 saw the start of a systematic reform of the electricity market which will unfold in stages, following the general principles of Law 2/2009. The first stage, which was implemented in 2010, envisages:
the creation of an infra‐day market (Italian initials MI);
a review of the architecture of the dispatching services market (MSD) by adopting more efficient network models and algorithms for the selection of offerings on the market;
the adoption of a new supply structure that reflects the structure of plants’ running costs more faithfully, on the basis of the different services delivered to Terna (secondary reserve or other services).
The reform also envisaged the division of the MSD into multiple sessions to enable producers to bring their plants’ offerings more closely into line with real time, in the face of variations in the technical parameters, risks and running costs3.
On 1 January 2011 the second stage of the reform began. This sees the integration of the MI with the MSD, by coordinating the sessions of the MI with the sub‐stages and sessions into which the MSD is divided. The aim is to further increase the opportunities to adjust production and consumption programmes before delivery. A number of improvements were also made to the architecture of the MSD, by dividing the programming stage into a number of sub‐stages to select offerings in as near as possible to real time. The aim here is to minimise forecasting errors and thus the amount of resources procured on the MSD, with a view to reducing the net cost of procuring resources for dispatching. The fine‐tuning of the MSD’s architecture also involved the introduction of a start‐up charge, in order to reflect the structure of thermo‐electric plants’ running costs more faithfully.
On the subject of balancing, with Resolution ARG/elt 231/10 of 14 December 2010 the Authority set the value for 2011 of the “excess” within which actual imbalances in consumption units are valued at the Day‐Ahead Market price rather than the imbalance price. This excess, which was introduced in the early period of opening up the electricity market to the active participation of demand, has remained in place as it develops towards full implementation, at which point it will be cancelled.
The new provisions for the dispatching of electricity injected into the grid from wind installations were described in last year’s report. In this year’s, they are discussed in the section on the Authority’s activity in developing renewables, distributed generation and high‐yield co‐generation.
3 See also the section on The structure of the electricity market.
3.Regulation and performance of the electricity market 31/07/2011
The Italian Regulatory Authority for Electricity and Gas (AEEG) Page 23 of 106
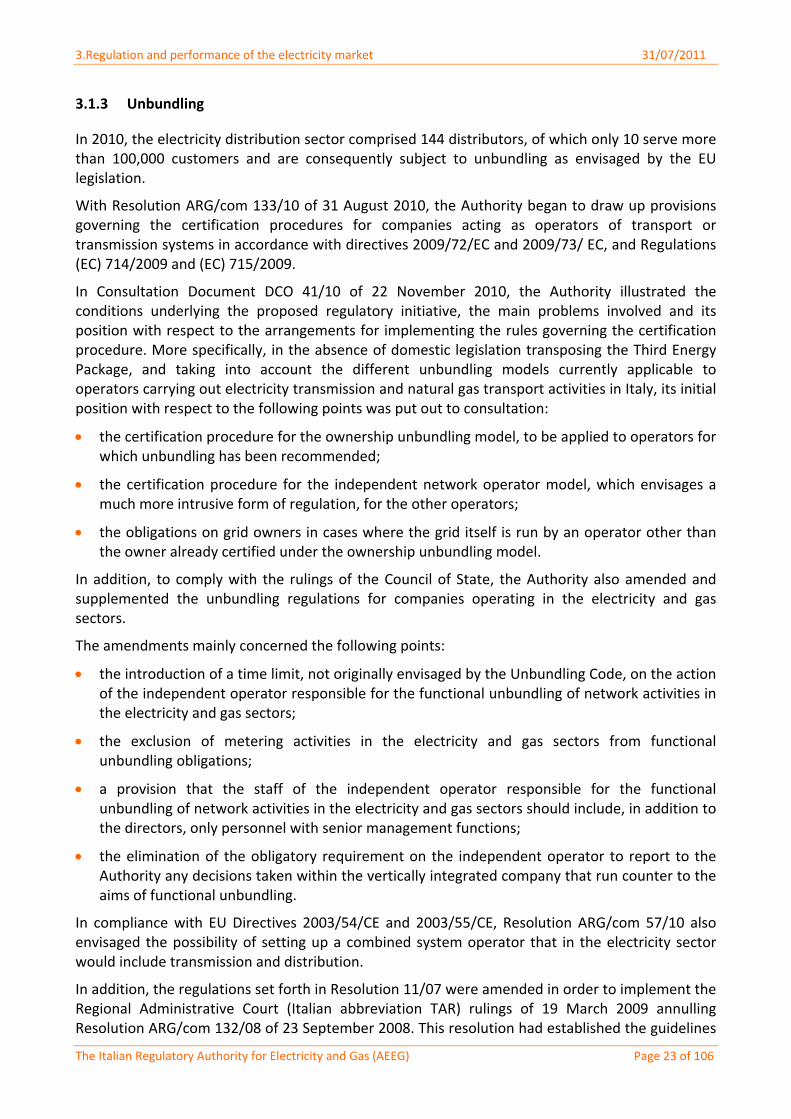
3.1.3 Unbundling
In 2010, the electricity distribution sector comprised 144 distributors, of which only 10 serve more than 100,000 customers and are consequently subject to unbundling as envisaged by the EU legislation.
With Resolution ARG/com 133/10 of 31 August 2010, the Authority began to draw up provisions governing the certification procedures for companies acting as operators of transport or transmission systems in accordance with directives 2009/72/EC and 2009/73/ EC, and Regulations (EC) 714/2009 and (EC) 715/2009.
In Consultation Document DCO 41/10 of 22 November 2010, the Authority illustrated the conditions underlying the proposed regulatory initiative, the main problems involved and its position with respect to the arrangements for implementing the rules governing the certification procedure. More specifically, in the absence of domestic legislation transposing the Third Energy Package, and taking into account the different unbundling models currently applicable to operators carrying out electricity transmission and natural gas transport activities in Italy, its initial position with respect to the following points was put out to consultation:
the certification procedure for the ownership unbundling model, to be applied to operators for which unbundling has been recommended;
the certification procedure for the independent network operator model, which envisages a much more intrusive form of regulation, for the other operators;
the obligations on grid owners in cases where the grid itself is run by an operator other than the owner already certified under the ownership unbundling model.
In addition, to comply with the rulings of the Council of State, the Authority also amended and supplemented the unbundling regulations for companies operating in the electricity and gas sectors.
The amendments mainly concerned the following points:
the introduction of a time limit, not originally envisaged by the Unbundling Code, on the action of the independent operator responsible for the functional unbundling of network activities in the electricity and gas sectors;
the exclusion of metering activities in the electricity and gas sectors from functional unbundling obligations;
a provision that the staff of the independent operator responsible for the functional unbundling of network activities in the electricity and gas sectors should include, in addition to the directors, only personnel with senior management functions;
the elimination of the obligatory requirement on the independent operator to report to the Authority any decisions taken within the vertically integrated company that run counter to the aims of functional unbundling.
In compliance with EU Directives 2003/54/CE and 2003/55/CE, Resolution ARG/com 57/10 also envisaged the possibility of setting up a combined system operator that in the electricity sector would include transmission and distribution.
In addition, the regulations set forth in Resolution 11/07 were amended in order to implement the Regional Administrative Court (Italian abbreviation TAR) rulings of 19 March 2009 annulling Resolution ARG/com 132/08 of 23 September 2008. This resolution had established the guidelines
3.Regulation and performance of the electricity market 31/07/2011
The Italian Regulatory Authority for Electricity and Gas (AEEG) Page 24 of 106
for independent operators to draw up their programme of functional unbundling procedures. As a result of the TAR ruling, when drawing up their programmes companies will not be required to follow the guidelines dictated by the Authority.
3.2 Competition
3.2.1 Description of the wholesale electricity market
In 2010, after a sharp contraction the previous year, demand for electricity saw an upturn as the Italian economy began a modest recovery. According to the (provisional) data published by the national transmission system operator (TSO), demand in 2010 reached 326.2 TWh, a 1.8% increase on 2009. Demand levels remained much lower than before the crisis, however, with the peak‐time power capacity requirement about 13 TWh down on the 2008 level.
Peak power demand was reached in July, at 56.4 GW.
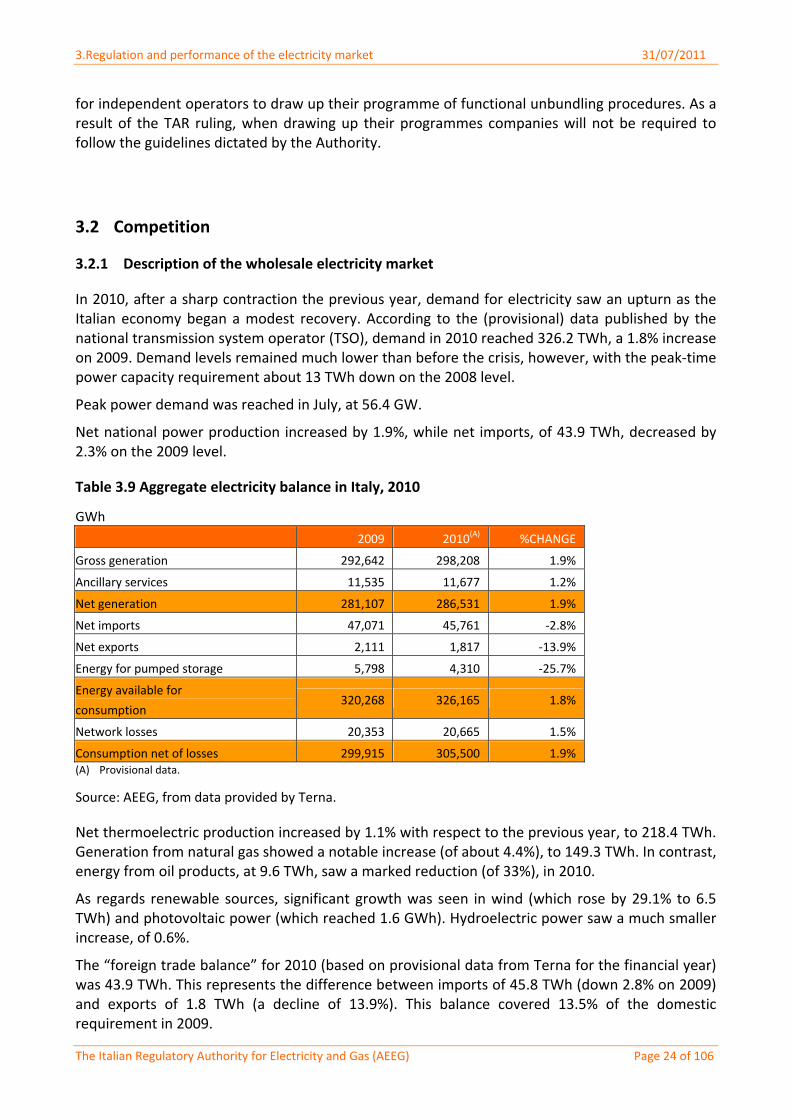
Net national power production increased by 1.9%, while net imports, of 43.9 TWh, decreased by 2.3% on the 2009 level.
Table 3.9 Aggregate electricity balance in Italy, 2010
GWh
2009 2010(A) %CHANGE
Gross generation 292,642 298,208 1.9%
Ancillary services 11,535 11,677 1.2%
Net generation 281,107 286,531 1.9%
Net imports 47,071 45,761 ‐2.8%
Net exports 2,111 1,817 ‐13.9%
Energy for pumped storage 5,798 4,310 ‐25.7%
Energy available for
consumption 320,268 326,165 1.8%
Network losses 20,353 20,665 1.5%
Consumption net of losses 299,915 305,500 1.9% (A) Provisional data.
Source: AEEG, from data provided by Terna.
Net thermoelectric production increased by 1.1% with respect to the previous year, to 218.4 TWh. Generation from natural gas showed a notable increase (of about 4.4%), to 149.3 TWh. In contrast, energy from oil products, at 9.6 TWh, saw a marked reduction (of 33%), in 2010.
As regards renewable sources, significant growth was seen in wind (which rose by 29.1% to 6.5 TWh) and photovoltaic power (which reached 1.6 GWh). Hydroelectric power saw a much smaller increase, of 0.6%.
The “foreign trade balance” for 2010 (based on provisional data from Terna for the financial year) was 43.9 TWh. This represents the difference between imports of 45.8 TWh (down 2.8% on 2009) and exports of 1.8 TWh (a decline of 13.9%). This balance covered 13.5% of the domestic requirement in 2009.
3.Regulation and performance of the electricity market 31/07/2011
The Italian Regulatory Authority for Electricity and Gas (AEEG) Page 25 of 106
The reduction in imports in 2010 was linked to the strong contraction in energy from Switzerland (down 1.9 TWh) and, to a lesser degree, from France (down 265 GWh). Imports from Slovenia, on the other hand, increased by 703 GWh.
Turning to exports, the decline in electricity flows mainly affected trade with Greece (which fell by 222 GWh) and with France (down 126 GWh).
In terms of net domestic electricity generation, the Enel group’s market share declined from 29.8% in 2009 to 27.9% in 2010. Of the four main competitors, Edison (11.0%) and ENI (10.0%) essentially retained their market share. E.On (5.7%) and Edipower (5.5%) saw their share of the market shrink, to the advantage of other medium‐sized operators and smaller producers.
The Herfindahl‐Hirschman Index (HHI) for net production shows a further reduction in market concentration, from 1,240 in 2009 to 1,119 in 2010.
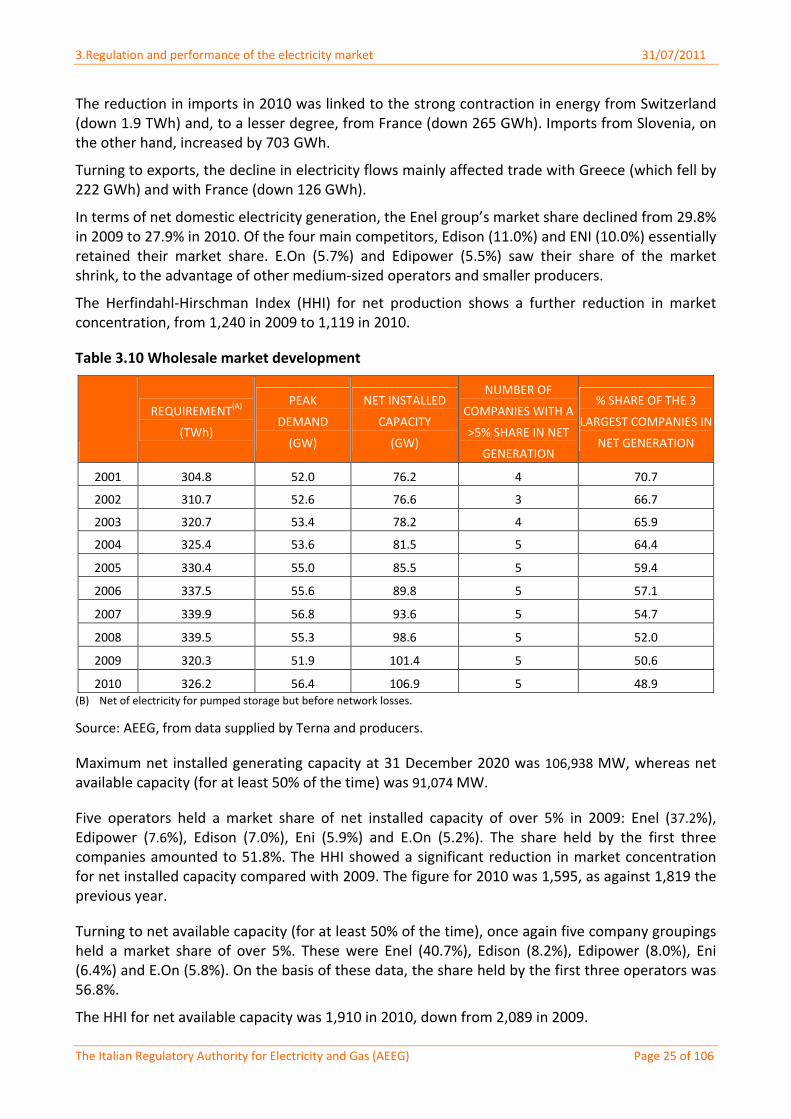
Table 3.10 Wholesale market development
REQUIREMENT(A)
(TWh)
PEAK
DEMAND
(GW)
NET INSTALLED
CAPACITY
(GW)
NUMBER OF
COMPANIES WITH A
>5% SHARE IN NET
GENERATION
% SHARE OF THE 3
LARGEST COMPANIES IN
NET GENERATION
2001 304.8 52.0 76.2 4 70.7
2002 310.7 52.6 76.6 3 66.7
2003 320.7 53.4 78.2 4 65.9
2004 325.4 53.6 81.5 5 64.4
2005 330.4 55.0 85.5 5 59.4
2006 337.5 55.6 89.8 5 57.1
2007 339.9 56.8 93.6 5 54.7
2008 339.5 55.3 98.6 5 52.0
2009 320.3 51.9 101.4 5 50.6
2010 326.2 56.4 106.9 5 48.9 (B) Net of electricity for pumped storage but before network losses.
Source: AEEG, from data supplied by Terna and producers.
Maximum net installed generating capacity at 31 December 2020 was 106,938 MW, whereas net available capacity (for at least 50% of the time) was 91,074 MW.
Five operators held a market share of net installed capacity of over 5% in 2009: Enel (37.2%), Edipower (7.6%), Edison (7.0%), Eni (5.9%) and E.On (5.2%). The share held by the first three companies amounted to 51.8%. The HHI showed a significant reduction in market concentration for net installed capacity compared with 2009. The figure for 2010 was 1,595, as against 1,819 the previous year.
Turning to net available capacity (for at least 50% of the time), once again five company groupings held a market share of over 5%. These were Enel (40.7%), Edison (8.2%), Edipower (8.0%), Eni (6.4%) and E.On (5.8%). On the basis of these data, the share held by the first three operators was 56.8%.
The HHI for net available capacity was 1,910 in 2010, down from 2,089 in 2009.
3.Regulation and performance of the electricity market 31/07/2011
The Italian Regulatory Authority for Electricity and Gas (AEEG) Page 26 of 106
Electricity market structure
Electricity trading for the purposes of better planning of generating and consumption units can be conducted through forward or spot contracts.
The spot market (MPE) is composed of:
the Day‐Ahead Market (MGP), where electricity is traded for the following day, and the Infra‐Day Market (MI), in which operators can adjust their sales and purchase bids/offers and commercial positions with respect to trading on the MGP;
the dispatching services market (MSD), in which Terna (TSO) procures the resources needed to manage and control the system in order to resolve intra‐zone congestions, create the energy reserve and balance the system in real‐time.
The MI, set up through Law 2 of 28 January 2009, began operating in November 2009, replacing the Adjustment Market (MA). Throughout 2010 the MI was divided into two sessions (MI1 and MI2), with different successive closing times. A further two were added in January 2011, with negotiations closing on the delivery day.
Law 2/2009 also made changes, which came into force on 1 January 2010, to the MSD. Under the provisions of Art. 5 of the Ministry for the Economy’s decree of 29 April 2009, these changes envisage that the MSD will continue to be divided into two stages, a planning and a balancing (MB) stage. Other innovations include:
the possibility, during each session, to specify a different price for each of the services offered (power reserve, congestion resolution and real‐time balancing)
the sub‐division of the MB into 5 consecutive sessions on the day to which offers refer. In the first session, offers made by operators at the MSD planning stage are taken into consideration; in the following 4 sessions, operators have the opportunity to adjust their positions on the market up to 90 minutes before the first trading hour.
The MTE is the forum for negotiating forward contracts envisaging an obligation to deliver/withdraw electricity. Negotiations take place continuously and concern two types of contract, baseload and peakload, which can be negotiated on monthly, quarterly or annual delivery periods.
In November 2008 the Italian Stock Exchange (Borsa Italiana) inaugurated the market for derivative financial instruments on the Italian Derivatives Electricity Exchange (IDEX). This is dedicated to the trading of instruments based on the average purchase price (Single National Price – PUN). In implementation of the Ministry for Economic Development’s decree of 29 April 2009, the GME entered into a collaboration agreement with Borsa Italiana to enable operators taking part in both markets to regulate, through physical delivery, the financial contracts concluded on the IDEX. The physical delivery option can be exercised on the third open Exchange day prior to the month of delivery with reference to the position gained by the operator on the IDEX for the following month.
Lastly, operators can buy and sell electricity not just through the market organised by the GME but also by entering into sales contracts outwith the bidding system. The Forward Market Accounting Platform (PCE), for the recording of bilateral contracts, began operating in May 2007.
As regards market participation, the number of operators listed on the GME rose to a new peak of 202 in 2010, up 41 on the previous year. This growth was mainly seen on the MGP, which has 134 active operators (up 18) and on the MI, where offers were submitted by 69 operators (up 16).
3.Regulation and performance of the electricity market 31/07/2011
The Italian Regulatory Authority for Electricity and Gas (AEEG) Page 27 of 106
With 23 operators (up 3), participation on the MSD showed a slight upturn. The same applied to the PCE, where the negative trend seen in the two previous years was reversed, with the number of active operators rising to 95 (up 7).
Only participation in the MTE remained stable, with the number of active operators settling at a similar level to 2009 (15, as against 16).
Day‐Ahead Market
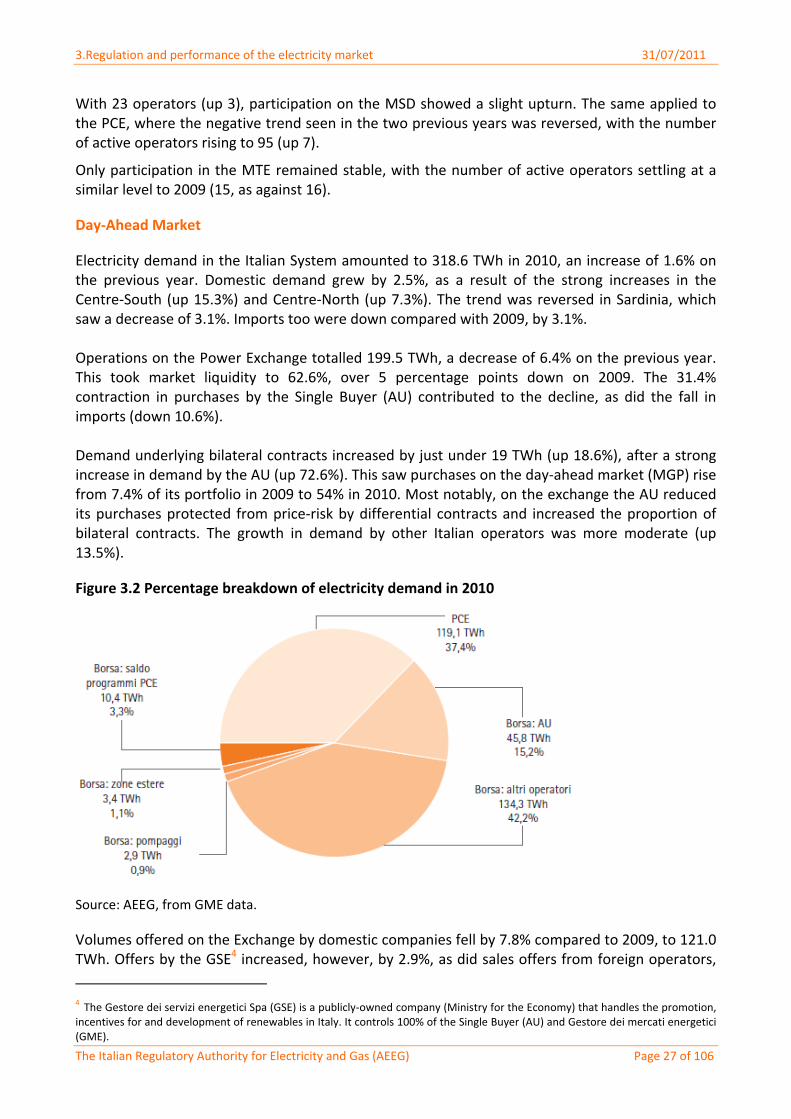
Electricity demand in the Italian System amounted to 318.6 TWh in 2010, an increase of 1.6% on the previous year. Domestic demand grew by 2.5%, as a result of the strong increases in the Centre‐South (up 15.3%) and Centre‐North (up 7.3%). The trend was reversed in Sardinia, which saw a decrease of 3.1%. Imports too were down compared with 2009, by 3.1%. Operations on the Power Exchange totalled 199.5 TWh, a decrease of 6.4% on the previous year. This took market liquidity to 62.6%, over 5 percentage points down on 2009. The 31.4% contraction in purchases by the Single Buyer (AU) contributed to the decline, as did the fall in imports (down 10.6%). Demand underlying bilateral contracts increased by just under 19 TWh (up 18.6%), after a strong increase in demand by the AU (up 72.6%). This saw purchases on the day‐ahead market (MGP) rise from 7.4% of its portfolio in 2009 to 54% in 2010. Most notably, on the exchange the AU reduced its purchases protected from price‐risk by differential contracts and increased the proportion of bilateral contracts. The growth in demand by other Italian operators was more moderate (up 13.5%).
Figure 3.2 Percentage breakdown of electricity demand in 2010
Source: AEEG, from GME data.
Volumes offered on the Exchange by domestic companies fell by 7.8% compared to 2009, to 121.0 TWh. Offers by the GSE4 increased, however, by 2.9%, as did sales offers from foreign operators,
4 The Gestore dei servizi energetici Spa (GSE) is a publicly‐owned company (Ministry for the Economy) that handles the promotion, incentives for and development of renewables in Italy. It controls 100% of the Single Buyer (AU) and Gestore dei mercati energetici (GME).
3.Regulation and performance of the electricity market 31/07/2011
The Italian Regulatory Authority for Electricity and Gas (AEEG) Page 28 of 106
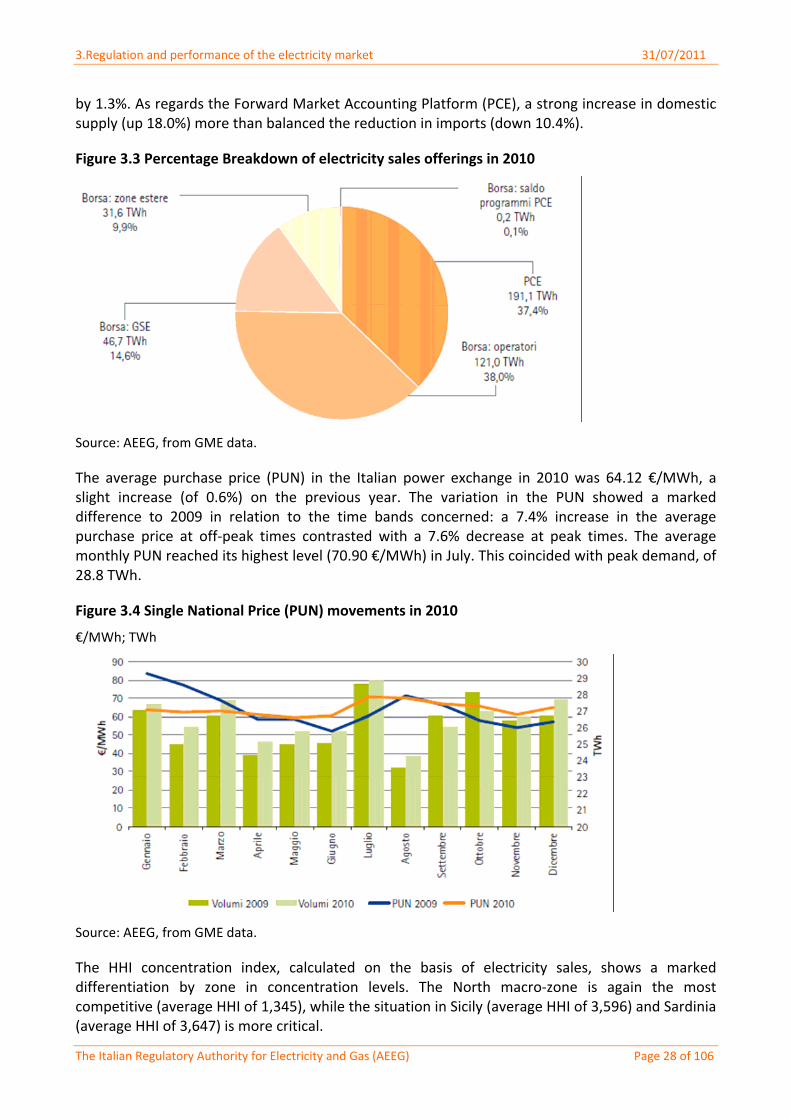
by 1.3%. As regards the Forward Market Accounting Platform (PCE), a strong increase in domestic supply (up 18.0%) more than balanced the reduction in imports (down 10.4%).
Figure 3.3 Percentage Breakdown of electricity sales offerings in 2010
Source: AEEG, from GME data.
The average purchase price (PUN) in the Italian power exchange in 2010 was 64.12 €/MWh, a slight increase (of 0.6%) on the previous year. The variation in the PUN showed a marked difference to 2009 in relation to the time bands concerned: a 7.4% increase in the average purchase price at off‐peak times contrasted with a 7.6% decrease at peak times. The average monthly PUN reached its highest level (70.90 €/MWh) in July. This coincided with peak demand, of 28.8 TWh.
Figure 3.4 Single National Price (PUN) movements in 2010
€/MWh; TWh
Source: AEEG, from GME data.
The HHI concentration index, calculated on the basis of electricity sales, shows a marked differentiation by zone in concentration levels. The North macro‐zone is again the most competitive (average HHI of 1,345), while the situation in Sicily (average HHI of 3,596) and Sardinia (average HHI of 3,647) is more critical.
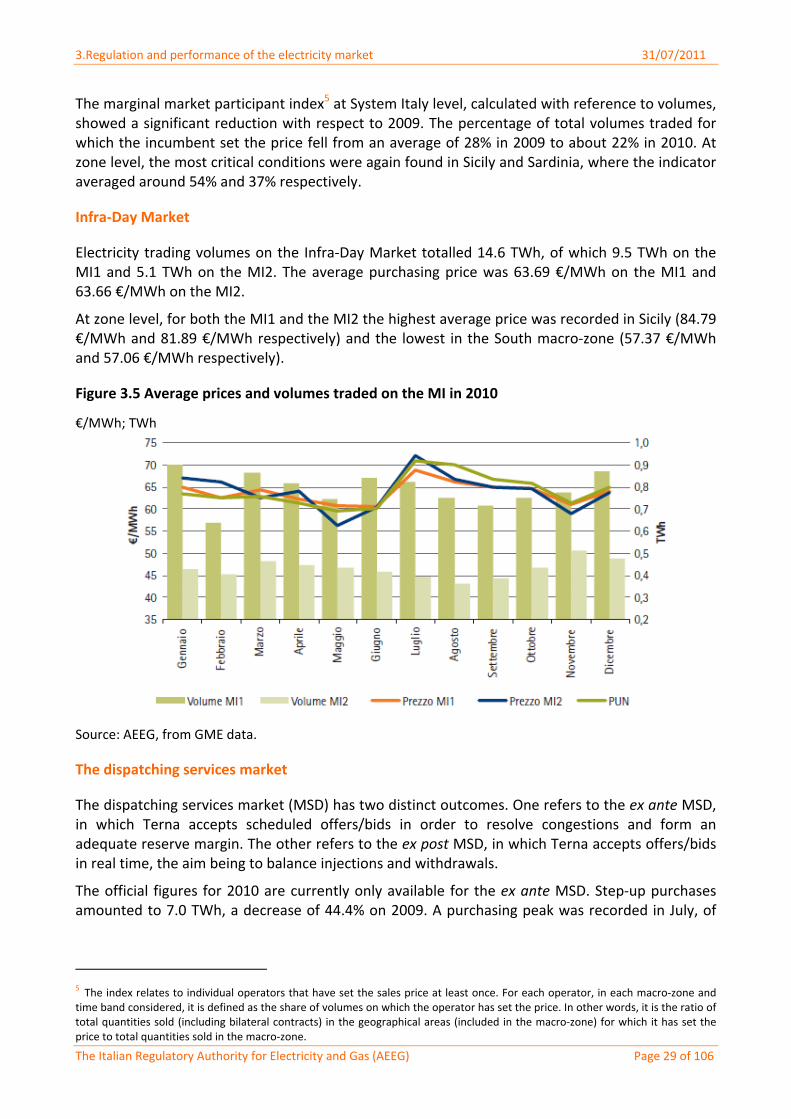
3.Regulation and performance of the electricity market 31/07/2011
The Italian Regulatory Authority for Electricity and Gas (AEEG) Page 29 of 106
The marginal market participant index5 at System Italy level, calculated with reference to volumes, showed a significant reduction with respect to 2009. The percentage of total volumes traded for which the incumbent set the price fell from an average of 28% in 2009 to about 22% in 2010. At zone level, the most critical conditions were again found in Sicily and Sardinia, where the indicator averaged around 54% and 37% respectively.
Infra‐Day Market
Electricity trading volumes on the Infra‐Day Market totalled 14.6 TWh, of which 9.5 TWh on the MI1 and 5.1 TWh on the MI2. The average purchasing price was 63.69 €/MWh on the MI1 and 63.66 €/MWh on the MI2.
At zone level, for both the MI1 and the MI2 the highest average price was recorded in Sicily (84.79 €/MWh and 81.89 €/MWh respectively) and the lowest in the South macro‐zone (57.37 €/MWh and 57.06 €/MWh respectively).
Figure 3.5 Average prices and volumes traded on the MI in 2010
€/MWh; TWh
Source: AEEG, from GME data.
The dispatching services market
The dispatching services market (MSD) has two distinct outcomes. One refers to the ex ante MSD, in which Terna accepts scheduled offers/bids in order to resolve congestions and form an adequate reserve margin. The other refers to the ex post MSD, in which Terna accepts offers/bids in real time, the aim being to balance injections and withdrawals.
The official figures for 2010 are currently only available for the ex ante MSD. Step‐up purchases amounted to 7.0 TWh, a decrease of 44.4% on 2009. A purchasing peak was recorded in July, of
5 The index relates to individual operators that have set the sales price at least once. For each operator, in each macro‐zone and time band considered, it is defined as the share of volumes on which the operator has set the price. In other words, it is the ratio of total quantities sold (including bilateral contracts) in the geographical areas (included in the macro‐zone) for which it has set the price to total quantities sold in the macro‐zone.
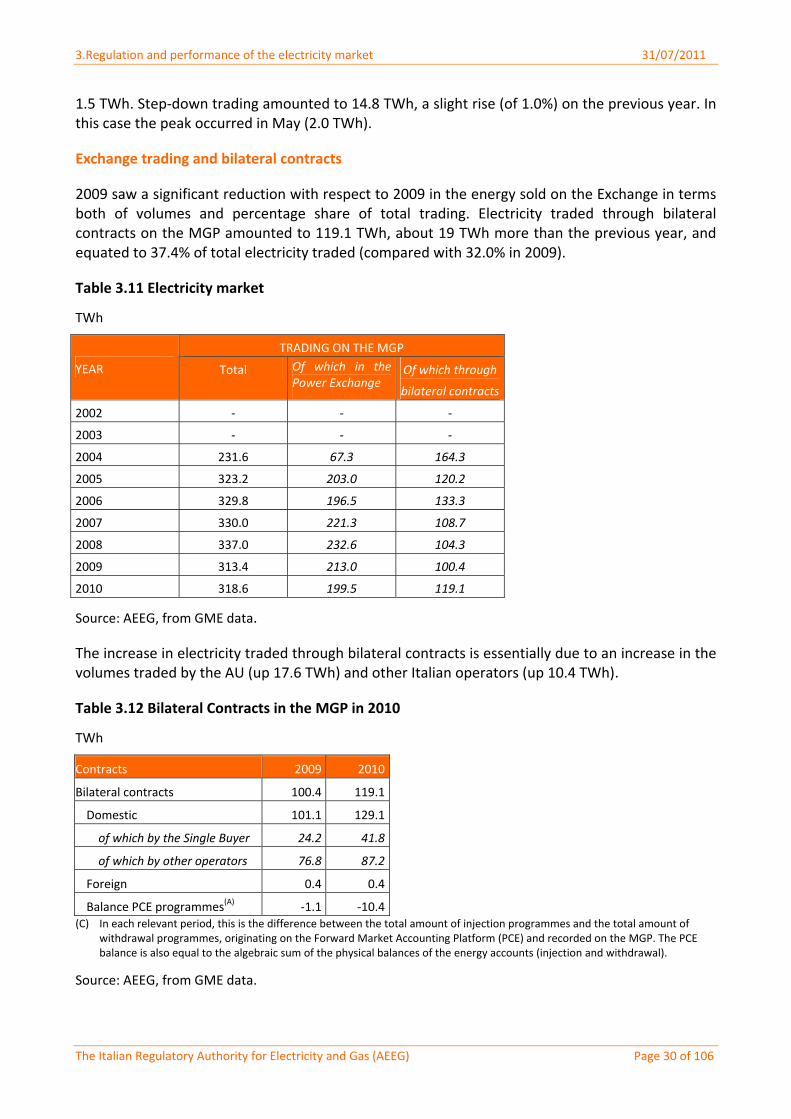
3.Regulation and performance of the electricity market 31/07/2011
The Italian Regulatory Authority for Electricity and Gas (AEEG) Page 30 of 106
1.5 TWh. Step‐down trading amounted to 14.8 TWh, a slight rise (of 1.0%) on the previous year. In this case the peak occurred in May (2.0 TWh).
Exchange trading and bilateral contracts
2009 saw a significant reduction with respect to 2009 in the energy sold on the Exchange in terms both of volumes and percentage share of total trading. Electricity traded through bilateral contracts on the MGP amounted to 119.1 TWh, about 19 TWh more than the previous year, and equated to 37.4% of total electricity traded (compared with 32.0% in 2009).
Table 3.11 Electricity market
TWh
TRADING ON THE MGP
YEAR Total Of which in the Power Exchange
Of which through
bilateral contracts
2002 ‐ ‐ ‐
2003 ‐ ‐ ‐
2004 231.6 67.3 164.3
2005 323.2 203.0 120.2
2006 329.8 196.5 133.3
2007 330.0 221.3 108.7
2008 337.0 232.6 104.3
2009 313.4 213.0 100.4
2010 318.6 199.5 119.1
Source: AEEG, from GME data.
The increase in electricity traded through bilateral contracts is essentially due to an increase in the volumes traded by the AU (up 17.6 TWh) and other Italian operators (up 10.4 TWh).
Table 3.12 Bilateral Contracts in the MGP in 2010
TWh
Contracts 2009 2010
Bilateral contracts 100.4 119.1
Domestic 101.1 129.1
of which by the Single Buyer 24.2 41.8
of which by other operators 76.8 87.2
Foreign 0.4 0.4
Balance PCE programmes(A) ‐1.1 ‐10.4(C) In each relevant period, this is the difference between the total amount of injection programmes and the total amount of
withdrawal programmes, originating on the Forward Market Accounting Platform (PCE) and recorded on the MGP. The PCE balance is also equal to the algebraic sum of the physical balances of the energy accounts (injection and withdrawal).
Source: AEEG, from GME data.
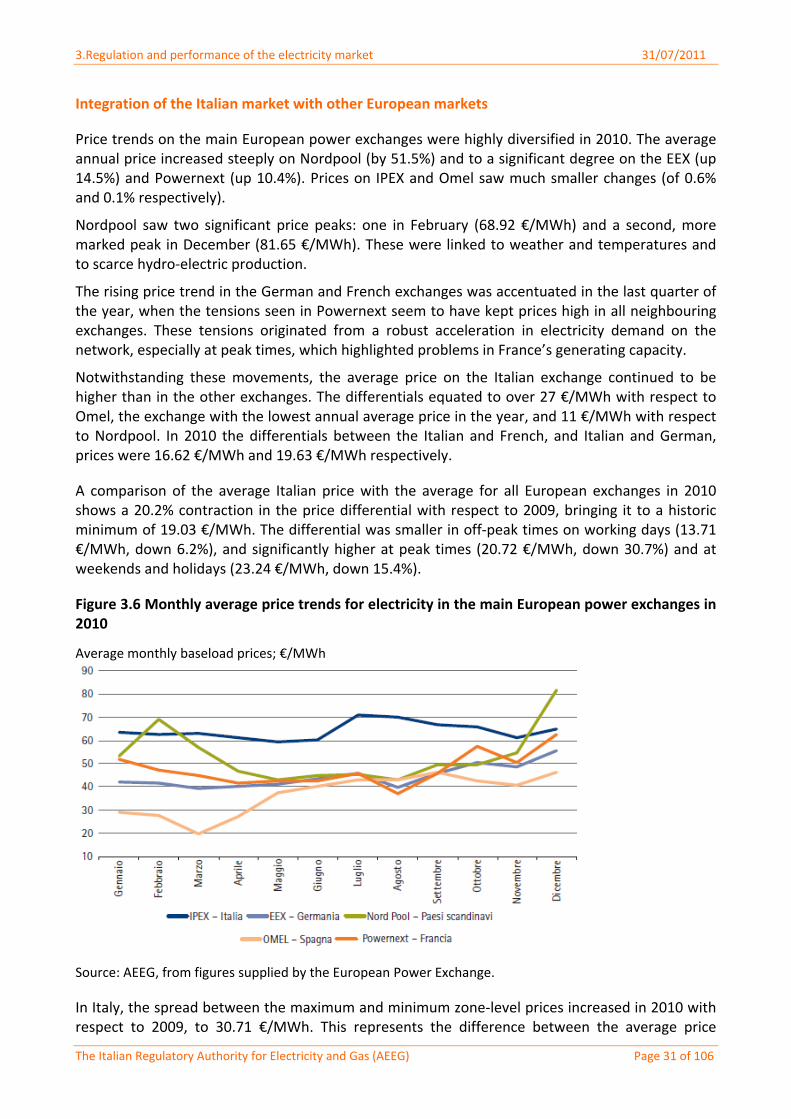
3.Regulation and performance of the electricity market 31/07/2011
The Italian Regulatory Authority for Electricity and Gas (AEEG) Page 31 of 106
Integration of the Italian market with other European markets
Price trends on the main European power exchanges were highly diversified in 2010. The average annual price increased steeply on Nordpool (by 51.5%) and to a significant degree on the EEX (up 14.5%) and Powernext (up 10.4%). Prices on IPEX and Omel saw much smaller changes (of 0.6% and 0.1% respectively).
Nordpool saw two significant price peaks: one in February (68.92 €/MWh) and a second, more marked peak in December (81.65 €/MWh). These were linked to weather and temperatures and to scarce hydro‐electric production.
The rising price trend in the German and French exchanges was accentuated in the last quarter of the year, when the tensions seen in Powernext seem to have kept prices high in all neighbouring exchanges. These tensions originated from a robust acceleration in electricity demand on the network, especially at peak times, which highlighted problems in France’s generating capacity.
Notwithstanding these movements, the average price on the Italian exchange continued to be higher than in the other exchanges. The differentials equated to over 27 €/MWh with respect to Omel, the exchange with the lowest annual average price in the year, and 11 €/MWh with respect to Nordpool. In 2010 the differentials between the Italian and French, and Italian and German, prices were 16.62 €/MWh and 19.63 €/MWh respectively.
A comparison of the average Italian price with the average for all European exchanges in 2010 shows a 20.2% contraction in the price differential with respect to 2009, bringing it to a historic minimum of 19.03 €/MWh. The differential was smaller in off‐peak times on working days (13.71 €/MWh, down 6.2%), and significantly higher at peak times (20.72 €/MWh, down 30.7%) and at weekends and holidays (23.24 €/MWh, down 15.4%).
Figure 3.6 Monthly average price trends for electricity in the main European power exchanges in 2010
Average monthly baseload prices; €/MWh
Source: AEEG, from figures supplied by the European Power Exchange.
In Italy, the spread between the maximum and minimum zone‐level prices increased in 2010 with respect to 2009, to 30.71 €/MWh. This represents the difference between the average price
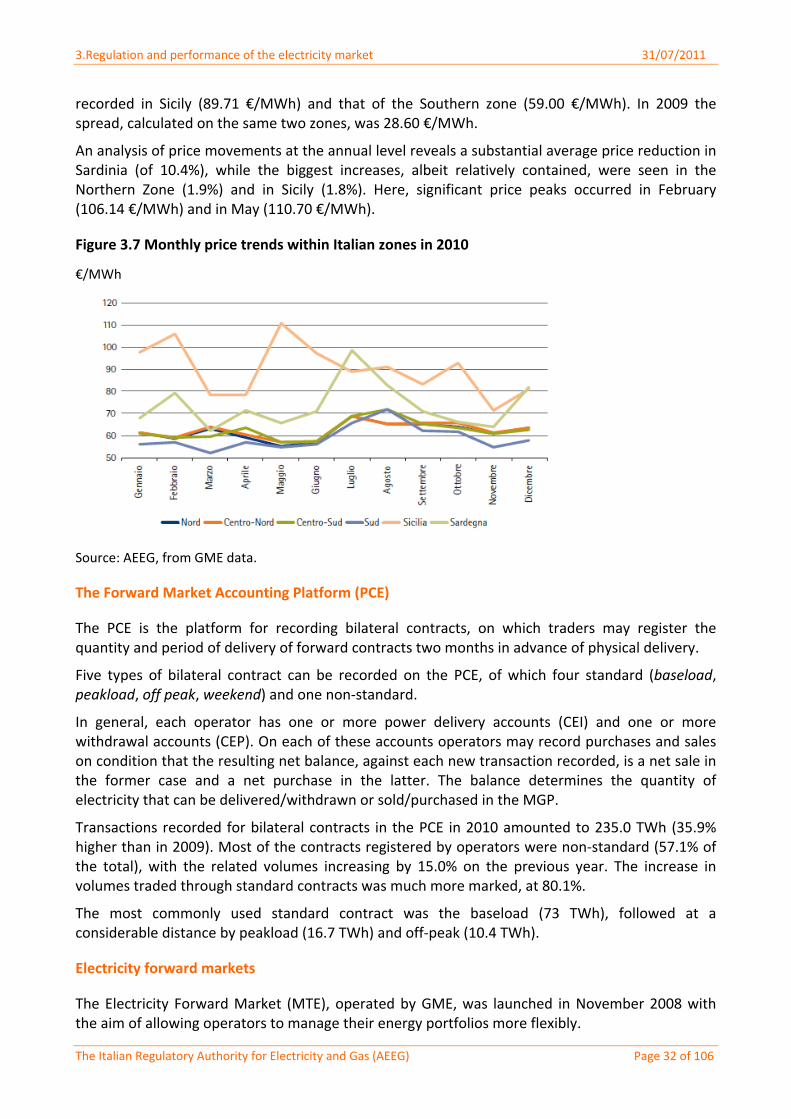
3.Regulation and performance of the electricity market 31/07/2011
The Italian Regulatory Authority for Electricity and Gas (AEEG) Page 32 of 106
recorded in Sicily (89.71 €/MWh) and that of the Southern zone (59.00 €/MWh). In 2009 the spread, calculated on the same two zones, was 28.60 €/MWh.
An analysis of price movements at the annual level reveals a substantial average price reduction in Sardinia (of 10.4%), while the biggest increases, albeit relatively contained, were seen in the Northern Zone (1.9%) and in Sicily (1.8%). Here, significant price peaks occurred in February (106.14 €/MWh) and in May (110.70 €/MWh).
Figure 3.7 Monthly price trends within Italian zones in 2010
€/MWh
Source: AEEG, from GME data.
The Forward Market Accounting Platform (PCE)
The PCE is the platform for recording bilateral contracts, on which traders may register the quantity and period of delivery of forward contracts two months in advance of physical delivery.
Five types of bilateral contract can be recorded on the PCE, of which four standard (baseload, peakload, off peak, weekend) and one non‐standard.
In general, each operator has one or more power delivery accounts (CEI) and one or more withdrawal accounts (CEP). On each of these accounts operators may record purchases and sales on condition that the resulting net balance, against each new transaction recorded, is a net sale in the former case and a net purchase in the latter. The balance determines the quantity of electricity that can be delivered/withdrawn or sold/purchased in the MGP.
Transactions recorded for bilateral contracts in the PCE in 2010 amounted to 235.0 TWh (35.9% higher than in 2009). Most of the contracts registered by operators were non‐standard (57.1% of the total), with the related volumes increasing by 15.0% on the previous year. The increase in volumes traded through standard contracts was much more marked, at 80.1%.
The most commonly used standard contract was the baseload (73 TWh), followed at a considerable distance by peakload (16.7 TWh) and off‐peak (10.4 TWh).
Electricity forward markets
The Electricity Forward Market (MTE), operated by GME, was launched in November 2008 with the aim of allowing operators to manage their energy portfolios more flexibly.
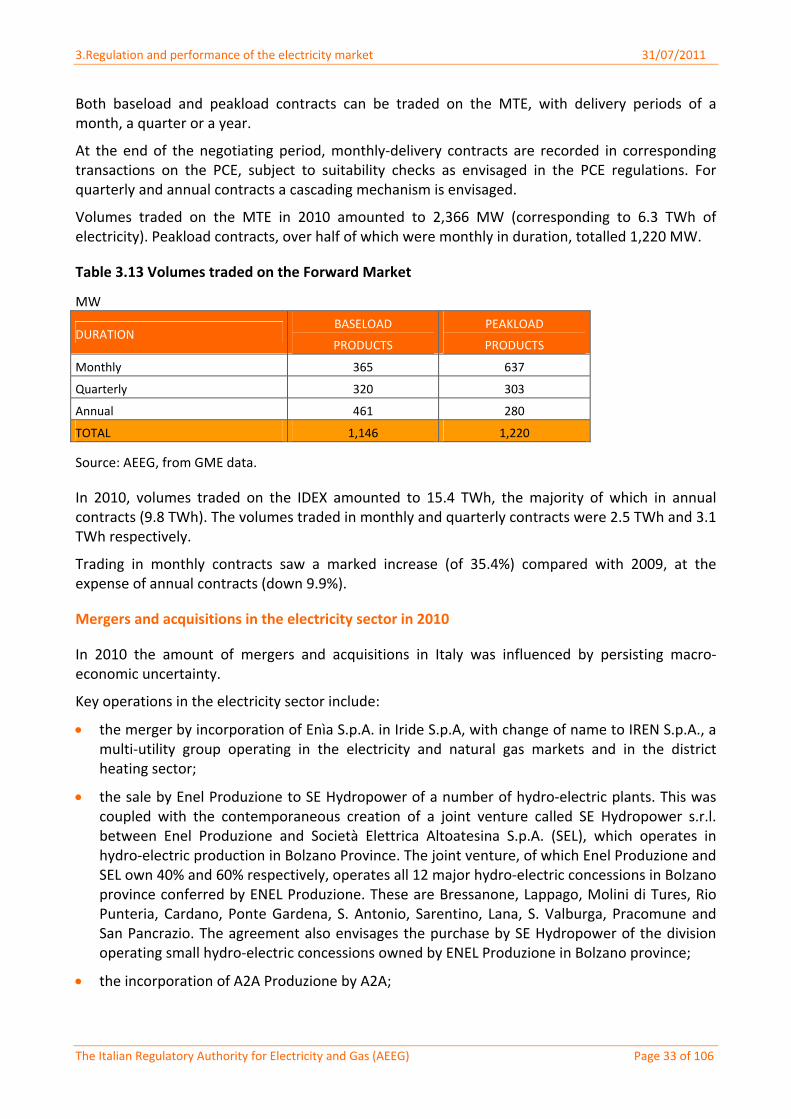
3.Regulation and performance of the electricity market 31/07/2011
The Italian Regulatory Authority for Electricity and Gas (AEEG) Page 33 of 106
Both baseload and peakload contracts can be traded on the MTE, with delivery periods of a month, a quarter or a year.
At the end of the negotiating period, monthly‐delivery contracts are recorded in corresponding transactions on the PCE, subject to suitability checks as envisaged in the PCE regulations. For quarterly and annual contracts a cascading mechanism is envisaged.
Volumes traded on the MTE in 2010 amounted to 2,366 MW (corresponding to 6.3 TWh of electricity). Peakload contracts, over half of which were monthly in duration, totalled 1,220 MW.
Table 3.13 Volumes traded on the Forward Market
MW
DURATION BASELOAD
PRODUCTS
PEAKLOAD
PRODUCTS
Monthly 365 637
Quarterly 320 303
Annual 461 280
TOTAL 1,146 1,220
Source: AEEG, from GME data.
In 2010, volumes traded on the IDEX amounted to 15.4 TWh, the majority of which in annual contracts (9.8 TWh). The volumes traded in monthly and quarterly contracts were 2.5 TWh and 3.1 TWh respectively.
Trading in monthly contracts saw a marked increase (of 35.4%) compared with 2009, at the expense of annual contracts (down 9.9%).
Mergers and acquisitions in the electricity sector in 2010
In 2010 the amount of mergers and acquisitions in Italy was influenced by persisting macro‐economic uncertainty.
Key operations in the electricity sector include:
the merger by incorporation of Enìa S.p.A. in Iride S.p.A, with change of name to IREN S.p.A., a multi‐utility group operating in the electricity and natural gas markets and in the district heating sector;
the sale by Enel Produzione to SE Hydropower of a number of hydro‐electric plants. This was coupled with the contemporaneous creation of a joint venture called SE Hydropower s.r.l. between Enel Produzione and Società Elettrica Altoatesina S.p.A. (SEL), which operates in hydro‐electric production in Bolzano Province. The joint venture, of which Enel Produzione and SEL own 40% and 60% respectively, operates all 12 major hydro‐electric concessions in Bolzano province conferred by ENEL Produzione. These are Bressanone, Lappago, Molini di Tures, Rio Punteria, Cardano, Ponte Gardena, S. Antonio, Sarentino, Lana, S. Valburga, Pracomune and San Pancrazio. The agreement also envisages the purchase by SE Hydropower of the division operating small hydro‐electric concessions owned by ENEL Produzione in Bolzano province;
the incorporation of A2A Produzione by A2A;
3.Regulation and performance of the electricity market 31/07/2011
The Italian Regulatory Authority for Electricity and Gas (AEEG) Page 34 of 106
the acquisition by E.On Climate & Renewables Italia of the following wind farms: Parco Eolico Marco Aurelio Severino, Parco Eolico Iardino, Parco Eolico Monte Cute, Parco Eolico Piano di Corda and Parco Eolico Serra Pelata;
the incorporation of Cofely Energia by Cofely Italia.
Activity of the Authority in the fields of renewable resources, distributed generation and high‐yield cogeneration
The Authority adopted numerous provisions in 2010 concerning the development of renewable sources. These were intended to introduce an incentive system for smart grids; rationalise network connection arrangements for generation plants; optimise dispatching for wind farms; establish the arrangements for delivering incentives for photovoltaic installations; and define the conditions to monitor and control the sale to consumers of electricity from renewable sources.
As regards smart grids, with Annex A of Resolution 348/07 of 29 December 2007, the Integrated Transmission Text (ITT), the Authority introduced an incentive system to encourage the development of electricity distribution networks. This aims to meet the binding objectives laid down by the European Union as part of the 20‐20‐20 climate and energy package.
Taking into account the projected substantial development of electricity production from renewables in coming years, distribution companies have been given the opportunity to obtain an additional 2% on the rate of return on invested capital for 12 years. The aim is to promote the introduction of innovative, smart technologies that are able to integrate the behaviour and actions of all users connected to the grid (generators, consumers and mixed points). Another aim is to ensure electricity supply in an efficient, sustainable and secure manner.
Under art. 11.7 of the ITT, the Authority defined the procedure and selection criteria for investments in smart grids, initially with Resolution ARG/elt 39/10 of 25 March 2010 as supplemented and amended by Resolution ARG/elt 148/10 of 24 September 2010, and subsequently with Resolution ARG/elt 191/10 of 2 November 2010.
Under this procedure, companies that had applied for the incentives were assessed through independent technical reports, drawn up by experts selected by the Authority, on the effectiveness and suitability of the proposed projects. The reports took into consideration the requirements envisaged by Resolution ARG/elt 39/10, and of the Guidelines previously set forth in Resolution 7/10 of 27 October 2010. More specifically, the evaluation examined the relationship between the benefits deriving from the implementation of the pilot project and the cost of the investments in smart grids. Starting from the results of these independent technical reports, with Resolution ARG/elt 12/11 of 8 February 2011 the Authority published a list ranking the applications and selected 8 out of the 9 projects as being eligible. It gave the excluded company the option of reformulating its project for the next evaluation.
Turning to production companies’ grid connections, with Resolution ARG/elt 125/10 of 4 August 2010 the Authority up‐dated the Integrated Text of Active Connections (TICA) and introduced new regulatory provisions to:
define initiatives to prevent transport capacity on the grids being occupied in cases where, after the proposal is accepted, the electricity generation plant is not actually built;
conduct a more detailed analysis of any procedures that were not previously regulated under the TICA, especially procedures concerning the coordination of grid operators;
3.Regulation and performance of the electricity market 31/07/2011
The Italian Regulatory Authority for Electricity and Gas (AEEG) Page 35 of 106
define and rationalise those procedures which, although not directly related to electricity production plants’ technical connection to the grid, are necessary for that connection to be activated. More specifically, a single “control panel” has been introduced. This was created and is operated by Terna as part of its project for a system to manage electricity generating plant registers (GAUDÌ).
define principles to ensure that the electricity system develops in a more rational manner in order to promote access to the network for existing electricity generation plants and those to be built in the future.
The most significant initiatives are those under the first point above: to prevent the occupation of transmission capacity when a proposed generating plant has been approved but not actually built. Numerous cases of operators booking capacity but not then installing the plant have been reported by the Authority in recent years. This is a true barrier to entry by new operators, some of which build their plant but are then subjected to a lengthy wait to obtain a connection, even though the grid is saturated in virtual terms only.
In this regard, before approving Resolution ARG/elt 125/10, in its consultation document DCO 15/10 of 25 May 2010 the Authority had proposed two alternative lines of intervention. One consisted of establishing a guarantee (deposit or bank surety) that operators would be required to submit to the grid operator in addition to paying the charges for submitting their proposal and creating the connection. During the consultation, this option was the preferred choice of nearly all the producers and grid operators taking part, since it was simpler and quicker to apply than the alternative, not least in light of the urgent need to take action.
On this basis, in Resolution ARG/elt 125/10 the Authority established a guarantee‐charge for grid‐capacity bookings. Payable to the grid operator an annual basis in the form of a bank surety or deposit, the charge was related to the duration of the period booked.
However, these initiatives were made ineffective by the suspension of the relevant sections of Resolution ARG/elt 125/10 following a provisional ruling by the Regional Administrative Court (TAR) of Lombardy. With Resolution ARG/elt 9/11 of 2 February 2011, the Authority suspended the charge for all those operators who had submitted or planned to submit connection applications, pending the outcome of any cases still before the TAR.
As regards dispatching for electricity injected to the grid by wind plants, in recent years the Authority has drawn up a series of provisions designed to optimise the use of the electricity grid. The aim here is to reduce overall dispatching costs by encouraging an increase in production from non‐programmable renewable sources and ensuring grid security.
Resolution ARG/elt 98/08 of 23 July 2008 had established that wind plants not yet operating and for which the detailed minimum technical specification had not yet been approved should be able to provide network services including the regulation of active and reactive power, protection from voltage dips and power reductions.
For other wind plants, Resolution ARG/elt 5/10 of 25 January 2010 defined procedures for the remuneration of the costs incurred by producers who voluntarily up‐grade their plants to supply one or more network services. With Resolution ARG/elt 207/10 of 22 November 2010, the Authority then gave Terna the task of defining the procedures to identify the units concerned, with a spending limit of 25 million euros. 5% of the actual expenditure is set against the bonuses due to Terna for procuring resources for dispatching services. The remainder is charged to consumers, through dispatching charges.
3.Regulation and performance of the electricity market 31/07/2011
The Italian Regulatory Authority for Electricity and Gas (AEEG) Page 36 of 106
Resolution ARG/elt 5/10 also introduced new incentives for the scheduling of large production units (i.e. with power equal to or greater than 10 MVA) fuelled by non‐programmable renewable sources. The aim here is to promote improvements in producers’ electricity injection forecasts and consequently reduce system costs.
For smaller production units, with ARG/elt 4/10 of 25 January 2010 the Authority assigned the task of making aggregate forecasts for each market zone to the GSE. The forecasts are produced from real‐time satellite data regarding source availability and consequent production levels. For these units, therefore, the cost of forecasting is not borne by producers because, under the current structure of the electricity system, this is the greatest benefit that can be obtained for the purpose of managing dispatching more efficiently.
At present, as a result of real, rather than virtual, grid saturation in some regions of Italy (especially in the Centre‐South), and to ensure the security of the electricity system, Terna can impose production cuts on wind plants. To safeguard the investments made in the renewables sector, in 2007 the Authority decided to remunerate the resulting “non‐production”. The new remuneration arrangements defined in 2010, again through Resolution ARG/elt 5/10, are based on the estimates drawn up by a third actor, the GSE. They use actual wind data measured in situ at the times when Terna asks for production cuts. A model simulating the operation of the wind plants concerned is also used.
The new formula to calculate “missing” wind power includes an index measuring dispatching users’ reliability in complying with the dispatching orders issued by Terna, without, however, contemplating that these orders might not be honoured.
Lastly, the formula to calculate non‐production also includes an excess, amounting to 80 equivalent hours per year, that is applied when the generation units are not sufficient to deliver the required network services. This does not affect the exemptions granted by Terna in cases where adjustments are not possible. Non‐production is remunerated at the hourly zone‐level price paid by Terna under the dispatching contract.
Turning to photovoltaic plants, in its Decree of 6 August 2010 the Ministry for Economic Development, in conjunction with the Ministry for the Environment and the Protection of the Territory and the Sea, introduced an incentive mechanism for plants starting operating from 1 January 2011 onwards. More specifically, art. 15 of the decree provides for the Authority to:
establish the arrangements, timescale and conditions for paying the incentive tariffs;
establish the arrangements to check on compliance with the provisions of the decree;
up‐date and supplement its own provisions concerning connections, especially as regards the compensation envisaged by art. 2.12 (g) of Law 481/1995 of 14 November 1985. This applies in cases where failure by the grid operator to respect the timescale for connections involves the loss of the right to a given incentive tariff;
determine the arrangements to ensure that the resources for the delivery of the incentive tariffs, and for the management of the activities envisaged by the decree, are covered by tariff component A3;
determine the arrangements for increasing the incentive tariff for systems with a predictable trading profile. This entails establishing the conditions and arrangements whereby the grid operator sends operators entitled to incentive tariffs the hourly data required for verification.
3.Regulation and performance of the electricity market 31/07/2011
The Italian Regulatory Authority for Electricity and Gas (AEEG) Page 37 of 106
With Resolution ARG/elt 181/10 of 20 October 2010, the Authority established the arrangements, timescale and conditions for the payment of the incentive tariffs, and for verifying that operators comply with the provisions of the decree.
In relation to the up‐dating and supplementing of its provisions governing connections, especially with respect to compensation and the application of the higher incentive tariff for systems with a foreseeable trading profile, on 20 October 2010 the Authority published consultation document DCO 34/10.
Following this consultation process, the Authority published Resolution ARG/elt 225/10 of 3 December 2010. This supplemented Resolution ARG/elt 181/10 by establishing the arrangements for calculating any compensation, in addition to that envisaged by the TICA, which the grid operator is required to pay to the operator concerned. If the delay attributable to the grid operator is of no more than 25 days, the refund takes the form of a top‐up to the automatic compensation payable under the TICA. If, on the other hand, the delay is longer than 25 days, the refund is proportional to the difference between the unit values of the incentive to which the operator was entitled and of the incentive actually received.
With consultation document DCO 26/09 of 27 July 2009, the Authority had set out a number of proposals to define the conditions for the control and monitoring of sales of electricity from renewable sources to consumers. Its aim was to identify the most appropriate market mechanisms to promote transparency and competition.
Following the publication of the Minister for Economic Development’s Decree of 31 July 2009, consultation document DCO 23/10 of 14 July 2010 proposed a number of instruments to monitor and control sales offerings for electricity produced from renewables.
These are designed to ensure that the same volume of generated electricity is not included in more than one sales offering. Another aim is to promote transparency and ensure additionality of a given offering of electricity produced from renewables in comparison to other commercial offerings that also include electricity produced from renewables, whose cost incentives are already borne, directly or indirectly, by consumers.
Lastly, it should be noted that the Authority has up‐dated the Electricity Production Code by bringing together in one document the regulations governing electricity production, with particular regard to renewable sources and high‐yield co‐generation. The Code also includes the main provisions adopted by the Authority in this area. The Authority’s intention in drawing up this document was to provide operators in the sector with a comprehensive and up‐to‐date guide to the current regulatory and legislative framework. The document is designed purely as an overview, its main purpose being to meet operators’ needs for information and explanatory material and in so doing respond to the requests submitted on numerous occasions by the many actors involved in electricity production.
3.2.2 Description of the retail electricity market
According to the provisional figures published by Terna, retail electricity sales in 2010 amounted to about 288 TWh, excluding self‐consumption and network losses. Total consumption, including self‐consumption, was about 305.5 TWh. Table 3.14 gives a breakdown of consumption by sector of use.
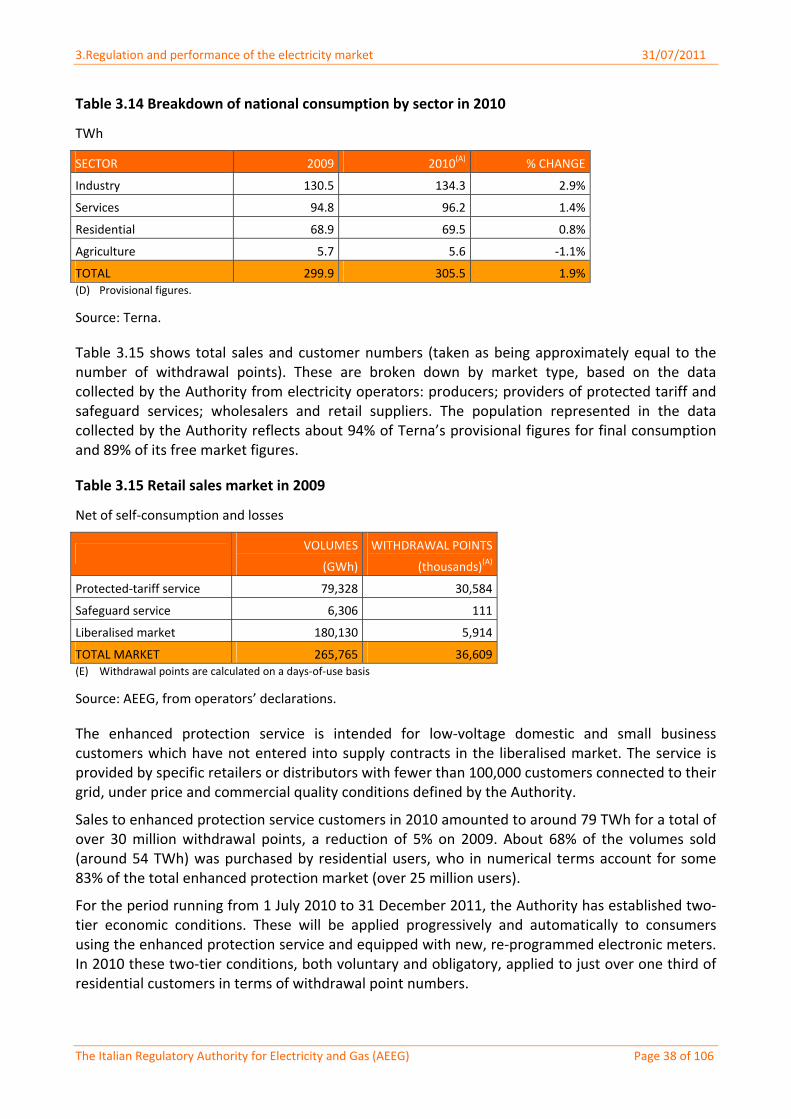
3.Regulation and performance of the electricity market 31/07/2011
The Italian Regulatory Authority for Electricity and Gas (AEEG) Page 38 of 106
Table 3.14 Breakdown of national consumption by sector in 2010
TWh
SECTOR 2009 2010(A) % CHANGE
Industry 130.5 134.3 2.9%
Services 94.8 96.2 1.4%
Residential 68.9 69.5 0.8%
Agriculture 5.7 5.6 ‐1.1%
TOTAL 299.9 305.5 1.9% (D) Provisional figures.
Source: Terna.
Table 3.15 shows total sales and customer numbers (taken as being approximately equal to the number of withdrawal points). These are broken down by market type, based on the data collected by the Authority from electricity operators: producers; providers of protected tariff and safeguard services; wholesalers and retail suppliers. The population represented in the data collected by the Authority reflects about 94% of Terna’s provisional figures for final consumption and 89% of its free market figures.
Table 3.15 Retail sales market in 2009
Net of self‐consumption and losses
VOLUMES
(GWh)
WITHDRAWAL POINTS
(thousands)(A)
Protected‐tariff service 79,328 30,584
Safeguard service 6,306 111
Liberalised market 180,130 5,914
TOTAL MARKET 265,765 36,609(E) Withdrawal points are calculated on a days‐of‐use basis
Source: AEEG, from operators’ declarations.
The enhanced protection service is intended for low‐voltage domestic and small business customers which have not entered into supply contracts in the liberalised market. The service is provided by specific retailers or distributors with fewer than 100,000 customers connected to their grid, under price and commercial quality conditions defined by the Authority.
Sales to enhanced protection service customers in 2010 amounted to around 79 TWh for a total of over 30 million withdrawal points, a reduction of 5% on 2009. About 68% of the volumes sold (around 54 TWh) was purchased by residential users, who in numerical terms account for some 83% of the total enhanced protection market (over 25 million users).
For the period running from 1 July 2010 to 31 December 2011, the Authority has established two‐tier economic conditions. These will be applied progressively and automatically to consumers using the enhanced protection service and equipped with new, re‐programmed electronic meters. In 2010 these two‐tier conditions, both voluntary and obligatory, applied to just over one third of residential customers in terms of withdrawal point numbers.
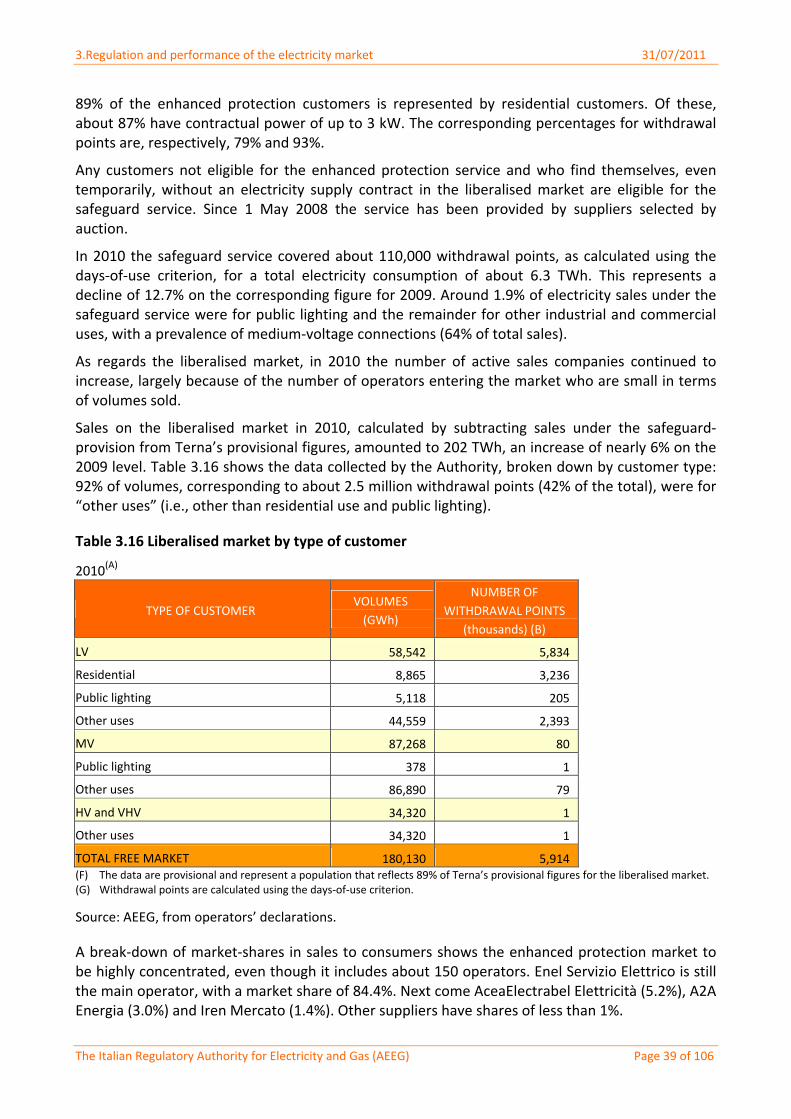
3.Regulation and performance of the electricity market 31/07/2011
The Italian Regulatory Authority for Electricity and Gas (AEEG) Page 39 of 106
89% of the enhanced protection customers is represented by residential customers. Of these, about 87% have contractual power of up to 3 kW. The corresponding percentages for withdrawal points are, respectively, 79% and 93%.
Any customers not eligible for the enhanced protection service and who find themselves, even temporarily, without an electricity supply contract in the liberalised market are eligible for the safeguard service. Since 1 May 2008 the service has been provided by suppliers selected by auction.
In 2010 the safeguard service covered about 110,000 withdrawal points, as calculated using the days‐of‐use criterion, for a total electricity consumption of about 6.3 TWh. This represents a decline of 12.7% on the corresponding figure for 2009. Around 1.9% of electricity sales under the safeguard service were for public lighting and the remainder for other industrial and commercial uses, with a prevalence of medium‐voltage connections (64% of total sales).
As regards the liberalised market, in 2010 the number of active sales companies continued to increase, largely because of the number of operators entering the market who are small in terms of volumes sold.
Sales on the liberalised market in 2010, calculated by subtracting sales under the safeguard‐provision from Terna’s provisional figures, amounted to 202 TWh, an increase of nearly 6% on the 2009 level. Table 3.16 shows the data collected by the Authority, broken down by customer type: 92% of volumes, corresponding to about 2.5 million withdrawal points (42% of the total), were for “other uses” (i.e., other than residential use and public lighting).
Table 3.16 Liberalised market by type of customer
2010(A)
TYPE OF CUSTOMER VOLUMES
(GWh)
NUMBER OF
WITHDRAWAL POINTS
(thousands) (B)
LV 58,542 5,834
Residential 8,865 3,236
Public lighting 5,118 205
Other uses 44,559 2,393
MV 87,268 80
Public lighting 378 1
Other uses 86,890 79
HV and VHV 34,320 1
Other uses 34,320 1
TOTAL FREE MARKET 180,130 5,914 (F) The data are provisional and represent a population that reflects 89% of Terna’s provisional figures for the liberalised market. (G) Withdrawal points are calculated using the days‐of‐use criterion.
Source: AEEG, from operators’ declarations.
A break‐down of market‐shares in sales to consumers shows the enhanced protection market to be highly concentrated, even though it includes about 150 operators. Enel Servizio Elettrico is still the main operator, with a market share of 84.4%. Next come AceaElectrabel Elettricità (5.2%), A2A Energia (3.0%) and Iren Mercato (1.4%). Other suppliers have shares of less than 1%.
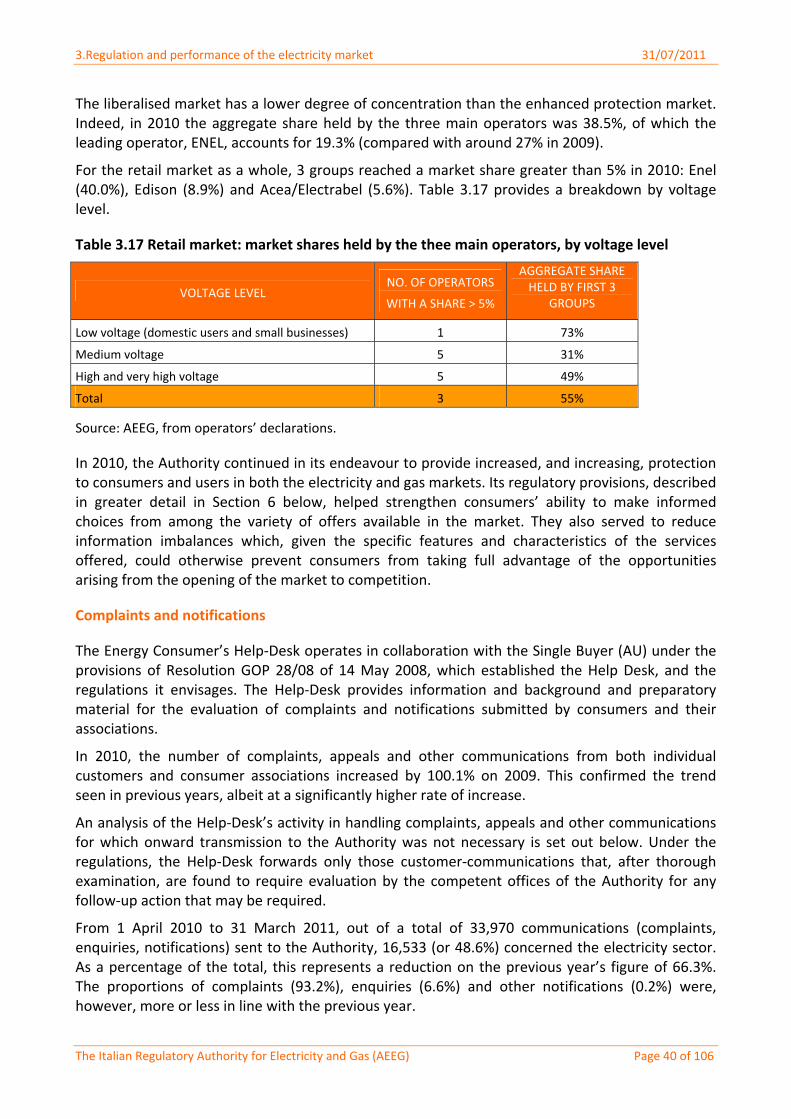
3.Regulation and performance of the electricity market 31/07/2011
The Italian Regulatory Authority for Electricity and Gas (AEEG) Page 40 of 106
The liberalised market has a lower degree of concentration than the enhanced protection market. Indeed, in 2010 the aggregate share held by the three main operators was 38.5%, of which the leading operator, ENEL, accounts for 19.3% (compared with around 27% in 2009).
For the retail market as a whole, 3 groups reached a market share greater than 5% in 2010: Enel (40.0%), Edison (8.9%) and Acea/Electrabel (5.6%). Table 3.17 provides a breakdown by voltage level.
Table 3.17 Retail market: market shares held by the thee main operators, by voltage level
VOLTAGE LEVEL NO. OF OPERATORS
WITH A SHARE > 5%
AGGREGATE SHARE HELD BY FIRST 3
GROUPS
Low voltage (domestic users and small businesses) 1 73%
Medium voltage 5 31%
High and very high voltage 5 49%
Total 3 55%
Source: AEEG, from operators’ declarations.
In 2010, the Authority continued in its endeavour to provide increased, and increasing, protection to consumers and users in both the electricity and gas markets. Its regulatory provisions, described in greater detail in Section 6 below, helped strengthen consumers’ ability to make informed choices from among the variety of offers available in the market. They also served to reduce information imbalances which, given the specific features and characteristics of the services offered, could otherwise prevent consumers from taking full advantage of the opportunities arising from the opening of the market to competition.
Complaints and notifications
The Energy Consumer’s Help‐Desk operates in collaboration with the Single Buyer (AU) under the provisions of Resolution GOP 28/08 of 14 May 2008, which established the Help Desk, and the regulations it envisages. The Help‐Desk provides information and background and preparatory material for the evaluation of complaints and notifications submitted by consumers and their associations.
In 2010, the number of complaints, appeals and other communications from both individual customers and consumer associations increased by 100.1% on 2009. This confirmed the trend seen in previous years, albeit at a significantly higher rate of increase.
An analysis of the Help‐Desk’s activity in handling complaints, appeals and other communications for which onward transmission to the Authority was not necessary is set out below. Under the regulations, the Help‐Desk forwards only those customer‐communications that, after thorough examination, are found to require evaluation by the competent offices of the Authority for any follow‐up action that may be required.
From 1 April 2010 to 31 March 2011, out of a total of 33,970 communications (complaints, enquiries, notifications) sent to the Authority, 16,533 (or 48.6%) concerned the electricity sector. As a percentage of the total, this represents a reduction on the previous year’s figure of 66.3%. The proportions of complaints (93.2%), enquiries (6.6%) and other notifications (0.2%) were, however, more or less in line with the previous year.
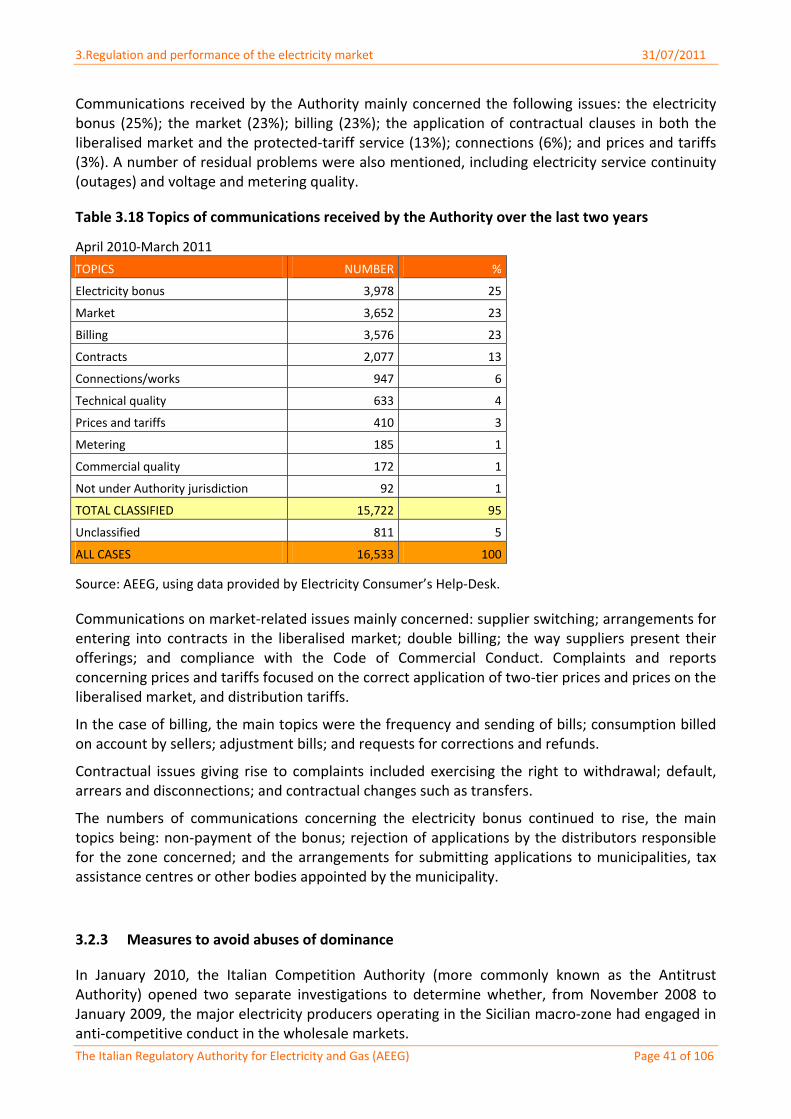
3.Regulation and performance of the electricity market 31/07/2011
The Italian Regulatory Authority for Electricity and Gas (AEEG) Page 41 of 106
Communications received by the Authority mainly concerned the following issues: the electricity bonus (25%); the market (23%); billing (23%); the application of contractual clauses in both the liberalised market and the protected‐tariff service (13%); connections (6%); and prices and tariffs (3%). A number of residual problems were also mentioned, including electricity service continuity (outages) and voltage and metering quality.
Table 3.18 Topics of communications received by the Authority over the last two years
April 2010‐March 2011
TOPICS NUMBER %
Electricity bonus 3,978 25
Market 3,652 23
Billing 3,576 23
Contracts 2,077 13
Connections/works 947 6
Technical quality 633 4
Prices and tariffs 410 3
Metering 185 1
Commercial quality 172 1
Not under Authority jurisdiction 92 1
TOTAL CLASSIFIED 15,722 95
Unclassified 811 5
ALL CASES 16,533 100
Source: AEEG, using data provided by Electricity Consumer’s Help‐Desk.
Communications on market‐related issues mainly concerned: supplier switching; arrangements for entering into contracts in the liberalised market; double billing; the way suppliers present their offerings; and compliance with the Code of Commercial Conduct. Complaints and reports concerning prices and tariffs focused on the correct application of two‐tier prices and prices on the liberalised market, and distribution tariffs.
In the case of billing, the main topics were the frequency and sending of bills; consumption billed on account by sellers; adjustment bills; and requests for corrections and refunds.
Contractual issues giving rise to complaints included exercising the right to withdrawal; default, arrears and disconnections; and contractual changes such as transfers.
The numbers of communications concerning the electricity bonus continued to rise, the main topics being: non‐payment of the bonus; rejection of applications by the distributors responsible for the zone concerned; and the arrangements for submitting applications to municipalities, tax assistance centres or other bodies appointed by the municipality.
3.2.3 Measures to avoid abuses of dominance
In January 2010, the Italian Competition Authority (more commonly known as the Antitrust Authority) opened two separate investigations to determine whether, from November 2008 to January 2009, the major electricity producers operating in the Sicilian macro‐zone had engaged in anti‐competitive conduct in the wholesale markets.
3.Regulation and performance of the electricity market 31/07/2011
The Italian Regulatory Authority for Electricity and Gas (AEEG) Page 42 of 106
The anomalous electricity price movements in the region allegedly originated from a possible abuse of ENEL and Enel Produzione’s dominant position and a possible competition‐restricting agreement between Edipower’s tolling partners – A2A trading, Edison trading, Iride mercato and Alpiq Energia Italia – and between their parent companies.
The two procedures were decided in light of the report sent by the Authority for Electricity and Gas (AEEG) in the wake of the fact‐finding investigation it had opened with Resolution VIS 3/09 of 22 January 2009. The aim of the investigation was to examine price formation in the electricity markets in late 2008 and January 2009 in Sicily and connected zones. The investigation was based on a double consideration:
prices recorded in the Sicily zone in the period under consideration had reached levels considerably higher than the national average, both on an average daily basis and at certain times of the day;
on a first analysis, the differences between the price levels in the Sicily zone and average national prices could not be fully explained by corresponding differences in the cost structure of the respective generating facilities.
To ensure that both hypotheses were analysed with the utmost rigour, the competent offices of the AEEG analysed allowed‐price trends for electricity sold in the day‐ahead market (MGP) in the three months from November 2008 to January 2009. They also analysed the difference, over the same period, between allowed prices and variable generation costs, with reference to specific generating technologies and their typical usage profiles.
To investigate the cause of these price anomalies, the AEEG conducted the following two types of detailed analysis:
structural analysis of the electricity market in the Sicily macro‐zone;
analysis of the conduct of the principle operators active in that area.
To perform these analyses, the AEEG drew on the collaboration of the Monitoring Office set up by Terna and the Energy Markets Operator (GME) in compliance with the provisions of Art. 3 of the Integrated Text for the Monitoring of the Electricity Wholesale and Dispatching Markets (TIMM, Resolution ARG/elt 115/08 of 5 August 2008).
After examining the mark‐up over the period under investigation, the Authority concluded that the large differences between national average prices and those in the Sicily zone did not arise from differences in the cost structures in their respective generating facilities over the period.
The structural analyses revealed a worrying situation. First, in terms of the correct functioning of the system as a whole. In macro‐zone Sicily, in a significant number of cases the situation had almost arisen where Terna would have been required to activate the Emergency Plan for the Security of the Electricity System (PESSE). And second, in terms of the extent to which the principal macro‐operators, i.e. ENEL and the Edipower group, played a pivotal role, and the frequency with which they did so. This indicated an extreme concentration of market power in the hands of the main producers on the island.
Lastly, an analysis of the operators’ conduct revealed that, for Edipower’s tolling partners, in numerous situations it would probably have been more profitable to submit offers with prices aligned to variable costs than to follow the strategy actually adopted. This gave rise to a reasonable doubt that individual tollers’ bidding strategies could have been coordinated, with certain features peculiar to the tolling contract between Edipower and its partners making such coordination possible.
3.Regulation and performance of the electricity market 31/07/2011
The Italian Regulatory Authority for Electricity and Gas (AEEG) Page 43 of 106
The two investigations opened by the Antitrust Authority following the AEEG’s report concluded in December 2010 with a decision to accept and place on a binding footing the commitments made by the main energy companies operating in Sicily macro‐zone.
More specifically, the measures proposed by ENEL and ENEL Produzione in the proceeding for abuse of dominant position envisage a ceiling on the sales price in the macro‐zone’s wholesale markets until the end of 2013. Edipower and its partners, the subjects of the proceeding for a possible agreement to restrict competition, undertook to assign to Edipower alone the task of managing procurement and formulating the offers/bids relating to the San Filippo del Mela (ME) plant and to tie these offers/bids to variable costs. The aim of these measures was to narrow the gap between the Sicilian price recorded on the wholesale energy market and that recorded on mainland Italy.
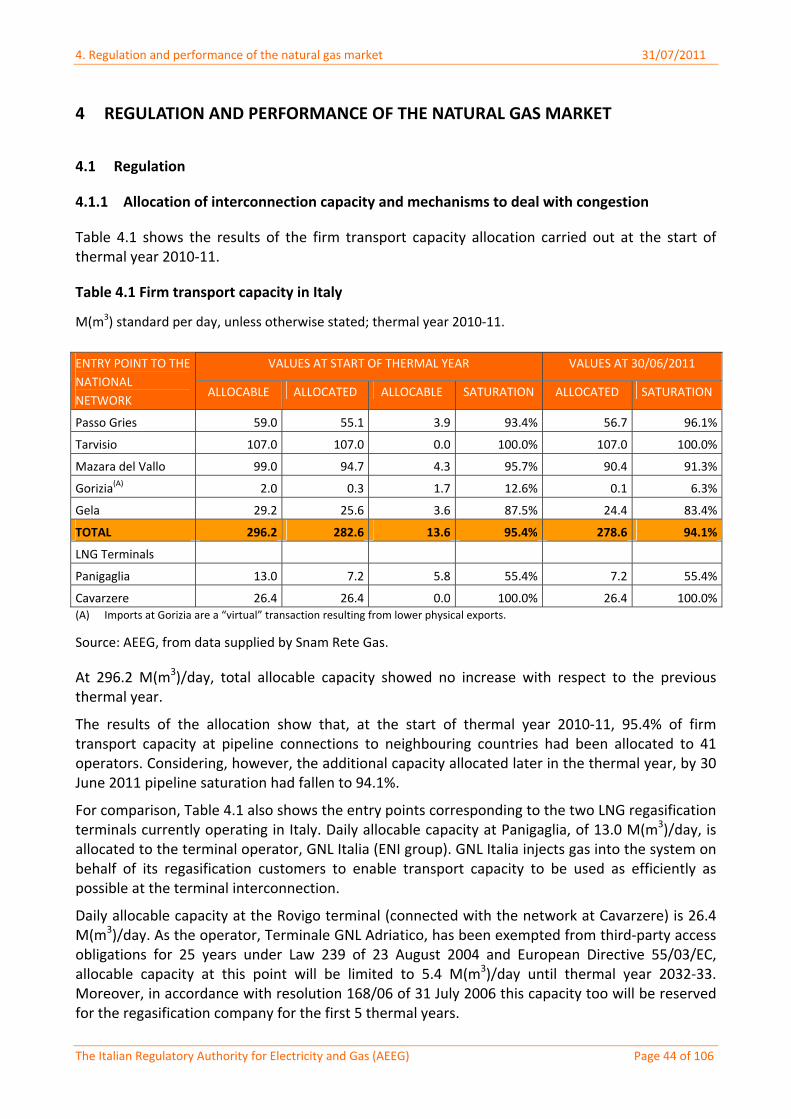
4. Regulation and performance of the natural gas market 31/07/2011
The Italian Regulatory Authority for Electricity and Gas (AEEG) Page 44 of 106
4 REGULATION AND PERFORMANCE OF THE NATURAL GAS MARKET
4.1 Regulation
4.1.1 Allocation of interconnection capacity and mechanisms to deal with congestion
Table 4.1 shows the results of the firm transport capacity allocation carried out at the start of thermal year 2010‐11.
Table 4.1 Firm transport capacity in Italy
M(m3) standard per day, unless otherwise stated; thermal year 2010‐11.
VALUES AT START OF THERMAL YEAR VALUES AT 30/06/2011 ENTRY POINT TO THE
NATIONAL
NETWORK ALLOCABLE ALLOCATED ALLOCABLE SATURATION ALLOCATED SATURATION
Passo Gries 59.0 55.1 3.9 93.4% 56.7 96.1%
Tarvisio 107.0 107.0 0.0 100.0% 107.0 100.0%
Mazara del Vallo 99.0 94.7 4.3 95.7% 90.4 91.3%
Gorizia(A) 2.0 0.3 1.7 12.6% 0.1 6.3%
Gela 29.2 25.6 3.6 87.5% 24.4 83.4%
TOTAL 296.2 282.6 13.6 95.4% 278.6 94.1%
LNG Terminals
Panigaglia 13.0 7.2 5.8 55.4% 7.2 55.4%
Cavarzere 26.4 26.4 0.0 100.0% 26.4 100.0%(A) Imports at Gorizia are a “virtual” transaction resulting from lower physical exports.
Source: AEEG, from data supplied by Snam Rete Gas.
At 296.2 M(m3)/day, total allocable capacity showed no increase with respect to the previous thermal year.
The results of the allocation show that, at the start of thermal year 2010‐11, 95.4% of firm transport capacity at pipeline connections to neighbouring countries had been allocated to 41 operators. Considering, however, the additional capacity allocated later in the thermal year, by 30 June 2011 pipeline saturation had fallen to 94.1%.
For comparison, Table 4.1 also shows the entry points corresponding to the two LNG regasification terminals currently operating in Italy. Daily allocable capacity at Panigaglia, of 13.0 M(m3)/day, is allocated to the terminal operator, GNL Italia (ENI group). GNL Italia injects gas into the system on behalf of its regasification customers to enable transport capacity to be used as efficiently as possible at the terminal interconnection.
Daily allocable capacity at the Rovigo terminal (connected with the network at Cavarzere) is 26.4 M(m3)/day. As the operator, Terminale GNL Adriatico, has been exempted from third‐party access obligations for 25 years under Law 239 of 23 August 2004 and European Directive 55/03/EC, allocable capacity at this point will be limited to 5.4 M(m3)/day until thermal year 2032‐33. Moreover, in accordance with resolution 168/06 of 31 July 2006 this capacity too will be reserved for the regasification company for the first 5 thermal years.
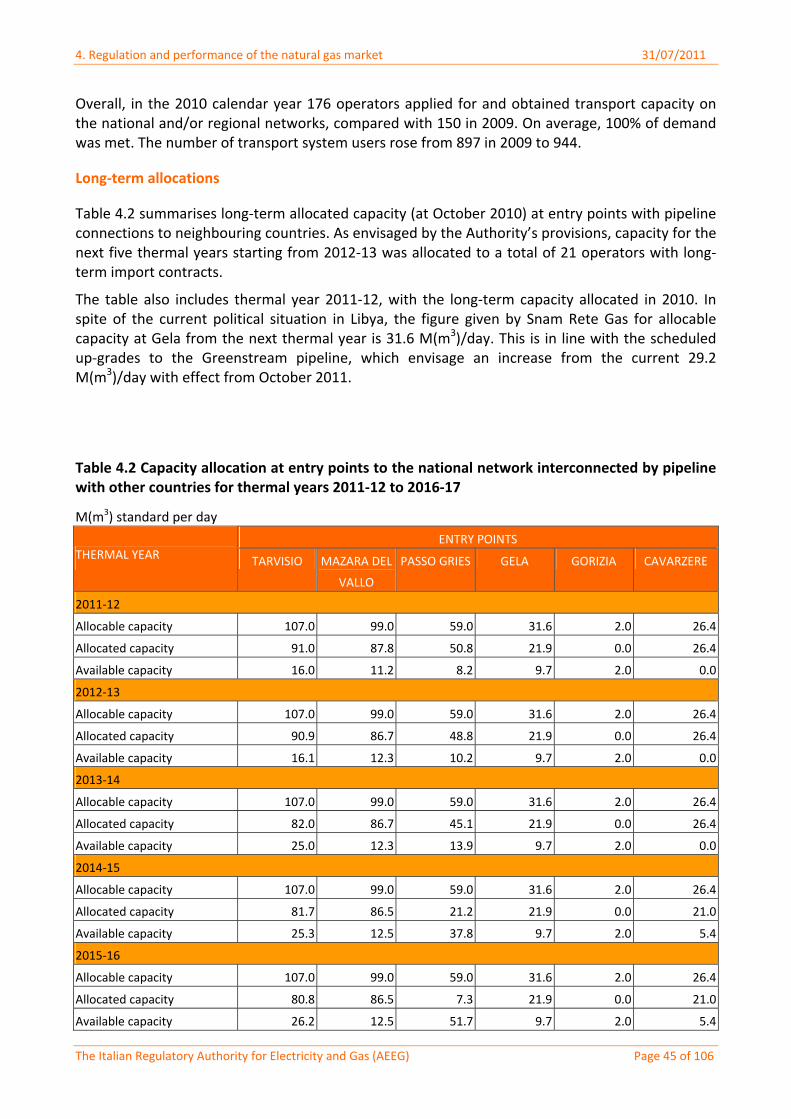
4. Regulation and performance of the natural gas market 31/07/2011
The Italian Regulatory Authority for Electricity and Gas (AEEG) Page 45 of 106
Overall, in the 2010 calendar year 176 operators applied for and obtained transport capacity on the national and/or regional networks, compared with 150 in 2009. On average, 100% of demand was met. The number of transport system users rose from 897 in 2009 to 944.
Long‐term allocations
Table 4.2 summarises long‐term allocated capacity (at October 2010) at entry points with pipeline connections to neighbouring countries. As envisaged by the Authority’s provisions, capacity for the next five thermal years starting from 2012‐13 was allocated to a total of 21 operators with long‐term import contracts.
The table also includes thermal year 2011‐12, with the long‐term capacity allocated in 2010. In spite of the current political situation in Libya, the figure given by Snam Rete Gas for allocable capacity at Gela from the next thermal year is 31.6 M(m3)/day. This is in line with the scheduled up‐grades to the Greenstream pipeline, which envisage an increase from the current 29.2 M(m3)/day with effect from October 2011.
Table 4.2 Capacity allocation at entry points to the national network interconnected by pipeline with other countries for thermal years 2011‐12 to 2016‐17
M(m3) standard per day
ENTRY POINTS THERMAL YEAR TARVISIO MAZARA DEL
VALLO
PASSO GRIES GELA GORIZIA CAVARZERE
2011‐12
Allocable capacity 107.0 99.0 59.0 31.6 2.0 26.4
Allocated capacity 91.0 87.8 50.8 21.9 0.0 26.4
Available capacity 16.0 11.2 8.2 9.7 2.0 0.0
2012‐13
Allocable capacity 107.0 99.0 59.0 31.6 2.0 26.4
Allocated capacity 90.9 86.7 48.8 21.9 0.0 26.4
Available capacity 16.1 12.3 10.2 9.7 2.0 0.0
2013‐14
Allocable capacity 107.0 99.0 59.0 31.6 2.0 26.4
Allocated capacity 82.0 86.7 45.1 21.9 0.0 26.4
Available capacity 25.0 12.3 13.9 9.7 2.0 0.0
2014‐15
Allocable capacity 107.0 99.0 59.0 31.6 2.0 26.4
Allocated capacity 81.7 86.5 21.2 21.9 0.0 21.0
Available capacity 25.3 12.5 37.8 9.7 2.0 5.4
2015‐16
Allocable capacity 107.0 99.0 59.0 31.6 2.0 26.4
Allocated capacity 80.8 86.5 7.3 21.9 0.0 21.0
Available capacity 26.2 12.5 51.7 9.7 2.0 5.4
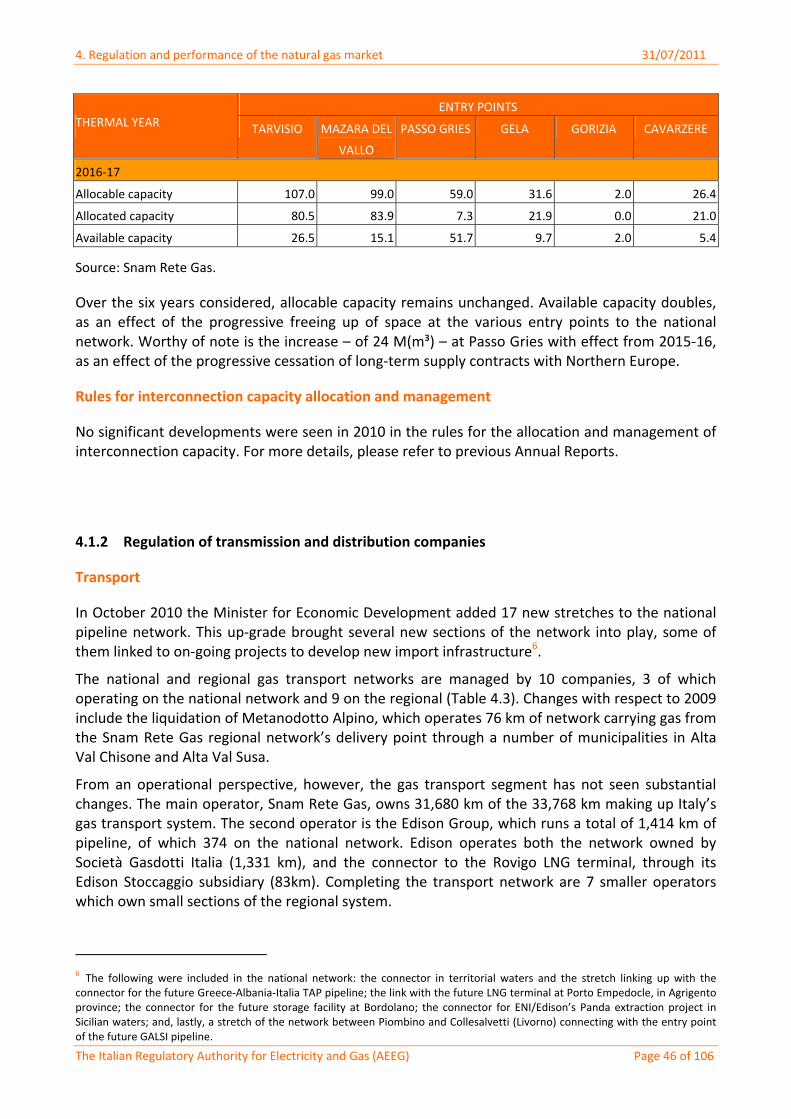
4. Regulation and performance of the natural gas market 31/07/2011
The Italian Regulatory Authority for Electricity and Gas (AEEG) Page 46 of 106
ENTRY POINTS THERMAL YEAR TARVISIO MAZARA DEL
VALLO
PASSO GRIES GELA GORIZIA CAVARZERE
2016‐17
Allocable capacity 107.0 99.0 59.0 31.6 2.0 26.4
Allocated capacity 80.5 83.9 7.3 21.9 0.0 21.0
Available capacity 26.5 15.1 51.7 9.7 2.0 5.4
Source: Snam Rete Gas.
Over the six years considered, allocable capacity remains unchanged. Available capacity doubles, as an effect of the progressive freeing up of space at the various entry points to the national network. Worthy of note is the increase – of 24 M(m³) – at Passo Gries with effect from 2015‐16, as an effect of the progressive cessation of long‐term supply contracts with Northern Europe.
Rules for interconnection capacity allocation and management
No significant developments were seen in 2010 in the rules for the allocation and management of interconnection capacity. For more details, please refer to previous Annual Reports.
4.1.2 Regulation of transmission and distribution companies
Transport
In October 2010 the Minister for Economic Development added 17 new stretches to the national pipeline network. This up‐grade brought several new sections of the network into play, some of them linked to on‐going projects to develop new import infrastructure6.
The national and regional gas transport networks are managed by 10 companies, 3 of which operating on the national network and 9 on the regional (Table 4.3). Changes with respect to 2009 include the liquidation of Metanodotto Alpino, which operates 76 km of network carrying gas from the Snam Rete Gas regional network’s delivery point through a number of municipalities in Alta Val Chisone and Alta Val Susa.
From an operational perspective, however, the gas transport segment has not seen substantial changes. The main operator, Snam Rete Gas, owns 31,680 km of the 33,768 km making up Italy’s gas transport system. The second operator is the Edison Group, which runs a total of 1,414 km of pipeline, of which 374 on the national network. Edison operates both the network owned by Società Gasdotti Italia (1,331 km), and the connector to the Rovigo LNG terminal, through its Edison Stoccaggio subsidiary (83km). Completing the transport network are 7 smaller operators which own small sections of the regional system.
6 The following were included in the national network: the connector in territorial waters and the stretch linking up with the connector for the future Greece‐Albania‐Italia TAP pipeline; the link with the future LNG terminal at Porto Empedocle, in Agrigento province; the connector for the future storage facility at Bordolano; the connector for ENI/Edison’s Panda extraction project in Sicilian waters; and, lastly, a stretch of the network between Piombino and Collesalvetti (Livorno) connecting with the entry point of the future GALSI pipeline.
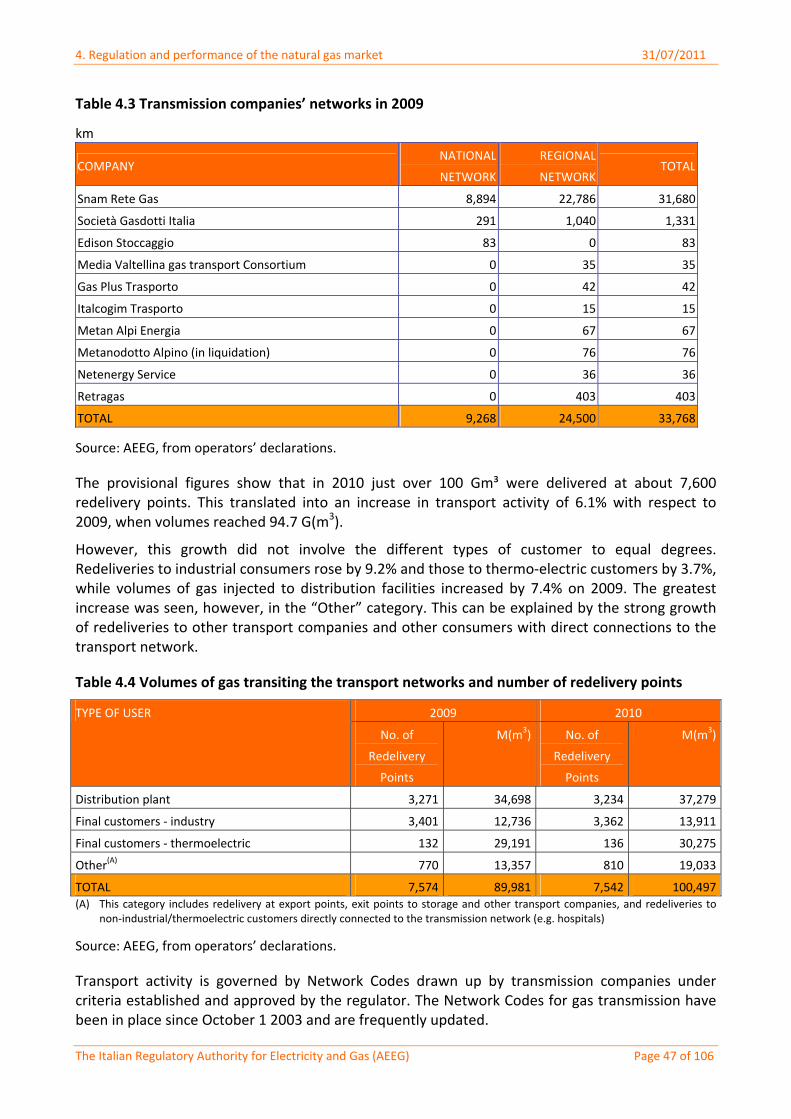
4. Regulation and performance of the natural gas market 31/07/2011
The Italian Regulatory Authority for Electricity and Gas (AEEG) Page 47 of 106
Table 4.3 Transmission companies’ networks in 2009
km
COMPANY NATIONAL
NETWORK
REGIONAL
NETWORK TOTAL
Snam Rete Gas 8,894 22,786 31,680
Società Gasdotti Italia 291 1,040 1,331
Edison Stoccaggio 83 0 83
Media Valtellina gas transport Consortium 0 35 35
Gas Plus Trasporto 0 42 42
Italcogim Trasporto 0 15 15
Metan Alpi Energia 0 67 67
Metanodotto Alpino (in liquidation) 0 76 76
Netenergy Service 0 36 36
Retragas 0 403 403
TOTAL 9,268 24,500 33,768
Source: AEEG, from operators’ declarations.
The provisional figures show that in 2010 just over 100 Gm³ were delivered at about 7,600 redelivery points. This translated into an increase in transport activity of 6.1% with respect to 2009, when volumes reached 94.7 G(m3).
However, this growth did not involve the different types of customer to equal degrees. Redeliveries to industrial consumers rose by 9.2% and those to thermo‐electric customers by 3.7%, while volumes of gas injected to distribution facilities increased by 7.4% on 2009. The greatest increase was seen, however, in the “Other” category. This can be explained by the strong growth of redeliveries to other transport companies and other consumers with direct connections to the transport network.
Table 4.4 Volumes of gas transiting the transport networks and number of redelivery points
2009 2010 TYPE OF USER
No. of
Redelivery
Points
M(m3) No. of
Redelivery
Points
M(m3)
Distribution plant 3,271 34,698 3,234 37,279
Final customers ‐ industry 3,401 12,736 3,362 13,911
Final customers ‐ thermoelectric 132 29,191 136 30,275
Other(A) 770 13,357 810 19,033
TOTAL 7,574 89,981 7,542 100,497(A) This category includes redelivery at export points, exit points to storage and other transport companies, and redeliveries to
non‐industrial/thermoelectric customers directly connected to the transmission network (e.g. hospitals)
Source: AEEG, from operators’ declarations.
Transport activity is governed by Network Codes drawn up by transmission companies under criteria established and approved by the regulator. The Network Codes for gas transmission have been in place since October 1 2003 and are frequently updated.
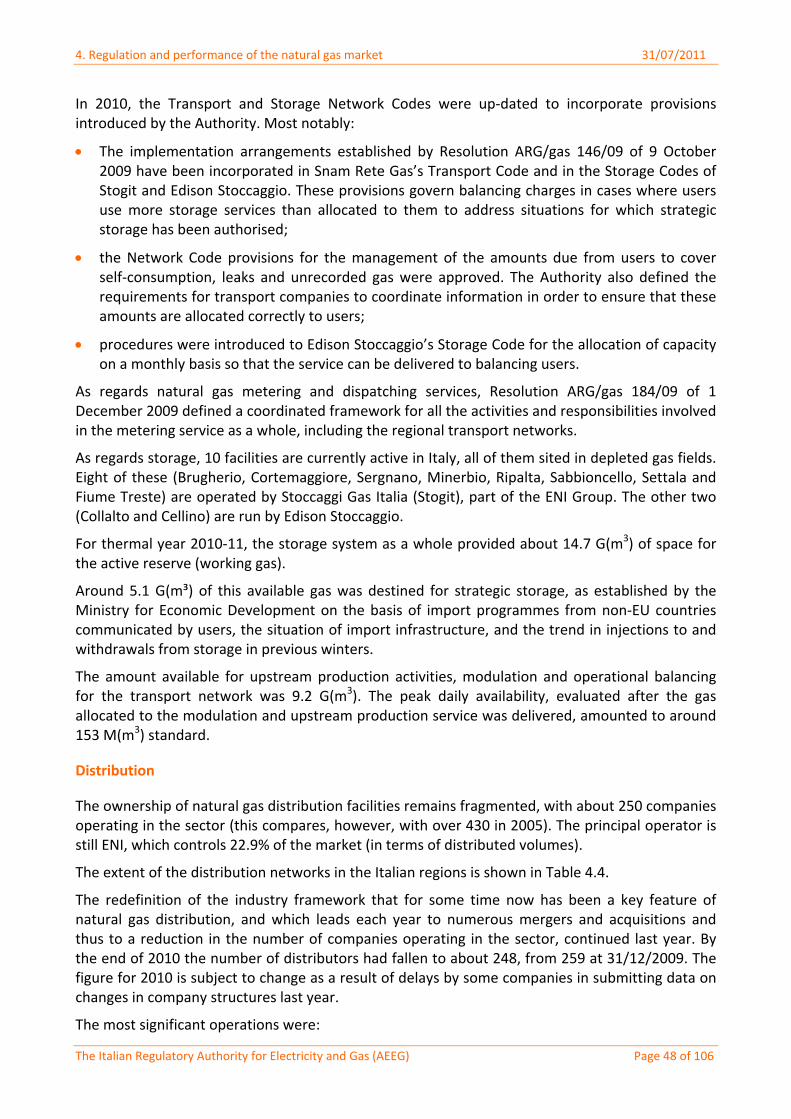
4. Regulation and performance of the natural gas market 31/07/2011
The Italian Regulatory Authority for Electricity and Gas (AEEG) Page 48 of 106
In 2010, the Transport and Storage Network Codes were up‐dated to incorporate provisions introduced by the Authority. Most notably:
The implementation arrangements established by Resolution ARG/gas 146/09 of 9 October 2009 have been incorporated in Snam Rete Gas’s Transport Code and in the Storage Codes of Stogit and Edison Stoccaggio. These provisions govern balancing charges in cases where users use more storage services than allocated to them to address situations for which strategic storage has been authorised;
the Network Code provisions for the management of the amounts due from users to cover self‐consumption, leaks and unrecorded gas were approved. The Authority also defined the requirements for transport companies to coordinate information in order to ensure that these amounts are allocated correctly to users;
procedures were introduced to Edison Stoccaggio’s Storage Code for the allocation of capacity on a monthly basis so that the service can be delivered to balancing users.
As regards natural gas metering and dispatching services, Resolution ARG/gas 184/09 of 1 December 2009 defined a coordinated framework for all the activities and responsibilities involved in the metering service as a whole, including the regional transport networks.
As regards storage, 10 facilities are currently active in Italy, all of them sited in depleted gas fields. Eight of these (Brugherio, Cortemaggiore, Sergnano, Minerbio, Ripalta, Sabbioncello, Settala and Fiume Treste) are operated by Stoccaggi Gas Italia (Stogit), part of the ENI Group. The other two (Collalto and Cellino) are run by Edison Stoccaggio.
For thermal year 2010‐11, the storage system as a whole provided about 14.7 G(m3) of space for the active reserve (working gas).
Around 5.1 G(m³) of this available gas was destined for strategic storage, as established by the Ministry for Economic Development on the basis of import programmes from non‐EU countries communicated by users, the situation of import infrastructure, and the trend in injections to and withdrawals from storage in previous winters.
The amount available for upstream production activities, modulation and operational balancing for the transport network was 9.2 G(m3). The peak daily availability, evaluated after the gas allocated to the modulation and upstream production service was delivered, amounted to around 153 M(m3) standard.
Distribution
The ownership of natural gas distribution facilities remains fragmented, with about 250 companies operating in the sector (this compares, however, with over 430 in 2005). The principal operator is still ENI, which controls 22.9% of the market (in terms of distributed volumes).
The extent of the distribution networks in the Italian regions is shown in Table 4.4.
The redefinition of the industry framework that for some time now has been a key feature of natural gas distribution, and which leads each year to numerous mergers and acquisitions and thus to a reduction in the number of companies operating in the sector, continued last year. By the end of 2010 the number of distributors had fallen to about 248, from 259 at 31/12/2009. The figure for 2010 is subject to change as a result of delays by some companies in submitting data on changes in company structures last year.
The most significant operations were:
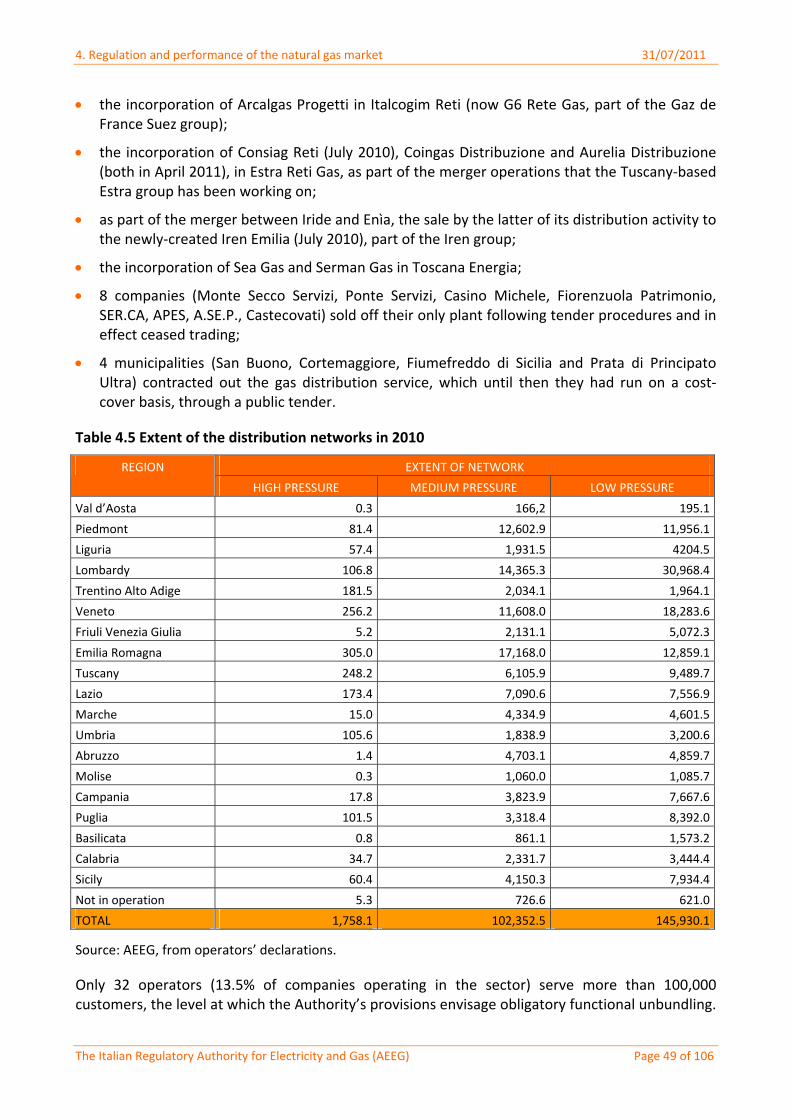
4. Regulation and performance of the natural gas market 31/07/2011
The Italian Regulatory Authority for Electricity and Gas (AEEG) Page 49 of 106
the incorporation of Arcalgas Progetti in Italcogim Reti (now G6 Rete Gas, part of the Gaz de France Suez group);
the incorporation of Consiag Reti (July 2010), Coingas Distribuzione and Aurelia Distribuzione (both in April 2011), in Estra Reti Gas, as part of the merger operations that the Tuscany‐based Estra group has been working on;
as part of the merger between Iride and Enìa, the sale by the latter of its distribution activity to the newly‐created Iren Emilia (July 2010), part of the Iren group;
the incorporation of Sea Gas and Serman Gas in Toscana Energia;
8 companies (Monte Secco Servizi, Ponte Servizi, Casino Michele, Fiorenzuola Patrimonio, SER.CA, APES, A.SE.P., Castecovati) sold off their only plant following tender procedures and in effect ceased trading;
4 municipalities (San Buono, Cortemaggiore, Fiumefreddo di Sicilia and Prata di Principato Ultra) contracted out the gas distribution service, which until then they had run on a cost‐cover basis, through a public tender.
Table 4.5 Extent of the distribution networks in 2010
EXTENT OF NETWORK REGION
HIGH PRESSURE MEDIUM PRESSURE LOW PRESSURE
Val d’Aosta 0.3 166,2 195.1
Piedmont 81.4 12,602.9 11,956.1
Liguria 57.4 1,931.5 4204.5
Lombardy 106.8 14,365.3 30,968.4
Trentino Alto Adige 181.5 2,034.1 1,964.1
Veneto 256.2 11,608.0 18,283.6
Friuli Venezia Giulia 5.2 2,131.1 5,072.3
Emilia Romagna 305.0 17,168.0 12,859.1
Tuscany 248.2 6,105.9 9,489.7
Lazio 173.4 7,090.6 7,556.9
Marche 15.0 4,334.9 4,601.5
Umbria 105.6 1,838.9 3,200.6
Abruzzo 1.4 4,703.1 4,859.7
Molise 0.3 1,060.0 1,085.7
Campania 17.8 3,823.9 7,667.6
Puglia 101.5 3,318.4 8,392.0
Basilicata 0.8 861.1 1,573.2
Calabria 34.7 2,331.7 3,444.4
Sicily 60.4 4,150.3 7,934.4
Not in operation 5.3 726.6 621.0
TOTAL 1,758.1 102,352.5 145,930.1
Source: AEEG, from operators’ declarations.
Only 32 operators (13.5% of companies operating in the sector) serve more than 100,000 customers, the level at which the Authority’s provisions envisage obligatory functional unbundling.
4. Regulation and performance of the natural gas market 31/07/2011
The Italian Regulatory Authority for Electricity and Gas (AEEG) Page 50 of 106
Overall, they account for 80.5% of the volumes distributed in Italy (in 2009 these same companies covered 80.4%).
In 2004 the Authority issued the rules governing access to and delivery of the natural gas distribution service. These envisaged, inter alia, that all distribution companies must operate on the basis of a Network Code. In 2006 the Authority drew up a standard Code, since which time all distribution companies have been required to draw up their own. They may adopt the rules envisaged by the standard Code or submit their own proposed version – drafted to meet their own needs but based on the standard Code – to the Authority for approval. In December 2009 the Authority amended and added to some parts of the standard Network Code, most notably the sections governing readings, gas volume adjustments, and metering service responsibilities.
In April 2010, in consultation document DCO 6/10, the Authority illustrated its proposals for the completion of the rules governing the gas metering service by distributors. The main changes are intended to solve problems that have emerged with regard to self‐readings. More specifically, they include:
the adoption, to validate self‐readings, of a single, more sophisticated algorithm than the one currently used by distribution companies;
the introduction of a ceiling on the number of self‐readings that sellers can send distribution companies each month, in order to reduce the burden on the system caused by the complexity of the relative information flows.
With Resolution ARG/gas 145/10 of 22 September 2010, the Authority amended the existing provisions covering this subject. Its aim was to rationalise the obligations governing attempts to collect metering data from consumers, by introducing minimum and maximum intervals between each consecutive attempt. More specifically:
for redelivery points with consumption of up to 500 S(m3)/year, one attempt in each civil year with a maximum interval of 13 months and a minimum of 6 months between any two consecutive collection attempts;
for redelivery points with consumption of over 500 S(m3)/year and up to 5,000 S(m3)/year, 2 attempts in each civil year with a maximum of 7 months and minimum of 3 months between any two consecutive collection attempts;
for redelivery points with consumption of over 5,000 S(m3)/year, one attempt per month with a minimum of 25 days and maximum of 35 days between any two consecutive collection attempts.
In recognition of the considerable importance of self‐readings from a system perspective, Resolution ARG/gas 145/10 also introduced more detailed rules governing the flow and timescale for the transmission of self‐readings, as already proposed in consultation document DCO 6/10. The Authority’s aim here was to make further progress in the task of simplifying and increasing the effectiveness of the regulations.
Minimum areas for natural gas distribution ‐ In 2010 the Ministry for Economic Development continued its work on identifying the minimum geographical zones (catchment areas) for the distribution of natural gas.
In January 2011, and in collaboration with the Ministry for Relations with the Regions and for Territorial Cohesion, the Ministry adopted a decree defining these catchment areas (Italian initials ATEM) for gas distribution. The decree, the fruit of a long dialogue with the social partners and
4. Regulation and performance of the natural gas market 31/07/2011
The Italian Regulatory Authority for Electricity and Gas (AEEG) Page 51 of 106
mediation between opposing interests, identified 177 such areas. The following matters will be included in subsequent provisions, on which work is still in progress:
details of the municipalities included in each area
the regulations governing public tender criteria
the definition of the “social clause” (a provision to safeguard existing employment levels in the ATEMs being put out to tender).
The “catchment area decree” came into force in April 2011 and had the immediate effect of halting the tenders under way at that time for the distribution service. Since April, in fact, the tenders must be conducted solely at ATEM level (and no longer at individual municipality level), without prejudice to any third party rights that may have been established. More specifically, tenders for which “the tender notice had not been published or the deadline for submission had not been reached” have been halted.
Transport tariffs
In 2009, the Authority approved the criteria for the regulation of natural gas transport and dispatching tariffs for the third regulatory period, 2010‐13 (resolution ARG/gas 184/09 of 1 December 2009).
As described in detail in last year’s Annual Report, the tariff regulation mechanisms established for the third regulatory period:
use the calendar year rather than the thermal year as the reference used to set and apply transport tariffs;
set the real, pre‐tax rate of return on invested capital at 6.4% for the transport and dispatching service;
confirm the same incentive mechanism for new investments as was applied in the second regulatory period and introduce an efficiency index for the cost/benefit analysis applied to infrastructure development;
confirm the adoption of the entry‐exit tariff model to determine the charges for gas entering and leaving the national pipeline network. They also bring “exit” tariff zones into line with the geographical areas in which the tariffs apply;
set differentiated efficiency gain coefficients (price caps) for each transport firm. In cases where, during the reference year for the determination of operating costs, operators’ actual costs are lower than those allowed for, the price cap should be set at a level that will offset profit‐sharing over a period of 8 years;
break income down into capacity and commodity components which reflect the structure of the transport operator’s capital and running costs.
With the same provision, the Authority established the tariff criteria and rules for the allocation of responsibility for the metering service for natural gas transport for the 2010‐13 period. More specifically, metering costs will be separated out from the general costs of the transport and dispatching service in order to determine a specific charge for the remuneration of the service.
As regards the tariff regulation criteria for the gas transport metering service, the authority provided that:
4. Regulation and performance of the natural gas market 31/07/2011
The Italian Regulatory Authority for Electricity and Gas (AEEG) Page 52 of 106
the allowed cost should be calculated with reference to all the assets and activities required to perform the service, with the exclusion of those for which national producers are responsible (these are already covered in the sales contracts drawn up by the producers). The cost should refer to a technologically advanced metering system and service provided in conditions of quality and efficiency;
the allowed rate of return on invested capital should be 6.9%.
At the end of 2010 the Authority approved the tariff proposals for natural gas transport and dispatching charges and the transitional charge for the metering service in force for calendar year 2011 (Resolution ARG/gas 218/10 of 30 November 2010). The new transport and metering tariff levels on the national and regional pipeline networks were determined following verification of the tariff proposals submitted to the authority by transport companies in accordance with Resolution ARG/gas 184/09.
Since 1 January 2011 the transport company has also applied two new tariff components, GST and RET, to final customers directly connected to the natural gas network. These were established by Resolution ARG/com 93/10 of 25 June 2010, and took effect on 1 July 2010. More specifically:
the GST component is intended to finance special tariff terms for economically disadvantaged gas sector customers;
the RET component is intended to finance energy‐saving initiatives and the development of renewable sources in the natural gas sector.
Regasification tariffs
For the LNG regasification service, the current thermal year (2010‐2011) is the penultimate of the third regulatory period as defined by Resolution ARG/Gas 92/08 of 7 July 2008.
Under this provision, by 31 May each year regasification companies are required to send the Authority their tariff proposals for the following thermal year. After examining these proposals, in Resolution ARG/gas 108/10 of 19 July 2010 the Authority set the regasification service tariff for 2010‐11 for GNL Italia and Terminale GNL Adriatico.
In addition to regasification services, Terminale GNL Adriatico also provides maritime towing and mooring services to allow ships to berth and supply LNG to the company’s regasification terminal at Porto Viro (Rovigo).
For these services too, the price needs to be defined on the basis of the underlying delivery costs. The economic conditions for maritime towing and mooring services, like those for the regasification service, must therefore be approved by the Authority, whose evaluation also takes into account the need to ensure transparent, non‐discriminatory access conditions for users of the terminal. After examining the tariff proposal submitted by Terminale GNL Adriatico, the Authority approved the tariff – 152,233.67 €/berthing – for maritime towing and mooring services at that terminal for thermal year 2010‐11 (Resolution ARG/gas 118/10 of 3 August 2010).
Distribution tariffs
As with transmission tariffs, distribution tariffs are proposed by companies in accordance with the criteria defined by the Authority at the beginning of each four‐year regulatory period. The
4. Regulation and performance of the natural gas market 31/07/2011
The Italian Regulatory Authority for Electricity and Gas (AEEG) Page 53 of 106
Authority monitors and approves these tariffs on an annual basis, taking the operators’ reference revenues into account.
1 January 2009 saw the adoption of the Tariff Regulations for the Natural Gas Distribution and Metering Services (Italian initials RTDG). Approved with Resolution ARG/gas 159/08 of 6 November 2008, these apply to the regulatory period running from 1 January 2009 to 31 December 2012.
The 3rd regulatory period saw the introduction of incentives for distribution companies, which are still very numerous in Italy, to aggregate. These consisted of a modulation of the rate used to calculate the productivity gain (i.e., the X‐factor). This rate, which increases as the size of company decreases, is:
3.2% for companies serving over 300,000 redelivery points;
4.6% for companies with more than 50,000 but fewer than 300,000 redelivery points;
5.4% for companies serving, at most, 50,000 redelivery points.
The Authority’s main goals in defining the tariff regulation framework for the 3rd period also include: regulatory stability; convergence between the tariff regulation criteria applied in the electricity and gas sectors; reduction of the revenue risk for operators; consistency between tariff and service quality regulation; and a simplification of tariff mechanisms, not least to foster competition (see Annual Report 2009).
The obligatory tariff components for the distribution, metering and commercialisation of natural gas for 2011 were set through Resolution ARG/gas 235/10 of 14 December 2010.
In accordance with the RGDG, distribution companies are obliged to offer counterparties an obligatory tariff that is differentiated by tariff zone. The six zones are:
north‐west, which includes Valle d'Aosta, Piedmont and Liguria Regions;
north‐east, which includes: Lombardy, Trentino‐Alto Adige, Veneto, Friuli‐Venezia Giulia and Emilia‐Romagna;
central, which includes Tuscany, Umbria and Marche;
centre‐south east, which includes Abruzzo, Molise, Puglia and Basilicata;
centre south‐west, which includes Lazio and Campania;
south, which includes Calabria and Sicily.
The distribution and metering tariff is composed of a fixed component, �1, which can be broken down into three elements: distribution (�1 dis), metering (�1 mis) and commercialisation (�1 cot), and a variable component, �3, which is differentiated by consumption band. As mentioned earlier, all of these components are differentiated in line with the six tariff zones. The tariff also includes additional components, not differentiated by zone, which vary on a quarterly basis. These are:
UG1, to cover any imbalances in the equalisation systems and/or any adjustments;
GS, to cover the tariff compensation system for economically disadvantaged customers;
RE, to cover energy saving initiatives and the development of renewables in the natural gas sector;
RS, to cover costs relating to gas service quality.
4. Regulation and performance of the natural gas market 31/07/2011
The Italian Regulatory Authority for Electricity and Gas (AEEG) Page 54 of 106
Storage tariffs
With resolution ARG/gas 119/10 of 3 August 2010, the Authority defined the second part of the Consolidated Text for the Regulation of Quality and Tariffs in the Storage Service for the period 2011‐14 (TUSG), relative to the Tariff Regulations for the Natural Gas Storage Service for Regulatory Period 2011‐14 (Italian initials RTSG). With the RTSG, the criteria to determine the storage tariffs for the new regulatory period, 2011‐14, have entered into force.
In defining the new tariff regulation criteria, the Authority established certain general requirements that should be taken into account. These include the need to:
introduce mechanisms to incentivise the efficient development of natural gas storage infrastructure, in keeping with the overall objective of guaranteeing the security of the national gas system and promoting the development of a competitive market;
ensure continuity with the Authority’s existing provisions governing access to and the delivery of the storage service;
achieve further convergence, where possible, of the tariff regulation criteria in the electricity and gas sectors;
take into account any possible developments in the balancing service in the natural gas market.
The tariff regulation framework for the third regulatory period:
sets the allowed rate of return on invested capital for the natural gas storage service at 6.7%;
adopts the calendar year rather than the thermal year as the reference for setting and applying storage tariffs;
confirms the incentive mechanism applied in the second regulatory period for the development of new investments;
confirms the adoption of a single national tariff accompanied by an equalisation mechanism to ensure that the revenue due to each company is recovered;
introduces a special revenue quota to cover the costs of storage‐site recovery and conversion costs; total revenue quotas allowed by the tariff system are paid into a fund that is considered as an adjustment item in determining the allowed invested capital;
applies differentiated productivity gain coefficients (X‐factor) for each storage company. These are scaled in such a way as to offset profit‐sharing over a period of 8 years. Alternatively, they may be set at zero in cases where, in the reference year, storage companies’ actual running costs are higher than the allowed costs.
The Authority also opened a procedure to identify incentive mechanisms to bring investments to develop storage capacity into play more quickly. Its aim here was to increase the efficacy of the incentive mechanism for the development of natural gas storage infrastructure.
After checking the data submitted by the two national storage operators, Stoccaggi Gas Italia (Stogit) and Edison Stoccaggio, with Resolution ARG/gas 202/10 of 22 November 2010 the Authority approved the tariff proposals submitted by the two companies. It set company‐specific charges for the storage service for 2011 in accordance with Resolution ARG/gas 119/10.
The Authority also set the compensation rate for 2011 for the non‐availability of storage sites for other purposes, in accordance with art. 2 paragraph 558 of the 2008 Finance Law (Budget). This is
4. Regulation and performance of the natural gas market 31/07/2011
The Italian Regulatory Authority for Electricity and Gas (AEEG) Page 55 of 106
paid to the Regions in which the sites are located. It then set the value of tariff component US2, the revenue from which is used to cover the costs arising from this payment.
Balancing
After extensive consultation with stakeholders7, in April 2011 the Authority established the Regulations Governing Economic‐Merit Balancing for Natural Gas (Resolution RG/gas 45/11 of 14 April 2011). It also introduced market mechanisms to increase the flexibility and liquidity of supply. These envisage the creation of a platform at central level that will enable all operators to buy, on an economic‐merit basis (i.e., the best‐value offering), the resources needed to balance their own positions and ensure that the network is balanced at all times, in the interests of system security. More specifically, on the platform (organised by the Energy Market Operator – GME), operators will state their readiness to increase or reduce the amount of gas injected to or withdrawn from storage. The operator responsible for balancing, Snam Rete Gas, will acquire the resources necessary to ensure that the system is balanced.
Initially set for 1 July, to allow the necessary time to prepare the platform and procedures, the start of the new system has been postponed until 1 December 2011. This was partly to ensure that enough time is available to complete the regulatory framework needed for it to function (and in particular to define the regulations governing physical and economic settlements in the balancing service, currently still being drawn up).
Under the new system, called the Market‐based Simplified Balancing System (Italian initials SBSM), the major transport company (Snam Rete Gas) will acquire the necessary storage resources in the new, dedicated market (MB‐GAS) to maintain a balance of withdrawals from and injections to the network. The practice of automatically attributing all imbalances to variations in shippers’ storage availability will therefore cease.
Balancing will continue to be practised on a daily basis and at a nationwide level, i.e. over one national zone.
Participation in the market by holders of storage resources is obligatory. Later on, the market will be extended to other resources, starting with LNG and then import modulation.
The market will be conducted in one daily session that is contiguous with – but separate from – the day‐ahead market session (MGP‐GAS). A single price will be defined for use in settling all imbalances. In general (i.e., apart from situations of scarcity of supply or system emergencies), it will be equal to the price of the last offer accepted. There will be no margins of tolerance.
More precisely, the GME will be required to match offers/bids by merit order of the purchase bids, based on a descending scale of prices offered, and by merit order of sales offerings, based on an rising scale of prices offered, in order to maximise the net value of the transactions completed. The remuneration price of the quantities entailed in the combined offers will be equal to:
the price associated with the balancing operator’s offer, in cases where the quantities entailed in accepted offers by authorised users are lower than those associated with the balancing operator’s offer;
zero, in emergency situations caused by excess gas and in cases where excess network capacity cannot be offset by purchase bids;
7 See Consultation documents DCO 25/10 of 26 July 2010 and DCO 45/10 of 2 December 2010.
4. Regulation and performance of the natural gas market 31/07/2011
The Italian Regulatory Authority for Electricity and Gas (AEEG) Page 56 of 106
the price of replenishing strategic storage, with an additional 3.5 €/GJ (13.34 €c/m3 per 9,100 kcal), in emergency situations caused by gas scarcity, and in cases where the offerings on the MB‐GAS are not sufficient to cover the imbalance;
the average price recorded in the previous 30 days (with the exception of the emergency situations outlined here), in the event that the quantities entailed in accepted offers are lower than 6,000 GJ;
the price of the last accepted offer/bid running counter to that of the balancing operator in all other cases.
“Authorised users” holding storage resources will be required to submit offers and bids to buy and to sell gas (a maximum of 10 for each type) at freely determined prices. Offers/bids, which must be submitted no later than 20.00 hours of the gas‐day, should refer to volumes of gas ranging from a minimum (unused injection or delivery capacity) to a maximum (free space or gas in storage). All mutually compatible offers/bids will be accepted. In the early stages only, offers/bids accepted on the MB‐GAS will be limited to the volumes necessary to cover the overall imbalance in the transport network.
Under the new system, the quantities delivered from or injected into storage by each user will be based on the volumes scheduled for delivery or injection and any volumes traded on the platform. This makes it possible to determine the amount held in storage by each user on the day following that of flow, thus resolving one of the critical points of the current system, where the amounts held are only made known after the transport balance has been drawn up (3 months after the day of flow).
The possibility of reformulating the schedules on the “gas day” itself, up to 17.00 hours, has also been introduced (previously the deadline was the previous day). The aim here is to give users additional instruments to adjust their positions. Initially, re‐scheduling will only be possible for storage and network withdrawals.
The MB‐GAS will be operated by GME. The role of central counterparty for transactions will be performed by the main transport company, as operator responsible for balancing.
In reforming the balancing system, Resolution ARG/gas 45/11 introduced changes to the regulations governing the transport and storage services (established by Resolution 137/02 and 119/05 respectively). These will now need to be transferred to the respective Codes, subject to consultation with users.
Safety and quality of gas services – Transport
The quality of the gas transport service is currently regulated by Resolution ARG/gas 141/09 of 1 October 2009. With this, the Authority approved Part 1 – Regulation of the Quality of the Natural Gas Transport Service for Regulatory Period 2010‐13 (RQTG) – of the Consolidated Text for the Regulation of Quality and Tariffs in the Natural Gas Transport and Dispatching Services for 2010‐13 (TUTG)8.
The Authority regulates gas quality through Resolution 185/05 of 6 September 2005. This established service obligations and the availability of gross calorific value (GCV) measurements as
8 Resolution ARG/gas 184/09 saw the approval of Part II – Tariff Regulation for the Natural Gas Transport and Dispatching Services (RTTG) and Part III – Tariff Regulation for the Natural Gas Transport Metering Service (RMTG).
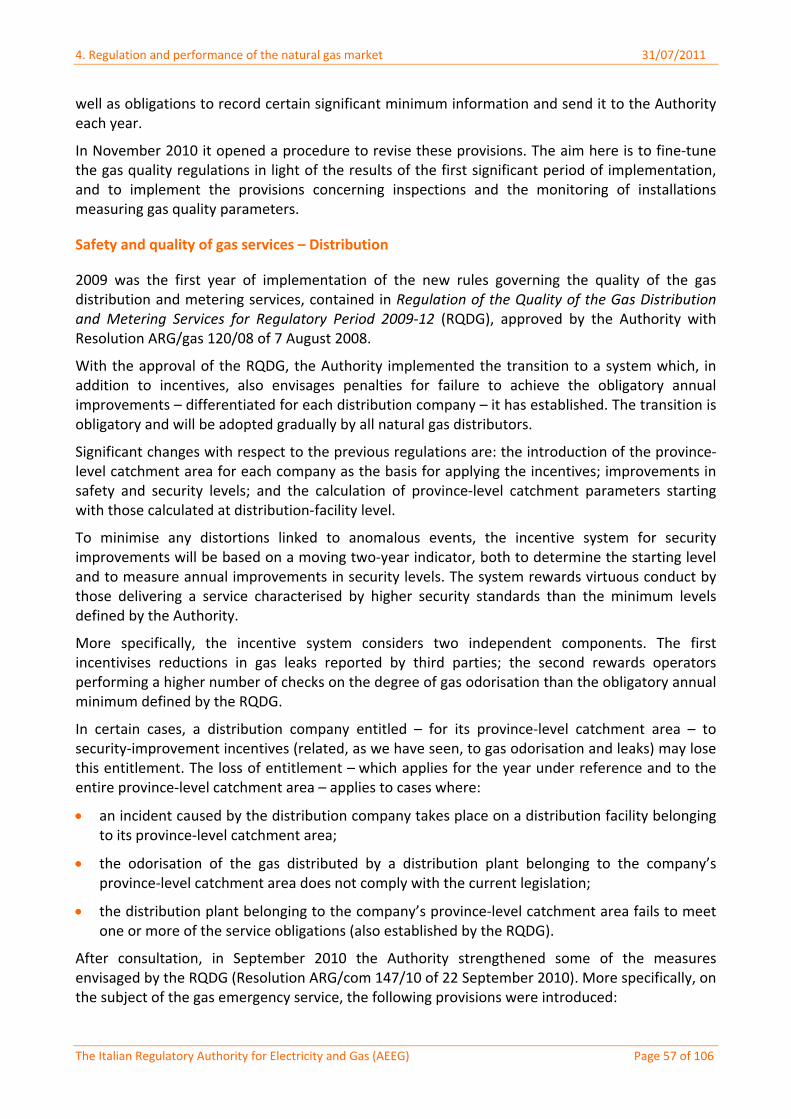
4. Regulation and performance of the natural gas market 31/07/2011
The Italian Regulatory Authority for Electricity and Gas (AEEG) Page 57 of 106
well as obligations to record certain significant minimum information and send it to the Authority each year.
In November 2010 it opened a procedure to revise these provisions. The aim here is to fine‐tune the gas quality regulations in light of the results of the first significant period of implementation, and to implement the provisions concerning inspections and the monitoring of installations measuring gas quality parameters.
Safety and quality of gas services – Distribution
2009 was the first year of implementation of the new rules governing the quality of the gas distribution and metering services, contained in Regulation of the Quality of the Gas Distribution and Metering Services for Regulatory Period 2009‐12 (RQDG), approved by the Authority with Resolution ARG/gas 120/08 of 7 August 2008.
With the approval of the RQDG, the Authority implemented the transition to a system which, in addition to incentives, also envisages penalties for failure to achieve the obligatory annual improvements – differentiated for each distribution company – it has established. The transition is obligatory and will be adopted gradually by all natural gas distributors.
Significant changes with respect to the previous regulations are: the introduction of the province‐level catchment area for each company as the basis for applying the incentives; improvements in safety and security levels; and the calculation of province‐level catchment parameters starting with those calculated at distribution‐facility level.
To minimise any distortions linked to anomalous events, the incentive system for security improvements will be based on a moving two‐year indicator, both to determine the starting level and to measure annual improvements in security levels. The system rewards virtuous conduct by those delivering a service characterised by higher security standards than the minimum levels defined by the Authority.
More specifically, the incentive system considers two independent components. The first incentivises reductions in gas leaks reported by third parties; the second rewards operators performing a higher number of checks on the degree of gas odorisation than the obligatory annual minimum defined by the RQDG.
In certain cases, a distribution company entitled – for its province‐level catchment area – to security‐improvement incentives (related, as we have seen, to gas odorisation and leaks) may lose this entitlement. The loss of entitlement – which applies for the year under reference and to the entire province‐level catchment area – applies to cases where:
an incident caused by the distribution company takes place on a distribution facility belonging to its province‐level catchment area;
the odorisation of the gas distributed by a distribution plant belonging to the company’s province‐level catchment area does not comply with the current legislation;
the distribution plant belonging to the company’s province‐level catchment area fails to meet one or more of the service obligations (also established by the RQDG).
After consultation, in September 2010 the Authority strengthened some of the measures envisaged by the RQDG (Resolution ARG/com 147/10 of 22 September 2010). More specifically, on the subject of the gas emergency service, the following provisions were introduced:
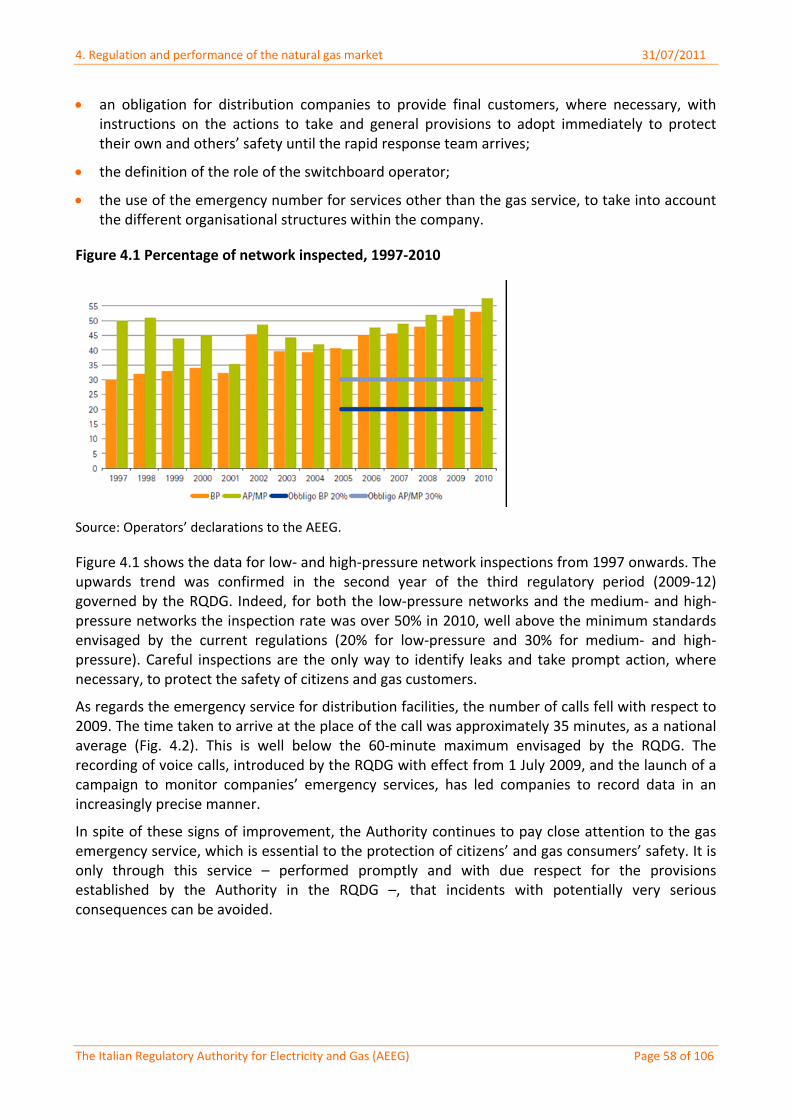
4. Regulation and performance of the natural gas market 31/07/2011
The Italian Regulatory Authority for Electricity and Gas (AEEG) Page 58 of 106
an obligation for distribution companies to provide final customers, where necessary, with instructions on the actions to take and general provisions to adopt immediately to protect their own and others’ safety until the rapid response team arrives;
the definition of the role of the switchboard operator;
the use of the emergency number for services other than the gas service, to take into account the different organisational structures within the company.
Figure 4.1 Percentage of network inspected, 1997‐2010
Source: Operators’ declarations to the AEEG.
Figure 4.1 shows the data for low‐ and high‐pressure network inspections from 1997 onwards. The upwards trend was confirmed in the second year of the third regulatory period (2009‐12) governed by the RQDG. Indeed, for both the low‐pressure networks and the medium‐ and high‐pressure networks the inspection rate was over 50% in 2010, well above the minimum standards envisaged by the current regulations (20% for low‐pressure and 30% for medium‐ and high‐pressure). Careful inspections are the only way to identify leaks and take prompt action, where necessary, to protect the safety of citizens and gas customers.
As regards the emergency service for distribution facilities, the number of calls fell with respect to 2009. The time taken to arrive at the place of the call was approximately 35 minutes, as a national average (Fig. 4.2). This is well below the 60‐minute maximum envisaged by the RQDG. The recording of voice calls, introduced by the RQDG with effect from 1 July 2009, and the launch of a campaign to monitor companies’ emergency services, has led companies to record data in an increasingly precise manner.
In spite of these signs of improvement, the Authority continues to pay close attention to the gas emergency service, which is essential to the protection of citizens’ and gas consumers’ safety. It is only through this service – performed promptly and with due respect for the provisions established by the Authority in the RQDG –, that incidents with potentially very serious consequences can be avoided.
4. Regulation and performance of the natural gas market 31/07/2011
The Italian Regulatory Authority for Electricity and Gas (AEEG) Page 59 of 106
Figure 4.2 Emergency calls at distribution plant, 2001‐20
Actual average time (in minutes) and number of calls
Source: Operators’ declarations to the AEEG.
An analysis of the data submitted by operators reveals that from 2009 to 2010:
the number of gas leaks located following scheduled network inspections fell from 15,178 to 8,862; however, the number of leaks located on the network and the underground part, usually more dangerous, remained essentially unchanged. Leaks located on the aerial part of the user derivation plant showed a significant reduction.
gas leaks located following reports by third persons decreased from 161,394 to 140,296; those normally most risky, i.e. leaks on the network and in the underground part of the system, decreased from 16,408 to 13,918. Leaks located on the aerial part of the user derivation plant and at metering units also diminished (from 144,986 to 126,378)
Still on the subject of gas leaks located following reports by third persons, 2010 saw a significant reduction both in the underground and aerial parts of the user derivation plant. It should be noted that the current regulations are driving the system towards ever‐higher levels of safety in the gas distribution service. This can be attributed to the combined effect of the Authority’s oversight activity and the system of incentives and penalties designed, inter alia, to reduce gas leaks on the network. Category A1 leaks, the most dangerous kind, diminished by 17%.
Safety and quality of gas services – Storage
With Resolution ARG/gas 204/10 of 22 November 2010, the Authority approved Part 1 – Regulation of the Quality of the Natural Gas Storage Service for Regulatory Period 2011‐14 (RQSG) of the Consolidated Text for the Regulation of Quality and Tariffs in the Natural Gas Storage Service for Regulatory Period 2011‐14 (TUSG)9.
Both proceedings underwent the Regulatory Impact Analysis (RIA) applied to the Authority’s most important provisions. The Authority also asked operators to provide information for a preliminary survey of the operational practices adopted by Stogit and Edison Stoccaggio in matters of safety,
9 As seen earlier, Part II of the TUSG, containing the Tariff Regulation for the Natural Gas Storage Service for Regulatory Period 2011‐2014 (RTSG), was issued through Resolution ARG/gas 119/10.
4. Regulation and performance of the natural gas market 31/07/2011
The Italian Regulatory Authority for Electricity and Gas (AEEG) Page 60 of 106
continuity and commercial quality. Technical meetings were also organised with the various stakeholders. In addition, the Authority conducted an international benchmarking analysis on the quality of the natural gas storage service in other European countries (United Kingdom, France and Germany).
The RQSG is divided into sections that govern, respectively, the security, continuity and quality of the storage service. The data‐recording and communication obligations that storage companies must comply with have been formulated in such a way as to facilitate the Authority’s oversight and monitoring of the data submitted to it. The aim here is to ensure that the new regulations, which will take effect in gradual stages, are implemented in full. The provisions governing security and commercial quality entered into force on 1 April 2011, at the start of the new thermal year (2011‐12).
The rules contained in Resolution ARG/gas 204/10 must be transposed into the Storage Codes when these are up‐dated. These up‐dates are vital procedures, since the Codes provide the normative architecture for the commitments between storage companies and service users. The provisions contained in them help ensure that the RQSG, to which they are complementary, is applied effectively.
Commercial quality of gas distribution service
The regulation of commercial quality was introduced on 1 January 2001 with the entry into force of Resolution 47/00 of 2 March 2000. For the 3rd regulatory period it has been incorporated in part I of the TUDG, Regulation of the Quality of the Gas Distribution and Metering Services for Regulatory period 2009‐12 (RQDG), described in detail in the Annual Report for 2009.
2009 saw a number of amendments to the RQDG concerning the reconstruction of consumption following ascertained metering faults; the management of appointments; and the collection of metering data.
The main innovations concerning commercial quality in the distribution service can be summarised as follows:
the definition of an overall standard for the indicator concerning the time available to sellers to set appointments with final customers, the aim being to identify the tasks and responsibility of the counterparties more precisely in order to better protect consumers’ rights;
the introduction of new rules governing the way times are calculated. More specifically, these reiterate that the time needed to set appointments must be calculated by the distributor without interruptions;
distributors have been given the task of making appointments directly with final customers both for services requiring prior authorisation and for the reactivation of supply following suspension for an emergency, given that it is to the distributor that customers submit their requests;
the scope of the rules applicable to postponed appointments has been extended to checks of metering units or supply pressure, and to the provision of technical data;
a guaranteed standard concerning the collection of metering data recorded by an accessible meter (one which allows access to view consumption without any need for a person to be present) has been introduced. It applies to distributors and refers to low‐pressure customers. The aim of this standard is to guarantee the commercial quality of the metering service with respect to the interests concerned and in consideration of the remuneration of metering

4. Regulation and performance of the natural gas market 31/07/2011
The Italian Regulatory Authority for Electricity and Gas (AEEG) Page 61 of 106
activity itself, contained in the distribution tariff. The standard was defined as the time between the date of the attempt to collect the metering data, for a redelivery point with accessible meter, and the date of the subsequent attempt, for the same point, with due respect for both the maximum and minimum intervals envisaged;
as regards the guaranteed standard referred to above, an automatic €30 compensation payment to customers has been introduced. This must be paid by the distributor through the sales company;
registration obligations have also introduced for operators. However, they have been given adequate time to bring their procedures into line with the amended regulations.
In examining the quality data for the distribution service, we should bear in mind that new rules governing automatic compensation payments came into force in 2010. These envisage an increase in the basic amount due for delays in carrying out the service, excluding the punctuality band for appointments requested. As a consequence, the data for 2010 are not directly comparable with those for the previous two years. Indeed, the progressive reduction in the number of cases of failure to meet the standards subject to automatic compensation was transformed in 2010 into an increase of 36%.
In absolute terms, last year saw 21,172 cases of failure to meet the guaranteed standards, compared with 15,578 in 2009. 19,468 automatic compensation payments, totalling €992,347, were paid to customers. In the case of single services subject to guaranteed standards already in force in 2009, the data show a reduction in the number of cases of failure to meet the standards for causes attributable to the distribution company. This confirms the improvement seen in recent years and the effectiveness of the instruments companies themselves have put in place to meet customers’ needs with ever‐growing efficiency and speed.
With respect to 2009, a notable improvement can be seen in the performance of simple works. However, this part of the service, along with metering‐unit checks, continues to generate some of the highest numbers of failures to meet the standard and therefore of compensation payments. The data show an improving trend for all services, with the exception of reactivation after disconnection for default and the deactivation of supply at the customer’s request.
Commercial quality of the gas sales service
The review of commercial quality regulation for the sale of electricity and gas, governed by the Consolidated Text for the Regulation of Quality in the Electricity and Natural Gas Sales Services (TIQV), was introduced by Resolution ARG/com 164/08 of 18 November 2008 and came into force on 1 July 2009. The TIQV defines the rules laid down to ensure that written complaints and requests for information, and billing corrections, are all handled as promptly as possible. It also establishes automatic compensation for consumers.
Resolution ARG/com 147/10 amended and supplemented the TIQV. More specifically, for both the electricity and gas sectors a guaranteed standard of two days was introduced for sellers to forward customer complaints and other communications to distributors (this is significant to final customers who need the distributor to carry out a service). If this timescale is not respected the customer receives an automatic compensation payment of €30. For this new guaranteed standard, obligatory registration and communication requirements have also been introduced in order to monitor compliance.
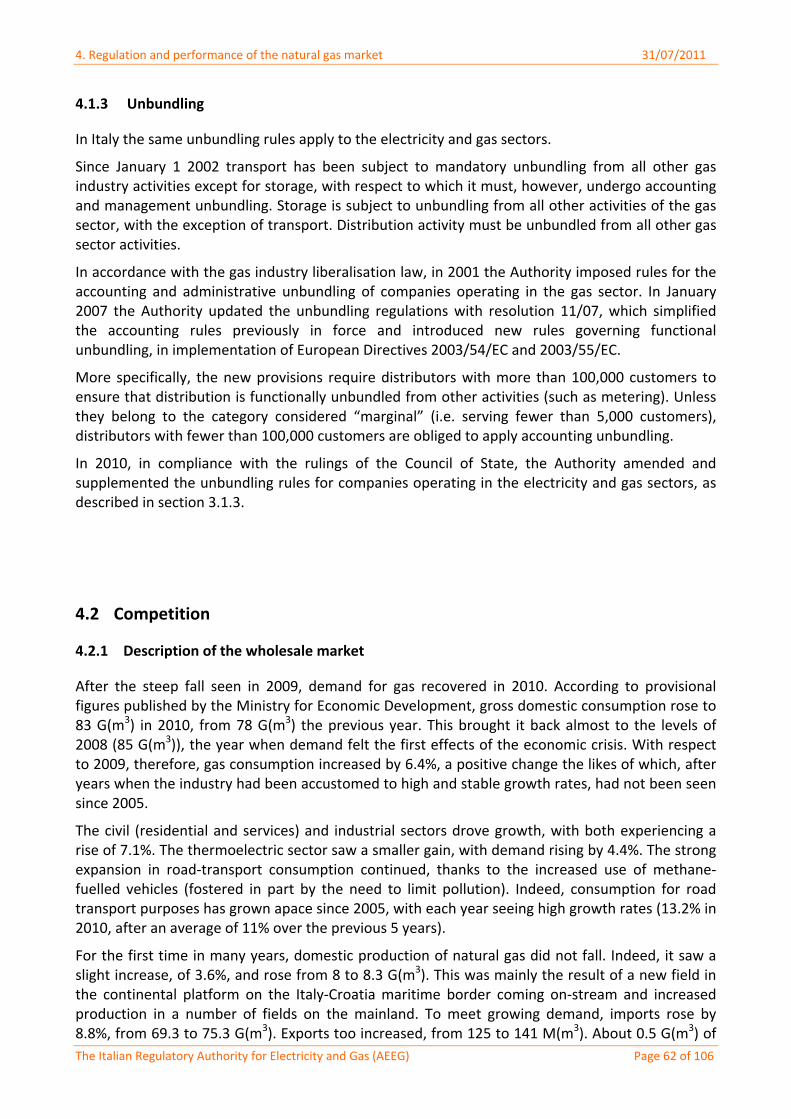
4. Regulation and performance of the natural gas market 31/07/2011
The Italian Regulatory Authority for Electricity and Gas (AEEG) Page 62 of 106
4.1.3 Unbundling
In Italy the same unbundling rules apply to the electricity and gas sectors.
Since January 1 2002 transport has been subject to mandatory unbundling from all other gas industry activities except for storage, with respect to which it must, however, undergo accounting and management unbundling. Storage is subject to unbundling from all other activities of the gas sector, with the exception of transport. Distribution activity must be unbundled from all other gas sector activities.
In accordance with the gas industry liberalisation law, in 2001 the Authority imposed rules for the accounting and administrative unbundling of companies operating in the gas sector. In January 2007 the Authority updated the unbundling regulations with resolution 11/07, which simplified the accounting rules previously in force and introduced new rules governing functional unbundling, in implementation of European Directives 2003/54/EC and 2003/55/EC.
More specifically, the new provisions require distributors with more than 100,000 customers to ensure that distribution is functionally unbundled from other activities (such as metering). Unless they belong to the category considered “marginal” (i.e. serving fewer than 5,000 customers), distributors with fewer than 100,000 customers are obliged to apply accounting unbundling.
In 2010, in compliance with the rulings of the Council of State, the Authority amended and supplemented the unbundling rules for companies operating in the electricity and gas sectors, as described in section 3.1.3.
4.2 Competition
4.2.1 Description of the wholesale market
After the steep fall seen in 2009, demand for gas recovered in 2010. According to provisional figures published by the Ministry for Economic Development, gross domestic consumption rose to 83 G(m3) in 2010, from 78 G(m3) the previous year. This brought it back almost to the levels of 2008 (85 G(m3)), the year when demand felt the first effects of the economic crisis. With respect to 2009, therefore, gas consumption increased by 6.4%, a positive change the likes of which, after years when the industry had been accustomed to high and stable growth rates, had not been seen since 2005.
The civil (residential and services) and industrial sectors drove growth, with both experiencing a rise of 7.1%. The thermoelectric sector saw a smaller gain, with demand rising by 4.4%. The strong expansion in road‐transport consumption continued, thanks to the increased use of methane‐fuelled vehicles (fostered in part by the need to limit pollution). Indeed, consumption for road transport purposes has grown apace since 2005, with each year seeing high growth rates (13.2% in 2010, after an average of 11% over the previous 5 years).
For the first time in many years, domestic production of natural gas did not fall. Indeed, it saw a slight increase, of 3.6%, and rose from 8 to 8.3 G(m3). This was mainly the result of a new field in the continental platform on the Italy‐Croatia maritime border coming on‐stream and increased production in a number of fields on the mainland. To meet growing demand, imports rose by 8.8%, from 69.3 to 75.3 G(m3). Exports too increased, from 125 to 141 M(m3). About 0.5 G(m3) of
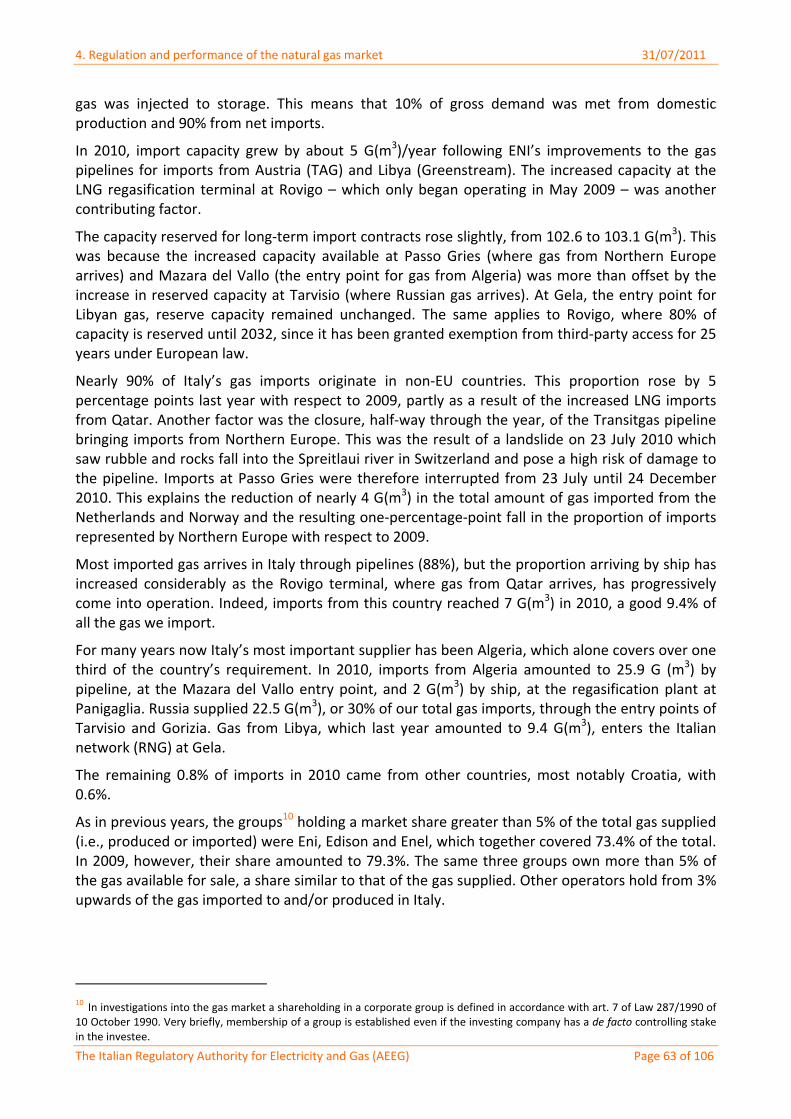
4. Regulation and performance of the natural gas market 31/07/2011
The Italian Regulatory Authority for Electricity and Gas (AEEG) Page 63 of 106
gas was injected to storage. This means that 10% of gross demand was met from domestic production and 90% from net imports.
In 2010, import capacity grew by about 5 G(m3)/year following ENI’s improvements to the gas pipelines for imports from Austria (TAG) and Libya (Greenstream). The increased capacity at the LNG regasification terminal at Rovigo – which only began operating in May 2009 – was another contributing factor.
The capacity reserved for long‐term import contracts rose slightly, from 102.6 to 103.1 G(m3). This was because the increased capacity available at Passo Gries (where gas from Northern Europe arrives) and Mazara del Vallo (the entry point for gas from Algeria) was more than offset by the increase in reserved capacity at Tarvisio (where Russian gas arrives). At Gela, the entry point for Libyan gas, reserve capacity remained unchanged. The same applies to Rovigo, where 80% of capacity is reserved until 2032, since it has been granted exemption from third‐party access for 25 years under European law.
Nearly 90% of Italy’s gas imports originate in non‐EU countries. This proportion rose by 5 percentage points last year with respect to 2009, partly as a result of the increased LNG imports from Qatar. Another factor was the closure, half‐way through the year, of the Transitgas pipeline bringing imports from Northern Europe. This was the result of a landslide on 23 July 2010 which saw rubble and rocks fall into the Spreitlaui river in Switzerland and pose a high risk of damage to the pipeline. Imports at Passo Gries were therefore interrupted from 23 July until 24 December 2010. This explains the reduction of nearly 4 G(m3) in the total amount of gas imported from the Netherlands and Norway and the resulting one‐percentage‐point fall in the proportion of imports represented by Northern Europe with respect to 2009.
Most imported gas arrives in Italy through pipelines (88%), but the proportion arriving by ship has increased considerably as the Rovigo terminal, where gas from Qatar arrives, has progressively come into operation. Indeed, imports from this country reached 7 G(m3) in 2010, a good 9.4% of all the gas we import.
For many years now Italy’s most important supplier has been Algeria, which alone covers over one third of the country’s requirement. In 2010, imports from Algeria amounted to 25.9 G (m3) by pipeline, at the Mazara del Vallo entry point, and 2 G(m3) by ship, at the regasification plant at Panigaglia. Russia supplied 22.5 G(m3), or 30% of our total gas imports, through the entry points of Tarvisio and Gorizia. Gas from Libya, which last year amounted to 9.4 G(m3), enters the Italian network (RNG) at Gela.
The remaining 0.8% of imports in 2010 came from other countries, most notably Croatia, with 0.6%.
As in previous years, the groups10 holding a market share greater than 5% of the total gas supplied (i.e., produced or imported) were Eni, Edison and Enel, which together covered 73.4% of the total. In 2009, however, their share amounted to 79.3%. The same three groups own more than 5% of the gas available for sale, a share similar to that of the gas supplied. Other operators hold from 3% upwards of the gas imported to and/or produced in Italy.
10 In investigations into the gas market a shareholding in a corporate group is defined in accordance with art. 7 of Law 287/1990 of 10 October 1990. Very briefly, membership of a group is established even if the investing company has a de facto controlling stake in the investee.
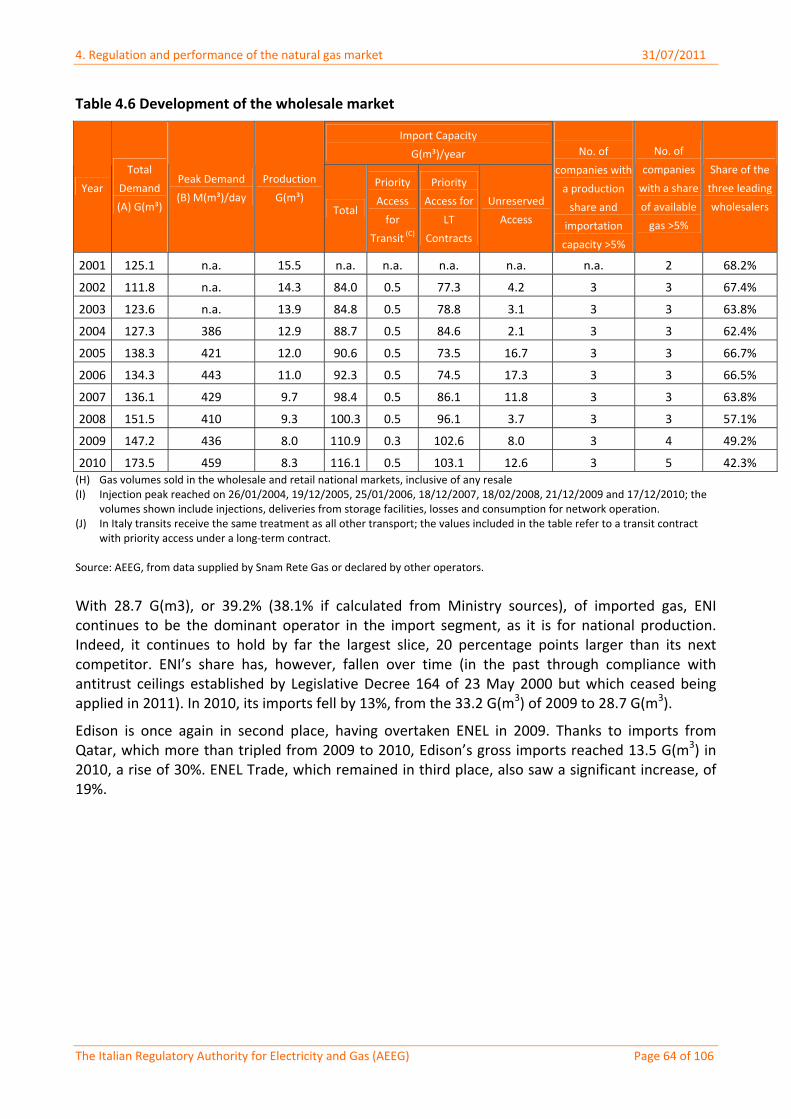
4. Regulation and performance of the natural gas market 31/07/2011
The Italian Regulatory Authority for Electricity and Gas (AEEG) Page 64 of 106
Table 4.6 Development of the wholesale market
Import Capacity
G(m³)/year
Year
Total
Demand
(A) G(m³)
Peak Demand
(B) M(m³)/day
Production
G(m³) Total
Priority
Access
for
Transit (C)
Priority
Access for
LT
Contracts
Unreserved
Access
No. of
companies with
a production
share and
importation
capacity >5%
No. of
companies
with a share
of available
gas >5%
Share of the
three leading
wholesalers
2001 125.1 n.a. 15.5 n.a. n.a. n.a. n.a. n.a. 2 68.2%
2002 111.8 n.a. 14.3 84.0 0.5 77.3 4.2 3 3 67.4%
2003 123.6 n.a. 13.9 84.8 0.5 78.8 3.1 3 3 63.8%
2004 127.3 386 12.9 88.7 0.5 84.6 2.1 3 3 62.4%
2005 138.3 421 12.0 90.6 0.5 73.5 16.7 3 3 66.7%
2006 134.3 443 11.0 92.3 0.5 74.5 17.3 3 3 66.5%
2007 136.1 429 9.7 98.4 0.5 86.1 11.8 3 3 63.8%
2008 151.5 410 9.3 100.3 0.5 96.1 3.7 3 3 57.1%
2009 147.2 436 8.0 110.9 0.3 102.6 8.0 3 4 49.2%
2010 173.5 459 8.3 116.1 0.5 103.1 12.6 3 5 42.3% (H) Gas volumes sold in the wholesale and retail national markets, inclusive of any resale (I) Injection peak reached on 26/01/2004, 19/12/2005, 25/01/2006, 18/12/2007, 18/02/2008, 21/12/2009 and 17/12/2010; the
volumes shown include injections, deliveries from storage facilities, losses and consumption for network operation. (J) In Italy transits receive the same treatment as all other transport; the values included in the table refer to a transit contract
with priority access under a long‐term contract. Source: AEEG, from data supplied by Snam Rete Gas or declared by other operators.
With 28.7 G(m3), or 39.2% (38.1% if calculated from Ministry sources), of imported gas, ENI continues to be the dominant operator in the import segment, as it is for national production. Indeed, it continues to hold by far the largest slice, 20 percentage points larger than its next competitor. ENI’s share has, however, fallen over time (in the past through compliance with antitrust ceilings established by Legislative Decree 164 of 23 May 2000 but which ceased being applied in 2011). In 2010, its imports fell by 13%, from the 33.2 G(m3) of 2009 to 28.7 G(m3).
Edison is once again in second place, having overtaken ENEL in 2009. Thanks to imports from Qatar, which more than tripled from 2009 to 2010, Edison’s gross imports reached 13.5 G(m3) in 2010, a rise of 30%. ENEL Trade, which remained in third place, also saw a significant increase, of 19%.
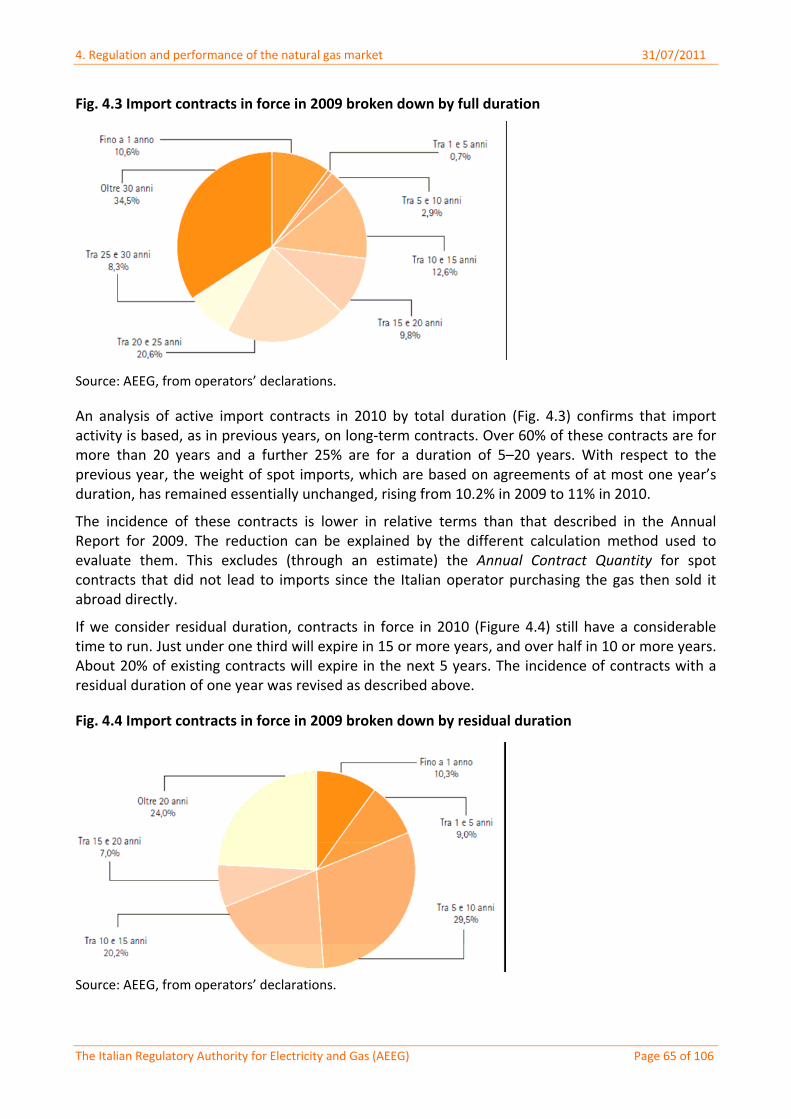
4. Regulation and performance of the natural gas market 31/07/2011
The Italian Regulatory Authority for Electricity and Gas (AEEG) Page 65 of 106
Fig. 4.3 Import contracts in force in 2009 broken down by full duration
Source: AEEG, from operators’ declarations.
An analysis of active import contracts in 2010 by total duration (Fig. 4.3) confirms that import activity is based, as in previous years, on long‐term contracts. Over 60% of these contracts are for more than 20 years and a further 25% are for a duration of 5–20 years. With respect to the previous year, the weight of spot imports, which are based on agreements of at most one year’s duration, has remained essentially unchanged, rising from 10.2% in 2009 to 11% in 2010.
The incidence of these contracts is lower in relative terms than that described in the Annual Report for 2009. The reduction can be explained by the different calculation method used to evaluate them. This excludes (through an estimate) the Annual Contract Quantity for spot contracts that did not lead to imports since the Italian operator purchasing the gas then sold it abroad directly.
If we consider residual duration, contracts in force in 2010 (Figure 4.4) still have a considerable time to run. Just under one third will expire in 15 or more years, and over half in 10 or more years. About 20% of existing contracts will expire in the next 5 years. The incidence of contracts with a residual duration of one year was revised as described above.
Fig. 4.4 Import contracts in force in 2009 broken down by residual duration
Source: AEEG, from operators’ declarations.
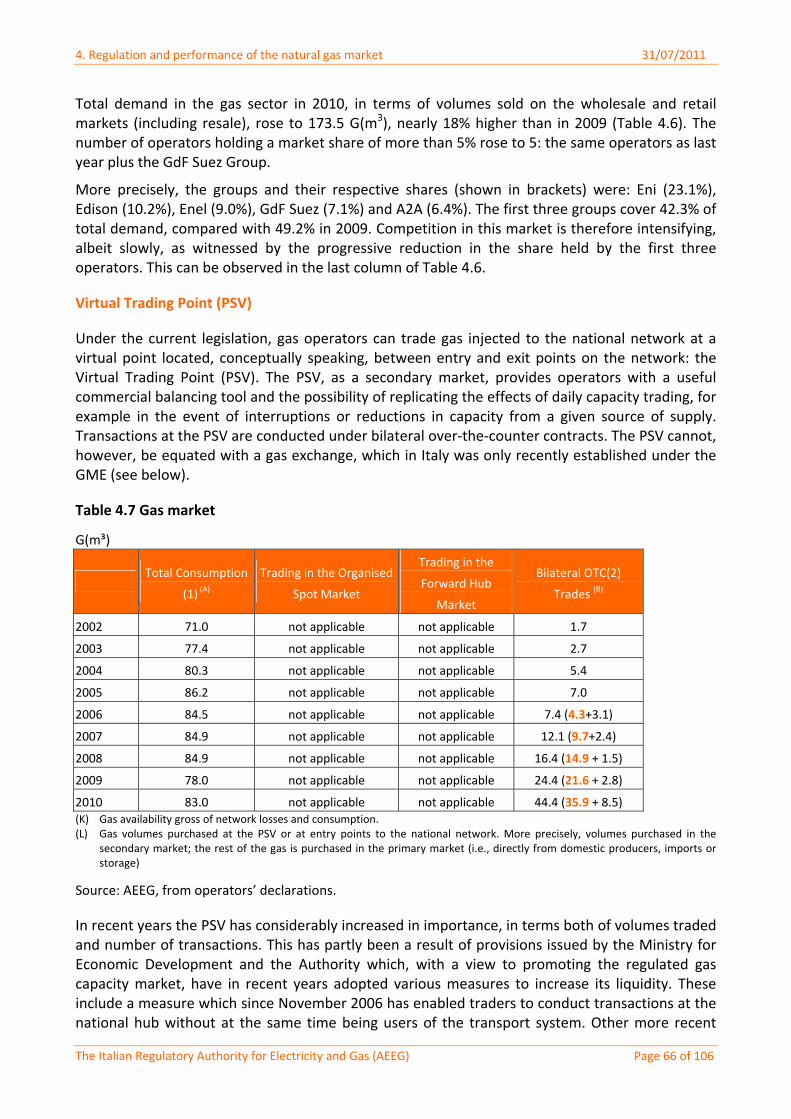
4. Regulation and performance of the natural gas market 31/07/2011
The Italian Regulatory Authority for Electricity and Gas (AEEG) Page 66 of 106
Total demand in the gas sector in 2010, in terms of volumes sold on the wholesale and retail markets (including resale), rose to 173.5 G(m3), nearly 18% higher than in 2009 (Table 4.6). The number of operators holding a market share of more than 5% rose to 5: the same operators as last year plus the GdF Suez Group.
More precisely, the groups and their respective shares (shown in brackets) were: Eni (23.1%), Edison (10.2%), Enel (9.0%), GdF Suez (7.1%) and A2A (6.4%). The first three groups cover 42.3% of total demand, compared with 49.2% in 2009. Competition in this market is therefore intensifying, albeit slowly, as witnessed by the progressive reduction in the share held by the first three operators. This can be observed in the last column of Table 4.6.
Virtual Trading Point (PSV)
Under the current legislation, gas operators can trade gas injected to the national network at a virtual point located, conceptually speaking, between entry and exit points on the network: the Virtual Trading Point (PSV). The PSV, as a secondary market, provides operators with a useful commercial balancing tool and the possibility of replicating the effects of daily capacity trading, for example in the event of interruptions or reductions in capacity from a given source of supply. Transactions at the PSV are conducted under bilateral over‐the‐counter contracts. The PSV cannot, however, be equated with a gas exchange, which in Italy was only recently established under the GME (see below).
Table 4.7 Gas market
G(m³)
Total Consumption
(1) (A) Trading in the Organised
Spot Market
Trading in the
Forward Hub
Market
Bilateral OTC(2)
Trades (B)
2002 71.0 not applicable not applicable 1.7
2003 77.4 not applicable not applicable 2.7
2004 80.3 not applicable not applicable 5.4
2005 86.2 not applicable not applicable 7.0
2006 84.5 not applicable not applicable 7.4 (4.3+3.1)
2007 84.9 not applicable not applicable 12.1 (9.7+2.4)
2008 84.9 not applicable not applicable 16.4 (14.9 + 1.5)
2009 78.0 not applicable not applicable 24.4 (21.6 + 2.8)
2010 83.0 not applicable not applicable 44.4 (35.9 + 8.5) (K) Gas availability gross of network losses and consumption. (L) Gas volumes purchased at the PSV or at entry points to the national network. More precisely, volumes purchased in the
secondary market; the rest of the gas is purchased in the primary market (i.e., directly from domestic producers, imports or storage)
Source: AEEG, from operators’ declarations.
In recent years the PSV has considerably increased in importance, in terms both of volumes traded and number of transactions. This has partly been a result of provisions issued by the Ministry for Economic Development and the Authority which, with a view to promoting the regulated gas capacity market, have in recent years adopted various measures to increase its liquidity. These include a measure which since November 2006 has enabled traders to conduct transactions at the national hub without at the same time being users of the transport system. Other more recent
4. Regulation and performance of the natural gas market 31/07/2011
The Italian Regulatory Authority for Electricity and Gas (AEEG) Page 67 of 106
measures envisaged the obligation to offer quotas of imported gas on the PSV on which, in 2010, 106 operators exchanged, sold and purchased gas. Of these, 32 were pure traders, in that they were not users of the transport system. The number of traders grew considerably in 2010, if we consider that the same figures for 2009 give 82 operators engaging in trading, only 22 of which not users of the transport system.
In 2010, transactions on the PSV reached 35.9 G(m3). This is because, of the 44.4 G(m3) in volumes actually traded, as indicated in Table 4.7, 8.5 G(m3) actually involve gas redelivery at the Panigaglia and Rovigo regasification terminals. These redeliveries, although recorded as operations at the PSV, are not the result of transactions between operators on the secondary market. Compared with the 21.6 G(m3) recorded in 2009, traded volumes have therefore grown by 66%, to 43% of gross national consumption, which amounts to 83 G(m3).
Only 0.6 G(m3) of total transactions involve volumes purchased by ENI, which then transferred them to the PSV through gas release operations as a result of provisions issued by the Antitrust Authority.
Gas exchange
The first step towards the creation of a Gas Exchange in Italy was Decree law 7 of 31 January 2007, confirmed as Law 40 of 2 April 2007. This established the obligation:
for holders of natural gas extraction concessions, to transfer quotas of domestically produced gas due to the state;
for importers, to offer a quota of imported gas on the regulated capacity market.
The arrangements for the transfer of the quotas were then defined with later provisions issued by the Ministry for Economic Development and the Authority and adopted between 2009 and 2009. With Law 99 of 23 July 2009, the economic management of the gas market was entrusted solely to the GME which, under the same law and within 6 months of its entry into force, was required to take on the management of sales and purchase bids/offers (and all related services) on an economic merit basis.
However, the initial core of the Exchange was actually created last year, with the Ministry for Economic Development’s decree of 18 March 2010 setting up the Trading Platform for imported gas, called “P‐GAS”. The decree established that with effect from 10 May 2010 importers should place their obligatory quotas of imported natural gas for transfer solely on the new Trading Platform (in the “import segment”). The decree also established that further offerings of gas by operators other than those bound by the obligations imposed by Decree Law 7/2007 may be admitted to the Platform. Indeed, operators authorised to trade on the PSV are also entitled to do so on the P‐GAS, where the products traded are contracts with delivery periods of one month or one thermal year. The GME simply acts as platform operator and not as central counterparty: guarantees, billing and payments are handled directly by the operators selling the gas. Trading is continuous for the import quotas transferred on a compulsory basis on the P‐GAS.
Since August 2010, trading in the domestically produced gas quotas due to the state has been added to trading in imported gas, with gas produced in Italy traded in the “quota segment” of the P‐GAS. Once again, the GME is not the central counterparty and operates solely as organiser and operator of the platform, while trading is conducted on an auction basis.
The actual spot market for natural gas, with the GME acting as central counterparty, was launched in October 2010 with the creation of the M‐GAS. On this market, operators authorised to conduct
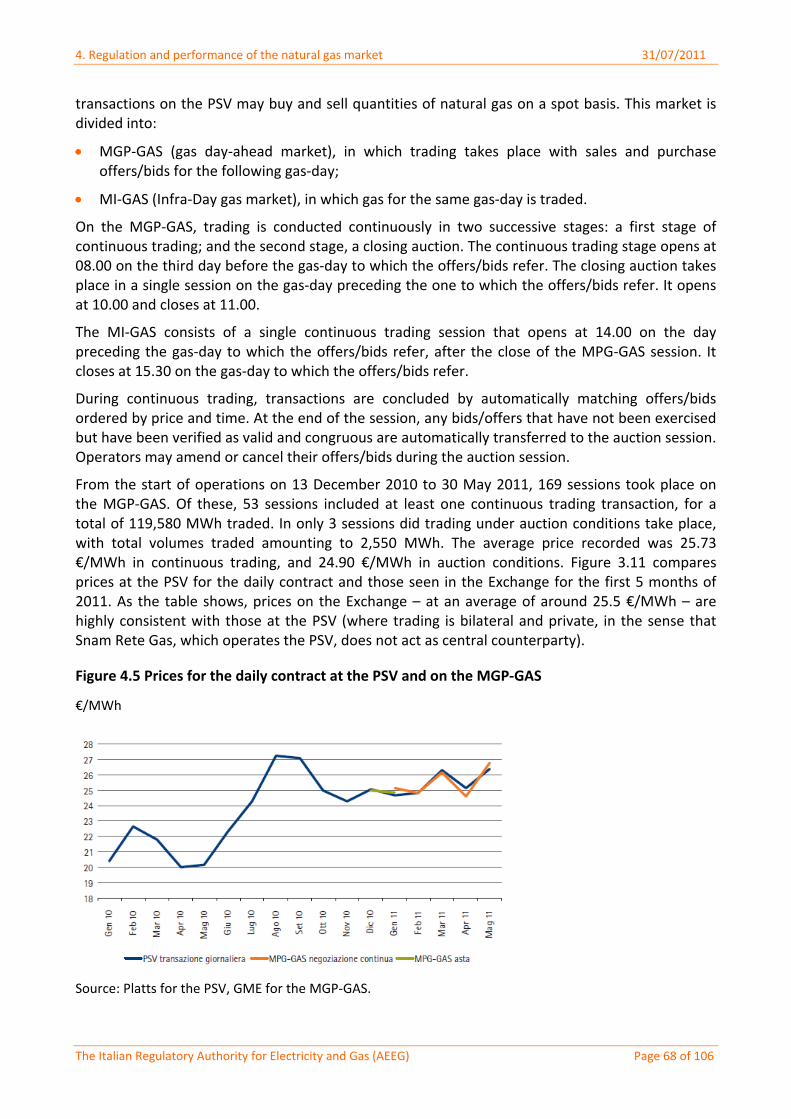
4. Regulation and performance of the natural gas market 31/07/2011
The Italian Regulatory Authority for Electricity and Gas (AEEG) Page 68 of 106
transactions on the PSV may buy and sell quantities of natural gas on a spot basis. This market is divided into:
MGP‐GAS (gas day‐ahead market), in which trading takes place with sales and purchase offers/bids for the following gas‐day;
MI‐GAS (Infra‐Day gas market), in which gas for the same gas‐day is traded.
On the MGP‐GAS, trading is conducted continuously in two successive stages: a first stage of continuous trading; and the second stage, a closing auction. The continuous trading stage opens at 08.00 on the third day before the gas‐day to which the offers/bids refer. The closing auction takes place in a single session on the gas‐day preceding the one to which the offers/bids refer. It opens at 10.00 and closes at 11.00.
The MI‐GAS consists of a single continuous trading session that opens at 14.00 on the day preceding the gas‐day to which the offers/bids refer, after the close of the MPG‐GAS session. It closes at 15.30 on the gas‐day to which the offers/bids refer.
During continuous trading, transactions are concluded by automatically matching offers/bids ordered by price and time. At the end of the session, any bids/offers that have not been exercised but have been verified as valid and congruous are automatically transferred to the auction session. Operators may amend or cancel their offers/bids during the auction session.
From the start of operations on 13 December 2010 to 30 May 2011, 169 sessions took place on the MGP‐GAS. Of these, 53 sessions included at least one continuous trading transaction, for a total of 119,580 MWh traded. In only 3 sessions did trading under auction conditions take place, with total volumes traded amounting to 2,550 MWh. The average price recorded was 25.73 €/MWh in continuous trading, and 24.90 €/MWh in auction conditions. Figure 3.11 compares prices at the PSV for the daily contract and those seen in the Exchange for the first 5 months of 2011. As the table shows, prices on the Exchange – at an average of around 25.5 €/MWh – are highly consistent with those at the PSV (where trading is bilateral and private, in the sense that Snam Rete Gas, which operates the PSV, does not act as central counterparty).
Figure 4.5 Prices for the daily contract at the PSV and on the MGP‐GAS
€/MWh
Source: Platts for the PSV, GME for the MGP‐GAS.
4. Regulation and performance of the natural gas market 31/07/2011
The Italian Regulatory Authority for Electricity and Gas (AEEG) Page 69 of 106
4.2.2 Description of the retail market
Table 4.8, which gives the key figures for the retail market, shows that 2010 was a year of recovery for the natural gas sector. The Ministry for Economic Development has estimated that gross domestic consumption – i.e., including losses of about 1.6 G(m3) – amounted to 82.98G(m3), compared with 78.02 G(m3) in 2009.
Based on the initial, preliminary annual survey conducted by the Authority on the evolution of the regulated sectors, sales to the retail market in 2010 totalled 71.96 G(m3). Of these, 43.79 G(m3) were provided by wholesalers and 28.17 G(m3) by “pure retailers”. If we add 13.89 G(m3) of self‐consumption (gas consumed directly in operators’ electricity power stations), then overall consumption in Italy was 85.85 G(m3). This figure is higher than the 82.98 G(m3) published by the Ministry for Economic Development. The discrepancy can be explained by a number of factors. As we have mentioned before, the calculations for the Annual Report are performed immediately after the data are collected and are therefore provisional. This timing allows for only a limited number of database checks. Another explanation is that, although operators are asked to apply a uniform heating power (of 38.1 MJ/m3) when replying to questions on the quantities of gas handled, we know that in many cases they fail to do so. A third reason for the difference in the ministry’s – non‐definitive – figures may be that operators in many cases respond to questionnaires on annual data by providing cash data (which include quantities not applicable to the year being surveyed) instead of the data actually requested.
Of the 376 sales operators responding to the survey, 197 sold gas exclusively to the retail market, 106 to other operators as well as directly to the retail market and 33 only to other suppliers. 34 said they had not been active in 2010 and 6 said they had made no sales.
As happens every year, the number of retail operators increased and their relative importance changed both through increases in sales and as a result of mergers and acquisitions. The main operations in 2010 include:
the incorporation of E.T. Energia and Territorio Servizi Commerciali, Tecniconsul Servizi and Metema Energy in E.On Energia (in January);
the incorporation of Agam Vendite, Canturina Servizi Vendita and Serenissima Energia in Enerxenia (June);
the merger between Iride and Enìa (July), after which Enìa Energia was incorporated by Iride Mercato, which then changed the company name to Iren Mercato;
the transfer of Gaz de France’s secondary activities to GdF Suez Gas Supply & Sales (April);
the acquisition by Estra Energie of the natural gas retail sales operation of Offidagas and Baiengas Commerciale (October);
the incorporation of Eneco Energia in Edison Energia and of Bas Ominiservizi and Asm Energia and Ambiente in A2a Energia (both in December);
As regards the composition of the GdF Suez group, it should be noted that in 2010 it also included GdF Suez Energie (formerly Italcogim Energie), which in 2009 belonged to the Energie Investimenti group. After GdF Suez acquired full control of Energie Investimenti by acquiring the 40% held by Cam Partecipazioni (Camfin Gruppo), in March 2010 Energie Investimenti underwent a merger by incorporation in GdF Suez Energia Italia.
Of the groups selling to the retail market, 9 (compared with 6 in 2009) had nationwide operations (Eni, Italcogim Energie, Enel, Edison Energia, Shell Italia, Gas Plus Vendite, Uno gas Energia,
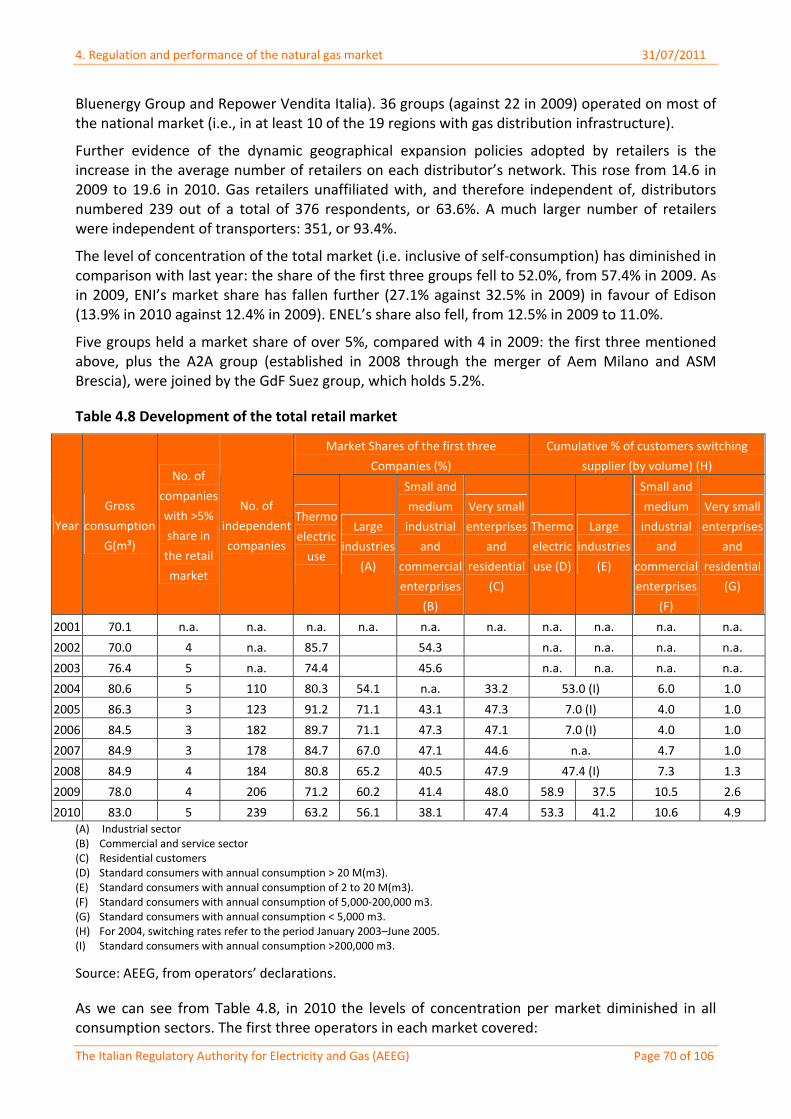
4. Regulation and performance of the natural gas market 31/07/2011
The Italian Regulatory Authority for Electricity and Gas (AEEG) Page 70 of 106
Bluenergy Group and Repower Vendita Italia). 36 groups (against 22 in 2009) operated on most of the national market (i.e., in at least 10 of the 19 regions with gas distribution infrastructure).
Further evidence of the dynamic geographical expansion policies adopted by retailers is the increase in the average number of retailers on each distributor’s network. This rose from 14.6 in 2009 to 19.6 in 2010. Gas retailers unaffiliated with, and therefore independent of, distributors numbered 239 out of a total of 376 respondents, or 63.6%. A much larger number of retailers were independent of transporters: 351, or 93.4%.
The level of concentration of the total market (i.e. inclusive of self‐consumption) has diminished in comparison with last year: the share of the first three groups fell to 52.0%, from 57.4% in 2009. As in 2009, ENI’s market share has fallen further (27.1% against 32.5% in 2009) in favour of Edison (13.9% in 2010 against 12.4% in 2009). ENEL’s share also fell, from 12.5% in 2009 to 11.0%.
Five groups held a market share of over 5%, compared with 4 in 2009: the first three mentioned above, plus the A2A group (established in 2008 through the merger of Aem Milano and ASM Brescia), were joined by the GdF Suez group, which holds 5.2%.
Table 4.8 Development of the total retail market
Market Shares of the first three
Companies (%)
Cumulative % of customers switching
supplier (by volume) (H)
Year
Gross
consumption
G(m³)
No. of
companies
with >5%
share in
the retail
market
No. of
independent
companies
Thermo
electric
use
Large
industries
(A)
Small and
medium
industrial
and
commercial
enterprises
(B)
Very small
enterprises
and
residential
(C)
Thermo
electric
use (D)
Large
industries
(E)
Small and
medium
industrial
and
commercial
enterprises
(F)
Very small
enterprises
and
residential
(G)
2001 70.1 n.a. n.a. n.a. n.a. n.a. n.a. n.a. n.a. n.a. n.a.
2002 70.0 4 n.a. 85.7 54.3 n.a. n.a. n.a. n.a.
2003 76.4 5 n.a. 74.4 45.6 n.a. n.a. n.a. n.a.
2004 80.6 5 110 80.3 54.1 n.a. 33.2 53.0 (I) 6.0 1.0
2005 86.3 3 123 91.2 71.1 43.1 47.3 7.0 (I) 4.0 1.0
2006 84.5 3 182 89.7 71.1 47.3 47.1 7.0 (I) 4.0 1.0
2007 84.9 3 178 84.7 67.0 47.1 44.6 n.a. 4.7 1.0
2008 84.9 4 184 80.8 65.2 40.5 47.9 47.4 (I) 7.3 1.3
2009 78.0 4 206 71.2 60.2 41.4 48.0 58.9 37.5 10.5 2.6
2010 83.0 5 239 63.2 56.1 38.1 47.4 53.3 41.2 10.6 4.9 (A) Industrial sector (B) Commercial and service sector (C) Residential customers (D) Standard consumers with annual consumption > 20 M(m3). (E) Standard consumers with annual consumption of 2 to 20 M(m3). (F) Standard consumers with annual consumption of 5,000‐200,000 m3. (G) Standard consumers with annual consumption < 5,000 m3. (H) For 2004, switching rates refer to the period January 2003–June 2005. (I) Standard consumers with annual consumption >200,000 m3.
Source: AEEG, from operators’ declarations.
As we can see from Table 4.8, in 2010 the levels of concentration per market diminished in all consumption sectors. The first three operators in each market covered:
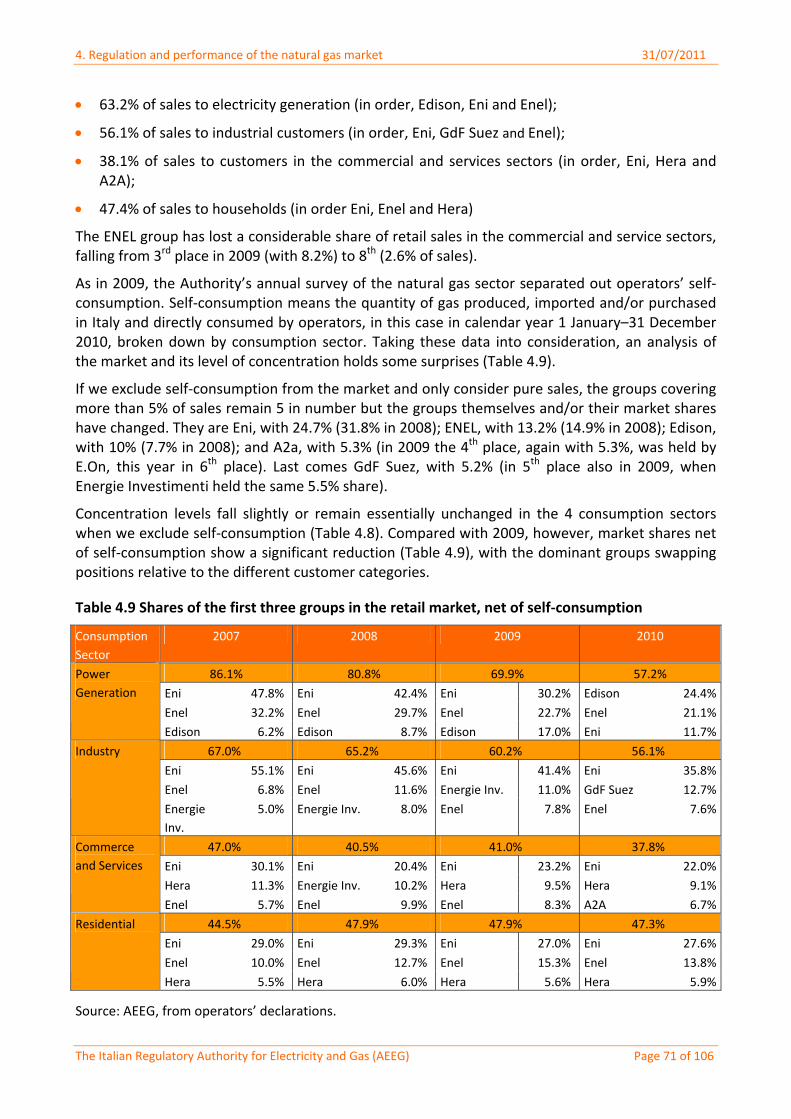
4. Regulation and performance of the natural gas market 31/07/2011
The Italian Regulatory Authority for Electricity and Gas (AEEG) Page 71 of 106
63.2% of sales to electricity generation (in order, Edison, Eni and Enel);
56.1% of sales to industrial customers (in order, Eni, GdF Suez and Enel);
38.1% of sales to customers in the commercial and services sectors (in order, Eni, Hera and A2A);
47.4% of sales to households (in order Eni, Enel and Hera)
The ENEL group has lost a considerable share of retail sales in the commercial and service sectors, falling from 3rd place in 2009 (with 8.2%) to 8th (2.6% of sales).
As in 2009, the Authority’s annual survey of the natural gas sector separated out operators’ self‐consumption. Self‐consumption means the quantity of gas produced, imported and/or purchased in Italy and directly consumed by operators, in this case in calendar year 1 January–31 December 2010, broken down by consumption sector. Taking these data into consideration, an analysis of the market and its level of concentration holds some surprises (Table 4.9).
If we exclude self‐consumption from the market and only consider pure sales, the groups covering more than 5% of sales remain 5 in number but the groups themselves and/or their market shares have changed. They are Eni, with 24.7% (31.8% in 2008); ENEL, with 13.2% (14.9% in 2008); Edison, with 10% (7.7% in 2008); and A2a, with 5.3% (in 2009 the 4th place, again with 5.3%, was held by E.On, this year in 6th place). Last comes GdF Suez, with 5.2% (in 5th place also in 2009, when Energie Investimenti held the same 5.5% share).
Concentration levels fall slightly or remain essentially unchanged in the 4 consumption sectors when we exclude self‐consumption (Table 4.8). Compared with 2009, however, market shares net of self‐consumption show a significant reduction (Table 4.9), with the dominant groups swapping positions relative to the different customer categories.
Table 4.9 Shares of the first three groups in the retail market, net of self‐consumption
Consumption
Sector
2007 2008 2009 2010
86.1% 80.8% 69.9% 57.2%
Eni 47.8% Eni 42.4% Eni 30.2% Edison 24.4%
Enel 32.2% Enel 29.7% Enel 22.7% Enel 21.1%
Power
Generation
Edison 6.2% Edison 8.7% Edison 17.0% Eni 11.7%
67.0% 65.2% 60.2% 56.1%
Eni 55.1% Eni 45.6% Eni 41.4% Eni 35.8%
Enel 6.8% Enel 11.6% Energie Inv. 11.0% GdF Suez 12.7%
Industry
Energie
Inv.
5.0% Energie Inv. 8.0% Enel 7.8% Enel 7.6%
47.0% 40.5% 41.0% 37.8%
Eni 30.1% Eni 20.4% Eni 23.2% Eni 22.0%
Hera 11.3% Energie Inv. 10.2% Hera 9.5% Hera 9.1%
Commerce
and Services
Enel 5.7% Enel 9.9% Enel 8.3% A2A 6.7%
44.5% 47.9% 47.9% 47.3%
Eni 29.0% Eni 29.3% Eni 27.0% Eni 27.6%
Enel 10.0% Enel 12.7% Enel 15.3% Enel 13.8%
Residential
Hera 5.5% Hera 6.0% Hera 5.6% Hera 5.9%
Source: AEEG, from operators’ declarations.
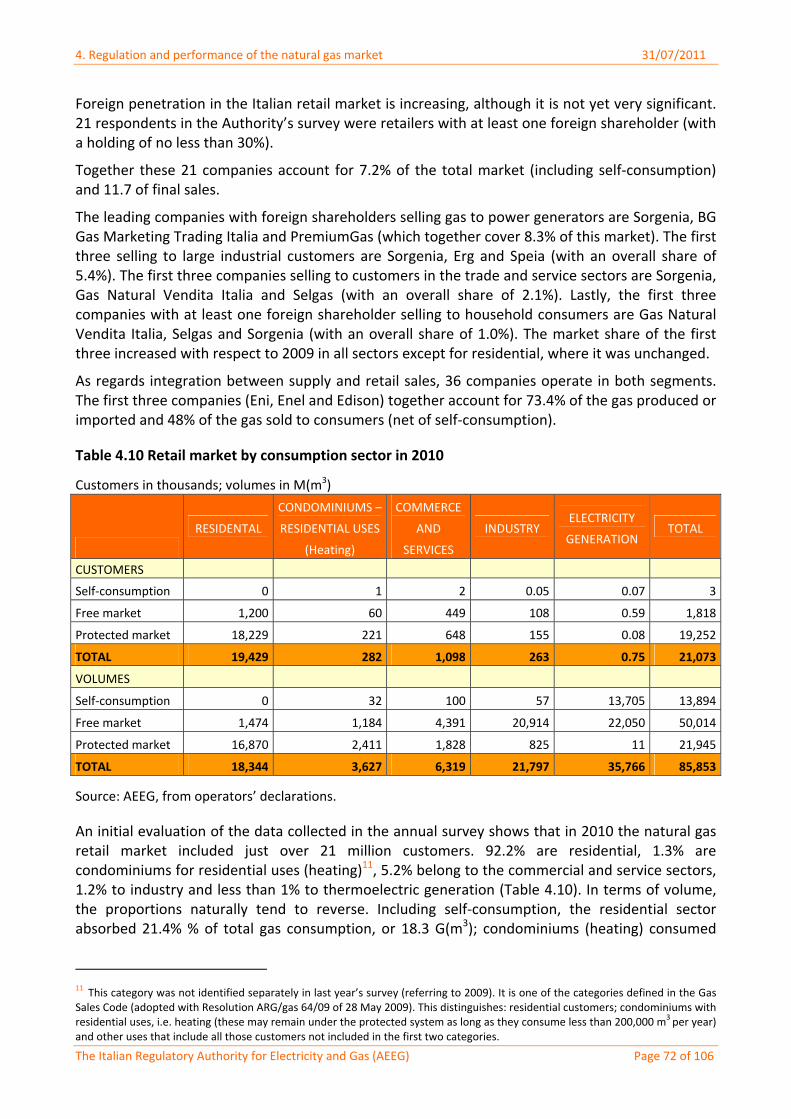
4. Regulation and performance of the natural gas market 31/07/2011
The Italian Regulatory Authority for Electricity and Gas (AEEG) Page 72 of 106
Foreign penetration in the Italian retail market is increasing, although it is not yet very significant. 21 respondents in the Authority’s survey were retailers with at least one foreign shareholder (with a holding of no less than 30%).
Together these 21 companies account for 7.2% of the total market (including self‐consumption) and 11.7 of final sales.
The leading companies with foreign shareholders selling gas to power generators are Sorgenia, BG Gas Marketing Trading Italia and PremiumGas (which together cover 8.3% of this market). The first three selling to large industrial customers are Sorgenia, Erg and Speia (with an overall share of 5.4%). The first three companies selling to customers in the trade and service sectors are Sorgenia, Gas Natural Vendita Italia and Selgas (with an overall share of 2.1%). Lastly, the first three companies with at least one foreign shareholder selling to household consumers are Gas Natural Vendita Italia, Selgas and Sorgenia (with an overall share of 1.0%). The market share of the first three increased with respect to 2009 in all sectors except for residential, where it was unchanged.
As regards integration between supply and retail sales, 36 companies operate in both segments. The first three companies (Eni, Enel and Edison) together account for 73.4% of the gas produced or imported and 48% of the gas sold to consumers (net of self‐consumption).
Table 4.10 Retail market by consumption sector in 2010
Customers in thousands; volumes in M(m3)
RESIDENTAL
CONDOMINIUMS –
RESIDENTIAL USES
(Heating)
COMMERCE
AND
SERVICES
INDUSTRY ELECTRICITY
GENERATION TOTAL
CUSTOMERS
Self‐consumption 0 1 2 0.05 0.07 3
Free market 1,200 60 449 108 0.59 1,818
Protected market 18,229 221 648 155 0.08 19,252
TOTAL 19,429 282 1,098 263 0.75 21,073
VOLUMES
Self‐consumption 0 32 100 57 13,705 13,894
Free market 1,474 1,184 4,391 20,914 22,050 50,014
Protected market 16,870 2,411 1,828 825 11 21,945
TOTAL 18,344 3,627 6,319 21,797 35,766 85,853
Source: AEEG, from operators’ declarations.
An initial evaluation of the data collected in the annual survey shows that in 2010 the natural gas retail market included just over 21 million customers. 92.2% are residential, 1.3% are condominiums for residential uses (heating)11, 5.2% belong to the commercial and service sectors, 1.2% to industry and less than 1% to thermoelectric generation (Table 4.10). In terms of volume, the proportions naturally tend to reverse. Including self‐consumption, the residential sector absorbed 21.4% % of total gas consumption, or 18.3 G(m3); condominiums (heating) consumed
11 This category was not identified separately in last year’s survey (referring to 2009). It is one of the categories defined in the Gas Sales Code (adopted with Resolution ARG/gas 64/09 of 28 May 2009). This distinguishes: residential customers; condominiums with residential uses, i.e. heating (these may remain under the protected system as long as they consume less than 200,000 m3 per year) and other uses that include all those customers not included in the first two categories.
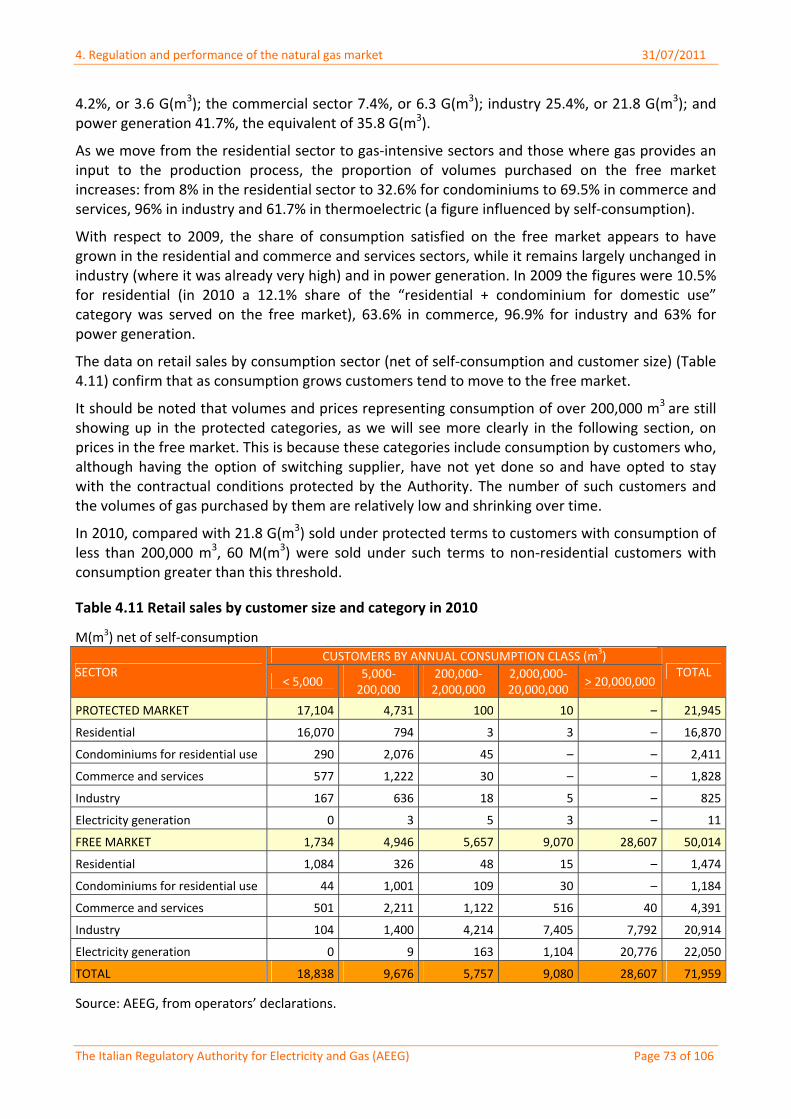
4. Regulation and performance of the natural gas market 31/07/2011
The Italian Regulatory Authority for Electricity and Gas (AEEG) Page 73 of 106
4.2%, or 3.6 G(m3); the commercial sector 7.4%, or 6.3 G(m3); industry 25.4%, or 21.8 G(m3); and power generation 41.7%, the equivalent of 35.8 G(m3).
As we move from the residential sector to gas‐intensive sectors and those where gas provides an input to the production process, the proportion of volumes purchased on the free market increases: from 8% in the residential sector to 32.6% for condominiums to 69.5% in commerce and services, 96% in industry and 61.7% in thermoelectric (a figure influenced by self‐consumption).
With respect to 2009, the share of consumption satisfied on the free market appears to have grown in the residential and commerce and services sectors, while it remains largely unchanged in industry (where it was already very high) and in power generation. In 2009 the figures were 10.5% for residential (in 2010 a 12.1% share of the “residential + condominium for domestic use” category was served on the free market), 63.6% in commerce, 96.9% for industry and 63% for power generation.
The data on retail sales by consumption sector (net of self‐consumption and customer size) (Table 4.11) confirm that as consumption grows customers tend to move to the free market.
It should be noted that volumes and prices representing consumption of over 200,000 m3 are still showing up in the protected categories, as we will see more clearly in the following section, on prices in the free market. This is because these categories include consumption by customers who, although having the option of switching supplier, have not yet done so and have opted to stay with the contractual conditions protected by the Authority. The number of such customers and the volumes of gas purchased by them are relatively low and shrinking over time.
In 2010, compared with 21.8 G(m3) sold under protected terms to customers with consumption of less than 200,000 m3, 60 M(m3) were sold under such terms to non‐residential customers with consumption greater than this threshold.
Table 4.11 Retail sales by customer size and category in 2010
M(m3) net of self‐consumption
CUSTOMERS BY ANNUAL CONSUMPTION CLASS (m3) SECTOR
< 5,000 5,000‐200,000
200,000‐ 2,000,000
2,000,000‐ 20,000,000
> 20,000,000TOTAL
PROTECTED MARKET 17,104 4,731 100 10 – 21,945
Residential 16,070 794 3 3 – 16,870
Condominiums for residential use 290 2,076 45 – – 2,411
Commerce and services 577 1,222 30 – – 1,828
Industry 167 636 18 5 – 825
Electricity generation 0 3 5 3 – 11
FREE MARKET 1,734 4,946 5,657 9,070 28,607 50,014
Residential 1,084 326 48 15 – 1,474
Condominiums for residential use 44 1,001 109 30 – 1,184
Commerce and services 501 2,211 1,122 516 40 4,391
Industry 104 1,400 4,214 7,405 7,792 20,914
Electricity generation 0 9 163 1,104 20,776 22,050
TOTAL 18,838 9,676 5,757 9,080 28,607 71,959
Source: AEEG, from operators’ declarations.
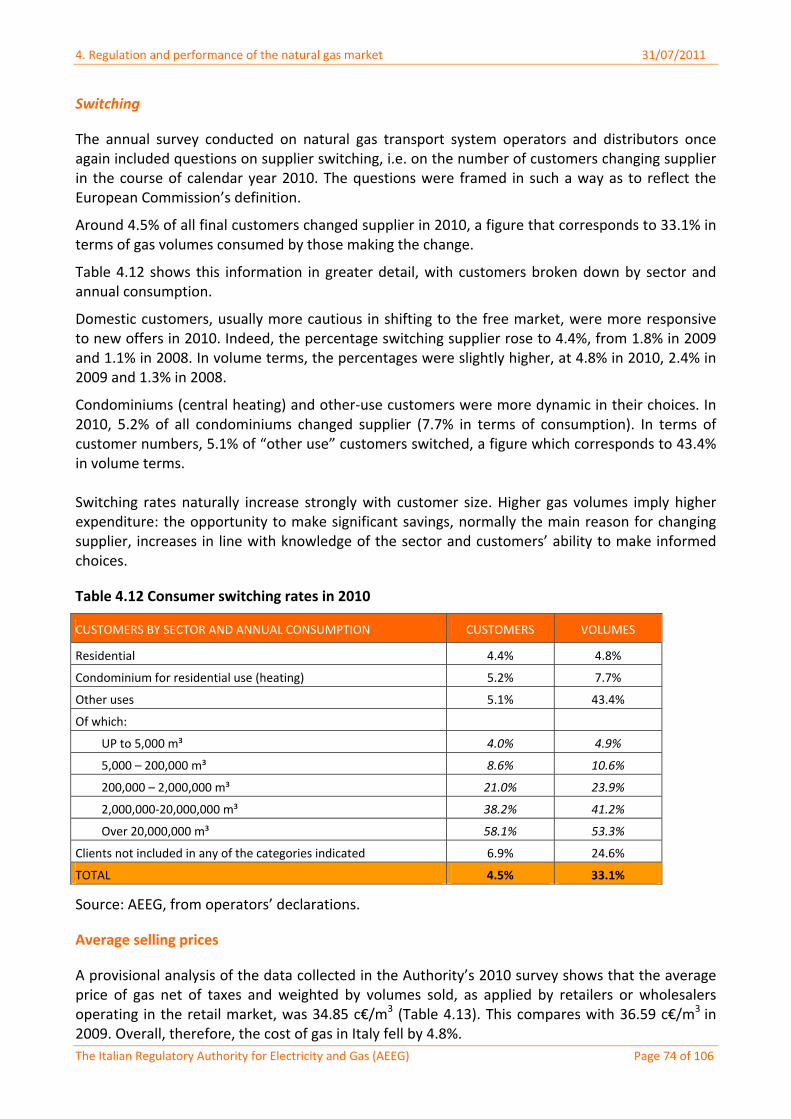
4. Regulation and performance of the natural gas market 31/07/2011
The Italian Regulatory Authority for Electricity and Gas (AEEG) Page 74 of 106
Switching
The annual survey conducted on natural gas transport system operators and distributors once again included questions on supplier switching, i.e. on the number of customers changing supplier in the course of calendar year 2010. The questions were framed in such a way as to reflect the European Commission’s definition.
Around 4.5% of all final customers changed supplier in 2010, a figure that corresponds to 33.1% in terms of gas volumes consumed by those making the change.
Table 4.12 shows this information in greater detail, with customers broken down by sector and annual consumption.
Domestic customers, usually more cautious in shifting to the free market, were more responsive to new offers in 2010. Indeed, the percentage switching supplier rose to 4.4%, from 1.8% in 2009 and 1.1% in 2008. In volume terms, the percentages were slightly higher, at 4.8% in 2010, 2.4% in 2009 and 1.3% in 2008.
Condominiums (central heating) and other‐use customers were more dynamic in their choices. In 2010, 5.2% of all condominiums changed supplier (7.7% in terms of consumption). In terms of customer numbers, 5.1% of “other use” customers switched, a figure which corresponds to 43.4% in volume terms. Switching rates naturally increase strongly with customer size. Higher gas volumes imply higher expenditure: the opportunity to make significant savings, normally the main reason for changing supplier, increases in line with knowledge of the sector and customers’ ability to make informed choices.
Table 4.12 Consumer switching rates in 2010
CUSTOMERS BY SECTOR AND ANNUAL CONSUMPTION CUSTOMERS VOLUMES
Residential 4.4% 4.8%
Condominium for residential use (heating) 5.2% 7.7%
Other uses 5.1% 43.4%
Of which:
UP to 5,000 m³ 4.0% 4.9%
5,000 – 200,000 m³ 8.6% 10.6%
200,000 – 2,000,000 m³ 21.0% 23.9%
2,000,000‐20,000,000 m³ 38.2% 41.2%
Over 20,000,000 m³ 58.1% 53.3%
Clients not included in any of the categories indicated 6.9% 24.6%
TOTAL 4.5% 33.1%
Source: AEEG, from operators’ declarations.
Average selling prices
A provisional analysis of the data collected in the Authority’s 2010 survey shows that the average price of gas net of taxes and weighted by volumes sold, as applied by retailers or wholesalers operating in the retail market, was 34.85 c€/m3 (Table 4.13). This compares with 36.59 c€/m3 in 2009. Overall, therefore, the cost of gas in Italy fell by 4.8%.
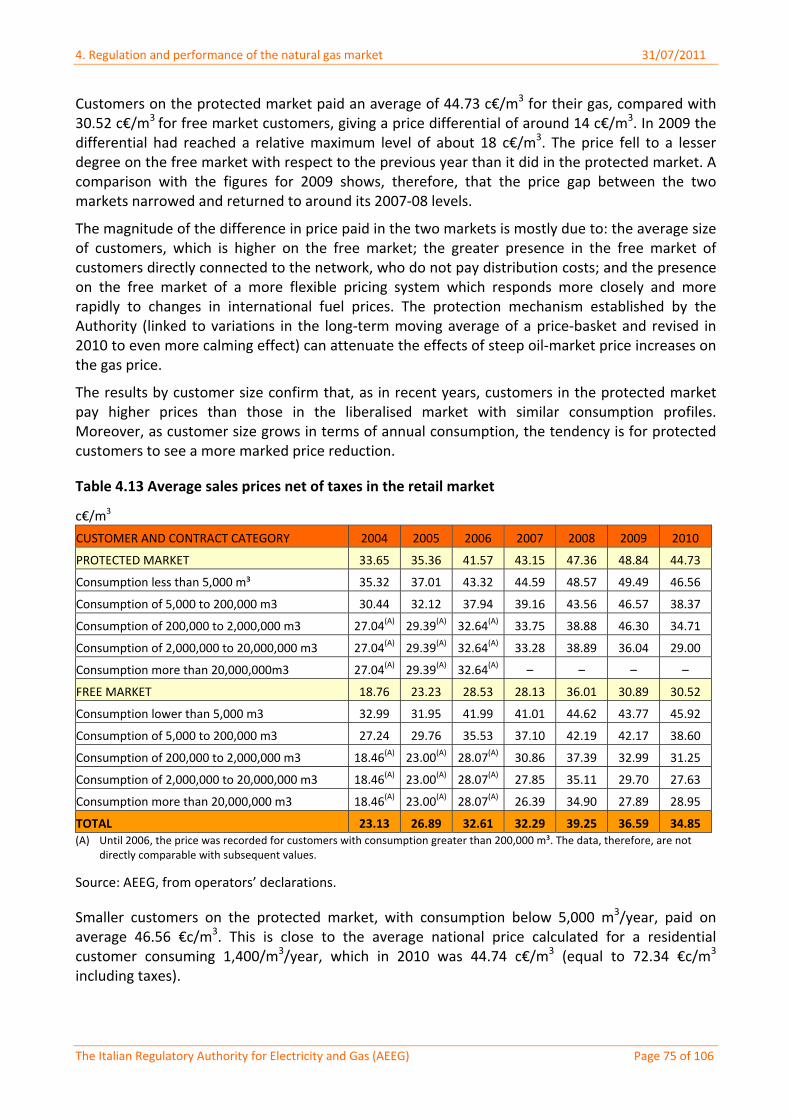
4. Regulation and performance of the natural gas market 31/07/2011
The Italian Regulatory Authority for Electricity and Gas (AEEG) Page 75 of 106
Customers on the protected market paid an average of 44.73 c€/m3 for their gas, compared with 30.52 c€/m3 for free market customers, giving a price differential of around 14 c€/m3. In 2009 the differential had reached a relative maximum level of about 18 c€/m3. The price fell to a lesser degree on the free market with respect to the previous year than it did in the protected market. A comparison with the figures for 2009 shows, therefore, that the price gap between the two markets narrowed and returned to around its 2007‐08 levels.
The magnitude of the difference in price paid in the two markets is mostly due to: the average size of customers, which is higher on the free market; the greater presence in the free market of customers directly connected to the network, who do not pay distribution costs; and the presence on the free market of a more flexible pricing system which responds more closely and more rapidly to changes in international fuel prices. The protection mechanism established by the Authority (linked to variations in the long‐term moving average of a price‐basket and revised in 2010 to even more calming effect) can attenuate the effects of steep oil‐market price increases on the gas price.
The results by customer size confirm that, as in recent years, customers in the protected market pay higher prices than those in the liberalised market with similar consumption profiles. Moreover, as customer size grows in terms of annual consumption, the tendency is for protected customers to see a more marked price reduction.
Table 4.13 Average sales prices net of taxes in the retail market
c€/m3
CUSTOMER AND CONTRACT CATEGORY 2004 2005 2006 2007 2008 2009 2010
PROTECTED MARKET 33.65 35.36 41.57 43.15 47.36 48.84 44.73
Consumption less than 5,000 m³ 35.32 37.01 43.32 44.59 48.57 49.49 46.56
Consumption of 5,000 to 200,000 m3 30.44 32.12 37.94 39.16 43.56 46.57 38.37
Consumption of 200,000 to 2,000,000 m3 27.04(A) 29.39(A) 32.64(A) 33.75 38.88 46.30 34.71
Consumption of 2,000,000 to 20,000,000 m3 27.04(A) 29.39(A) 32.64(A) 33.28 38.89 36.04 29.00
Consumption more than 20,000,000m3 27.04(A) 29.39(A) 32.64(A) – – – –
FREE MARKET 18.76 23.23 28.53 28.13 36.01 30.89 30.52
Consumption lower than 5,000 m3 32.99 31.95 41.99 41.01 44.62 43.77 45.92
Consumption of 5,000 to 200,000 m3 27.24 29.76 35.53 37.10 42.19 42.17 38.60
Consumption of 200,000 to 2,000,000 m3 18.46(A) 23.00(A) 28.07(A) 30.86 37.39 32.99 31.25
Consumption of 2,000,000 to 20,000,000 m3 18.46(A) 23.00(A) 28.07(A) 27.85 35.11 29.70 27.63
Consumption more than 20,000,000 m3 18.46(A) 23.00(A) 28.07(A) 26.39 34.90 27.89 28.95
TOTAL 23.13 26.89 32.61 32.29 39.25 36.59 34.85 (A) Until 2006, the price was recorded for customers with consumption greater than 200,000 m³. The data, therefore, are not
directly comparable with subsequent values.
Source: AEEG, from operators’ declarations.
Smaller customers on the protected market, with consumption below 5,000 m3/year, paid on average 46.56 €c/m3. This is close to the average national price calculated for a residential customer consuming 1,400/m3/year, which in 2010 was 44.74 c€/m3 (equal to 72.34 €c/m3
including taxes).
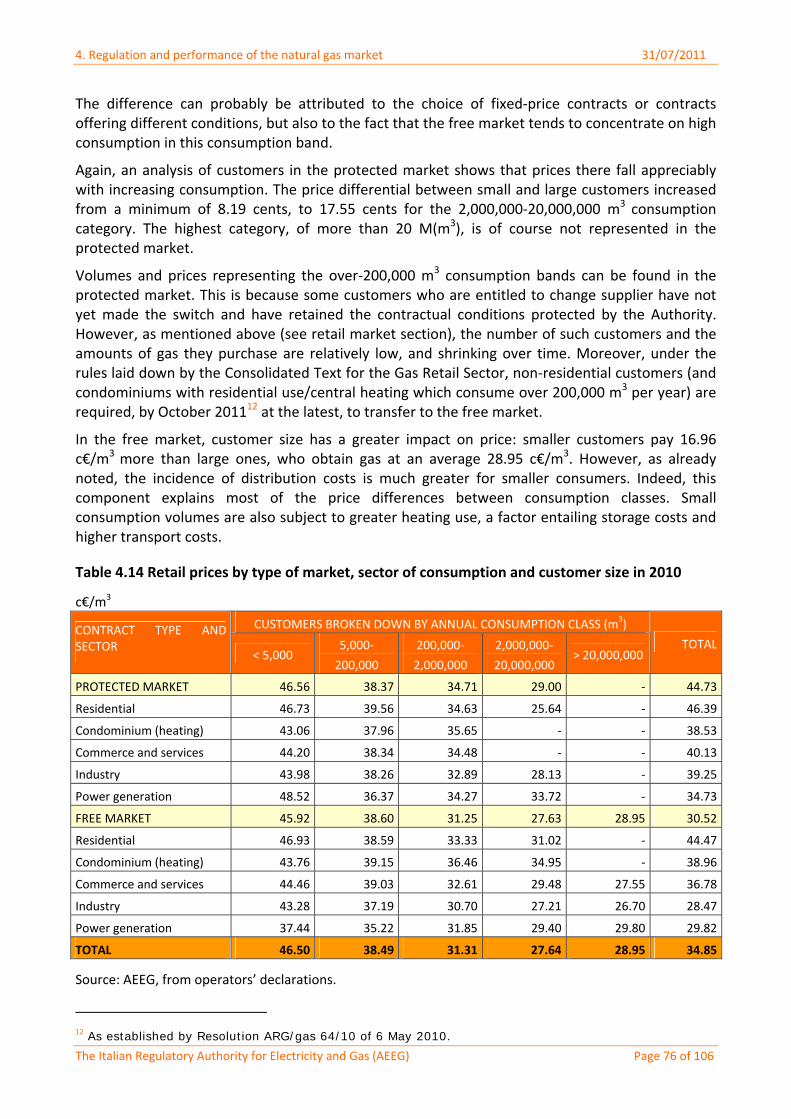
4. Regulation and performance of the natural gas market 31/07/2011
The Italian Regulatory Authority for Electricity and Gas (AEEG) Page 76 of 106
The difference can probably be attributed to the choice of fixed‐price contracts or contracts offering different conditions, but also to the fact that the free market tends to concentrate on high consumption in this consumption band.
Again, an analysis of customers in the protected market shows that prices there fall appreciably with increasing consumption. The price differential between small and large customers increased from a minimum of 8.19 cents, to 17.55 cents for the 2,000,000‐20,000,000 m3 consumption category. The highest category, of more than 20 M(m3), is of course not represented in the protected market.
Volumes and prices representing the over‐200,000 m3 consumption bands can be found in the protected market. This is because some customers who are entitled to change supplier have not yet made the switch and have retained the contractual conditions protected by the Authority. However, as mentioned above (see retail market section), the number of such customers and the amounts of gas they purchase are relatively low, and shrinking over time. Moreover, under the rules laid down by the Consolidated Text for the Gas Retail Sector, non‐residential customers (and condominiums with residential use/central heating which consume over 200,000 m3 per year) are required, by October 201112 at the latest, to transfer to the free market.
In the free market, customer size has a greater impact on price: smaller customers pay 16.96 c€/m3 more than large ones, who obtain gas at an average 28.95 c€/m3. However, as already noted, the incidence of distribution costs is much greater for smaller consumers. Indeed, this component explains most of the price differences between consumption classes. Small consumption volumes are also subject to greater heating use, a factor entailing storage costs and higher transport costs.
Table 4.14 Retail prices by type of market, sector of consumption and customer size in 2010
c€/m3
CUSTOMERS BROKEN DOWN BY ANNUAL CONSUMPTION CLASS (m3) CONTRACT TYPE AND SECTOR
< 5,000 5,000‐
200,000
200,000‐
2,000,000
2,000,000‐
20,000,000 > 20,000,000
TOTAL
PROTECTED MARKET 46.56 38.37 34.71 29.00 ‐ 44.73
Residential 46.73 39.56 34.63 25.64 ‐ 46.39
Condominium (heating) 43.06 37.96 35.65 ‐ ‐ 38.53
Commerce and services 44.20 38.34 34.48 ‐ ‐ 40.13
Industry 43.98 38.26 32.89 28.13 ‐ 39.25
Power generation 48.52 36.37 34.27 33.72 ‐ 34.73
FREE MARKET 45.92 38.60 31.25 27.63 28.95 30.52
Residential 46.93 38.59 33.33 31.02 ‐ 44.47
Condominium (heating) 43.76 39.15 36.46 34.95 ‐ 38.96
Commerce and services 44.46 39.03 32.61 29.48 27.55 36.78
Industry 43.28 37.19 30.70 27.21 26.70 28.47
Power generation 37.44 35.22 31.85 29.40 29.80 29.82
TOTAL 46.50 38.49 31.31 27.64 28.95 34.85
Source: AEEG, from operators’ declarations.
12 As established by Resolution ARG/gas 64/10 of 6 May 2010.
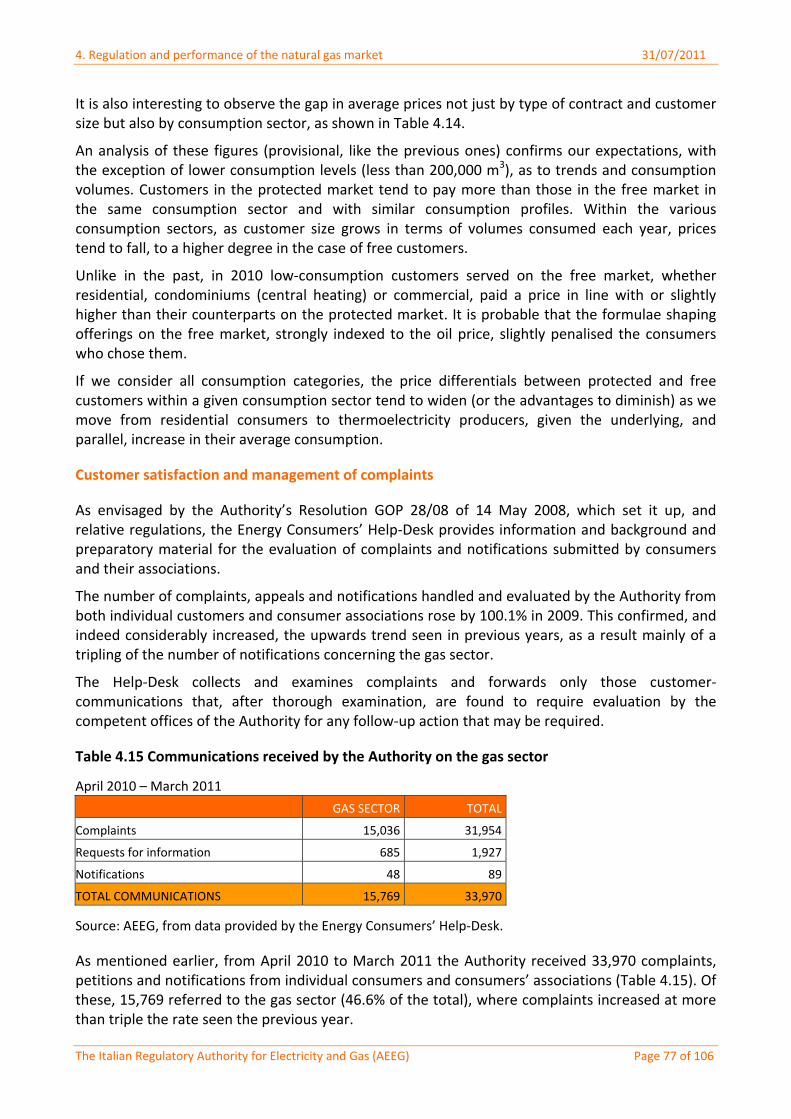
4. Regulation and performance of the natural gas market 31/07/2011
The Italian Regulatory Authority for Electricity and Gas (AEEG) Page 77 of 106
It is also interesting to observe the gap in average prices not just by type of contract and customer size but also by consumption sector, as shown in Table 4.14.
An analysis of these figures (provisional, like the previous ones) confirms our expectations, with the exception of lower consumption levels (less than 200,000 m3), as to trends and consumption volumes. Customers in the protected market tend to pay more than those in the free market in the same consumption sector and with similar consumption profiles. Within the various consumption sectors, as customer size grows in terms of volumes consumed each year, prices tend to fall, to a higher degree in the case of free customers.
Unlike in the past, in 2010 low‐consumption customers served on the free market, whether residential, condominiums (central heating) or commercial, paid a price in line with or slightly higher than their counterparts on the protected market. It is probable that the formulae shaping offerings on the free market, strongly indexed to the oil price, slightly penalised the consumers who chose them.
If we consider all consumption categories, the price differentials between protected and free customers within a given consumption sector tend to widen (or the advantages to diminish) as we move from residential consumers to thermoelectricity producers, given the underlying, and parallel, increase in their average consumption.
Customer satisfaction and management of complaints
As envisaged by the Authority’s Resolution GOP 28/08 of 14 May 2008, which set it up, and relative regulations, the Energy Consumers’ Help‐Desk provides information and background and preparatory material for the evaluation of complaints and notifications submitted by consumers and their associations.
The number of complaints, appeals and notifications handled and evaluated by the Authority from both individual customers and consumer associations rose by 100.1% in 2009. This confirmed, and indeed considerably increased, the upwards trend seen in previous years, as a result mainly of a tripling of the number of notifications concerning the gas sector.
The Help‐Desk collects and examines complaints and forwards only those customer‐communications that, after thorough examination, are found to require evaluation by the competent offices of the Authority for any follow‐up action that may be required.
Table 4.15 Communications received by the Authority on the gas sector
April 2010 – March 2011
GAS SECTOR TOTAL
Complaints 15,036 31,954
Requests for information 685 1,927
Notifications 48 89
TOTAL COMMUNICATIONS 15,769 33,970
Source: AEEG, from data provided by the Energy Consumers’ Help‐Desk.
As mentioned earlier, from April 2010 to March 2011 the Authority received 33,970 complaints, petitions and notifications from individual consumers and consumers’ associations (Table 4.15). Of these, 15,769 referred to the gas sector (46.6% of the total), where complaints increased at more than triple the rate seen the previous year.
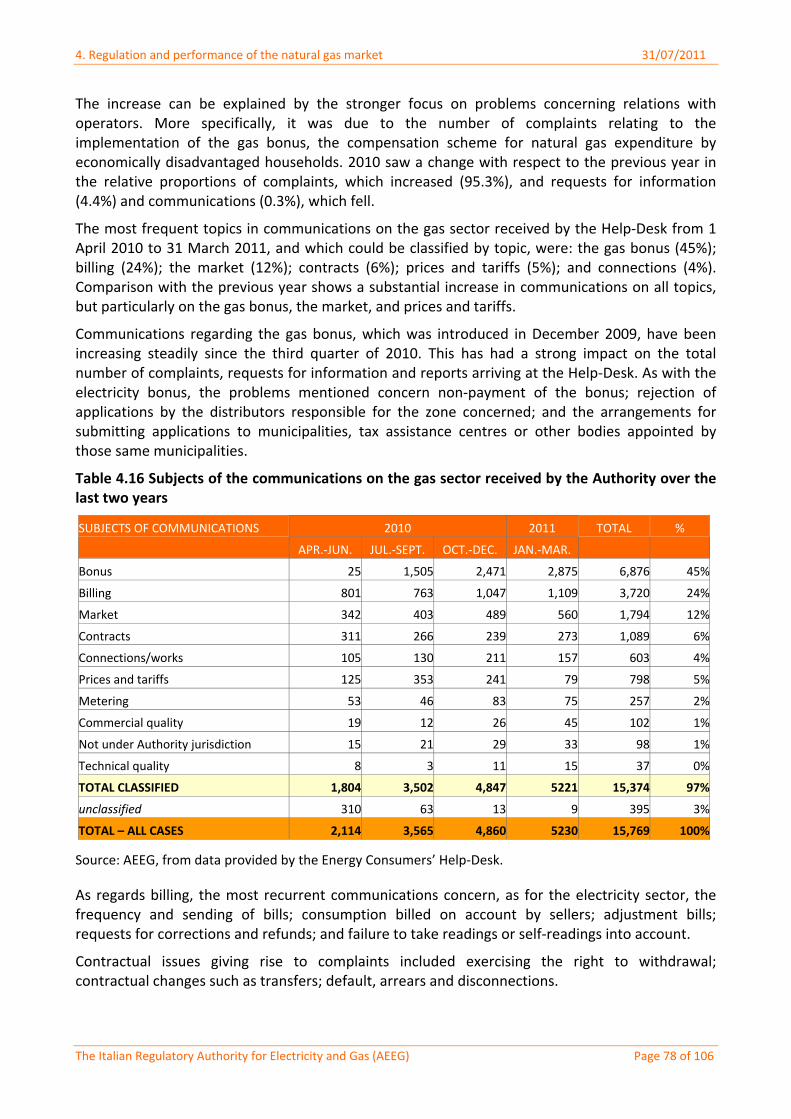
4. Regulation and performance of the natural gas market 31/07/2011
The Italian Regulatory Authority for Electricity and Gas (AEEG) Page 78 of 106
The increase can be explained by the stronger focus on problems concerning relations with operators. More specifically, it was due to the number of complaints relating to the implementation of the gas bonus, the compensation scheme for natural gas expenditure by economically disadvantaged households. 2010 saw a change with respect to the previous year in the relative proportions of complaints, which increased (95.3%), and requests for information (4.4%) and communications (0.3%), which fell.
The most frequent topics in communications on the gas sector received by the Help‐Desk from 1 April 2010 to 31 March 2011, and which could be classified by topic, were: the gas bonus (45%); billing (24%); the market (12%); contracts (6%); prices and tariffs (5%); and connections (4%). Comparison with the previous year shows a substantial increase in communications on all topics, but particularly on the gas bonus, the market, and prices and tariffs.
Communications regarding the gas bonus, which was introduced in December 2009, have been increasing steadily since the third quarter of 2010. This has had a strong impact on the total number of complaints, requests for information and reports arriving at the Help‐Desk. As with the electricity bonus, the problems mentioned concern non‐payment of the bonus; rejection of applications by the distributors responsible for the zone concerned; and the arrangements for submitting applications to municipalities, tax assistance centres or other bodies appointed by those same municipalities.
Table 4.16 Subjects of the communications on the gas sector received by the Authority over the last two years
2010 2011 SUBJECTS OF COMMUNICATIONS
APR.‐JUN. JUL.‐SEPT. OCT.‐DEC. JAN.‐MAR.
TOTAL %
Bonus 25 1,505 2,471 2,875 6,876 45%
Billing 801 763 1,047 1,109 3,720 24%
Market 342 403 489 560 1,794 12%
Contracts 311 266 239 273 1,089 6%
Connections/works 105 130 211 157 603 4%
Prices and tariffs 125 353 241 79 798 5%
Metering 53 46 83 75 257 2%
Commercial quality 19 12 26 45 102 1%
Not under Authority jurisdiction 15 21 29 33 98 1%
Technical quality 8 3 11 15 37 0%
TOTAL CLASSIFIED 1,804 3,502 4,847 5221 15,374 97%
unclassified 310 63 13 9 395 3%
TOTAL – ALL CASES 2,114 3,565 4,860 5230 15,769 100%
Source: AEEG, from data provided by the Energy Consumers’ Help‐Desk.
As regards billing, the most recurrent communications concern, as for the electricity sector, the frequency and sending of bills; consumption billed on account by sellers; adjustment bills; requests for corrections and refunds; and failure to take readings or self‐readings into account.
Contractual issues giving rise to complaints included exercising the right to withdrawal; contractual changes such as transfers; default, arrears and disconnections.
4. Regulation and performance of the natural gas market 31/07/2011
The Italian Regulatory Authority for Electricity and Gas (AEEG) Page 79 of 106
Communications about the market mainly concerned double billing; supplier switching; compliance with the Commercial Code of Conduct; the proper presentation of offerings and the proper application of prices and rates in the free market.
As regards prices and tariffs, communications mainly concerned the correct application of free market prices and/or tariffs.
Communications on the joint supply of electricity and gas (dual fuel) received by the Energy Consumers’ Help‐Desk from 1 April 2010 to 31 March 2011 were 1,668 in number, or approximately 4.8% of the total. The incidence of dual fuel communications and complaints therefore remains marginal, in spite of the increased offerings in this segment, with respect to the overall figure.
4.2.3 Measures to avoid abuses of dominance
Article 30 of Law 99 of 23 July 2009 gave the Government delegated authority to define a package of initiatives to guarantee the competitiveness of industrial end‐users in the Italian manufacturing sector, characterised by a constantly high level of gas consumption. This was also to be achieved through a review of the “antitrust ceilings” system envisaged by paragraphs 2 and 3 of article 19 of Legislative Decree 164 of 23 May 2000, which did not produce the expected results in terms of market opening.
Legislative Decree 130 of 13 August 2010, containing Measures for greater competitiveness in the natural gas market and the transfer of the resulting benefits to consumers, implementing the delegated authority contained in Law 99/09, set forth the Government’s provisions for this review. It also introduced incentive measures for the creation of new storage capacity.
Briefly, the decree envisaged a 40% ceiling on the wholesale market share held by any given operator. This value may be raised to 60%, in cases where the operator undertakes to implement a series of initiatives that include a specific programme for the development of new storage capacity (4 G(m3)), the usage rights of which should be made available to the market under specific conditions.
If an operator exceeds the 60% ceiling it is obliged to implement a gas release programme for the subsequent thermal year, under similar conditions to those set out in articles 3.1 and 3.2 of Decree Law 78 of 1 July 2009. This establishes that volumes of gas to be transferred through gas release should be determined through a Ministry for Economic Development decree whereby the operator may exceed the relative threshold value and market conditions, up to but no more than 4 G(m3).
The measures to foster competition formulated in Legislative Decree 130/2010 (under delegated authority) replaced the limits defined by the antitrust ceilings, which are no longer applicable, and introduced provisions to increase the flexibility of the gas system. This will be done by augmenting storage infrastructure, which has historically been insufficient for market needs and a bottleneck to its development.
In other words, the aims of Law 130/2010 are pursued through a system of obligations/incentives for ENI (the dominant operator and owner of nearly all the storage capacity in Italy) to increase the offering of natural gas storage services. This means, essentially, allowing industrial and thermoelectric operators to contribute to the development of storage infrastructure to make it possible, for example, to procure significant volumes of gas abroad in periods of greater availability or lower prices.
4. Regulation and performance of the natural gas market 31/07/2011
The Italian Regulatory Authority for Electricity and Gas (AEEG) Page 80 of 106
Legislative Decree 130/10 entrusted the Authority with most of its implementing procedures. With Resolution ARG/gas 193/10 of 4 November 2010, the Authority first of all laid down transitional measures to bring forward the benefits, for investors selected according to the procedures established by the Decree, resulting from the creation of new storage capacity. As a result, industrial investors will have access to a service, provided by the Energy Services Operator (GSE), whereby natural gas can be delivered in the summer period (at the Zeebrugge and/or TTF hubs, or at the Virtual Exchange Point (PSV)), and then re‐delivered in the following winter period (at the PSV).
Industrial investors can use this service until the new storage capacity gradually comes online and in any case for no longer than 5 years, with maximum quantities corresponding to the new quotas assigned to them but not yet in operation. Industrial investors will also be able to pay the GSE the amount corresponding to the delivery of natural gas in the summer period in foreign markets, in accordance with article 9.6 of Legislative Decree 130/10.
Resolution ARG/gas 193/10 also sets the criteria with which the GSE procures the gas needed to deliver the services just described, as well as the arrangements to make them available through the “virtual storage service”. This service is provided in part by operators selected through a specific competitive procedure, and in part by the operator adopting the measures governed by article 5.1 of Legislative Decree 130/10 (i.e., ENI).
The development plan for new storage capacity submitted by ENI was approved by the Ministry of Economic Development with its Decree of 31 January 2011. The Authority subsequently defined the procedures for the allocation of new storage capacity for industrial and thermoelectric customers (taking into account the reserves envisaged in Legislative Decree 130/10).
Following the approval of Legislative Decree 130/10, with Resolution ARG/gas 29/11 of 23 March 2011 the Authority approved the criteria for the definition of access charges for new storage capacity created in accordance with that same decree. It also approved the temporary measures envisaged by articles 9 and 10 of the decree to bring forward the market effects of the development of new storage capacity13.
From a regulatory continuity perspective, the Authority defined the criteria for the calculation of these charges along similar lines to the tariff criteria for the storage services established in Resolution ARG/gas 119/10. More specifically, it provided that:
in calculating the charges for access to new storage capacity, all of the costs relating to the overall storage service provided by the operator creating the new capacity should be considered;
in calculating the charges for access to the transitional measures, the unit space, delivery point and injection point charges constituting the single national storage tariff should be taken into consideration. The emphasis should be placed on the delivery point, using the same coefficient as envisaged for the minimum delivery point service.
13 The new storage capacity will be developed over a 5‐year period. Legislative Decree 130/10 therefore envisaged measures whereby investors could obtain, in advance, the same or similar effects to those they would have obtained if the new capacity had come into operation with immediate effect.
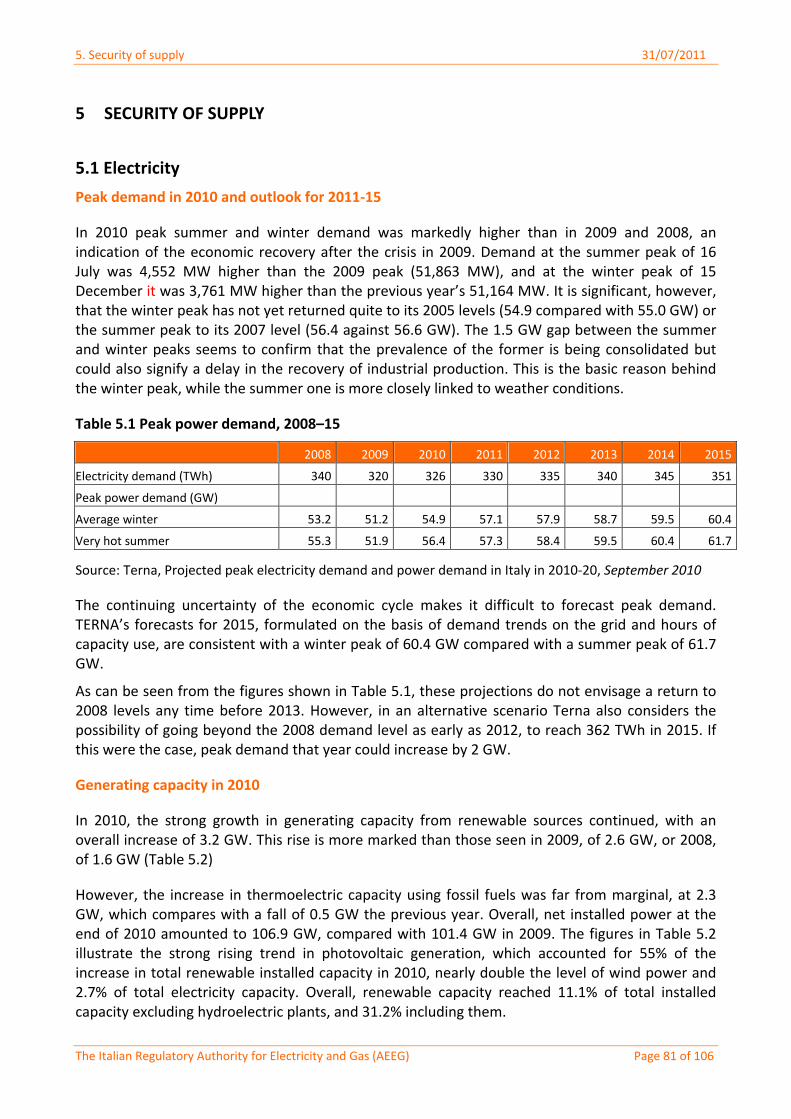
5. Security of supply 31/07/2011
The Italian Regulatory Authority for Electricity and Gas (AEEG) Page 81 of 106
5 SECURITY OF SUPPLY
5.1 Electricity
Peak demand in 2010 and outlook for 2011‐15
In 2010 peak summer and winter demand was markedly higher than in 2009 and 2008, an indication of the economic recovery after the crisis in 2009. Demand at the summer peak of 16 July was 4,552 MW higher than the 2009 peak (51,863 MW), and at the winter peak of 15 December it was 3,761 MW higher than the previous year’s 51,164 MW. It is significant, however, that the winter peak has not yet returned quite to its 2005 levels (54.9 compared with 55.0 GW) or the summer peak to its 2007 level (56.4 against 56.6 GW). The 1.5 GW gap between the summer and winter peaks seems to confirm that the prevalence of the former is being consolidated but could also signify a delay in the recovery of industrial production. This is the basic reason behind the winter peak, while the summer one is more closely linked to weather conditions.
Table 5.1 Peak power demand, 2008–15
2008 2009 2010 2011 2012 2013 2014 2015
Electricity demand (TWh) 340 320 326 330 335 340 345 351
Peak power demand (GW)
Average winter 53.2 51.2 54.9 57.1 57.9 58.7 59.5 60.4
Very hot summer 55.3 51.9 56.4 57.3 58.4 59.5 60.4 61.7
Source: Terna, Projected peak electricity demand and power demand in Italy in 2010‐20, September 2010
The continuing uncertainty of the economic cycle makes it difficult to forecast peak demand. TERNA’s forecasts for 2015, formulated on the basis of demand trends on the grid and hours of capacity use, are consistent with a winter peak of 60.4 GW compared with a summer peak of 61.7 GW.
As can be seen from the figures shown in Table 5.1, these projections do not envisage a return to 2008 levels any time before 2013. However, in an alternative scenario Terna also considers the possibility of going beyond the 2008 demand level as early as 2012, to reach 362 TWh in 2015. If this were the case, peak demand that year could increase by 2 GW.
Generating capacity in 2010
In 2010, the strong growth in generating capacity from renewable sources continued, with an overall increase of 3.2 GW. This rise is more marked than those seen in 2009, of 2.6 GW, or 2008, of 1.6 GW (Table 5.2)
However, the increase in thermoelectric capacity using fossil fuels was far from marginal, at 2.3 GW, which compares with a fall of 0.5 GW the previous year. Overall, net installed power at the end of 2010 amounted to 106.9 GW, compared with 101.4 GW in 2009. The figures in Table 5.2 illustrate the strong rising trend in photovoltaic generation, which accounted for 55% of the increase in total renewable installed capacity in 2010, nearly double the level of wind power and 2.7% of total electricity capacity. Overall, renewable capacity reached 11.1% of total installed capacity excluding hydroelectric plants, and 31.2% including them.
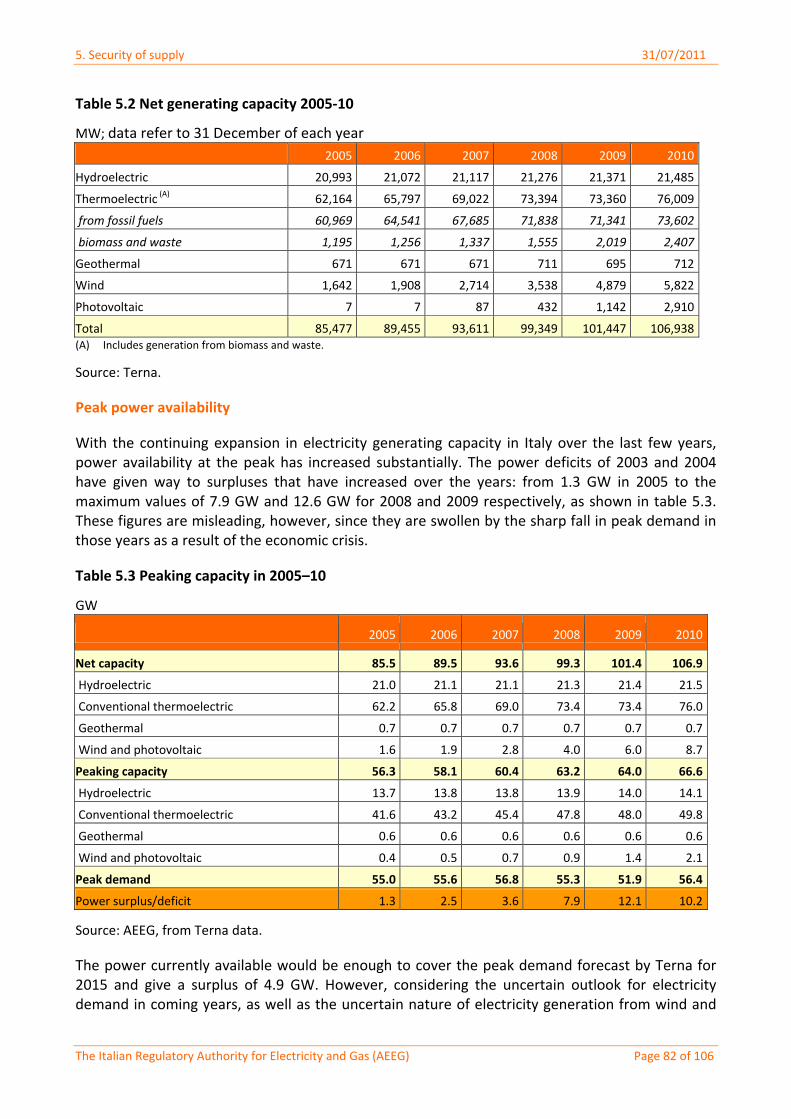
5. Security of supply 31/07/2011
The Italian Regulatory Authority for Electricity and Gas (AEEG) Page 82 of 106
Table 5.2 Net generating capacity 2005‐10
MW; data refer to 31 December of each year
2005 2006 2007 2008 2009 2010
Hydroelectric 20,993 21,072 21,117 21,276 21,371 21,485
Thermoelectric (A) 62,164 65,797 69,022 73,394 73,360 76,009
from fossil fuels 60,969 64,541 67,685 71,838 71,341 73,602
biomass and waste 1,195 1,256 1,337 1,555 2,019 2,407
Geothermal 671 671 671 711 695 712
Wind 1,642 1,908 2,714 3,538 4,879 5,822
Photovoltaic 7 7 87 432 1,142 2,910
Total 85,477 89,455 93,611 99,349 101,447 106,938(A) Includes generation from biomass and waste.
Source: Terna.
Peak power availability
With the continuing expansion in electricity generating capacity in Italy over the last few years, power availability at the peak has increased substantially. The power deficits of 2003 and 2004 have given way to surpluses that have increased over the years: from 1.3 GW in 2005 to the maximum values of 7.9 GW and 12.6 GW for 2008 and 2009 respectively, as shown in table 5.3. These figures are misleading, however, since they are swollen by the sharp fall in peak demand in those years as a result of the economic crisis.
Table 5.3 Peaking capacity in 2005–10
GW
2005 2006 2007 2008 2009 2010
Net capacity 85.5 89.5 93.6 99.3 101.4 106.9
Hydroelectric 21.0 21.1 21.1 21.3 21.4 21.5
Conventional thermoelectric 62.2 65.8 69.0 73.4 73.4 76.0
Geothermal 0.7 0.7 0.7 0.7 0.7 0.7
Wind and photovoltaic 1.6 1.9 2.8 4.0 6.0 8.7
Peaking capacity 56.3 58.1 60.4 63.2 64.0 66.6
Hydroelectric 13.7 13.8 13.8 13.9 14.0 14.1
Conventional thermoelectric 41.6 43.2 45.4 47.8 48.0 49.8
Geothermal 0.6 0.6 0.6 0.6 0.6 0.6
Wind and photovoltaic 0.4 0.5 0.7 0.9 1.4 2.1
Peak demand 55.0 55.6 56.8 55.3 51.9 56.4
Power surplus/deficit 1.3 2.5 3.6 7.9 12.1 10.2
Source: AEEG, from Terna data.
The power currently available would be enough to cover the peak demand forecast by Terna for 2015 and give a surplus of 4.9 GW. However, considering the uncertain outlook for electricity demand in coming years, as well as the uncertain nature of electricity generation from wind and
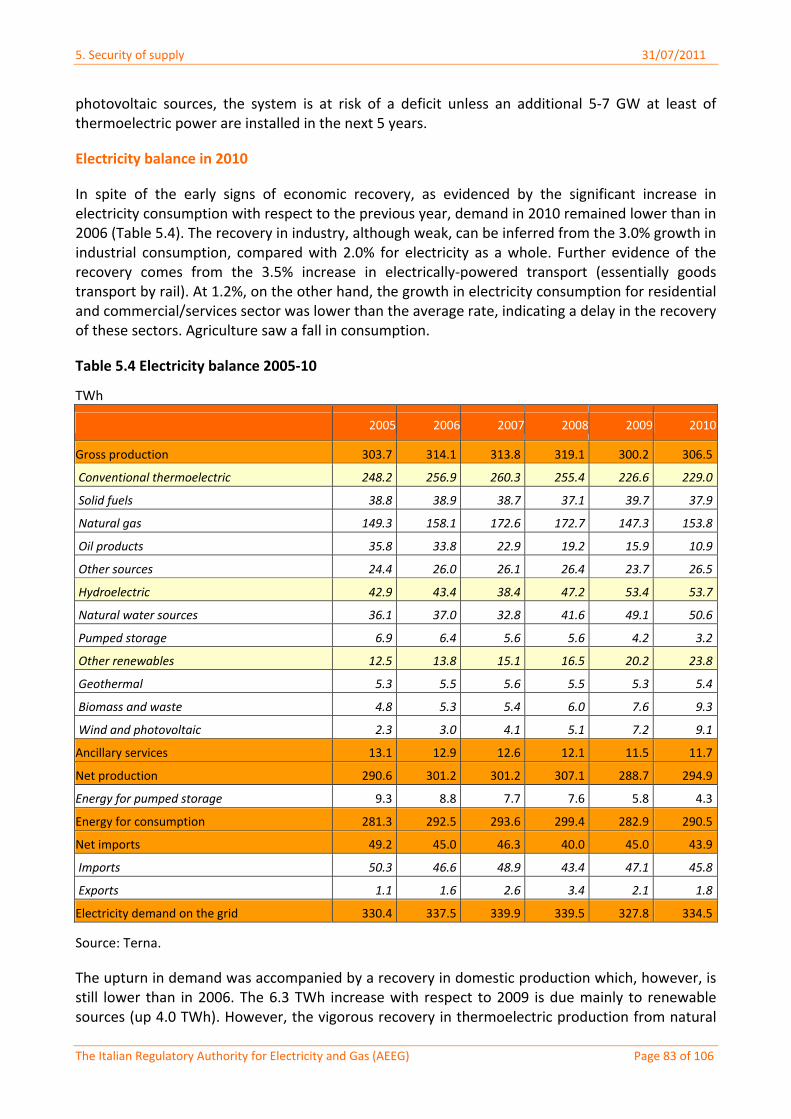
5. Security of supply 31/07/2011
The Italian Regulatory Authority for Electricity and Gas (AEEG) Page 83 of 106
photovoltaic sources, the system is at risk of a deficit unless an additional 5‐7 GW at least of thermoelectric power are installed in the next 5 years.
Electricity balance in 2010
In spite of the early signs of economic recovery, as evidenced by the significant increase in electricity consumption with respect to the previous year, demand in 2010 remained lower than in 2006 (Table 5.4). The recovery in industry, although weak, can be inferred from the 3.0% growth in industrial consumption, compared with 2.0% for electricity as a whole. Further evidence of the recovery comes from the 3.5% increase in electrically‐powered transport (essentially goods transport by rail). At 1.2%, on the other hand, the growth in electricity consumption for residential and commercial/services sector was lower than the average rate, indicating a delay in the recovery of these sectors. Agriculture saw a fall in consumption.
Table 5.4 Electricity balance 2005‐10
TWh
2005 2006 2007 2008 2009 2010
Gross production 303.7 314.1 313.8 319.1 300.2 306.5
Conventional thermoelectric 248.2 256.9 260.3 255.4 226.6 229.0
Solid fuels 38.8 38.9 38.7 37.1 39.7 37.9
Natural gas 149.3 158.1 172.6 172.7 147.3 153.8
Oil products 35.8 33.8 22.9 19.2 15.9 10.9
Other sources 24.4 26.0 26.1 26.4 23.7 26.5
Hydroelectric 42.9 43.4 38.4 47.2 53.4 53.7
Natural water sources 36.1 37.0 32.8 41.6 49.1 50.6
Pumped storage 6.9 6.4 5.6 5.6 4.2 3.2
Other renewables 12.5 13.8 15.1 16.5 20.2 23.8
Geothermal 5.3 5.5 5.6 5.5 5.3 5.4
Biomass and waste 4.8 5.3 5.4 6.0 7.6 9.3
Wind and photovoltaic 2.3 3.0 4.1 5.1 7.2 9.1
Ancillary services 13.1 12.9 12.6 12.1 11.5 11.7
Net production 290.6 301.2 301.2 307.1 288.7 294.9
Energy for pumped storage 9.3 8.8 7.7 7.6 5.8 4.3
Energy for consumption 281.3 292.5 293.6 299.4 282.9 290.5
Net imports 49.2 45.0 46.3 40.0 45.0 43.9
Imports 50.3 46.6 48.9 43.4 47.1 45.8
Exports 1.1 1.6 2.6 3.4 2.1 1.8
Electricity demand on the grid 330.4 337.5 339.9 339.5 327.8 334.5
Source: Terna.
The upturn in demand was accompanied by a recovery in domestic production which, however, is still lower than in 2006. The 6.3 TWh increase with respect to 2009 is due mainly to renewable sources (up 4.0 TWh). However, the vigorous recovery in thermoelectric production from natural
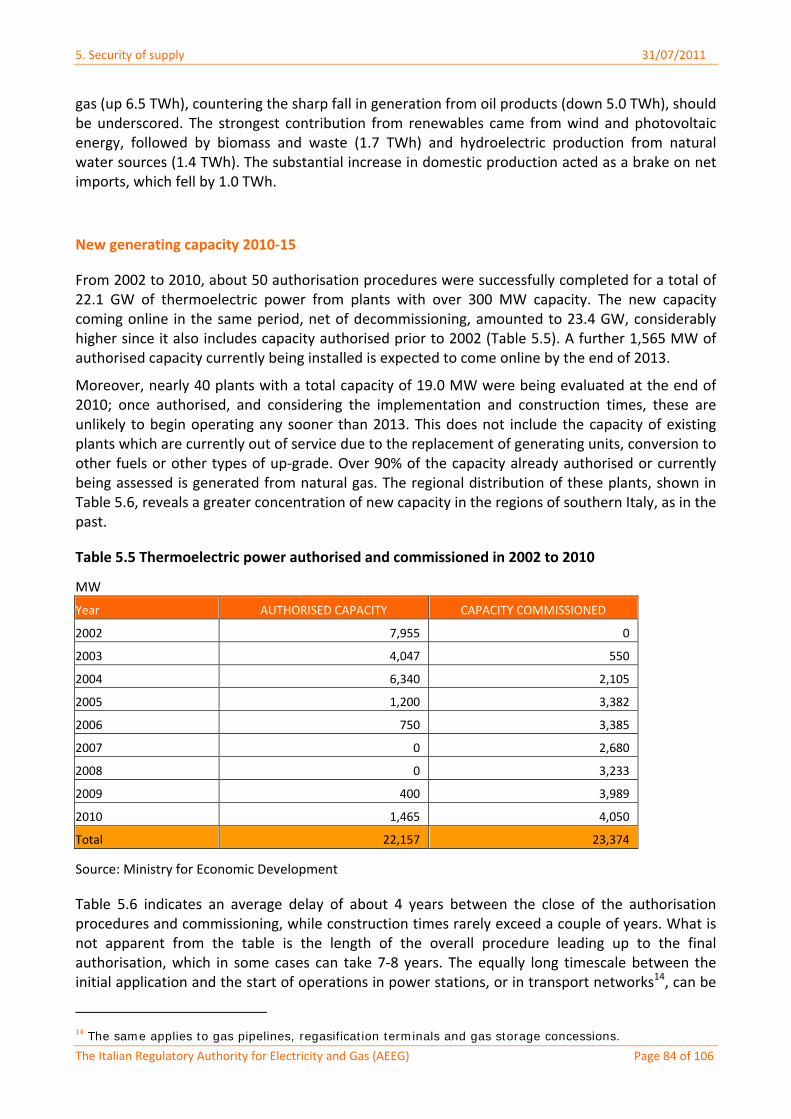
5. Security of supply 31/07/2011
The Italian Regulatory Authority for Electricity and Gas (AEEG) Page 84 of 106
gas (up 6.5 TWh), countering the sharp fall in generation from oil products (down 5.0 TWh), should be underscored. The strongest contribution from renewables came from wind and photovoltaic energy, followed by biomass and waste (1.7 TWh) and hydroelectric production from natural water sources (1.4 TWh). The substantial increase in domestic production acted as a brake on net imports, which fell by 1.0 TWh.
New generating capacity 2010‐15
From 2002 to 2010, about 50 authorisation procedures were successfully completed for a total of 22.1 GW of thermoelectric power from plants with over 300 MW capacity. The new capacity coming online in the same period, net of decommissioning, amounted to 23.4 GW, considerably higher since it also includes capacity authorised prior to 2002 (Table 5.5). A further 1,565 MW of authorised capacity currently being installed is expected to come online by the end of 2013.
Moreover, nearly 40 plants with a total capacity of 19.0 MW were being evaluated at the end of 2010; once authorised, and considering the implementation and construction times, these are unlikely to begin operating any sooner than 2013. This does not include the capacity of existing plants which are currently out of service due to the replacement of generating units, conversion to other fuels or other types of up‐grade. Over 90% of the capacity already authorised or currently being assessed is generated from natural gas. The regional distribution of these plants, shown in Table 5.6, reveals a greater concentration of new capacity in the regions of southern Italy, as in the past.
Table 5.5 Thermoelectric power authorised and commissioned in 2002 to 2010
MW
Year AUTHORISED CAPACITY CAPACITY COMMISSIONED
2002 7,955 0
2003 4,047 550
2004 6,340 2,105
2005 1,200 3,382
2006 750 3,385
2007 0 2,680
2008 0 3,233
2009 400 3,989
2010 1,465 4,050
Total 22,157 23,374
Source: Ministry for Economic Development
Table 5.6 indicates an average delay of about 4 years between the close of the authorisation procedures and commissioning, while construction times rarely exceed a couple of years. What is not apparent from the table is the length of the overall procedure leading up to the final authorisation, which in some cases can take 7‐8 years. The equally long timescale between the initial application and the start of operations in power stations, or in transport networks14, can be
14 The same applies to gas pipelines, regasification terminals and gas storage concessions.
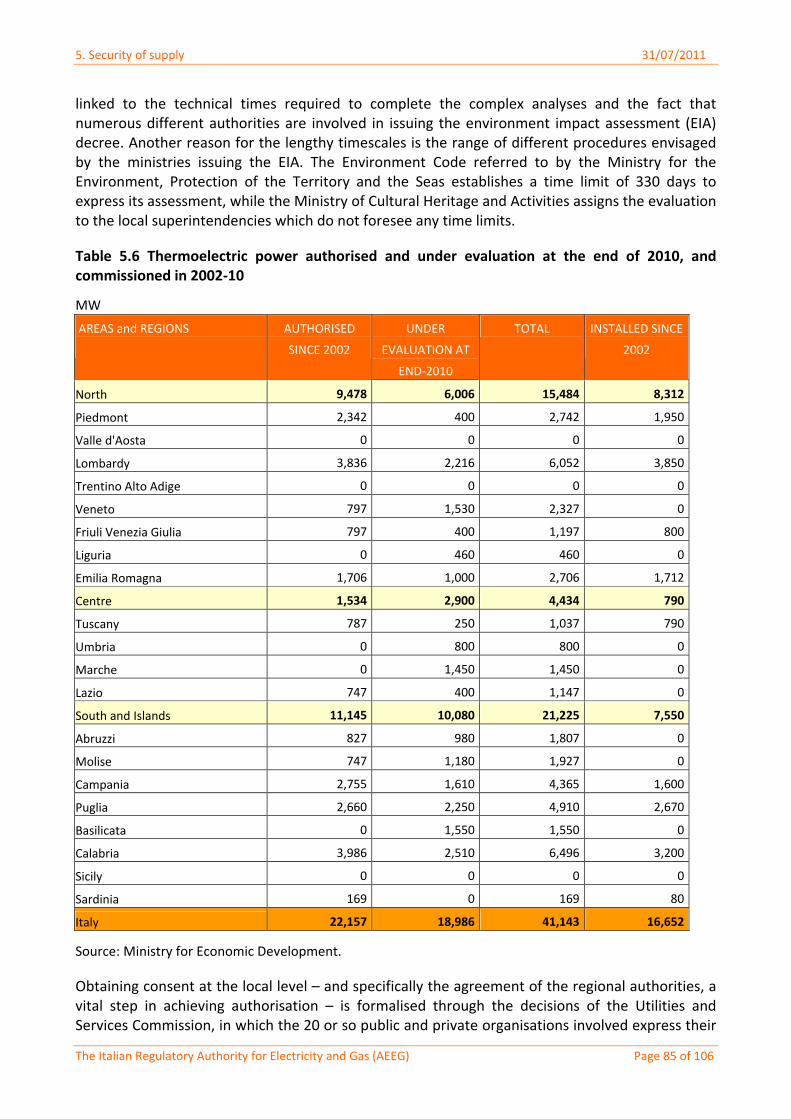
5. Security of supply 31/07/2011
The Italian Regulatory Authority for Electricity and Gas (AEEG) Page 85 of 106
linked to the technical times required to complete the complex analyses and the fact that numerous different authorities are involved in issuing the environment impact assessment (EIA) decree. Another reason for the lengthy timescales is the range of different procedures envisaged by the ministries issuing the EIA. The Environment Code referred to by the Ministry for the Environment, Protection of the Territory and the Seas establishes a time limit of 330 days to express its assessment, while the Ministry of Cultural Heritage and Activities assigns the evaluation to the local superintendencies which do not foresee any time limits.
Table 5.6 Thermoelectric power authorised and under evaluation at the end of 2010, and commissioned in 2002‐10
MW
AREAS and REGIONS
AUTHORISED
SINCE 2002
UNDER
EVALUATION AT
END‐2010
TOTAL INSTALLED SINCE
2002
North 9,478 6,006 15,484 8,312
Piedmont 2,342 400 2,742 1,950
Valle d'Aosta 0 0 0 0
Lombardy 3,836 2,216 6,052 3,850
Trentino Alto Adige 0 0 0 0
Veneto 797 1,530 2,327 0
Friuli Venezia Giulia 797 400 1,197 800
Liguria 0 460 460 0
Emilia Romagna 1,706 1,000 2,706 1,712
Centre 1,534 2,900 4,434 790
Tuscany 787 250 1,037 790
Umbria 0 800 800 0
Marche 0 1,450 1,450 0
Lazio 747 400 1,147 0
South and Islands 11,145 10,080 21,225 7,550
Abruzzi 827 980 1,807 0
Molise 747 1,180 1,927 0
Campania 2,755 1,610 4,365 1,600
Puglia 2,660 2,250 4,910 2,670
Basilicata 0 1,550 1,550 0
Calabria 3,986 2,510 6,496 3,200
Sicily 0 0 0 0
Sardinia 169 0 169 80
Italy 22,157 18,986 41,143 16,652
Source: Ministry for Economic Development.
Obtaining consent at the local level – and specifically the agreement of the regional authorities, a vital step in achieving authorisation – is formalised through the decisions of the Utilities and Services Commission, in which the 20 or so public and private organisations involved express their
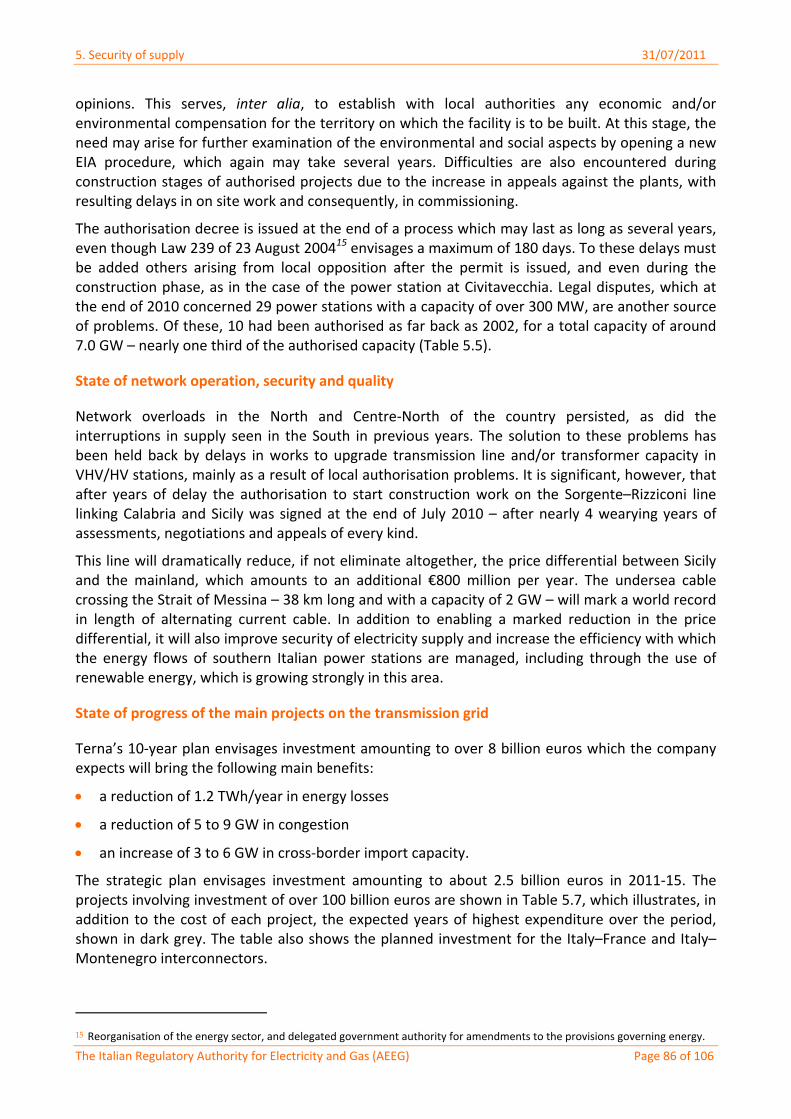
5. Security of supply 31/07/2011
The Italian Regulatory Authority for Electricity and Gas (AEEG) Page 86 of 106
opinions. This serves, inter alia, to establish with local authorities any economic and/or environmental compensation for the territory on which the facility is to be built. At this stage, the need may arise for further examination of the environmental and social aspects by opening a new EIA procedure, which again may take several years. Difficulties are also encountered during construction stages of authorised projects due to the increase in appeals against the plants, with resulting delays in on site work and consequently, in commissioning.
The authorisation decree is issued at the end of a process which may last as long as several years, even though Law 239 of 23 August 200415 envisages a maximum of 180 days. To these delays must be added others arising from local opposition after the permit is issued, and even during the construction phase, as in the case of the power station at Civitavecchia. Legal disputes, which at the end of 2010 concerned 29 power stations with a capacity of over 300 MW, are another source of problems. Of these, 10 had been authorised as far back as 2002, for a total capacity of around 7.0 GW – nearly one third of the authorised capacity (Table 5.5).
State of network operation, security and quality
Network overloads in the North and Centre‐North of the country persisted, as did the interruptions in supply seen in the South in previous years. The solution to these problems has been held back by delays in works to upgrade transmission line and/or transformer capacity in VHV/HV stations, mainly as a result of local authorisation problems. It is significant, however, that after years of delay the authorisation to start construction work on the Sorgente–Rizziconi line linking Calabria and Sicily was signed at the end of July 2010 – after nearly 4 wearying years of assessments, negotiations and appeals of every kind.
This line will dramatically reduce, if not eliminate altogether, the price differential between Sicily and the mainland, which amounts to an additional €800 million per year. The undersea cable crossing the Strait of Messina – 38 km long and with a capacity of 2 GW – will mark a world record in length of alternating current cable. In addition to enabling a marked reduction in the price differential, it will also improve security of electricity supply and increase the efficiency with which the energy flows of southern Italian power stations are managed, including through the use of renewable energy, which is growing strongly in this area.
State of progress of the main projects on the transmission grid
Terna’s 10‐year plan envisages investment amounting to over 8 billion euros which the company expects will bring the following main benefits:
a reduction of 1.2 TWh/year in energy losses
a reduction of 5 to 9 GW in congestion
an increase of 3 to 6 GW in cross‐border import capacity.
The strategic plan envisages investment amounting to about 2.5 billion euros in 2011‐15. The projects involving investment of over 100 billion euros are shown in Table 5.7, which illustrates, in addition to the cost of each project, the expected years of highest expenditure over the period, shown in dark grey. The table also shows the planned investment for the Italy–France and Italy–Montenegro interconnectors.
15 Reorganisation of the energy sector, and delegated government authority for amendments to the provisions governing energy.
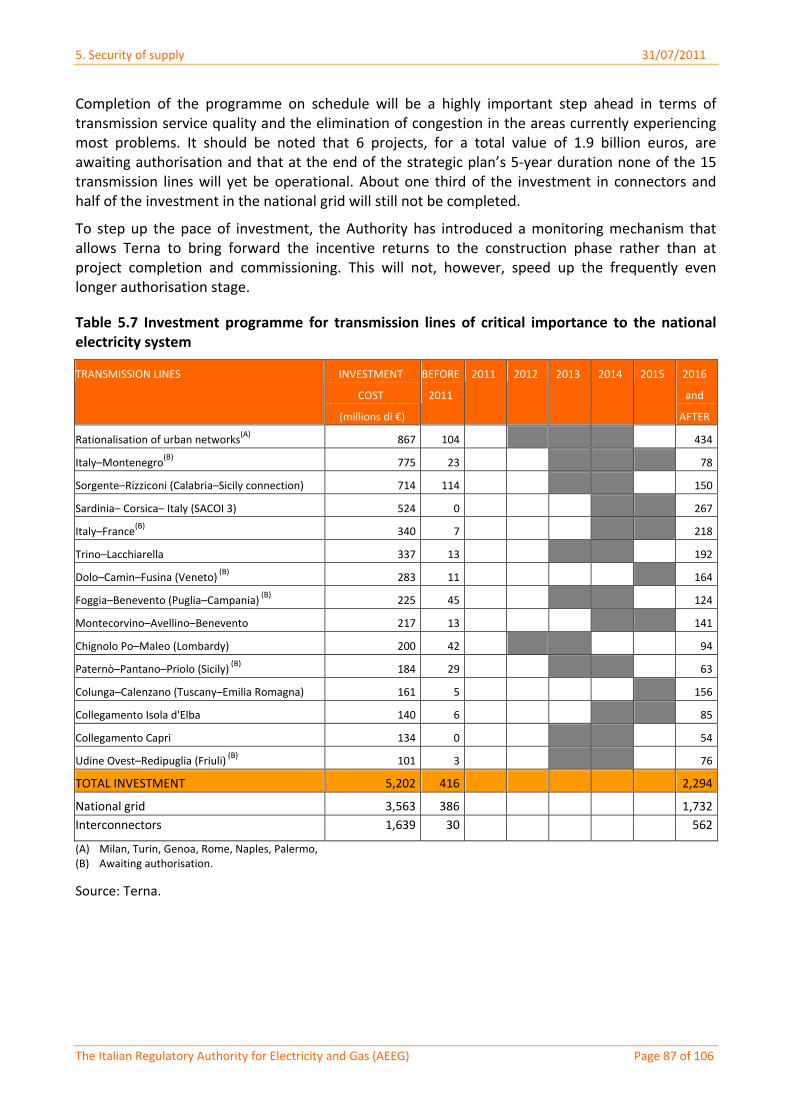
5. Security of supply 31/07/2011
The Italian Regulatory Authority for Electricity and Gas (AEEG) Page 87 of 106
Completion of the programme on schedule will be a highly important step ahead in terms of transmission service quality and the elimination of congestion in the areas currently experiencing most problems. It should be noted that 6 projects, for a total value of 1.9 billion euros, are awaiting authorisation and that at the end of the strategic plan’s 5‐year duration none of the 15 transmission lines will yet be operational. About one third of the investment in connectors and half of the investment in the national grid will still not be completed.
To step up the pace of investment, the Authority has introduced a monitoring mechanism that allows Terna to bring forward the incentive returns to the construction phase rather than at project completion and commissioning. This will not, however, speed up the frequently even longer authorisation stage.
Table 5.7 Investment programme for transmission lines of critical importance to the national electricity system
TRANSMISSION LINES INVESTMENT
COST
(millions di €)
BEFORE
2011
2011 2012 2013 2014 2015 2016
and
AFTER
Rationalisation of urban networks(A) 867 104 434
Italy–Montenegro(B) 775 23 78
Sorgente–Rizziconi (Calabria–Sicily connection) 714 114 150
Sardinia– Corsica– Italy (SACOI 3) 524 0 267
Italy–France(B) 340 7 218
Trino–Lacchiarella 337 13 192
Dolo–Camin–Fusina (Veneto) (B)
283 11 164
Foggia–Benevento (Puglia–Campania) (B)
225 45 124
Montecorvino–Avellino–Benevento 217 13 141
Chignolo Po–Maleo (Lombardy) 200 42 94
Paternò–Pantano–Priolo (Sicily) (B)
184 29 63
Colunga–Calenzano (Tuscany–Emilia Romagna) 161 5 156
Collegamento Isola d'Elba 140 6 85
Collegamento Capri 134 0 54
Udine Ovest–Redipuglia (Friuli) (B)
101 3 76
TOTAL INVESTMENT 5,202 416 2,294
National grid 3,563 386 1,732
Interconnectors 1,639 30 562
(A) Milan, Turin, Genoa, Rome, Naples, Palermo, (B) Awaiting authorisation.
Source: Terna.
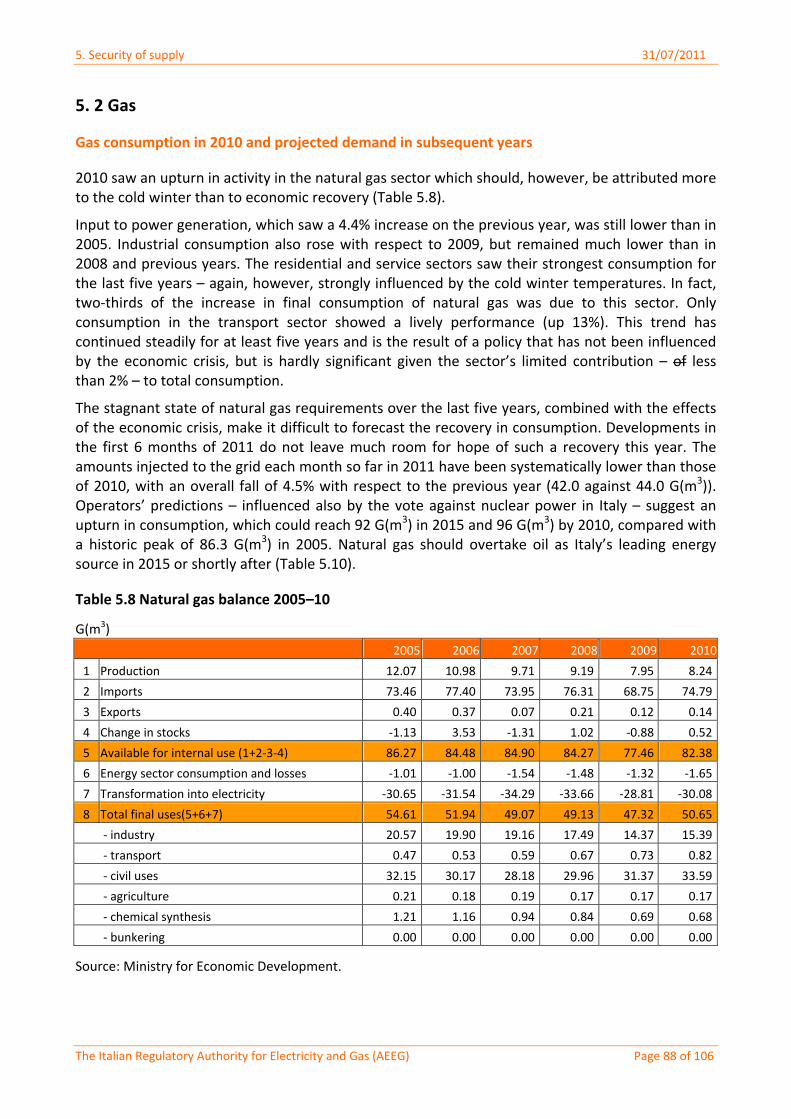
5. Security of supply 31/07/2011
The Italian Regulatory Authority for Electricity and Gas (AEEG) Page 88 of 106
5. 2 Gas
Gas consumption in 2010 and projected demand in subsequent years
2010 saw an upturn in activity in the natural gas sector which should, however, be attributed more to the cold winter than to economic recovery (Table 5.8).
Input to power generation, which saw a 4.4% increase on the previous year, was still lower than in 2005. Industrial consumption also rose with respect to 2009, but remained much lower than in 2008 and previous years. The residential and service sectors saw their strongest consumption for the last five years – again, however, strongly influenced by the cold winter temperatures. In fact, two‐thirds of the increase in final consumption of natural gas was due to this sector. Only consumption in the transport sector showed a lively performance (up 13%). This trend has continued steadily for at least five years and is the result of a policy that has not been influenced by the economic crisis, but is hardly significant given the sector’s limited contribution – of less than 2% – to total consumption.
The stagnant state of natural gas requirements over the last five years, combined with the effects of the economic crisis, make it difficult to forecast the recovery in consumption. Developments in the first 6 months of 2011 do not leave much room for hope of such a recovery this year. The amounts injected to the grid each month so far in 2011 have been systematically lower than those of 2010, with an overall fall of 4.5% with respect to the previous year (42.0 against 44.0 G(m3)). Operators’ predictions – influenced also by the vote against nuclear power in Italy – suggest an upturn in consumption, which could reach 92 G(m3) in 2015 and 96 G(m3) by 2010, compared with a historic peak of 86.3 G(m3) in 2005. Natural gas should overtake oil as Italy’s leading energy source in 2015 or shortly after (Table 5.10).
Table 5.8 Natural gas balance 2005–10
G(m3)
2005 2006 2007 2008 2009 2010
1 Production 12.07 10.98 9.71 9.19 7.95 8.24
2 Imports 73.46 77.40 73.95 76.31 68.75 74.79
3 Exports 0.40 0.37 0.07 0.21 0.12 0.14
4 Change in stocks ‐1.13 3.53 ‐1.31 1.02 ‐0.88 0.52
5 Available for internal use (1+2‐3‐4) 86.27 84.48 84.90 84.27 77.46 82.38
6 Energy sector consumption and losses ‐1.01 ‐1.00 ‐1.54 ‐1.48 ‐1.32 ‐1.65
7 Transformation into electricity ‐30.65 ‐31.54 ‐34.29 ‐33.66 ‐28.81 ‐30.08
8 Total final uses(5+6+7) 54.61 51.94 49.07 49.13 47.32 50.65
‐ industry 20.57 19.90 19.16 17.49 14.37 15.39
‐ transport 0.47 0.53 0.59 0.67 0.73 0.82
‐ civil uses 32.15 30.17 28.18 29.96 31.37 33.59
‐ agriculture 0.21 0.18 0.19 0.17 0.17 0.17
‐ chemical synthesis 1.21 1.16 0.94 0.84 0.69 0.68
‐ bunkering 0.00 0.00 0.00 0.00 0.00 0.00
Source: Ministry for Economic Development.
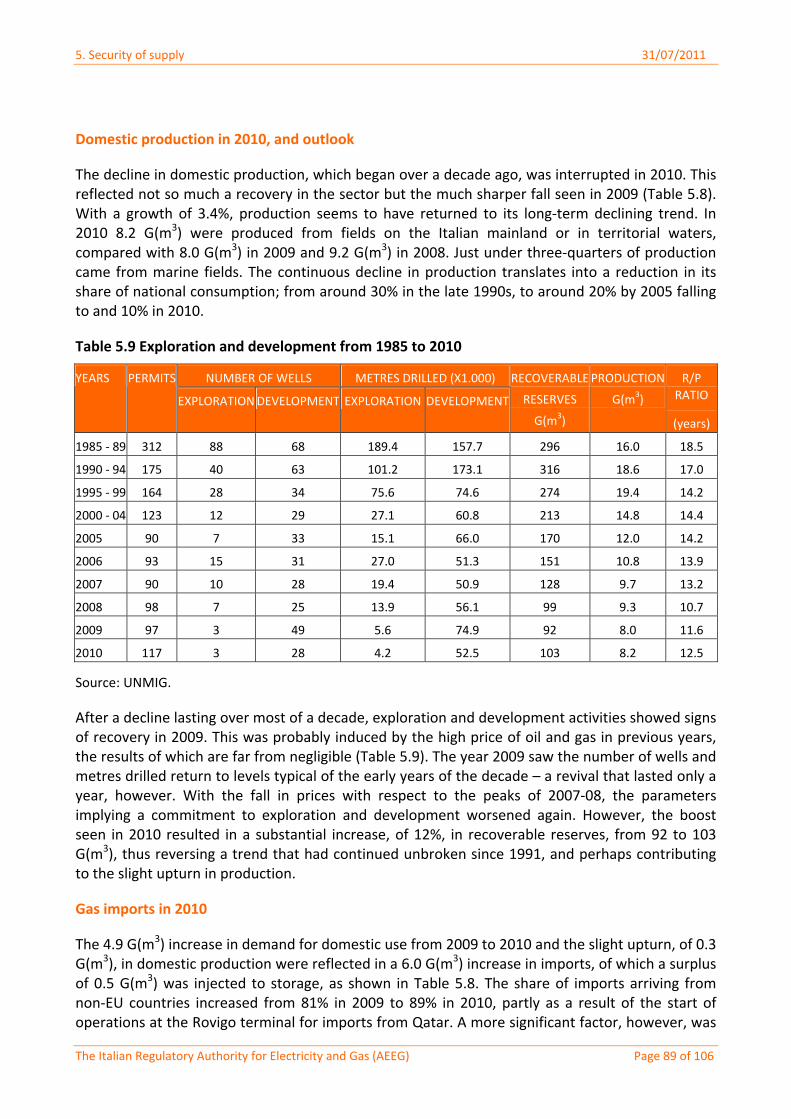
5. Security of supply 31/07/2011
The Italian Regulatory Authority for Electricity and Gas (AEEG) Page 89 of 106
Domestic production in 2010, and outlook
The decline in domestic production, which began over a decade ago, was interrupted in 2010. This reflected not so much a recovery in the sector but the much sharper fall seen in 2009 (Table 5.8). With a growth of 3.4%, production seems to have returned to its long‐term declining trend. In 2010 8.2 G(m3) were produced from fields on the Italian mainland or in territorial waters, compared with 8.0 G(m3) in 2009 and 9.2 G(m3) in 2008. Just under three‐quarters of production came from marine fields. The continuous decline in production translates into a reduction in its share of national consumption; from around 30% in the late 1990s, to around 20% by 2005 falling to and 10% in 2010.
Table 5.9 Exploration and development from 1985 to 2010
NUMBER OF WELLS METRES DRILLED (X1.000) YEARS PERMITS
EXPLORATION DEVELOPMENT EXPLORATION DEVELOPMENT
RECOVERABLE
RESERVES
G(m3)
PRODUCTION
G(m3)
R/P
RATIO
(years)
1985 ‐ 89 312 88 68 189.4 157.7 296 16.0 18.5
1990 ‐ 94 175 40 63 101.2 173.1 316 18.6 17.0
1995 ‐ 99 164 28 34 75.6 74.6 274 19.4 14.2
2000 ‐ 04 123 12 29 27.1 60.8 213 14.8 14.4
2005 90 7 33 15.1 66.0 170 12.0 14.2
2006 93 15 31 27.0 51.3 151 10.8 13.9
2007 90 10 28 19.4 50.9 128 9.7 13.2
2008 98 7 25 13.9 56.1 99 9.3 10.7
2009 97 3 49 5.6 74.9 92 8.0 11.6
2010 117 3 28 4.2 52.5 103 8.2 12.5
Source: UNMIG.
After a decline lasting over most of a decade, exploration and development activities showed signs of recovery in 2009. This was probably induced by the high price of oil and gas in previous years, the results of which are far from negligible (Table 5.9). The year 2009 saw the number of wells and metres drilled return to levels typical of the early years of the decade – a revival that lasted only a year, however. With the fall in prices with respect to the peaks of 2007‐08, the parameters implying a commitment to exploration and development worsened again. However, the boost seen in 2010 resulted in a substantial increase, of 12%, in recoverable reserves, from 92 to 103 G(m3), thus reversing a trend that had continued unbroken since 1991, and perhaps contributing to the slight upturn in production.
Gas imports in 2010
The 4.9 G(m3) increase in demand for domestic use from 2009 to 2010 and the slight upturn, of 0.3 G(m3), in domestic production were reflected in a 6.0 G(m3) increase in imports, of which a surplus of 0.5 G(m3) was injected to storage, as shown in Table 5.8. The share of imports arriving from non‐EU countries increased from 81% in 2009 to 89% in 2010, partly as a result of the start of operations at the Rovigo terminal for imports from Qatar. A more significant factor, however, was
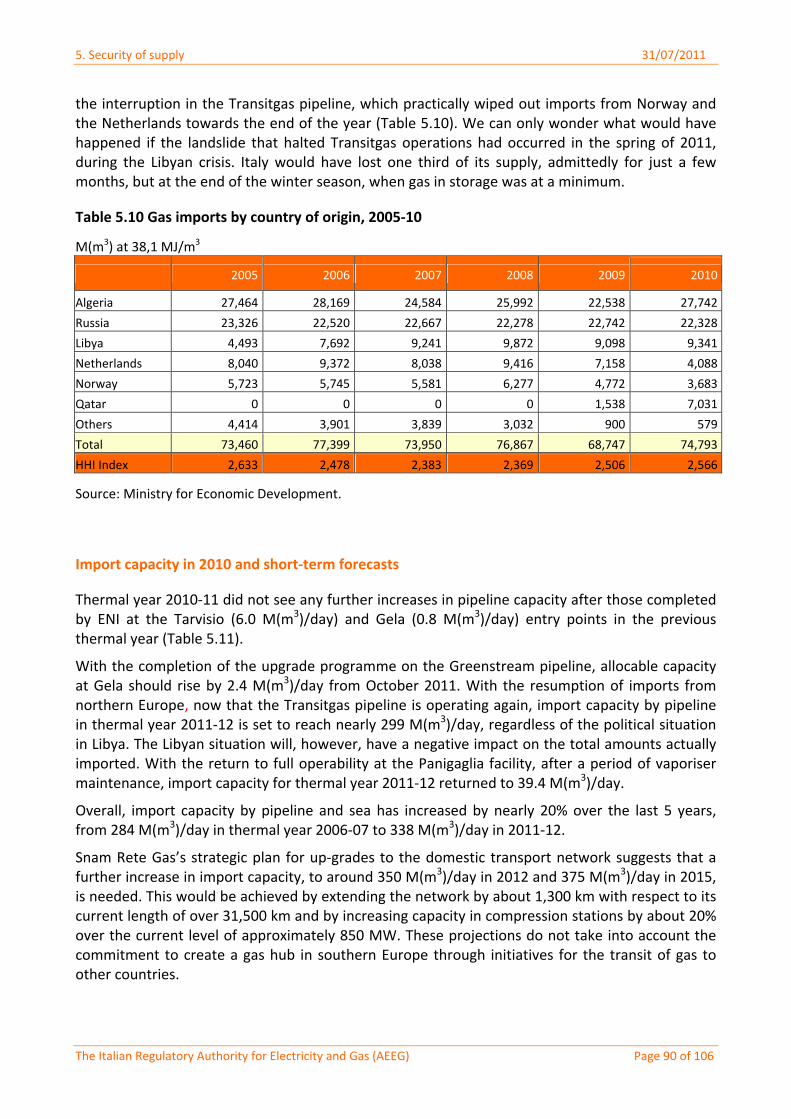
5. Security of supply 31/07/2011
The Italian Regulatory Authority for Electricity and Gas (AEEG) Page 90 of 106
the interruption in the Transitgas pipeline, which practically wiped out imports from Norway and the Netherlands towards the end of the year (Table 5.10). We can only wonder what would have happened if the landslide that halted Transitgas operations had occurred in the spring of 2011, during the Libyan crisis. Italy would have lost one third of its supply, admittedly for just a few months, but at the end of the winter season, when gas in storage was at a minimum.
Table 5.10 Gas imports by country of origin, 2005‐10
M(m3) at 38,1 MJ/m3
2005 2006 2007 2008 2009 2010
Algeria 27,464 28,169 24,584 25,992 22,538 27,742
Russia 23,326 22,520 22,667 22,278 22,742 22,328
Libya 4,493 7,692 9,241 9,872 9,098 9,341
Netherlands 8,040 9,372 8,038 9,416 7,158 4,088
Norway 5,723 5,745 5,581 6,277 4,772 3,683
Qatar 0 0 0 0 1,538 7,031
Others 4,414 3,901 3,839 3,032 900 579
Total 73,460 77,399 73,950 76,867 68,747 74,793
HHI Index 2,633 2,478 2,383 2,369 2,506 2,566
Source: Ministry for Economic Development.
Import capacity in 2010 and short‐term forecasts
Thermal year 2010‐11 did not see any further increases in pipeline capacity after those completed by ENI at the Tarvisio (6.0 M(m3)/day) and Gela (0.8 M(m3)/day) entry points in the previous thermal year (Table 5.11).
With the completion of the upgrade programme on the Greenstream pipeline, allocable capacity at Gela should rise by 2.4 M(m3)/day from October 2011. With the resumption of imports from northern Europe, now that the Transitgas pipeline is operating again, import capacity by pipeline in thermal year 2011‐12 is set to reach nearly 299 M(m3)/day, regardless of the political situation in Libya. The Libyan situation will, however, have a negative impact on the total amounts actually imported. With the return to full operability at the Panigaglia facility, after a period of vaporiser maintenance, import capacity for thermal year 2011‐12 returned to 39.4 M(m3)/day.
Overall, import capacity by pipeline and sea has increased by nearly 20% over the last 5 years, from 284 M(m3)/day in thermal year 2006‐07 to 338 M(m3)/day in 2011‐12.
Snam Rete Gas’s strategic plan for up‐grades to the domestic transport network suggests that a further increase in import capacity, to around 350 M(m3)/day in 2012 and 375 M(m3)/day in 2015, is needed. This would be achieved by extending the network by about 1,300 km with respect to its current length of over 31,500 km and by increasing capacity in compression stations by about 20% over the current level of approximately 850 MW. These projections do not take into account the commitment to create a gas hub in southern Europe through initiatives for the transit of gas to other countries.
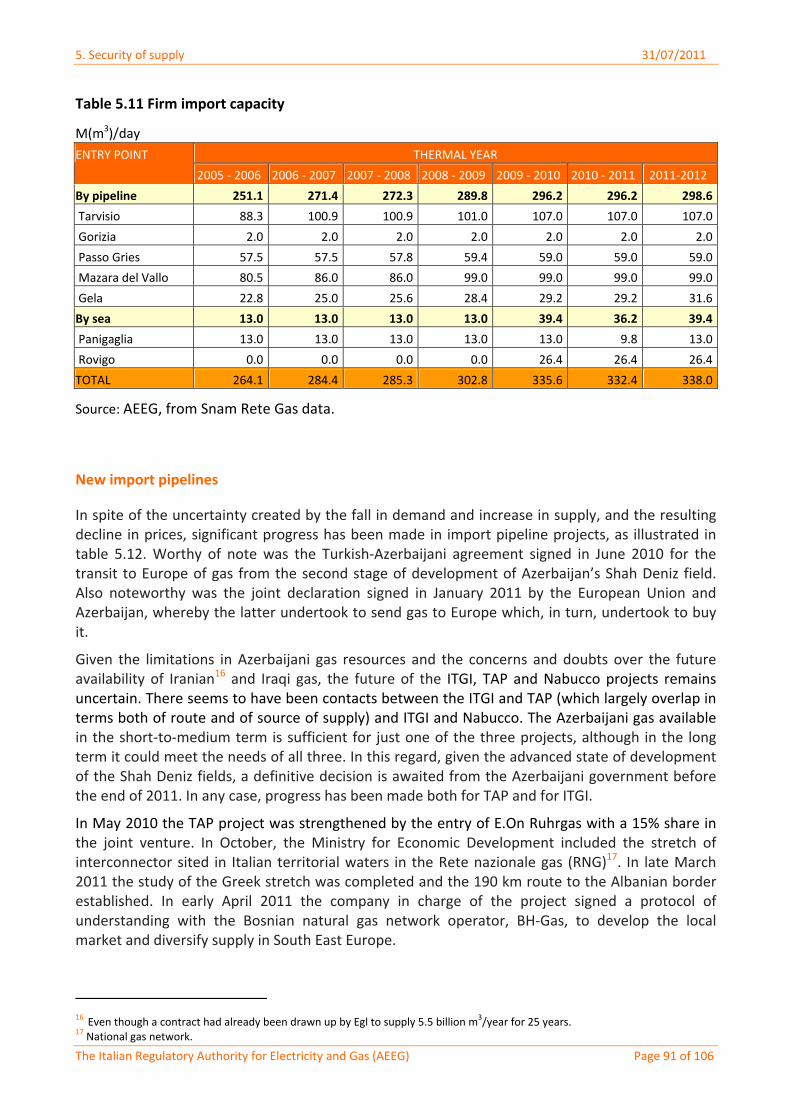
5. Security of supply 31/07/2011
The Italian Regulatory Authority for Electricity and Gas (AEEG) Page 91 of 106
Table 5.11 Firm import capacity
M(m3)/day
THERMAL YEAR ENTRY POINT
2005 ‐ 2006 2006 ‐ 2007 2007 ‐ 2008 2008 ‐ 2009 2009 ‐ 2010 2010 ‐ 2011 2011‐2012
By pipeline 251.1 271.4 272.3 289.8 296.2 296.2 298.6
Tarvisio 88.3 100.9 100.9 101.0 107.0 107.0 107.0
Gorizia 2.0 2.0 2.0 2.0 2.0 2.0 2.0
Passo Gries 57.5 57.5 57.8 59.4 59.0 59.0 59.0
Mazara del Vallo 80.5 86.0 86.0 99.0 99.0 99.0 99.0
Gela 22.8 25.0 25.6 28.4 29.2 29.2 31.6
By sea 13.0 13.0 13.0 13.0 39.4 36.2 39.4
Panigaglia 13.0 13.0 13.0 13.0 13.0 9.8 13.0
Rovigo 0.0 0.0 0.0 0.0 26.4 26.4 26.4
TOTAL 264.1 284.4 285.3 302.8 335.6 332.4 338.0
Source: AEEG, from Snam Rete Gas data.
New import pipelines
In spite of the uncertainty created by the fall in demand and increase in supply, and the resulting decline in prices, significant progress has been made in import pipeline projects, as illustrated in table 5.12. Worthy of note was the Turkish‐Azerbaijani agreement signed in June 2010 for the transit to Europe of gas from the second stage of development of Azerbaijan’s Shah Deniz field. Also noteworthy was the joint declaration signed in January 2011 by the European Union and Azerbaijan, whereby the latter undertook to send gas to Europe which, in turn, undertook to buy it.
Given the limitations in Azerbaijani gas resources and the concerns and doubts over the future availability of Iranian16 and Iraqi gas, the future of the ITGI, TAP and Nabucco projects remains uncertain. There seems to have been contacts between the ITGI and TAP (which largely overlap in terms both of route and of source of supply) and ITGI and Nabucco. The Azerbaijani gas available in the short‐to‐medium term is sufficient for just one of the three projects, although in the long term it could meet the needs of all three. In this regard, given the advanced state of development of the Shah Deniz fields, a definitive decision is awaited from the Azerbaijani government before the end of 2011. In any case, progress has been made both for TAP and for ITGI.
In May 2010 the TAP project was strengthened by the entry of E.On Ruhrgas with a 15% share in the joint venture. In October, the Ministry for Economic Development included the stretch of interconnector sited in Italian territorial waters in the Rete nazionale gas (RNG)17. In late March 2011 the study of the Greek stretch was completed and the 190 km route to the Albanian border established. In early April 2011 the company in charge of the project signed a protocol of understanding with the Bosnian natural gas network operator, BH‐Gas, to develop the local market and diversify supply in South East Europe.
16 Even though a contract had already been drawn up by Egl to supply 5.5 billion m3/year for 25 years. 17 National gas network.
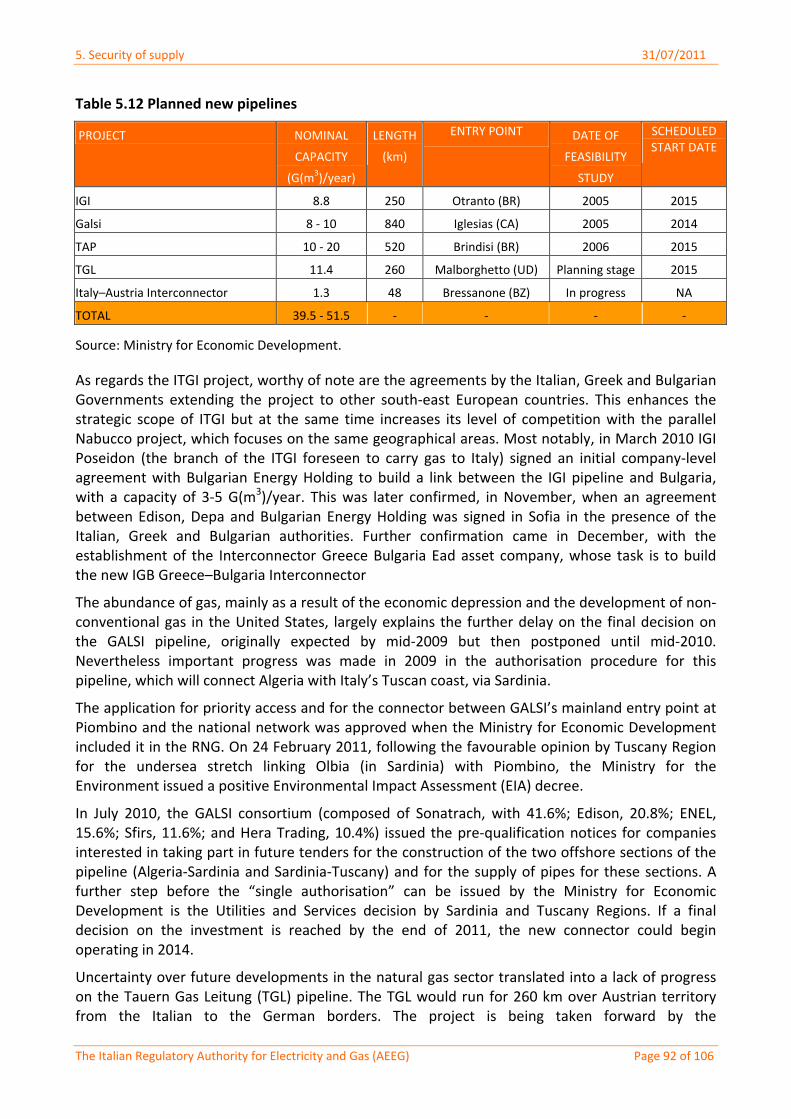
5. Security of supply 31/07/2011
The Italian Regulatory Authority for Electricity and Gas (AEEG) Page 92 of 106
Table 5.12 Planned new pipelines
PROJECT NOMINAL
CAPACITY
(G(m3)/year)
LENGTH
(km)
ENTRY POINT DATE OF
FEASIBILITY
STUDY
SCHEDULED START DATE
IGI 8.8 250 Otranto (BR) 2005 2015
Galsi 8 ‐ 10 840 Iglesias (CA) 2005 2014
TAP 10 ‐ 20 520 Brindisi (BR) 2006 2015
TGL 11.4 260 Malborghetto (UD) Planning stage 2015
Italy–Austria Interconnector 1.3 48 Bressanone (BZ) In progress NA
TOTAL 39.5 ‐ 51.5 ‐ ‐ ‐ ‐
Source: Ministry for Economic Development.
As regards the ITGI project, worthy of note are the agreements by the Italian, Greek and Bulgarian Governments extending the project to other south‐east European countries. This enhances the strategic scope of ITGI but at the same time increases its level of competition with the parallel Nabucco project, which focuses on the same geographical areas. Most notably, in March 2010 IGI Poseidon (the branch of the ITGI foreseen to carry gas to Italy) signed an initial company‐level agreement with Bulgarian Energy Holding to build a link between the IGI pipeline and Bulgaria, with a capacity of 3‐5 G(m3)/year. This was later confirmed, in November, when an agreement between Edison, Depa and Bulgarian Energy Holding was signed in Sofia in the presence of the Italian, Greek and Bulgarian authorities. Further confirmation came in December, with the establishment of the Interconnector Greece Bulgaria Ead asset company, whose task is to build the new IGB Greece–Bulgaria Interconnector
The abundance of gas, mainly as a result of the economic depression and the development of non‐conventional gas in the United States, largely explains the further delay on the final decision on the GALSI pipeline, originally expected by mid‐2009 but then postponed until mid‐2010. Nevertheless important progress was made in 2009 in the authorisation procedure for this pipeline, which will connect Algeria with Italy’s Tuscan coast, via Sardinia.
The application for priority access and for the connector between GALSI’s mainland entry point at Piombino and the national network was approved when the Ministry for Economic Development included it in the RNG. On 24 February 2011, following the favourable opinion by Tuscany Region for the undersea stretch linking Olbia (in Sardinia) with Piombino, the Ministry for the Environment issued a positive Environmental Impact Assessment (EIA) decree.
In July 2010, the GALSI consortium (composed of Sonatrach, with 41.6%; Edison, 20.8%; ENEL, 15.6%; Sfirs, 11.6%; and Hera Trading, 10.4%) issued the pre‐qualification notices for companies interested in taking part in future tenders for the construction of the two offshore sections of the pipeline (Algeria‐Sardinia and Sardinia‐Tuscany) and for the supply of pipes for these sections. A further step before the “single authorisation” can be issued by the Ministry for Economic Development is the Utilities and Services decision by Sardinia and Tuscany Regions. If a final decision on the investment is reached by the end of 2011, the new connector could begin operating in 2014.
Uncertainty over future developments in the natural gas sector translated into a lack of progress on the Tauern Gas Leitung (TGL) pipeline. The TGL would run for 260 km over Austrian territory from the Italian to the German borders. The project is being taken forward by the
5. Security of supply 31/07/2011
The Italian Regulatory Authority for Electricity and Gas (AEEG) Page 93 of 106
Tauerngasleitung Studien und Planungsgesellschaft Mbh consortium, 45% controlled by E.On and 55% by five Austrian companies.
As regards existing pipelines, the political situation in Libya will inevitably delay the completion of the Greenstream pipeline up‐grade from 29.2 to 31.6 M(m3)/day, initially scheduled for October 2011. The pipeline, in which ENI and the Libyan state‐owned company NOC are equal shareholders, carries gas from Libya to Italy. Operations were halted in late February 2011, when it was closed as a result of the unrest in Libya.
New liquefied natural gas terminals
The twelve months since the previous Annual Report have seen important progress in the authorisation procedures for the construction of new LNG regasification terminals on the Italian coastline or in territorial waters. These are summarised in Table 5.13.
In 2010 the Ministry for the Environment issued positive Environmental Impact Assessment (EIA) decrees for the expansion of the Panigaglia (SP) terminal and for the new terminals at Brindisi (BR), Monfalcone (TS), Rosignano (LI) and Zaule (TS). In the case of Zaule, the decree also included the pipeline‐RNG connector. A further positive EIA came in January 2011, for Porto Recanati (AN).
However, it is unlikely that the above plants will begin operating any time soon, for two main reasons. First, once the EIA has been issued, the Ministry for Economic Development can issue a “single authorisation” for the construction and operation of the plant only after the Utilities and Services Commission – which is entitled to reopen the whole case up for discussion – has given its opinion. And second, because the changed conditions of the gas market have led the companies proposing the projects to review their investment plans. For example, construction work on the Gioia Tauro terminal has not even started yet, although it obtained a definitive green light in December 2009.
The Toscana Offshore (LI), Falconara Marittima (AN) and Porto Empedocle (AG) facilities are at a more advanced stage of progress. For the first, which consists of a methane tanker transformed into a floating terminal permanently anchored 22km off the coast of Tuscany, between Livorno and Pisa, the first load of gas is expected in the second half of 2012. The second, to be constructed by converting an existing oil platform 16 km off the coast, obtained the definitive go‐ahead from the Utilities and Services Commission in July 2011. The third, at Porto Empedocle, obtained the green light that same month from the Council of State, which granted the appeal lodged by Nuove Energie against the ruling by Lazio Regional Administrative Court (TAR). The TAR’s ruling had halted the works in December 2010 in response to a case lodged by Agrigento Municipal Council and a local environmental committee.
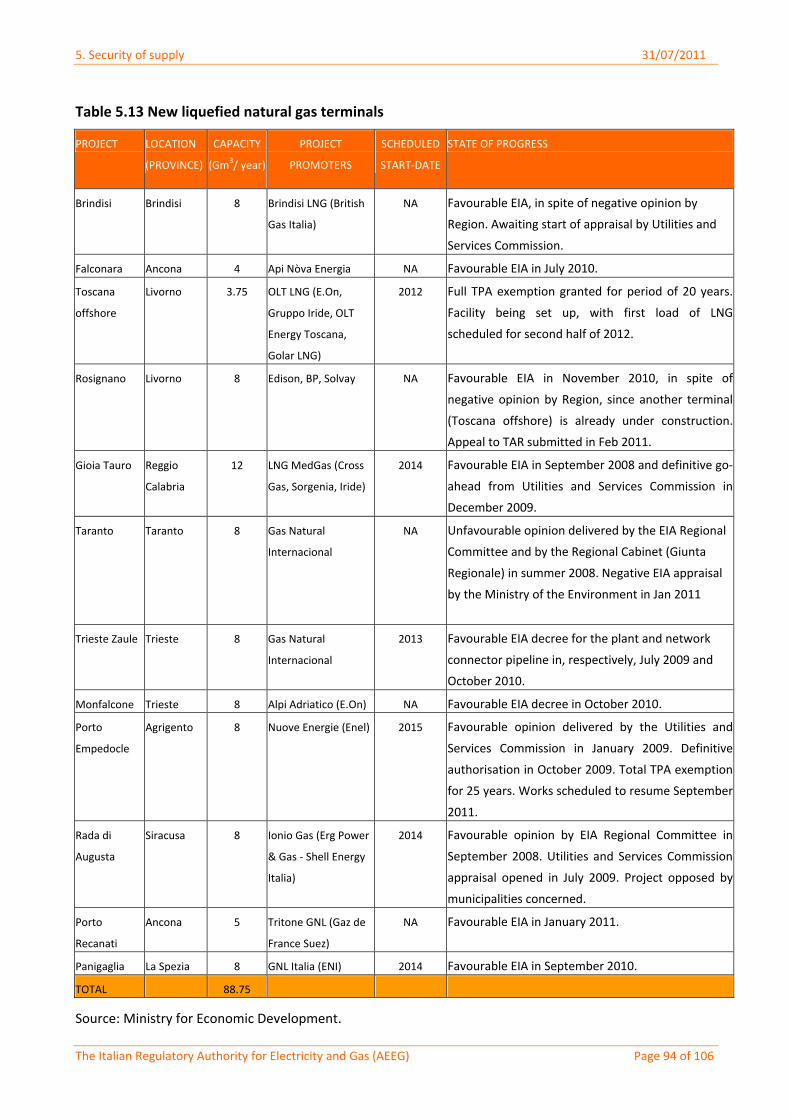
5. Security of supply 31/07/2011
The Italian Regulatory Authority for Electricity and Gas (AEEG) Page 94 of 106
Table 5.13 New liquefied natural gas terminals
PROJECT LOCATION
(PROVINCE)
CAPACITY
(Gm3/ year)
PROJECT
PROMOTERS
SCHEDULED
START‐DATE
STATE OF PROGRESS
Brindisi Brindisi 8 Brindisi LNG (British
Gas Italia)
NA Favourable EIA, in spite of negative opinion by
Region. Awaiting start of appraisal by Utilities and
Services Commission.
Falconara Ancona 4 Api Nòva Energia NA Favourable EIA in July 2010.
Toscana
offshore
Livorno 3.75 OLT LNG (E.On,
Gruppo Iride, OLT
Energy Toscana,
Golar LNG)
2012 Full TPA exemption granted for period of 20 years.
Facility being set up, with first load of LNG
scheduled for second half of 2012.
Rosignano Livorno 8 Edison, BP, Solvay NA Favourable EIA in November 2010, in spite of
negative opinion by Region, since another terminal
(Toscana offshore) is already under construction.
Appeal to TAR submitted in Feb 2011.
Gioia Tauro Reggio
Calabria
12 LNG MedGas (Cross
Gas, Sorgenia, Iride)
2014 Favourable EIA in September 2008 and definitive go‐
ahead from Utilities and Services Commission in
December 2009.
Taranto Taranto 8 Gas Natural
Internacional
NA Unfavourable opinion delivered by the EIA Regional
Committee and by the Regional Cabinet (Giunta
Regionale) in summer 2008. Negative EIA appraisal
by the Ministry of the Environment in Jan 2011
Trieste Zaule Trieste 8 Gas Natural
Internacional
2013 Favourable EIA decree for the plant and network
connector pipeline in, respectively, July 2009 and
October 2010.
Monfalcone Trieste 8 Alpi Adriatico (E.On) NA Favourable EIA decree in October 2010.
Porto
Empedocle
Agrigento 8 Nuove Energie (Enel) 2015 Favourable opinion delivered by the Utilities and
Services Commission in January 2009. Definitive
authorisation in October 2009. Total TPA exemption
for 25 years. Works scheduled to resume September
2011.
Rada di
Augusta
Siracusa 8 Ionio Gas (Erg Power
& Gas ‐ Shell Energy
Italia)
2014 Favourable opinion by EIA Regional Committee in
September 2008. Utilities and Services Commission
appraisal opened in July 2009. Project opposed by
municipalities concerned.
Porto
Recanati
Ancona 5 Tritone GNL (Gaz de
France Suez)
NA Favourable EIA in January 2011.
Panigaglia La Spezia 8 GNL Italia (ENI) 2014 Favourable EIA in September 2010.
TOTAL 88.75
Source: Ministry for Economic Development.
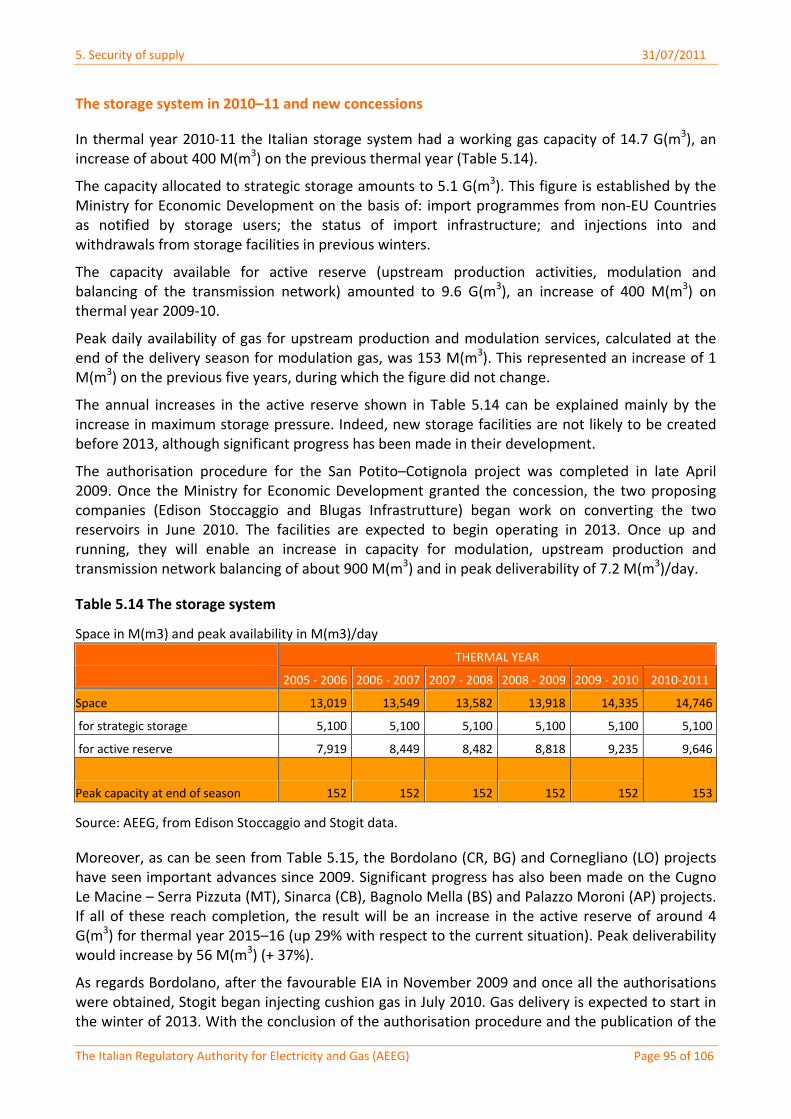
5. Security of supply 31/07/2011
The Italian Regulatory Authority for Electricity and Gas (AEEG) Page 95 of 106
The storage system in 2010–11 and new concessions
In thermal year 2010‐11 the Italian storage system had a working gas capacity of 14.7 G(m3), an increase of about 400 M(m3) on the previous thermal year (Table 5.14).
The capacity allocated to strategic storage amounts to 5.1 G(m3). This figure is established by the Ministry for Economic Development on the basis of: import programmes from non‐EU Countries as notified by storage users; the status of import infrastructure; and injections into and withdrawals from storage facilities in previous winters.
The capacity available for active reserve (upstream production activities, modulation and balancing of the transmission network) amounted to 9.6 G(m3), an increase of 400 M(m3) on thermal year 2009‐10.
Peak daily availability of gas for upstream production and modulation services, calculated at the end of the delivery season for modulation gas, was 153 M(m3). This represented an increase of 1 M(m3) on the previous five years, during which the figure did not change.
The annual increases in the active reserve shown in Table 5.14 can be explained mainly by the increase in maximum storage pressure. Indeed, new storage facilities are not likely to be created before 2013, although significant progress has been made in their development.
The authorisation procedure for the San Potito–Cotignola project was completed in late April 2009. Once the Ministry for Economic Development granted the concession, the two proposing companies (Edison Stoccaggio and Blugas Infrastrutture) began work on converting the two reservoirs in June 2010. The facilities are expected to begin operating in 2013. Once up and running, they will enable an increase in capacity for modulation, upstream production and transmission network balancing of about 900 M(m3) and in peak deliverability of 7.2 M(m3)/day.
Table 5.14 The storage system
Space in M(m3) and peak availability in M(m3)/day
THERMAL YEAR
2005 ‐ 2006 2006 ‐ 2007 2007 ‐ 2008 2008 ‐ 2009 2009 ‐ 2010 2010‐2011
Space 13,019 13,549 13,582 13,918 14,335 14,746
for strategic storage 5,100 5,100 5,100 5,100 5,100 5,100
for active reserve 7,919 8,449 8,482 8,818 9,235 9,646
Peak capacity at end of season 152 152 152 152 152 153
Source: AEEG, from Edison Stoccaggio and Stogit data.
Moreover, as can be seen from Table 5.15, the Bordolano (CR, BG) and Cornegliano (LO) projects have seen important advances since 2009. Significant progress has also been made on the Cugno Le Macine – Serra Pizzuta (MT), Sinarca (CB), Bagnolo Mella (BS) and Palazzo Moroni (AP) projects. If all of these reach completion, the result will be an increase in the active reserve of around 4 G(m3) for thermal year 2015–16 (up 29% with respect to the current situation). Peak deliverability would increase by 56 M(m3) (+ 37%).
As regards Bordolano, after the favourable EIA in November 2009 and once all the authorisations were obtained, Stogit began injecting cushion gas in July 2010. Gas delivery is expected to start in the winter of 2013. With the conclusion of the authorisation procedure and the publication of the
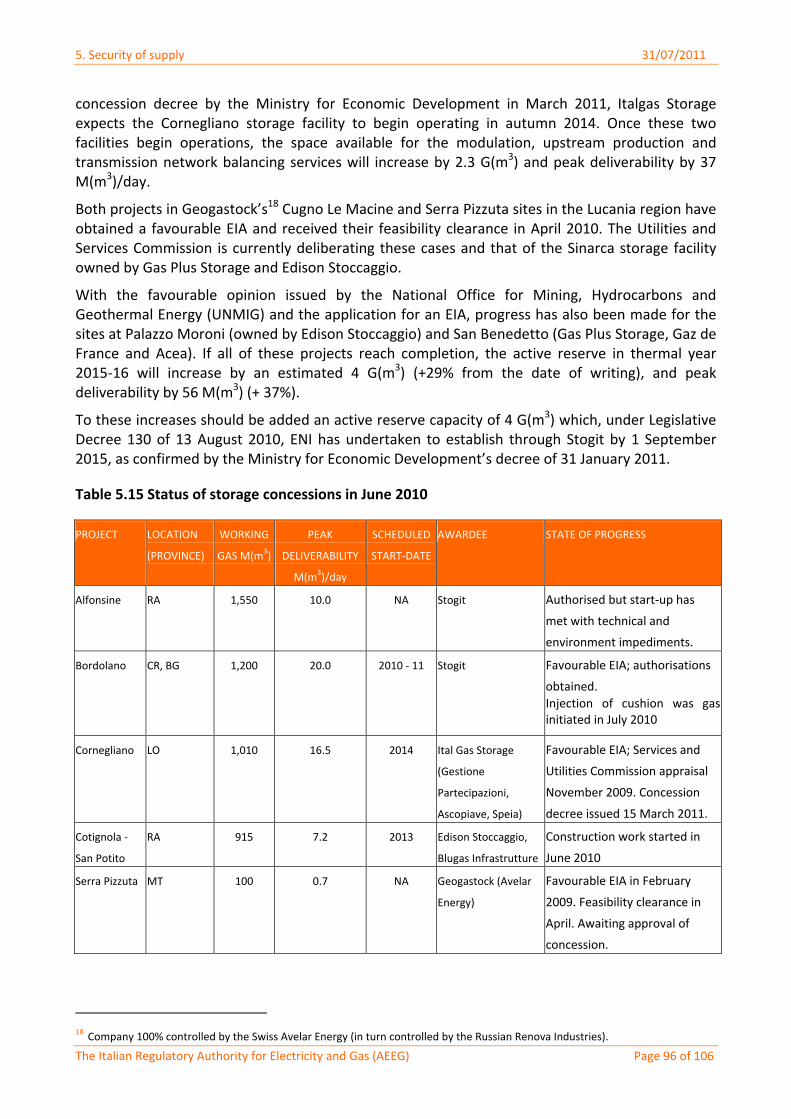
5. Security of supply 31/07/2011
The Italian Regulatory Authority for Electricity and Gas (AEEG) Page 96 of 106
concession decree by the Ministry for Economic Development in March 2011, Italgas Storage expects the Cornegliano storage facility to begin operating in autumn 2014. Once these two facilities begin operations, the space available for the modulation, upstream production and transmission network balancing services will increase by 2.3 G(m3) and peak deliverability by 37 M(m3)/day.
Both projects in Geogastock’s18 Cugno Le Macine and Serra Pizzuta sites in the Lucania region have obtained a favourable EIA and received their feasibility clearance in April 2010. The Utilities and Services Commission is currently deliberating these cases and that of the Sinarca storage facility owned by Gas Plus Storage and Edison Stoccaggio.
With the favourable opinion issued by the National Office for Mining, Hydrocarbons and Geothermal Energy (UNMIG) and the application for an EIA, progress has also been made for the sites at Palazzo Moroni (owned by Edison Stoccaggio) and San Benedetto (Gas Plus Storage, Gaz de France and Acea). If all of these projects reach completion, the active reserve in thermal year 2015‐16 will increase by an estimated 4 G(m3) (+29% from the date of writing), and peak deliverability by 56 M(m3) (+ 37%).
To these increases should be added an active reserve capacity of 4 G(m3) which, under Legislative Decree 130 of 13 August 2010, ENI has undertaken to establish through Stogit by 1 September 2015, as confirmed by the Ministry for Economic Development’s decree of 31 January 2011.
Table 5.15 Status of storage concessions in June 2010
PROJECT LOCATION
(PROVINCE)
WORKING
GAS M(m3)
PEAK
DELIVERABILITY
M(m3)/day
SCHEDULED
START‐DATE
AWARDEE STATE OF PROGRESS
Alfonsine RA 1,550 10.0 NA Stogit Authorised but start‐up has
met with technical and
environment impediments.
Bordolano CR, BG 1,200 20.0 2010 ‐ 11 Stogit Favourable EIA; authorisations
obtained.
Injection of cushion was gas initiated in July 2010
Cornegliano LO 1,010 16.5 2014 Ital Gas Storage
(Gestione
Partecipazioni,
Ascopiave, Speia)
Favourable EIA; Services and
Utilities Commission appraisal
November 2009. Concession
decree issued 15 March 2011.
Cotignola ‐
San Potito
RA 915 7.2 2013 Edison Stoccaggio,
Blugas Infrastrutture
Construction work started in
June 2010
Serra Pizzuta MT 100 0.7 NA Geogastock (Avelar
Energy)
Favourable EIA in February
2009. Feasibility clearance in
April. Awaiting approval of
concession.
18 Company 100% controlled by the Swiss Avelar Energy (in turn controlled by the Russian Renova Industries).
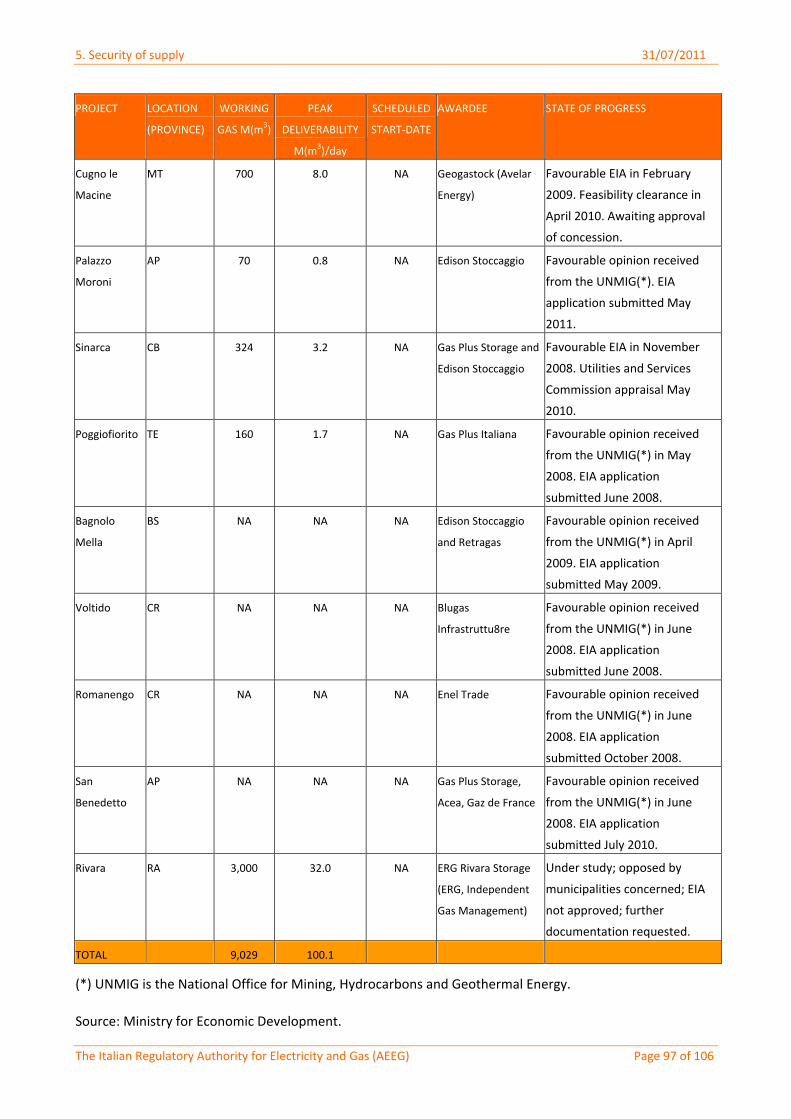
5. Security of supply 31/07/2011
The Italian Regulatory Authority for Electricity and Gas (AEEG) Page 97 of 106
PROJECT LOCATION
(PROVINCE)
WORKING
GAS M(m3)
PEAK
DELIVERABILITY
M(m3)/day
SCHEDULED
START‐DATE
AWARDEE STATE OF PROGRESS
Cugno le
Macine
MT 700 8.0 NA Geogastock (Avelar
Energy)
Favourable EIA in February
2009. Feasibility clearance in
April 2010. Awaiting approval
of concession.
Palazzo
Moroni
AP 70 0.8 NA Edison Stoccaggio Favourable opinion received
from the UNMIG(*). EIA
application submitted May
2011.
Sinarca CB 324 3.2 NA Gas Plus Storage and
Edison Stoccaggio
Favourable EIA in November
2008. Utilities and Services
Commission appraisal May
2010.
Poggiofiorito TE 160 1.7 NA Gas Plus Italiana Favourable opinion received
from the UNMIG(*) in May
2008. EIA application
submitted June 2008.
Bagnolo
Mella
BS NA NA NA Edison Stoccaggio
and Retragas
Favourable opinion received
from the UNMIG(*) in April
2009. EIA application
submitted May 2009.
Voltido CR NA NA NA Blugas
Infrastruttu8re
Favourable opinion received
from the UNMIG(*) in June
2008. EIA application
submitted June 2008.
Romanengo CR NA NA NA Enel Trade Favourable opinion received
from the UNMIG(*) in June
2008. EIA application
submitted October 2008.
San
Benedetto
AP NA NA NA Gas Plus Storage,
Acea, Gaz de France
Favourable opinion received
from the UNMIG(*) in June
2008. EIA application
submitted July 2010.
Rivara RA 3,000 32.0 NA ERG Rivara Storage
(ERG, Independent
Gas Management)
Under study; opposed by
municipalities concerned; EIA
not approved; further
documentation requested.
TOTAL 9,029 100.1
(*) UNMIG is the National Office for Mining, Hydrocarbons and Geothermal Energy.
Source: Ministry for Economic Development.
5. Security of supply 31/07/2011
The Italian Regulatory Authority for Electricity and Gas (AEEG) Page 98 of 106
Supply/demand balance in the short to medium term
Considering the economic crisis and the reduced demand for natural gas that has accompanied it, together with the import capacity expansion currently under way in Italy, it is difficult to imagine supply problems emerging over the next few years except in the case of long‐term supply interruptions by the main suppliers (Algeria and Russia).
The start of operations of the new regasification terminals, which will bring an additional import capacity of around 20 M(m3), will be enough in itself to create a gas surplus.

6. Public service issues and consumer protection 31/07/2011
The Italian Regulatory Authority for Electricity and Gas (AEEG) Page 99 of 106
6 PUBLIC SERVICE ISSUES AND CONSUMER PROTECTION
In 2010 the Authority for Electricity and Gas continued in its work of achieving increased protection for consumers and users in both the electricity and gas markets.
More specifically, the Authority’s regulatory activity has focused on concrete measures to strengthen end‐users’ ability to make informed choices from the various commercial service offers on the market. It moreover focussed on the gradual harmonisation and standardisation of the regulation concerning commercial services, while respecting the structural differences between the electricity and gas sectors.
No significant changes were made in 2010 to the obligations that companies operating in the gas and electricity markets are required to meet.
Unbundling of distribution and sales activities
Law 125/07, which implemented some of the provisions of Directives 55 and 54 of 2003, imposed the legal unbundling of electricity retail and distribution companies with over 100,000 customers (10 out of a total of 144).
Retail companies in the natural gas sector (231 in 2010) must be unbundled from distributors (of which 237 were active in 2010). They require authorisation by the Ministry for Economic Activity to carry out this activity only if they intend to provide directly end‐users.
In 2007, the terms and conditions of administrative and accounting unbundling were defined by the Authority (Unbundling Code) and in 2008 the Guidelines for the preparation of the unbundling programme were approved. Following the decisions by the Council of State in December 2008 cancelling these provisions, in April 2010 the Authority amended and supplemented the rules governing administrative and accounting unbundling for companies operating in the electricity and gas sectors.
More specifically, these changes concern:
the introduction of a time limit on the action of the independent operator;
the exclusion of metering activities from functional unbundling obligations;
the elimination of the compulsory requirement on the independent operator to report to the Authority any decision taken within the vertically integrated company that might contrast the general goal of functional unbundling;
provisions concerning the staffing of the independent operator;
the possibility, envisaged by the Directives in the 2nd energy package, of establishing joint system operators (distribution and transmission in the electricity sector and transport, regasification, storage and distribution in the natural gas sector).
The programme of unbundling procedures envisaged by the Guidelines approved by the Authority in 2008 was also cancelled by the Regional Administrative Court (TAR) rulings of 2009 and is therefore no longer binding.

6. Public service issues and consumer protection 31/07/2011
The Italian Regulatory Authority for Electricity and Gas (AEEG) Page 100 of 106
Sales on the retail market
No authorisation is required in Italy to operate in the electricity retail market. However, to help consumers become better informed about the existing retailers, in June 2007 the Authority began to publish a list on its website of retail companies meeting certain reliability requirements. Inclusion in the list is voluntary.
In providing for full liberalisation of the electricity market, Law 125/07 also established an “enhanced protection regime” (servizio di maggior tutela) for low‐voltage residential and small‐business customers. The service benefits from protected supply conditions (in terms of quality and equitable prices) set by the Authority. Law 125/07 also introduced a “safeguard regime” (servizio di salvaguardia) for non‐domestic low‐voltage medium‐sized customers and medium‐voltage customers opting not to choose a supplier on the liberalised market. The safeguard regime envisages a “supplier of last resort” selected by the Ministry for Economic Development through competitive bidding procedures.
In 2010, based on the surveys conducted by the Authority, there were 150 retailers operating under the “enhanced protection regime” and 192 operating on the liberalised market. Customers not eligible for the enhanced protection regime and who, even temporarily, find themselves without an electricity sales/purchase contract in the free market have access to the safeguard regime.
Since 1 May 2008, the service has been provided by retailers selected through auctions. For the period 1 January 2010‐31 December 2010 (with 3 operators providing the supplier of last resort service in 12 geographical areas) these were:
Exergia, for the following areas: Piedmont–Val’Aosta–Liguria; Trentino–Alto‐Adige; Veneto–Friuli‐Venezia‐Giulia; and Emilia Romagna;
Enel Energia, for Sardinia; Campania; Umbria–Marche; Basilicata–Calabria; and Sicily.
Hera Comm, for Tuscany; Lombardy; Lazio–Abruzzo; and Molise–Puglia.
The suppliers of last resort for thermal year 2010‐11 were selected in accordance with the provisions of Law 99/2009. The Ministry for Economic Development’s Decree of 6 August 2010 established that, for thermal year 2010‐11, the Single Buyer would select these suppliers through competitive bidding procedures established by the Authority.
With Resolution ARG/gas 131/10 of 9 August 2010, the Authority therefore defined the criteria for the selection of the suppliers of last resort. After publishing the Regulations for competitive bidding procedures on its website, the Single Buyer selected the operators and published the outcome of the selection procedure for natural gas suppliers of last resort for thermal year 2010‐11 on its website (Table 6.1).

6. Public service issues and consumer protection 31/07/2011
The Italian Regulatory Authority for Electricity and Gas (AEEG) Page 101 of 106
Table 6.1 Suppliers of last resort: ranking
Supplier obligations, supply terms and consumer protection
Regulation of supply terms and obligations designed to guarantee consumer protection in both the electricity and gas markets has been designed by the Authority and in force since December 2007 (see Annual Reports for 2008, 2009 and 2010). Such regulation largely reflects the Authority’s jurisdiction over customer protection as envisaged by its founding law (Law 481/1995), which in many ways goes beyond the requirements of the European Directives of 2003. This system, which includes common rules for the electricity and gas sectors, is described in some detail in the Annual Report 2010 and in previous Annual Reports and can be summarised in rules regarding:
billing transparency (contracts and supply, invoicing, consumption, charges, and payments);
minimum mandatory contractual terms and conditions of supply (meter‐reading, calculation of consumption, billing frequency, terms and method of payment, late payments and defaults, disconnections, payment by instalment, and handling of complaints);
Commercial Codes of Conduct for supply to consumers (specific conduct requirements, starting with information obligations, in contacts with, and then in drawing up contracts with, prospective customers). These also envisage the use of a price comparison table to make it easier for both residential and non‐residential consumers to compare the offers presented, the aim being to reduce non‐transparent behaviour by suppliers;
procedures for filing complaints;
protection in cases of late payments and payment by instalments;
web‐based price comparison tools;
the Energy Consumers’ Help‐Desk (Sportello per il consumatore di energia elettrica e gas);
compulsory uniform nationwide standards covering commercial quality of service, security and continuity of supply for all distributors, with provisions for automatic compensations, paid through the billing system, in the event of non‐compliance with standards by distributors;
quality standards for telephone sales services.
Commercial quality levels have seen a gradual improvement since the introduction of regulation by the Authority. Evidence of this lies in the fact that after years of constant increases, the number of automatic compensations to consumers for failure to comply with commercial standards has
MACRO‐AREA NUMBER OPERATORS
AREA North‐East:
Valle d’Aosta, Piedmont and Liguria 2
Enel Energia
Eni – Gas & Power Division
AREA North‐West
Lombardy, Trentino Alto Adige, Friuli Venezia Giulia,
Veneto ed Emilia Romagna
2 Enel Energia
Eni – Gas & Power Division
AREA Central:
Tuscany, Umbria and Marche 2
Enel Energia
Eni – Gas & Power Division
AREA Centre‐South, South
Abruzzo, Molise, Puglia, Basilicata, Lazio, Campania,
Calabria and Sicily
2
Enel Energia
Eni – Gas & Power Division
6. Public service issues and consumer protection 31/07/2011
The Italian Regulatory Authority for Electricity and Gas (AEEG) Page 102 of 106
fallen drastically in both the electricity and gas sectors. More specifically: from the peak of 79,072 in 2003 to 13,005 in 2010 for electricity, and from the peak of 43,886 in 2007 to 19,468 in 2010 in the natural gas sector.
As regards consumer protection and public service obligations, 2010 saw the completion of the Integrated Commercial Code of Conduct for the two sectors. This extends price‐comparison tools to the gas sector and to dual‐fuel offerings, a form of contract that is becoming increasingly widespread in the free market.
Another measure aiming to harmonise the rulings of the two sectors was the entry into force of the directive approved in 2010 for the harmonisation and transparency of billing documents for the consumption of electricity and gas distributed over urban networks. With the new directive, bills have been made even more transparent and easier still to understand. The new billing template has been standardised for both electricity and gas, and for duel fuel, thus making it easier for consumers to compare electricity and gas bills.
Important changes were made to the rules governing payment by instalments in the natural gas sector in 2010.
The Sportello per il consumatore di energia elettrica e gas (Help‐Desk for Electricity and Gas Consumers), which began operating in 2009, is run by the Single Buyer under rules drawn up by the Authority. It provides consumers in the liberalised markets with timely responses to written complaints and other communications. With its dedicated call centre, the Help‐Desk also aims to give consumers access to any information on the liberalised energy markets that might increase their awareness of their rights and help them make an informed choice of energy supplier. The effectiveness of the energy consumers’ Helpdesk is confirmed by:
the data on the volume of information requests received: from 417,000 calls from April 2009 to March 2010 to 740,131 from April 2010 to March 2011;
the distribution of peak information requests, which coincided with the information campaigns for the electricity and gas bonuses;
the excellent results achieved in 2010 by the Help‐Desk call centre for energy consumers. These included: service accessibility of 99.6%, compared with a required standard of 90%; average waiting time of 91’’ (required standard 240”); service level of 90.9% (required standard 80%);
the results achieved in meeting the customer satisfaction goals promoted by the Ministry for Public Innovation (good service, 84%; adequate service, 13%; unsatisfactory service, 3%).
2010 also saw increased user uptake of the information services available on the Authority’s website. Most notably, a growing number of visits to Trova‐offerte (Offer Finder, an interactive online service for consumers that has been operating for electricity customers since April 2009 and for gas and dual‐fuel customers since April 2010) was recorded. Trova offerte allows users to compare the offers available on the market and grasp any advantages to be gained from changing their supply contract.
To provide increasingly complete and transparent information, the Authority continued in 2010 to up‐date the Atlante dei diritti del consumatore di energia elettrica e gas (“Atlas” for Electricity and Gas Consumers’ Rignts), which is also available online.
6. Public service issues and consumer protection 31/07/2011
The Italian Regulatory Authority for Electricity and Gas (AEEG) Page 103 of 106
Finally, to improve the quality of operators’ responses to consumers’ complaints, the Authority published a consultation document in 2010 regarding the publication of comparative data on the effectiveness and efficiency of those responses.
Treatment of vulnerable consumers
With the Interministerial Decree of 28 December 2007, published in the Official Journal of the Italian Republic (Gazzetta Ufficiale) on 18 February 2008, the Government defined the legislative framework for the introduction of protection mechanisms for economically disadvantaged and vulnerable residential customers.
These provisions were further supplemented by Decree Law no. 185 of 29 November 2008, which extended the rebate mechanism to the gas sector and introduced a different access threshold for households with more than three children. Under the current legislative framework, therefore, the special provisions for vulnerable customers refers to the following categories of residential customers:
members of households with an Indicator of Equivalent Economic Status (ISEE)19 no higher than €7,500 ;
members of households with more than 3 children and ISEE no higher than €20,000;
households that include a seriously ill person who needs to use electrically powered life‐saving equipment, without limitations of domicile or contractual demand.
For the electricity sector, starting on 1 January 2009 and back‐dated to 1 January 2008, a protection mechanism (“social bonus”) specifically designed for economically disadvantage residential customers or those with serious health conditions has been active. This mechanism was previously included implicitly in the D2 and D3 tariff structure applied on an obligatory basis to all residential customers. The Authority adjusts the value of the rebate each year, at the same time as the December tariff adjustment.
At 30 March 2011, over 2 million applications for the “social bonus” had been submitted and, having passed all the checks carried out by municipal authorities and electricity distributors, been judged eligible to receive the bonus. More than 1.5 million households actually used the bonus. According to the estimates carried out in the early months of 2011, the rebates paid in 2008, 2009 and 2010 amounted to about 233 million euros. The cost of delivering the electricity rebates is included in general system costs.
For the gas sector, and with effect from 1 January 2009, Decree 185/08 has extended the right to rebates on their natural gas expenditure to economically disadvantaged households already entitled to protected tariffs for their electricity supply. Decree 185/08 also entrusted the Authority with the task of quantifying the rebates and defining the arrangements for applying them.
As part of the gas distribution tariff reform for the new regulatory period beginning on 1 January 2009, the Authority had revoked the previous social protection mechanisms (see Annual Report 2009). With Resolution ARG/gas 88/09 of 6 July 2009, the Authority defined the arrangements for the rebate mechanism for natural gas customers.
19 The Indicator of Equivalent Economic Status (ISEE) was conceived at central government level as a concise and reliable means of measuring citizens’ standard of living. It makes it possible to select the platform of social welfare beneficiaries using uniform criteria and parameters. More precisely, the ISEE is a linear combination of income (including from financial assets) and household assets (of which 20% is considered). It is used as a unit of reference to evaluate the resources of the household rather than the individual. For this reason, the value of the ISEE is expressed in euro‐equivalents: it is divided by a coefficient of equivalence that takes into account the size and composition of the household receiving the social welfare benefit under consideration.
6. Public service issues and consumer protection 31/07/2011
The Italian Regulatory Authority for Electricity and Gas (AEEG) Page 104 of 106
The system, which has been active since December 2009, was back‐dated to 1 January 2009. At 15 March 2011, over 700,000 “social bonus” applications had been submitted to the municipal authorities. The total amount paid out in 2009 and 2010 is an estimated 75 million euros. The amount of compensation for 2011 was defined at the time of the December 2010 tariff adjustment.
Disconnection of defaulting customers
The contractual conditions for retail supply defined by the Authority also regulate disconnections following defaults in the payment of bills. Distributors may proceed with disconnections only after sending a written notice to defaulting customers referring to: the final date for payment; the procedure for notifying that the payment has been made; and the date after which disconnection will be made in the absence of payment. Disconnections are not allowed when electricity is required to power medical devices; on Fridays and weekends; or on holidays or the day preceding a holiday.
The Authority does not monitor the number of disconnections related to payment defaults, but rather the number of requests for reactivation of service following such disconnections.
Between 2009 and 2010, in the electricity sector requests for reactivation of service increased from 1,236,841 to 1,290,738 (low‐voltage customers), and in the natural gas sector from 78,343 to 95,033, (low‐pressure customers)20. The number of reactivation requests following disconnections for payment default in the electricity sector has grown in recent years (from 310,540 in 2004), even following the introduction of remotely operated smart meters. Using these, as an alternative to outright disconnection suppliers can drastically reduce the power supplied to a “minimum vital level” (around 0.5 kW). This practice, which is recommended by the Authority in the interests of increased consumer protection, minimises the damage caused to customers while the default is pending.
Tariff regulation
Tariff regulation is primarily intended for infrastructure activities performed over networks and implemented through a price cap mechanism as set by the Authority’s founding law (Law 481/95). It reflects the regulator’s efficiency goals over a four‐year regulatory period.
In the electricity sector, the Authority set the transmission, distribution and metering tariffs for the third regulatory period (2008‐11) in December 2007. For natural gas, the tariff regulation criteria for the third regulatory period were defined in 2008 for the distribution, metering and regasification services; in 2009 for the transport service; and in 2010 for storage.
For the new regulatory period for transport (2010‐13) and storage (2011‐14), the price cap has been differentiated by company.
20 In the natural gas sector the number of residential customers is about half that of the electricity sector (about 28 million). However, the significant gap in the number of disconnections can be explained primarily by technical and security reasons which lead operators to disconnect supply only in extreme cases.
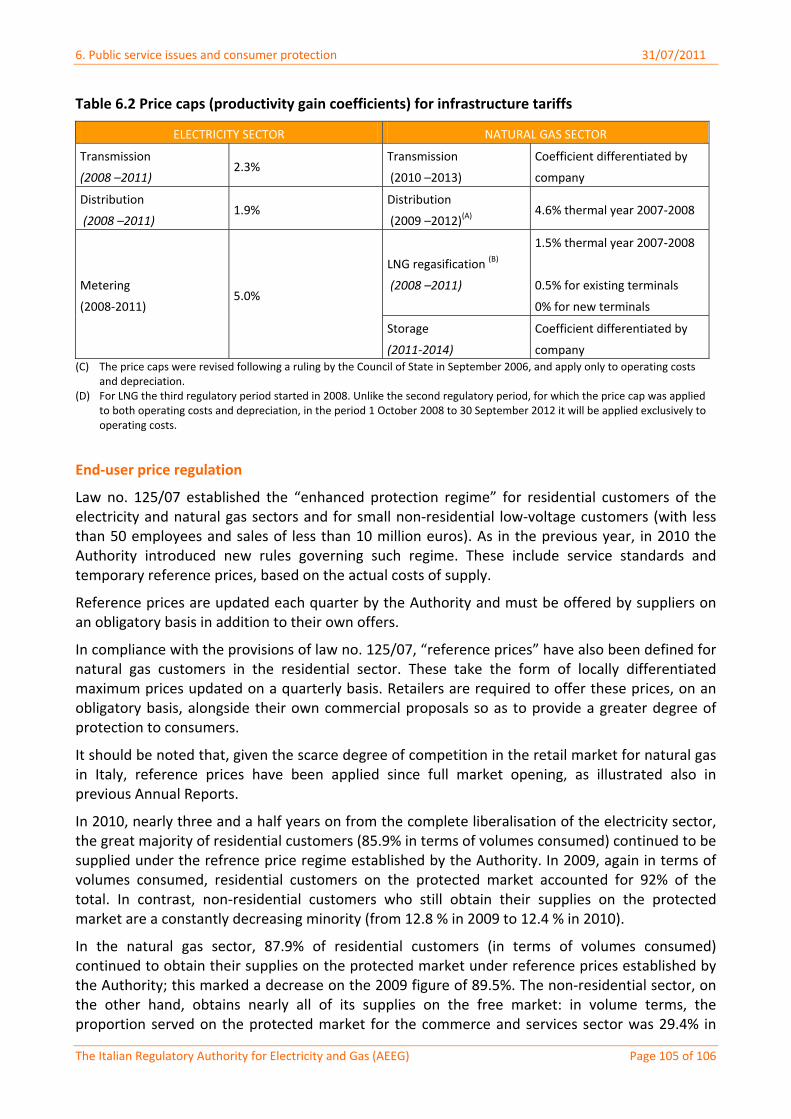
6. Public service issues and consumer protection 31/07/2011
The Italian Regulatory Authority for Electricity and Gas (AEEG) Page 105 of 106
Table 6.2 Price caps (productivity gain coefficients) for infrastructure tariffs
ELECTRICITY SECTOR NATURAL GAS SECTOR
Transmission
(2008 –2011) 2.3%
Transmission
(2010 –2013)
Coefficient differentiated by
company
Distribution
(2008 –2011) 1.9%
Distribution
(2009 –2012)(A) 4.6% thermal year 2007‐2008
LNG regasification (B)
(2008 –2011)
1.5% thermal year 2007‐2008
0.5% for existing terminals
0% for new terminals
Metering
(2008‐2011) 5.0%
Storage
(2011‐2014)
Coefficient differentiated by
company (C) The price caps were revised following a ruling by the Council of State in September 2006, and apply only to operating costs
and depreciation. (D) For LNG the third regulatory period started in 2008. Unlike the second regulatory period, for which the price cap was applied
to both operating costs and depreciation, in the period 1 October 2008 to 30 September 2012 it will be applied exclusively to operating costs.
End‐user price regulation
Law no. 125/07 established the “enhanced protection regime” for residential customers of the electricity and natural gas sectors and for small non‐residential low‐voltage customers (with less than 50 employees and sales of less than 10 million euros). As in the previous year, in 2010 the Authority introduced new rules governing such regime. These include service standards and temporary reference prices, based on the actual costs of supply.
Reference prices are updated each quarter by the Authority and must be offered by suppliers on an obligatory basis in addition to their own offers.
In compliance with the provisions of law no. 125/07, “reference prices” have also been defined for natural gas customers in the residential sector. These take the form of locally differentiated maximum prices updated on a quarterly basis. Retailers are required to offer these prices, on an obligatory basis, alongside their own commercial proposals so as to provide a greater degree of protection to consumers.
It should be noted that, given the scarce degree of competition in the retail market for natural gas in Italy, reference prices have been applied since full market opening, as illustrated also in previous Annual Reports.
In 2010, nearly three and a half years on from the complete liberalisation of the electricity sector, the great majority of residential customers (85.9% in terms of volumes consumed) continued to be supplied under the refrence price regime established by the Authority. In 2009, again in terms of volumes consumed, residential customers on the protected market accounted for 92% of the total. In contrast, non‐residential customers who still obtain their supplies on the protected market are a constantly decreasing minority (from 12.8 % in 2009 to 12.4 % in 2010).
In the natural gas sector, 87.9% of residential customers (in terms of volumes consumed) continued to obtain their supplies on the protected market under reference prices established by the Authority; this marked a decrease on the 2009 figure of 89.5%. The non‐residential sector, on the other hand, obtains nearly all of its supplies on the free market: in volume terms, the proportion served on the protected market for the commerce and services sector was 29.4% in
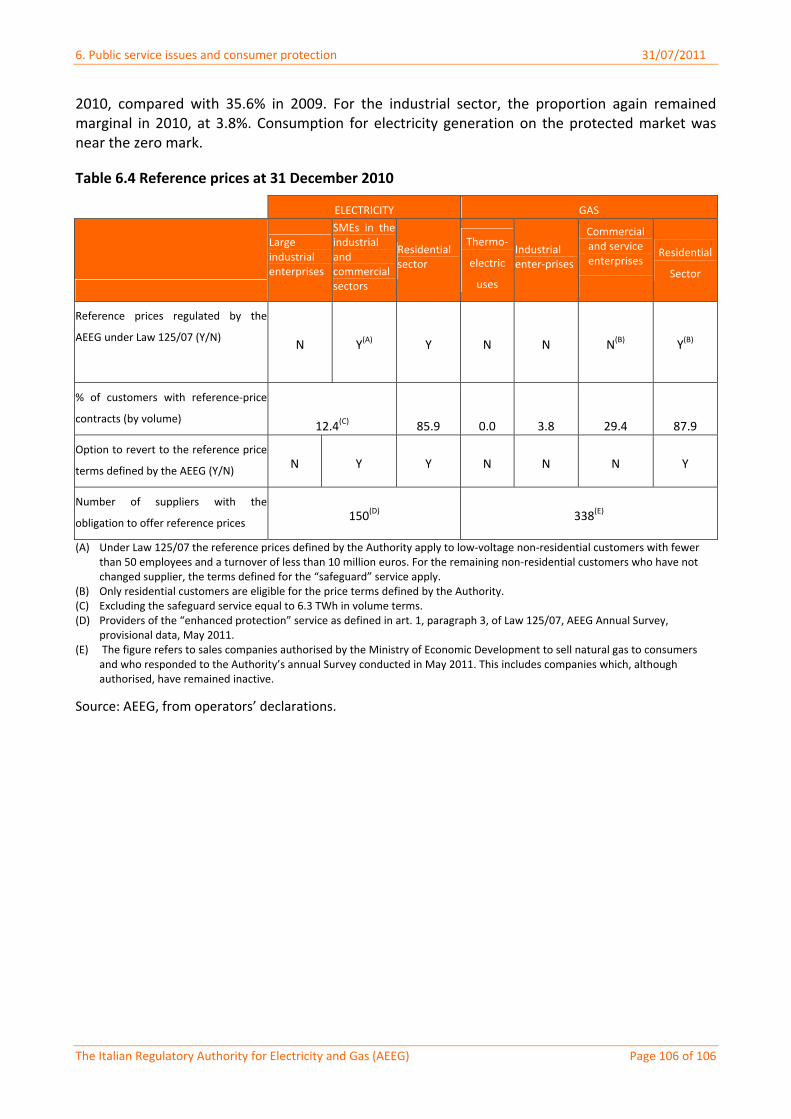
6. Public service issues and consumer protection 31/07/2011
The Italian Regulatory Authority for Electricity and Gas (AEEG) Page 106 of 106
2010, compared with 35.6% in 2009. For the industrial sector, the proportion again remained marginal in 2010, at 3.8%. Consumption for electricity generation on the protected market was near the zero mark.
Table 6.4 Reference prices at 31 December 2010
ELECTRICITY GAS
Large industrial enterprises
SMEs in the industrial and commercial sectors
Residential sector
Thermo‐
electric
uses
Industrial enter‐prises
Commercial and service enterprises
Residential
Sector
Reference prices regulated by the
AEEG under Law 125/07 (Y/N)
N Y(A) Y N N N(B) Y(B)
% of customers with reference‐price
contracts (by volume) 12.4(C) 85.9 0.0
3.8 29.4 87.9
Option to revert to the reference price
terms defined by the AEEG (Y/N) N Y Y N N N Y
Number of suppliers with the
obligation to offer reference prices 150(D) 338(E)
(A) Under Law 125/07 the reference prices defined by the Authority apply to low‐voltage non‐residential customers with fewer than 50 employees and a turnover of less than 10 million euros. For the remaining non‐residential customers who have not changed supplier, the terms defined for the “safeguard” service apply.
(B) Only residential customers are eligible for the price terms defined by the Authority. (C) Excluding the safeguard service equal to 6.3 TWh in volume terms. (D) Providers of the “enhanced protection” service as defined in art. 1, paragraph 3, of Law 125/07, AEEG Annual Survey,
provisional data, May 2011. (E) The figure refers to sales companies authorised by the Ministry of Economic Development to sell natural gas to consumers
and who responded to the Authority’s annual Survey conducted in May 2011. This includes companies which, although authorised, have remained inactive.
Source: AEEG, from operators’ declarations.