Embed Size (px)
Citation preview

Autonomous Generation of Soundscapes usingUnstructured Sound Databases
Nathaniel Finney
MASTER THESIS UPF / 2009Master in Sound and Music Computing
Master thesis supervisor:
Jordi JanerDepartment of Information and Communication Technologies
Universitat Pompeu Fabra, Barcelona

ii
.
Abstract
This research focuses on the generation of soundscapes using unstructured sounddatabases for the sonification of virtual environments. A generalized methodologyfor design based on soundscape categorization, perceptual discrimination of sourcesand media design principles is proposed, with the underlying principle of the compo-sition of a source and a textural layer within any soundscape. A generative model isproposed based on these principles covering sound object retrieval, segmentation, pa-rameterization and resynthesis. The model incorporates wavelet resynthesis, sampleplayback and a technique for concatenative synthesis using an MFCC-based BICsegmentation method. Principles for optimal grain size selection with respect tosource layer content are discussed, and the concatenation of segments is based on arelative MFCC Euclidean distance calculation.
An implementation of the model using a photorealistic panoramic image in an ur-ban context is described, using a sound database of community-provided recordings.The implementation utilizes sample playback and concatenative synthesis in orderto maximally preserve the contextual attributes of the photorealistic environment,while wavelet resynthesis is discussed as a potential avenue for further development.The methods of classification, segmentation and synthesis adhering to the particularapplication are discussed, along with a validation of the model using a subjectiveevaluation. The results of the study demonstrate the applicability of the design prin-ciples to an autonomous generation engine, while highlighting some of the challengesof implementation for autonomous functionality related to retrieval, segmentationand synthesis parameterization.

iii
.
Acknowledgments
I would like to sincerely thank my supervisor Jordi Janer for his contributionsto this research, including ideas, discussions and technical input. Also, my fellowmembers of the MTG Metaverse project deserve special appreciation for their efforts:Stefan Kersten for contribution of knowledge of the field and enough literature tofill a library, as well as lessons in Supercollider, and Gerard Roma for invaluableassistance with programming audio in Actionscript, while responding very kindlyto my naive programming-related questions, and setting up servers to work aroundendless security policy file problems.
I also give a large token of appreciation to Xavier Serra for guidance since thebeginning of the Master’s program in interpreting my entangled interests towardresearch work that was somehow very in tune with all of them, and in the end anextremely rewarding experience. Furthermore to Emilia Gomez for her coordina-tion efforts of the program, and always showing a genuine interest in the students’progress and contentedness.
I also extend a sincere thanks to Hendrik Purwins for contribution of ideas,stimulating discussions that never ceased to be interesting, and sense of humor inthe students’ heaviest times of stress.
And to the fellow students I have had the privilege to have as colleagues this year,I give my deepest gratitude for sharing this experience and giving your sometimesbrutally honest opinions of my ideas and beliefs for research in SMC. It has been anabsolute pleasure to work alongside you all, and I look forward to continued workand/or socializing with you in the future.
I would like to personally thank my flatmates over this past year, the membersof the Rock Fort : Leonardo “The Tortilla Sensei” Aldrey, Saso “Hide Your TerassePlantholders!” Musevic, Sabine “Chippie” Mehlin, Olivier “Tac Tac” Lalonde,Katalin “Makes Me Look Good in Pictures” Karolyi and Robin “Texan Turf Battle”Motheral for your friendship, great meals and general support.
And last but far from least, to my family and friends abroad, thank you forcontinuing to lend me your support and guidance with only the best of intentions.

iv

Contents
1 Introduction 1
2 Soundscape Description and Perception 32.1 Soundscape Classification . . . . . . . . . . . . . . . . . . . . . . . . 32.2 The Sound Scene in Media . . . . . . . . . . . . . . . . . . . . . . . . 42.3 The Sense of Presence . . . . . . . . . . . . . . . . . . . . . . . . . . 5
3 Design and Generation 93.1 Design Methodology . . . . . . . . . . . . . . . . . . . . . . . . . . . 93.2 Sound Object Retrieval . . . . . . . . . . . . . . . . . . . . . . . . . . 113.3 Generation . . . . . . . . . . . . . . . . . . . . . . . . . . . . . . . . . 12
4 Implementation 154.1 Taxonomy . . . . . . . . . . . . . . . . . . . . . . . . . . . . . . . . . 154.2 Generation . . . . . . . . . . . . . . . . . . . . . . . . . . . . . . . . . 164.3 System Architecture . . . . . . . . . . . . . . . . . . . . . . . . . . . 174.4 Evaluation . . . . . . . . . . . . . . . . . . . . . . . . . . . . . . . . . 20
5 Discussion and Conclusions 27
A R. Murray Schafer’s Taxonomy 29
B Evaluation Results 31
v

vi CONTENTS
Chapter 1
Introduction
The focus of this study is on the application of unstructured sound databases to theautonomous design and generation of soundscapes for virtual environments. Thefollowing chapters discuss aspects related to soundscape and sound source classi-fication, sound scene design for media, the perceptual sense of presence in sonicenvironments, and an implementation of a soundscape generator using unstructuredaudio databases. An autonomous generation model may be separated into threemajor portions: retrieval, design and generation. The following work focuses pri-marily on the design and generation aspects, while implementation of autonomousretrieval is reserved as an avenue for future work.
The design of sonic environments requires a fundamental classification strat-egy for both soundscapes and sound sources. The classification of soundscapes ismost widely performed using R. Murray Schafer’s referential taxonomy, which in-corporates socio-cultural attributes and ecological acoustics [14]. Many models foranalyzing and generating soundscapes use Schafer’s breakdown of the componentsof the soundscape into keynote and signal layers as a foundation for their model-ing of the soundscape [4], [21]. In addition to a referential classification, a soundsource is often classified according to its physical characteristics, such as in the workof William Gaver where he developed a taxonomy according to the interaction ofmaterials [10]. The use of such a taxonomy is pinnacle in developing methods formodeling and synthesizing sound objects according to physical attributes, and is agroundwork for many studies in ecological acoustics and physical modeling synthe-sis [13]. The variability of physical attributes for resynthesizing sound objects is agrowing field of research for improving the interactivity aspect in VE’s [7]. Thisstudy however focuses on the textural and passive elements of the soundscape towhich interactive sonic elements may be added.
In the work of Birchfield et. al., the generation of the soundscape is based ona probabilistic selection of audio tracks separated according the Schafer concept ofkeynote sounds and signal sounds, where the material has been retrieved prior togeneration with a lexical search using WordNet [8]. Birchfield et. al. incorporatesdynamically changing probabilities in response to user behavior for triggering audiotracks, which results in an evolving sound environment that they propose reflectsthe sonic diversity of the equivalent natural environment [4]. Probabilistic modelsfor soundscape generation are a demonstration of the notion that a generated sound-
1

2 CHAPTER 1. INTRODUCTION
scape is greatly enhanced by variety and evolution, for which research has shown tobe a contributing factor to the sense of presence in VE’s [16], [20].
With the use of unstructured databases as the audio input to the soundscapegenerator, such a model may be considered both a framework for community in-teraction and an ecological acoustics preservational tool, while taking advantage ofthe growing databases of sonic material such as The Freesound Project [1]. An au-tonomous soundscape generation model that can incorporate the past and currentresearch in soundscape design and composition would be a tool that would allow forthe usage of the increasing audio resources that are at the community’s disposal,and for the improvement of immersive qualities within VE’s.
Chapter 2
Soundscape Description andPerception
This section describes the most accepted theories and techniques of soundscapeclassification and design. The design of sonic virtual environments (VE’s) utilizesmany sound design concepts from film and video games as well as some more recentconcepts that have emerged along with the establishment of virtual reality andenvironments on the internet for social collaboration and networking. Many ofthe concepts related to immersion in film and video games and the role of thesonic environment are applicable for optimizing immersion in interactive virtualenvironments, while many aspects unique to the nature of VE’s pose new challengesto sound design theories and technologies.
2.1 Soundscape Classification
2.1.1 Schafer’s Taxonomy
R. Murray Schafer distinguishes three main themes of a soundscape: keynote sounds,signals and soundmarks [14]. The keynote is analogous to the musical notion of keywhich is the tonal reference point, or anchor of a composition. Schafer comparesthe concept of keynote sounds in soundscapes to the visual perception of figure andground, where the figure is the subject of attention and the ground is the surround-ing context which gives the figure its shape and mass. Without the ground, thefigure becomes shapeless and nonexistent [14]. Signals are sounds in the foregroundthat draw the listener’s atttention, and can thus be thought of as the figure inthe visual perception analogy. Since theoretically any sound can become a signalsound if the listener decides to pay attention to it, Schafer further defines the signalsound as those sounds that force attention from the listener, such as bells, hornsand whistles. Soundmarks are those sounds that are particularly noticeable for adistinct community, deriving from the term landmark.
Schafer’s breakdown of the main themes of the soundscape serves as a good start-ing point for defining and classifying a soundscape. He gives examples of how thesethemes have changed throughout history, taking examples from rural life and cities,the onset of industrialization and electricity, and how these factors may have caused
3

4 CHAPTER 2. SOUNDSCAPE DESCRIPTION AND PERCEPTION
drastic changes to the sonic environment in which man has lived. These conceptsmay be of interest in VE’s where environmental preservation is a consideration.
2.1.2 Physical Characteristics
Classification of sounds based on physical characteristics such as material and typeof interaction provides a framework for categorizing sound objects, which can beutilized for sonification purposes. In Gaver’s taxonomy [10] a hierarchy of mate-rials and their sonic interactions are described, which provides a groundwork fororganizing databases of sounds and segmented audio events.
Another classification scheme for individual sound sources based on the physicalcharacteristics was proposed by Pierre Shaeffer, and further elaborated upon by R.Murray Schafer, which categorizes a signal using the quantities attack, body anddecay in a tabular format against the quantities duration, mass, grain and dynamics[14]. This method is more generalized than Gaver’s taxonomy, and more related tothe temporal audio content rather than the physical content.
A method of classification of sound objects which combines the two taxonomiescould be very interesting for categorization and retrieval of segmented sound objects.The development of such a scheme is discussed as an avenue for future work in section5.
2.1.3 Referential Characteristics
In soundscape generation it is very useful to employ a referential classification ofsound sources, such as that described by R. Murray Schafer, which groups objectsbased on their context rather than content or physical characteristics. Schafer di-vides the sources within soundscapes into six referential categories listed as follows:
1. Natural Sounds2. Human Sounds3. Sounds and Society4. Mechanical Sounds5. Quiet and Silence6. Sounds as Indicators
These categories are further subdivided into smaller groups such as churches andfireworks. The entire list is given in Appendix A.
2.2 The Sound Scene in Media
2.2.1 Diegesis
In sound design for film, the sound scene can be divided into two main portions:diegetic and non-diegetic. Diegetic refers to any sound source that can be resolved toa component of the environment, such as foley effects, ambient sounds such as windand traffic, and any music played by a device or person within the environment. Non-diegetic is any sound source that is not within the environment such as a narrator,

2.3. THE SENSE OF PRESENCE 5
ambience effects not heard by the characters in a story, or music not linked to asource in the environment [5].
Sonnenschein describes the use of non-diegetic sounds in cinema as guidingthe listener toward a feeling, subjectively beyond the visual elements giving theexamples of a wolf howl piercing a downtown redlight district and an exaggeratedticking clock over an office worker under the pressure of a deadline [19]. It is evi-dent that these types of cinematic effects can have a dramatic effect on a cinematicstoryline, and the use of such effects in a VE can be assumed to have an equallydramatic effect if suitably applied in a given context.
For the purposes of this study, the soundscape can be assumed to only be com-posed of diegetic sounds, and a further implementation regarding the enhancementof the scene can include a layer with sonic additions such as musical accompanimentand additional effects. This constraint implies that all sounds generated in the vir-tual soundscape must contain a direct relationship to a source either visible by theuser or based upon a logical assumption of its source within the environment.
2.2.2 Synchrony
Sound events are furthermore labeled as either synchronous or non-synchronous [5],meaning that their sonic behavior is related to the visual aspects of particular ob-jects within the VE. Some examples of synchrony are spatial position relative tothe user, contacts between objects, speech and animal noises, and acoustical effectsrelated to the interaction of the environment and sound sources.
2.2.3 On-Screen and Off-Screen
In cinema the sounds that are related to sources within the frame are termed as on-screen, while those that are not within the frame are called off-screen [19]. Off-screensounds are further divided into the categories active and passive. Active sounds arethose that invoke attention from the subject, and can be considered analogous toSchafer’s classification term signals. This distinction is highly influential on thesound design of the scene, as they shape the attention and focus of the subject.However, it is intuitive that the distinction is not discrete, since some sounds mayaffect the attention of the listener more than others. This level of attractiveness candepend on many properties such as volume, spectral content, termporal fluctuation,and the adhesion with the context.
2.3 The Sense of Presence
This section describes the elements that affect the sense of presence in VE’s. Thesense of presence is defined as the feeling of being situated in an environment despitebeing physically situated in another [17]. In quantifying and/or qualifying the senseof presence, or the similar term immersion, different authors have proposed andevaluated various components that make up this highly subjective sense [17], [20],[16].
6 CHAPTER 2. SOUNDSCAPE DESCRIPTION AND PERCEPTION
In order to experience some degree of presence in a VE, the psychological statesinvolvement and immersion are necessary precursors. Involvement is defined asthe focus on a coherent set of stimuli, and immersion is the actual perception ofenvelopment in an environment [17].
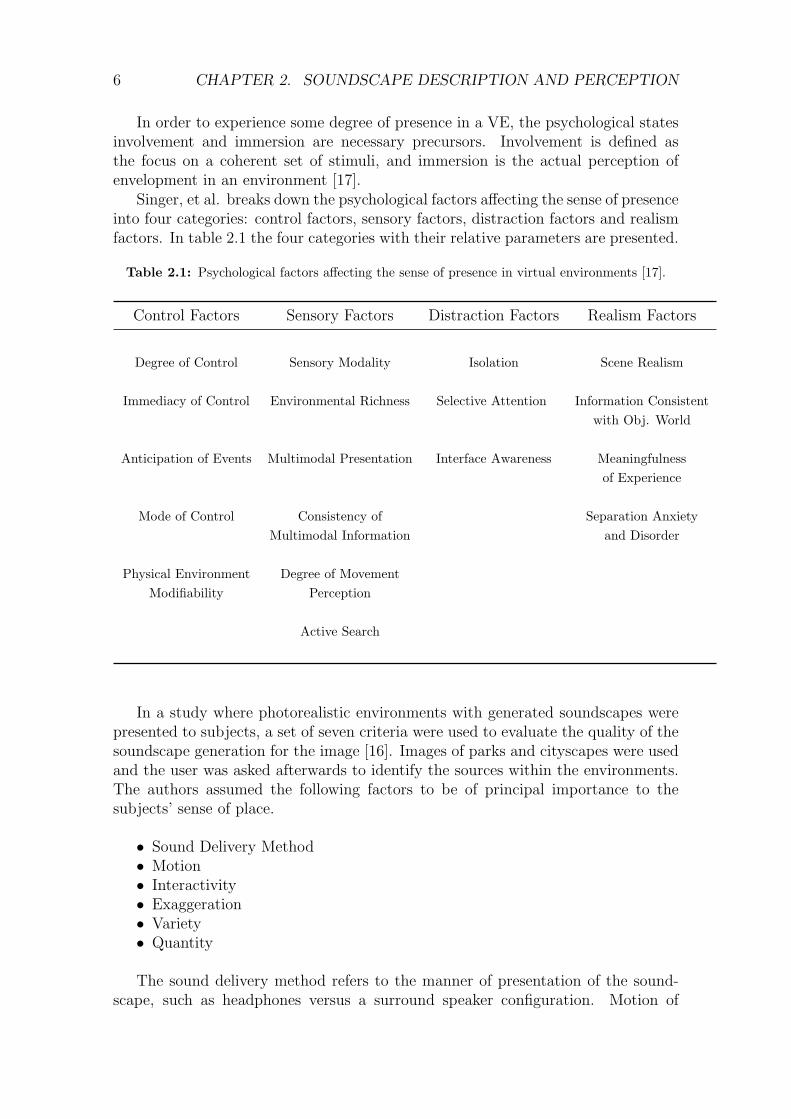
Singer, et al. breaks down the psychological factors affecting the sense of presenceinto four categories: control factors, sensory factors, distraction factors and realismfactors. In table 2.1 the four categories with their relative parameters are presented.
Table 2.1: Psychological factors affecting the sense of presence in virtual environments [17].
Control Factors Sensory Factors Distraction Factors Realism Factors
Degree of Control Sensory Modality Isolation Scene Realism
Immediacy of Control Environmental Richness Selective Attention Information Consistentwith Obj. World
Anticipation of Events Multimodal Presentation Interface Awareness Meaningfulnessof Experience
Mode of Control Consistency of Separation AnxietyMultimodal Information and Disorder
Physical Environment Degree of MovementModifiability Perception
Active Search
In a study where photorealistic environments with generated soundscapes werepresented to subjects, a set of seven criteria were used to evaluate the quality of thesoundscape generation for the image [16]. Images of parks and cityscapes were usedand the user was asked afterwards to identify the sources within the environments.The authors assumed the following factors to be of principal importance to thesubjects’ sense of place.
• Sound Delivery Method• Motion• Interactivity• Exaggeration• Variety• Quantity
The sound delivery method refers to the manner of presentation of the sound-scape, such as headphones versus a surround speaker configuration. Motion of
2.3. THE SENSE OF PRESENCE 7
sources within the environment are propsed by the authors to add to the dynamismof the soundscape, and thereby induce more interest in the user to the environment.Interactivity in this particular study refers to the use of physical models to alterthe nature of the sound samples according the position of the user relative to thesource, where an example may be footsteps on different materials. The processingof audio content to fit the context is very related to the parameters scene realism,consistency of multimodal information and information consistent with the observedworld, as shown in table 2.1.
Exaggeration is a quality that refers to the use of sound effects to enhance thenatural character of sound sources for a purpose, such as is used often in cinemaand video games. This concept is counteractive to the concepts described above re-lated to realism and consistency, and exposes the compromise between soundscapedesign and realism. While added elements which may enhance the perceptual re-sponse or encourage a certain emotional response may contribute to the immersivequalities of a soundscape, in some applications they may have a distracting effect,which detracts from the cogency of the environment. Therefore it is evident thata soundscape design application requires an initial decision regarding whether theprimary intention is realism or emotional response.
Variety is thought to be of critical importance to the perceptual believability ofthe soundscape, and refers to the change and evolution of the soundscape over time,or in other words, the absence of the recognition of looping sounds. A limitation ofthe use of the samples for playback is that the user may perceive loops within thesoundscape, which may highly reduce the sense of presence in the environment.
Quality refers to the density of sources within the soundscape, and is discussedby the authors in terms of the sources that capture the attention of the subject. Ifthe density of recognizable sources is too high, then the subject may have difficultyfocusing, while if it is too low, then the soundscape may cease to be engaging.

8 CHAPTER 2. SOUNDSCAPE DESCRIPTION AND PERCEPTION

Chapter 3
Design and Generation
Using the principles explained in the previous chapter, an outline for optimizingthe sense of presence in VE’s is described in this section for the application ofautonomous soundscape generation. The sound design elements and principles areapplied in relation to the factors affecting presence in VE’s and the most relevantmethods of audio synthesis for soundscape generation.
3.1 Design Methodology
The principles of sound design and soundscape characterization as described in theprevious chapter lead to the underlying hypothesis of the design methodology de-scribed in this section, that the treatment of the soundscape in terms of two layers,textures (background) and objects (foreground), establishes a framework for algo-rithmic design and interaction principles more suitable for information delivery andperceptual comfort than with a unified montage of sound sources.
The textural elements and object elements are segmented from sound files re-trieved from a database, and categorized into one of these two layers using theirsemantic identifiers, which are either extracted from tags or a recognition model.Objects are those sounds that are meant or expected to draw attention from the user,and may include indicators, soundmarks or informational content such as churchbells or non-diegetic sounds such as narration. Textural elements are determinedto be those sources that form the ambience such as birds and wind, and tend to bemore stochastic in nature while drawing minimal focus from the user.
Figure 3.1 shows the overview of the system functionality, where the two soundgroups, textures and objects are seen to be handled separately until the final mix-ing and spatialization. Solid arrows signify transfer of audio content, while dashedarrows are informational streams supplied to the various function blocks. The fol-lowing subsections contain short descriptions of each block while the finer details ofthe generation method are described in sections 3.2 and 3.3.
3.1.1 Input Content
The inputs to the system are in the middle of the diagram, signified by circles, anddivided into four categories: audio content, locality attributes, real-time conditions
9

10 CHAPTER 3. DESIGN AND GENERATION
Figure 3.1: Overview of the system functionality with given inputs (green circles), analysis blocks(diamonds), sound groups (rectangles) and processes (rectangles with soft corners).
and metadata.
Audio Content Audio content is retrieved from a database of user-provided audiorecordings, and contains all tag information and any accompanying descriptorinformation related to audio analyses on the server.
Locality Attributes Locality-related details include information such as spokenlanguage, common animal life, vehicle types, and both the density and types ofconstruction machinery. This information is predetermined and applied duringthe search within the database of sounds for use in the soundscape generation.
The soundmarks for the city are determined using a search based on a prede-fined list of potential soundmarks. This list includes items such as churches,stadiums and above-ground trains or trolleys. The signals for the city includelocality-specific police sirens and crosswalk signals, and are found through apreemptive search for city information.
Real-time conditions The generated soundscape is used to convey informationto the user regarding the real-time conditions of the locality such as traffic,weather (including seasonal information), and other current activity takingplace at that locality such as demonstrations or festivals.
Metadata Information ascertained from the community and user interaction mayprovide avenues for optimizing and enriching the soundscape generation. Thistopic will be discussed further in section 5 as an opportunity for extension tothe application.
3.1.2 Analysis
Content Analysis Analysis of the textural sounds is used to obtain spectral andtemporal attributes for use in the resynthesis process, and is performed using

3.2. SOUND OBJECT RETRIEVAL 11
basic audio analysis to extract the duration and level, and more involved tech-niques such as fourier analysis and wavelet analysis for use in the resynthesisprocess.
Textural Parameters The informational inputs provide a data set that is ana-lyzed to return a set of parameters for the textural resynthesis process, includ-ing factors related to the locality-specific attributes, conditions and metadata.These may include characteristics such as the density of people or animals andweather conditions.
Playback Strategy The informational inputs are merged to form an algorithmicplayback strategy for the sound objects, which may include such attributessuch as source motion, looping and multitude.
Post Analysis After resynthesis of the textural layer, spectral and temporal in-formation is extracted to ensure the fidelity of the stream and for use in themixing with the object layer.
3.1.3 Processes
Define & Segment The audio content from the sound database is segmented anddefined in terms of the referential taxonomy. The segmentation includes aseparation of transient, harmonic and stochastic sources. The content of eachsegment is decided using the tags associated with the original files and sourcerecognition.
Resynthesis The textural layer is synthesized using concatenative synthesis (mo-saicing), wavelet resynthesis and looped playback, with the synthesis param-eters provided by the Content Analysis and Textural Parameters analysisblocks.
Pre-playback Conditioning Before mixing with the textural layer, some basicconditioning such as enveloping and filtering are applied to the sound objectsto ensure clean playback and spectral separation of the objects.
Mix & Spatialize The sounds are mixed with respect to the playback strategyand textural parameters and spatialized based on the user orientation withinsoundscape.
3.2 Sound Object Retrieval
From the searches for soundmarks, signals and city information, a set of keywordsare obtained for retrieval of sounds from the unstructured database and organizedinto a sound object list. Using a lexical database search technique, sounds relatedto each of the items on the sound object list are retrieved for use in the soundscapegeneration.

12 CHAPTER 3. DESIGN AND GENERATION
3.3 Generation
The purposes of the design described in this section are to create a sense of im-mersion in the soundscape and to deliver relevant information to the user regardingthe environment and conditions. In order to optimize the system for these pur-poses, the aspects of scene realism, variety (ie. reduction of the perception of loops)and interactivity are given pinnacle importance in the playback strategy and audioprocessing.
Three forms of generation of sounds are used in this model: sample playback,wavelet resynthesis and concatenative synthesis. Using these different methods al-lows for optimal source separation and efficiency in processing the differing types ofsounds.
3.3.1 Sample Playback
After segmentation and definition, a bank of sound objects for playback is createdfrom which to construct the sound scene. For many sound types such as impulsiveevents and indicators, which tend to be of relatively short duration, it is mostefficient to trigger these sounds directly without analysis and resynthesis. Birchfieldet. al. constructed soundscapes using a playback and looping method in a generativesoundscape model that adapted to user actions and improved variability by applyingprobabilities to the sound events [4], using the principles of soundscape compositionas described by Barry Truax and R. Murray Schafer.
For interactivity-related sound events, such as impact sounds arising as a resultof movement or contact with objects in the scene, sample playback is a natural choicefor sound generation. However, the drawback in implementation, in game enginesfor example, is often the compromise between variety and the amount of memoryspace to store the samples. Techniques which resynthesize samples to accompanythe gestural or contact characteristics, such as modal synthesis, are very useful fortransforming the original sound with respect to variations in the interaction [22].For example, a transformation of the sound of the footsteps to match the groundmaterial would add to the realism aspect, and thereby increase the sense of presencein the environment [6].
Textural sources that have a repeating pattern may also be favored to incorporatea looping playback strategy, in order to reduce the complexity of the application.
3.3.2 Wavelet Analysis and Resynthesis
The analysis of textural sources that are highly stochastic and non-stationary arevery suitable for a wavelet decomposition approach [11]. Wavelet basis functions areselected and compared with the signal at different temporal translations with differ-ent scalings, to retrieve a set of decomposition coefficients representing the likenessof the signal to the basis functions in time. These coefficients may then be used toresynthesize the texture with time-variance and dynamic changes. Applying a pa-rameterization model depending on the sound type classification, the decompositioncoefficients may be used to alter the synthesis result to generate an altered versionof the original signal. For example, by varying the time and frequency parameters
3.3. GENERATION 13
of a rain signal decomposition, the output signal can be altered to simulate varyingheaviness of rainfall [12].
3.3.3 Concatenative Synthesis
Concatenative synthesis can be thought of as a content-based extension of granularsynthesis, where an audio stream is broken into units, which are selected based onlikeness to a target signal [15]. This synthesis method is highly suitable for handlingsound files from a database, which can be segmented. The size of the units areselected based on the type of source, and the playback of the units is performedusing the concatenative synthesis technique to produce a texture from a set of pre-recorded sounds. The grain size should be long enough so that the source of thesound is recognizable, yet short enough to prevent the perception of looping events.For example, the grain size for speech should be long enough to recognize full wordsin order for the language to be recognizable (ie. ∼ 1 second), but not long enoughfor entire sentences or phrases (ie. ∼ 3 seconds) to be discernible to prevent thathighly recognizable events are perceived to be repeating during playback. In thisway the grain size does not necessarily need to be held constant, and may containa window of variance in order to prevent periodicity in the artifacts that may arisedue to discontinuities between the grains.
In general the choice of grain size can highly affect the resulting texture, andfor most naturally recorded sounds a general selection of grain size for a category,such as birds or construction, requires some manual tuning in order to achieve thebest result. If a grain size is chosen that is too long in comparison with the event,then a repeating pattern may be perceived and the recognized during subsequentplayback. On the other hand, if a grain size is selected that is too short comparedwith the natural duration of the event, then the naturalness of the signal may becompromised.
As an example, in the case of a recording of construction activity where theremay be present both sounds of hammering and sawing, the optimal grain size forthe two events would not be equivalent. For the case of a saw, the onset, sustain anddecay portions of the event must be present and in the natural order of occurrence,and for hammering the repetition of patterns of more than a few strikes would berecognizable. In both of these cases, the likelihood of distraction for the listener ishigh, and therefore a variable grain size is necessary for such a recording.
Therefore, for an autonomous concatenative synthesis engine, a segmentationprocedure based on the temporal changes in the recording is recommended in order tocapture both long events and short events. For this engine, an MFCC-based bayesianinformation criterion (BIC) segmentation procedure is used to scan a recording foroptimal segmentation points [2]. Using an MFCC calculation takes into accountthe spectral properties of the signal and is based on the Mel-scale, which correlatesthe frequency spectrum of the signal with the perceptual attribute of timbre. Aminimum segmentation length is selected depending on the signal classification,based on Schafer’s taxonomy, and the grain sizes longer than that length are chosenaccording to the optimal segmentation points from the MFCC-BIC calculation. Theminimum grain sizes should be selected based on the logic as described above in
14 CHAPTER 3. DESIGN AND GENERATION
the example of speech, where the source should be recognizable for the minimumsegment length.
Each sound file before segmentation is pre-conditioned with low-pass and high-pass filtering and normalization. The cutoff frequencies for the filters are decidedby the frequency range of the sources within the categories. Normalization ensuresthat the initial amplitudes of the source categories are equivalent in order to easethe global mixing implementation. After segmentation, the segments’ boundaries arecross-faded and their selection during playback is decided according to a euclideandistance calculation with the other segments. Segments whose MFCC coefficients’are outside of the standard deviation are disregarded to remove any extraneoussegments from the concatenation.
In a given set of segments, the nearest segments among the set are determinedand each consecutive segment is selected randomly from this set1. The randomnessallows the selection to vary across the entire set, while the selected subset based onthe nearest MFCC’s ensures that large changes in relative spectral content do notresult. In general pre-segmented samples are recommended to be at least 20 timeslonger than the minimal grain size in order to obtain a sufficient number of samplesfor concatenation without the perception of loops. These concepts are further dis-cussed in section 5 and continued research in quantifying these requirements basedon subjective analyses is recommended.
1In implementation, it is recommended that this set be composed of the five nearest segmentsto allow for variation over long durations of exposure to the source. In deciding this number boththe number of segments retrieved from segmentation and the expected duration of exposure to theuser must be considered.

Chapter 4
Implementation
As an initial implementation of the autonomous soundscape generation model, astatic photorealistic environment was chosen in order to evaluate the use of recordedsounds from unstructured databases in an application that must be consistent withthe natural environment. The Google Street View application contains panoramicimages from discrete locations within a city, in which the user is free to rotate and cantranslate to different locations. The sound database used for feeding the soundscapegenerator was The Freesound Project [1], and as many samples as possible wereselected with origins in Barcelona and Spain for purposes of authenticity. For thepurposes of this study involving the Street View application, the sound objects areretrieved manually in order to focus on the automonous generation aspect, and theautomatic retrieval implementation is reserved as an avenue for future work.
Three locations were selected for simulation and the generated soundscapes werecompared with real recordings of the locations through a subjective evaluation.
4.1 Taxonomy
For the initial application of generating soundscapes for Google Street View, a cat-egorization according to Schafer’s taxonomy of the potential elements within anoutdoor city street context are given in table 4.1.
Table 4.1: Schafer’s referential classification applied to the most frequent sources found in atypical city.
Natural Human Society Mechanical Quiet Indicators
Air Voice City Transportation Horns / WhistlesBirds Clothing Construction Bells / Gongs
Insects Body Tools TelephonesAnimals Industrial Warning Systems
The categories Society and Quiet can be disregarded for this study, since Soci-ety is a general classification for environments and Quiet relates to environmentswith very few or negligible sound sources. The subcategories for each of the othercategories must be further broken down and further specified in order to determine
15

16 CHAPTER 4. IMPLEMENTATION
Table 4.2: Elaborated referential classification applied to the most frequent sources found in atypical city.
Natural Human Mechanical Indicators
Wind Speaking Voice Cars and Trucks Car HornsBirds Yelling Voice Motorcycles Church Bells
Insects Footsteps Street Power Tools Mobile PhonesDogs Whistles Police SirensCats
the range of possible sources that should be included in the Street View applica-tion. Reducing the table to the main four categories, and elaborating on the sub-categories, the scene description table for cityscapes for this application is given intable 4.2.
4.2 Generation
4.2.1 Sample Playback
The incorporation of sound objects into the soundscape in the Street View applica-tion follows a similar model to that of Birchfield et. al. [4], employing probabilisticplayback to objects with probability values based on the location and orientationof the user. The sound objects used in this model include construction noises, in-dicators (sirens, phones) and soundmarks. For example, if the user has selected alocation on a street that is labeled as currently having construction activity, as isprovided by the RT Conditions input block (See figure 3.1.), the probability thatconstruction noises will be played back would be high, while if the user were tonavigate to another street without construction activity then the probability wouldlower to zero.
For all of the source layers, the levels of the sources were decreased as the POVof the user was directed away from the location of the source. This strategy isbased on the sound design principles and presence factors related to synchrony andmultimodal consistency.
4.2.2 Wavelet Analysis and Resynthesis
Wavelet decomposition is very suitable for the Street View application, as a relativelysmall set of sound recordings may be used to train the model in order to synthesizea manipulable and time-varying texture. This approach is recommended for thetextural sources of wind and water as a future improvement to the application, sincethey are non-stationary and stochastic signals for which a parameterized model foralteration based on an external input may be applied. However it may be arguedthat for this particular application it is beneficial to preserve the original character ofthe community-provided sounds, and thus reflect the true quality of the soundscape.If the resynthesized sounds deviate noticeably from the original recordings, then the

4.3. SYSTEM ARCHITECTURE 17
application may risk losing its preservational aspect. Therefore, such techniques ofresynthesis should not incorporate an abundant amount of parameterization, butinstead focus on the aim of preventing the perception of loops during playback.
4.2.3 Concatenative Synthesis
For this application it was decided that the community-provided recordings shouldbe as preserved as possible, in order to reflect the true nature of the urban sound-scape as recorded by individuals within the context. Therefore, for textural sourcesa concatenative synthesis technique is the most suitable method for the application.As described in section 3.3.3 the recordings are segmented according to a MFCC-based BIC technique, where the minimum grain sizes are chosen for the selectedcategories of the Schafer taxonomy. For this application the grain size selection isperformed for the three categories natural, human and mechanical.
As sound recordings of natural elements found in community-driven sound data-bases for an urban context are primarily composed of city-dwelling birds, the choiceof grain size may in theory be selected to be very short, as many bird soundsare impulsive. However, field recordings such as those found in unstructured sounddatabases contain a combination of bird noises and wind, and therefore it is desirableto retain the long duration of the textural evolutions found in these recordings, andas well to prevent artifacts from the resynthesis discontinuities which may arise dueto the stochastic layer in these recordings. Therefore a longer minimum grain sizeof 4 seconds was selected for the segmentation procedure, however further analysisusing many different recordings could result in a more optimal selection. For humansounds, the minimum grain size was selected based on the logic described in section3.3.3 to be one second, and for construction two seconds to prevent the recognitionof long patterns of impact noises.
Table 4.3 shows the selected minimum grain sizes and cutoff frequencies for thesource categories.
Table 4.3: Selected cutoff frequencies and minimum grain sizes for the source categories.
Natural Human Mechanical
HP Cutoff Frequency (Hz) 300 200 50LP Cutoff Frequency (kHz) 13 10 10
Min Grain Size (s) 4 1 2
4.3 System Architecture
The Street View application is itself a Flash object, and thus the interaction withthe object was created in Actionscript 3.0 and communicated with the Street Viewobject through Javascript. The sound generation was initially performed on a hostmachine with Supercollider, and received messages from the Flash object for trig-gering the concatenation and playback via OSC messages over the server. While
18 CHAPTER 4. IMPLEMENTATION
Supercollider is a highly flexible choice for sound generation, and allows for the ex-tension into low level processing, for this application it was decided to move thesound generation to Actionscript in order to bundle the processes. Furthermore thisarchitecture allows for playback to be generated on the client-side, and eases thestreaming requirements if the system were to be implemented on a larger scale forcommunity usage or experimentation. As the low level processing and segmentationis performed off-line, only the playback strategy, spatialization and concatenationtiming is performed on the client-side, and therefore Actionscript is applicable forsound generation for the Street View application.
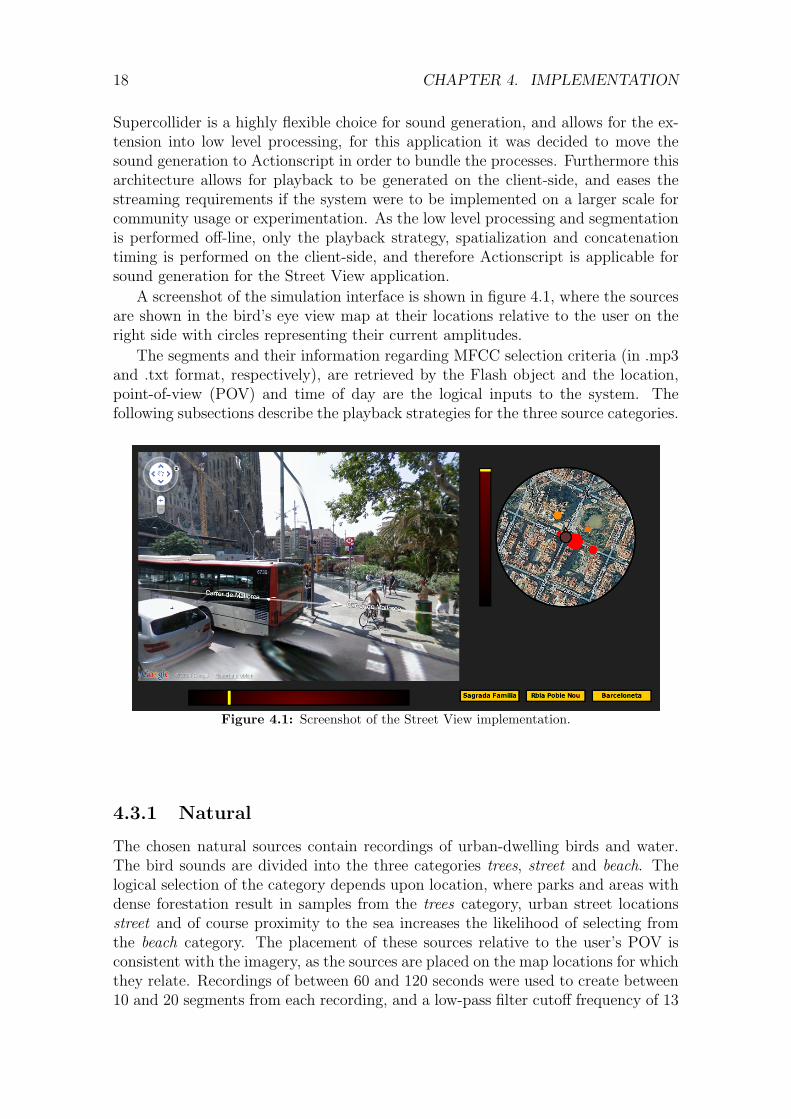
A screenshot of the simulation interface is shown in figure 4.1, where the sourcesare shown in the bird’s eye view map at their locations relative to the user on theright side with circles representing their current amplitudes.
The segments and their information regarding MFCC selection criteria (in .mp3and .txt format, respectively), are retrieved by the Flash object and the location,point-of-view (POV) and time of day are the logical inputs to the system. Thefollowing subsections describe the playback strategies for the three source categories.
Figure 4.1: Screenshot of the Street View implementation.
4.3.1 Natural
The chosen natural sources contain recordings of urban-dwelling birds and water.The bird sounds are divided into the three categories trees, street and beach. Thelogical selection of the category depends upon location, where parks and areas withdense forestation result in samples from the trees category, urban street locationsstreet and of course proximity to the sea increases the likelihood of selecting fromthe beach category. The placement of these sources relative to the user’s POV isconsistent with the imagery, as the sources are placed on the map locations for whichthey relate. Recordings of between 60 and 120 seconds were used to create between10 and 20 segments from each recording, and a low-pass filter cutoff frequency of 13

4.3. SYSTEM ARCHITECTURE 19
kHz and a high-pass filter cutoff frequency of 300 Hz was chosen based on the likelyfrequency range of content for the natural sources.
4.3.2 Human
Recordings of voices were selected and categorized based on density and time ofday. Locations of heavy pedestrian traffic result in more source layers, and the timeof day determines the density of voices within the samples. Samples of between30 and 120 seconds were used and segmented using a minimum segment length ofone second. The low-pass filter cutoff frequency used was 10 kHz and the high-passcutoff was 200 Hz, in accordance with the typical frequency range of speech.
4.3.3 Machinery
Machinery sounds included both construction and traffic noises, as well as signalssuch as sirens and horns. The construction sounds were concatenated using a min-imum grain size of one second, with a low-pass cutoff frequency of 10 kHz and ahigh-pass cutoff frequency of 50 Hz.
Traffic sounds were synthesized using a sample playback method, with individ-ual samples of vehicles passing. In some applications traffic may be considered atextural source, however as the user is positioned in the street, the passing vehi-cles are highly active in this context (see section 2.2.3). In addition, layering thesesounds algorithmically allows for much more control of the conditions, and alleviatescomplications with segmentation and looping of field recordings of many vehicles si-multaneously. The segments were divided into two general categories of slow andfast, and subcategories of light, medium, heavy, truck and motorcycle. The trafficconditions are input to the system based on the location and time of day, and dic-tate which and how many samples are used and the timing between their playback.For this simulation only the situation of passing traffic was assumed, although themodel should be extended to include idling, decelerating and accelerating traffic aswell.
As traffic in urban areas tends to be grouped due to clustering at intersections,the simulation uses a clustering technique where sets of vehicles are layered withsome separation between the clusters, as shown in figure 4.2. The group separationis decided by the time of day input, and is discretized into low, medium and high,where the minimum group separation times are 8, 12 and 20 seconds, respectively.A random fluctuation variable is added to these values with a range of half of thegroup separation time. Linking this variable to the group separation time simulatesthe increasing sporadicity of traffic with less density.
The elements within the group are composed of samples of the individual vehi-cles for the categories discussed above, and each element is selected randomly duringplayback. In this manner, the density of a certain type of vehicle, light for example,is decided by the number of samples in the sound bank relative to the other sub-categories. The number of elements in each group is determined by an input basedon the locality, which is the number of lanes in the road at the current location.There is as well a random fluctuation variable for the time offset of the elements

20 CHAPTER 4. IMPLEMENTATION
Figure 4.2: Diagram representing the generalized functionality of the traffic simulation for theStreet View application.
within the group relative to one another, which is within the range of the groupsegmentation time divided by eight. The elements are individually spatialized inrelation to the user position to give the impression of direction, which is correlatedwith the direction of traffic on the street.
4.4 Evaluation
4.4.1 Criteria
In the Street View application, the factors related to control and the visual perceptare quite limited, since the visual image to which the user is subjected is static. Thepossible interactions with the environment are location selection and POV alteration.As the soundscape represents a dynamic image, while the image presented to theuser is static, it is apparent that the attainable degree of immersion is much lowerthan a typical virtual environment, for which Singer’s parameters are meant toevaluate. Therefore, many of the parameters are not used in this evaluation as theyare not highly applicable to interaction within a VE composed of a static image anda dynamic soundscape.
The factors from table 2.1 that are determined to be most relevant for the evalu-ation were selected, and a description of each as given by Singer et. al., is providedin table 4.4. These factors are to be evaluated using the procedure described in thefollowing section.
4.4.2 Procedure
As presence is a psychological phenomenon, the manner of its measurement andquantification is often disputed. The two main categories measuring presence aresubjective and objective techniques. Subjective techniques require the subject toverbalize or express their perceived sense of presence through the use of question-naires or quizzes [17], [16], [18], and objective methods observe behavioral [9] andphysiological responses of the subject during the experiment [3]. For this study, asubjective analysis is used to evaluate the system for this stage of development ofthe soundscape generation model.

4.4. EVALUATION 21
Table 4.4: Selected parameters and their definitions from Singer et. al. [17] used for evaluationof the Street View sonification.
Anticipation of Events Individuals probably will experience a greater sense of pres-ence in an environment if they are able to anticipate orpredict what will happen next, whether or not it is underpersonal control.
Physical Environment Modifi-ability
Presence should increase as ones ability to modify physicalobjects in that environment increases.
Environmental Richness The greater the extent of sensory information transmittedto appropriate senses of the observer, the stronger the senseof presence will be.
Consistency of MultimodalInformation
The information received through all modalities should de-scribe the same objective world.
Degree of Movement Percep-tion
Presence can be enhanced if the observer perceives self-movement through the VE, and to the extent that objectsappear to move relative to the observer.
Active Search An environment should enhance presence when it permitsobservers to control the relation of their senses to the en-vironment.To the extent that observers can modify theirviewpoint to change what they see, or to reposition theirhead to affect binaural hearing, or to search the environ-ment haptically, they should experience more presence.
Scene Realism Scene realism ... refers to the connectedness and continuityof the stimuli being experienced (as governed by scene con-tent, texture, resolution, light sources, field of view (FOV),dimensionality, etc.).
Information Consistent withObjective World
The more consistent the information conveyed by a VE iswith that learned through real-world experience, the morepresence should be experienced in that VE.

22 CHAPTER 4. IMPLEMENTATION
Figure 4.3: User interface for subjective evaluation.
The analysis was performed using eight participants, who were presented sound-scapes generated using the Street View sonifier and recorded soundscapes for threelocations using headphones (Sennheisser HD650). The recorded soundscapes werequadraphonic recordings situated at each of the locations between 12 and 2 P.M. onweekdays with a Zoom H2 handheld recorder. The four channels were used to cre-ate a spatialized reproduction in Actionscript with mixing orientation linked to userorientation. Each recorded soundscape was one minute in duration and selectedmanually beforehand from a longer recording, with the intent to include varioussound sources without heavy weighting on any one sound object in particular.
Table 4.5: Samples and settings for subjective evaluation.
Sagrada Familia Rambla Poble Nou Barceloneta
Birds - Street Level = 20%, Pan = 75◦ Level = 10%, Pan = −45◦ Level = 10%, Pan = 60◦
Birds - Trees Level = 60%, Pan = −45◦ Level = 40%, Pan = −135◦ Level = 20%, Pan = 45◦
Birds - Beach — — Level = 10%, Pan = 110◦
Voices - Medium — Level = 30%, Pan = 90◦ Level = 20%, Pan = −120◦
Voices - Crowd Level = 80%, Pan = 90◦ Level = 80%, Pan = −110◦ Level = 60%, Pan = 160◦
Construction Level = 100%, Pan = −135◦ — Level = 40%, Pan = −100◦
Traffic Lanes = 4, Density = ”high” Lanes = 1, Density = ”mid” Lanes = 2, Density = ”mid”
The generated soundscapes included samples from the three Schafer categoriesNatural, Human and Machine, and traffic simulation settings representative of thenumber of lanes and time of day. The same sound samples were used for eachlocation with variations in level and spatialization manually determined to representthe locality1. A description of the samples used in each location, their spatializations
1Samples not referentially relating to a locality were not included in the generated soundscape,as is shown in table 4.5.

4.4. EVALUATION 23
Table 4.6: Second phase of subjective evaluation - Questionnaire.
1. How well could you identify individual sound sources in the soundscape?
2. How well could you actively localize individual sound sources in the soundscape?
3. How compelling was your sense of objects moving through space?
4. How much did the auditory aspects of the environment involve you?
5. How compelling was your sense of movement (turning) inside the virtual environment?
6. How much did your experiences in the virtual environment seem consistent withyour real-world experiences?
relative to the user’s initial orientation and their levels relative to their normalizedmaxima are given in table 4.5, along with the traffic simulation settings.
The subject was situated in front of a computer with the application running,which contained the panoramic image and a control application for changing thePOV. A screenshot of the user interface is shown in figure 4.3. The user was asked tochange the POV for each of the three locations, and was then given a questionnaireafterwards as is shown in table 4.6, which was composed of the questions in theSinger et. al experiments that are related to the chosen factors from table 4.4. Foreach of the questions, the user selected a box within a range as is shown in table4.7.
Table 4.7: Subject response example box.
Not at all Moderately Very wello o o o o
The users were instructed to randomly select their first location, and use thepanning bar underneath the Street View window to explore the image and auditoryenvironment. They were given the questions beforehand and allowed to answer themduring the experiment while changing locations and soundscapes. The generated andrecorded soundscapes were not placed in any particular order and the users werenot aware before the experiment that some soundscapes were recorded and somewere generated. Two of the recorded soundscapes were in region B and one was inregion A, where the regions can be seen figure 4.3. The users were not given anytime limitation and were allowed to spend as little or as much time as they desiredat each location.

24 CHAPTER 4. IMPLEMENTATION
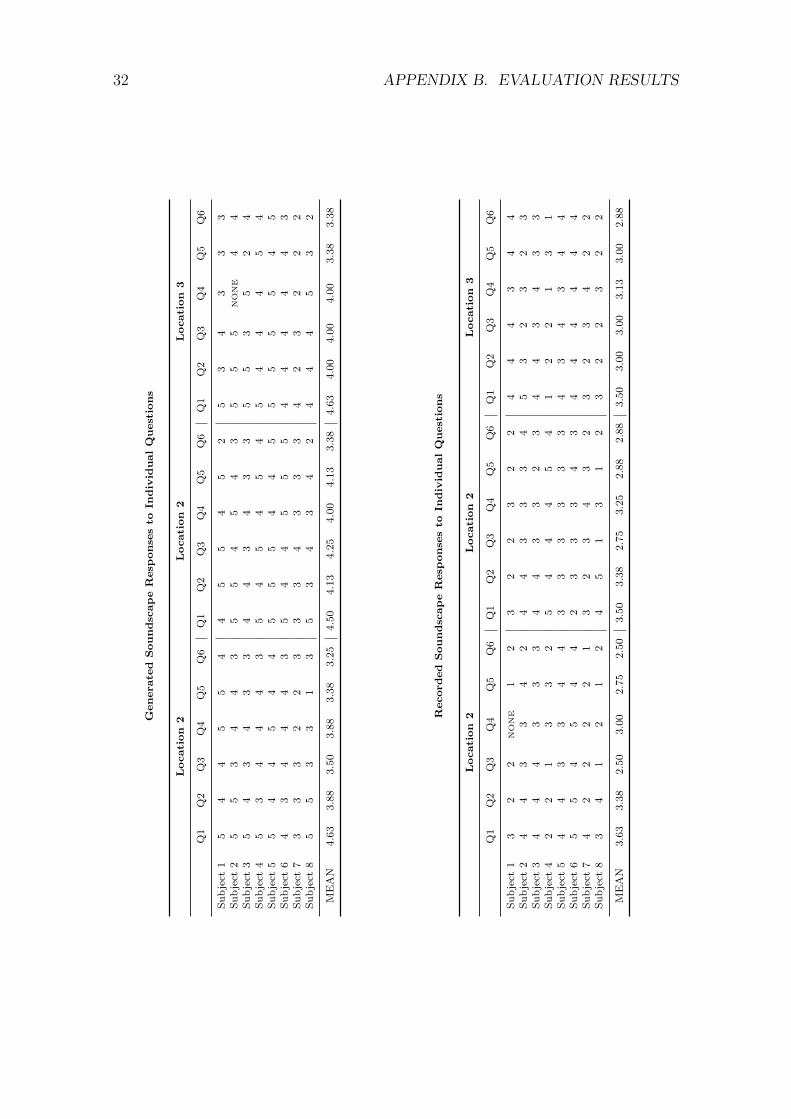
4.4.3 Results and Discussion
The results of the analysis showed that the subjects generally rated the generatedsoundscapes higher than the recorded soundscapes for each of the individual ques-tions, by a margin of 15 − 20%. While there were not enough subjects for draw-ing statistically significant conclusions, the results demonstrate that the generatedsoundscapes are at least acceptable in comparison with actual recordings. It is es-pecially interesting to note that for the question related to the consistency withreal-world experiences (see table 4.6), the generated soundscapes actually scoredhigher than actual recordings. This result is consistent with the experimenter’s ob-servation that none of the subjects were able to identify which soundscapes werereal and which were generated following the experiment, when asked informally ifthey noticed a distinctive difference.
The amount of favorability related to the individual questions did not show anyone attribute to a be prominent contributor to the results, and the distribution waseven with respect to the questions related to sensory factors and realism factors (seeappendix B). Furthermore, the three locations returned similar results with respectto the difference between generated and recorded soundscapes. The normalizedresponses to the individual questions for the three locations are shown in figure 4.4.
Figure 4.4: Normalized responses averaged over all participants in the subjective evaluation foreach question.
From the statistical results and the comments of the participants following theexperiment, some explanations for the favorability of the generated soundscapesover the recorded soundscapes may be discussed. As many of the questions wererelated to the identification of sources, localization and dynamism of sound objects,the spatialization and mixing of the separate layers seem to have had a pronouncedeffect. The participants were more easily able to distinguish and localize objects inthe sound scene and perceived a higher degree of movement of objects with the gen-
4.4. EVALUATION 25
erated soundscapes using separated source layers and individual layer spatialization.Although the recorded soundscapes were created with quadraphonic recordings andspatialized relative to user orientation, it is recommended for future evaluations touse ambisonic or head-related transfer functions to establish a more realistic spatial-ization for comparison with the generation model. Furthermore, some users notedthat the traffic seemed more congruent with their positions for the generated sound-scapes, which is logical since the recordings were made beside the road as opposedto within the flow of traffic. This observation however demonstrates the effect ofmulti-modal consistency on presence for this application.
The initial levels of each of the source layers was set manually prior to the ex-periment, in order to create a suitable mixing of the source layers. The sampleswere normalized prior to segmentation and playback, and it was found during devel-opment of the application that level adjustments were necessary and in some casesrequired very drastic reductions. In order to automate the level mixing process, aperceptual quantification of the source layers’ levels must be incorporated for futureimplementations.
It was also noted by some participants that the recognition of sources relatedto the location was a large factor in their feeling of being situated within the envi-ronment, such as seagulls near the beach. In the recorded soundscapes the naturalsounds of the location were not perceived to be as representative for the locationas those selected for the generated soundscapes. Selecting sources particular for alocation may exaggerate the actual sonic environment creating an augmented sonicreality for the image, and thereby increase the amount of sensory information avail-able to the user.
The design methodology applied to this application seems to have enhanced theimmersive experience for the participants as compared with actual recordings dueto improved source identification and location, and multi-modal consistency.

26 CHAPTER 4. IMPLEMENTATION

Chapter 5
Discussion and Conclusions
The results of this study establish autonomous generation of soundscapes using con-tent from unstructured sound databases as a viable avenue for enhancing the sonicenvironments of VE’s. The combination of sound design principles from the fieldsof acoustic ecology and media seems as well to lay a groundwork for autonomoussoundscape generation, as the results of the evaluation demonstrated a favorableresponse compared to actual soundscape recordings. However, with the key compo-nents of retrieval, sound object selection and initial level mixing performed manuallyfor the simulation, it also exhibits that the implementation of the model must befurther developed in order to reach fully autonomous functionality.
The use of automatic level mixing with user orientation, in addition to spatial-ization, seemed to result in an improved sense of space for the participants, andbetter localization and identification of individual sources. Additionally, the userswere not able to distinguish the generated soundscapes from the natural recordings,which suggests that the concatenative synthesis methodology did not cause percep-tual anomalies in the generation, and that the use of layered recordings from anunstructured database can create the illusion of a natural soundscape.
The concatenative synthesis method employed in this model, based on BIC seg-mentation and MFCC proximity, was observed during development to contain somepossibly perceivable instabilities in the samples with notable stochastic components.Although the MFCC selection criterion alleviates these instabilities to some extent,for a single source layer without other layers to mask the spectrally varying stochasticcomponent, these instabilities may contribute to a perceptually observable disconti-nuity in the audio stream. Further research regarding the masking criteria necessaryfor ensuring that these variances in spectral content are not perceptually relevantare recommended for future work. The generation model proposed in chapter 3recommends the use of wavelet resythesis for the stochastic source layers, and itsincorporation into a future implementation may resolve this issue.
Selection of the minimum grain sizes for the individual source layers was decidedbased on the length of the shortest audio event that was desired for capture. Thismethod proposes to use a minimum grain size for each of the sources in Schafer’staxonomy, which are chosen for a particular application, and for the implementationin the Street View sonification the method was determined to be successful. Furtheranalysis using many different samples may demonstrate however that the selection
27
28 CHAPTER 5. DISCUSSION AND CONCLUSIONS
may be further optimized for each particular recording using a procedure based ondetected event lengths within the recording.
The subjective evaluation insisted that the positioning and POV of the userrelative to the sources are highly affective attributes of the soundscape, which arebelieved to be the primarily contributing factors in the favorability of the generatedsoundscapes over the recorded soundscapes. The correlation of the user’s POV andthe location of sound objects in the sound scene was used to adjust the levels and ofcourse the spatialization of the source layers, but may be further enhanced with theuse of audio effects such as dynamic filtering and compression. Such optimizationswould likely further improve the multi-modal consistency and source identificationproperties related to the sense of presence.
In chapter 3 the concept of the use of metadata related to user interactivity andtrends was discussed as an input to the generative strategy. The use of metadata ishighly dependent on the application, but carries the potential for enrichment of theplayback and generation strategies that may not be available based on analysis of theaudio content alone. For the Street View application for example, metadata relatedto user feedback regarding the relative levels of sources could alleviate the difficultiesdiscussed in section 4.4.3 with automatic mixing. Such user-driven feedback wouldensure the most comfortable and desirable mix based not only on loudness perceptionbut also on the relative focal draw of the individual source layers.
The implementation of the model in a photorealistic application demonstratedthat it is acceptable for creating realistic sonic environments, however the modellacks validation for a less realistic VE where the use of naturally recorded soundtextures as found in unstructured databases may not be as successful. It is expectedthat the selection of audio content must be suitable for the context of the application,and therefore the model should be validated for non-photorealistic applications, fromwhich a methodology for retrieval based on application context may be derived.
The use of a photorealistic application did however expose the compromise be-tween realism and emotional induction in soundscape design. Although realism maybe considered to be of primary importance for the Street View sonification, it wasfound that users responded favorably to the use of sounds that exaggerated the nat-ural components of the soundscape for the image. The sound objects particular fora location were accentuated through level and density parameters, and in turn con-tributed to a general preference over the actual recordings, in which these sourceswere not as prominent. The balance between realism and emotional induction isa design principle that should be evaluated for each application. Further study iswarranted for quantifying this balance with relation to the soundscape generationmodel. A further extension of this notion is the incorporation of diegetic sounds intothe model, as discussed in section 2.2. For the Street View application for example,it may be conceived to incorporate narration or instructional sounds to give the userinformation regarding the location, if so desired by the user. These additions maycontribute to the informational exchange between the application and the user andthereby increase its beneficial value.
Appendix A
R. Murray Schafer’s Taxonomy
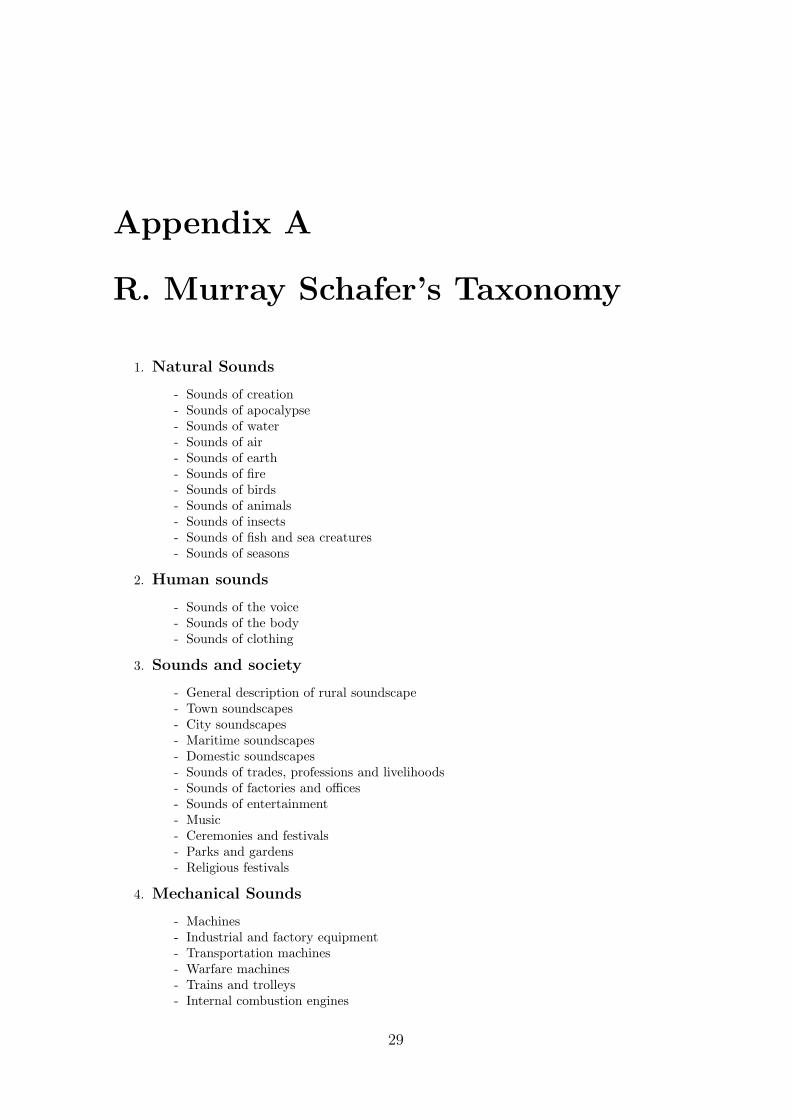
1. Natural Sounds
- Sounds of creation- Sounds of apocalypse- Sounds of water- Sounds of air- Sounds of earth- Sounds of fire- Sounds of birds- Sounds of animals- Sounds of insects- Sounds of fish and sea creatures- Sounds of seasons
2. Human sounds
- Sounds of the voice- Sounds of the body- Sounds of clothing
3. Sounds and society
- General description of rural soundscape- Town soundscapes- City soundscapes- Maritime soundscapes- Domestic soundscapes- Sounds of trades, professions and livelihoods- Sounds of factories and offices- Sounds of entertainment- Music- Ceremonies and festivals- Parks and gardens- Religious festivals
4. Mechanical Sounds
- Machines- Industrial and factory equipment- Transportation machines- Warfare machines- Trains and trolleys- Internal combustion engines
29

30 APPENDIX A. R. MURRAY SCHAFER’S TAXONOMY
- Aircraft- Construction and demolition equipment- Mechanical tools- Ventilations and air-conditioners- Instruments of war and destruction- Farm machinery
5. Quiet and Silence
6. Sounds as Indicators
- Bells and gongs- Horns and whistles- Sounds of time- Telephones- Warning systems- Signals of pleasure- Indicators of future occurrences
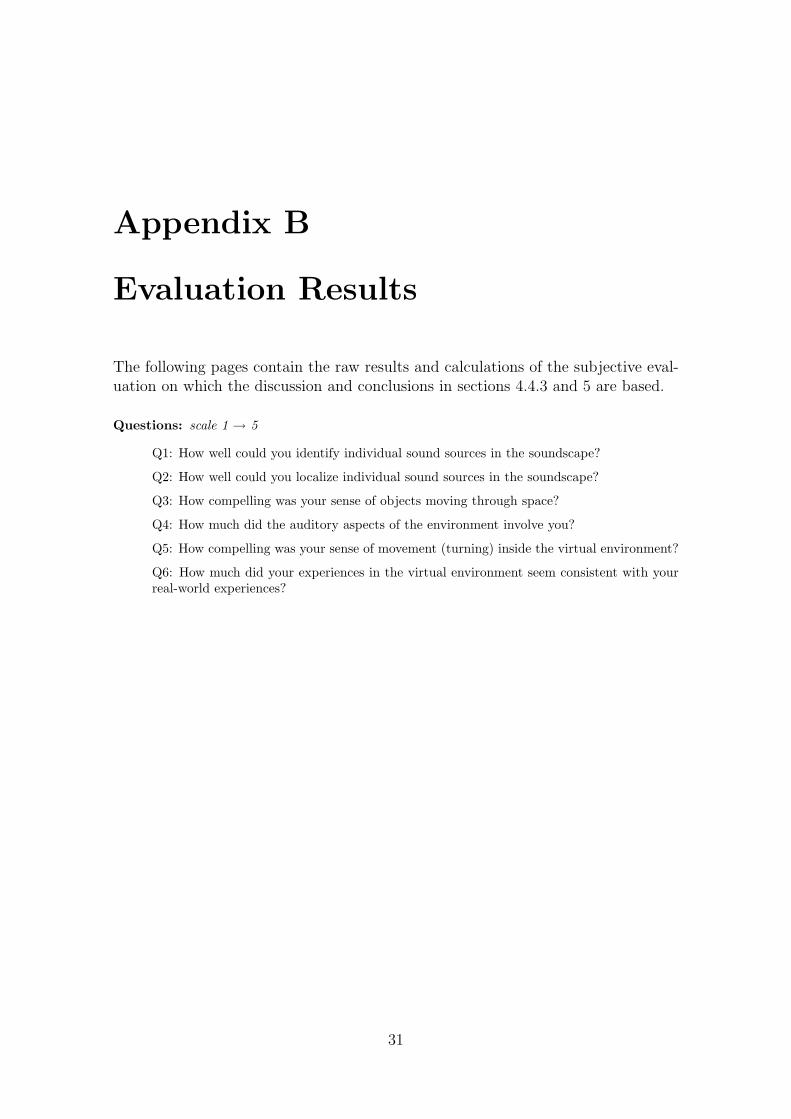
Appendix B
Evaluation Results
The following pages contain the raw results and calculations of the subjective eval-uation on which the discussion and conclusions in sections 4.4.3 and 5 are based.
Questions: scale 1 → 5
Q1: How well could you identify individual sound sources in the soundscape?
Q2: How well could you localize individual sound sources in the soundscape?
Q3: How compelling was your sense of objects moving through space?
Q4: How much did the auditory aspects of the environment involve you?
Q5: How compelling was your sense of movement (turning) inside the virtual environment?
Q6: How much did your experiences in the virtual environment seem consistent with yourreal-world experiences?
31
32 APPENDIX B. EVALUATION RESULTS
Gen
erate
dS
ou
nd
scap
eR
esp
on
ses
toIn
div
idu
al
Qu
est
ion
s
Locati
on
2L
ocati
on
2L
ocati
on
3
Q1
Q2
Q3
Q4
Q5
Q6
Q1
Q2
Q3
Q4
Q5
Q6
Q1
Q2
Q3
Q4
Q5
Q6
Subje
ct1
54
45
54
45
54
52
53
43
33
Subje
ct2
55
34
43
55
45
43
55
5N
ON
E4
4Subje
ct3
54
34
33
44
34
33
55
35
24
Subje
ct4
53
44
43
54
54
54
54
44
54
Subje
ct5
54
45
44
55
54
45
55
55
45
Subje
ct6
43
44
43
54
45
55
44
44
43
Subje
ct7
33
32
23
33
43
33
42
32
22
Subje
ct8
55
33
13
53
43
42
44
45
32
ME
AN
4.6
33.8
83.5
03.8
83.3
83.2
54.5
04.1
34.2
54.0
04.1
33.3
84.6
34.0
04.0
04.0
03.3
83.3
8
Record
ed
Sou
nd
scap
eR
esp
on
ses
toIn
div
idu
al
Qu
est
ion
s
Locati
on
2L
ocati
on
2L
ocati
on
3
Q1
Q2
Q3
Q4
Q5
Q6
Q1
Q2
Q3
Q4
Q5
Q6
Q1
Q2
Q3
Q4
Q5
Q6
Subje
ct1
32
2N
ON
E1
23
22
32
24
44
34
4Subje
ct2
44
33
42
44
33
34
53
23
23
Subje
ct3
44
43
33
44
33
23
44
34
33
Subje
ct4
22
13
32
54
44
54
12
21
31
Subje
ct5
44
33
44
33
33
33
43
43
44
Subje
ct6
55
45
44
23
33
43
44
44
44
Subje
ct7
42
22
21
32
34
32
32
34
22
Subje
ct8
34
12
12
45
13
12
32
23
22
ME
AN
3.6
33.3
82.5
03.0
02.7
52.5
03.5
03.3
82.7
53.2
52.8
82.8
83.5
03.0
03.0
03.1
33.0
02.8
8

33
Average
Resp
on
ses
toIn
div
idu
al
Qu
est
ion
s
Loca
tion
1Loca
tion
2Loca
tion
3M
ean
Ques
tions
Fact
ors
Gen
erate
dR
ecord
edG
ener
ate
dR
ecord
edG
ener
ate
dR
ecord
edG
ener
ate
dR
ecord
ed
Q1
RF,SF
4.6
33.6
34.5
03.5
04.6
33.5
04.5
83.5
4Q
2R
F,SF
3.8
83.3
84.1
33.3
84.0
03.0
04.0
03.2
5Q
3SF
3.5
02.5
04.2
52.7
54.0
03.0
03.9
22.7
5Q
4SF
3.8
83.0
04.0
03.2
54.0
03.1
33.9
63.1
3Q
5SF
3.3
82.7
54.1
32.8
83.3
83.0
03.6
32.8
8Q
6R
F,C
F3.2
52.5
03.3
82.8
83.3
82.8
83.3
32.7
5
Mea
n3.7
52.9
64.0
63.1
03.9
03.0
83.9
03.0
5
Norm
ali
zed
Diff
eren
ces
(Gen
erate
d-
Record
ed
)
Locati
on
1L
ocati
on
2L
ocati
on
3M
ean
Q1
0.2
00.2
00.2
30.2
1Q
20.1
00.1
50.2
00.1
5Q
30.2
00.3
00.2
00.2
3Q
40.1
80.1
50.1
80.1
7Q
50.1
30.2
50.0
80.1
5Q
60.1
50.1
00.1
00.1
2
Mea
n0.1
60.1
90.1
60.1
7
Sen
sory
Fact
ors
0.1
60.2
10.1
80.1
8
Rea
lism
Fact
ors
0.1
50.1
50.1
80.1
6
Contr
olFact
ors
0.1
50.1
00.1
00.1
2

34 APPENDIX B. EVALUATION RESULTS
Bibliography
[1] Freesound.org. www.freesound.org.
[2] X. Anguera and J. Hernando. Xbic: Real-time cross probabilities measurefor speaker segmentation. Univ. California Berkeley, ICSIBerkeley Tech. Rep,2005.
[3] W. Barfield and C. Hendrix. Presence and performance within virtual environ-ments. Presence: Teleoperators & Virtual Environments, 3, 1996.
[4] D. Birchfield, N. Mattar, and H. Sundaram. Design of a generative model forsoundscape creation. In International Computer Music Conference, Barcelona,Spain, 2005.
[5] Michel Chion, Claudia Gorbman, and Walter Murch. Audio-Vision. ColumbiaUniversity Press, April 1994.
[6] P. Cook. Modeling bills gait: Analysis and parametric synthesis of walkingsounds. Proc. Audio Engr. Society, 22, 2002.
[7] P. R. Cook. Toward physically-informed parametric synthesis of sound effects.In 1999 IEEE Workshop on Applications of Signal Processing to Audio andAcoustics, page 15, 1999.
[8] C. Fellbaum et al. WordNet: An electronic lexical database. MIT press Cam-bridge, MA, 1998.
[9] Jonathan Freeman, S. E. Avons, Don E. Pearson, and Wijnand A. IJsselsteijn.Effects of sensory information and prior experience on direct subjective rat-ings of presence. Presence: Teleoperators & Virtual Environments, 8(1):1–13,February 1999.
[10] W. W. Gaver. How do we hear in the world? explorations in ecological acoustics.Ecological Psychology, 5(4):285–313, 1993.
[11] N. E. Miner and T. P. Caudell. A wavelet synthesis technique for creatingrealistic virtual environment sounds. Presence: Teleoperators & Virtual Envi-ronments, 11(5):493–507, 2002.
[12] N. E. Miner and T. P. Caudell. Using wavelets to synthesize stochastic-basedsounds for immersive virtual environments. ACM Transactions on Applied Per-ception (TAP), 2(4):521–528, 2005.
35

36 BIBLIOGRAPHY
[13] Davide Rocchesso and Federico Fontana. The sounding object. Mondo Estremo,2003.
[14] R. Murray Schafer. The Soundscape: Our Sonic Environment and the Tuningof the World. Destiny Books, 1994.
[15] D. Schwarz. A system for data-driven concatenative sound synthesis. In Proc.Cost- G6 Conf. on Digital Audio Effects (DAFX), pages 97–102, Verona, Italy,2000.
[16] S. Serafin. Sound design to enhance presence in photorealistic virtual reality. InProceedings of the 2004 International Conference on Auditory Display, pages6–9, 2004.
[17] Michael J Singer and Bob G. Witmer. Measuring presence in virtual environ-ments: A presence questionnaire. PRESENCE, 7:225–240, 1998.
[18] M. Slater and M. Usoh. Representations systems, perceptual position, andpresence in immersive virtual environments. Presence: Teleoperators and virtualenvironments, 2(3):221–233, 1993.
[19] D. Sonnenschein. Sound design: The expressive power of music, voice andsound effects in cinema. Michael Wiese Productions, 2001.
[20] P. Turner, I. McGregor, S. Turner, and F. Carroll. Evaluating soundscapes asa means of creating a sense of place. In International Conference on AuditoryDisplay, 2003.
[21] Andrea Valle, Mattia Schirosa, and Vincenzo Lombardo. A framework forsoundscape analysis and re-synthesis. In Proceedings of the SMC 2009, Porto,Portugal, July 2009.
[22] Kees van den Doel, Paul G. Kry, and Dinesh K. Pai. FoleyAutomatic:physically-based sound effects for interactive simulation and animation. In Pro-ceedings of the 28th annual conference on Computer graphics and interactivetechniques, pages 537–544. ACM, 2001.