Embed Size (px)
Citation preview

kpmg.com
Automotive’s new reality:
Americans have gotten comfortable working from home and buying online. That means they’re driving less. Businesses need to take notice.
Fewer trips, fewer miles, fewer cars?


A letter from Gary SilbergAmericans love to drive. In many ways, the automobile is an integral part of the American experience—an expression of freedom and independence. We take our families for trips to the mountains, the oceans, to our national parks. We jump in our cars to go to a movie or out to dinner. We drive to work, we drive to the mall and to neighborhood shops. We drive. A lot.
In fact, in 2019, Americans racked up an astounding 3 trillion miles behind the wheel. That amounts to 337 round trips from Earth to Pluto. For six decades there has been a steady growth in “vehicle miles traveled” or VMT in auto industry jargon.
But suddenly—as with so much of American life—driving was disrupted by COVID-19. The social-distancing measures enacted to slow the outbreak dramatically cut the amount of miles Americans travel by car. Millions of employees started working from home. And, with stores closed, consumers increased online shopping. At the height of the lockdown (in April), daily VMT fell an unprecedented 64 percent, or by 160 billion miles.
As optimists, we believe scientists will eventually develop a vaccine, and our economy will recover. But the strategic question now is: what will be the new reality for automobile usage? Will the changes in consumer behavior that reduced miles traveled in 2020 persist or not?
To answer these questions we looked at the two driving “missions” that were most affected by COVID-19: commuting and shopping. These uses are two of the most important reasons for people to own cars and together they account for nearly 40 percent of those 3 trillion annual miles that Americans log. The analysis we present in this paper suggests that the trends of
more people working and shopping from home will continue—and could cut U.S. annual VMT by up to 270 billion miles.
Of course, forecasting consumer behavior of any kind is always complex. Even now, we see that for safety reasons, commuters are abandoning public transport and driving their own cars or using mobility services. And some consumers are taking long car trips rather than risking an airplane flight. In the near term, these behaviors might partially offset the impact of fewer commuting and shopping trips. But in the long run, these safety concerns will fade.
Our research suggests that the trends we focus on here—more home-based work and more e-commerce—are powerful and enduring. That leads to the ultimate question: what happens when Americans cut their driving by 270 billion miles per year (or up to about 9.2 percent)? What happens to auto makers, parts suppliers and other players in the automotive value chain? The first-order effect would be a reduced need to own a vehicle and lower demand for new and used cars. We estimate that car ownership could fall from 1.97 to 1.87 vehicles per household. That may not sound like much, but it could translate into up to 14 million fewer vehicles on U.S. roads.
We believe this could likely be the auto industry’s next challenge. Fewer trips, fewer miles—and fewer cars. It’s a new reality to reckon with.
Gary SilbergPartner and Global Head of Automotive Sector
1© 2020 KPMG LLP, a Delaware limited liability partnership and the U.S. member firm of the KPMG network of independent member firms affiliated with KPMG International Cooperative (“KPMG International”), a Swiss entity. All rights reserved.
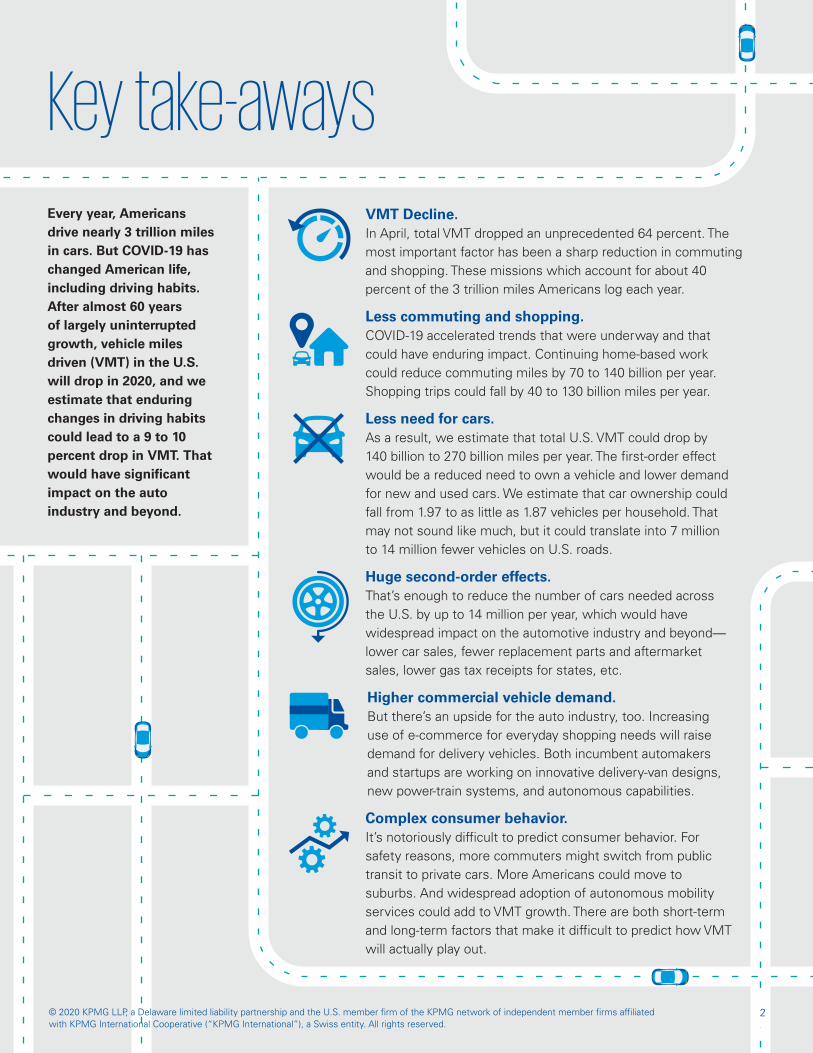
Key take-awaysEvery year, Americans drive nearly 3 trillion miles in cars. But COVID-19 has changed American life, including driving habits. After almost 60 years of largely uninterrupted growth, vehicle miles driven (VMT) in the U.S. will drop in 2020, and we estimate that enduring changes in driving habits could lead to a 9 to 10 percent drop in VMT. That would have significant impact on the auto industry and beyond.
VMT Decline. In April, total VMT dropped an unprecedented 64 percent. The most important factor has been a sharp reduction in commuting and shopping. These missions which account for about 40 percent of the 3 trillion miles Americans log each year.
Less commuting and shopping. COVID-19 accelerated trends that were underway and that could have enduring impact. Continuing home-based work could reduce commuting miles by 70 to 140 billion per year. Shopping trips could fall by 40 to 130 billion miles per year.
Less need for cars. As a result, we estimate that total U.S. VMT could drop by 140 billion to 270 billion miles per year. The first-order effect would be a reduced need to own a vehicle and lower demand for new and used cars. We estimate that car ownership could fall from 1.97 to as little as 1.87 vehicles per household. That may not sound like much, but it could translate into 7 million to 14 million fewer vehicles on U.S. roads.
Huge second-order effects. That’s enough to reduce the number of cars needed across the U.S. by up to 14 million per year, which would have widespread impact on the automotive industry and beyond—lower car sales, fewer replacement parts and aftermarket sales, lower gas tax receipts for states, etc.
Higher commercial vehicle demand. But there’s an upside for the auto industry, too. Increasing use of e-commerce for everyday shopping needs will raise demand for delivery vehicles. Both incumbent automakers and startups are working on innovative delivery-van designs, new power-train systems, and autonomous capabilities.
Complex consumer behavior. It’s notoriously difficult to predict consumer behavior. For safety reasons, more commuters might switch from public transit to private cars. More Americans could move to suburbs. And widespread adoption of autonomous mobility services could add to VMT growth. There are both short-term and long-term factors that make it difficult to predict how VMT will actually play out.
2© 2020 KPMG LLP, a Delaware limited liability partnership and the U.S. member firm of the KPMG network of independent member firms affiliated with KPMG International Cooperative (“KPMG International”), a Swiss entity. All rights reserved.

For six decades, there has been a steady rise in the number of miles that Americans travel in automobiles every year (Exhibit 1). In 1960, total vehicle miles traveled (VMT) was 600 billion. By 2019, it was nearly 3 trillion and growing.
Then came COVID-19. In 2020, this nearly unbroken streak appears to be ending. In the 2008-09 recession VMT growth dipped, but under COVID-19 stay-at-home orders, automobile use plunged. Highways that had been choked with rush-hour traffic were eerily empty. There were no trips to the mall, no ferrying kids to school and sports, no nights out on the town. During April, VMT fell 64 percent below the usual level, or by 160 billion miles for the month.1 In May, VMT was still down 40 percent compared with May 2019.2
Exhibit 1: 60 years of VMT growth
US Light Vehicle VMT (Vehicle Miles Traveled) (Billion miles)
Note: Between 1960 and 1990, data is in five-year intervals. 1991 to 2020 reflects annual numbers.
Source: US Bureau of Transportation Statistics
The question now—and the purpose of this paper—is to determine how “sticky” these changes in auto usage could be. For answers we looked at commuting and shopping trips, which together make up nearly 40 percent of U.S.
VMT and are most subject to enduring change. People won’t stop driving the kids to school or running errands, but many may choose to work from home or rarely set foot in a grocery store again. How many consumers make such choices will have direct impact on automobile usage and, inevitably, on automobile demand.
In the following analysis, we show how we estimated that VMT could fall by more than 9 percent, or about 270 billion miles per year, based on changes in commuting and shopping. That’s about 100 million trips from New York to California. To be sure, a number of variables could mitigate this outcome: commuters shifting from public transportation to private cars; lower gas prices encouraging long trips; population migration from cities to suburbs where driving is more of a necessity.
But if this scenario plays out, the effects could be significant. It would mean a drop in vehicle sales, closing of assembly plants, a decline in gasoline consumption and gas taxes, and a drop in aftermarket sales, to name a few.
Exhibit 2. Total impact could be 110 to 270 billion lower U.S. VMT
Estimated potential decline in VMT (Billion miles, light vehicles only)
Source:: U.S. Bureau of Transportation Statistics; U.S. National Household Travel Survey; KPMG analysis
Introduction
0
1,000
1,500
2,000
2,500
3,000
500
1960 1970 1980 1990 2000 2010 2020
+400%
Pre COVID-19baseline
Commute VMTdecline
Shopping VMTdecline
Post COVID-19estimate
2,950B 70-140B
40-130B2,680-2,840B
110-270billion miles
1 Source: Streetlight Data2 Source: U.S. Department of Transportation
3© 2020 KPMG LLP, a Delaware limited liability partnership and the U.S. member firm of the KPMG network of independent member firms affiliated with KPMG International Cooperative (“KPMG International”), a Swiss entity. All rights reserved.

Commuting trips: More home-based work, fewer commutersAs states imposed stay-at-home orders to limit the spread of COVID-19, businesses were forced to shut their doors. Employees who could work from home—and were still employed—pivoted quickly and started engaging with colleagues and customers on videoconferencing platforms. Before COVID-19, about 3.4 percent of U.S. workers worked from home full-time.3 By the beginning of April, that number had jumped to 62 percent.4
The effect can be seen in rush-hour traffic data. In Atlanta, for example, commuting VMT fell by 45 percent during the month of April, according to Streetlight, which
estimates traffic using anonymized cellphone and GPS data.5 Streetlight found similar results in Chicago, and if we extrapolate to a national level, it looks like commuting VMT may have dropped by 30 billion miles during April. Exhibit 2 shows the impact on congestion. On the left, the map from mid-April 2019 shows pervasive “moderate,” “slow,” and “stop and go” traffic during morning rush hour in Atlanta—one of the nation’s most congested cities.6 A year later, at the height of the COVID-19 lockdown, the map is mostly green, indicating that traffic is moving freely.
Exhibit 2. How working from home relieved Atlanta’s rush-hour congestion
Atlanta’s congestion during morning rush hour
April 15 – 19, 2019
April 13 – 17, 2020
1 Source: The 2017 State of Telecommuting in the U.S. Employee Workforce, Published by FlexJobs and Global Workplace Analytics2 Source: Beth Braccio Hering, Remote Work Statistics: Shifting Norms and Expectations, flexjobs.com; Jim Harter, “How Coronavirus Will Change the ‘Next Normal’ Workplace, Gallup.com, May 1, 2020.
3 Source: Streetlight Data vehicle traffic data4 Source: HERE Technologies vehicle traffic data5 Source: Searchlight Data
Source(s): HERE vehicle traffic data
Stop and goSlowModerateFast Stop and goSlowModerateFast
4© 2020 KPMG LLP, a Delaware limited liability partnership and the U.S. member firm of the KPMG network of independent member firms affiliated with KPMG International Cooperative (“KPMG International”), a Swiss entity. All rights reserved.
Hitachi
Facebook, Square
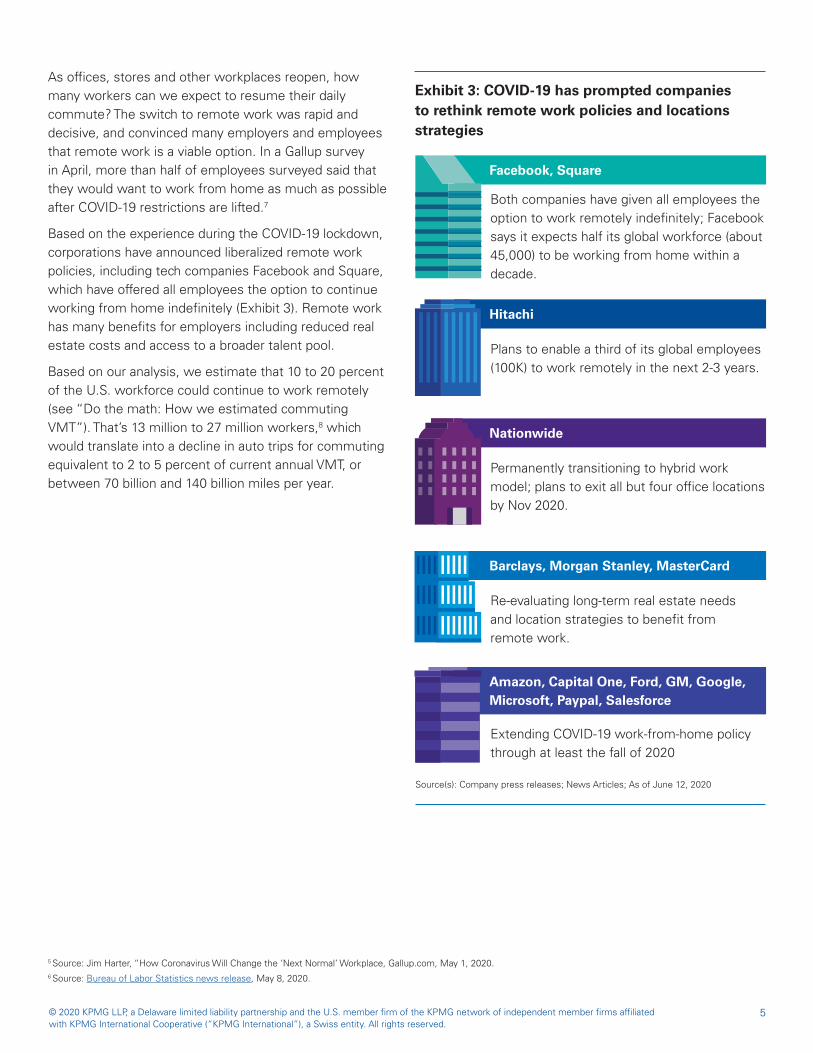
As offices, stores and other workplaces reopen, how many workers can we expect to resume their daily commute? The switch to remote work was rapid and decisive, and convinced many employers and employees that remote work is a viable option. In a Gallup survey in April, more than half of employees surveyed said that they would want to work from home as much as possible after COVID-19 restrictions are lifted.7
Based on the experience during the COVID-19 lockdown, corporations have announced liberalized remote work policies, including tech companies Facebook and Square, which have offered all employees the option to continue working from home indefinitely (Exhibit 3). Remote work has many benefits for employers including reduced real estate costs and access to a broader talent pool.
Based on our analysis, we estimate that 10 to 20 percent of the U.S. workforce could continue to work remotely (see “Do the math: How we estimated commuting VMT”). That’s 13 million to 27 million workers,8 which would translate into a decline in auto trips for commuting equivalent to 2 to 5 percent of current annual VMT, or between 70 billion and 140 billion miles per year.
5 Source: Jim Harter, “How Coronavirus Will Change the ‘Next Normal’ Workplace, Gallup.com, May 1, 2020.6 Source: Bureau of Labor Statistics news release, May 8, 2020.
Exhibit 3: COVID-19 has prompted companies to rethink remote work policies and locations strategies
Both companies have given all employees the option to work remotely indefinitely; Facebook says it expects half its global workforce (about 45,000) to be working from home within a decade.
Plans to enable a third of its global employees (100K) to work remotely in the next 2-3 years.
Nationwide
Permanently transitioning to hybrid work model; plans to exit all but four office locations by Nov 2020.
Barclays, Morgan Stanley, MasterCard
Re-evaluating long-term real estate needs and location strategies to benefit from remote work.
Amazon, Capital One, Ford, GM, Google, Microsoft, Paypal, Salesforce
Extending COVID-19 work-from-home policy through at least the fall of 2020
Source(s): Company press releases; News Articles; As of June 12, 2020
5© 2020 KPMG LLP, a Delaware limited liability partnership and the U.S. member firm of the KPMG network of independent member firms affiliated with KPMG International Cooperative (“KPMG International”), a Swiss entity. All rights reserved.
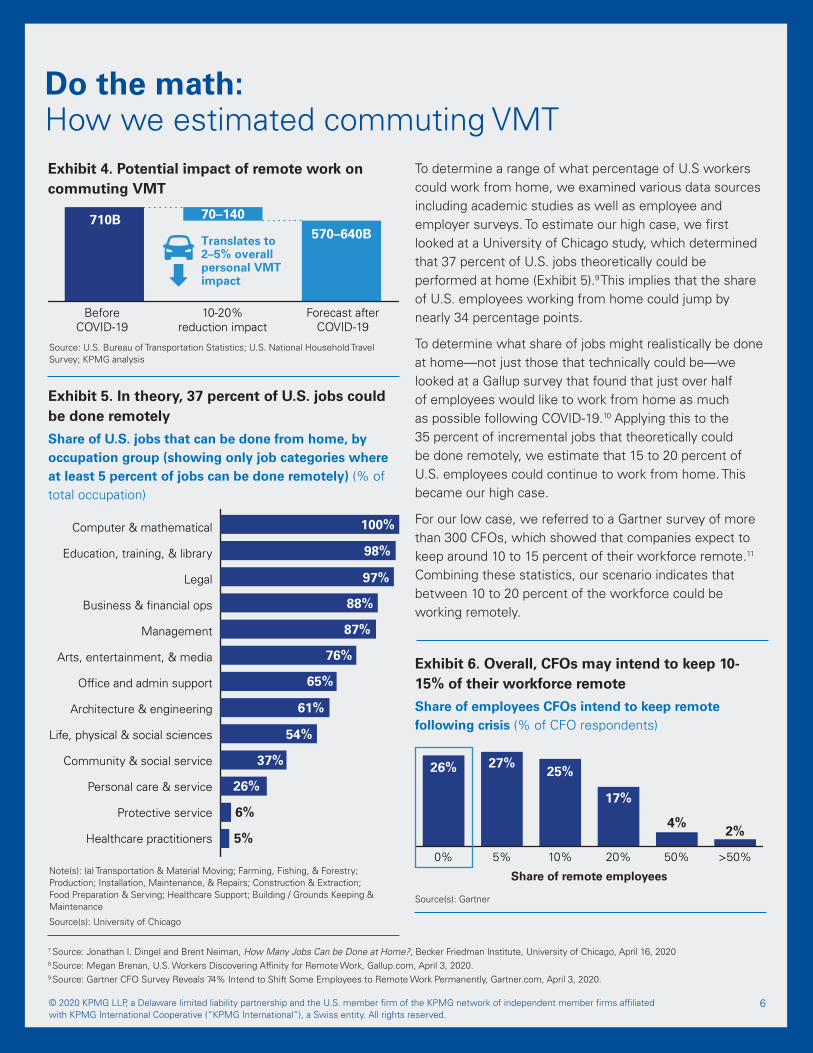
Do the math: How we estimated commuting VMT
To determine a range of what percentage of U.S workers could work from home, we examined various data sources including academic studies as well as employee and employer surveys. To estimate our high case, we first looked at a University of Chicago study, which determined that 37 percent of U.S. jobs theoretically could be performed at home (Exhibit 5).9 This implies that the share of U.S. employees working from home could jump by nearly 34 percentage points.
To determine what share of jobs might realistically be done at home—not just those that technically could be—we looked at a Gallup survey that found that just over half of employees would like to work from home as much as possible following COVID-19.10 Applying this to the 35 percent of incremental jobs that theoretically could be done remotely, we estimate that 15 to 20 percent of U.S. employees could continue to work from home. This became our high case.
For our low case, we referred to a Gartner survey of more than 300 CFOs, which showed that companies expect to keep around 10 to 15 percent of their workforce remote.11
Combining these statistics, our scenario indicates that between 10 to 20 percent of the workforce could be working remotely.
Exhibit 4. Potential impact of remote work on commuting VMT
BeforeCOVID-19
10-20%reduction impact
Forecast afterCOVID-19
710B 70–140570–640BTranslates to
2–5% overallpersonal VMTimpact
Exhibit 5. In theory, 37 percent of U.S. jobs could be done remotely
Share of U.S. jobs that can be done from home, by occupation group (showing only job categories where at least 5 percent of jobs can be done remotely) (% of total occupation)
7 Source: Jonathan I. Dingel and Brent Neiman, How Many Jobs Can be Done at Home?, Becker Friedman Institute, University of Chicago, April 16, 20208 Source: Megan Brenan, U.S. Workers Discovering Affinity for Remote Work, Gallup.com, April 3, 2020.9 Source: Gartner CFO Survey Reveals 74% Intend to Shift Some Employees to Remote Work Permanently, Gartner.com, April 3, 2020.
Computer & mathematical
Education, training, & library
Legal
Business & financial ops
Management
Arts, entertainment, & media
Office and admin support
Architecture & engineering
Life, physical & social sciences
Community & social service
Personal care & service
Protective service
Healthcare practitioners
100%
98%
97%
88%
87%
76%
65%
61%
54%
37%
26%
6%
5%
Note(s): (a) Transportation & Material Moving; Farming, Fishing, & Forestry; Production; Installation, Maintenance, & Repairs; Construction & Extraction; Food Preparation & Serving; Healthcare Support; Building / Grounds Keeping & Maintenance
Source(s): University of Chicago
Exhibit 6. Overall, CFOs may intend to keep 10-15% of their workforce remote
Share of employees CFOs intend to keep remote following crisis (% of CFO respondents)
Source(s): Gartner
0% 5% 10% 20% 50% >50%
26% 27%25%
17%
4% 2%
Source: U.S. Bureau of Transportation Statistics; U.S. National Household Travel Survey; KPMG analysis
Share of remote employees
6© 2020 KPMG LLP, a Delaware limited liability partnership and the U.S. member firm of the KPMG network of independent member firms affiliated with KPMG International Cooperative (“KPMG International”), a Swiss entity. All rights reserved.

Shopping trips: shop ‘til you drop—online The social-distancing orders forced hundreds of thousands of stores, restaurants, and other consumer services to shut their doors. For consumers, that meant no more weekend excursions to the mall. Drugstores and grocery stores were open, but consumers spaced out their trips to minimize health risks. Foot traffic for non-essential retail fell about 80 percent at its lowest point, and April U.S. retail sales fell a record 16.4 percent from March and were 21.6 percent below the April 2019 level.12 Since then, grocery and general merchandise sales have rebounded, although mall traffic remained far below the pre COVID-19 level as of the end of May.
House-bound consumers turned to e-commerce for much more of their shopping needs, including groceries. In a a survey of 1,100 adult consumers, 60 percent of respondents said that since COVID-19, they are doing more shopping online than in-store, vs. 44 percent before COVID-19. Two-thirds of respondents expect to continue purchasing items they now buy online after the coronavirus is under control.14
COVID-19 has clearly put e-commerce adoption on a faster trajectory. In 2019, UBS had projected that e-commerce would reach 20.8 percent of total retail sales in 2023, up from 14.4 in 2018. But with accelerated adoption during and after the COVID-19 lockdown, UBS now expects that e-commerce will jump up to 25 percent of U.S. retail sales in 2025.15
Even at this accelerated rate of adoption, the U.S. would only be catching up with other nations. In the U.K, e-commerce penetration reached 22 percent in 2019 and in China, e-commerce accounted for more than a third of retail sales.16 It is worth noting that China became the world leader in e-commerce (as a share of total retail) partly as a result of the SARS epidemic in 2003.17
12 Source: Safegraph; C&R Research13 Source: KPMG survey.14 Source: Dan Berthiaume, “Survey: Three in four consumers try new online retailers duiring COVID-19,” Chain Store Age, June 11, 2020.15 Source: Retail and Internet UBS Interactive Model: More eCommerce Share Gains Ahead, November 5, 2019; U.S. Retail We Expect 100K Stores Will Close,
UBS Securities, April 20, 2020.16 Source: eMarketer.17 Source: How SARS led to the birth of China ecommerce, Business Insider, Feb. 7, 2020.
Exhibit 7. COVID-19 reduced shopping trips by an estimated 60 percent
Foot Traffic for Select Retail Venue Types (US, % Change Relative to Baseline)
Source(s): Safegraph
0.0
0.2
0.4
0.6
0.8
1.0
1.2
1.4
1/18
1/16
1/24
2/01
2/09
2/17
2/25
3/04
3/12
3/20
3/28
4/05
4/13
4/21
4/29
5/07
5/15
5/23
General merchandise Supermarkets Weighted average Shopping malls
7© 2020 KPMG LLP, a Delaware limited liability partnership and the U.S. member firm of the KPMG network of independent member firms affiliated with KPMG International Cooperative (“KPMG International”), a Swiss entity. All rights reserved.

It is also important to note that not all new e-commerce sales have eliminated shopping trips. To continue operating during COVID-19, stores and restaurants instituted curbside pickup for online orders. These service options could continue. Before COVID-19, the order online/pickup in store model had already become a significant part of the business for chains such as Target, Home Depot and Lowe’s, representing about 60 percent of their e-commerce sales.18
To estimate how home-delivery of goods bought online could impact U.S. VMT, we analyzed historical e-commerce penetration rates and the relationship to changes in shopping trips. The result: We estimate that the growing
reliance on e-commerce could result in a sustained reduction of shopping-trip VMT of 40 billion to 130 billion miles per year (see “Do the math: How we estimated reduced shopping VMT”).
We also considered the additional miles that are being added to total VMT by the rising volume of home deliveries. In the first quarter of 2020, Amazon parcel deliveries jumped by 50 percent. UPS reported a 10 percent increase in driver miles and a 15 percent increase in stops.19 Based on our analysis, we estimate that the increase in use of e-commerce post COVID-19 could generate 5 billion to 18 billion miles per year in package delivery VMT.
18 Source: Company financial reports and analyst presentations (Loewe’s, Target and Walmart). 19 Source: Company financial reports
8© 2020 KPMG LLP, a Delaware limited liability partnership and the U.S. member firm of the KPMG network of independent member firms affiliated with KPMG International Cooperative (“KPMG International”), a Swiss entity. All rights reserved.
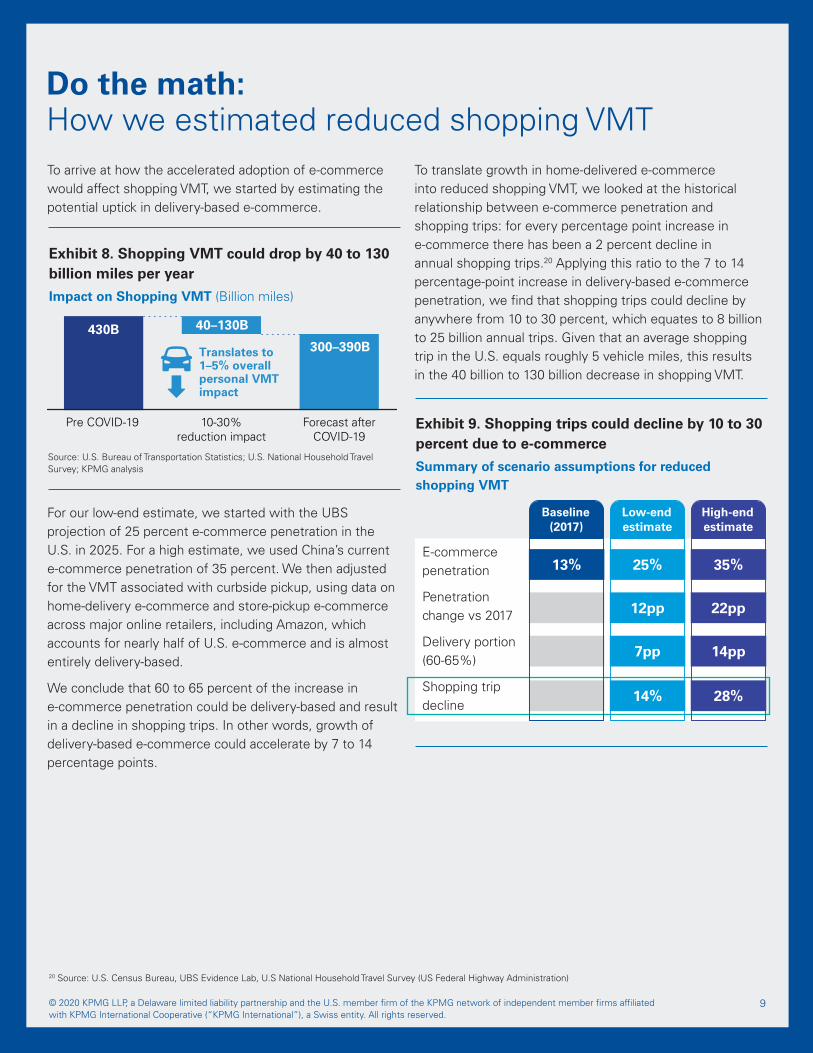
Do the math: How we estimated reduced shopping VMTTo arrive at how the accelerated adoption of e-commerce would affect shopping VMT, we started by estimating the potential uptick in delivery-based e-commerce.
For our low-end estimate, we started with the UBS projection of 25 percent e-commerce penetration in the U.S. in 2025. For a high estimate, we used China’s current e-commerce penetration of 35 percent. We then adjusted for the VMT associated with curbside pickup, using data on home-delivery e-commerce and store-pickup e-commerce across major online retailers, including Amazon, which accounts for nearly half of U.S. e-commerce and is almost entirely delivery-based.
We conclude that 60 to 65 percent of the increase in e-commerce penetration could be delivery-based and result in a decline in shopping trips. In other words, growth of delivery-based e-commerce could accelerate by 7 to 14 percentage points.
To translate growth in home-delivered e-commerce into reduced shopping VMT, we looked at the historical relationship between e-commerce penetration and shopping trips: for every percentage point increase in e-commerce there has been a 2 percent decline in annual shopping trips.20 Applying this ratio to the 7 to 14 percentage-point increase in delivery-based e-commerce penetration, we find that shopping trips could decline by anywhere from 10 to 30 percent, which equates to 8 billion to 25 billion annual trips. Given that an average shopping trip in the U.S. equals roughly 5 vehicle miles, this results in the 40 billion to 130 billion decrease in shopping VMT.
Exhibit 9. Shopping trips could decline by 10 to 30 percent due to e-commerce
Summary of scenario assumptions for reduced shopping VMT
E-commerce penetration
Penetration change vs 2017
Delivery portion (60-65%)
Shopping trip decline
Baseline (2017)
Low-end estimate
High-end estimate
13% 25% 35%
12pp 22pp
7pp 14pp
14% 28%
20 Source: U.S. Census Bureau, UBS Evidence Lab, U.S National Household Travel Survey (US Federal Highway Administration)
Exhibit 8. Shopping VMT could drop by 40 to 130 billion miles per year
Impact on Shopping VMT (Billion miles)
Pre COVID-19 10-30%reduction impact
Forecast afterCOVID-19
430B 40–130B
300–390BTranslates to1–5% overallpersonal VMTimpact
Source: U.S. Bureau of Transportation Statistics; U.S. National Household Travel Survey; KPMG analysis
9© 2020 KPMG LLP, a Delaware limited liability partnership and the U.S. member firm of the KPMG network of independent member firms affiliated with KPMG International Cooperative (“KPMG International”), a Swiss entity. All rights reserved.

Forces that could raise consumer VMTWhile our research shows that VMT will decline based on the quantifiable effects of new work and shopping habits, there are other variables at play that could raise VMT. Many of these variables involve trade-offs between safety, cost, conveniences and speed that will be reconsidered in the post-COVID-19 context and are not easy to quantify.
— Will the concentration of COVID-19 in urban areas prompt more city dwellers to move to the suburbs where they will need a car?
— Will people switch from public transit to cars for safety reasons? In March, U.S. transit ridership declined 90 percent (Exhibit 10). According to a KPMG survey, only 60 percent of transit users expect to go back to using public transit when social-distancing rules are relaxed. Nearly a quarter of transit riders said they would switch to driving their own cars or carpooling; 15 percent plan to use ride-sharing services. To put this in perspective, even though mass transit is critical in some large cities, only about 5 percent of U.S. workers commute on mass transit.21
— Will riders come back to mobility services such as Uber and Lyft? Mobility as a Service (MaaS) ridership declined over health concerns during the COVID-19 lockdown. With restrictions easing, Lyft is already reporting an uptick in ridership.22 When a coronavirus vaccine arrives, we expect MaaS to return to its previous growth trajectory.23
21 Source: U.S. Household Survey22 Source: Micah Maidenberg, “Lyft Says Demand Picking Up as COVID-19 Restriction Ease,” The Wall Street Journal, June 2, 2020.23 Source: KPMG
Exhibit 10. How enduring will the drop in public transit usage be?
Transit ridership dropped 90 percent from March to May
More than 40% of transit riders indicated intent to shift to alternate modes following COVID-19, primarily personal vehicles and ride sharing
0%
20%
40%
60%
80%
100%
3/02 3/09 3/16 3/23 3/30 4/06 4/13 4/20 4/27 5/04 5/11
San Francisco (BART) Washington DC (WMTA) Boston (MBTA)
San Francisco closed down earlier than east coast cities
Source(s): BART, WMATA, MBTA
59%
18% 15% 6% 3%
Continueusing transit
Shift topersonalvehicle
Shift toride sharing
Shift tocarpool
Other
Combined 24% of transit riders to switchto personal vehicle travel
Source(s): KPMG Consumer Survey, N=34
10© 2020 KPMG LLP, a Delaware limited liability partnership and the U.S. member firm of the KPMG network of independent member firms affiliated with KPMG International Cooperative (“KPMG International”), a Swiss entity. All rights reserved.

What a long-term decline in VMT would mean for businessThe effects of COVID-19 will be felt for years. The response to the virus has accelerated powerful behavioral changes that will continue to shape how Americans use automobiles. We believe the changes in commuting and
e-commerce are here to stay and that the combined effect of reduced commuting and shopping journeys could be as much as 270 billion fewer vehicle miles traveled each year in the U.S. (Exhibit 11).
These changes can have substantial implications for businesses—most importantly for automotive demand. Today, the average number of vehicles per U.S. household is 1.97. But with fewer commuter trips and shopping excursions, some car owners may decide they no longer need a second vehicle. With the projected decline in VMT,
we estimate that average car ownership could dip to 1.87 vehicles per household. That’s a seemingly small decline. But in a total U.S. fleet of more than 250 million light vehicles, that would mean as many as 14 million fewer cars would be needed (see Do the math: How we estimated potential for lower car ownership).
Exhibit 11. Total impact could be 110 to 270 billion lower U.S. VMT
Estimated potential decline in VMT (Billion miles, light vehicles only)
110-270billion miles
Pre COVID-19baseline
Commute VMTdecline
Shopping VMTdecline
Post COVID-19estimate
2,950B 70-140B
40-130B
2,680–2,840B
-3.7% ~ -9.2%
???
Countervailingimpacts
11© 2020 KPMG LLP, a Delaware limited liability partnership and the U.S. member firm of the KPMG network of independent member firms affiliated with KPMG International Cooperative (“KPMG International”), a Swiss entity. All rights reserved.

The upshot: automakers, retailers and other players in automotive will likely need to prepare for a decline in passenger vehicle sales. Falling VMT would also affect used-car sales and aftermarket parts and service: less driving also means less wear and tear on vehicles, as well as a decline in traffic accidents, cutting into the lucrative collision parts business.24 Auto aftermarket suppliers will likely see a significant falloff in demand for replacement parts and maintenance services.
On the positive side, a rise in home deliveries will drive demand for commercial vehicles. This may accelerate adoption of innovative delivery van designs from existing suppliers and startups. Many of these feature electric power trains and some have autonomous control, eliminating the need for a driver and reducing the risk of infection. Startups such as Nuro and Starship Technologies are already well along in developing such vehicles.
24 For more on the impact on aftermarket sales, see: Stop-start: Auto aftermarket sales have stalled because of COVID-19, but a demand surge is on the horizon.
12© 2020 KPMG LLP, a Delaware limited liability partnership and the U.S. member firm of the KPMG network of independent member firms affiliated with KPMG International Cooperative (“KPMG International”), a Swiss entity. All rights reserved.
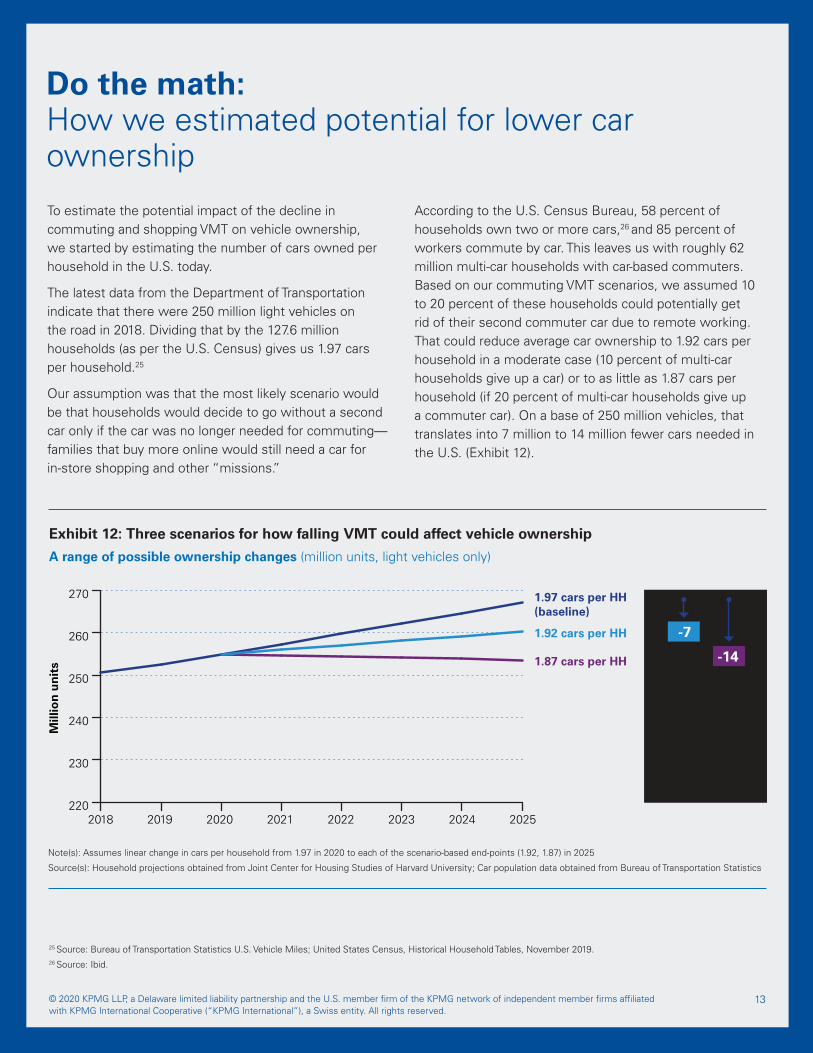
Do the math: How we estimated potential for lower car ownership
To estimate the potential impact of the decline in commuting and shopping VMT on vehicle ownership, we started by estimating the number of cars owned per household in the U.S. today.
The latest data from the Department of Transportation indicate that there were 250 million light vehicles on the road in 2018. Dividing that by the 127.6 million households (as per the U.S. Census) gives us 1.97 cars per household.25
Our assumption was that the most likely scenario would be that households would decide to go without a second car only if the car was no longer needed for commuting—families that buy more online would still need a car for in-store shopping and other “missions.”
According to the U.S. Census Bureau, 58 percent of households own two or more cars,26 and 85 percent of workers commute by car. This leaves us with roughly 62 million multi-car households with car-based commuters. Based on our commuting VMT scenarios, we assumed 10 to 20 percent of these households could potentially get rid of their second commuter car due to remote working. That could reduce average car ownership to 1.92 cars per household in a moderate case (10 percent of multi-car households give up a car) or to as little as 1.87 cars per household (if 20 percent of multi-car households give up a commuter car). On a base of 250 million vehicles, that translates into 7 million to 14 million fewer cars needed in the U.S. (Exhibit 12).
25 Source: Bureau of Transportation Statistics U.S. Vehicle Miles; United States Census, Historical Household Tables, November 2019.26 Source: Ibid.
Exhibit 12: Three scenarios for how falling VMT could affect vehicle ownership
A range of possible ownership changes (million units, light vehicles only)
Note(s): Assumes linear change in cars per household from 1.97 in 2020 to each of the scenario-based end-points (1.92, 1.87) in 2025
Source(s): Household projections obtained from Joint Center for Housing Studies of Harvard University; Car population data obtained from Bureau of Transportation Statistics
Mill
ion
unit
s
1.97 cars per HH(baseline)
1.92 cars per HH
1.87 cars per HH
Potential vehicle population reduction (millions)
-7
-14
220
230
240
250
260
270
2018 2019 2020 2021 2022 2023 2024 2025
13© 2020 KPMG LLP, a Delaware limited liability partnership and the U.S. member firm of the KPMG network of independent member firms affiliated with KPMG International Cooperative (“KPMG International”), a Swiss entity. All rights reserved.

Conclusion COVID-19 is the defining event of 2020—and will continue to shape society, politics, and business for years to come. It has brought about rapid and widespread changes in how people work and shop. In this research, we have examined how COVID-19 has disrupted normal driving routines and how this could lead to long-term changes in
how Americans use cars. The impact of fewer commuting and shopping trips—a possible drop of 3.7 to 9.2 percent drop in U.S. VMT— could have widespread effects, including a direct hit on demand for new and used cars. The automotive business needs to understand and prepare for this unexpected challenge.
Fundamental shifts in consumer behavior are altering Americans’ need to drive, the distance they travel, and the mode of transportation they choose. This compels executives in the automotive industry to revisit historical approaches and assumptions underlying their demand forecasts and strategic plans. To compete effectively in the New Reality, it will be necessary for automotive executives to understand the unprecedented level of uncertainty and the need to build additional innovation, agility, and flexibility in their businesses. They can achieve this by analyzing a broad set of drivers of future changes in personal travel and vehicle miles—beyond the commute and shopping trips that we discuss in this white paper.
Our dedicated KPMG Automotive Strategy team can help you be successful in navigating the uncertain future by leveraging our long-standing history of insights and innovation and the power of data and analytics.
We can help you to:
Analyze a broader set of potential drivers of
changes and develop future scenarios
Refine or rebuild your demand forecast approach
and framework
Consider implications of demand scenarios for your
current product portfolio
Determine the winning portfolio of products
and services
How KPMG can help
14© 2020 KPMG LLP, a Delaware limited liability partnership and the U.S. member firm of the KPMG network of independent member firms affiliated with KPMG International Cooperative (“KPMG International”), a Swiss entity. All rights reserved.

Authors
Jono is a principal in KPMG’s Strategy practice. Specializing in growth and innovation strategy, he has more than 20 years of experience in product and technology strategy. He currently serves the automotive and aerospace industries. Prior to joining KPMG, Jono was a research scientist and mathematician working extensively with unmanned and autonomous systems and the underlying mapping, guidance, sensors and high-performance computing capabilities.
Jono Anderson
Tom is the national strategy leader for the KPMG Industrial Manufacturing practice. With 30 years of consulting experience, he focuses on supply and manufacturing strategy, operations turnaround, purchasing, and supply base management, with a focus on automotive, aerospace, and industrials.
Gary is global lead for the KPMG Automotive practice. Gary has more than 25 years of business experience, including over 16 years in the automotive industry. He has advised numerous domestic and multinational companies in strategy, mergers, acquisitions, divestitures and joint ventures. For the past seven years he has focused on the intersection of technology and the automotive industry, developing groundbreaking research on autonomous vehicles, mobility services connected cars and automotive retailing.
Bala is a Managing Director in KPMG’s Strategy practice, with more than 18 years of experience in helping companies develop their growth strategies. He specializes in the automotive sector and primarily works with automakers, Tier 1 suppliers, and investors. His work has focused on helping clients plan for disruptions in automotive businesses, including autonomy, mobility on demand, connected vehicles and electrification.
Thank youWe would like to thank KPMG colleagues who contributed this work: Griffin Glenn, John Jullens, Serena Crivellaro, Kenneth Fodor, Geoffrey Lewis, John Hart, and Tara Thompson
Yoshi is a Managing Director in the KPMG Strategy practice, with more than 20 years of experience in growth and innovation strategy, new market entry, M&A strategy and commercial due diligence. Yoshi assists leading U.S. and global companies in a variety of industrial manufacturing subsectors including automotive OEMs, Tier-1 suppliers, automotive retailers and aftermarket companies, as well as mobility services providers.
Yoshi Suganuma
Bala Lakshman
Todd is a principal in the KPMG Strategy practice. He has more than 25 years of experience in strategy and corporate. He currently primarily serves the automotive industry, providing consultation services to passenger and commercial vehicle original equipment manufacturers (OEMs), Tier 1 suppliers, and emerging players in the industry.
Gary Silberg Tom Mayor Todd Dubner
Nehal is a Manager in the KPMG Strategy practice, with more than 7 years of experience in growth, innovation and market entry strategy. He currently serves a variety of industrial manufacturing clients and specializes in the automotive sector.
Nehal Doshi
15© 2020 KPMG LLP, a Delaware limited liability partnership and the U.S. member firm of the KPMG network of independent member firms affiliated with KPMG International Cooperative (“KPMG International”), a Swiss entity. All rights reserved.

16© 2020 KPMG LLP, a Delaware limited liability partnership and the U.S. member firm of the KPMG network of independent member firms affiliated with KPMG International Cooperative (“KPMG International”), a Swiss entity. All rights reserved.
The information contained herein is of a general nature and is not intended to address the circumstances of any particular individual or entity. Although we endeavor to provide accurate and timely information, there can be no guarantee that such information is accurate as of the date it is received or that it will continue to be accurate in the future. No one should act upon such information without appropriate professional advice after a thorough examination of the particular situation.
The KPMG name and logo are registered trademarks or trademarks of KPMG International.
© 2020 KPMG LLP, a Delaware limited liability partnership and the U.S. member firm of the KPMG network of independent member firms affiliated with KPMG International Cooperative (“KPMG International”), a Swiss entity. All rights reserved. DASD-2020-2073
Some or all of the services described herein may not be permissible for KPMG audit clients and their affiliates or related entities.
kpmg.com/socialmedia
Related thought leadership:
The future of automotive retailing
Smarter cars, but more distracted drivers, too
EV plan B?
Gary Silberg Partner, Strategy 312-665-1916 [email protected]
Bala Lakshman Managing Director, Strategy 214-840-4005 [email protected]
Tom Mayor Principal, Strategy 216-875-8061 [email protected]
Yoshi Suganuma Managing Director, Strategy 212-872-7821 [email protected]
Jono M Anderson Principal, Corporate Strategy 858-750-7330 [email protected]
Todd Dubner Principal, Corporate Strategy 212-954-7359 [email protected]
Nehal Doshi Manager, Strategy 484-838-9493 [email protected]
For more information, contact us:


![State of Augmented Reality, Virtual Reality and Mixed Reality · State of Augmented Reality, Virtual Reality and Mixed Reality [Microsoft Hololen] [Ready Player One] Augmented Reality](https://img.pdfslide.us/doc/110x75/5f82ab6da2d89130b90d78c7/state-of-augmented-reality-virtual-reality-and-mixed-reality-state-of-augmented.jpg)