Embed Size (px)
Citation preview

Automotive Properties REIT January 2018

DISCLAIMER
2
FORWARD-LOOKING STATEMENTS
Certain statements contained in this presentation constitute forward-looking information within the meaning of securities laws. Forward-looking informationmay relate to the REIT’s future outlook and anticipated events or results and may include statements regarding the financial position, business strategy,budgets, litigation, projected costs, capital expenditures, financial results, taxes, plans and objectives of or involving the REIT. Particularly, statements regardingfuture results, performance, achievements, prospects or opportunities for the REIT or the real estate or automotive dealership industry are forward-lookingstatements. The REIT has based these forward-looking statements on factors and assumptions about future events and financial trends that it believes mayaffect its financial condition, results of operations, business strategy and financial needs, including that the Canadian economy will remain stable over the next12 months, that inflation will remain relatively low, that interest rates will remain stable, that tax laws remain unchanged, that conditions within theautomotive dealership real estate industry and the automotive dealership industry generally, including competition for acquisitions, will be consistent with thecurrent climate, that the Canadian capital markets will provide the REIT with access to equity and/or debt at reasonable rates when required and that theDilawri Organization will continue its involvement with the REIT. Although the forward-looking statements contained in this presentation are based uponassumptions that management believes are reasonable based on information currently available to management, there can be no assurance that actual resultswill be consistent with these forward-looking statements. Forward-looking statements necessarily involve known and unknown risks and uncertainties, many ofwhich are beyond the REIT’s control, that may cause the REIT’s or the industry’s actual results, performance, achievements, prospects and opportunities infuture periods to differ materially from those expressed or implied by such forward-looking statements. The forward-looking statements made in thispresentation relate only to events or information as of the date of this presentation. Except as required by law, the REIT and Dilawri undertake no obligation toupdate or revise publicly any forward-looking statements, whether as a result of new information, future events or otherwise, after the date on which thestatements are made or to reflect the occurrence of unanticipated events. Please refer to “Forward-Looking Statements” in the REIT’s regulatory filings.
NON-IFRS MEASURES
This presentation makes reference to certain non-IFRS measures. Funds from operations (‘‘FFO’’), adjusted funds from operations (‘‘AFFO’’), net operatingincome (‘‘NOI’’) and cash net operating income (‘‘Cash NOI’’) are key measures of performance used by real estate businesses. However, such measures are notdefined by IFRS and do not have standardized meanings prescribed by IFRS. The REIT believes that AFFO is a key measure of economic earnings performanceand is indicative of the REIT’s ability to pay distributions from earnings, while FFO, NOI and Cash NOI are important measures of operating performance and theperformance of real estate properties. The IFRS measurement most directly comparable to FFO, AFFO, NOI and Cash NOI is net income. Please refer to “Non-IFRS Measures” in the REIT’s regulatory filings.

REIT OVERVIEW
3
PORTFOLIO WELL POSITIONED TO GENERATE A RELIABLE STREAM
OF CASH DISTRIBUTIONS
• Canada’s only public vehicle focused on consolidating automotive dealership real estate properties
• High-quality portfolio of strategically located dealership properties across Canada, representing 29 global manufacturers / brands
• Long-term, triple-net leases with fixed rent escalators provide stable, predictable cash flows
• Strong, independent board and REIT-friendly management agreement (fixed fee for forecast period and cost-recovery thereafter, no termination fee, no acquisition fees)
• Significant growth potential with current acquisition capacity of approximately $75 million
CAPITAL MARKET PROFILE
4
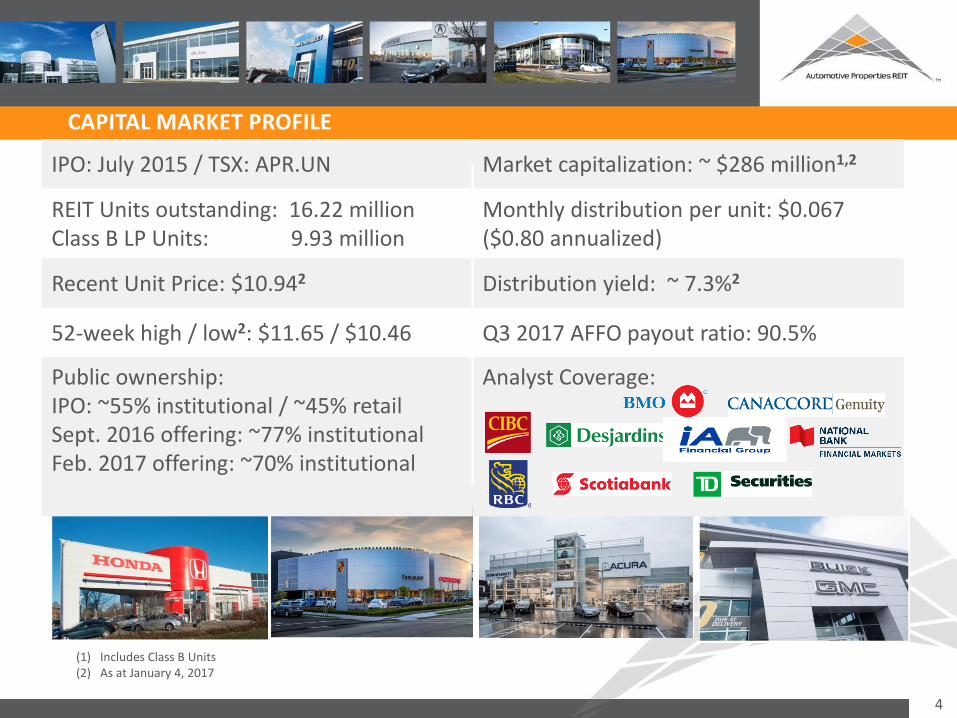
IPO: July 2015 / TSX: APR.UN Market capitalization: ~ $286 million1,2
REIT Units outstanding: 16.22 millionClass B LP Units: 9.93 million
Monthly distribution per unit: $0.067 ($0.80 annualized)
Recent Unit Price: $10.942 Distribution yield: ~ 7.3%2
52-week high / low2: $11.65 / $10.46 Q3 2017 AFFO payout ratio: 90.5%
Public ownership: IPO: ~55% institutional / ~45% retailSept. 2016 offering: ~77% institutionalFeb. 2017 offering: ~70% institutional
Analyst Coverage:
(1) Includes Class B Units(2) As at January 4, 2017

CANADIAN AUTOMOTIVE DEALERSHIP INDUSTRY1
5
REPRESENTING 6.7% OF 2016 GDP, THE AUTOMOTIVE RETAIL SALES INDUSTRY IS CANADA’S LARGEST RETAIL SEGMENT
($billions)
Retail Sales
Auto industry’s proportion of Canada’s overall retail sales of
products and merchandise in 2016
25%
Canadian New Motor Vehicle Sales (YTD # of units sold, 2017 and 2016)2
+ 7.0%YTD new unit sales growth
after 10 months in 2017 compared to 20162
5664 65 70 74 78 83 83 83 87 92 96 94
8896 100 105
112120
128134
1996 1997 1998 1999 2000 2001 2002 2003 2004 2005 2006 2007 2008 2009 2010 2011 2012 2013 2014 2015 2016
1.79 MillionRecord YTD unit auto sales in
Canada in first ten months of 2017
(1) Source: Statistics Canada(2) As at October 31, 2017
0
100,000
200,000
300,000
400,000
500,000
600,000
700,000
Atl. Provinces QC ON MB SK AB BC & Territories
2016 2017

AUTOMOTIVE INDUSTRY EVOLUTION
• Consumer buying habits – high online consumer knowledge
• Electric Vehicles – low penetration, expected to increase • Implication on dealer infrastructure
• Automated vs. Autonomous • Automated - Safety/technology expected to be regulated
• Autonomous – Cultural shift
• Other Influencers • Ride Sharing Platforms – Uber, Lyft
6
DEALER DEMOGRAPHICS AND INDUSTRY EVOLUTION WILL ACCELERATE CONSOLIDATION

7
OPPORTUNITY TO CONSOLIDATE HIGHLY FRAGMENTED INDUSTRY
7
50%
15%
35%
Proportion of Canada’s ~ 3,500 Auto Dealerships Owned by Size of Ownership Group1
5 or more Dealerships
Single Dealership
2-4 Dealerships
10 Dealership Groups: Only 10.1% of the Market
(1) Source: DesRosiers Automotive Consultants Inc.(2) Information based on publicly available information as at May 20, 2016(3) Denotes current tenants of the REIT(4) Excludes collision centres and RV/Marine dealerships
Company Dealerships% of Total
Dilawri Group (3) 63 1.8%
AutoCanada(2) 59 1.5%
Go Auto(2)(3)(4) 40 1.1%
Peformance Group 33 0.8%
Albi Group 29 0.8%
Zanchin Automotive Group(2) 27 0.8%
Steele Automotive Group
26 0.8%
Gabriel-Prestige-President Group(2) 26 0.7%
O’Regan Group(2) 26 0.7%
Murray Auto Group(2) 25 0.7%
Top 10 subtotal 355 10.1%
Other 3,154 89.91%
Total 3,508(1) 100.0%

PARTNERING WITH AUTOMOTIVE PROPERTIES REIT
• Succession planning• Monetization of embedded capital• Wealth diversification / Tax efficient Class B LP Units • Invest in core business
8
PROVIDING FINANCIAL LIQUIDITY TO AUTOMOTIVE DEALERSHIP OWNERS TO
SUPPORT THE ADVANCEMENT OF THEIR STRATEGIC OBJECTIVES
EstablishedDealers
Industry Consolidators
• Redeploy capital from underlying real estate in existing portfolio• Fund acquisition program / expand presence in emerging institutional asset class• Realize higher investment returns from core business • Strengthen competitive position / expedite economies of scale
Consolidation of Canada’s fragmented dealership industry provides ample partnership opportunities

SIGNIFICANT GROWTH SINCE IPO
9
At IPO (July 2015) Current Change
Properties1 26 39 +50%
Number of Brands1 26 29 +11%
GLA1 ~1.0 million sq. ft. ~1.4 million sq. ft. +40%
Yield2 8.00% 7.3% (0.7%)
Number of Units Outstanding3 18,053,253 26,149,253 +45%
Market Capitalization ($millions)2 $180.3 $286.1 +59%
Debt ($millions)4 $193.8 $234.8 +21%
Investment Properties FMV ($millions)4 $357.7 $510.3 +43%
Loan-to-Value4 54.2% 45.8% (8.4%)
Implied Cap Rate4 6.5% 6.5% ---
(1) As at December 31, 2017(2) As at January 4, 2018(3) Includes Class B units(4) As at September 30, 2017

10
• Modern, best-in-class dealerships
• 39 properties, 53 dealership/service locations on > 126 acres1
• ~ 1.4 million square feet of Gross Leasable Area (“GLA”) 1
GROWTH DRIVERS: PORTFOLIO EXPANSION AND RENT INCREASES
PORTFOLIO OVERVIEW
GreaterVancouver
Calgary
Regina
Edmonton
GreaterToronto
Greater Montreal
• > $164.8 million in acquisitions since IPO (13 properties) 1
• Acquisitions enhance tenant, brand and geographic diversification
(1) As at December 31, 2017

# of REIT Locations7000004000002000004000002000003000003000004000001000005000004000002000001000011
PORTFOLIO DIVERSIFICATION
11
Other
PROPERTIES BENEFIT FROM PRIME LOCATIONS IN STRATEGIC URBAN MARKE TS, AND BROAD DIVERSIFICATION OF INDUSTRY-LEADING BRANDS
Manufacturer / Brand (By % of Dealership Rent)1
(1) As at December 31, 2017
Number of Properties1 By GLA1
GTA
39.1%
Regina
12.9%
Calgary
16.6%
GVA
10.8%
GMA
13.3%
Edmonton
7.3%
17.5%
11.2%9.3% 9.0%
5.9% 5.7% 5.6% 5.2% 4.2% 4.1% 3.7% 3.4% 2.8%
12.4%
GVA6
Calgary5
Regina8
GMA4
Edmonton5
GTA11

MANUFACTURER AND BRAND DIVERSIFICATION1
12
Brands by Market Segment (% of Cash NOI from Dealership Properties)1
Manufacturers by Region(% of Cash NOI from Dealership Properties)1
STRONG MIX OF LUXURY AND MASS MARKET BRANDS
(4)
(2)
(1) As at December 31, 2017(2) Mass Market segment includes: Chrysler, Ford, General Motors, Kia, Nissan (including Nissan Infiniti), Honda, Hyundai, Mazda, Mitsubishi, Toyota and Volkswagen(3) Luxury segment includes: Acura, Audi, BMW and Infiniti(4) Ultra-Luxury segment includes: Aston Martin, Bentley, Lamborghini, Land Rover, Lincoln, Porsche, Maserati, McLaren and Mercedes-Benz
Asia52%Europe
40%
North America
8%Mass
Market54%
Luxury34%
Ultra-Luxury12%
2
4
3

• 63 franchised automotive dealerships, representing 29 brands
• Presence in QC, ON, SK, AB, BC
• REIT has the first right to acquire from Dilawri development and acquisition pipeline
- Over the last six years, Dilawri has, on average opened or acquired five new automotive dealerships per year, including two to three automotive dealership properties
• Pro forma adjusted rent coverage ratio of 3.2x as at December 31, 2016 (LTM)
• Pro forma adjusted rent coverage ratio of 3.4x as at September 30, 2017 (LTM)
$1,016
$1,324
$1,641
$2,000
$2,400
2012 2013 2014 2015 2016
13
ALIGNMENT OF INTERESTS THROUGH DILAWRI’S ~38% EFFECTIVE
OWNERSHIP INTEREST IN THE REIT
Dilawri 5-Year Historical Revenues ($millions)
EBITDA $49.4 $63.8 $75.2 $76.6 $72.8
STRONG LEAD TENANT
CAGR of ~10%

14
RELIABLE LONG-TERM CASH FLOW, WITH CONTRACTED, LONG-TERM
RENTAL INCOME GROWTH AND ONLY ONE LEASE EXPIRATION BEFORE 2026
LEASING PROFILE1
• Triple-net leases
• All leases are indemnified by parent company of (Dilawri Group, Go Auto and Pfaff Automotive Partners)
• Weighted average term of ~13.1 years
• Fixed 1.5% annual rent escalator for the 32 Dilawri properties over the next 8.7 - 17.5 years
• Fixed 1.0% annual rent escalators for the Go Mazda property (Porsche JLR Edmonton +1% annual commencing 2020)Lease Maturity Schedule2
(1) As at September 30, 2017(2) Based on 12-month rolling average as at September 30, 2017
3.5%4.6%
6.7%5.7%
9.6%
14.5%14.0%
14.6%
8.3%
11.3%
7.2%
-
1.0
2.0
3.0
4.0
5.0
'16 '17 '18 '19 '20 '21 '22 '23 '24 '25 '26 '27 '28 '29 '30 '31 '32 '33 '34 '35-
5%
10%
15%
20%
25%
% o
f C
ash
NO
I

SUMMARY OF ACQUISITIONS1
15
Last 24 Months
• 13 properties
• $164.8 million combined purchase price
• Four transactions worth $71.4 million with third party
dealership tenants
• Adds ~467,000 square feet of GLA to portfolio
• Acquisitions indirectly funded by two fully-subscribed
equity offerings totaling ~$86 million
• Enhanced brand, geographic and tenant diversification
• Accretive to AFFO per Unit
(1) As at December 31, 207

ACQUISITIONS WITH DILAWRI AS OPERATING TENANT
16
Mercedes-Benz West IslandDollard-des-Ormeaux, QCAcquired: December 2016Purchase Price: $20.3 million
Toyota WoodlandMontreal, QCAcquired: December 2015Purchase Price: $7.2 million
Audi BarrieBarrie, ONAcquired: January 2016Purchase Price: $11.1 million
St. Bruno Audi & VolkswagenSt. Bruno, QCAcquired: December 2016Purchase Price: $14.3 million
Heritage HondaCalgary, ABAcquired: April 2017Purchase Price: $23.6 million
Barrie VolkswagenBarrie, ONAcquired: March 2017Purchase Price: $8.9 million
Mazda des SourcesDorval, QCAcquired: December 2017Purchase Price: $8.0 million

ACQUISITIONS WITH THIRD PARTY DEALERSHIP TENANTS1
17
Go MazdaEdmonton, ABAcquired: March 2017Purchase Price: $8.0 million
Ericksen InfinitiEdmonton, ABAcquisition PendingPurchase Price: $23.2 million for three-property portfolio
Southtown HyundaiEdmonton, ABAcquisition PendingPurchase Price: $23.2 million for three-property portfolio
Kentwood Ford (service compound)Edmonton, ABAcquisition PendingPurchase Price: $23.2 million for three-property portfolio
Porsche Centre / Jaguar Land RoverEdmonton, ABAcquired: December 2015Purchase Price: $23.0 million
Pfaff AudiVaughan, ONAcquired: September 2016Purchase Price: $17.2 million
(1) As at December 31, 207

18
YTD 2017 FINANCIAL REVIEW
($thousands, except per unit amounts and as otherwise noted) Nine months ended September 30, 2017
Nine months ended September 30, 2016
Revenue from investment properties $ 30,947 $ 25,147
Cash NOI 24,047 19,729
Same property Cash NOI 19,407 19,130
FFO 18,882 14,881
AFFO 17,015 13,031
Per Unit Amounts1
Distributions $ 0.603 $ 0.603
FFO (diluted) 0.737 0.817
AFFO (diluted) 0.664 0.715
FFO payout ratio 81.8% 73.8%
AFFO payout ratio 90.8% 84.3%
(1) Year-over-year declines in FFO per Unit and AFFO per Unit were primarily attributable to the dilutive effect of the REIT’s equity offering in February 2017, which resulted in a lower Debt to GBV of 45.8%

Q3 2017 FINANCIAL REVIEW
19
8,538
6,756
10,599
6,853
0
2,000
4,000
6,000
8,000
10,000
12,000
Property Revenue Same Property Revenue
Property Revenue
2016 2017
6,649 6,612
8,293
6,709
$0
$2,000
$4,000
$6,000
$8,000
Cash NOI Same Property Cash NOI
Cash NOI
2016 2017
4,9904,375
6,4055,811
$0
$2,000
$4,000
$6,000
$8,000
FFO AFFO
FFO and AFFO
2016 2017
($000s)
($000s)
($000s)
Per Unit Amounts2 Q3 2017 Q3 2016
Distributions $0.201 $0.201
FFO (diluted) $0.244 $0.269
AFFO (diluted) $0.222 $0.236
FFO Payout Ratio 82.4% 74.7%
AFFO Payout Ratio 90.5% 85.2%
(1) Same Property Revenue excludes straight line rent adjustments(2) Year-over-year declines in FFO per Unit and AFFO per Unit were primarily attributable to the dilutive effect of the REIT’s equity offering in February 2017, which resulted in a lower
Debt to GBV of 45.8%
1

20
BALANCE SHEET METRICS
($thousands, unless otherwise noted) At September 30, 2017 At September 30, 2016
Total assets $514,618 $430,294
Units outstanding (includes Class B LP Units) 26,149,253 21,894,253
Weighted average effective interest rate on debt 3.35% 3.15%
Proportion of debt at fixed rates 94% 90%
Weighted average interest term remaining through swaps (years)
5.6 5.2
Interest coverage ratio 3.9x 3.4x
Debt to GBV: 45.8% 48.2%
21
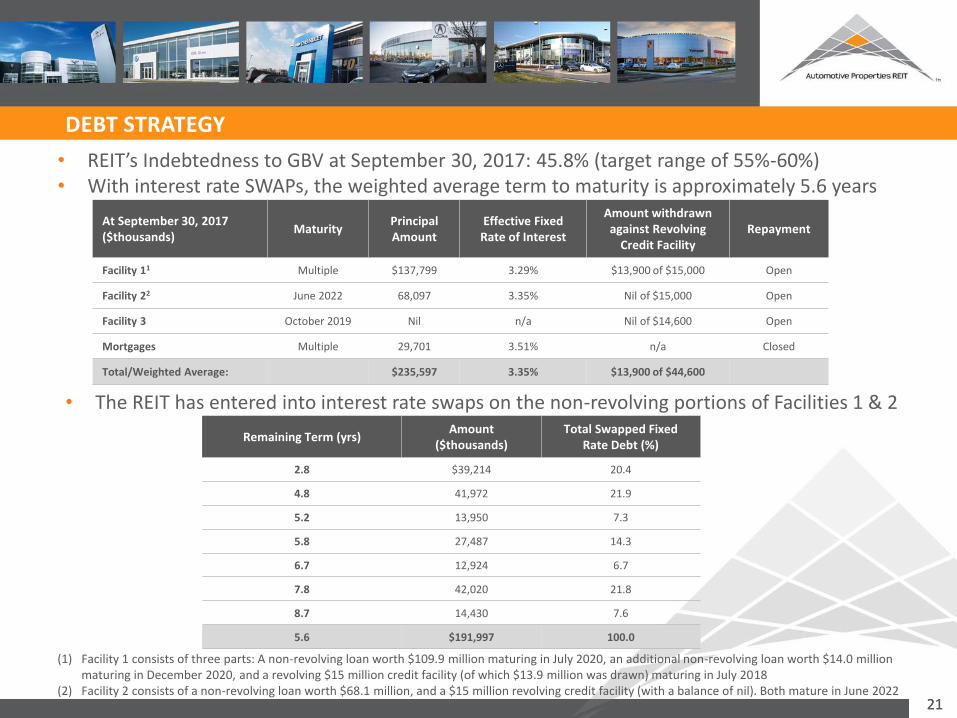
• REIT’s Indebtedness to GBV at September 30, 2017: 45.8% (target range of 55%-60%)• With interest rate SWAPs, the weighted average term to maturity is approximately 5.6 years
At September 30, 2017($thousands)
MaturityPrincipal Amount
Effective Fixed Rate of Interest
Amount withdrawn against Revolving
Credit FacilityRepayment
Facility 11 Multiple $137,799 3.29% $13,900 of $15,000 Open
Facility 22 June 2022 68,097 3.35% Nil of $15,000 Open
Facility 3 October 2019 Nil n/a Nil of $14,600 Open
Mortgages Multiple 29,701 3.51% n/a Closed
Total/Weighted Average: $235,597 3.35% $13,900 of $44,600
21
DEBT STRATEGY
(1) Facility 1 consists of three parts: A non-revolving loan worth $109.9 million maturing in July 2020, an additional non-revolving loan worth $14.0 million maturing in December 2020, and a revolving $15 million credit facility (of which $13.9 million was drawn) maturing in July 2018
(2) Facility 2 consists of a non-revolving loan worth $68.1 million, and a $15 million revolving credit facility (with a balance of nil). Both mature in June 2022
• The REIT has entered into interest rate swaps on the non-revolving portions of Facilities 1 & 2
Remaining Term (yrs)Amount
($thousands)Total Swapped Fixed
Rate Debt (%)
2.8 $39,214 20.4
4.8 41,972 21.9
5.2 13,950 7.3
5.8 27,487 14.3
6.7 12,924 6.7
7.8 42,020 21.8
8.7 14,430 7.6
5.6 $191,997 100.0

2222
MANAGEMENT FOCUSED ON GROWING AFFO PER UNIT
Name, Province and Country
of Residence Principal Occupation
Kapil DilawriChairOntario, Canada
Co-founder of the DilawriGroup and Vice President and Secretary of Dilawri
James MatthewsOntario, Canada
Chief Financial Officer of the Dilawri Group
Louis ForbesOntario, Canada
Senior Vice President and Chief Financial Officer
CT Real Estate Investment Trust
Stuart LazierOntario, Canada
Partner, Co-Founder and Chief Executive Officer
Fiera Properties Limited
John MorrisonLead TrusteeOntario, Canada
President and Chief Executive Officer
Choice Properties Real Estate Investment Trust
LEADERSHIP / GOVERNANCE
Strong Majority Independent Board
• External asset management by Dilawri on a cost-recovery basis• No additional fees (asset management,
acquisition, financing or leasing)
• 5-year term with renewal options
• Terminable, in whole or part, by the REIT upon 90 days' notice• No fee payable by the REIT
Management Structure
• Automotive dealership properties benefit from strong industry fundamentals
• High-quality, strategically located properties, with brand and geographic diversification
• Tenancies currently include two of the three largest Canadian dealership groups
• Long-term, triple-net leases with contractual fixed rent increases provide stable, predictable cash flows
• Large, highly fragmented market presents compelling consolidation opportunity
• Right of first offer on Dilawri development and acquisition pipeline
• Thirteen property acquisitions since July 2015 for a combined purchase price of $164 million1
• Low Debt to GBV / Sound balance sheet, providing approximately $75 million of acquisition capacity
23
INVESTMENT HIGHLIGHTS
(1) As at December 31, 2017