Embed Size (px)
Citation preview
AUTOMOBILE TIRE HYDROPLANING -
A STUDY OF WHEEL SPIN-DOWN
AND OTHER VARIABLES.
by
A. J. Stocker Associate Research Engineer
J. T. Dotson Research Associate
and
D. L. Ivey Research Engineer
Research Report Number 147-3F
Variables Associated with Hydroplaning Research Study Number 2-10-70-147
Sponsored by
The Texas Highway Department In Cooperation With The
U. S. Department of Transportation Federal Highway Administration
August 1974
TEXAS TRANSPORTATION INSTITUTE Texas A&M University
College Station, Texas
1ecnnleal Reports Cant~r · TWtaS Tra~ 'rstiMe
HCHNICAL REPORT STANOARD TITLF PAGI
1. R"port No, 2. Government Aceession No. 3. Recipient's Catalog No.
4. Title and Subtitle 5, Report Dote
AUTOMOBILE TIRE HYDROPLANING - A STUDY OF WHEEL August 1974 SPIN-DOWN AND OTHER VARIABLES 6. Performing Organization Code
7, Author/ s) 8. Performing Organization Report No.
A. J. Stocker, J. T. Dotson, and D. L. Ivey Research Report 147-3F
9. Performing Organization Nome and Address 10. Work Unit No.
Texas Transportation Institute Texas A&M University 11. Contract or Grant No.
College Station, Texas 77843 Research Study 2-10-70-147 13. Type of Raport and Period Covered
12. Sponsoring Agency Nome and Address Final Report - September 19 9 Texas Highway Department August 1974 11th and Brazos Austin, Texas 78701 14. Sp-::ansoring Agency Code
I 5. Supplementary Notes Research performed in cooperation with DOT, FHWA. Research Study Title: "Variables Associated with Hydroplaning."
.. 16
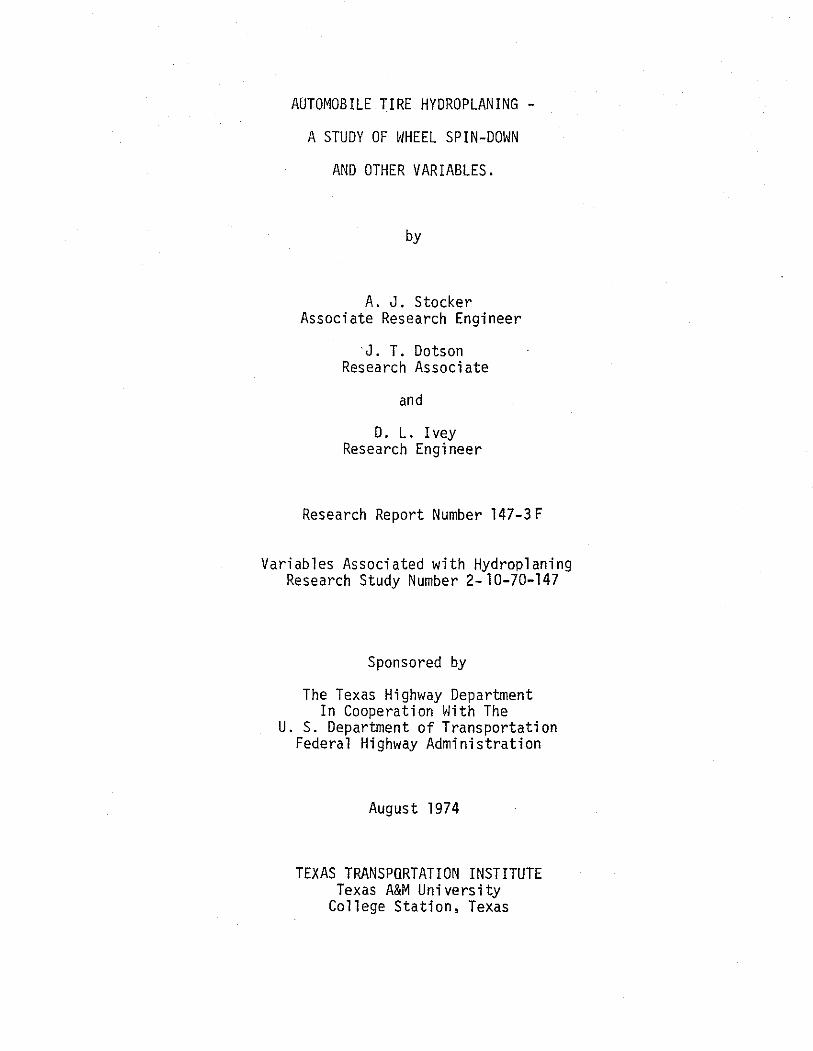
. Ab"••c•A study of the wet weather characteristics of five different pavements and ten different tires is presented. The pavements studied were a portland cement concrete, a seal coat surface treatment, a hot mix asphalt, a jennite surface and a longitudinally grooved portland cement concrete. The tires studied were several bias ply tires with different tread depths, a wide tire with full tread, a test standard tire, a smooth fiberglass belted tire and a full tread steel belted radial. In this study, wheel spin-down was used as the criterion for the detection of hydroplaning and the variables considered were tire tread depth, tire inflation pressure, water depth and wheel 1 oad. A sloping trough 800 ft. long, 30 in. wide and 4 in. deep was used in obtaining the data. The results indicate that the sea 1 coat surface treatment requires a considerably higher ground speed to cause spin-down than do the other pavements tested. It was also observed that no single critical speed, necessary for wheel spin-down to occur, exists for the range of variables selected, but it is recommended that there be a reduction of speed to 50 mph for any section of highway on which water can accumulate to 0.1 inch or more during wet weather periods.
17. Key w .. d, highways, pavements, water dept hl~. Distribution Statement
hydroplaning, spin-down, surface tex-ture, tire inflation pressure, tire / tread depth, grooved pavements.
19. ·-Security Clouil. {of this report) 20. Security Cloaaif. {of this page) 21. No. of Pages 22. Price
Unclassified Unclassified 116
·-Form DOT F 1700.7 1&•691


TTI-2-10-70-147-3F
ERRATA SHEET
for
Research Report 147-3F, "Auto!l'obile Hydroplaning--A Study of Wheel Spin-Down and Other Variables," by A. J. Stocker, J. T. [lotson, and D. L. Ivey, Texas Transportation Institute, Colleqe Station, Texas.
Pa9e 30
wrong: d = 3.38 X 10³ TO.ll L0.43 ro.sg
S0.42
correct: d = 3.38 X 10⁻³ To. 11 L 0.43 r0.59 s0.42
wrong: d = Water depth in inches
correct: d = Average water depth above top of texture in
wrong: S = Cross slope in in./ft.
correct: S = Cross slope in ft./ft.
inches

j j j j j j j j j j j j j j j j j j j j
j j j j j j j j j j
j j j j j
j j j
j
j j j
TABLE OF CONTENTS
ACKNOWLEDGEMENTS
DISCLAIMER
ABSTRACT
SUMI~ARY
IMPLEMENTATION
I. INTRODUCTION . . . . . . II. REVIEW OF THE LITERATURE
III. SELECTION OF PARAMETERS
IV. EXPERIMENTATION . . .
v. DISCUSSION OF RESULTS
VI. APPLICABILITY TO SAFE WET WEATHER SPEEDS.
VII. CONCLUSIONS . . . .
REFERENCES . . . . . . . . . . . . . . . . . . . . . . . .
ii
ix
ix
X
xi
.xi i
1
3
8
12
16 c' ~
27 ' ;,
32 i .t t !
34 i· . ; ;:
~·
' f ' ~ E
l ' I ! ~ w N

1
1
1
1
1
1
1
1
1
1
1
1
1
1
1
1
1
1
1
1
! !
I LIST OF FIGURES
1. The Hydroplaning Trough ..... . . . . . . . . . . . 2. Typical Water Depth Reading Taken Before
Test on Hydroplaning Trough ...
3. Tow Truck and Instrumented Test Trailer
4. Typical Test Run on Hydroplaning Trough
5. Effect of Vehicle Ground Speed on Wheel Spin-Down for
Concrete Pavement -Tire No. 4 - WD = 0.25 in . 6. Effect of Vehicle Ground Speed on Wheel Spin-Down for
Concrete Pavement - Tire No. 4 - WD = 0.40 in . 7. Effect of Vehicle Ground Speed on Wheel Spin-Down for
Concrete Pavement -Tire No. 8 - WD = 0.40 in . 8. Effect of Vehicle Ground Speed on Wheel Spin-Down for
Concrete Pavement - Tire No. 8 - WD = 0.70 in . . 9. Effect of Vehicle Ground Speed on Wheel Spin-Down for
. . .
. . .
. . . .
. . .
14
14
15
15
39
40
41
42
Seal Coat Surface Treatment -Tire No. 4 - WD = 0.40 in . . . . 43
10. Effect of Vehicle Ground Speed on Wheel Spin-Down for
Seal Coat Surface Treatment - Tire No. 4 - WD = 0.70 in . . . . 44
11. Effect of Vehicle Ground Speed on Wheel Spin-Down for
Seal Coat Surface Treatment -Tire No. 8 - WD = 0.40 in
12. Effect of Vehicle Ground Speed on Wheel Spin-Down for
Seal Coat Surface Treatment - Tire No. 8 - WD = 0.70 in
13. Effect of Vehicle Ground Speed on Wheel Spin-Down for
Hot Mix Pavement - Tire No. 4 - 0.40 in
14. Effect of Vehicle Ground Speed on Wheel Spin-Down for
Hot Mix Pavement - Tire No. 7 - 0.40 in
iii
45
46
47
48
LIST OF FIGURES (cont'd)
15. Effect of Vehicle Ground Speed on Wheel Spin-Down for
Hot Mix Pavement - Tire No. 8 - WD = 0.33 in . . . . . . . . 49
16. Effect of Vehicle Ground Speed on Wheel Spin-Down for
Jennite Pavement - Tire No. 4 - WD = 0.33 in . . . . . . 50
17. Effect of Vehicle Ground Speed on Wheel Spin-Down for
Jennite Pavement - Tire No. 4 - WD = 0.40 in . . . . . . . . 51
18. Effect of Vehicle Ground Speed on Wheel Spin-Down for
Jennite Pavement - Tire No. 8 - WD = 0.40 in . . . . . . . 52
19. Effect of Vehicle Ground Speed on Wheel Spin-Down
for Longitudinally Grooved Concrete Pavement -
Tire No. 1 - WD = 0.40 in. . . . . . . . 53 !. 1 " t 20. Effect of Vehicle Ground Speed on Wheel Spin-Down I
for Longitudinally Grooved Concrete Pavement 1 i
Tire No. 3 - WD = 0.40 in. . . . . . . . . . . . . 54 I 21. Effect of Vehicle Ground Speed on Wheel Spin-Down f
I for Longitudinally Grooved Concrete Pavement -I I
Tire No. 4 - WD = 0.40 in. 55 ' . . . . . . . . ' . ' " '·' 22. Effect of Vehicle Ground Speed on Hheel Spin-Down J
H '
for Longitudinally Grooved Concrete Pavement -
Tire No. 4 - WD = 0.25 in. . . . . . . . . . . 56
23. Effect of Vehicre Ground Speed on ~lhee 1 Spin-Down
for Longitudinally Grooved Concrete Pavement -
Tire No. 9 - WD = 0.33 in. . . . . . . . . . . . . . . 57
iv
-

LIST OF FIGURES (cont'd)
24. Effect of Vehicle Ground Speed on Hheel Spin-Down
for Longitudinally Grooved Concrete Pavement -
Tire No. 10 - WD = 0.40 in. . . . . . . .
25. Comparison of Experimental Results to NASA Equation
for Concrete Pavement - Tire No. 7 - WD = 0.40 in .
26. Comparison of Experimental Results to NASA Equation
for Concrete Pavement - Tire No. 8 - WD = 0.40 in .
27. Comparison of Experimental Results to NASA Equation
for Concrete Pavement - Tire No. 5 - WD = 0.40 in .
. . . .
28. Comparison of Experimental Results to NASA Equation for
Seal Coat Surface Treatment- Tire.No. 4 - WD = 0.70 in
29. Comparison of Experimental Results to NASA Equation for
Seal Coat Surface Treatment - Tire No. 8 - WD = 0.70 in
30. Comparison of Experimental Results to NASA Equation
for Hot Mix Pavement - Tire No. 2 - WD = 0.40 in ..
31. Comparison of Experimental Results to NASA Equation
for Hot Mix Pavement - Tire No. 4 - WD = 0.40 in ..
32. Comparison of Experimental Results to NASA Equation
for Hot Mix Pavement - Tire No. 7 - WD = 0.40 in.
33. Comparison of Experimental Results to NASA Equation
for Hot Mix Pavement -Tire No. 7 - WD = 0.33 in ..
34. Comparison of Experimental Results to NASA Equation
for Jennite Pavement - Tire No. 4 - WD = 0.40 in ..
35. Comparison of Experimental Results to NASA Equation
for Jennite Pavement -Tire No. 5 - WD = 0.40 in ..
v
. . . . . .
58
59
60
61
62
63
64
65
66
67
68
69

LIST OF FIGURES (cont'd)
36. Comparison of Experimental Results with NASA Equation
for Jennite Pavement -Tire No. 5 - ~JD = 0.33 in .•
37. Comparison of Experimental Results to NASA Equation
for Longitudinally Grooved Concrete Pavement -
Tire No. 9 - WD = 0. 25 in.. . . . .
38. Comparison of Experimental Results to NASA Equation
for Longitudinally Grooved Concrete Pavement-
Tire No. 9 - WD = 0.40 in .....
39. Comparison of Experimental Results to NASA Equation
for Longitudinally Grooved Concrete Pavement -
Tire No. 4 - WD = 0.40 in ••.
40. Effect of Water Depth and Wheel Load on Ground Speed
to Cause 10% Spin-Down - Tire No. 8 . • • . . . . . •
41. Effect of Water Depth and Wheel Load on Ground Speed
to Cause 10% Spin-Down - Tire No. 7 ....
42. Effect of Water Depth and Tire Aspect Ratio on Speed
to Cause 10% Spin-Down - Pavement No. 1 ..
43. Effect of Water Depth and Tread Depth on Speed to
Cause 10% Spin-Down - Pavement No. 1
44. Effect of Water Depth on Speed to Cause 10% Spin-Down-
Hot Mix Pavement - Tire No. 1 . . . . . . . 45. Effect of \~ater Depth on Speed to Cause 10% Spin-Down~
Hot Mix Pavement - Tire No. 3 . . . . . . 46. Effect of Hater Depth on Speed to Cause 10% Spin-Down
Jennite Pavement - Tire No. 1 . . . . .
vi
70
71
72
73
74
75
. . . . . 76
. . • . 77
. . 78
. . 79
-. . . 80

! I
! t I ! !
I
LIST OF FIGURES (cont'd)
47. Effect of Water Depth on Speed to Cause 10% Soin-Down -
Longi tudi na lly Grooved Concrete Pavement - Tire No. 4
48. Effect of Water Depth on Speed to Cause 10% Spin-Down -
Longitudinally Grooved Concrete Pavement - Tire No. 9
49. Repeatability Check of Data for Jennite Pavement -
Tire No. 3 - WD = 0.33 in . . . . ..
50. Repeatability Check of Data for Concrete Pavement -
Tire No. 1 - WD = 0.33 in .
51.
. . . . Comparison of Concrete and Seal Coat Surface
Treatment - Tire No. 1 . . . . . . . 52. Comparison of Concrete and Seal Coat Surface
Treatment - Tire No. 4 . . . . . . . . . . . . . . 53. Comparison of Concrete and Hot ~li x Pavements -
Tire No. 4 . . . . . . . . . . . . . . . . . 54. Comparison of Hot Mix and Jennite Pavements -
Tire No. 3 . . . . . . . 55. 10% Spin-Down for Two Tires and Three Surfaces at
Selected Tire Pressures - Tire No. 9 and 10 .. . . . . . 56. Effect of Surface and Tire Pressure and Ground
Speed for 10% Spin-Down - Tire No. 4
57. Comparison of Bias Ply Tires Tested (l ,5,7)
58. Comparison of Belted Tires Tested (9,10)
59. Comparison of Ungrooved and Grooved Concrete Surfaces
With Various Water Depths - Tire No. 4
60. Effect of Water Depth on Grooved Concrete Surface
vii
81
82
83
84
85
86
87
88
89
90
91
92
93
94

f ~ t
LIST OF FIGURES (cont'd) I l I
95 i I
61. Comparison of Ungrooved Concrete, Grooved Concrete and
Seal Coat Surfaces - Tire No. 9 .
62. Effect of Texture on Hydroplaning Tire No. 8 96 I w
97 I 63. Effect of Texture on Hydroplaning - Tire No. 4
64. Effect of Pressure on Hydroplaning - Tire No. 4 98
65. Effect of Tire on Hydroplaning - Tire 4, 7 and 8 99
66. Comparison of Tire Pressures - Accident Study .. 100
67. Combinations of Cross Slope and Texture Required To
Prevent Significant Water Depths 101
viii
-

ACKNOl~LEDGEMENTS
These tests and evaluations were conducted on Study No. 2-8-70-147
(HPR-1 (10)), "Vari.ables Associated With Hydroplaning," sponsored by the
Texas Highway Department in cooperation with the U. S. Department of
Transportation, Federal Highway Administration.
DISCLAIMER
The contents of this report reflect the views of the authors who are
responsible for the facts and the accuracy of the data presented herein.
The contents do not necessarily reflect the official views or policies of
the Federal Highway Administration. This report does not constitute a
standard, specification or regulation.
ix


ABSTRACT
A study of the wet weather characteristics of five different pavements
and ten different tires is presented. The pavements studied were a
portland cement concrete, a seal coat surface treatment, a hot mix asphalt,
a jennite surface and a longitudinally grooved portland cement concrete.
The tires studied were several bias ply tires with different tread depths,
a wide tire with full tread, a test standard tire, a smooth fiberglass
belted tire and a full tread steel belted radial. In this study, ~1heel
spin-down was used as the criterion for th.e detection of hydroplaning
and the variables considered were tire tread depth, tire inflation pressure,
water depth and wheel load. A sloping trough 800 ft. long, 30 in. wide
and 4 in. deep was used in obtaining the data. The results indicate that
the seal coat surface treatment requires a considerably higher ground speed
to cause spin-down than do the other pavements tested. It was also observed
that no single critical speed, necessary for wheel spin-down to occur,
exists for the range of variables selected, but it is recommended that
there be a reduction of speed to 50 mph for any section of highway on which
water can accumulate to 0.1 inch or more during wet weather periods.
Key Words: highways, pavements, hydroplaning, spin-down, surface texture,
water depth, tire inflation pressure, tire tread depth,
grooved pavements.
X
s
re,
ed
ved
jch
I J r·
I
I
SUMMARY
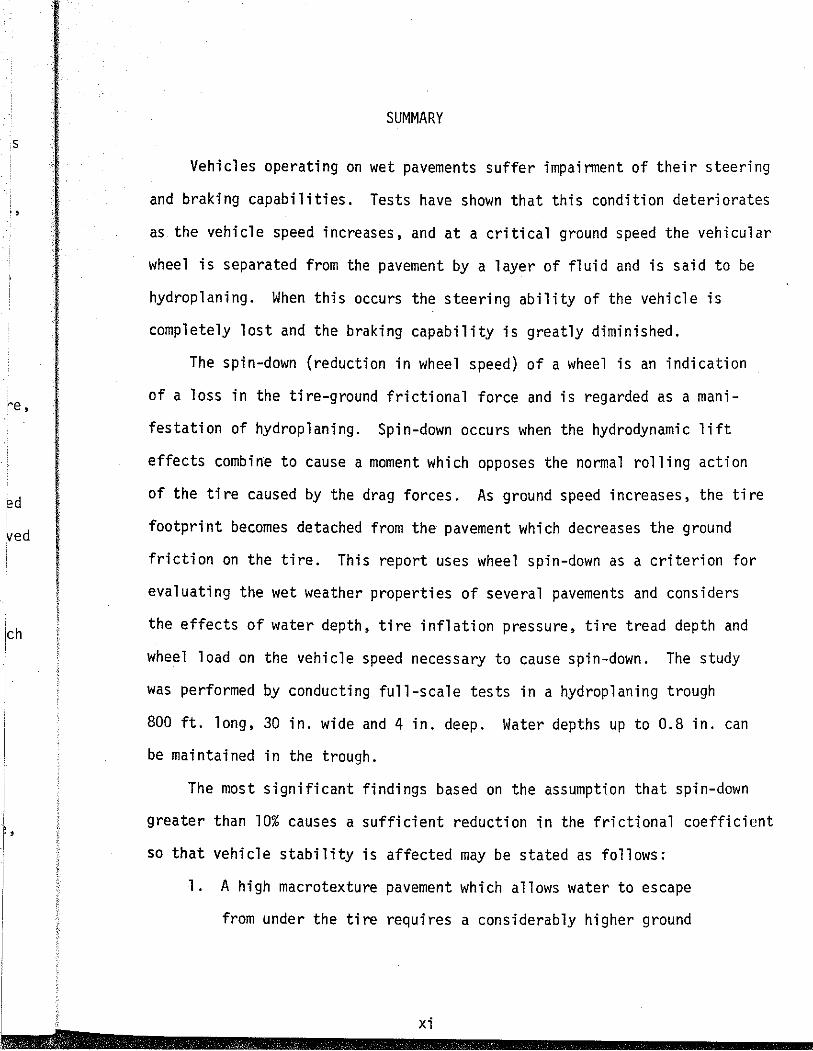
Vehicles operating on wet pavements suffer impairment of their steering
and braking capabilities. Tests have shown that this condition deteriorates
as the vehicle speed increases, and at a critical ground speed the vehicular
wheel is separated from the pavement by a layer of fluid and is said to be
hydroplaning. When this occurs the steering ability of the vehicle is
completely lost and the braking capability is greatly diminished.
The spin-down (reduction in wheel speed) of a wheel is an indication
of a loss in the tire-ground frictional force and is regarded as a mani
festation of hydroplaning. Spin-down occurs when the hydrodynamic lift
effects combine to cause a moment which opposes the normal rolling action
of the tire caused by the drag forces. As ground speed increases, the tire
footprint becomes detached from the pavement which decreases the ground
friction on the tire. This report uses wheel spin-down as a criterion for
evaluating the wet weather properties of several pavements and considers
the effects of water depth, tire inflation pressure, tire tread depth and
wheel load on the vehicle speed necessary to cause spin-down. The study
was performed by conducting full-scale tests in a hydroplaning trough
800 ft. long, 30 in. wide and 4 in. deep. Water depths up to 0.8 in. can
be maintained in the trough.
The most significant findings based on the assumption that spin-down
greater than 10% causes a sufficient reduction in the frictional coefficient
so that vehicle stability is affected may be stated as follows:
1. A high macrotexture pavement which allows water to escape
from under the tire requires a considerably higher ground
I xi 18: ......................... ________________ __

speed to cause spin-down than a low macrotexture pavement.
Consequently, a safer condition is created.
2. Decreasing the tire inflation pressure normally has the
effect of lowering the ground speed at which a certain
amount of spin-down occurs. Thus, a less safe condition
is created.
3. Increasing the width of a tire causes a decrease in the
ground speed required to produce spin-down.
4. An increase in the water depth causes a decrease in the
speed at which spin-down takes place.
5. A reduction in tire tread depth causes a decrease in the
speed at which spin-down takes place.
xii
! I 1 '
I ~· li
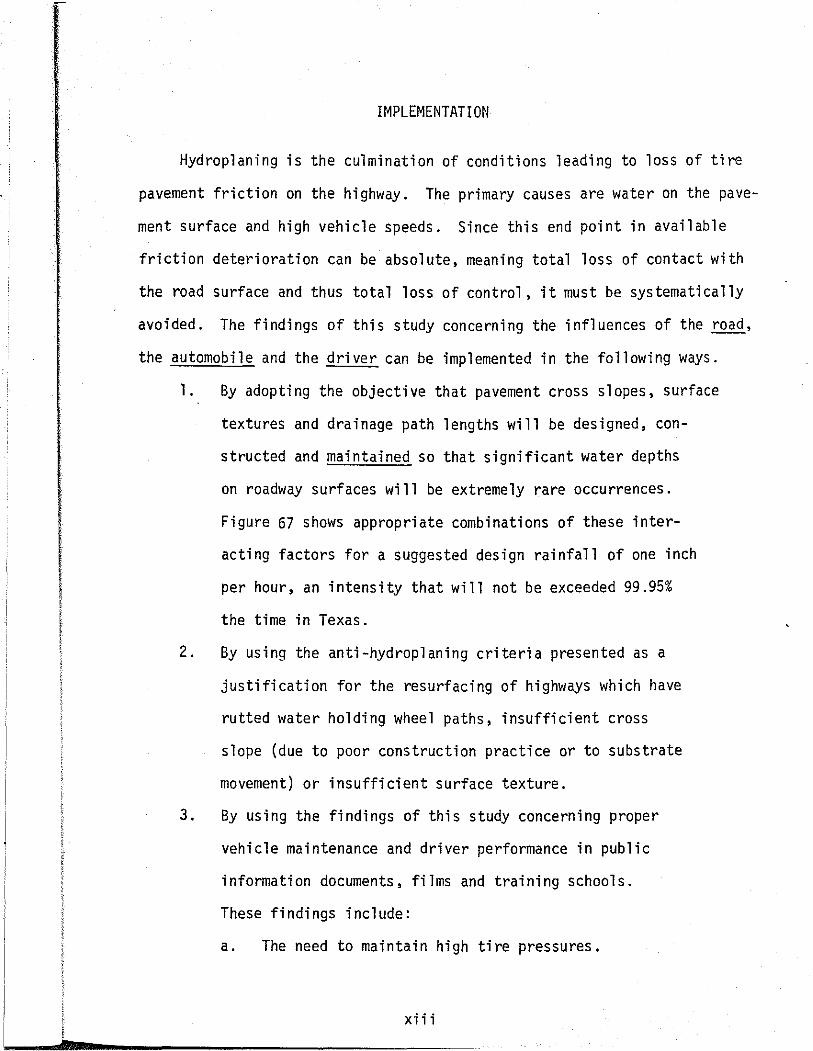
IMPLEMENTATION
Hydroplaning is the culmination of conditions leading to loss of tire
pavement friction on the highway. The primary causes are water on the pave
ment surface and high vehicle speeds. Since this end point in available
friction deterioration can be absolute, meaning total loss of contact with
the road surface and thus total loss of control, it must be systematically
avoided. The findings of this study concerning the influences of the road,
the automobile and the driver can be implemented in the following ways.
1. By adopting the objective that pavement cross slopes, surface
textures and drainage path lengths will be designed, con
structed and maintained so that significant water depths
on roadway surfaces will be extremely rare occurrences.
Figure 67 shows appropriate combinations of these inter
acting factors for a suggested design rainfall of one inch
per hour, an intensity that will not be exceeded 99.95%
the time in Texas.
2. By using the anti-hydroplaning criteria presented as a
justification for the resurfacing of highways which have
rutted water holding wheel paths, insufficient cross
slope (due to poor construction practice or to substrate
movement) or insufficient surface texture.
3. By using the findings of this study concerning proper
vehicle maintenance and driver performance in public
information documents, films and training schools.
These findings include:
a. The need to maintain high tire pressures.
xiii
b. The need to maintain deep tire tread depths.
c. The need to reduce vehicle speed.
d. The way to determine visually whether a hazardous highway surface condition exists.
4. By the use of specific data which determines critical
hydroplaning speeds to justify wet weather speed limits
as interim measures at sites determined to be hazardous
during rainfall.
xiv
f ,,

I. INTRODUCTION
As a vehicle travels along the highway, the friction required to
perform maneuvers is developed at the tire-pavement interface. The
friction developed will depend on such things as the pavement texture,
tire configuration, area of the contact zone, tread design, speed and
tire pressure. If this area is contaminated, the friction developed
at the interface will be decreased. If the contaminant is water, the
possibility of hydroplaning exists.
Hydroplaning is caused by the build up of fluid pressures within the
tire-pavement contact zone, and hydroplaning is considered to exist when
the hydrodynamic uplift equals the downward force exerted on the wheel.
At this point the tire is completely supported by the water layer. When
in this condition, the tire has lost all contact with the pavement sur
face and thus has lost the tractive force necessary to perform normal or
emergency driving maneuvers.
This study has chosen to use wheel spin-down as the indicator of
tire hydroplaning. Spin-down is a term describing the loss of angular
velocity of a wheel traveling over a flooded pavement as the speed of the
vehicle remains constant or increases. Wheel spin-down is caused by the
build up of hydrodynamic pressure in the forward portion of the tire
pavement contact area. This force acts to oppose the normal rotating
action of the tire and can build up to a point to cause the tire to stop
rotation completely. It has been assumed that once spin-down has been
initiated some loss of tire-pavement contact has occurred. Once a portion
of the contact is lost, the friction developed between the tire and the
pavement is decreased and a potentially dangerous situation exists.
1
The factors being considered in this study are water depth, pavement
texture (primarily macrotexture), vehicle speed, wheel load, tire inflation
pressure, tire configuration and tire tread depth. By adjusting each of
the variables, the effect each has on the speed at which a certain amount
of spin-down occurs. can be observed.
Up to this time most research in this area has been done by the
aircraft industry at the high speeds involved with take-off and touch
down. Because of this, the research has been done using aircraft tires
which have very different characteristics from automobile tires. It is
the objective of this study to observe what occurs at lower speeds, wheel
load and tire inflation pressure.
2

II. REVIEW OF THE LITERATURE
Theoretical and experimental studies have been made by a number
of researchers. The works more nearly associated with the research
investigation presented in this report and reviewed during the course
of the study are listed in references 1-52·.
Saal (42) initially studied the problem in 1935 and developed a
model based on two planes approaching each other in a fluid. He
assumed the tire contact area to be elliptical and used Reynold's
equation to obtain his results. r~oore (40) used squeeze film theory
to analyze the problem and concluded that the molecular mechanism of
viscosity that would be encountered between tire and wet pavement requires
further study. Also, he feels that the Reynolds-Stefan equation is
inadequate to describe this phenomenon.
Horne and Dreher (27) derived an equation to predict the critical
speed at which total hydroplaning begins. This equation assumes the
load on the tire to be in equilibrium with the dynamic pressure in front
of the tire and neglects the effects of fluid depth. For an experimentally
determined lift coefficient of 0.7, Horne develops the equation
where
vcr = 10.35 1P
Vcr =total hydroplaning speed in statute mph, and
p = tire inflation pressure in psi.
( 1 )
This equation is limited to smooth tires or commercially treaded tires
whose tread depth is less than the water film thickness. Reference 27
indicates that the results predicted by Eq. 1 are in reasonable agreement
3
------~~--------.......................... ~ .. with experimental data obtained for a variety of tires subjected to
different loads and inflation pressures.
Gengenbach (19) developed an empirical equation which includes the
thickness of the water film and his correlation with test results sho~1ed
that the total hydroplaning speed was signifi.cantly affected by the water
film thickness. This contradicted the equation developed by Horne (27).
Gengenbach's equation, like Horne's (27) assumed that the wheel load and
dynamic pressure were in equilibrium but used the cross section of the
water film under the tire ·contact patch perpendicular to the surface
velocity as the area for the force calculation. The area was multiplied
by a lift coefficient and the equation to predict the total hydroplaning
speed.was derived as
where
v = 508
V = total hydroplaning speed in km/hour,
Q =wheel load in KP(lKP = 2.2 lb.),
B = maximum width of contact patch in mm,
t = thickness of water film in mm, and
CL= lift coefficient determined empirically for a particular tire.
Gengenbach concludes that grooving of the tires considerably reduces the
lift coefficient and thus increases the critical hydroplaning_ speed. In
his work, tire designs with rna i nly ci rcumferenti a 1 grooves achieved CL
reductions of nearly 50% whereas designs with grooves primarily oriented
in the lateral direction achieved reductions down to 25% of the smooth tires.
4

r
ires.
Martin (35) explains the tire hydroplaning phenomenon from the stand
point of theoretical hydrodynamics and then compares theoretical and
experimental results. From the study it is concluded that for moderate
water depths and grooved tires, the lift coefficient for incipient
hydroplaning does not vary appreciably. Also, an inviscid fluid may be
assumed except for the case of smooth tires and/or thin films of water.
Dugoff and Ehrlich (13) studied the hydroplaning problem through scale
model laboratory experiments and employed dimensional analysis principles
to interpret their results. The tests were conducted for smooth tires of
rectangular cross-section at various loads and water depths. The authors
interpret Eq. 1 presented in ref. 27 in terms of dimensional analysis
principles and indicate that neither fluid gravity forces nor viscosity
forces had an appreciable influence on the full-scale tests that were
used in the comparison of Eq. 1 and presented in ref. 27. Further, the
authors of ref. (13) recommend that the effects of configurational and
tread changes to tires and the partial hydroplaning problems be studied.
Wray and Jurkat (50) derived an empirical equation relating critical
hydroplaning speed, water film thickness and nominal contact patch bearing
pressure for 811 diameter polyurethane model tires having four different
widths and a smooth surface. The results obtained using their equation
were compared to those obtained by Horne's equation {Eq. 1). They noted
that Horne's equation was bracketed by lines of constant water film thickness
having nearly the same slope. This implies.that by selecting a certain water
depth, Horne's NASA equation can be duplicated with experimental data frorr
the model wheel.
A vast amount of research concerning friction characteristics and
5
effects of the pavement texture and material has been conducted by British
researchers (1,2,4,17,18,22,23,36). Allbert (1) discusses the effects of
tire design parameters on hydroplaning and concludes that the most important
is the geometric design of the tread pattern. Allbert, Walker and Maycock (2),
after investigating various tires and pavement surfaces, conclude that the
coefficient of friction for a slipping tire is significantly decreased with
an increase in speed on fine-textured surfaces and to a lesser extent on
coarse-textured surfaces. Further, the tread pattern did not play as
significant a role on the coarse-textured surfaces. This implies that
tread wear would have a minor effect on coarse-textured surfaces. Gough
and Badger (22) discuss the effect of tread design on various surfaces
and the hydroplaning of heavy vehicles fitted with smooth tires which are
traveling on flooded road surfaces. Their findings on pavement surfaces
are similar to those presented in ref. 2. Martin (36) discusses treatments
to existing concrete and asphalt surfaces in order to improve their skidding
resistance. The materials and methods which may be used in future construc
tion are also described and illustrated.
A large amount of research concerning the variables associated with
hydroplaning and particularly pavement texture has also been conducted by
American investigators (5,11,14,28,30,33,34,43,51 ,52). Beaton, Zube and
Skog (5) conducted studies on the effect of pavement grooving to reduce
wet weather accidents. Their results indicate that pavement grooving
parallel to the centerline enhances the wet weather behavior of concrete
pavements and the friction value is raised. DeVinney (11) investigated
the effects of the tread design and compound, tire construction and road
surface on the hydroplaning problem. He concluded that the vehicle operating
6
sh
·tant
>Ck (2), ·.
lhe
,; th
;
jding
true-
f1 I
by '
d
I
~ t
t I II ..
le .•
~ I 'rat ina ~ I ~ I ' ~
I I , I i
I '
speed is the most significant single factor affecting wet skid resistance.
Also, a coarse textured surface has the greatest effect on decreasing the
significance of speed; tread design, tread compound, tire construction,
surface and temperature all play a role with the effects on skid resistance.
Horne (28) from his investigation of tires and pavements concluded that
tires having smooth or badly worn treads, and pavements that are worn
from heavy traffic or possess too little surface texture, are hazardous.
Yager (51) discusses the types of tire traction losses on wet roads and the
effects of pavement surface contaminants, surface texture, tire tread
design and ground speed on pneumatic tire braking and steering capability.
From his study, the author concludes that pavement grooving, both trans
versely and longitudinally, is an effective means for reducing all known
phenomena associated with low tire-surface friction. In addition,
badly worn tires indicated a significant reduction in the vehicular
braking and steering characteristics when compared with new full tread
tires.
7

III. SELECTION OF PARAMETERS
Pavements
Five pavements have been selected for this study. The first pavement
studied was a burlap drag finish concrete.surface with an average surface
texture of 0.018 in. as measured by the silicone putty method. This pave
ment was considered_ to be typical or similar to concrete pavements presently
in use. The second pavement tested was a seal coat surface treatment with
rounded river gravel, stone size between -5/8 in. and+ No.4 sieve used
as cover stone. The average texture of this surface was 0.146 in. measured
by the silicone putty method. This high texture composed of fairly loosely
bound aggregate is obviously impractical for use on high speed roadways but
was chosen simply to show the effect of increasing the macrotexture. A hot
mix asphalt was used as the third pavement. An average texture of 0.033 in.
was measured by the silicone putty method. This pavement was chosen as one
that was similar to those presently in use. The fourth pavement tested was
a clay filled coal-tar emulsion surface (Jennite). This surface had a
texture of 0.020 in. as measured by the silicone putty method. This surface
was chosen because it was felt that it was similar to a bleeding asphalt
pavement or a worn wheel rut. The fifth and final surface tested was the
initial burlap drag finish portland cement concrete modified by longitudinal
grooves 0.125 in. deep by 0.125 in. wide on 1.0 in. centers. This surface
was chosen because of the increased use of grooving on public highways.
The surface texture was 0.047 as measured by the silicone putty method.
It should be noted that by measuring the texture by use of the silicJne
putty method only the macro-texture is indicated. It is impossible to
8

show the magnitude of the micro-texture when using this method. This is
shown by the fact that pavement four, the jennite surface, has a higher
texture than the concrete pavement, surface one. The concrete pavement
has a very gritty feeling texture while the jennite is smooth~ It is felt
that microtexture plays an important part in the reduction of hydroplaning
but no quantitive measure of its effect was made in this study. It is
possible however to make inferences from the data obtained.
vlater Depths
Various water depths, measured from the top of the surface asperities,
were considered and values were selected so that the influence of this vari
able could be evaluated. The water depths studied on the concrete surface
varied from 0.12 to 0.70 in. This is a very wide range, with the upper limit
being rather impractical, but studied to see just how much effect the water
depth had on spin-down and if there was a point past which it had no effect.
The depths selected for the seal coat surface varied from 0.25 in. to 0.70 in.
This range was considered because when using water depths below 0.25 in. on
this particular surface it was extremely difficult to obtain any data, the
main reason being that the speeds necessary to cause spin-down at the lower
water depths were not achievable with the test vehicle. On the third and
fourth surfaces the water depth was varied from 0.12 to 0.40 in. On the
fifth surface the water depth was varied from 0.18 in. to 0.40 in. It was
found that this is a more realistic range of water depths and that there
were ample data produced· using these values.
Tire Inflation Pressures
Tire inflation pressures varying from 18 psi to 36 psi in 6 psi
increments were selected for evaluation on all five pavements. This range
9

, '
ri-
I mit
er
ct.
0 in.
on
e
!er
's
e
of values was not only representative of pressures found in the tires
of most ground vehicles, but also provides an adequate variation or range
for studying the effect of the variable. Pressures higher than 36 psi
were not selected because the tow vehicle was unable to attain speeds high
enough to produce meaningful data.
Wheel Load
Wheel loads of 800 lb. and 1,085 lb. were selected for evaluation on
the concrete pavement. The load of 1,085 lb. was used as the basic test
weight. This was done because of its specification as the ASTM skid trailer
standard. The 800 lb. load was used on tires No. 7 and 8 tested on the
concrete surface. This weight was chosen because it provided enough varia
tion to observe the effect of this parameter. Only the 1,085 lb. load was
used when testing the other four surfaces since no appreciable variation in
the results was observed in the evaluation of the concrete pavement when the
800 lb. was used.
Tires
Ten tires were selected for the study. They included:
1. Manufacturer A 7.75-14 Bias Ply - Full Tread Depth
2. Manufacturer A 7.75-14 Bias Ply - l/2 Tread Depth
3. Manufacturer A 7.75-14 Bias Ply - Smooth
4. Manufacturer B F70-l4 Wide Tire - Full Tread Depth'
5. Manufacturer C 7.75-14 Bias Ply- Full Tread Depth
6. ASTM E-17 Traction Standard 7.50-14 - Full Tread Derth
7. Manufacturer D 7.75-14 Bias Ply - Full Tread Depth
8. Manufacturer E 7.75-14 Bias Ply - Smooth
10
9. Manufacturer E
10. Manufacturer F
F78-14 Glass Belted - Smooth
195-14 Steel Belted Radial - Full Tread Depth
It was felt that this wide range of tires would provide an adequate
eva 1 uati on of the effects of tire geometry, stiffness and tread depth.
11
Joth
11 th
IV. EXPERIMENTATION
The tests were conducted in a sloped trough (0.88'/100') 800ft. long,
30 in. wide and 4 in. deep which is shown in Figure 1. The construction
procedures and specifications for this facility can be found in reference 46.
Because of its configuration and water supply, there was no difficulty
encountered in obtaining water depths of 0.7 in. above the pavement
·asperities. Even though a perfectly level surface was desired, variations
in the trough existed. Therefore, in order to better interpret the data,
water depths were taken at several points in the trough as shown in Figure
2. The variation of water depths was most pronounced for the seal coat surface.
It is difficult to obtain constant conditions when performing tests in
the open. Therefore, the data contain the influence of temperature and
varying winds. Experimentation was halted whenever wind speed was greater
than 15 mph. It was felt that this would cause variations in the water depth
that would affect the data. It has been observed that wind speed below this
point did not affect the data.
The tow vehicle and instrumented test trailer are shown in Figure 3
and a photograph of a typical test is shown in Figure 4. As can be seen
from these photographs, the tow vehicle is positioned so as to straddle
the trough while the test trailer is offset so that the left tire of the
trailer is positioned in the trough. The ground speed from the fifth
wheel and the speed of the test wheel in the trough are sensed by identiccl
tachometer generators. The output from the generators is fed into a
Hewlett-Packard 320 recorder which contains its own amplifier circuits.
The two wheel speeds are simultaneously recorded as analog traces on a
strip chart. From this chart the two ground speeds can be compared and
12
the percent spin-down calculated. The fifth wheel or vehicle speed is
also displayed to the driver on a digital voltmeter.
13

Figure 1. The Hydroplaning Trough.
Figure 2. Typical Water Depth Reading Taken Before Test on Hydroplaning Trough.
14

Figure 3. Tow Truck and Instrumented Test Trailer.
Figure 4. Typical Test Run on Hydroplaning Trough.
15
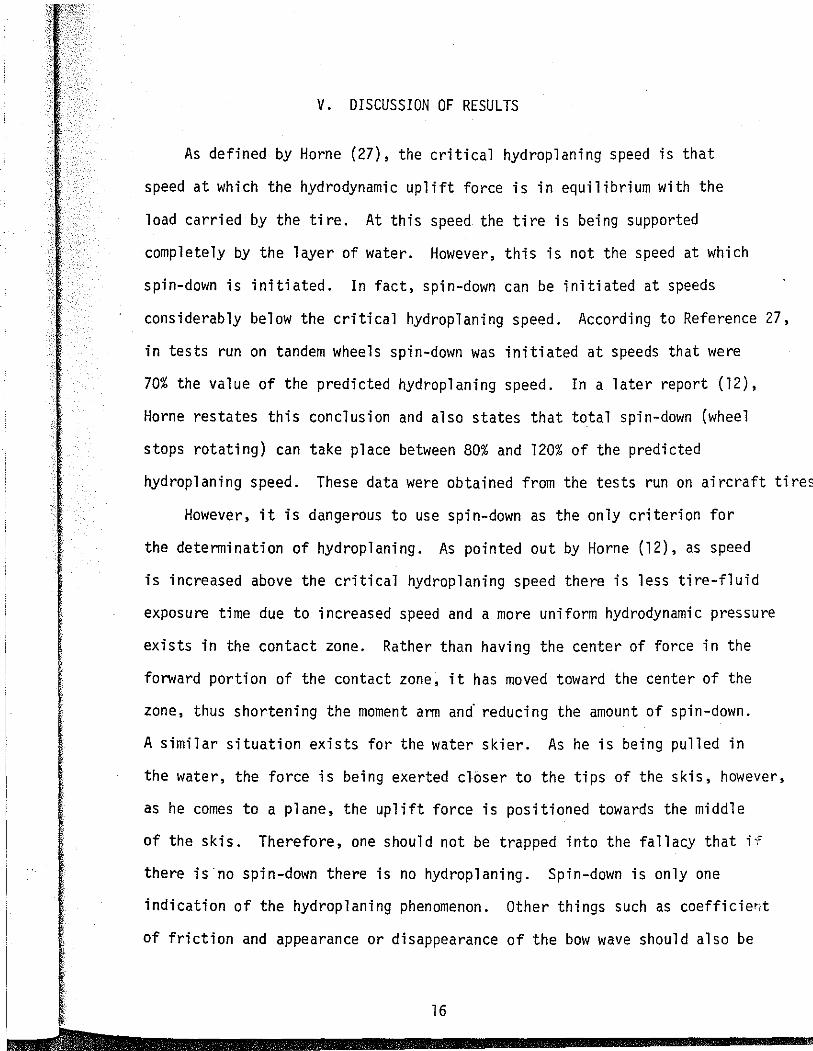
V. DISCUSSION OF RESULTS
As defined by Horne (27), the critical hydroplaning speed is that
speed at which the hydrodynamic uplift force is in equilibrium with the
load carried by the tire. At this speed the tire is being supported
completely by the layer of water. However, this is not the speed at which
spin-down is initiated. In fact, spin-down can be initiated at speeds
considerably below the critical hydroplaning speed. According to Reference 27,
in tests run on tandem wheels spin-down was initiated at speeds that were
70% the value of the predicted hydroplaning speed. In a later report (12),
Horne restates this conclusion and also states that total spin-down (wheel
stops rotating) can take place between 80% and 120% of the predicted
hydroplaning speed. These data were obtained from the tests run on aircraft tires
However, it is dangerous to use spin-down as the only criterion for
the determination of hydroplaning. As pointed out by Horne (12), as speed
is increased above the critical hydroplaning speed there is less tire-fluid
exposure time due to increased speed and a more uniform hydrodynamic pressure
exists in the contact zone. Rather than having the center of force in the
forward portion of the contact zone, it has moved toward the center of the
zone, thus shortening the moment arm and· reducing the amount of spin-down.
A similar situation exists for the water skier. As he is being pulled in
the water, the force is being exerted closer to the tips of the skis, however,
as he comes to a plane, the uplift force is positioned towards the middle
of the skis. Therefore, one should not be trapped into the fa 11 acy that H
there is·no spin-down there is no hydroplaning. Spin-down is only one
indication of the hydroplaning phenomenon. Other things such as coefficier:t
of friction and appearance or disappearance of the bow wave should also be
16

considered when determining the hydroplaning speed.
For the experimentation conducted on the hydroplaning trough, wheel
spin-down was the only criterion used to indicate loss of tire-pavement
contact. Because of this, it was decided to evaluate the pavements
studied and discuss the effects of the variables on the basis of percent
spin-down. Percent spin-down means the amount the test wheel relative
ground speed has been reduced in relation to the vehicle ground speed.
The data are presented as a plot of vehicle ground speed vs.
percent spin-down at a specific water depth showing the plots at
the various tire inflation pressures tested. ·-rhis method of presen
tation lends itself to the development of further comparisons of data
when desired. Several examples of additional comparisons are included
in the report.
Figures 5 thru 24 are examples of these plots. These figures display
wheel spin-down characteristics for various tires, surfaces, tire pressures,
water depths, tread depths and vehicle speeds. One of the most notable
trends is the effect of tire inflation pressure. As the inflation pressure
is increased, the speed required to cause a certain amount of spin-down is
also increased. Figure 5, for example, shows that by increasing the
inflation pressure by 6 psi, the speed required to cause 10% spin-down is
increased about 4 mph. However, decreasing the tire pressure does not
necessarily decrease the speed at which a given amount of spin-down will occur.
As can be seen in Figures 5, 10 and 11, there was no significant spin-down
obtained at 18 psi for speeds up to 64 mph. It must be remembered, however,
that wheel spin-down is only an indication of hydroplaning or tire-pavement
17
"'es,
ure
'is
occur.
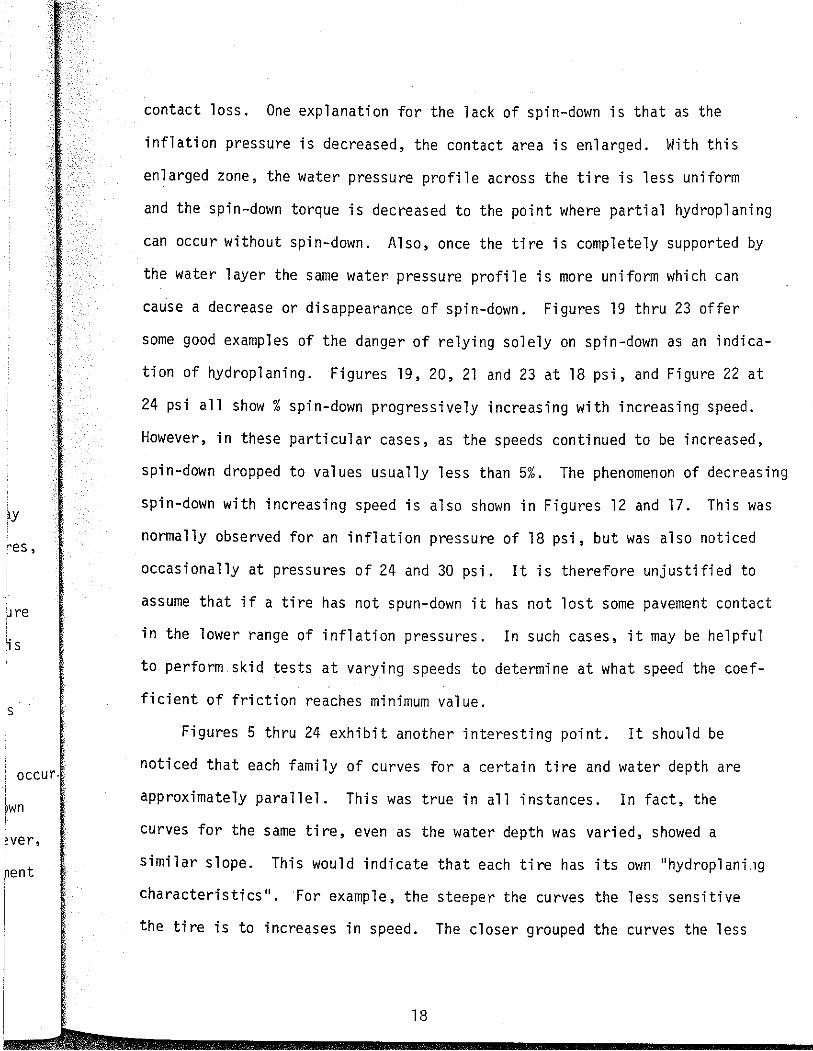
contact loss. One explanation for the lack of spin-down is that as the
inflation pressure is decreased, the contact area is enlarged. With this
enlarged zone, the water pressure profile across the tire is less uniform
and the spin-down torque is decreased to the point where partial hydroplaning
can occur without spin-down. Also, once the tire is completely supported by
the water layer the same water pressure profile is more uniform which can
cause a decrease or disappearance of spin-down. Figures 19 thru 23 offer
some good examples of the danger of relying solely on spin-down as an indica
tion of hydroplaning. Figures 19, 20, 21 and 23 at 18 psi, and Figure 22 at
24 psi all show % spin-down progressively increasing with increasing speed.
However, in these particular cases, as the speeds continued to be increased,
spin-down dropped to values usually less than 5%. The phenomenon of decreasing
spin-down with increasing speed is also shown in Figures 12 and 17. This was
normally observed for an inflation pressure of 18 psi, but was also noticed
occasionally at pressures of 24 and 30 psi. It is therefore unjustified to
assume that if a tire has not spun-down it has not lost some pavement contact
in the lower range of inflation pressures. In such cases, it may be helpful
to perform skid tests at varying speeds to determine at what speed the coef
ficient of friction reaches minimum value.
Figures 5 thru 24 exhibit another interesting point. It should be
noticed that each family of curves for a certain tire and water depth are
approximately parallel. This was true in all instances. In fact, the
curves for the same tire, even as the water depth was varied, showed a
similar slope. This would indicate that each tire has its own "hydroplani 1g
characteristics". For example, the steeper the curves the less sensitive
the tire is to increases in speed. The closer grouped the curves the less
18

sensitive the tire is to inflation pressure changes.
Figures 25 and 39 are plots of tire inflation pressure vs. ground
speeds at 10%, 32% and 60% spin-down. These plots are compared to the
equation for critical hydroplaning velocity presented by Horne in refer
ence 27 (i.e. VCR= 10.35 ;r-) where P =tire inflation pressure in psi.
Figures 25, 27, 28, 31 thru 36 and 39 show comparisons of tires with full
tread depths with Horne's equation. In all cases, the experimental plots
are approximately parallel with each other, but not necessarily parallel
with plots of other tires. This again indicates the possibility that the
tires may possess individual characteristics which may affect the speeds
at which they hydroplane. These full tread depth tires require compara
tively high speeds to cause spin-down. Therefore, simply because a plot
is to the right of the NASA equation does not mean that the tire is defi
nitely hydroplaning. It simply means that the speed required to cause a
certain amount of spin-down is higher due to the tires' construction and
that there has been at least a partial loss of pavement contact.
Figures 26, 29, 37 and 38 compare the results obtained for a smooth
or worn tire with Horne's equation. For these plots, even when total spin
down was compared to the equation, the speeds were far below those perdicted.
It should be noticed that the slopes differ from that of the NASA equa-
tion. Also, it has been observed that the slopes are affected by the
test surfaces. However, the slopes of these plots do not seem to be
affected by the water depths at which the tests were run. The water depth
did affect the positioning of these plots, that is, it affected the speed
at which a certain amount of spin-down would take place. But, as stated by
Horne (27), the speeds for even 10% spin-down are within 70% of the speeds
19

predicted by the equation.
As can be seen from the above observations it would be extremely
difficult to derive an equation for hydroplaning velocity that would fit
all tires under varying conditions. Horne has done an exceptional job,
even though as he admits, his equation is very 1 imi ted. But the agreement
of the data presented with his equation is quite encouraging.
Figures 40 thru 48 are plots of water depth vs. ground speed at which
10% spin-down occurred and are used to make various comparisons.
Figures 40 and 41 show the effect of varying the wheel load from 800 lbs.
to 1085 lbs. The results for the smooth tire are plotted on Figure 40 and
indicate that increases in the wheel load increases the speed necessary to
cause 10% spin-down. However, the results for a tire with a full tread
depth, plotted in Figure 41, indicate the reverse takes place. These data
indicate that the hydroplaning speed is less dependent on wheel load than
other variables. However, it should be made clear that only a limited amount
of data were collected and this may not be true for other tire-tread depth
texture-wheel load combinations.
Figure 42 shows a comparison of tire No. 4, the F70-14 wide tire, with
Tire No.7, a 7.75-14 bias ply. The bias ply tire required higher speeds
to cause the same amount of spin-down obtained with the wide tire. These
results are in agreement with the findings of other researchers which indi
cate that the hydroplaning speed decreases as the tire width increases. In
other words, the wider the tire, the lower the speed to cause a given amourt
of spin-down, all other things being equal. When a person water skis, it ~s
much easier to hydroplane using an aquaplane rather than two skis or using
two skis instead of a single ski. The more surface area available, or the
larger the contact area, the easier it is to hydroplane. This same trend
20
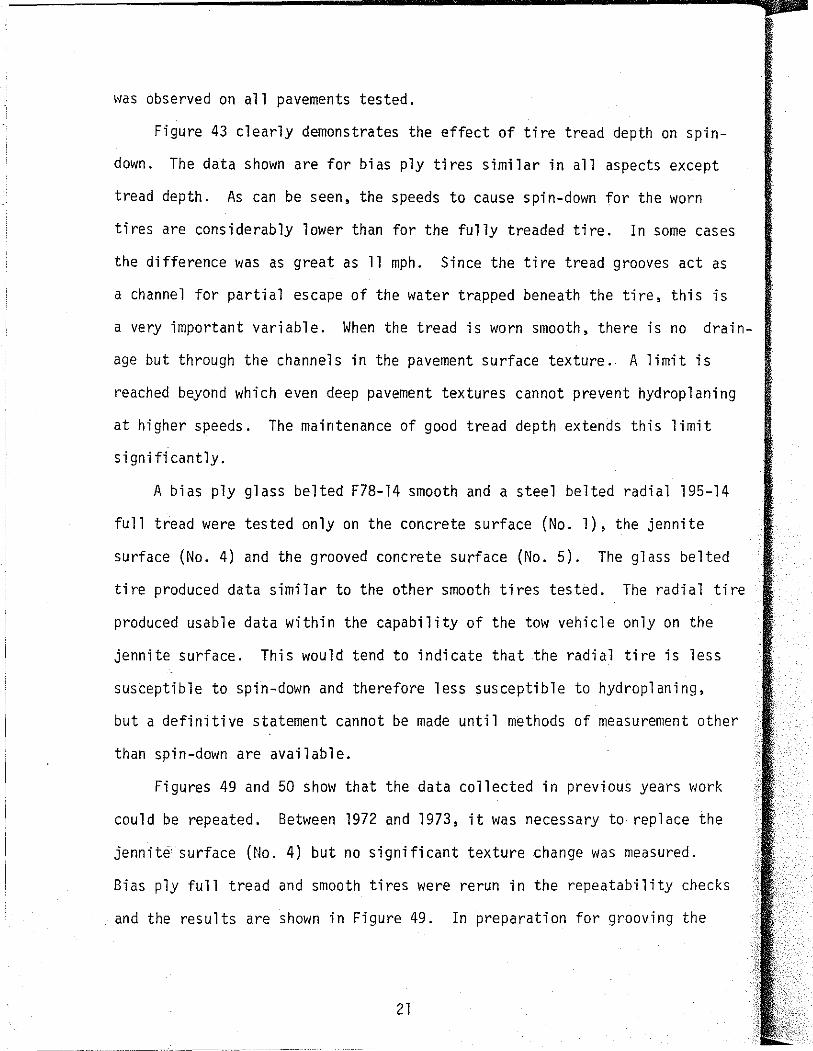
was observed on all pavements tested.
Figure 43 clearly demonstrates the effect of tire tread depth on spin
down. The data shown are for bias ply tires similar in all aspects except
tread depth. As can be seen, the speeds to cause spin-down for the worn
tires are considerably lower than for the fully treaded tire. In some cases
the difference was as great as 11 mph. Since the tire tread grooves act as
a channel for partial escape of the water trapped beneath the tire, this is
a very important variable. When the tread is worn smooth, there is no drain
age but through the channels in the pavement surface texture .. A limit is
reached beyond which even deep pavement textures cannot prevent hydroplaning
at higher speeds. The maintenance of good tread depth extends this limit
significantly.
A bias ply glass belted F78-14 smooth and a steel belted radial 195-14
full tread were tested only on the concrete surface (No. 1), the jennite
surface (No. 4) and the grooved concrete surface (No. 5). The glass belted
tire produced data similar to the other smooth tires tested. The radial tire
produced usable data within the capability of the tow vehicle only on the
jennite surface. This would tend to indicate that the radial tire is less
susceptible to spin-down and therefore less susceptible to hydroplaning,
but a definitive statement cannot be made until methods of measurement other
than spin-down are available.
Figures 49 and 50 show that the data collected in previous years work
could be repeated. Between 1972 and 1973, it was necessary to replace the
jennit~ surface (No. 4) but no significant texture change was measured.
Bias ply full tread and smooth tires were rerun in the repeatability checks
and the results are shown in Figure 49. In preparation for grooving the
21
)-
t
· ses
as
is
rain-
ing
14
:ed
tire
s
I ,her
, ks I
I
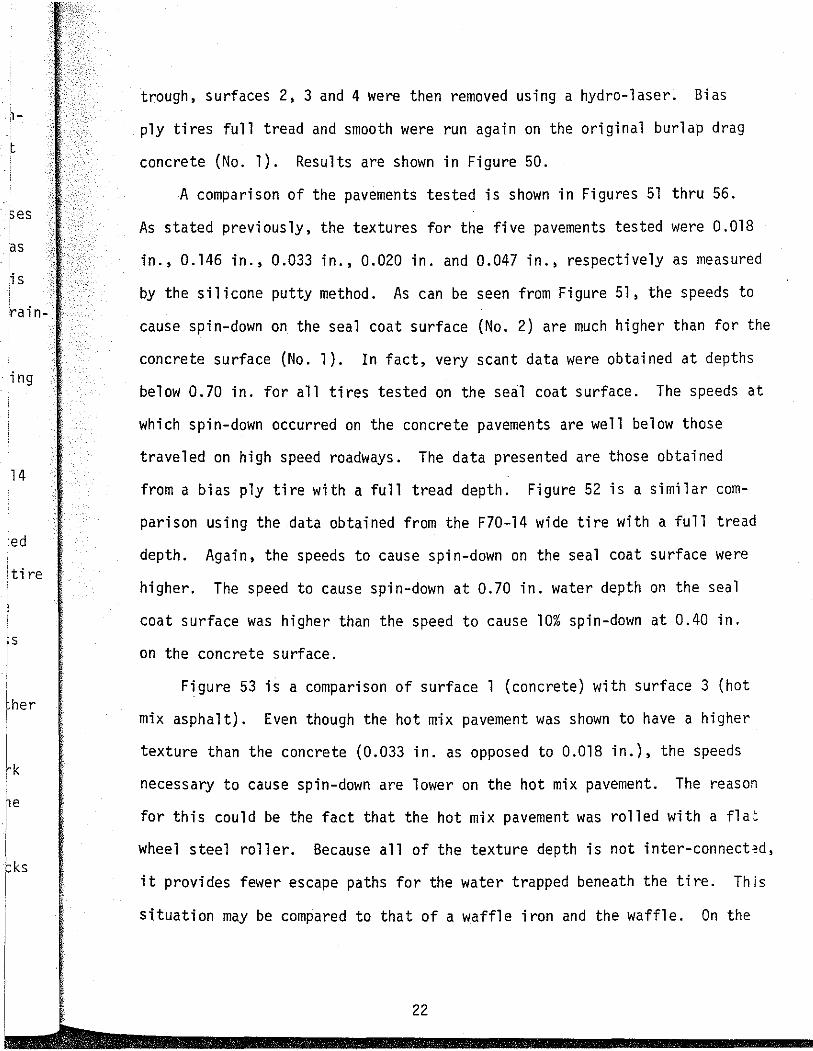
trough, surfaces 2, 3 and 4 were then removed using a hydro-laser. Bias
ply tires full tread and smooth were run again on the original burlap drag
concrete (No. 1). Results are shown in Figure 50.
A comparison of the pavements tested is shown in Figures 51 thru 56.
As stated previously, the textures for the five pavements tested were 0.018
in., 0.146 in., 0.033 in., 0.020 in. and 0.047 in., respectively as measured
by the silicone putty method. As can be seen from Figure 51, the speeds to
cause spin-down on the seal coat surface (No. 2) are much higher than for the
concrete surface (No. 1). In fact, very scant data were obtained at depths
below 0.70 in. for all tires tested on the seal coat surface. The speeds at
which spin-down occurred on the concrete pavements are well below those
traveled on high speed roadways. The data presented are those obtained
from a bias ply tire with a full tread depth. Figure 52 is a similar com
parison using the data obtained from the F70-14 wide tire with a full tread
depth. Again, the speeds to cause spin-down on the seal coat surface were
higher. The speed to cause spin-down at 0.70 in. water depth on the seal
coat surface was higher than the speed to cause 10% spin-down at 0.40 in.
on the concrete surface.
Figure 53 is a comparison of surface 1 (concrete) with surface 3 (hot
mix asphalt). Even though the hot mix pavement was shown to have a higher
texture than the concrete (0.033 in. as opposed to 0.018 in.), the speeds
necessary to cause spin-down are lower on the hot mix pavement. The reason
for this could be the fact that the hot mix pavement was rolled with a fla:
wheel steel roller. Because all of the texture depth is not inter-connect=d,
it provides fewer escape paths for the water trapped beneath the tire. This
situation may be compared to that of a waffle iron and the waffle. On the
22
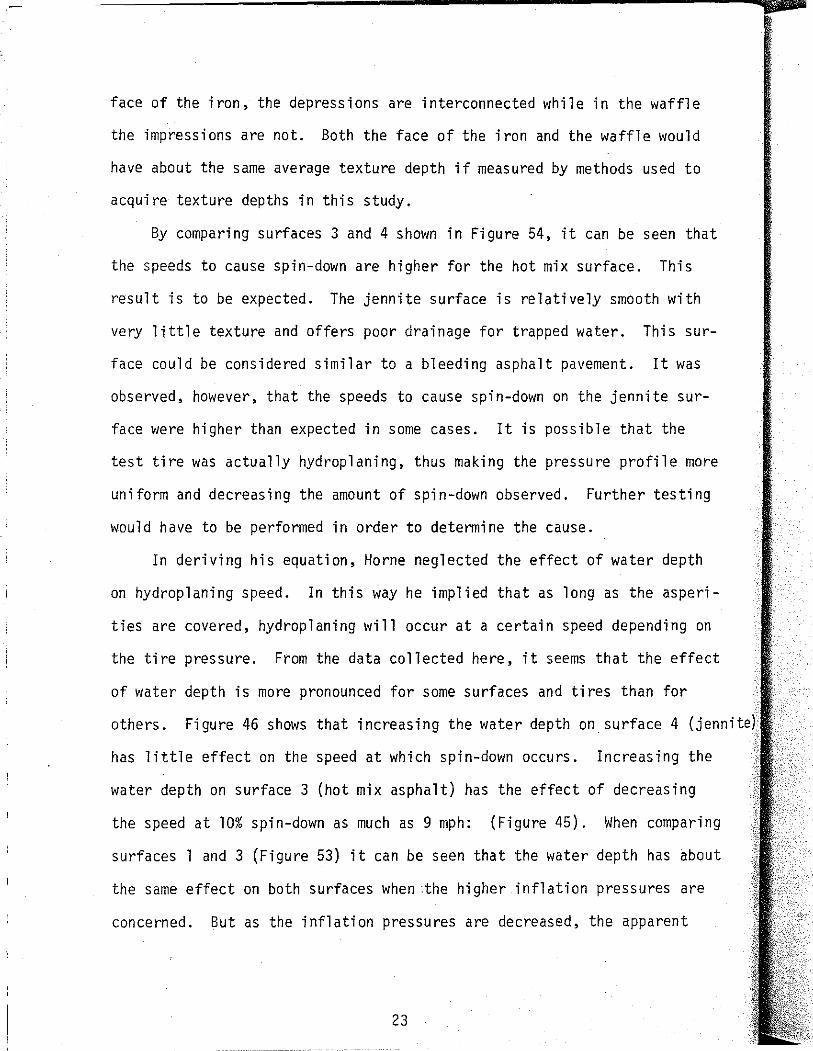
face of the iron, the depressions are interconnected while in the waffle
the impressions are not. Both the face of the iron and the waffle would
have about the same average texture depth if measured by methods used to
acquire texture depths in this study.
By comparing surfaces 3 and 4 shown in Figure 54, it can be seen that
the speeds to cause spin-down are higher for the hot mix surface. This
result is to be expected. The jennite surface is relatively smooth with
very little texture and offers poor drainage for trapped water. This sur
face could be considered similar to a bleeding asphalt pavement. It was
observed, however, that the speeds to cause spin-down on the jennite sur
face were higher than expected in some cases. It is possible that the
test tire was actually hydroplaning, thus making the pressure profile more
uniform and decreasing the amount of spin-down observed. Further testing
would have to be performed in order to determine the cause.
In deriving his equation, Horne neglected the effect of water depth
on hydroplaning speed. In this way he implied that as long as the asperi
ties are covered, hydroplaning will occur at a certain speed depending on
the tire pressure. From the data collected here, it seems that the effect
of water depth is more pronounced for some surfaces and tires than for
others. Figure 46 shows that increasing the water depth on surface 4 (jenni
has little effect on the speed at which spin-down occurs. Increasing the
water depth on surface 3 (hot mix asphalt) has the effect of decreasing
the speed at 10% spin-down as much as 9 mph: (Figure 45). When comparing
surfaces 1 and 3 (Figure 53) it can be seen that the water depth has about
the same effect on both surfaces when :the higher inflation pressures are
concerned. But as the inflation pressures are decreased, the apparent
23
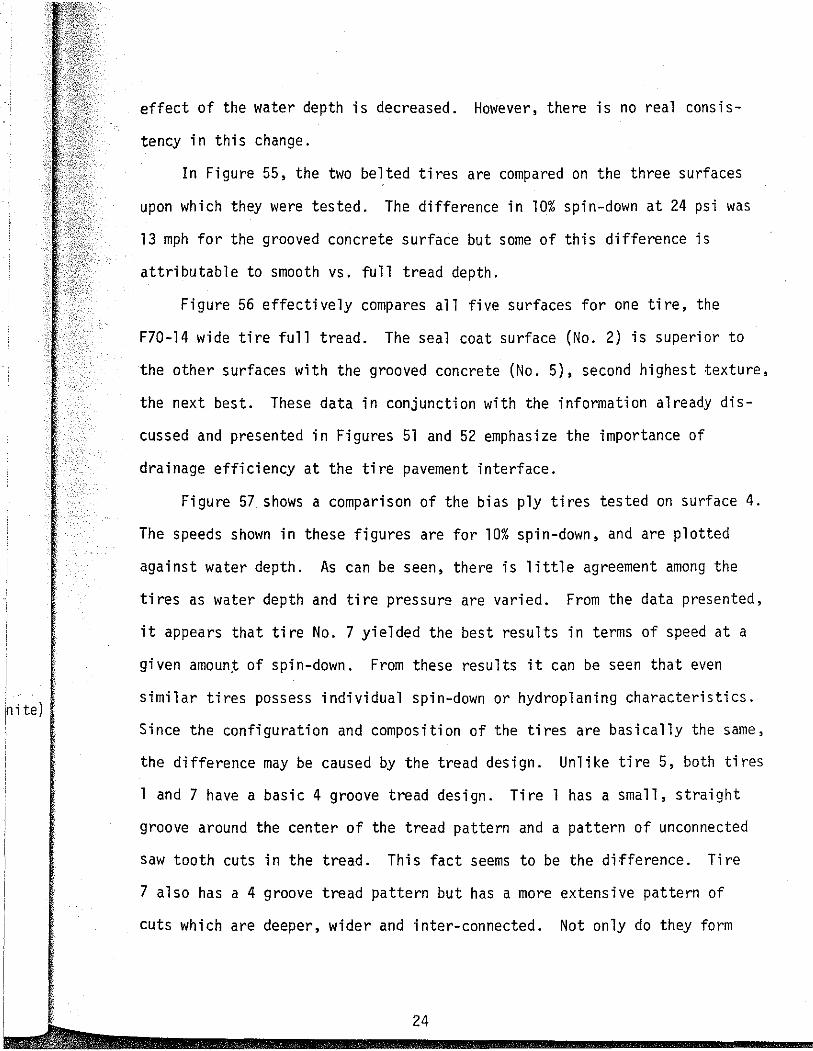
effect of the water depth is decreased. However, there is no real consis
tency in this change.
In Figure 55, the two belted tires are compared on the three surfaces
upon which they were tested. The difference in 10% spin-down at 24 psi was
13 mph for the grooved concrete surface but some of this difference is
attributable to smooth vs. full tread depth.
Figure 56 effectively compares all five surfaces for one tire, the
F70-14 wide tire full tread. The seal coat surface (No. 2) is superior to
the other surfaces with the grooved concrete (No. 5), second highest texture,
the next best. These data in conjunction with the information already dis
cussed and presented in Figures 51 and 52 emphasize the importance of
drainage efficiency at the tire pavement interface.
Figure 57 shows a comparison of the bias ply tires tested on surface 4.
The speeds shown in these figures are for 10% spin-down, and are plotted
against water depth. As can be seen, there is little agreement among the
tires as water depth and tire pressure are varied. From the data presented,
it appears that tire No. 7 yielded the best results in terms of speed at a
given amount of spin-down. From these results it can be seen that even
similar tires possess individual spin-down or hydroplaning characteristics.
Since the configuration and composition of the tires are basically the same,
the difference may be caused by the tread design. Unlike tire 5, both tires
1 and 7 have a basic 4 groove tread design. Tire 1 has a small, straight
groove around the center of the tread pattern and a pattern of unconnected
saw tooth cuts in the tread. This fact seems to be the difference. Tire
7 also has a 4 groove tread pattern but has a more extensive pattern of
cuts which are deeper, wider and inter-connected. Not only do they form
24
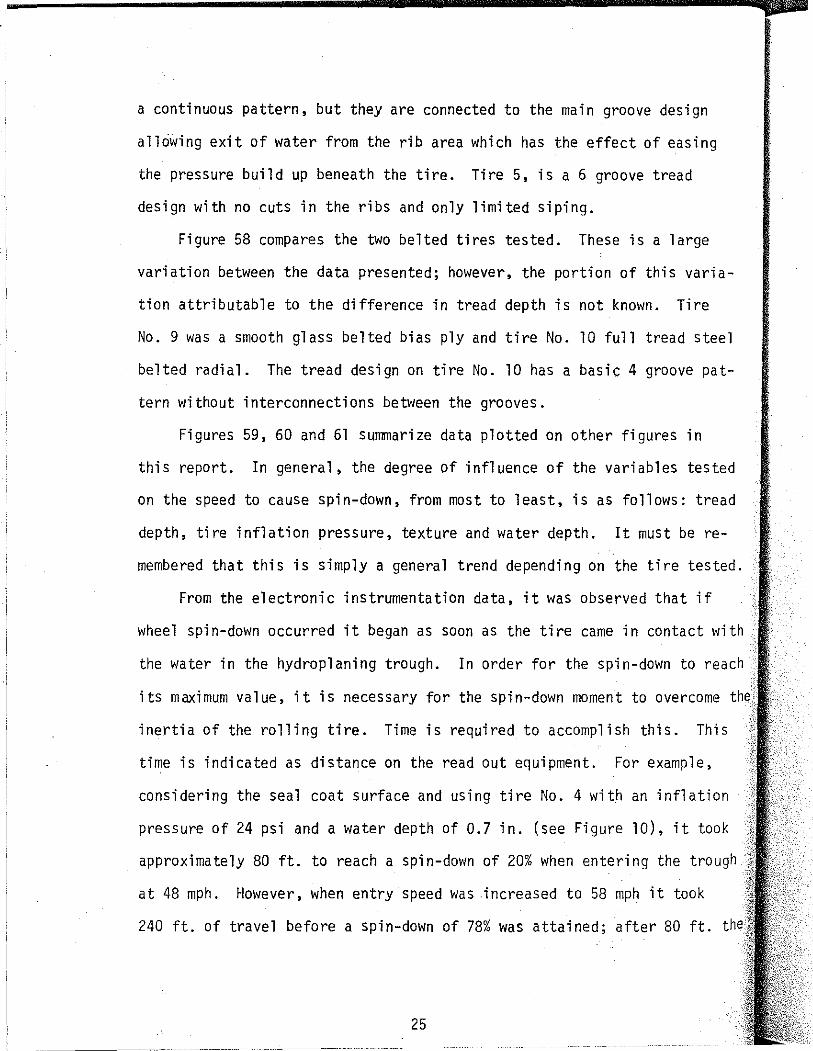
a continuous pattern, but they are connected to the main groove design
allowing exit of water from the rib area which has the effect of easing
the pressure build up beneath the tire. Tire 5, is a 6 groove tread
design with no cuts in the ribs and only limited siping.
Figure 58 compares the two belted tires tested. These is a large
variation between the data presented; however, the portion of this varia
tion attributable to the difference in tread depth is not known. Tire
No. 9 was a smooth glass belted bias ply and tire No. 10 full tread steel
belted radial. The tread design on tire No. 10 has a basic 4 groove pat
tern without interconnections between the grooves.
Figures 59, 60 and 61 summarize data plotted on other figures in
this report. In general, the degree of influence of the variables tested
on the speed to cause spin-down, from most to least, is as follows: tread
depth, tire inflation pressure, texture and water depth. It must be re
membered that this is simply a general trend depending on the tire tested.
From the electronic instrumentation data, it was observed that if
wheel spin-down occurred it began as soon as the tire came in contact with
the water in the hydroplaning trough. In order for the spin-down to reach
its maximum value, it is necessary for the spin-down moment to overcome
inertia of the rolling tire. Time is required to accomplish this. This
time is indicated as distance on the read out equipment. For example,
considering the seal coat surface and using tire No. 4 with an inflation
pressure of 24 psi and a water depth of 0.7 in. (see Figure 10), it took
approximately 80 ft. to reach a spin-down of 20% when entering the trough
at 48 mph. However, when entry speed was .increased to 58 mph it took
240 ft. of travel before a spin-down of 78% was attained; after 80 ft.
25

. 1
1g
tee 1
Ja t-
>ted
·ead
:ted.
i
with i
'each
ie the
is
,on I
Jok
I ugh
the
tachometer generator traces indicated a wheel spin-down of approximately
20%. The important point here is that the tire is influenced immediately
when it comes in contact with the water.
Therefore, it can be concluded that partial loss of pavement contact
or partial loss of traction occurs soon after the tire comes in contact
with a flooded pavement. If the flooded portion of pavement is not long
and the vehicle is not subjected to abnormal maneuvers, the tractive force
may be regained before a hazardous condition develops. For a given vehicu
lar ground speed that is high enough to cause wheel spin-down, it can
said that the probability of a hazardous vehicle control condition developing
increases with increasing length of the flooded pavement.
26

VI. APPLICABILITY TO
SAFE WET WEATHER SPEEDS
In legislative action, Section 167 of Senate Bill No. 183, 62nd
Legislature, the State of Texas has given authority to the Highway Commission
to set wet weather speed limits at specific places on Texas highways.
Although by no means encompassing all the factors which could be con-
sidered in· determining safe speeds, the current data on hydroplaning
give indications of the speeds which result in a potentially marginal
condition with regard to vehicle control. Hydroplaning is only one of
the many factors which must be considered in determining safe speeds.
It is limited to the case when a significant depth of water is encountered
on the roadway due to an exceptionally high intensity rain or to poor
drainage, puddles, wheel ruts, low cross slopes, etc.
In the discussion presented in this section, it is assumed that a
10% spin-down of a free rolling automobile wheel signifies the approach
of a control problem due to either loss of stopping capability or loss
in directional control. In this section the 10% spin-down speed will
be called the "critical speed''.
Figures 62 thru 65 show approximate curves which represent the
data developed. The effects of pavement texture, tire pressure and tire
type or condition are shown by these curves. Several tires are used
to illustrate the various effects.
Bias ply tires 7 and 8 represent full tread depth and smooth tires
respectively. Tire No. 4 is full tread depth with a wide tire configuraticn.
Wheel load in all cases is 1085 lbs.
27
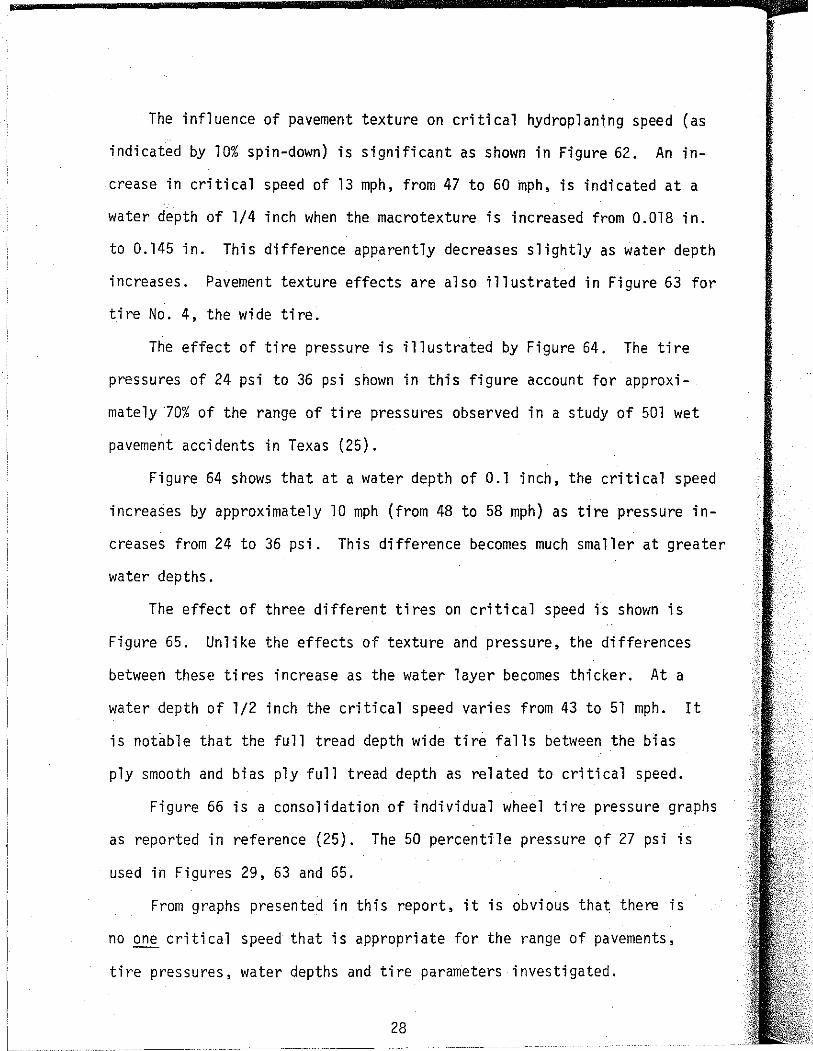
The influence of pavement texture on critical hydroplaning speed (as
indicated by 10% spin-down) is significant as shown in Figure 62. An in
crease in critical speed of 13 mph, from 47 to 60 mph, is indicated at a
water depth of 1/4 inch when the macrotexture is increased from 0.018 in.
to 0.145 in. This difference apparently decreases slightly as water depth
increases. Pavement texture effects are also illustrated in Figure 63 for
tire No. 4, the wide tire.
The effect of tire pressure is illustrated by Figure 64. The tire
pressures of 24 psi to 36 psi shown in this figure account for approxi
mately ·70% of the range of tire pressures observed in a study of 501 wet
pavement accidents in Texas (25).
Figure 64 shows that at a water depth of 0.1 inch, the critical speed
increases by approximately 10 mph (from 48 to 58 mph) as tire pressure in
creases from 24 to 36 psi. This difference becomes much smaller at greater
water depths.
The effect of three different tires on critical speed is shown is
Figure 65. Unlike the effects of texture and pressure, the differences
between these tires increase as the water layer becomes thicker. At a
water depth of l/2 inch the critical speed varies from 43 to 51 mph. It
is notable that the full tread depth wide tire falls between the bias
ply smooth and bias ply full tread depth as related to critical speed.
Figure 66 is a consolidation of individual wheel tire pressure graphs
as reported in reference (25). The 50 percentile pressure of 27 psi is
used in Figures 29, 63 and 65.
From graphs presented in this report, it is obvious that there is
no one critical speed that is appropriate for the range of pavements,
tire pressures, water depths and tire parameters investigated.
28
er
Partial hydroplaning, and thus some loss of vehicle control, may result
at speeds significantly below the posted speed limit on major rural highways
in Texas. No critical speeds below 39 mph were found and a speed of 50 mph
seems to be the approximated median value for all parameters investigated.
It is therefore suggested that a reduction of speed to 50 mph be con
sidered on any section of highway where water can accumulate to depths of
0.1 inch or more during wet periods. Further improvements in the safety
of these sections can be made if a high macrotexture surface is placed and
maintained.
It has been conclusively shown by numerous tests that the hydroplaning
phenomenon can occur for many tires and recommended tire pressures at
speeds lower than current speed limits. It is possible, however to design
highways so that hydroplaning will be an extremely rare occurrence. Ivey
(53) has shown that high intensity rainfall is a rare occurrence in Texas,
with a probability of experiencing over one inch per hour less than 0.05%
of the time. The highway engineer has the prerogative, based on this
study to choose an appropriate design rainfall. If this is done, the
following is an example of what design criteria can be applied to make
hydroplaning a remote possibility.
Example: Assume that the design rainfall has been chosen
as l in./hr. (This then means that less rainfall occurs 99.95%
of the time.) Based on the fact that hydroplaning cannot
occur at zero water depth, defined as that depth coincident
with the tops of the pavement surface asperities, choose
appropriate combinations of cross slopes and textures for
various drainage path lengths which will give a zero water
29
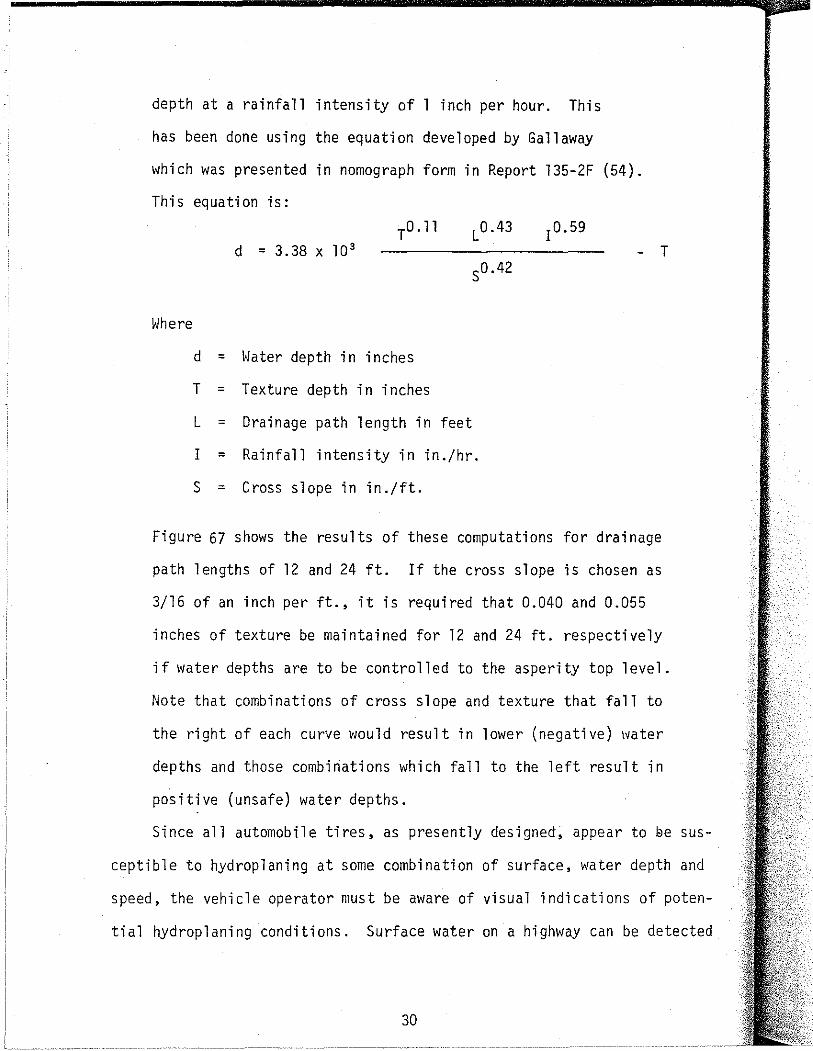
depth at a rainfall intensity of 1 inch per hour. This
has been done using the equation developed by Gallaway
which was presented in nomograph form in Report 135-2F (54).
This equation is:
L0.43 d = 3. 38 X 10 3 - T
Where
d = Water depth in inches
T = Texture depth in inches
L = Drainage path length in feet
I = Rainfall intensity in in./hr.
s = Cross slope in in./ft.
Figure 67 shows the results of these computations for drainage
path lengths of 12 and 24 ft. If the cross slope is chosen as
3/16 of an inch per ft., it is required that 0.040 and 0.055
inches of texture be maintained for 12 and 24 ft. respectively
if water depths are to be controlled to the asperity top level.
Note that combinations of cross slope and texture that fall to
the right of each curve would result in lower (negative) water
depths and those combinations which fall to the left result in
positive (unsafe) water depths.
Since all automobile tires, as presently designed; appear to 8e sus
ceptible to hydroplaning at some combination of surface, water depth and
speed, the vehicle operator must be aware of visual indications of poten
tial hydroplaning conditions. Surface water on a highway can be detected
30

~ !
by a driver and speed reduced appropriately. Some of the visual indica
tions of dangerous water accumulations are as follows:
A. Puddling in low spots and wheel ruts appear as very
shiney areas on the road surface.
B. The coarser the texture of the pavement, the less light
reflected from the surface.
C. Traffic will indicate to the driver the water quantity
on the road by the amount of spray produced by tires.
D. Traffic tire tracks tend to wipe the surface. The
length of time these wiped tracks are visible, par
ticularly in areas where drainage is crossing the
road, is an indication of the amount of water present.
31
VII. CONCLUSIONS
The following general conclusions are based upon the data obtained
from the tests performed at the Texas Transportation Institute's Research
Annex and the assumption that 10% spin-down causes a sufficient reduction
in the frictional coefficient so that vehicle stability is affected.
1. Wheel spin-down is normally initiated at a ground speed
that falls within 70% of the critical hydroplaning
speed predicted by Horne's NASA equation. Total spin
down (wheel stops rotating) may occur at speeds lower
than those predicted by Horne.
2. As the tire tread becomes worn, the drainage provided by
the tread becomes less efficient and the speed to cause
a given amount of spin-down is decreased. Speeds to
cause spin-down on worn tires are considerably less than
for tires with a full tread depth.
3. Decreasing the tire inflation pressure has the effect of
increasing the area of the contact zone. In the majority
of cases, the larger the area of the contact zone, the
lower the speed to cause spin-down.
4. Increasing the tire width has the effect of decreasing
the critical speed.
5. An increase in water depth generally has the effect of
decreasing the speed at which wheel spin-down is
initiated.
6. An increase in the macrotexture of the pavement increases
the speed at which spin-down occurs. The interconnection
32
I
of drainage channels in the pavement surface is an
important factor in minimizing hydroplaning.
7. Even though a tire may not have reached the total
hydroplaning speed, a hazardous condition may exist
when the wheel has partially spun down and some tire
roadway surface friction has been lost.
8. Many factors must be considered in determining safe
wet weather speeds. From a hydroplaning standpoint,
it is suggested that a reduction of speed to 50 mph
be considered on any section of highway where water
can accumulate to depths of 0.1 inch.
33

REFERENCES
1. Allbert, B. J., "Tire and Hydroplaning," Society of Automotive Engineers, Automotive Engineering Congress, Detroit, Michigan, January 8-12, 1968.
2. All bert, B. J., Walker, J. C., and Maycock, G., "Tyre to Wet Road Friction," Proceedings of the Institution of Mechanical Engineers, Volume 180, Part 2A, No. 4, 1966.
3. Ashkar, B. H., "Development of a Texture Profile Recorder," Texas Highway Department, Report No. 133-2, 15 pp., July 1970.
4. Barrett, R. V., "Drag and Spray Measurements from a Small Phenumatic Tyre Travelling through a Water Layer," Technical Information and Library Services, Ministry of Aviation, December 1963.
5. Beaton, J. L., Zube, E., and Skog, J., "Reduction of Accidents by Pavement Grooving," Highway Research Board Special Reports, No. 101, pp. 110-125,5 fig., 4 tab., 6 ref., 1 app., 1969.
6. Bevilacqua, E. M., and Percarpio, E. P., "Fundamental Aspects of Lubricated Friction of Rubber- VII: Notes on a Standard Tire and Procedure for Skid Testing," Presented at a meeting of the Division of Rubber Chemistry, April 23-26, 1968.
7. Bevilacqua, E. M., and Percarpio, E. P., ''Lubricated Friction of Rubber," Reprinted from Rubber Chemistry and Technology, Vol. 41, No. 4, September 1968.
8. Colley, B. E., Christensen, II. P., and Nowlen, W. J., "Factors Affecting Skid Resistance and Safety of Concrete Pavements," Hi gh11ay Research Board Speci a 1 Reports, No. 101 , pp. 80-99, 19 fig. , 4 tab., 38 ref. , 1969.
9. Daughaday, H., and Balmer, G. G., "A Theoretical Analysis of Hydroplaning Phenomena," Prepared for Presentation before Committee D-B4 - Surface Properties - Vehicle Interaction, Highway Research Board, Washington, D. C., January 14, 1970.
10. Davisson, J. A., "Basic Test Methods for Evaluating Tire Traction," Society of Automotive Engineers, Automotive Engineering Congress, Detroit, Michigan, January 8-12, 1968.
11. DeVinney, Halter E., "Factors Affecting Tire Traction," Society of Automotive Engineers, Mid-Year Meeting, Chicago, Illinois, May 15-19, 1967.
34
I
12. Dreher, Robert C., and Horne, Halter B., "Ground-Run Tests with a Bogie Landing Gear in Water and Slush,'' NASA Technical Note D-3515, National Aeronautics and Space Administration, Washington, D, C., July 1966.
13. Dugoff, Howard, and Ehrlich, I. Robert, "Laboratory-Scale Model Experiments to Investigate Aircraft Tire Hydroplaning," Reprinted from Proceedings, of the Seventh Annual National Conference on Environmental Effects on Aircraft and Propulsion Systems.
14. Dugoff, H., and Fancher, P. S., ''An Analysis of Tire Traction Properties and Their Influence on Vehicle Dynamic Performance," International Auto Safety Conference Compendium, pp. 341-366, 1970.
15. Ehrlich, I. R., Shaefer, A. R., and Wray, G. A., "Parameters Affecting Model-Tire Hydroplaning and Rolling Restoration," Davidson Laboratory Report SIT-DL-70-1408, March 1970, Stevens Institute of Technology, Castle Point Station, Hoboken, N.J.
16. Eshel , A. , "A Study of Tires on A Wet Runway," Fi na 1 Report Prepared under Contract No. NASW-1408, National Aeronautics and Space Administration, Ampex Corporation, Research and Engineering Publication, September 1967.
17. French, T., "Developments in Tyres Relating to Vehicle Safety and Accident Prevention," Dunlop Rubber Co., Ltd., Fort Dunlop, Erdington, Birmingham.24, England, August 1964.
18. French, T., and Hofferberth, Dr. W., "Tyre Development and Application," the Dunlop Company Limited, Presentation to the International Rubber Conference, Brighton, England, May 15-18, 1967.
19. Gengenbach, Herner, "The Effect of Wet Pavement on the Performance of Automobile Tires," Cornell Aeronautical Laboratory, Inc., Buffalo, New York, July 1967.
20. Gingell, V. R., "Grooving the Runway at Washington National Airport," Civil Engineering, ASCE, Vol. 39, No. 1, pp. 31-33, 1 fig., 3 phot., January 1969.
21 ·Goodwin, ~~. A., "Pre-Evaluation of Pavement f~aterials for Skid-Resistance A Review of U. S. Techniques," Highway Research Board Special Reports, No. 101, pp. 69-79, 10 fig., 15 ref., 1969.
22. Gough, V. E., and Badger, D. W., "Tyres and Road Safety," Presented at the Fifth World Meeting of the International Road Federation, London, September 18-24, 1966. ·
23. Gray, W. E., "Measurements of 'Aquaplaning Height' on a f1eteor Aircraft, and Photos of Flow Pattern under a t1ode 1 Tyre," Aeronautical Research Council Current Papers, Ministry of Aviation, London, 1964.
35
24. Grosch, K. A., and Maycock, G., "Influence of Test Conditions on The Wet Skid Resistance of Tyre Tread Compounds," Rubber Industry, Inst. Trans., Vol. 42, No.6, pp. 380-406,9 fig., 10 tab., 6 phot., 19 ref., December 1966.
25. Hankins, Kenneth D., Morgan, Richard B., Bashar, Ashkar and Tutt, Paul R., "The Degree of Influence of Certain Factors Pertaining to the Vehicle and the Pavement on Traffic Accidents Under Wet Conditions," Texas Highway Department, Departmental Research, Report No. l33-3F, September 1970.
26. Holmes, K. E. and Stone, R. D., "Tire Forces as Functions of Cornering and Braking Slip on Wet Road Surfaces," Ministry of Transport, London, RRL Rept. LR 254, 42 pp., 1969.
27. Horne, Walter B., and Dreher, Robert C., "Phenomena of Pneumatic Tire Hydroplaning," NASA Technical Note D-2056, National Aeronautics and Space Administration, Washington, D. C., November 1963.
28. Horne, Walter B., "Interactions Between a Pneumatic Tire and a Pavement Surface," presented at the Bureau of Public Roads Program Review Meeting, Gaithersburg, Maryland, December 6-8, 1966.
29. Horne, Walter B., and Joyner, Upshur T., "Pneumatic Tire Hydroplaning and Some Effects on Vehicle Performance," Society of Automotive Engineers, International Automotive Engineering Congress.
30. Horne, Walter B., and Leland, Trafford J. W., "Influence of Tire Tread Pattern and Runway Surface Condition on Braking Friction and Rolling Resistance of a Modern Aircraft Tire," NASA Technical Note D-1376, National Aeronautics and Space Administration, Washington, D. C., September 1962.
31. Horne, Walter B., "Skidding Accidents on Runways,and Highways Can Be Reduced," reprinted fr.om Astronautics & Aeronautics, August 1967.
32. Horne, Walter B., "Tire Hydroplaning and Its Effects on Tire Traction," presented at the Forty-Sixth Annual Meeting of the Highway Research Board, Washington, D. C., January 16-20, 1967.
33. Kessinger, B. G., and Neilson, W. D., ''Skid Resistance Study (Type B), "Arkansas State Highway Department, Federal Highway Administration, HRC-27.
34. Leland, T. J. W., Yager, Thomas J., and Upshur, T. Joyner, "Effects of Pavement Texture on Wet-Runway Braking Performance," NASA Technical Note D-4323, Washington, D. C., January 1968.
36

35. Martin, C. S., "Hydrodynamics of Tire Hydroplaning," Final Report, Project B-608, prepared for National Aeronautics and Space Administration by the School of Civil Engineering, Georgia Institute of Technology, Atlanta, Georgia, June 15, 1966.
36. Martin, F. R., and Judge, R. F. A., "Airfield Pavements: Problems of Skidding and Aquaplaning,'' reprinted from Civil Engineering, 8 Buckingham Street, London, W. C. 2, December 1966.
37. Meyer, W. E., "Pavement Friction and Temperature Effects, "Highway Research Board Special Reports, No. 101, pp. 47-55, 15 fig., ll ref., 1969.
38. Moore, D. F., ''The Logical Design of Optimum Skid-Resistant Surfaces," Highway Research Board Special Reports, No. 101, pp. 39-45, 7 fig., 11 ref., 1969.
39. Moore, D. F., "Drainage Criteria for Runway Surface Roughness," Journal of the Royal Aeronautical Society, May 1965, pp. 337-342.
40. Moore, D. F., "A Review of Squeeze Films," Wear, Vol. 8, No. 4, July/August 1965, pp. 245-263.
41. "Reducing Hazards on Slippery Runways," Engineering, UK, Vol. 204, No. 5303, p. 912, December 8, 1967.
42. Saal, R. N. J., "Laboratory Investigation into the Slipperiness of Roads," Chemistry and Industry, Jan. 3, 1936.
43. Sabey, B. E., and tlilliams, T., "Factors Affecting the Friction of Tires on viet Roads," International Auto Safety Conference Compendium, pp. 324-340, 1970.
44. Segel, Leonard, Ludema, K. C., and Dugoff, H. J., ''New Areas for Tire Performance Methods," American Society for Testing and Materials, Philadelphia, Pa., June 1968.
45. Staughton, G. C., and Williams, T., "Tyre Performance in Wet S.urface Conditions," Road Research Laboratory Report LR 355, 1970, Road Research Laboratory, Crowthorne, Berkshire.
46. Stocker, A. J., and Gregory, R. T., "Construction of a ·Facility to Study Variables Associated with Hydroplaning," Texas Transportation Institute Progress Report No. 1, Study No. 2-8-70-147, HPR-1(9), Texas A&M University, College Station, Texas, March 1971.
47. Tarpinian, H. D., "Equipment for Measuring Forces and ~1oments on Passenger Tires," Society of Automotive Engineers, International Automotive Engineering Congress, Detroit, Michigan, January 13-17, 1969.
37

48. "The Influence of the Road Surface on Skidding," Symposium, October 16, 1968, Salford Royal Advanced Tech. Coll., October 1968.
49. Tsakonas, S., Henry, C. J., and Jacobs, W. R., "Hydrodynamics of Aircraft Tire Hydroplaning," prepared under Contract No. NSR31-003-016 for National Aeronautics and Space Administration, NASA Contract Report CR-1125, ~lashington, D. C., August 1968.
50. Wray, G. A., and Jurkat, M. P., "Derivation of an Empirical Equation Relating Critical Hydroplaning Speed, Water Film Thickness and Nominal Contact Patch Bearing Pressure for an 8" Diameter Polyurethane Mode 1 Tire," Davidson Laboratory Report SIT -DL-70- 1479, March 1970, Stevens Institute of Technology, Castle Point Station, Hoboken, New Jersey.
51. Yager, Thomas J., "Hydroplaning -A Factor in Skidding," Presented at the Twelfth Annual Alabama Highway Engineering Conference, Auburn, Alabama, April 1-2, 1969.
52. Zube, E., Skog, J. B., and Kemp, G. R., "Field and Laboratory Studies on Skid Resistance of Pavement Surfaces," California Division of Highways, Bureau of Public Roads, HPR-1(5), B-3-1.
53. Ivey, D. L. and Lehtipuu, E. K.,"Rainfall and Visibility, The View from Behind the Wheel;'' Res. Rept. No. 135-3, Texas Transportation Institute, August 1974.
54. Ivey, D. L., Hankins, K. D. and Weaver, G. D., "Factors Vehi c 1 e Skids: A Basis for Wet Weather Speed Zoning," 135-2F, Texas Transportation Institute, February 1973.
38
Affecting Res. Rept.
/
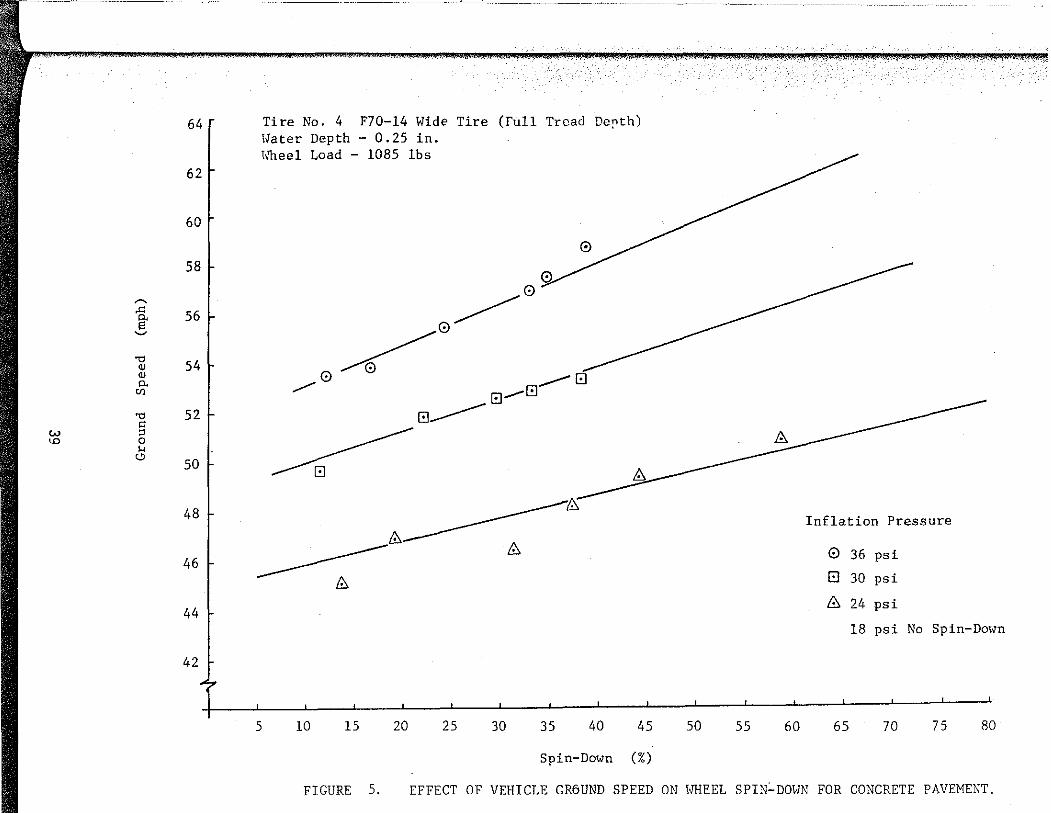
64
62
60
58
~
.<: ~ 56 '-'
""' <U 54 <U p.
"' ""' (j
52 w " \0 0 ,..
"' 50
48
46
44
42
Tire No. 4 F70-14 Hide Tire (full Tread Def'th) \<later Depth - 0.25 in. h'heel Load - 1085 lbs
00.
-------0~.
........... 0~
11::,.
~ 11::,.
5 10 15 20
El_El...........-EJ
El----
"0.
11::,.
25 30 35 40 45
Spin-Down (%)
50 55 60
Inflation Pressure
0 36 psi
El 30 psi
11::,. 24 psi
18 psi No Spin-Dmm
65 70 75 80
FIGURE 5. EFFECT OF VEHICLE GR6UND SPEED ON \.JHEEL SPIN:_DO\JN FOR CONCRETE PAVEMENT.

6fj
58
56
~ 54
E ~
52 "0 0) 0)
0.
"' 50 "0
"' _,. " 48
0 0 ... v
46
44
42
Tire No. 4 F70-14 Wide Ti~e (Full Tread Denth) Water Depth - 0.40 in. Hheel Load - 1085 lbs
0
0 ---- 0...-
8 _......----.....-------
0 ----------8
.....----15 _............-8
_............- A 8 8~-8
........... ~ ...........-- iS.
~-·-~ 5 10 15 20 25 30 35
8
.....----- 8 _......
8
40 45
Spin-Do~o~n (%)
__...........-0 0
50 55 60
_......------
Inflation Pressure 0 36 psi
8 30 psi
8 24 psi
-•- 18 psi
65 70 75 80
FIGURE 6. EFFECT OF VEHICLE GROUND SPEED ON W!EEL SPJN-DOh'N FOR CONCRETE PAVEMENT.
85
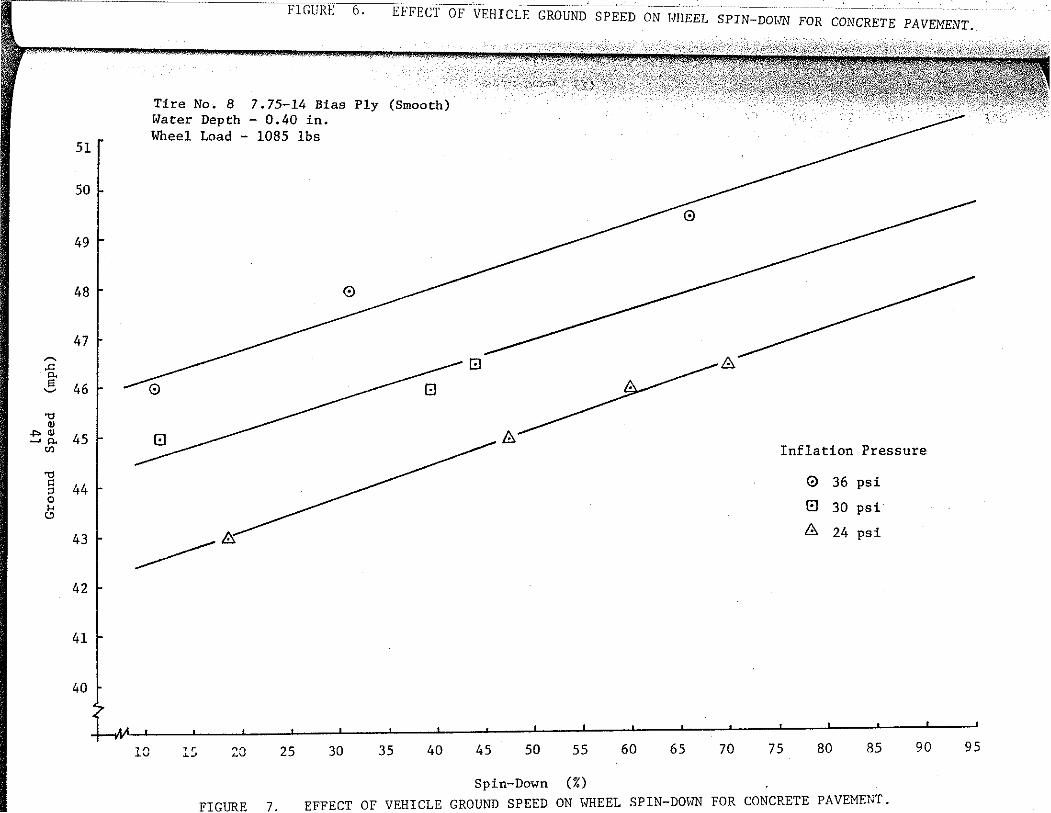
51
50
49
48
47 ~ I .c "" s 46 ~
"tl Q)
..,.Q) 45 ~o.
Cll
"tl 0:
44 " 0
" " 43
42
41
40
EFFECT OF VEHICLE GROUND SPEED ON !VHEEL SPIN-DOh'N FOR CONCRETE PAVEMENT.
Tire No. 8 7.75-14 Bias Ply (Smooth) Water Depth - 0.40 in. Wheel Load - 1085 lbs
0
----------- ---- [!]
~
IX
8 Inflation Pressure
0 36 psi
El 30 psi
&. 24 psi
10 lS ZO 25 30 35 40 45 50 55 60 65 70 75 80 85 90 95
Spin-Down (%)
FIGURE 7. EFFECT OF VEHICLE GROUND SPEED ON HHEEL SPIN-DOI-lN FOR CONCRETE PAVEMENT.

.p. N
50
49
48 I
I 47
~
..c 0.
-.5 46 ~ ., "' "' ~ 45 ., "' " ~ 44
Tire No. 8 7.75-14 Bias Ply (Smooth) Hater Depth- 0.70 in. Hheel Load - 1085 lbs.
0 ~
0
0
"[_@ ____ @
42 . -----& I
41
40 I
~
0
0
0
Inflation Pressure
0 36 psi
0 30 psi & 24 psi
~~~~~~~~~~~~~~~~~~~~
15 20 25 30 35 40 45 so 55 60 65 70 75 80 85 90 95 100

64
62
...... 60 .0:
"' s ~
58
"" "' "' "' "' 56 ..,.
"" w <l
" 0 54 ... ""
52
so
Tire No. 4 F?0-14 \vide Tire (Full Tread Depth) Water Depth - 0.40 in. Hheel Load - 1085 lbs
-·- 0
0/ /-·-
8 ?' /
5 10 15 20
/
G~G
8/
25 30 35 40
Spin-Down (%)
75····· 86 85 90
G~ 8
Inflation Pressure
0 36 psi
G 30 psi
8 24 psi
-·- 18 psi
45 50 55 60 65 70 75 80
FIGURE 9. EFFECT OF VEIIICLE GROUND SPEED ON HHEEL SPIN-DOI.nl FOR SEAL COAT SURFACE TREATMENT.
95 100
85
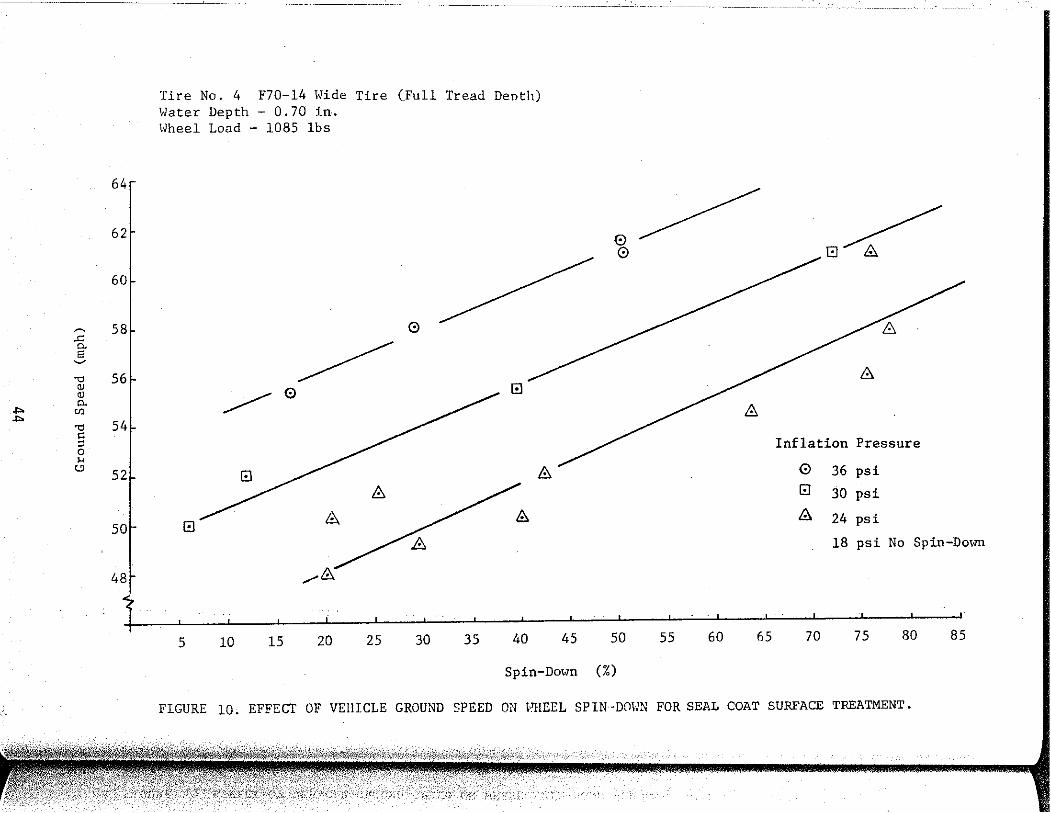
64
62
60
~ 58 .c 0. E ~
""' 56 "' "' 0.
""' "' ""' 54 ""' " " 0 ... l!> 52
5J
48
Tire No. 4 F70-14 Hide Tire (Full Tread Dent h) Hater Depth- 0.70 in. \Vhee1 Load - 1085 lbs
0
~ ~0
0
8
0
_.,...If:{
5 10 15 20 25 30 35 40 45 50
Spin-Dmm (%)
~ ~ 0 8
8
8
Inflation Pressure
0 36 psi 0 30 psi
8 24 psi
18 psi No Spin-Down
55 60 65 70 75 80 85
FIGURE 10. EFFECT OF VEHICLE GROUND SPEED ON \<'HEEL SPIN-DOHN FOR SEAL COAT SURFACE TREATMENT.

~
.c: "" s ~
"" -1=> QJ
01 QJ
"" Cl)
"" <= ::> 0 ... "
Tire No. 8 7.75-14 Bias Ply (Smooth) \,Tater Depth - 0.40 in.
64 r lfuee1 Load - 1085 1bs
62
60 ~ 0 ~/ 58 1- 0
56
54
52 I & /&
50
48
46 .
44
5 10 15 20 25 30 35 40
Spin-Down (%)
ru1t "'"'".u-c:uAT SDRf'ACE. TREATMENT.
Inflation Pressure
0 36 psi
[!] 30 psi
8. 24 psi 18 psi No Spin-Down
45 50 55 60
FIGURE 11. EFFECT OF VEHICLE GROUND SPEED ON I !HEEL SPIN-DO\JN FOR SEAL COAT SURFACE TREATHENT,
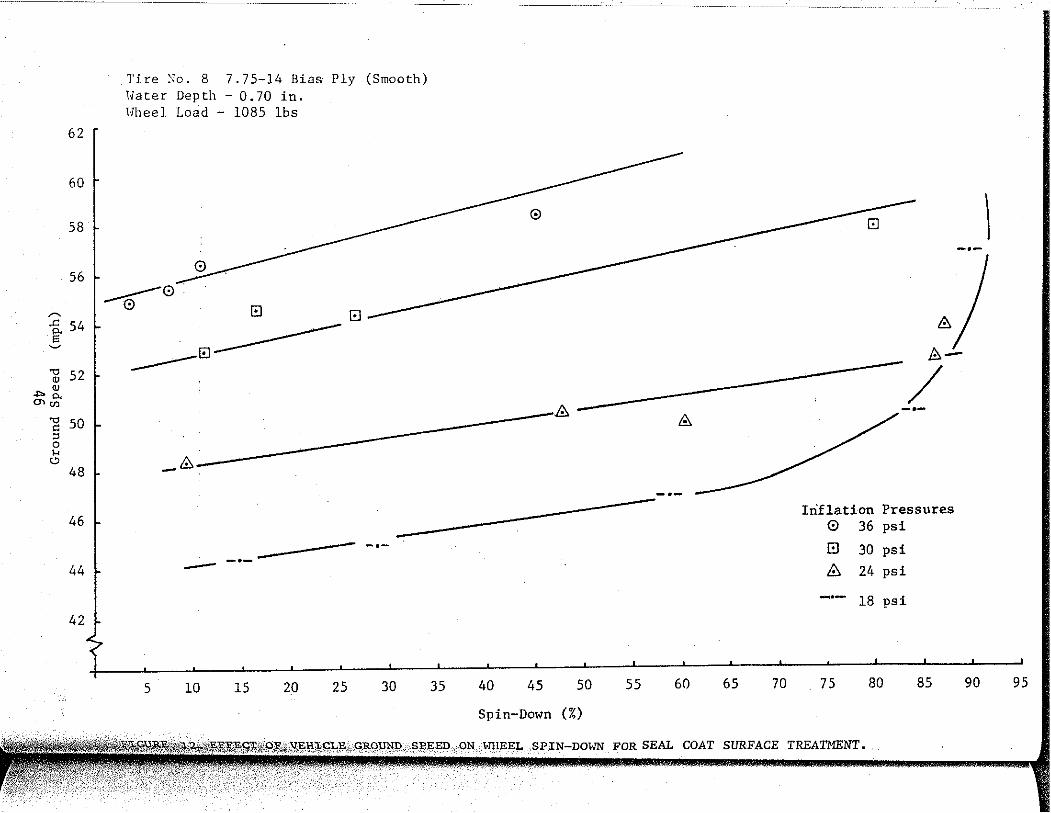
62
60
58
56
~
.c 54 g-~
"' 52 (lJ (lJ ..,."'
"'"' ] 50 " 0 .... '-' 48
46
44
42
Ti. re :·'o. 8 7. 7 5-14 Bias Ply (Smooth) Hater Depth - 0. 70 in. 1.n1eel Load - 1085 1bs
---::::---0 0 t!J
-------
[!)
-·-
&---[!)
_& __________________ & & ~ -·-
-·--·---
5 10 15 20 25 30 35 40 45 50 55 60 65 70
Spin-Down (%)
Inflation Pressures 0 36 psi
El 30 psi
b 24 psi
-·- 18 psi
75 80 85
SPIN-DOWN FOR SEAL COAT SURFACE TREATMENT.
90
'
95
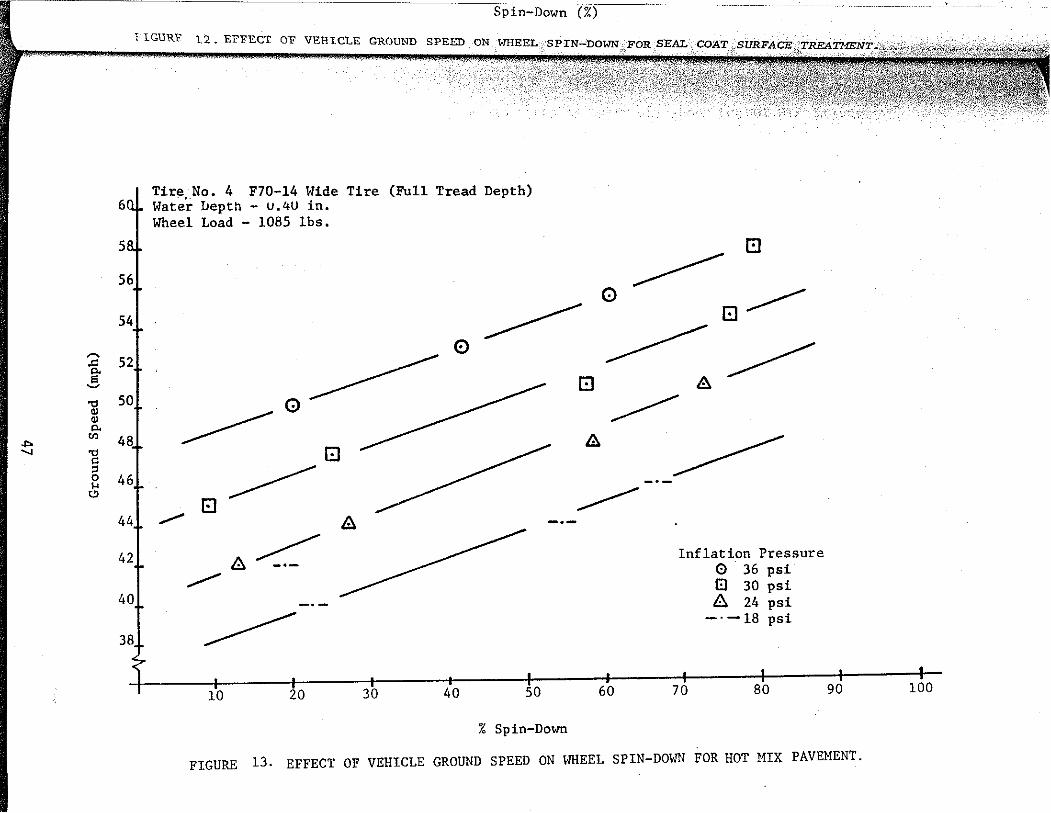
5
56
54
....... 52 .c:
"" a ~
., 50 Ql Ql
"" "' 48 """ ..... .,
c " 0 46 ,...
C>
44
42
40
38
pin-Down (%)
}lGURl' 12. EFFECT OF VEHICLE GROUND
Tire,No. 4 F70-14 Wide Tire (Full Tread Depth) Water Depth - u.4U in. Wheel Load - 1085 lbs.
~ G
0 ~ ~ I!]
~~ -----0 ~0-----
I!]
..,....,... l!l~ b:.~
............
~
10 20 30 40 50
% Spin-Down
I!] 8.
~ b:.
~
60
~
Inflation Pressure 0 · 36 psi 8 30 psi 8. 24 psi
-·-18 psi
70 80 90
FIGURE 13. EFFECT OF VEHICLE GROUND SPEED ON WHEEL SPIN-DOWN FOR HOT 11IX PAVEMENT.
100
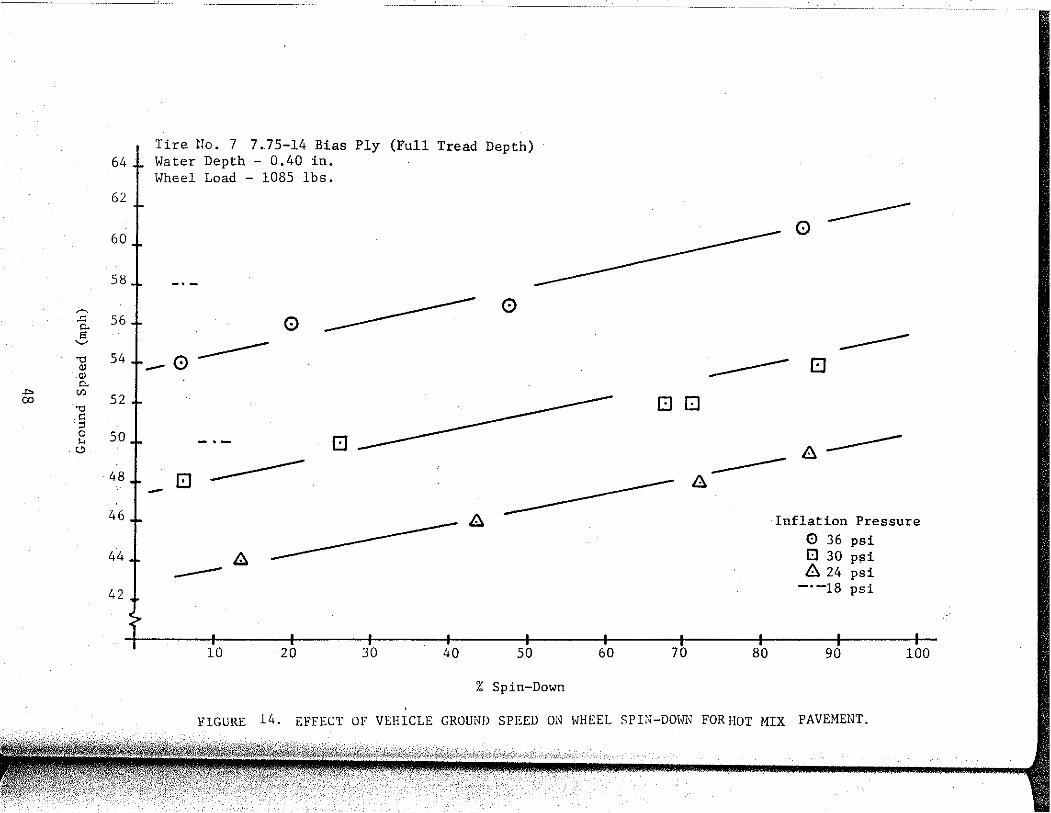
~
.c 0. s ~ .,
QJ QJ 0. _.,. "' (X) ., " •::> 0 ....
. t.!)
Tire l!o. 7 7 •. 75-14 Bias Ply (Full Tread Depth) 64 .L Water Depth - 0.40 in.
Wheel Load - 1085 1bs.
62
60
58
561 0
54 -0---- --------- 0
52
50 EJ
48t- 8 -----46 8
44 .l Ill --I 42
10 20 30 40 50
% Spin-Down
60
0--------
---- 8 00
70
---- 8-----11:.
Inflation Pressure
0 36 psi 0 30 Psi 8. 24 psi
-·-18 psi
80 90 100
FIGURE 14. EFFECT OF VEHICLE GROUND SPEED ON \oJHEEL SPIN-DOHN FORI-lOT MIX PAVEMENT.
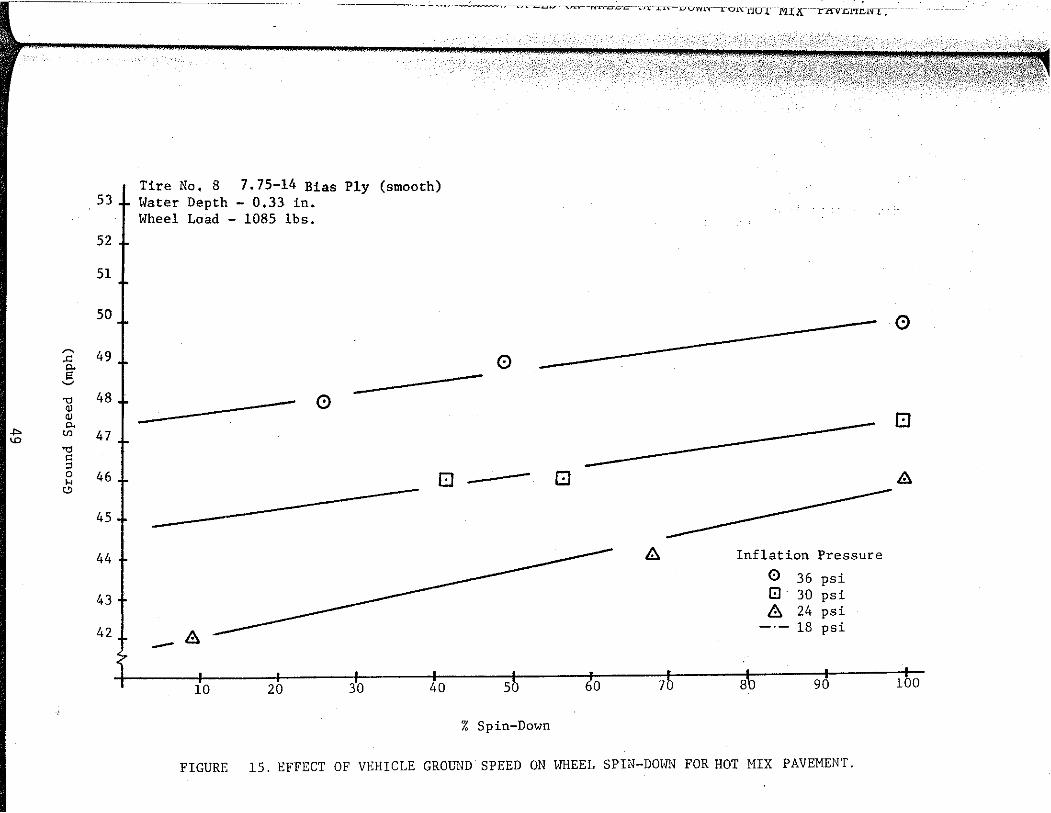
v-..-.---,..,-.-.-=c-.::.--- --.·,r--;.!;T'o---u-owH--l. .. Ol'\. t'llfl"--- '1'1LX. ______ L_KV-Ll~!.t.1'ri--:
Tire No, 8 7. 75-14 Bias Ply (smooth) 53 l~ater Depth - 0,33 in.
Wheel Load - 1085 lbs.
52
51
50 0 ~ 49 .c "" 0 g
'-' ., 48 + 0 '" '" "" G
""" UJ 47 <£> ., " ::l 0 46 .... '-'
G A o--45
44 C::. Inflation Pressure
0 36 psi
43 8 · 30 psi A 24 psi
42 I A - 18 psi
10 20 30 40 50 60 7 8 90 100
% Spin-Down
FIGURE 15. EFFECT OF VEHICLE GROUND SPEED ON WHEEL SPIN-DOWN FOR HOT MIX PAVEMENT.
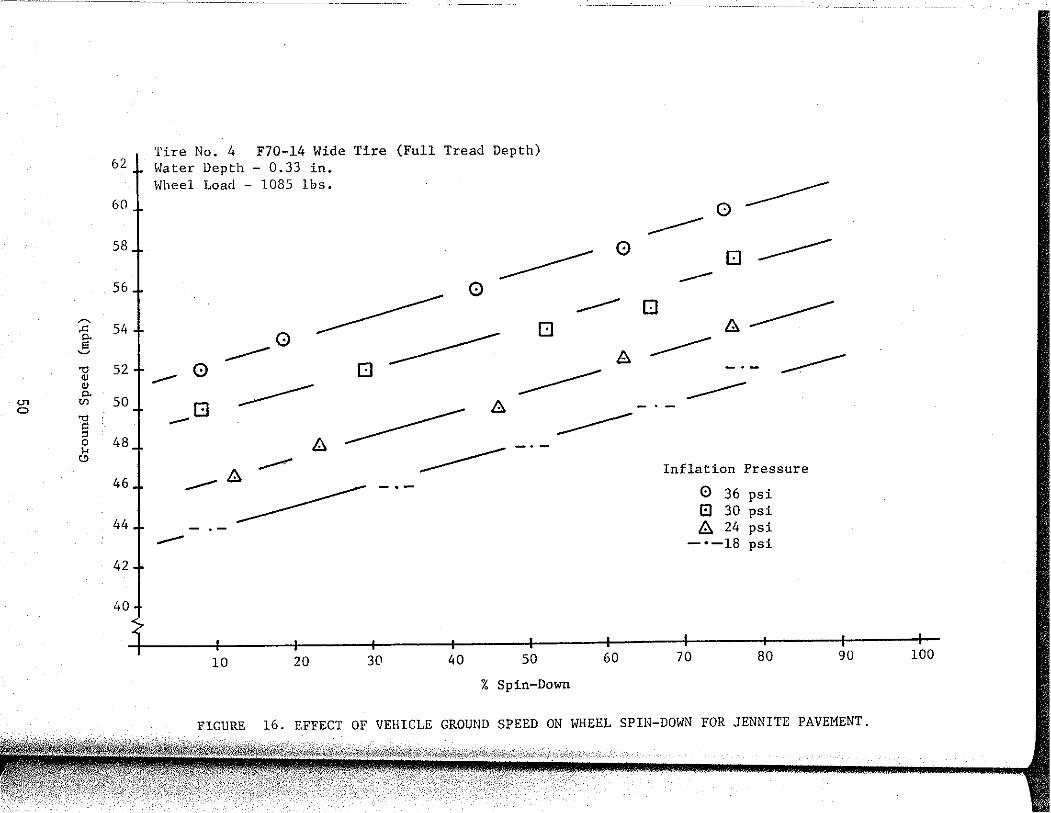
62
60
58
56
~
.c p.
54
" ~ '1::1
'" 52
'" 0. c.n "' 0
50 '1::1
"' ::l 48 0 ,_.
"' 46
44
42
40
Tire No. 4 F70-14 Wide Tire (Full Tread Depth) Water Depth - 0.33 in. Hheel Load - 1085 lbs.
-----0
0
0---------0 --------
------------------------- Q
&. ------
--0
0 ---
--
0 ---------
/;:;.
£\--
0
--------- ll\
------------------
0
------ £:. ---- - . - -----
------- ---. -
Inflation Pressure
0 36 psi 8 30 psi {;:;. 24 psi
-•-18 psi
10 20 30 40 50 60 70 80 90 100
% Spin-Down
FIGURE 16. EFFECT OF VEHICLE GROUND SPEED ON WHEEL SPIN-DOWN FOR JENNITE PAVEMENT.

1 1'TGUKt. · r o. r. r r EGTcJr-vErn-.:;-cic~GKouniT-:>PlcED-ON-wn~:;tL · SPTN"--iJOwN- ~-uK--~rENNT'l'E PAVEMENT.
57
56
55
54
53
52 ~
.c "' 51 13 ~
'1:l 50 Q) Q)
"' Cfl 49 '1:l
"' 0: ~ " 48
0
'" '-' 47
46
45
44
43
42
Tire llo. 4 F70-14 Wide Tire (Full Tread Depth) Water Depth - 0.40 in. Tire Pressure - 18 psi
0 / ----0~
ro 0 3"0 0 5
% Spin-Down
0
0
I 0
I 0
/ 0
/ 0
6"0 0 8ll 0
riS:JRE 17. EFFECT OF VEHICLE GROUND SPEED ON lolllEEL SPIN-DOWN FOR JENNITE PAVEl·!E:IT.
100
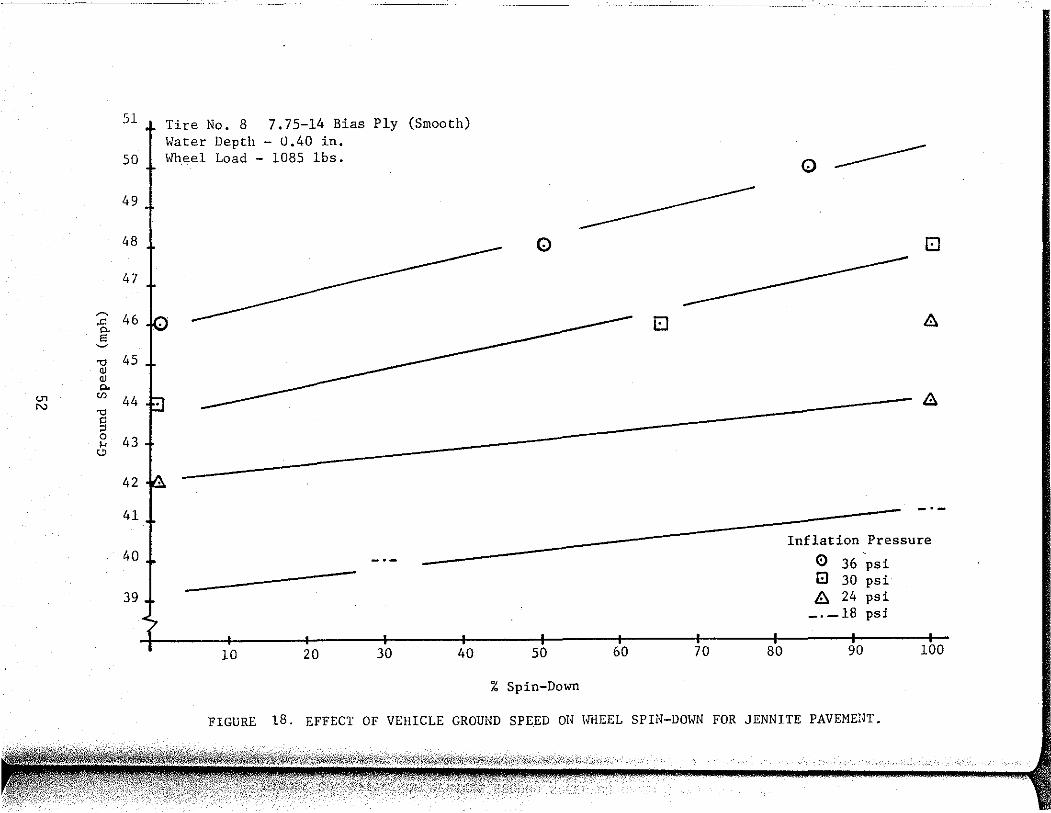
0"1 N
51
50
49
48
47
? 46 !§" ~
"0 45 QJ QJ .,.
Cll 44 "0 § 2 43 '-'
42
41
40
39
Tire No. 8 7. 75-14 Bias Ply (Smooth) Water Depth - 0.40 in. Wheel Load - 1085 lbs. 0 ----
0 EJ
EJ Ill
--- 8
-.-Inflation Pressure
0 36 psi 8 30 psi 8 24 psi
-·-18 psj
10 20 30 40 50 60 70 80 90 100
% Spin-Down
FIGURE 18. EFFECT OF VEHICLE GROUND SPEED ON \ffiEEL SPIN-DOWN FOR JENNITE PAVEMENT.

62
60
58
56 ~
.<:::
54 0. E ~
" 52 QJ QJ 0.
V1 U1 w "0
50 <:: ::l 0 s..
<.!l
48
46
44
42
Tire No.1 7.75-14 Bias Water Depth - 0.40 in. Wheel Load - 1085 lbs.
--IYL Ll..:;.u'l:;----.n-.cLv·-u\Jwr~·- r·o~:C1'11'n-r.r::;·---£"A v l!.I'TJSrf""r~-
Ply (Full Tread Depth)
0 --------6 0
0 -·-
== 0 0 0---·-·
0-·-
~ -·- 6 __........ Inflation Pressure
6 ~
~ 0 36 psi o 30 psi 6 24 psi
-·- -·-.............
5
-0-18 psi
10 15 20 25 30 35 40 45 50 55 60
Spin-Down (%)
FIGURE 19. EFFECT OF VEHICLE GROUND SPEED ON WHEEL SPIN-DOWN FOR LONGITUDIMALLY GROOVED CONCRETE PAVEMENT.
65 70 75 80
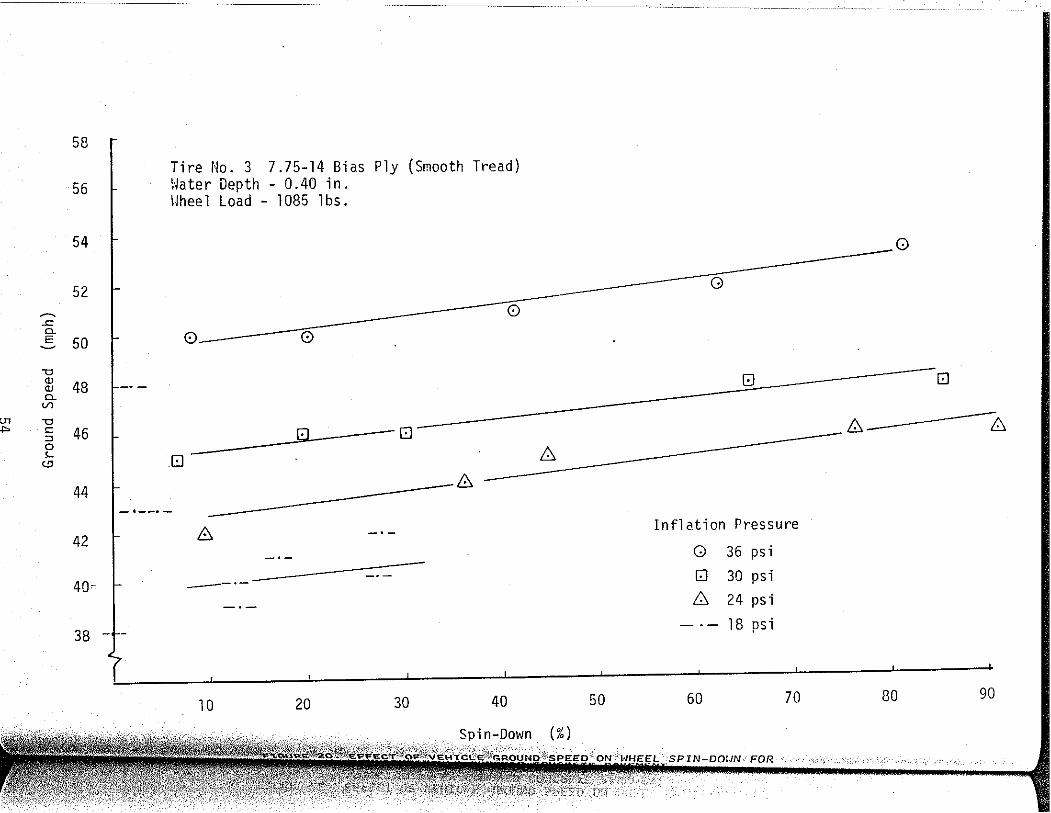
~
-<= c. E ~
"0 ClJ ClJ c. Vl
"0 ..,. <: :::;, 0 ,_
<!>
58
56
54
52
50 1-
48
46
I
44 I
Tire No. 3 7.75-14 Bias Ply (Smooth Tread) Water Depth - 0.40 in. \Jheel Load - 1085 lbs.
0
0 0
Q -[!]-
0
- ·--·- -----8--
42 t- 8
4Qc 1- --·-
38 -~-
'
10 20 30 40
G
0 [!]
8 6
6
Inflation Pressure
G 36 psi [!] 30 psi 6 24 psi
18 psi
50 60 70 80 90
SPif'J-DOtJN-: FOR

10
Spin-Down (%) l=1.GUR£ 2.0.
~
20 30 40 50 60 70
Soin-Do~m (%)
FIGURE 21. EFFECT OF VEHICLE GROUtlD SPEED Drl HHEEL SPIN-DOim FOR LONGITUDHIALL Y GROOVED CONCRETE PAVE!·1ENT.
80
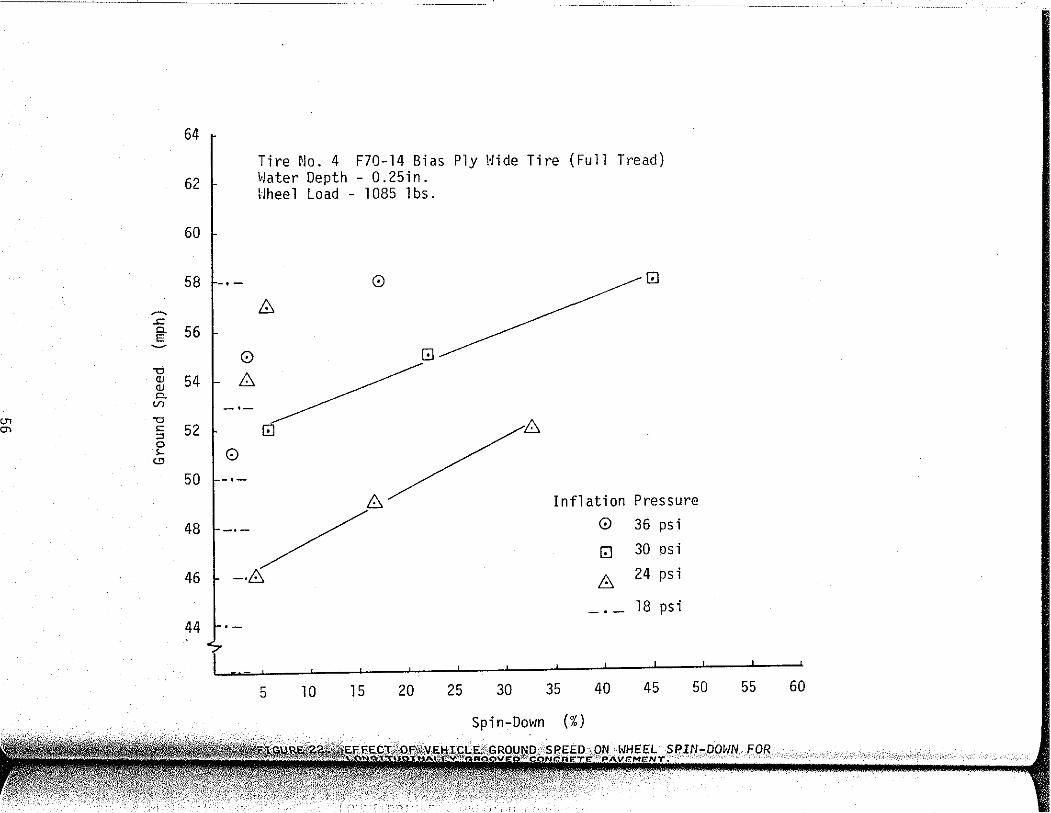
~
.<: Q_
E
-o (!) (!) c. (/)
"' -o <:::
"' 0 s...
""
64
62
60
58
1_. _
56
0 54 ~ 8
52 r 0
50 I
Tire No.4 F70-14 Bias Ply Hide Tire (Full Tread) Water Depth - 0.25in. Wheel Load - 1085 lbs.
0 _...-G)
8
G
--- /B G
6/ Inflation Pressure
481--·- / 0 36 psi
GJ 30 PSi
46 1- -·6 8 24 psi
18 psi 44
5 10 15 20 25 30 35 40 45 50
Spin-Dorm (%)
55 60
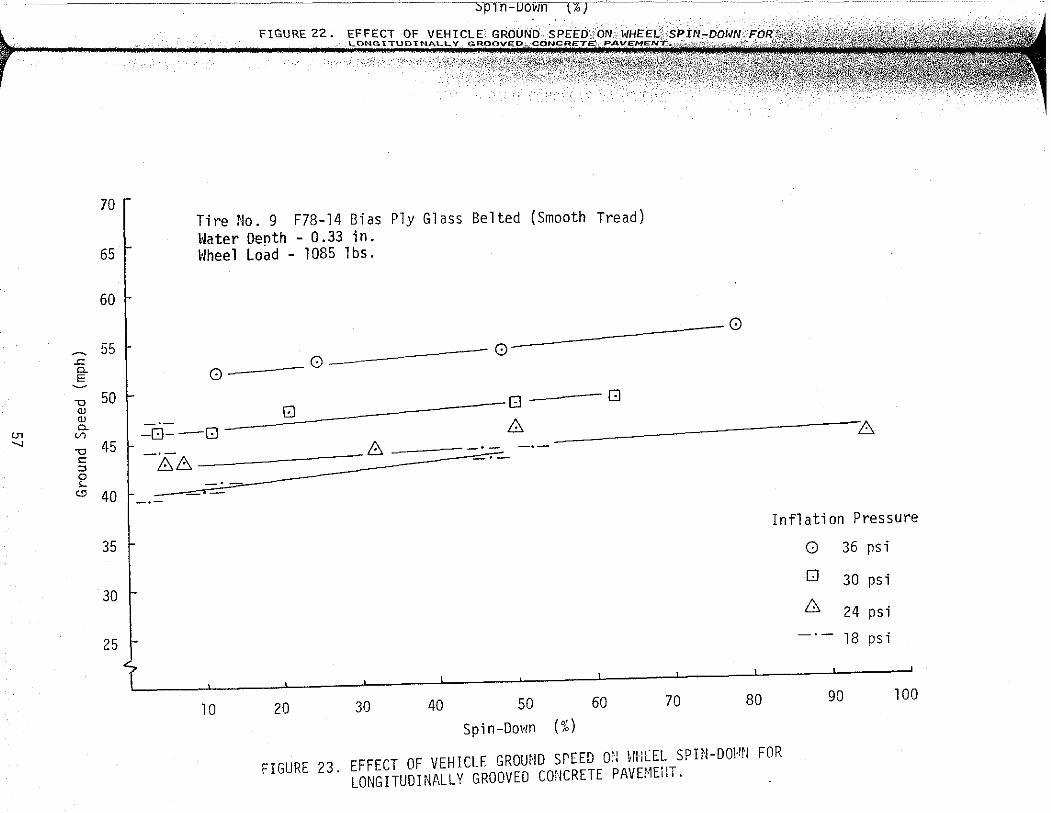
01 .._,
70
65
60
~ 55 .<= 0. E
-a QJ QJ 0.
(/)
-a <=
"' 0 '-
<.!>
50
45
40
35
30
25
---sprn-Dovln \%Tc
FIGURE 22. EFFECT OF VEHICLE
Tire No. 9 F78-l4 Bias Ply Glass Belted (Smooth Tread) Hater Denth - 0.33 in. Wheel Lo~d - 1085 lbs.
0 0 0 0
[!] 0 0
I -8--8 8 --------------~6 I
-86
_____ 8
Inflation Pressure
10 20 30 40 50 Spin-Down (%)
60 70 80
FIGURE 23. EFFECT OF VEHICLE GROUND srEED 0'! 1/ilt.:EL SPIN-DO\IN FOR LONGITUDINP.LL Y GROOVED CONCRETE PAVEHEiiT.
0 35 rsi
0 30 psi
!:::. 24 psi
18 psi
90 100

/
(.}1
O:J
70
65
~ 60 .<::
. 0. E ~
55 "0
"' "' 0. V) 50 "0 c :::l 0 ,_ 45 '-"
40
35
-----------'-------•-------""
0 0
Q
Tire No. 10 195-14 Steel Belted Radial (Full Tread) Hater Depth 0.40 in. Hhee l Load - l 085 l bs.
~8 -·--~ __:._.::.--8
8-----L:J &
. ----·----. __.:---------6-------- . --·- Inflation Pressure
G 36 psi
Q 30 psi
!;:, 24 psi
18 psi
5 10 15 20 25 30 35 40 45 50 55
Spi n-D01~n (%)
FIGURE 24. EFFECT OF VEHICLE GROUND SPEED ON VJHEEL SPIN-Oat-IN FOR LONGITUDINALLY GROOVED CONCRETE PAVEMENT.
60
WarPr nPnrh - n ;,n ~~

~
·rl UJ 0. ~
Q) ... ::J UJ UJ
01 Q) <!) ...
p.,
Q) ... •rl H
38
36
34
32
30
28
26
24 I_.,.
22
20
18
Tire No. 7 7.75-14 Bias Ply (Full Tread Water Depth - 0.40 in. \~eel Load - 800 lbs
0 ~;:,/ /
-·-
/ /
/
/
/ 0 "/ /=
[!)
/ -·- 10% Spin-Down
0 32% Spin-Down
0 60% Spin-Down
!;:, NASA Equation
1 A 64
Ground Speed {mph)
FIGURE 25. COMPARISON OF EXPERI:fE"TAL RESULTS TO NASA EQUATION FOR CONCRETE PAVEME:;·r .
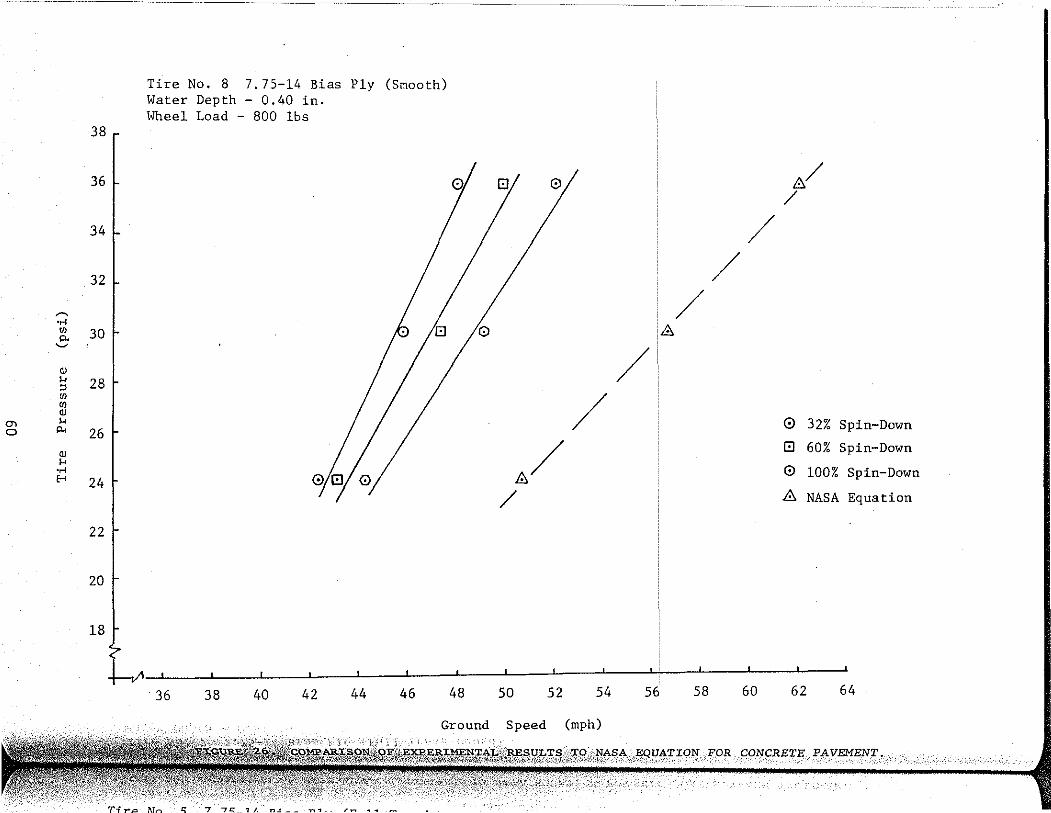
~ .... "' p. ~
<J) .... ::>
"' "' <J)
()) .... 0 "'
<J)
.... .... !'-<
38
I 36 I-
34 I-
32 ~
30 ~ 28
26
24
I 22
20
18
Tire No. 8 7. 75-14 Bias Ply (Smooth) Water Depth - 0.40 in. Wheel Load - 800 lbs
I
I
;fu;fu
(:)1
I
I
~
r.JI 0/ ~:/ /
I / I /
/ !8
/ / 0 32% Spin-Down
&/ [!] 60% Spin-Down
0 100% Spin-Down
/ 8 NASA Equation
36 38 40 42 44 46 48 50 52 54 56 58 60 62 64
Ground Speed (mph)
CONCRETE PAVEMENT •.
T·{.,..a 1\T.-. t:;: 7 7C::. _1/. n.:r __ .,.,.,_ ..-.., .... ~
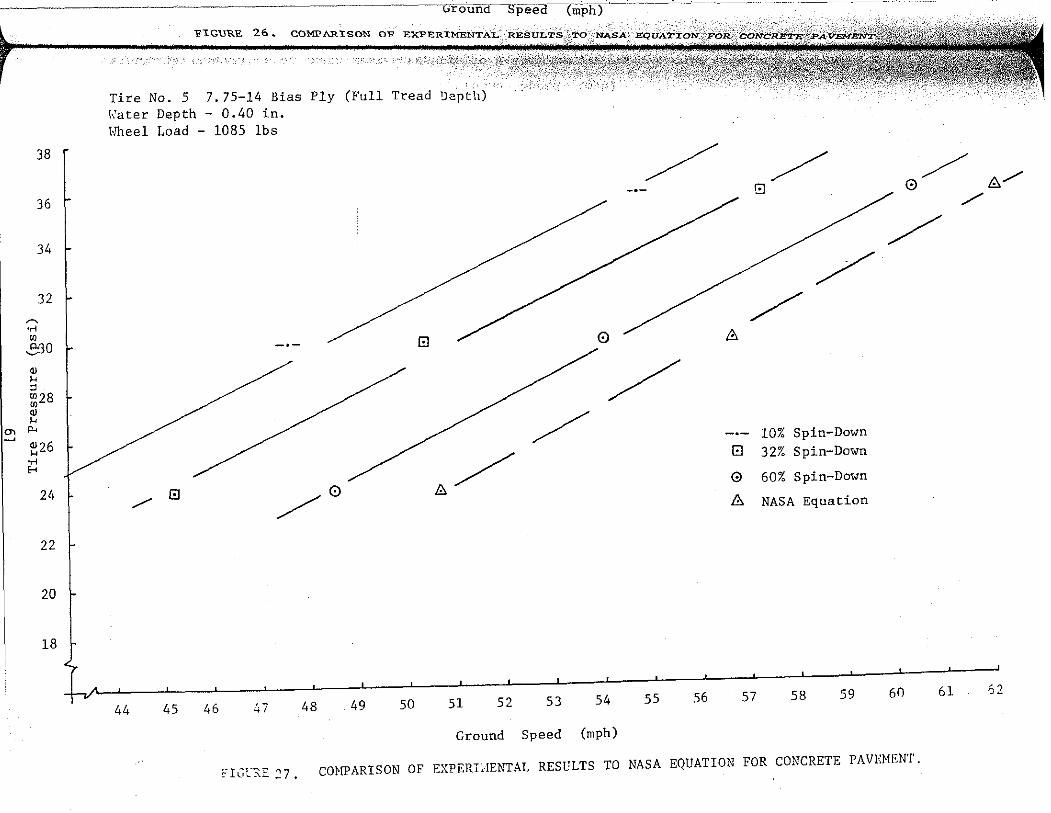
38
36
34
32 ~ .....
(/)
-.:;:30 <1l H
" "'28 (/)
<1l H
0\ "" ~
'"26 H ..... H
"1 22
20
18
F"lGlJRE 26.. COMPARISON OF
Tire No. 5 7.75-14 Bias Ply (Full Tread Der~b) · Water Depth - 0.40 in. Fheel Load - 1085 lbs
El
GJ /0 &/
/
44 45 46 -+i 48 49 so 51 52
/
/ /
53 54 55 56
Ground Speed (mph)
/ 8
/ /
8
10% Spin-Down El 32% Spin-Down
0 60% Spin-Down
& NASA Equation
57 58 59
/ &/ 0 /
/
60 61 '? ~~
FhT':.;: 27. CONPARISON OF EXPERL-IENTAL RESULTS TO NASA EQUATION FOR CONCRETE PAVEMENT.

~ ..... (I} p. ......
"' " " (I}
"' (I} N Q)·
" "" 0)
" ..... [,.<
38
36
34
32
30
28
26
Tire No. 4 F70-14 Wide Tire (Full Tread Depth) Water Depth- 0.70 in. Wheel Load - 1085 lbs.
/
-·- ' G/8 /
24r-:;;· _ / 0
EJ/l::, / /-"'
22 I
20 I
18
/ El /l::,/0/
/
/ /
0
10% Spin-Down El 32% Spin-Down
0 60% Spin-Down
8 NASA Equation
l__ -- ....... ..... C."' C..'l {.,/,
·SURFACE TREATMENT ..
'T'i ... L:> l\7..-. 0 ..., "7t:: ,,_

~
·.-< Ul
'"' ~
"' ... "' Ul Ul
0"> "' w ... '"' "' ... .....
E-<
Ground V"l.CUR:E. 2.8 .. COl'rPA:'RLSOH OF EX"PERil!ENTAL RESULTS
40
38
36
34
32
30
28
26
24
22
20
18
~ :· ; . •"
Tire No. 8 7.75-14 Bias Ply (Smooth) Water Depth- 0.70 in. \llieel Load - 1085 lbs
8 ~ 0 / / / /
47 48 ~9 50 51 52 53
// [;) 0/~
~ ~
/ G
/ &0
/
-·- 10% Spin-Down G 32% Spin-Down
0 60% Spin-Down
b. Nasa Equation
54 55 56 57 58 59 60 61 6~
Ground Speed (mph)
FIGURE 29 .CO~~?,\R:CSO~l OF EXPERIMENTAL RESULTS TO NASA E')UATIO:i FOR SEAL COAT SURFACE TREATMENT.
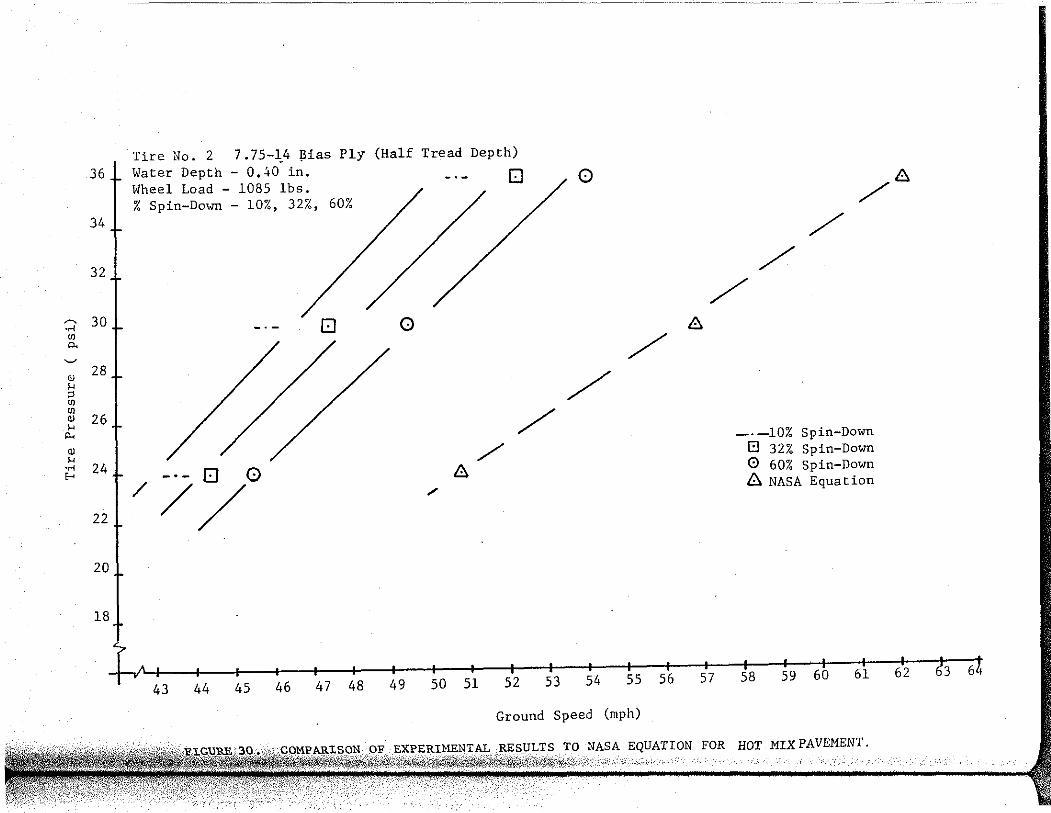
~
·..l {/) p.
~
OJ ,., " {/) {/)
OJ ,., p.
OJ ,., ·..< E-<
36
34
32
30 .J-
28
26
24 .j...
Tire No. 2 7.75-~4 ~ias Ply (Half Tread Depth) Water Depth - 0.40 in. Wheel Load - 1085 lbs. % Spin-Down - 10%, 32%, 60%
. -·- 0
0
0
0
/ /
8
0 /
8
/ /
/ 8
/ /
-·- 0
"t/ // ,
-· -10% Spin-Down El 32% Spin-Down 0 60% Spin-Down 8 NASA Equation
20
18
l 1 1 1 I I I ~ t ;' 1 1 1 1 I I I I I I I t !_ .... ~ ... ..., ~o !;a c.n hl h73 6
Ground Speed (mph)
TO NASA EQUATION FOR HOT MIX PAVEMENT. \:;~'·''''/"
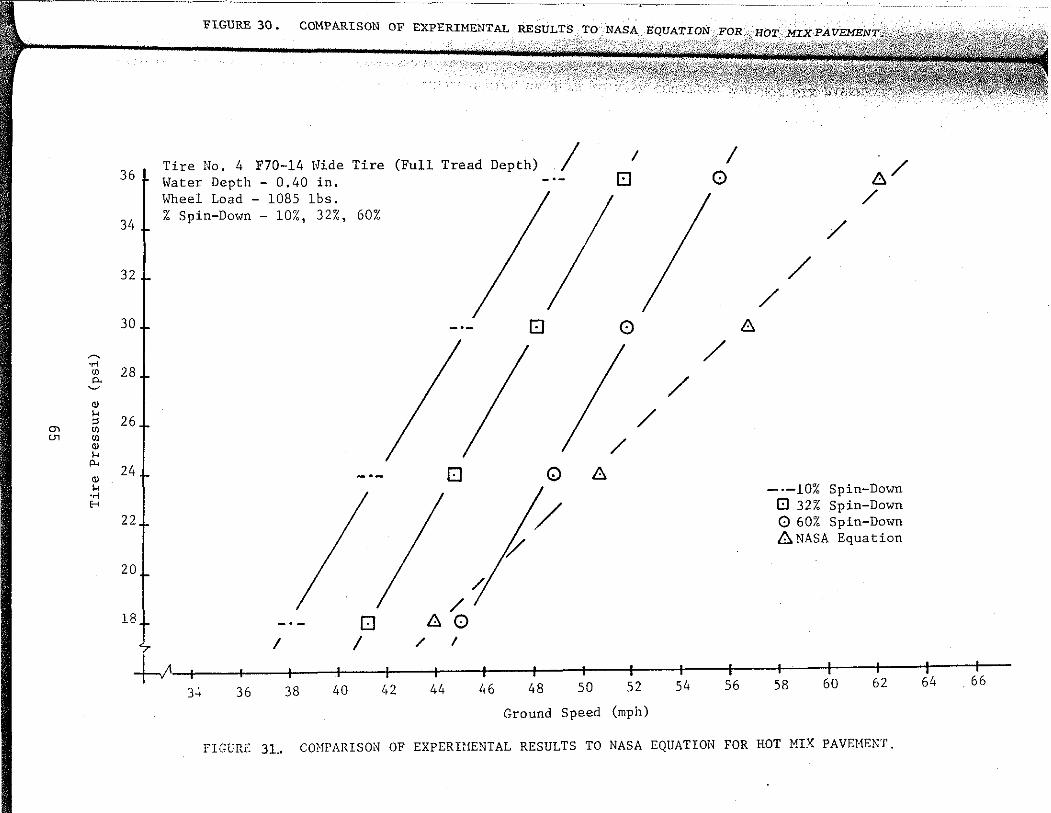
~ .... Ul p. ~
"' .... ::>
"' Ul Ul Ul
"' ....
"" "' .... .... E-<
36
34
32 t-
301
"t 26
24!
22
20
18
FIGURE 30. COMPARISON OF EXPERIMENTAL RESULTS TO NASA
Tire No. 4 F70-14 Hide Tire (Full Tread Depth) I Water Depth - 0.40 in. Wheel Load - 1085 1bs. % Spin-Down - 10%, 32%, 60%
/ -·-
-·-
I I
0
I
E)
0
I '
I I I// - ·-
I
0
0
I
/; /
80
0 A
1/
I 0
/ A
/ /
/
A/ /
-·-10% Spin-Down El 32% Spin-Down 0 60% Spin-Down 6 NASA Equation
"7 I I / I
~~~~~~~r-~~-r~_,--r-~~-r-+~~ 3~ 36 38 40 42 44 46 48 50 52 54 56 58 60 62 64 . 66
Ground Speed (mph)
FIGURr: 31.. CONPARISON OF EXPERWE~lTAL RESULTS TO NASA EQUATION FOR HOT MIX PAVE!1ENT.

36
34
32
30 ~
·..<
"' .,. ~
Q) 28
'"' " "' "' Q) 26 '"' "' Q) ...
·..< 24 E-<
22
20
18
Tire No. 7 7.75-14 Bias Ply (Full Tread Depth) Water Depth - 0.40 in. \olheel Load - 1085 lbs. % Spin-Down - 10%, 32%, 60%
0 0
///
- ·- ,EJ
/
6
/
34 36 38 40 42 44 46 48 50
0
/ /
52
Ground Speed (mph)
/
54
/ lJ
/ / 0
/ /
/
d /
6 /
56
-. -LO% Spin-Down El 32% Spin-Down 0 60% Spin-Down 6 NASA Equation
58 60 62
TO NASA EQUATION FOR HOT MIX PAVEMENT.
64 66
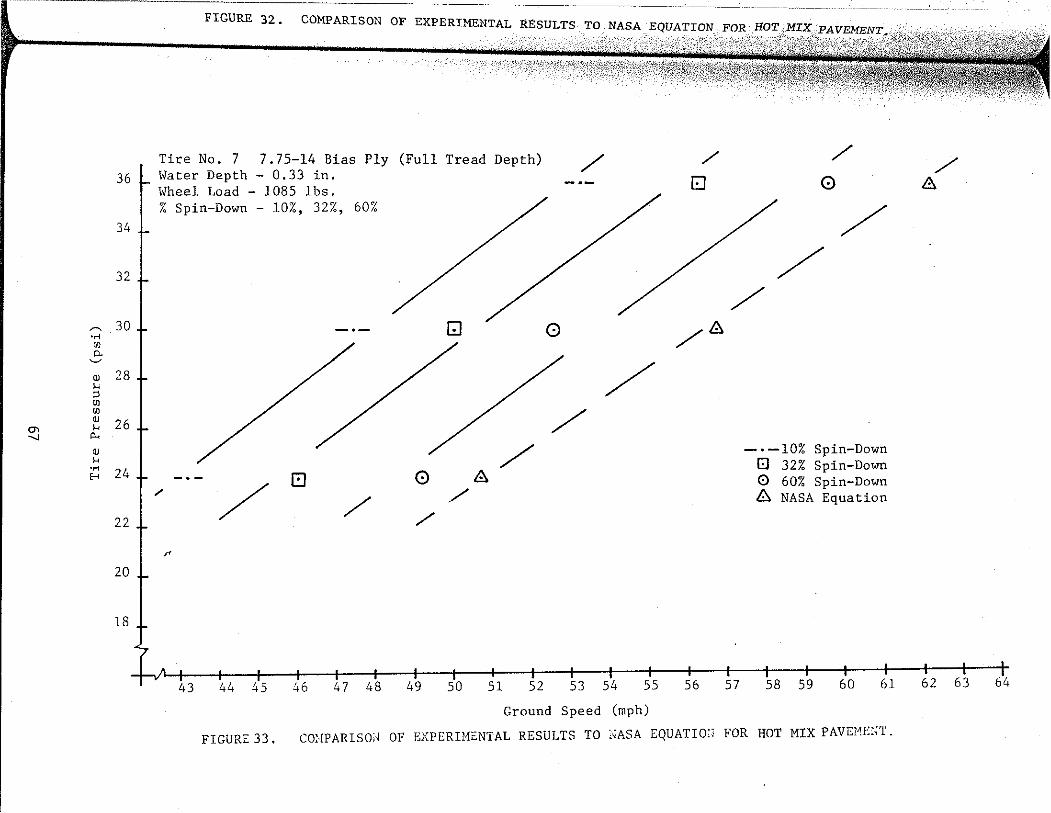
~
•ri lfJ p. ~
<JJ ... ::> lfJ lfJ <JJ
"' ...
...... "' <JJ ... •ri H
FIGURE 32. COMPARISON OF EXPERIMENTAL RESULTS
Tire No. 7 7.75-14 Bias Ply (Full Tread Depth) 36 L Hater Depth- 0.33 in.
\Vheel Load - 1085 lbs. % Spin-Down - 10%, 32%, 60%
34
32
30
28
26
24
22
EJ
/ /
/
" 20
18
43 44 45 46 47 48
GJ
0 ~ /
/
/
49 so 51 52
/
0
/ /
53 54 55
Ground Speed (mph)
/
r::J
/~
56
/ 0
'
/ /
/
57
-.-10% Spin-Down 8 32% Spin-Down 0 60% Spin-Down 8 NASA Equation
58 59 60 61
FIGURE 33. CO:.!PARIS0<1 OF EXPERU1ENTAL RESULTS TO :;ASA EQUATio:l FOR HOT MIX PAVEl~E:;T.
/ 8
62 63 64
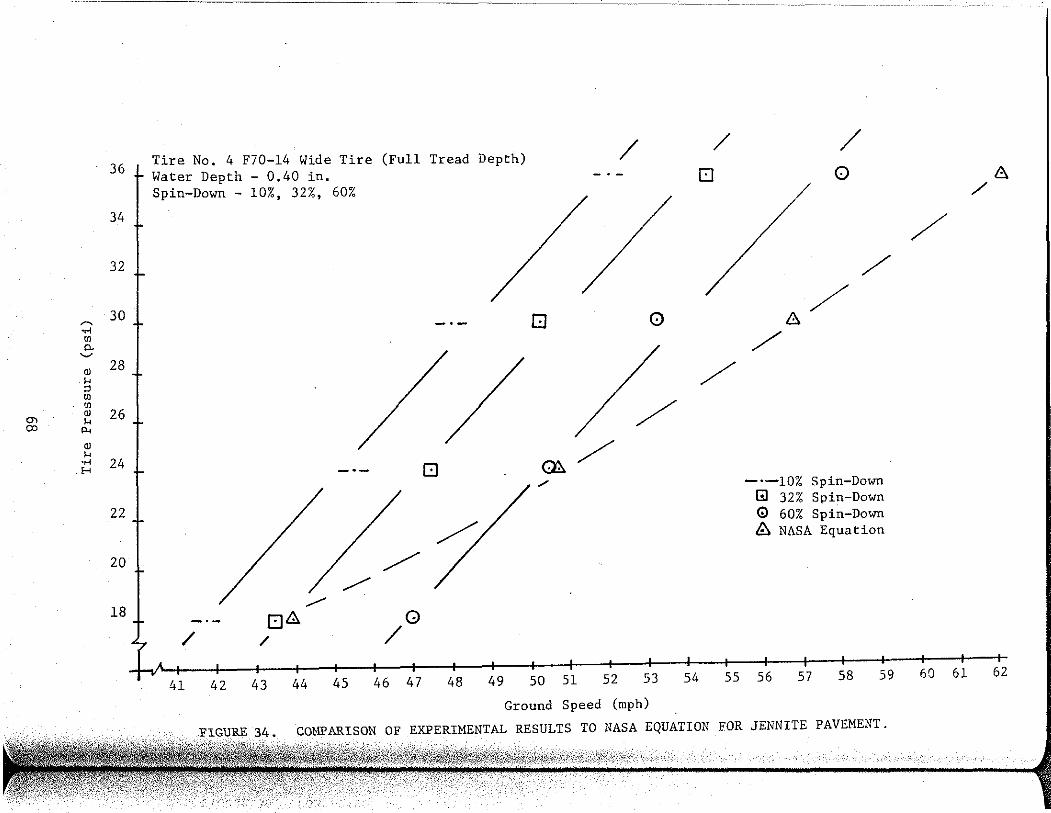
36 1 Tire No. 4 F70-14 Wide Tire (Full Tread Depth) / / / Water Depth - 0.40 in. -.- 0 0 8 Spin-Down - 10%, 32%, 60%
/ // /
34 I / / 32 I / / / /
~ 30 G 0
/ .... -·- 8 Ul / 0. ~
Q) 28 / H
" Ul Ul / Q) 26 Q) H
00 p.,
Q) / H .... 24 H -·- G m
/ -·-10% Spin-Down Gl 32% Spin-Down
22 I / /
~/ G> 60% Spin-Down ~ NASA Equation
zo I / / / /
18 I _./
-·- EJ8 G / / /
41 42 43 44 45 46 47 48 49 50 51 52 53 54 55 56 57 58 59 60 61 62
Ground Speed (mph)
EXPERIMENTAL RESULTS TO NASA EQUATION FOR JENNITE PAVEMENT.
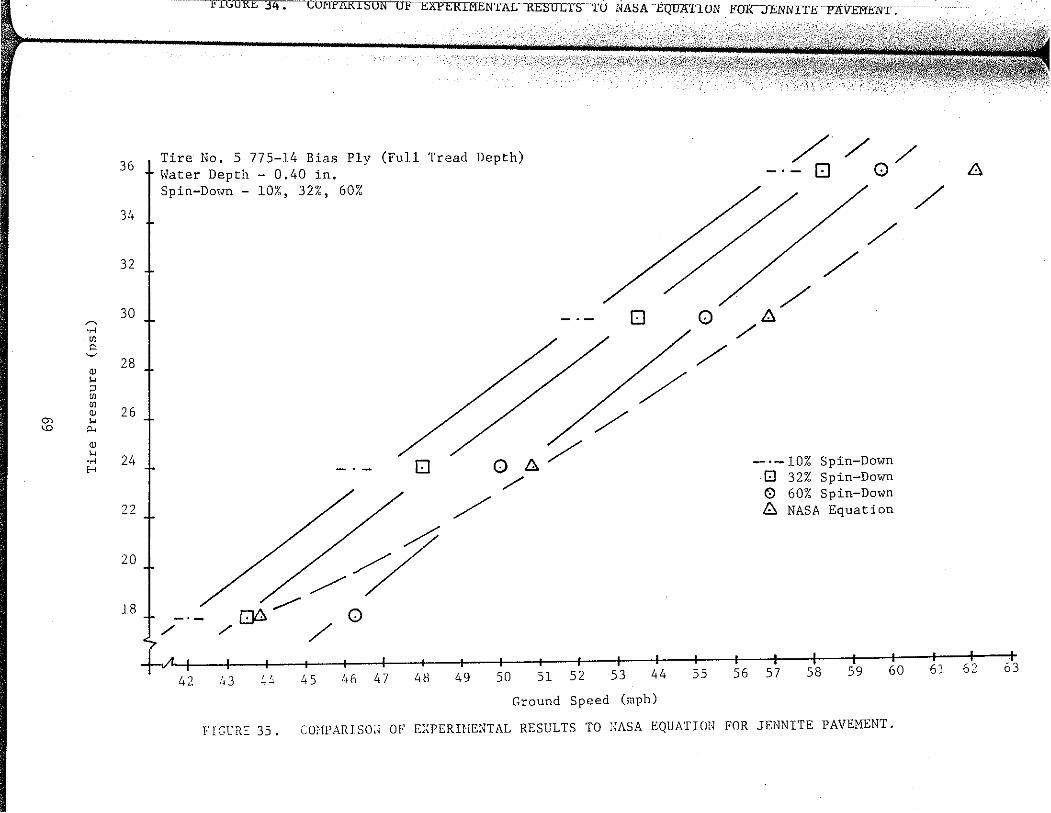
36
34
32
30 ~
·.-<
"' " ~ 28 "' ... ~ {/) {/)
26 "' ()) ... <D 0-<
"' ... 24 ·.-<
H
22
20
18 T
FTGORE j4. COMPARISON OF EXPERIMENTI\L--KESULTS-TO~~AEQilliTHJ~JW!CJENNTl'E PAVEMt:NT.
Tire No. 5 775-14 Bias Ply (Full Tread Depth) Hater Depth - 0.40 in.
/ -·- [;]
/ / 0
Spin-Dmm - 10%, 32%, 60% /
/
42
0 0 !1:. /
/
0
/
/~ .,....-'"
/ [;]6 / 0
43 ~~ 45 46 47 48 49 50 51 52 53 44
Ground Speed (mph)
0
/
55
~ /
/
/ /
- ·-10% Spin-Do<m · 0 . 32% Spin-Down 0 60% Spin-Down ~ NASA Equation
56 57 58 59 60
FTGrR~ 35. COHPARJSO:; OF E:(PERIHENTAL RESULTS TO "ASA EQUATION FOR JENNITE PAVEMENT.
61
6
'0 0.:.. 63

~
·.-I <Jl p. ~
QJ ... :l <Jl <Jl QJ ....,
0 ... p.
QJ ... ·.-I H
Tire No, 5 775-14 Bias Ply (Full Tread Depth) 36 I Water Depth - 0.33 in.
34
32
30
28
26
24
22
20
18
Spin-Dmm - 10%, 32%, 60%
-·- GJ / / /
0 IJ::. /
- •- 10% Spin-Down 8 32% Spin-Down 0 60% Spin-Down /]:;. NASA Equation
42 43 44 45 46 47 48 49 50 51 52 53 . 54 55 5b 57 58 59 60 61 62
Ground Speed (mph)
EXPERIMENTAL RESULTS WITH NASA EQUATION FOR JENNITE PAVEMENT.
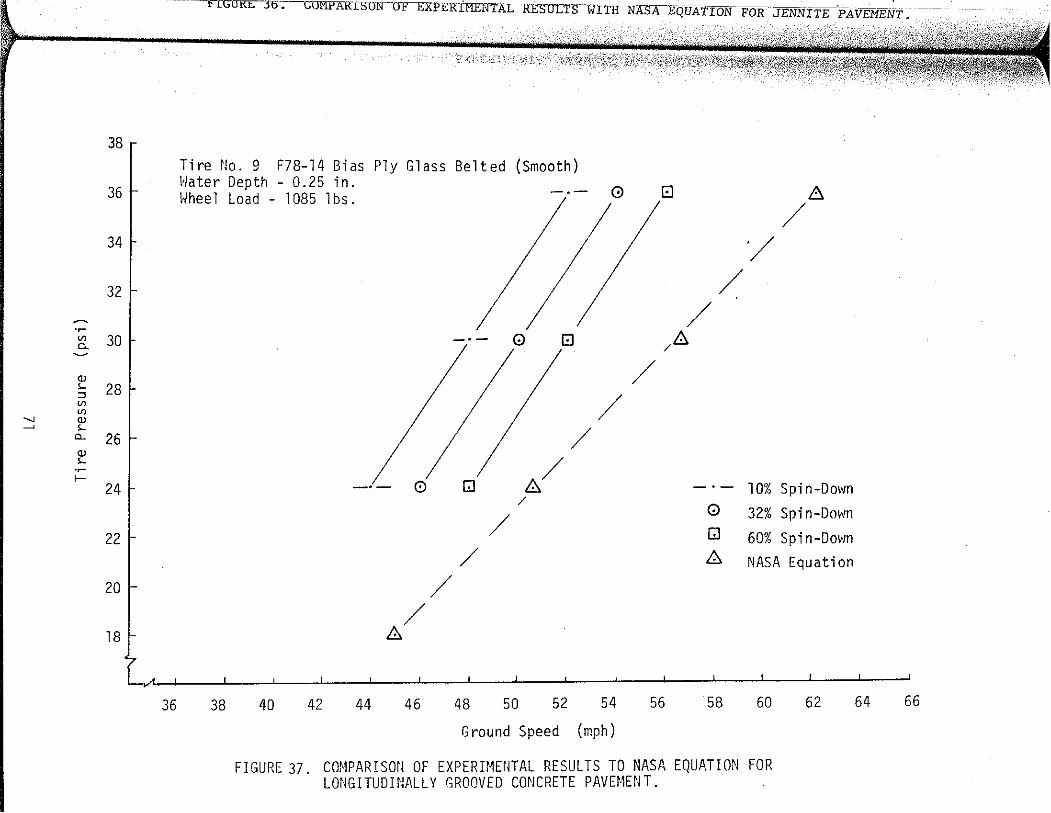
38
36
34
32
~
·~ Vl 30 n ~
QJ
'- 28 :::! Vl Vl
'.J QJ ~ '-
0.. 26 QJ
'-·~ 1-
24
22
20
18
36
r I GORE 36. COMPARISON llYTXPERlTIENT~RTSUI:TSin~ll-NASAEQUATION FOR JENN1TE ,PA.'VEMENT.
~;; :<-·i·;;
Tire t!o. 9 F78-l4 Bias Ply Glass Belted (Smooth) Water Depth - 0.25 in.
0 Hhee1 Load - 1085 1 bs.
8
38 40 42 44
0 G]
/ /
/
46 48
I
El
/ /
6./ /
/
50 52
Ground Speed
54
(mph)
El
/ /
/ 8
/
56
0 G]
8
58
/ ./
A
10% Spin-Down
32% Spin-Down
60% Spi n-Dovm
NASA Equation
60 62
FIGURE 37. C0~1PARISON OF EXPERH1ErHAL RESULTS TO NASA EQUATION FOR LONGITUDHlALL Y GROOVED CONCRETE PAVEt·1EN T.
64 66
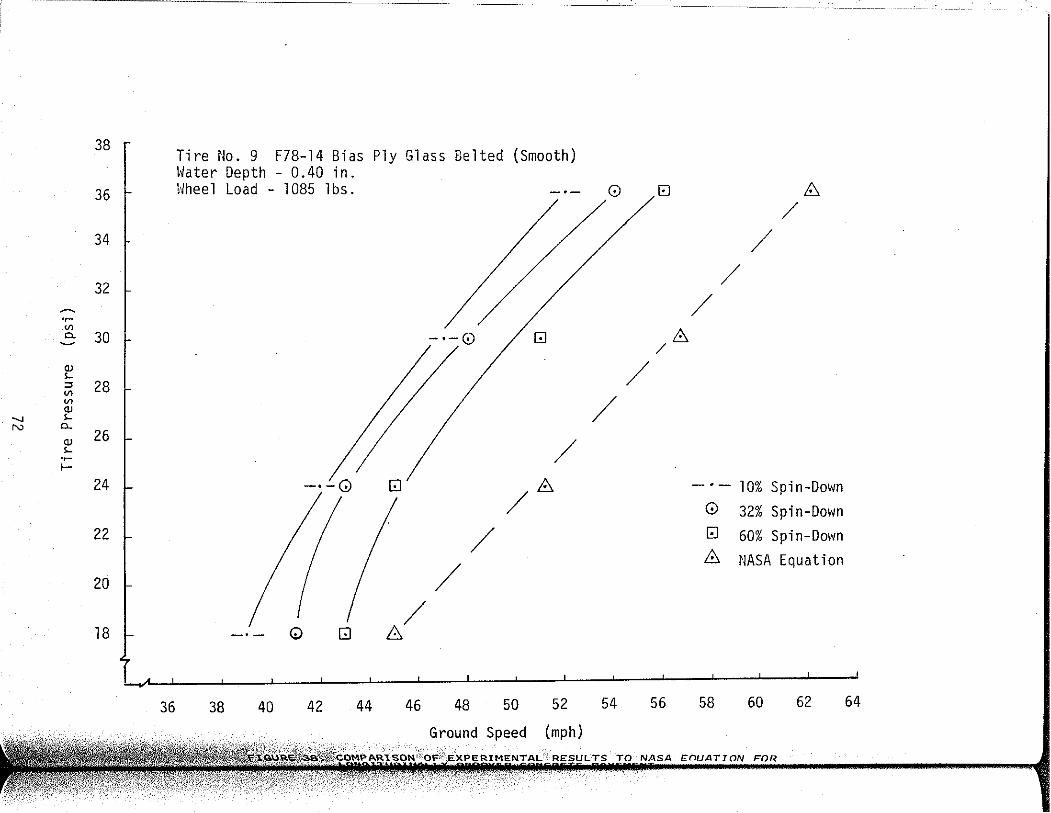
38
36
34
32 ~
·~ Vl
30 D.. ~
QJ
'-28 ::::>
Vl Vl QJ ..._, '-
0...
26 N
QJ
'-·~ 1-
24
22
20
18
I
36
Tire No. 9 F78-l4 Bias Ply Glass Belted (Smooth) Hater Depth - 0.40 in. Wheel Load - 1085 lbs.
-·-G Q
0 GJ 8
38 40 42 44
-·-0 [!]
/ /8
/ /
/
46 48 50
Ground Speed
52
(mph)
0
/ /
54
El
8 /
56
/ /
/
8 /
- ·- 10% Spin-Down 0 32% Spin-Down E1 60% Spin-Down 8 NASA Equation
58 60 62 64

38
36
34
32 ~
·~ til
30 c.. ~
QJ s..
28 ::J til til QJ
" s.. w c:... 26
QJ s.. ·~ 1-
24
22
20
18
FlG.URE 38.
Tire No. 4 F70-l4 Bias Hater Depth - 0.40 in. 11heel Load- 1085 lbs.
36 38 40 42
<lTD.
TS TO NASA EnUATION FOR .
Ply lJide Tire (Full Tread)
-·- 0 &.
-·-
/ ,-._· / \!.I&
44 46
/
48
/ -·- \!) $
/ /
/ 0 &. Q
/
/
50 52 54
/
/
56
Ground Sneed (mph)
/
0
Q
/;':,
58
/
/ /
10% Spin-Down 32% Spin-Down 60% Spin-Down NASA Equation
60 62
FIGURE 39. C0'1Pf..RISON OF EXPERH~E:ITAL RESULTS TO ::.n.Sl'1 E'lUATION FOR LQ;IGITUDINALL Y GROOVED CONCRETE PAVEf.1E1iT.
64
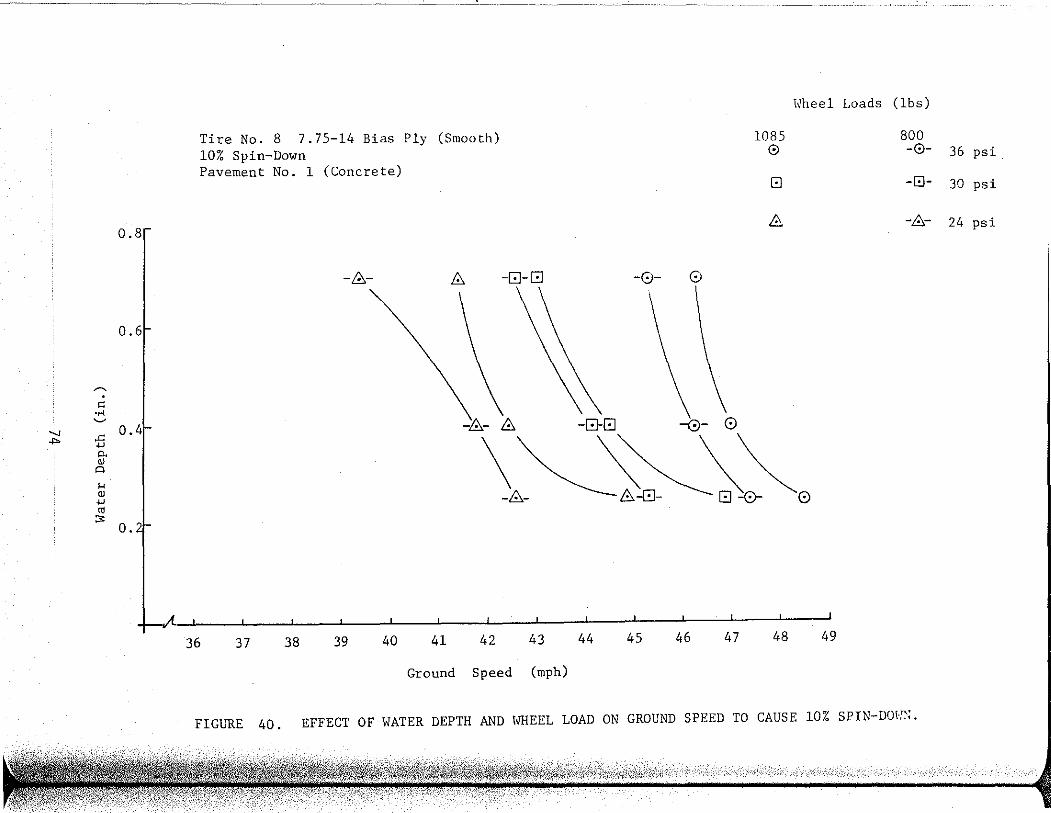
..., ""'
~
" .... ~
0.8
0.6
.c 0. 4 '-'
"" aJ Q
... aJ '-'
"' ::;: o.
Tire No. 8 7.75-14 Bias Ply (Smooth) 10% Spin-Down Pavement No. l (Concrete)
1085 0
8
Hheel Loads ( lbs)
800 -0- 36 psi
-8- 30 psi
6 -6- 24 psi
-&- b. -EJ-8 -0- 0
-~- & -G-El -0- 0
\~~\~ -b.- 8-8- El -0- 0
L I I
36 37 38 39 40 41 42 43 44 45 46 47 48 49
Ground Speed (mph)
FIGURE 40. EFFECT OF WATER DEPTH AND HllEEL LOAD ON GROUND SPEED TO CAUSE 10% SPIN-DO\-;~;.
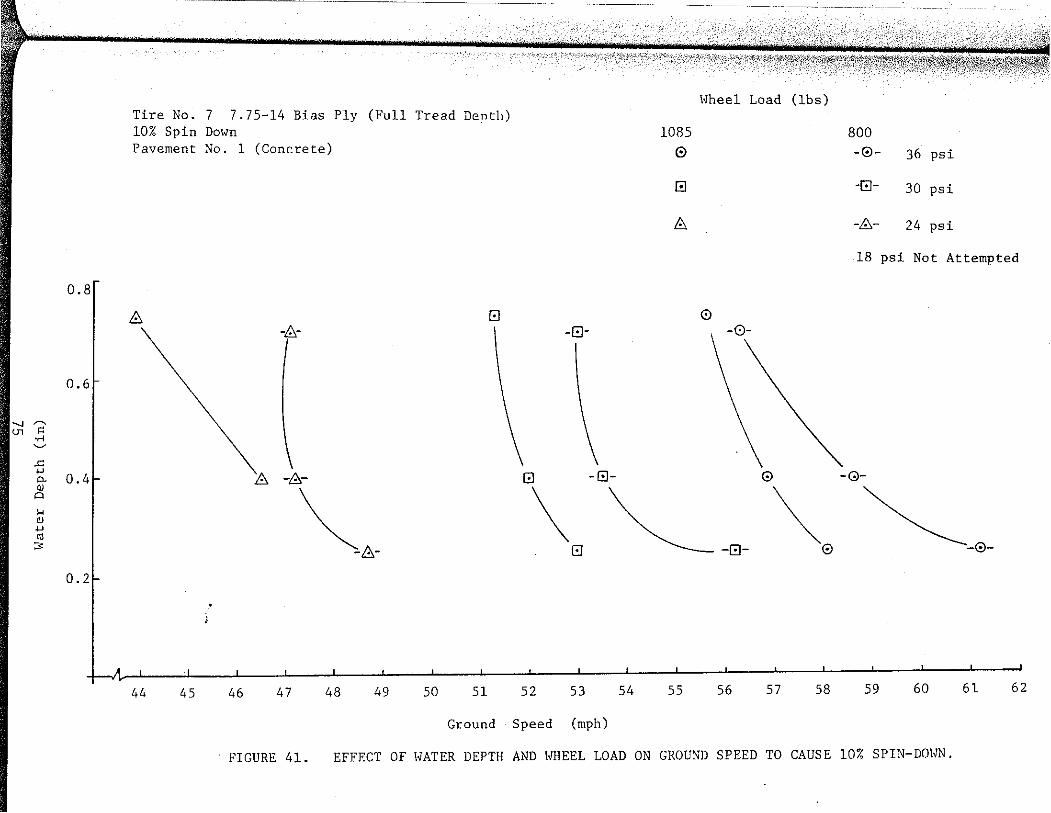
Hheel Load ( lbs) Tire No. 7 7. 75-14 Bias Ply (Full Tread Denth) 10% Spin D01om 1085 800 Pavement No. 1 (Concrete) G -0- 36 psi
(!] -EJ- 30 psi
8 -8- 24 psi
18 psi Not Attempted
-0.8
I 8 8 0
-8- I -EJ- -0-
0.6
.._, ~ Ul '" ·rl ~
..c .., ~ -8- -[!]-p. 0.4 8 0 -0-
QJ
~ \ ~- ~ p
.... QJ .., m ;3 -8- (!] -(!]- -0-
0.2
44 45 46 47 48 49 50 51 52 53 54 55 56 57 58 59 60 61 62
Ground Speed (mph)
FIGURE 41. EFFECT OF HATER DEPTH AND h'HEEL LOAD ON GROUND SPEED TO CAUSE 10% SPIN-DOh'N.

0.8
0.6 ~
"' .., .... , ~ .c '-' 0. Q)
"" o.t .... Q)
'-'
"' ~
0.2!-
Hheel Load - 1085 lbs 10% Spin-Down Pavement No. 1 (Concrete)
-&-
-·- 8
\ / & -·-
~
41 42 43 44 45 46
----'
Full Treacl D('pth
T:::_dc Tire Bias Ply
0 -0- 36 psi
8 -0- 30 psi
& -&- 24 psi
18 psi
-8- -0-
' -&- 8 0 -I!J- -0-
~ \ ~ 8 -[!):!) -0-
~0 ~0
47 48 49 50 51 52 53 54 55 56 57 58
Speed (mph)
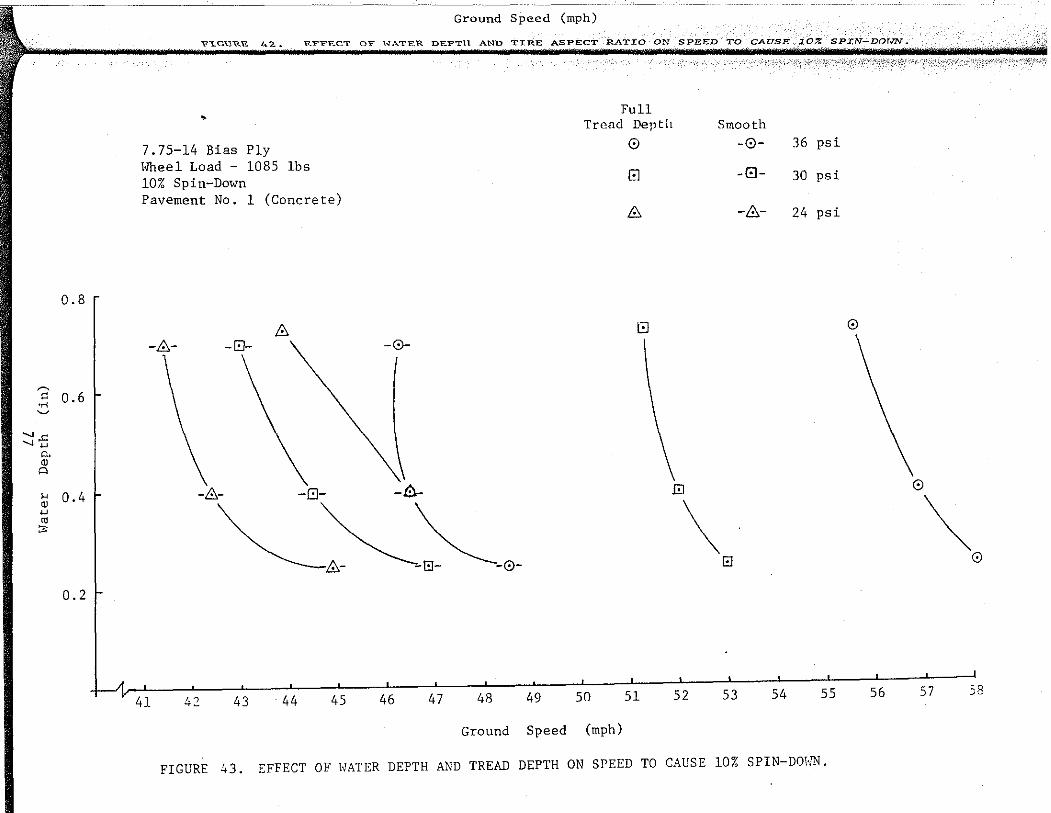
0.8
~
.~ 0.6 ~
".c ""' 0.
OJ A
~ 0.4 .., "' ::;::
0.2
Ground Speed (mph)
V"I..C.\J'R'E 'F_"F'FE.C'1." OF HATER DEPTH AND TIRE ASPECT
Full • Tread Deptlt Smooth
7.75-14 Bias Ply 0 -0- 36 psi
IVheel Load - 1085 lbs 0 -0- 30 psi
10% Spin-Down Pavement No. 1 (Concrete)
& -8- 24 psi
& 8 0
-&- -0- -0-
\"G -&- -El- -0.-
~~ &- -EI- -0- El
B
\
41 42 43 44 45 46 47 48 49 so 51 52 53 54 55 56 57 58
Ground Speed (mph)
FIGURE 43. EFFECT OF \VATER DEPTH AND TREAD DEPTH ON SPEED TO CAUSE 10% SPIN-DOhTN.

0.4
~
" .... 0.3 ~
,.c: '-' p,
"' -...J "' 00 H
"' '-'
& 0.2
0.1'
Tire No. 1 7. 75-14 Bias Ply (Full Tread Depth) Wheel Load- 1085 lbs. 10% Spin-Down
C:,. [!]
( [!]
\ &.
\ C:,.
0
\ 0
[!] 0
Inflation Pressure
0 36 osi 8 30 psi ~ 24 psi
18 psi - No Spin-Down
42 43 44 45 46 47 48 49 so 51 52 53 54 55 56 57 58
Ground Speed (mph)
FIGURE 44. EFFECT OF WATER DEPTH ON SPEED TO CAUSE 10% SPill-DOWN - HOT MIX PAVEMENT.
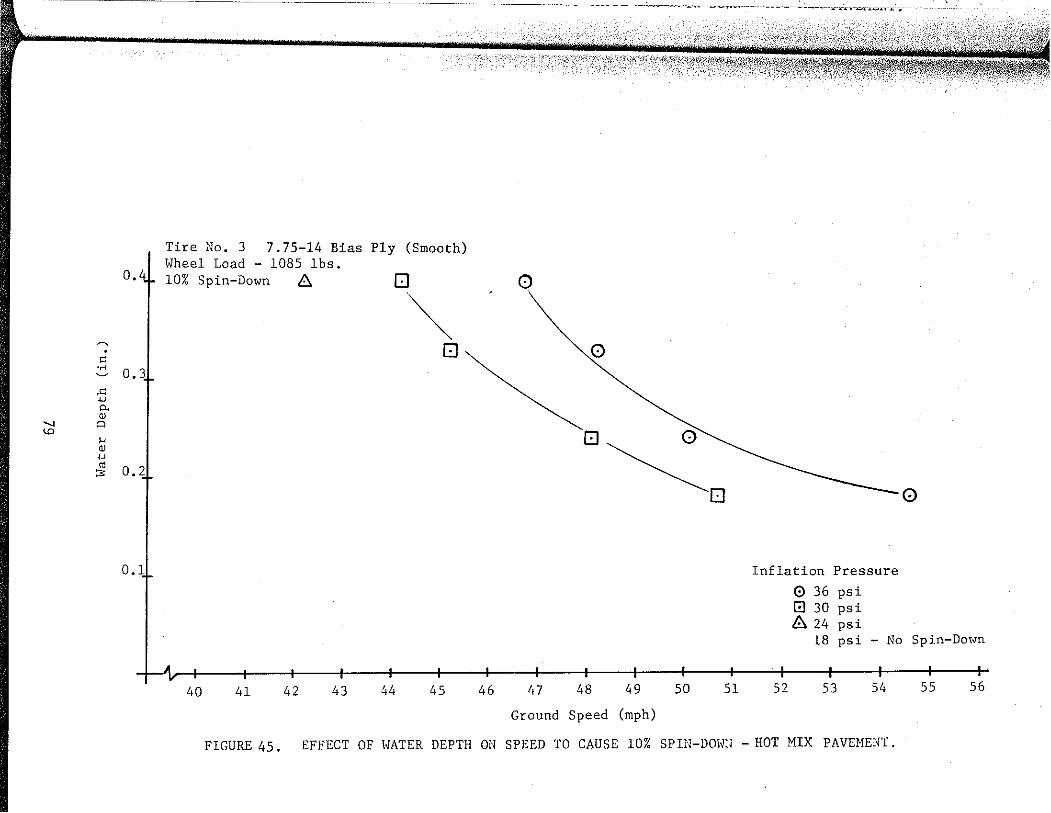
0,4
~
" •rl 0.3
.<=: '"' 0. OJ ...... "" <0 H OJ
'"' " :;: 0.2
0.1
Tire ilo. 3 7. 75-14 Bias Wheel Load - 1085 lbs. 10% Spin-Down 8
40 41 42 43
Ply (Smooth)
0
-~ 0
44 45 46
------------ -----,v---o----- ~ ~,----..,..-.._.. T> .-,------ "--- ---------------,.;-;ce>,·v- ..O.L-~=~-,--:<:--;.---
()
()
0 0
~0
47 48 49 50 51
Ground Speed (mph)
Inflation Pressure
0 36 psi G 30 psi 8 24 psi
0
l8 psi - No Spin-Dmm
52 53 54 55 56
FIGURE 45. EFFECT OF HATER DEPTH ON SPEED TO CAUSE 10% SPIN-DOHJ -HOT MIX PAVEMENT.
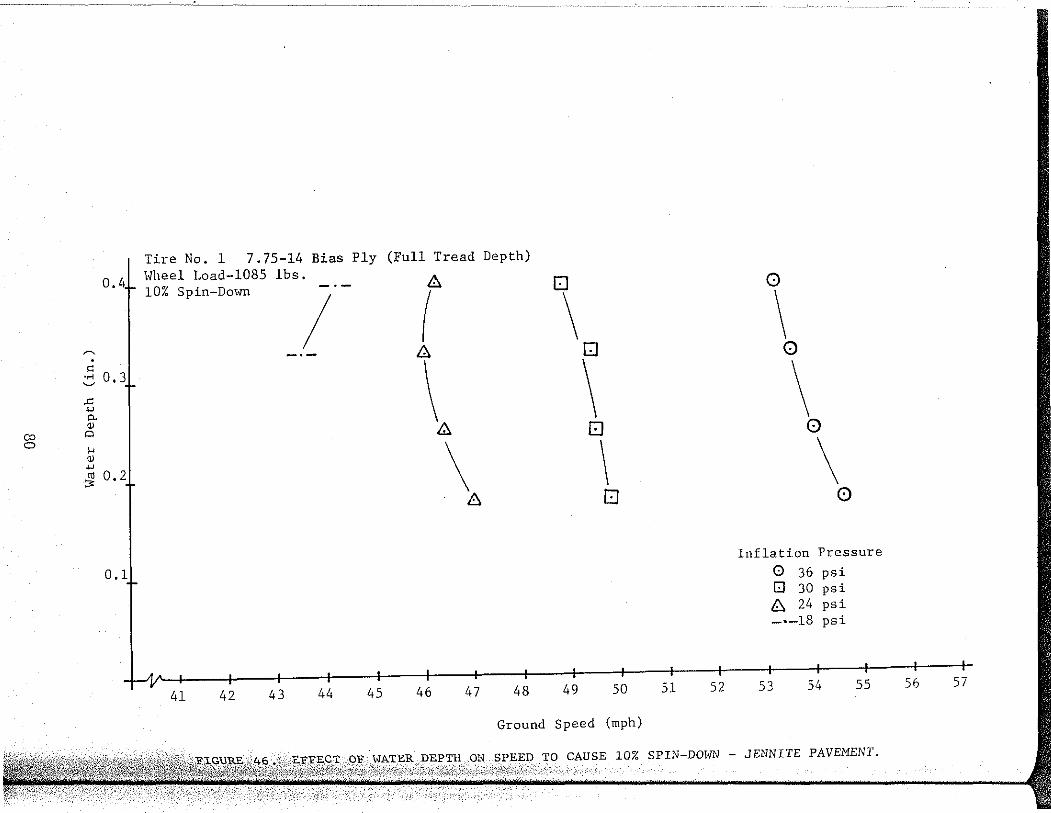
Tire No. 1 7.75-14 Bias Ply (Full Tread Depth)
0 41. Hheel Load-1085 lbs. 8 0 . "' '';".'""" } . - ( \ ~ -·- 8 Q . " \ \ ,::. 0.3
.c '"' .,. QJ 0 co Q
0 .... \ \ Q)
'"' ~ 0.2
8 0
0.1
41 42 43 44 45 46 47 48 49 50
Ground Speed (mph)
51 52
0
\ 0
\ 0
\ 0
Inflation Pressure 0 36 psi [J 30 psi 8 24 psi -·-18 psi
53 54 55
- JENNITE PAVEMENT.
56 57
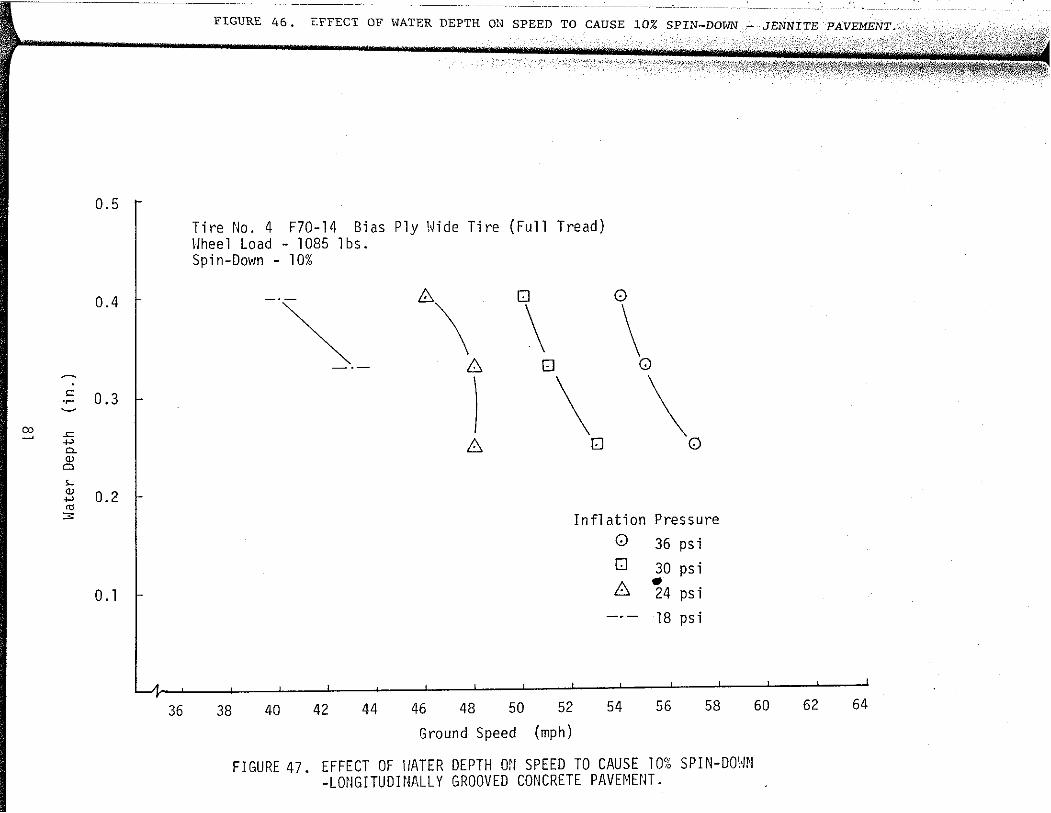
0.5
0.4
<= 0.3 ·~ ~
00 -<= +' 0. QJ
0
>-QJ 0.2 +'
"' 3:
0 .l
36
FIGURE 46 , i:FFECT OF WATER DEPTH ON SPEED TO CAUSE
Tire No. 4 F70-l4 Bias Ply Hide Tire (Full Tread) Wheel Load - 1085 lbs. Spi n-D01·m - l 0%
0
) 0 lJ 8
Inflation Pressure 0 36 psi
38 40 42 44 46 48 50 Ground Speed
52
(mph)
0
8
54
30 psi • • 24 ps1
18 psi
56 58
FIGURE 47. EFFECT OF \lATER DEPTH 011 SPEED TO CAUSE 10% SPIN-DOHN -LONGITUDINALLY GROOVED CONCRETE PAVEMENT.
60 62 64

0. 5
0.41-
~ 0.3 <=l
•..! OJ ~ N
-"' .._, c. QJ Cl
~ 0.2 .._, "' ~
0. l
Tire No. 9 F78-l4 Bias Ply Glass Belt (Smooth Tread) Wheel Load - 1085 lbs. Spin-Down - 10%
0 b. -\ \ 0
\ 0
\ 0
39 40 41 42 43 44 45 46 47 48
Ground Speed (mph)
HI\TER DEPTH Oil
0
\ 0
0
,o Inflation Pressure
0 36 osi
0 30 psi
b. 24 psi
18 psi
49 50 51 52 53 54
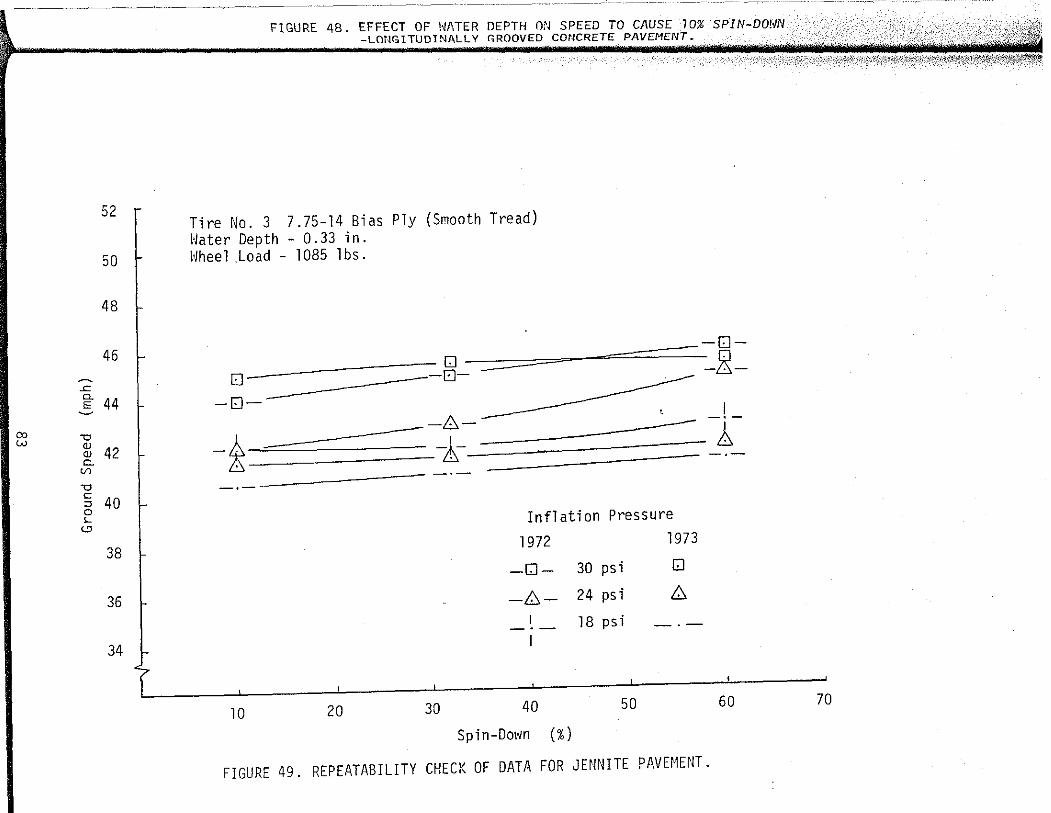
52
50
48
46 ~
-"" ~ 44 ~
00 "0 w 2i 42 c. Vl
"0
5 40 0 s... '-"
38
36
34
FIGURE 48. EFFECT OF \~1\TER DEPTH ON SPEED TO CAUSE 70% SPIN-D0!4N -LOf.IGITUDINALLY GROOVED CONCRETE PAVEMENT.
Tire No.3 7.75-14 Bias Ply (Smooth Tread) Water Depth - 0.33 in. Wheel .Load - 1085 lbs.
-D-O ---15----=::::::====-======-_R-
-o---A ~--- -l-6-----6- 8 -
-·--
Inflation Pressure
1972 1973
-0- 30 psi 0
-6.- 24 psi 6. I 18 psi -·- -·-
10 20 30 50 60 40
Spin-Dm'in (%)
FIGURE 49. REPEATABILITY CHECK OF DATA FOR JENNITE PAVH1ENT.
70

64 ·-
62
60
58
~
.<::
Q_ 56 ·-E ~
00 ""0
54 ..,.
QJ Q) Q_
V1
""0
52 t: :::> 0 '-
<!l
50
48
46
Tire No. 1 7.75-14 Bias Ply (Full Tread) ~!ater Depth - 0.33 in. Wheel Load - 1085 lbs.
[J
-0-
& -6-
10 20
-r:J-[::J
30
Inflation 1972
Pressure 1973
-GJ- 30 psi GJ
-8- 24 psi 8
40 50
Spin-Down (%)
[:]
60
PAVH1ENT.
70

0.8
~
" .... 0.6 ~
..c: ~
"" <l)
co p 01
" <l) ~ <tl 0.4 :;:
0.2
46
FIGURE 50. REPEATABILITY CHECK OF DATA FOR CONCRETE PAVH1ENT.
Tire No. 1 7.75-14 Bias Ply (Full Tread Depth) Hheel Load - 1085 lbs 10% Spin-Down
-&- -[!]-
& 0
~& \ [!]
~& \ 0""-------0
47 48 49 so 51 52 53 54
0 \ 0
Pavement
Ill //2 0 -0-
0 -0-
& -&-
\ 0""-
"-...__0
55 56
Ground Speed (mph)
57
36 psi
30 psi
24 psi
18 psi
58
FIGt:RE 51. COHPARISON OF CONCRETE Ai!D SEAL COAT SURFACE TREATifENT.
-0-
59 60 61
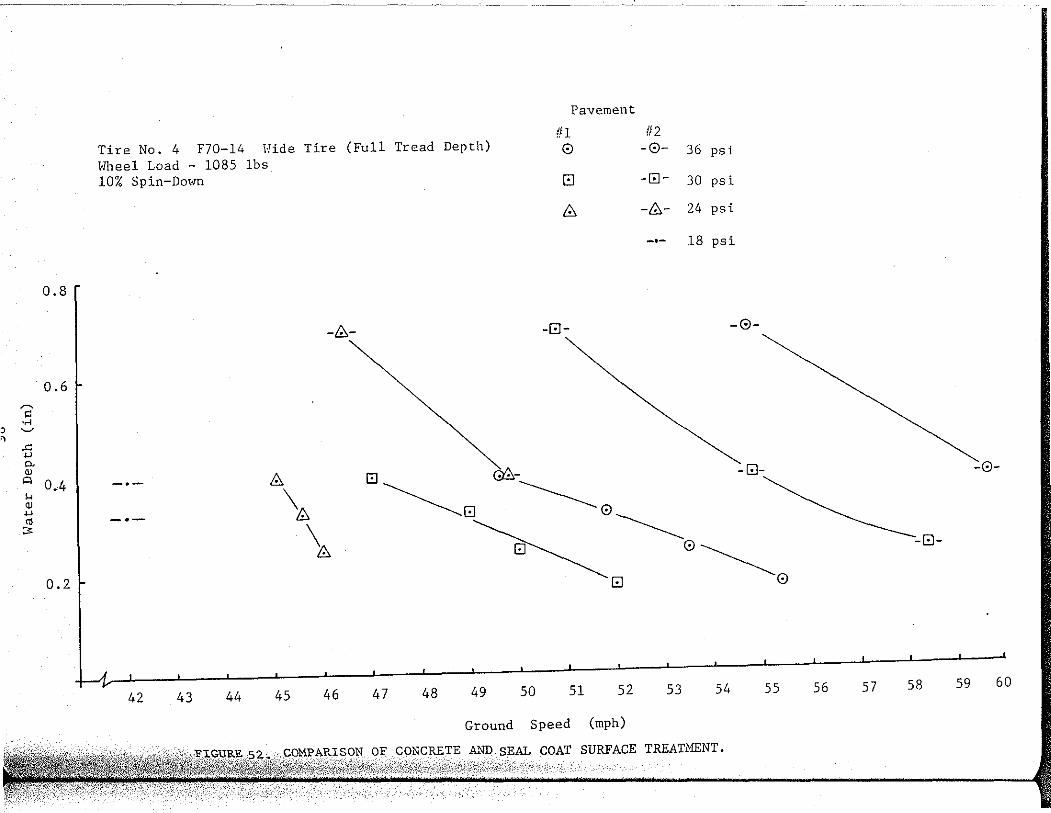
0.8
0.6 ~
.:: .... 0 ~
0 ..c: .., "' Q)
<=> 0.4 .... Q) .., "' ::;:
I 0.2
Tire No. 4 F70-l4 Hide Tire (Full Tread Depth) Wheel Load - 1085 lbs 10% Spin-DoHn
-8-
8~ 8:, -·-~ GJ -·-\
42 43 44 45 46 47 48 49
Pavement
111 112 0 -0- 36 psi
GJ -[!]- 30 psi
8:, -8:,- 24 psi
-·- 18 psi
-GJ- -0-
""------------ 0 ~ - GJ-
0~ G--.........___ ~0
GJ
so 51 52 53 54 55
Ground Speed (mph)
SURFACE TREATMENT.
-0-
-8-
56 57 58 59 60

0.4
~
" 0.3 •ri ~
"" w p. QJ
0
... 00 QJ " w
0. 2 "' ;3:
0.11
FIGURE 52. COHPARISON OF CONCRETE AND SEAL COAT SURFACE TREATMENT.
Tire No. 4 F70-14 Wide Tire (Full Tread Depth) Wheel Load - 1085 lbs 10% Spin-Do"n
. ~
-·-A- I \~-A -·- I
-B- B\ -0~ 0- .
-0-. 0 ~ ~
6. " -~"0 -0-'- B "
-0- ..... 0 -0-
Surface Ill
36 psi 0 30 psi [J 24 psi 6. 18 psi
38 39 40 41 42 43 44 45 46 47 48 49 50 51 52 53 54
Ground Speed (mph)
FIGL'RE 53. COI-lPARISOC'J OF CONCRETE A'lD HOT NIX PAVEHEcJTS.
0
Surface l/3
-0--[J-
-6.-' -·-1
55 56 57 58
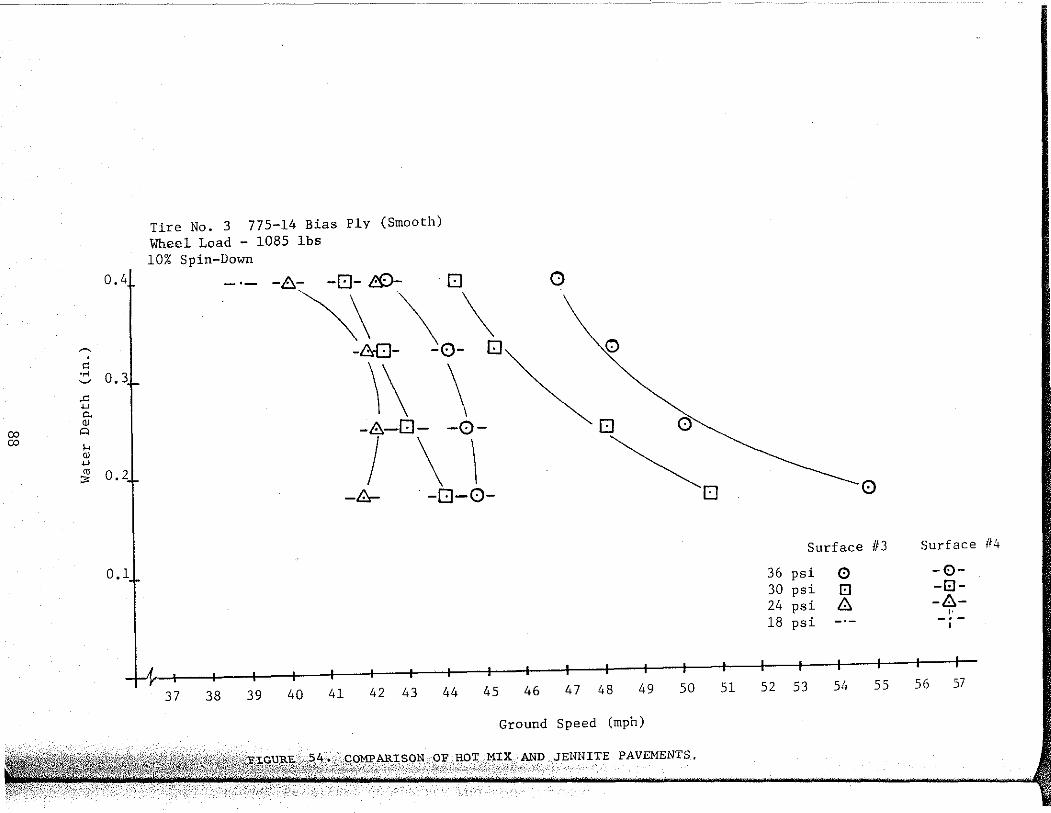
0.4
~ . " ..... 0.3 ~
.c w 0. Q)
co "" co ... Q) w
"' 0.2 ;,
0.11
Tire No. 3 775-14 Bias Ply (Smooth) Wheel Load - 1085 lbs 10% Spin-Down
-~- -0- /!§)- 0 0
~\ \\ -\\ -\ Q~'0 -6-0- -0- 0 0
J \\ ~ -&- . -0-0- 0 0
Surface 1/3 Surface 114
36 psi 0 -0-30 psi El -El-24 psi 6 -6-
I•
18 psi -·- I
37 38 39 40 41 42 43 44 45 46 47 48 49 50 51 52 53 54 55 56 57
Ground Speed (mph)
AND JENNITE PAVEMENTS.
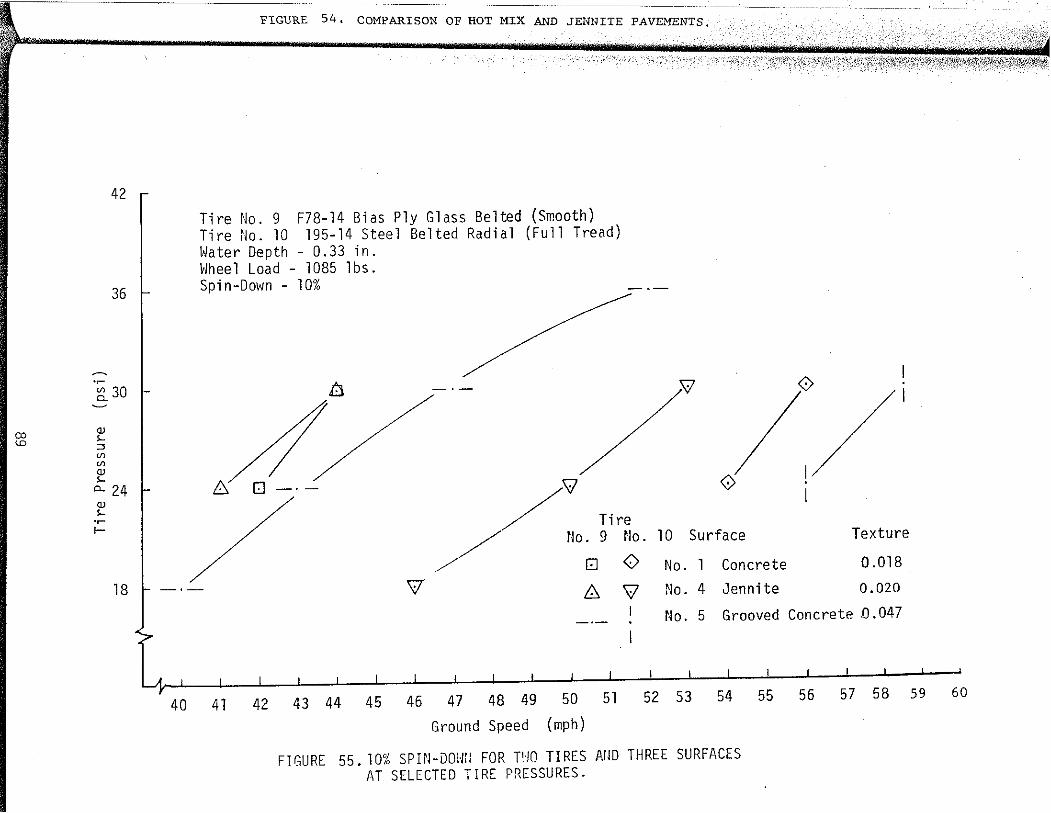
00 \.0
42
F"LGURE 54, COMPAR"LSON OF HOT MIX AND JENNITE PAVEMENTS,
Tire No. 9 F78-14 Bias Ply Glass Belted (Smooth) Tire No. 10 195-14 Steel Belted Radial (Full Tread) Water Depth - 0.33 in. Wheel Load- 1085 lbs.
36 L Spin-Down - 10%
·~
~30 ~
QJ
'-::J V> V> QJ
'-0. 24 QJ
'-·~
!--
18
n
I !:i 0 -·- /v
/ Tire // No. 9 ~lo.
0 0 v- !:i v
X!
0
10 Surface
No. 1 Concrete
No. 4 Jennite
0
Texture
0.018
0.020
No. 5 Grooved Concrete D.047
40 41 42 43 44 45 46 47 48 49 50 51 52 53 54 55 56 57 58 59 60
Ground Speed (mph)
FIGURE 55. lmi SPIN-DOl1ii FOR T'IO TIRES Af!D THREE SURFACES AT SELECTED TIRE PRESSURES.
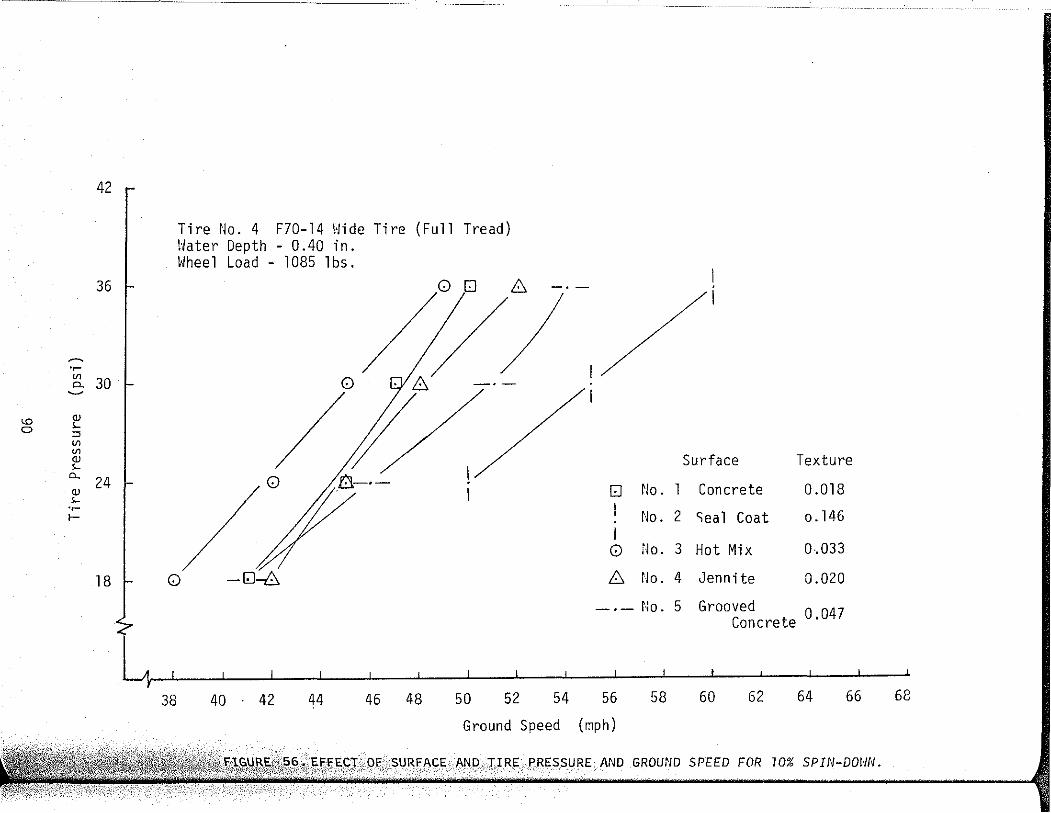
42
36
~
·~ Vl 30 D.. ~
QJ <D '-0 ::> Vl Vl QJ
'-o._
24 QJ
'-·~ 1-
18
Tire No. 4 F?0-14 Hide Tire (Full Tread) Water Depth - 0.40 in. Hheel Load - 1085 lbs.
/l//-0 ° 6
/I; 0 -EJ~
38 40 ° 42 44 46 48 50 52 54
Surface Texture
EJ No. 1 Concrete 0.018 I No. 2 Seal Coat 0 0146 I 0 flo. 3 Hot Mix 0.033
6 No. 4 Jennite 0.020
·- t-:o. 5 Grooved 0.047 - Concrete
56 58 60 62 64 66
Ground Speed {~ph)
70% SP I N-DOl·IN.
68

FIGURE 56. EFFECT OF SURFACE AND TIRE PRESSURE AND GROUND SPEED FOR 10%
Surface No, 4 Wheel Load - 1085 lbs. 10% Spin-Down
0. 411 I I I i
-& 0 -1!::.- -0- 0 -Q- -0- -0-
( vii I \ \ /I I
I i 0.3 +\ r 0$.- -0- 0 -8- -0-0-
\\' ( \ 1\1 I I
'"' Q !~ -L:B [J- 0 -8-0-
~
i 0.2 I
1
~\ I~ I \ \(I
0 -0-1!::.- 0 -ot:J-I I
Tire Ill
0.1 36 psi 0 30 psi 0 24 psi 1!::. 18 psi
43 44 45 46 47 48 49 50 51 52 53 54 55 56 57 58 59
Ground Speed (mph)
FIGURE 57. COHPARISON OF BIAS PLY TIRES (1, 5, & 7)
, I
-0-
115
-G--8--1!::.-
1\1 -0-I 117
I -o--6-
' -ti-l I
-j-
60 61 6"2 63
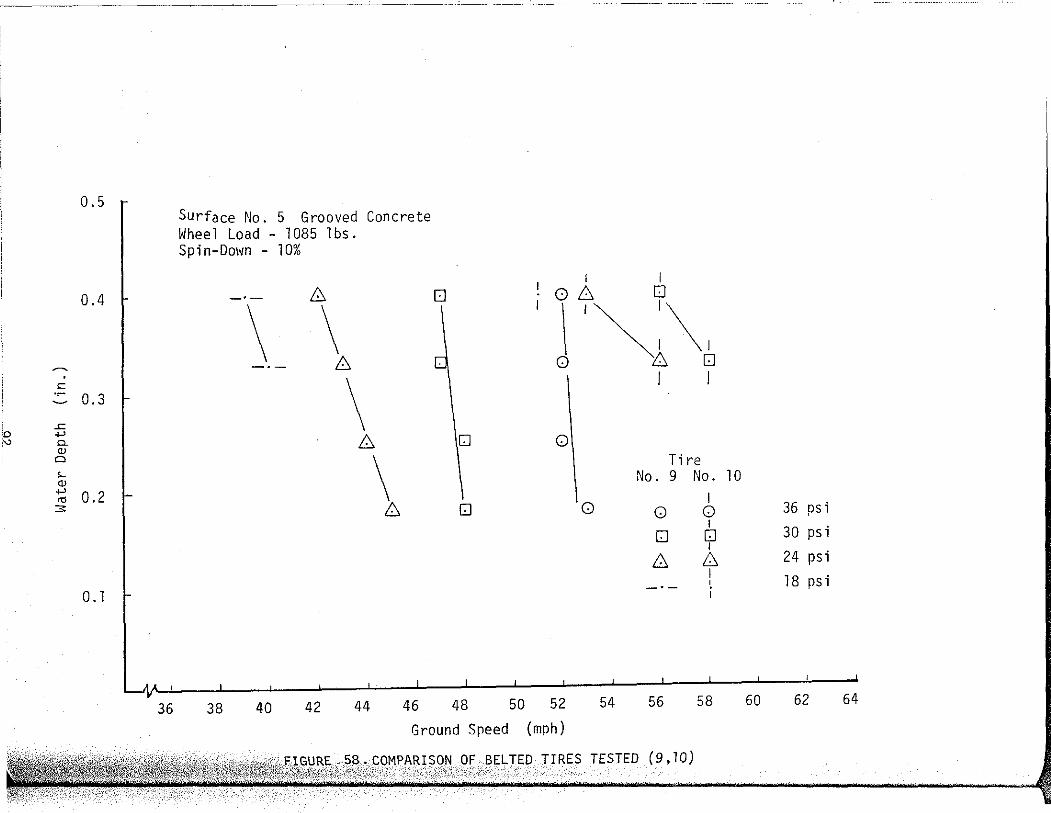
---··~-----··· ····--·-----·--···
36 38 40 42 44 46 48 50 52 54 56 58 60 62 64
Ground Speed (mph)
(9,10)
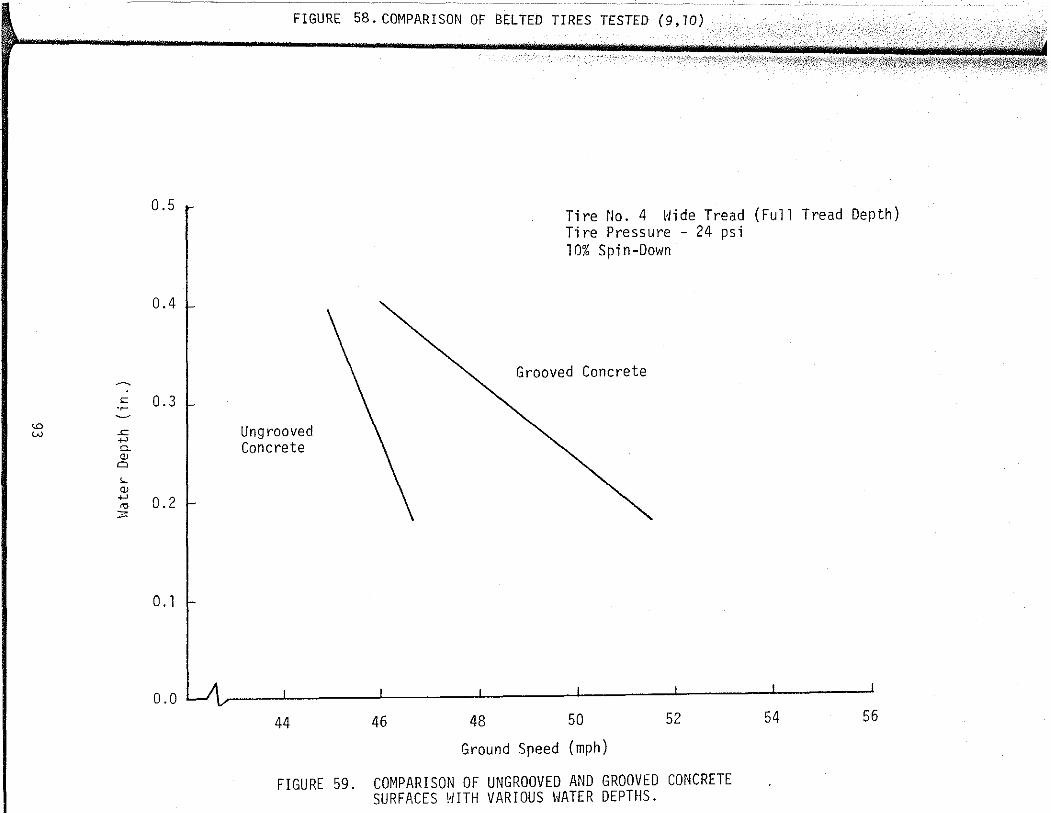
lO w
0.5
0.4
.;: 0. 3
.<:: +-' D.
"' 0 ,_ "' +-'
"' ::0: 0.2
0. 1
0.0
FIGURE 58. C0~1PARISON OF BELTED TIRES TESTED (9, 10)
",~·.·
Tire No. 4 Wide Tread (Full Tread Depth) Tire Pressure - 24 psi
Ungrooved Concrete
44 46
10% Spin-Down
Grooved Concrete
48 50 52
Ground Sreed (mph)
FIGURE 59. COMPARISON OF UNGROOVED AND GROOVED CONCRETE SURFACES WITH VARIOUS WATER DEPTHS.
54 56
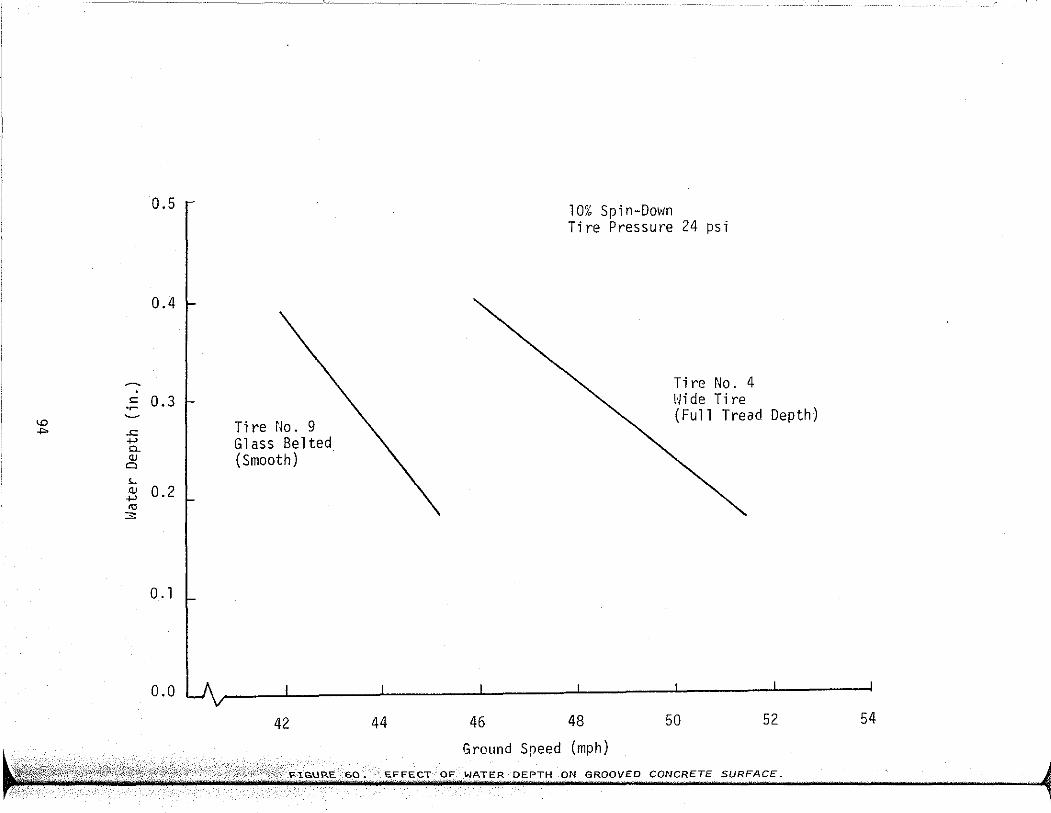
0.5 10% Spin-Down Tire Pressure 24 psi
0.4
Tire No. 4
r,r ~ <.0 ~ Hi de Tire
..,. Tire tlo. 9 (Full Tread Depth)
Glass Belted (Smooth)
'-OJ 0.2 ~
"' 3:
0. l
0.0
42 44 46 48 50 52 54
Ground Speed (mph) EFFECT WATER DEPTH ON GROOVED CONCRETE SURFACE.

42
36
~
·~ Vl
30 Q_ r ~
<D r.n QJ
s.. ::s Vl Vl QJ s..
CL
QJ s.. 24 ·~ 1-
I 18
40
-------···-- -f:irtiuna S)Jeecr rmprr/
l'lGURE 50. EFFECT OF WATER DEPTH ON GROOVED CONCRETE SURFACL
Tire tlo. 9 Hide Tread (Full Tread Depth) Water Depth 0.40 in. 10% Spin-Down
Ungrooved / / / Concrete Seal Coat
Grooved Concrete
//
44 48 52 56
Ground Speed (Mph)
FIGURE 61. COMPARISON OF UNGROOVED CO~CRETE, GROOVED CONCRETE A~D SEAL COAT SURFACES.
60 64

70
60
50
40
20
10
0
0
•
Tire No. 8 7.75-14 Bias Ply-Smooth
Speed Limit for Major Rural Highways --- -- - lligh Texture (0.1"'5 in.)
---Low Texture (O.Olil in.)
Pressure 27 psi, 50 th Percentile 10% Spin Dmm
0.2 0.4 0.6 O.B 1.0
Water Depth (in.)
FIGURE 62. EFFECT OF TEXTURE ON HYDROPLANING.
96
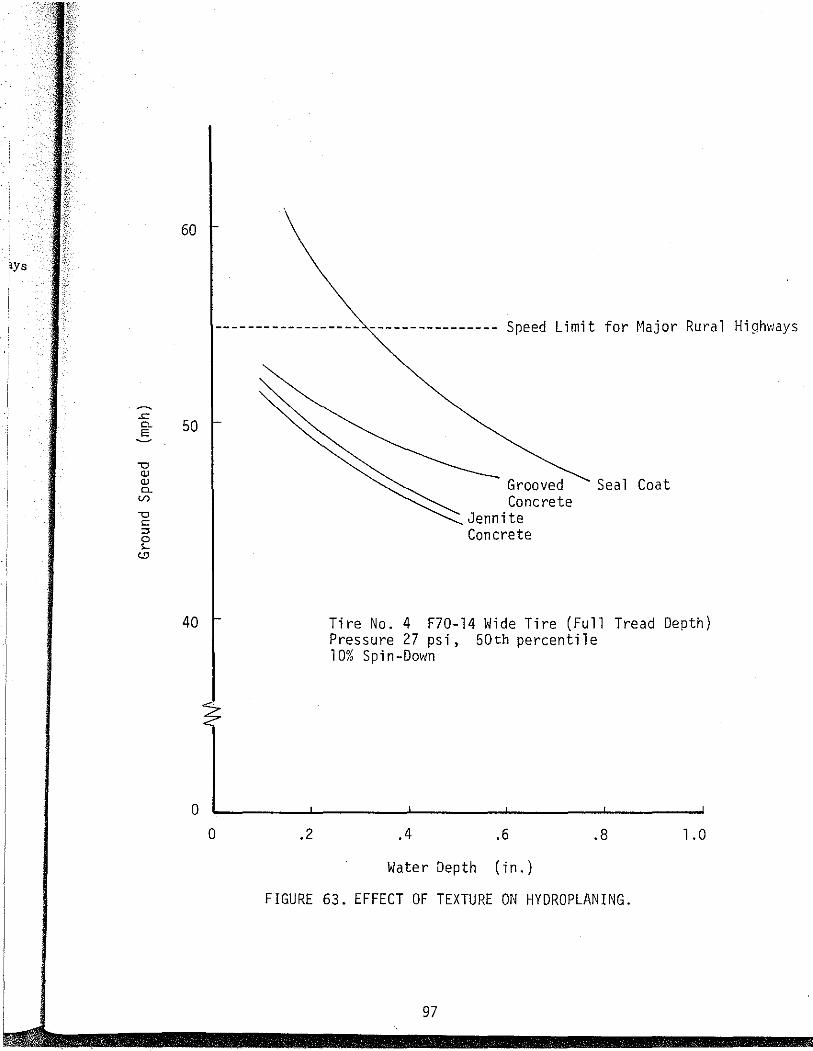
60
ays
.<::
"'- 50 E
"0 QJ QJ Cl. Vl
"0 t:: ::l 0 ,_ '-"
40
0
0
------------------ ---------------- Speed Limit for Major Rural Highways
.2
Grooved Seal Coat Concrete
Jennite Concrete
Tire No. 4 F70-14 Wide Tire (Full Tread Depth) Pressure 27 psi, 50th percentile 10% Spin-Down
.4 .6 .8 1.0
Water Depth (in.)
FIGURE 63. EFFECT OF TEXTURE ON HYDROPLANING.
97

70
50
;;; 30 " 0 ,..
20
10
Jo -------------- Speed Limit for Major Rural Highways
- Psj --~Psi ---------- ........... _, ---- -
Tire No. 4 F70-14 Wide Tire (Full Tread Depth)
Low Texture, 0.018 in. 10% Spin Down
OL-------~-------L------~~------~------~ 0 0.2 0.4 0.6 0.8 1.0
Water Depth (in.)
FIGURE 64. EFFECT OF PRESSURE ON HYDROPLANING.
98
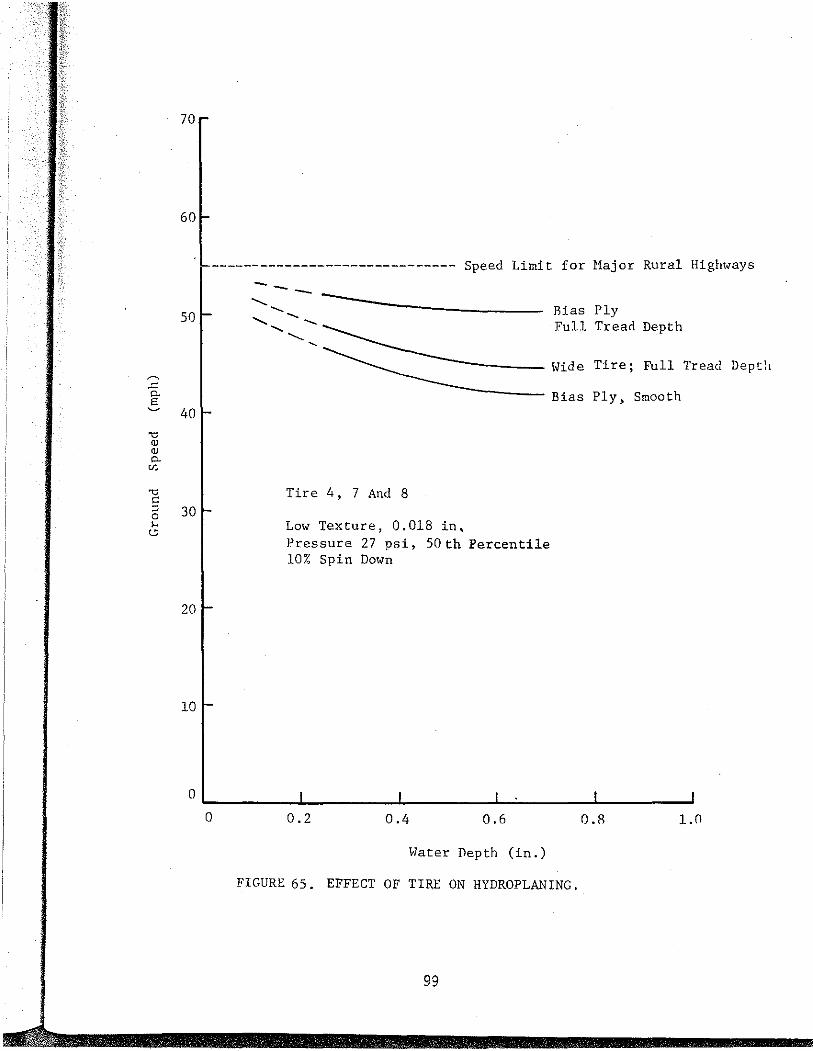
70
60
50
40
20
10
------------------------------ Speed Limit for l1ajor Rural Highways
-....... .......
---..... -
-.. --....... '
Tire 4, 7 And 8
Low Texture, 0.018 in, Pressure 27 psi, 50th Percentile 10% Spin Down
!lias Ply Full Tread Depth
Wide Tire; Full Tread Depth
Bias Ply, Smooth
0~------~-------L------~~------L-------~ 0 0.2 0.4 0.6 O.R 1.0
Hater Depth (in.)
FIGURE 65. EFFECT OF TIRE ON HYDROPLANING.
99

r--
I ___ right fro t tire
--·--· left fron tire --lC--X right rea tire
100 left rear tire
-
80 _d ~ v
I ;.... w b r:: 60 b (I) u
'"' (I)
"' (I)
:> ..... w
"' 40 ..-{
:l s :l
~ u
20
r/ v--·
h 0 A
0 10 14 18 22 26 30 34
Tire Pressure
FIGURE 66. C0!1PARISON OF TIRE PRESSURES - ACCIDENT STUDY. (ref. 25)
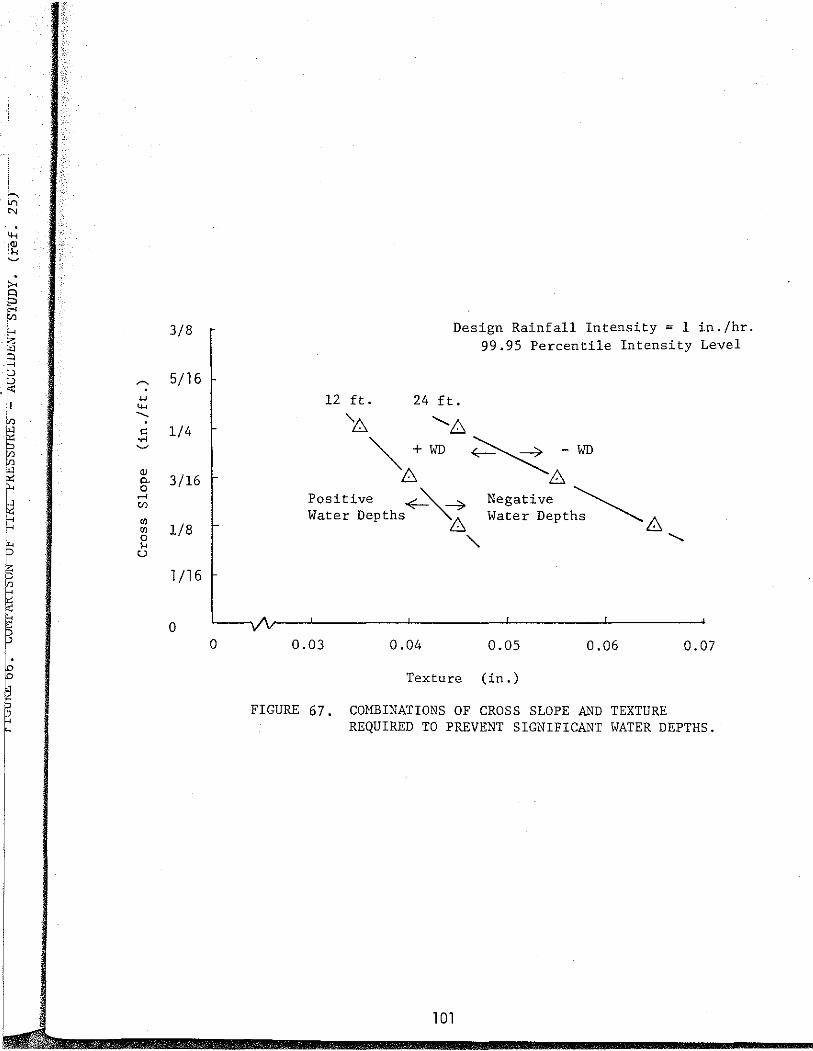
'""' . .,., "' ~ ',<I) ... ~
~ "' ~ 3/8
.;.::::
"' "' "" '-' 5/16 ·~ ~
•I '-'
' 'I ""' irJ -....
"' " 1/4 8 ....
~
"' irJ "' <ll [;'; 0.. 3/16
0
6 .-I
"' ~
H Ul !-< Ul 1/8
0 ... u
1/16
0 0
Design Rainfall Intensity = 1 in./hr. 99.95 Percentile Intensity Level
12 ft. 24 ft.
"L, '6 ~+WD ~-WD
6 6 Positive ~ ___:;,. Negative '-....... Water Depths - ~ Water Depths ~6
" '
0.03 0.04 0.05 0.06 0.07
Texture (in.)
FIGURE 67. COMBINATIONS OF CROSS SLOPE AND TEXTURE REQUIRED TO PREVENT SIGNIFICANT WATER DEPTHS.
101