Embed Size (px)
Citation preview
International Review of Electrical Engineering (I.R.E.E.), Vol. 5, n.5
Manuscript received February 2010, Copyright © 2007 Praise Worthy Prize S.r.l. - All rights reserved
2427
AUTOMATING CONSUMERS’ CONNECTIONS TO THE
DISTRIBUTION NETWORK FOR ENHANCED
PERFORMANCE
O.M. Popoola1, A. Jimoh2, D.Nicolae3
Abstract – Trial and error approach which involves service interruption is usually carried out to resolve
unbalance on phases in power distribution system. This approach might improve the phase voltage and current
but the resultant effect (change) does not last for too long; thereby reduces the market value in terms of quality
and reliability of supply. To enhance the performance of the secondary distribution system there is a need for an
automating technology. The aim of this paper is to introduce a method and technology developed for resolving
imbalances in a secondary distribution system as a result of the uneven distribution of single phase load across a
three phase power system. The technology developed is able to monitor, acquire/display collected data and
perform self changing switching actions electronically. This action is in form of rearrangement or transfer of
consumer loads for optimal performance of the distribution feeder. The proposed switching technology is based
on open- transition switch that enables transfer or rearrangement of consumer loads in a three-phase system
within milliseconds with supervisory control system. The following methodologies: System Simulator - Matlab
(Simulink), Virtual Instrumentation-Lab VIEW and Hardware implementation were applied for the validation of
the proposed technique.
Keywords: Automated technology, Current imbalances, Load balancing, Phase arrangement,
Static transfer switching.
I. Introduction
Electric utilities are facing the demands of reducing
costs and improving the quality as well as consistency of
supply. The distribution network is an important part of
the total electrical supply, as it transports electric power
from the distribution station to the customers.
Conversely, it has also been reported that 80% of the
consumer service interruptions are due to failure in the
distribution network. This is as a result of subjection to
load variations which might be due to load growth and
the delay/non response to the need for construction of
new substations and feeders within the system [1]. The
distribution systems have suffered from the following
maladies, mainly: voltage and current imbalances being a
major factor; poor voltage regulation; peak power/energy
losses; conductor heating/equipment damages; very high
unaccounted energy losses (20 - 40% against
international standards of 8 -10%) [2]…[4]. Different
methods from the standpoint of feeder loss reduction and
load balancing have been proposed, researched, and
presented for improvement of distribution network
reconfiguration; however these were mainly on the
primary distribution system [2…11].
The distribution network is normally instituted at the
primary side or medium voltage level of distribution
network; however it has little or no significant influence
on the problem created at the secondary side or the low
voltage levels. Although, technically these single-phase
loads are arranged such that the 3-phase system is
balanced; the fact, however, is that 100% balanced
operation all the time is impossible. At best what
happens is that the unbalanced is maintained within a
statutory level. Unbalance in the secondary distribution
network increases the severity of the problems of voltage
drop, power losses and large current in the neutral wire
[12], [13],[17].
Normally, to attain load balancing on phases, a
conventional trial and error approach is used. This
involves field measurements and the application of one’s
judgment. Using this approach, the phase voltage and
current unbalances might improve, however the resultant
change usually does not last for a long period of time
[14]. With this approach service interruption is
unavoidable; hence the rearrangement of consumers’ load
distribution points on phases cannot be performed
frequently so that a level of service supply can be
maintained to the consumers.
Although a method by Adisa, Siti & Davidson [15] for
assisting one’s judgment in the conventional trial and
error approach was presented, however this is still
insufficient as a result of the time-varying characteristic
of load.
An optimal solution in the form of automation
implementation using artificial intelligence,
telecommunication and power electronics equipments in
power systems will guarantee continuous dynamic load
balancing along the low voltage secondary feeder thereby
relieving overload in the three-phase system with minimal
service interruption; and reduce real power losses. This
O.M. Popoola, A. Jimoh, D. Nicolae
Copyright © 2010 Praise Worthy Prize S.r.l. - All rights reserved International Review of Electrical Engineering, Vol. 5, n.5
2428
will be technically advantageous as well as economical
for the utilities and the customers.
This paper addresses a method and technology for
implementation, intended for enhancing performance of
the low voltage distribution network.
The paper commences with the problem formulation,
followed by the proposed solution method; and the
validation of the proposed technique as carried out at our
laboratory in South Africa. The remainder of the paper is
devoted to deductions and realization of the automating
technique to reduce unbalance to a minimal level at the
LV distribution network [15], [16].
II. Problem Description
Recent researches has shown that, modifying the radial
structure of the primary feeders from time to time by
changing the on/off status of the sectionalizing and tie
switches to transfer load from feeder to another may
improve the operating conditions of the overall system
significantly. This usually has no considerable effect on
the secondary side of the distribution network, especially
its reliability.
Majority of the consumers at the secondary distribution
are single phase loads. Often times these single phases
are arranged or grouped to have a balanced three phase
systems, however, unbalance still occurs due to unequal
(unevenly) load distribution among the phases of the
feeder during time of use . Hence the need to evolve a
technique to minimize the unbalance effect (reduce
power losses, voltage drop and etc) by transferring loads
from the heavily loaded to less loaded phases randomly.
In formulating this problem, certain predefined
objectives must be satisfied in the redistribution of the
load among phases [17], [18],[19]. In this case the
objective functions that are considered are discussed in
the following:
II.1 Objective Functions to be achieved
a. Total Complex Power Unbalanced
In a three phase load system, the complex powers are
expressed as j
iS (j = a, b, c) for the loading of each phase.
The unbalance of these three complex powers can be
evaluated as follows:
2
1/ 3c
ul j id
i i i
j a
s s s
… (1)
Where id
iS represent the ideal per phase loading and
1/3c
id j
i i
j a
s s
… (2)
This is considered for a typical feeder ith. thus an
evaluation of 0ul
is indicates that the complex power of
ith feeder is balanced. The total complex power
unbalance can be evaluated from:
1
nul ul
T i
i
s s
… (3)
Where n is the number of feeders within the object
feeder. ul
Ts is used to evaluate the complex power
unbalance of a feeder and the value of this describes the
load balance situation at every feeder. Thus minimization
of ul
Ts is an objective function in the proposed method.
b. Average Voltage Drop
A good load balance will generally reduce the voltage
drop. Reducing the voltage drop is also an important
objective for a distribution engineer to achieve. The
average voltage drop is expressed as:
1
1/m
d i
i
V m VD
… (4)
Where m is the number of load points for the feeder
under consideration and
1
/m
p
i rated j rated
j
VD V V V
… (5)
Where Vrated is the rated phase voltage; p
jV is the
magnitude of the phase voltage at load point i and VDi is
the average of the three phase voltage drop at load point
i.
c. Voltage unbalance Factor
The total voltage unbalance factors for the zero and the
negative sequence are expressed as:
0 0
1
1/ /m
i i
i
VUF m V V
… (6)
1
1/ /m
i i
i
VUF m V V
… (7)
d. Total Line Loss
Minimizing the system loss and improving the
operational efficiency are usually major objectives of a
power utility. Hence the minimization of line losses is
also an objective function considered in the redistribution
of loads presented in this work.
2 2 2 2
1
/m
loss i i i i
i
P r P Q V
… (8)
Although conventional trial and error approach is used
for improving load balancing on the secondary level, the
duration of the effects of the balancing varies from one
distribution feeder to another due to the single phase
loads that continually change across the three-phase
feeder [9,10], apart from the time, human resources and
etc spent on achieving it.
The main aim of this study is to research and propose a
method and technology for automatically minimizing the
unbalances in the feeders and enhancing the secondary
distribution network performance with the view to
achieve the following:
▪ Rearrangement of consumers loads among the phases
uniformly so as to achieve load balance at the
secondary distribution level.
O.M. Popoola, A. Jimoh, D. Nicolae
Copyright © 2010 Praise Worthy Prize S.r.l. - All rights reserved International Review of Electrical Engineering, Vol. 5, n.5
2429
▪ To eliminate or reduce trial and error (manual
operations) methods.
▪ Evolve techniques or system for ensuring continuous
dynamic on-line load rearrangement with minimal
service interruption.
▪ Ensure that unbalance is within the specified limit as:
max , , / % limitab bc ca mean meanVUF V V V V V … (9)
Where Vab, Vbc, Vca represents the line to line voltages
and Vmean = mean (Vab, Vbc, Vca).
II.2. Phase and Load Balancing
Usually the load consumption of consumers connected
to a feeder fluctuates, thus leading to the fluctuation of
the total load connected to each phase of the feeder. This
in turn implies that the degree of unbalance keeps
varying. To balance the phase currents in every segment
and reduce the neutral line current is a very difficult task
for the distribution engineers considering the fact that
they do not have control over the utilization by the
consumers. Trial and error approach is based on expert
knowledge and judgment which involves the analysis of
variety of interrelated meter indications to detect
abnormal conditions such as circuit overloads, improper
line voltages, etc. Other factors required in the exercise
include the knowledge of voltage regulations, load flow
analysis and minimization of circuit losses; use of
mathematics to calculate resistive and reactive loads and
phase relationship to identify unbalanced low efficiency
load, circulating currents and undesirable conditions.
With the correct technology and provision of the
required input information(s), most of these activities can
be programmed to be performed by a dedicated
microcontroller or processing unit.
III. Proposed Technique
In the development of a technique for rearrangement of
consumer load to minimize unbalance in a low voltage
distribution system, the key operational activities
identified in relation to the feeder system includes
monitoring and acquisition of data; processing and
communication of signal and data; control and switch
transfer.
These activities can be achieved by separate functional
units namely: (1) the switching unit and (2) sensing unit
which together with the supervisory control station forms
the intelligent unit package for the proposed technology.
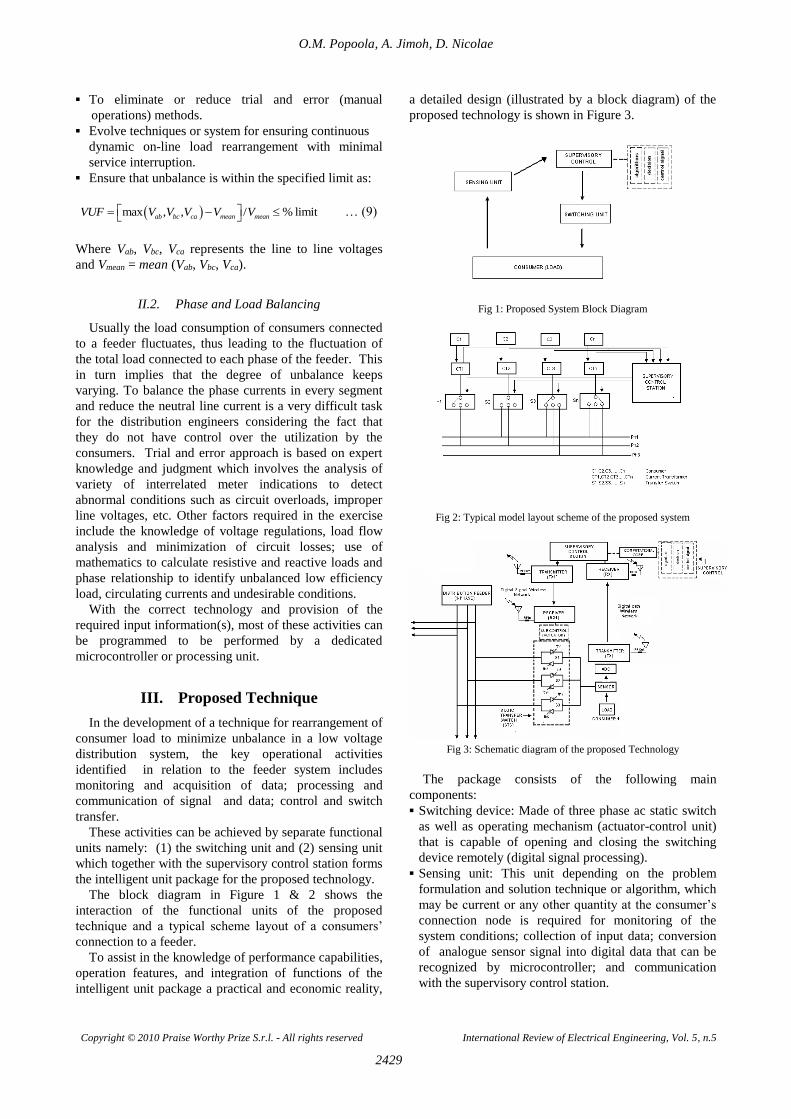
The block diagram in Figure 1 & 2 shows the
interaction of the functional units of the proposed
technique and a typical scheme layout of a consumers’
connection to a feeder.
To assist in the knowledge of performance capabilities,
operation features, and integration of functions of the
intelligent unit package a practical and economic reality,
a detailed design (illustrated by a block diagram) of the
proposed technology is shown in Figure 3.
Fig 1: Proposed System Block Diagram
Fig 2: Typical model layout scheme of the proposed system
Fig 3: Schematic diagram of the proposed Technology
The package consists of the following main
components:
▪ Switching device: Made of three phase ac static switch
as well as operating mechanism (actuator-control unit)
that is capable of opening and closing the switching
device remotely (digital signal processing).
▪ Sensing unit: This unit depending on the problem
formulation and solution technique or algorithm, which
may be current or any other quantity at the consumer’s
connection node is required for monitoring of the
system conditions; collection of input data; conversion
of analogue sensor signal into digital data that can be
recognized by microcontroller; and communication
with the supervisory control station.
O.M. Popoola, A. Jimoh, D. Nicolae
Copyright © 2010 Praise Worthy Prize S.r.l. - All rights reserved International Review of Electrical Engineering, Vol. 5, n.5
2430
▪ Supervisory Control unit: consists of embedded
microcontrollers for effective co-ordination,
computational and control of other intelligent units.
▪ Communication unit: a means of data communication
between the switching unit, sensing unit and the
supervisory control station.
▪ And lastly, uninterruptible power supply unit capable of
powering all components of the package.
The fundamental concept of the proposed technology
is based on the open-transition switch that enables the
transfer or rearrangement of consumer loads in the three-
phase feeder system within milliseconds. This is made
possible through supervisory control system for effective
co-ordination, computational and control of other
intelligent units.
III.1. Construction of Proposed Technology
Starting with the switching unit as shown in Figure 3,
this comprises mainly the static transfer switches (STS)
and the sub control. The static transfer switch is made of
two pair of thyristor connected in inverse parallel for
each phase. During normal operation one of the static
transfer switches is in ON mode or close position
(example S1) allowing the conduction of current to the
load (consumer) while the other two pair of static transfer
switches (S2 & S3) are in the OFF mode or open. When
the rearrangement (transfer) operation is required due to
overload on the current phase (example S1) being used,
S2 or S3 is turned on to conduct the current to the load
from the phase that can accommodate the existing
consumer and balance (or minimize the unbalance) of the
three phase feeder. Then the current in S1 is blocked at
the first zero crossing. The control actions sent from the
supervisory control (SC) is carried out through a logic
switching circuit acting as the operating mechanism or
better known as the actuator. The actuator is part of the
sub control.
The sub control (SbC) is interlinked with the SC and
located on the line. It is designed to acquire data,
switching status and transfer same to the SC through a
communication interface (Wireless Broadband Access
link) and also to perform switching action. The monitored
information (from the sensing unit design) and the
command (control) signal to switches S1 or S2 or S3 to
perform a transfer operation from Phase 1 (Red) to Phase
2 (Blue) or Phase 3 (Yellow) when the preferred source
voltage or current deviates from the pre-set upper or
lower limit is sent from the SC via the SbC.
III.2. Operating and Control Scheme
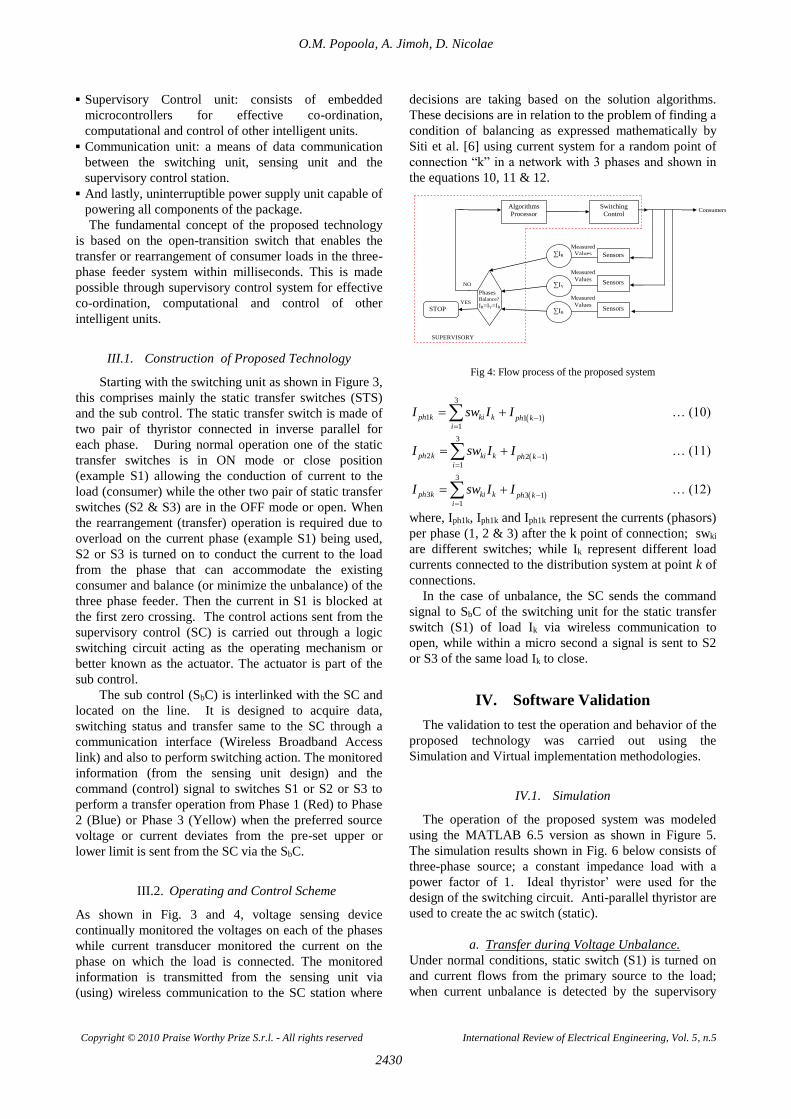
As shown in Fig. 3 and 4, voltage sensing device
continually monitored the voltages on each of the phases
while current transducer monitored the current on the
phase on which the load is connected. The monitored
information is transmitted from the sensing unit via
(using) wireless communication to the SC station where
decisions are taking based on the solution algorithms.
These decisions are in relation to the problem of finding a
condition of balancing as expressed mathematically by
Siti et al. [6] using current system for a random point of
connection “k” in a network with 3 phases and shown in
the equations 10, 11 & 12.
Consumers
Measured
Values
Measured
Values
Measured
Values
YES
NO
Phases Balance?
IR=IY=IB
STOP
Algorithms
Processor
Switching
Control
∑IB
∑IY
∑IR Sensors
Sensors
Sensors
SUPERVISORY
CONTROL
Fig 4: Flow process of the proposed system
3
1 1 11
ph k ki k ph ki
I sw I I
… (10)
3
2 2 11
ph k ki k ph ki
I sw I I
… (11)
3
3 3 11
ph k ki k ph ki
I sw I I
… (12)
where, Iph1k, Iph1k and Iph1k represent the currents (phasors)
per phase (1, 2 & 3) after the k point of connection; swki are different switches; while Ik
represent different load
currents connected to the distribution system at point k of
connections.
In the case of unbalance, the SC sends the command
signal to SbC of the switching unit for the static transfer
switch (S1) of load Ik via wireless communication to
open, while within a micro second a signal is sent to S2
or S3 of the same load Ik to close.
IV. Software Validation
The validation to test the operation and behavior of the
proposed technology was carried out using the
Simulation and Virtual implementation methodologies.
IV.1. Simulation
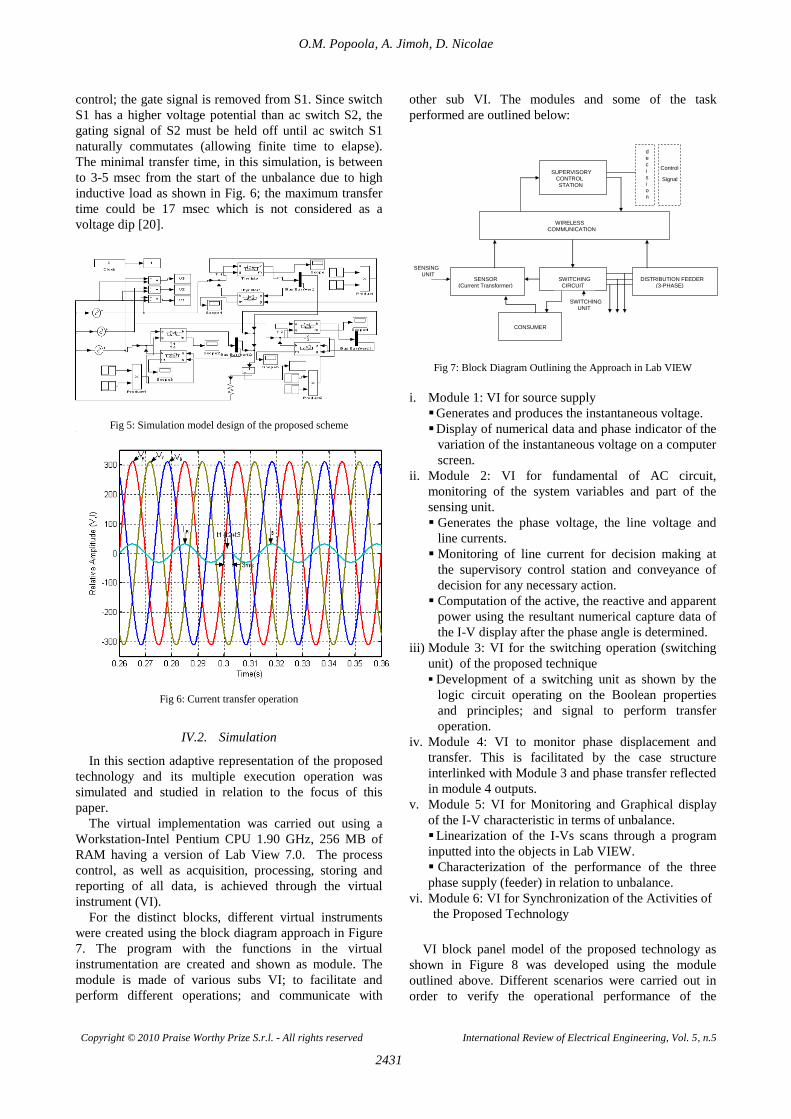
The operation of the proposed system was modeled
using the MATLAB 6.5 version as shown in Figure 5.
The simulation results shown in Fig. 6 below consists of
three-phase source; a constant impedance load with a
power factor of 1. Ideal thyristor’ were used for the
design of the switching circuit. Anti-parallel thyristor are
used to create the ac switch (static).
a. Transfer during Voltage Unbalance.
Under normal conditions, static switch (S1) is turned on
and current flows from the primary source to the load;
when current unbalance is detected by the supervisory
O.M. Popoola, A. Jimoh, D. Nicolae
Copyright © 2010 Praise Worthy Prize S.r.l. - All rights reserved International Review of Electrical Engineering, Vol. 5, n.5
2431
control; the gate signal is removed from S1. Since switch
S1 has a higher voltage potential than ac switch S2, the
gating signal of S2 must be held off until ac switch S1
naturally commutates (allowing finite time to elapse).
The minimal transfer time, in this simulation, is between
to 3-5 msec from the start of the unbalance due to high
inductive load as shown in Fig. 6; the maximum transfer
time could be 17 msec which is not considered as a
voltage dip [20].
Fig 5: Simulation model design of the proposed scheme
Fig 6: Current transfer operation
IV.2. Simulation
In this section adaptive representation of the proposed
technology and its multiple execution operation was
simulated and studied in relation to the focus of this
paper.
The virtual implementation was carried out using a
Workstation-Intel Pentium CPU 1.90 GHz, 256 MB of
RAM having a version of Lab View 7.0. The process
control, as well as acquisition, processing, storing and
reporting of all data, is achieved through the virtual
instrument (VI).
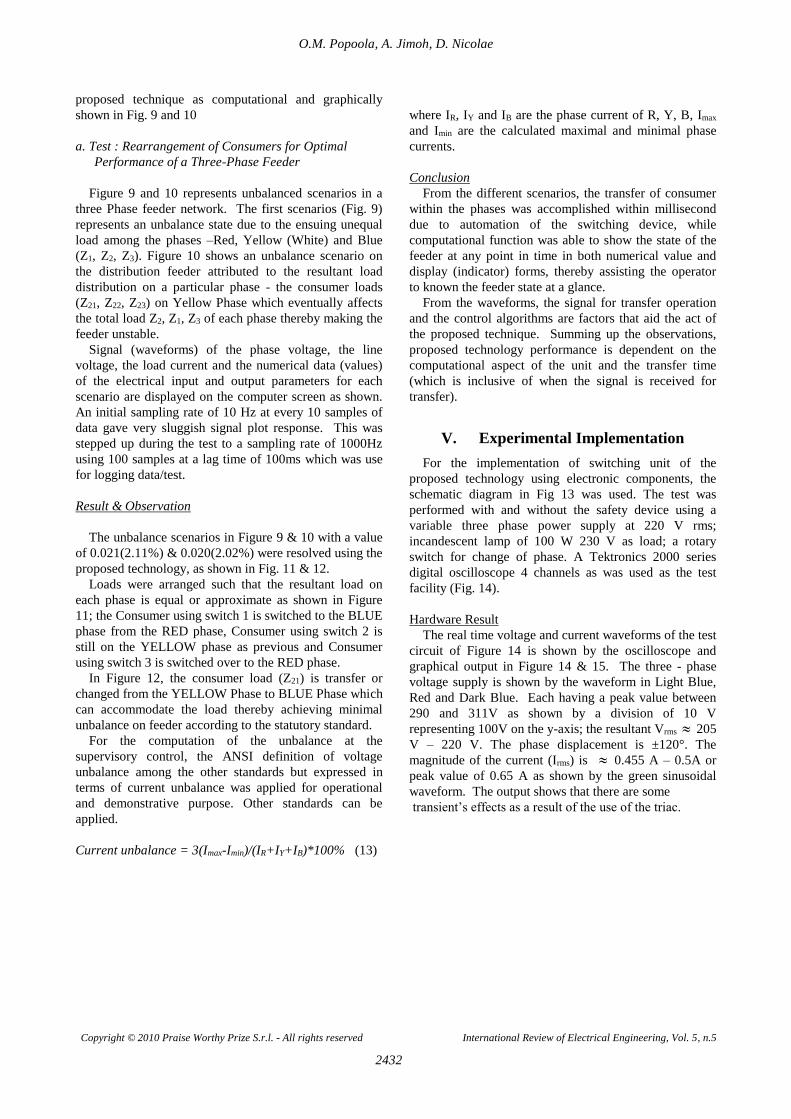
For the distinct blocks, different virtual instruments
were created using the block diagram approach in Figure
7. The program with the functions in the virtual
instrumentation are created and shown as module. The
module is made of various subs VI; to facilitate and
perform different operations; and communicate with
other sub VI. The modules and some of the task
performed are outlined below:
SUPERVISORY CONTROL STATION
WIRELESS COMMUNICATION
SENSOR (Current Transformer)
SWITCHING CIRCUIT
DISTRIBUTION FEEDER (3-PHASE)
CONSUMER
SWITCHING UNIT Transformer)
SENSING UNIT Transformer)
decision
Control
Signal
Fig 7: Block Diagram Outlining the Approach in Lab VIEW
i. Module 1: VI for source supply
Generates and produces the instantaneous voltage.
Display of numerical data and phase indicator of the
variation of the instantaneous voltage on a computer
screen.
ii. Module 2: VI for fundamental of AC circuit,
monitoring of the system variables and part of the
sensing unit.
Generates the phase voltage, the line voltage and
line currents.
Monitoring of line current for decision making at
the supervisory control station and conveyance of
decision for any necessary action.
Computation of the active, the reactive and apparent
power using the resultant numerical capture data of
the I-V display after the phase angle is determined.
iii) Module 3: VI for the switching operation (switching
unit) of the proposed technique
▪ Development of a switching unit as shown by the
logic circuit operating on the Boolean properties
and principles; and signal to perform transfer
operation.
iv. Module 4: VI to monitor phase displacement and
transfer. This is facilitated by the case structure
interlinked with Module 3 and phase transfer reflected
in module 4 outputs.
v. Module 5: VI for Monitoring and Graphical display
of the I-V characteristic in terms of unbalance.
Linearization of the I-Vs scans through a program
inputted into the objects in Lab VIEW.
Characterization of the performance of the three
phase supply (feeder) in relation to unbalance.
vi. Module 6: VI for Synchronization of the Activities of
the Proposed Technology
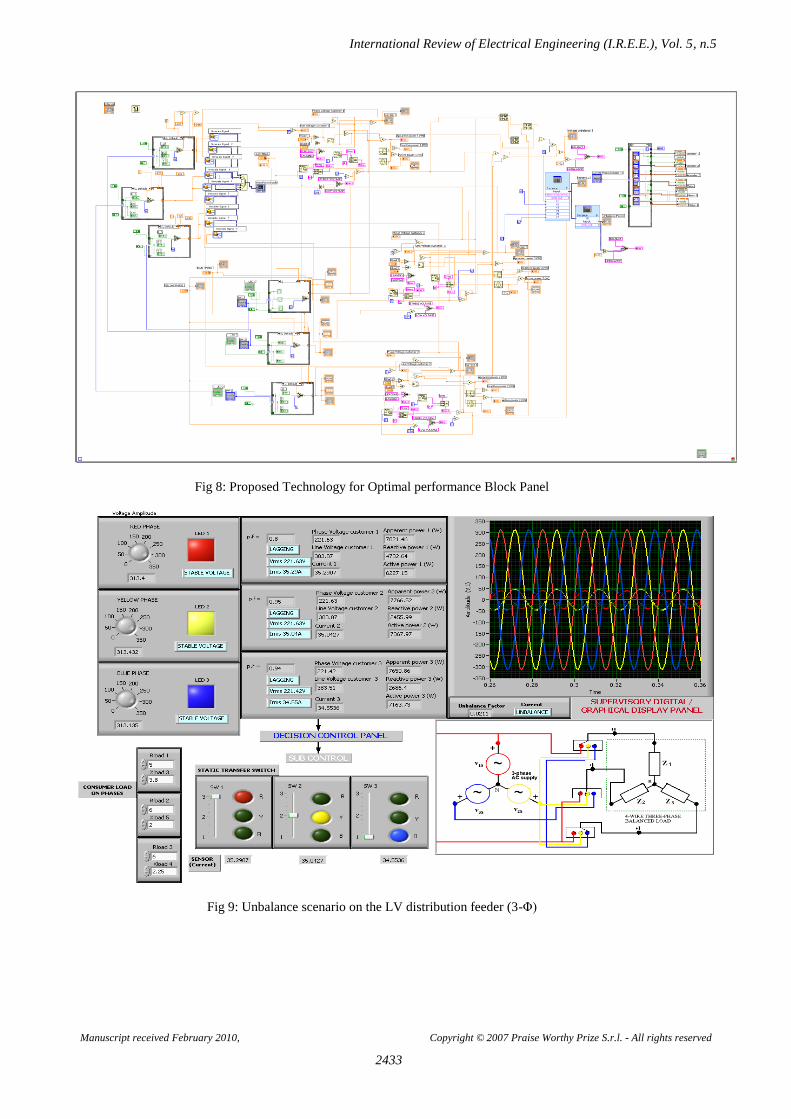
VI block panel model of the proposed technology as
shown in Figure 8 was developed using the module
outlined above. Different scenarios were carried out in
order to verify the operational performance of the
O.M. Popoola, A. Jimoh, D. Nicolae
Copyright © 2010 Praise Worthy Prize S.r.l. - All rights reserved International Review of Electrical Engineering, Vol. 5, n.5
2432
proposed technique as computational and graphically
shown in Fig. 9 and 10
a. Test : Rearrangement of Consumers for Optimal
Performance of a Three-Phase Feeder
Figure 9 and 10 represents unbalanced scenarios in a
three Phase feeder network. The first scenarios (Fig. 9)
represents an unbalance state due to the ensuing unequal
load among the phases –Red, Yellow (White) and Blue
(Z1, Z2, Z3). Figure 10 shows an unbalance scenario on
the distribution feeder attributed to the resultant load
distribution on a particular phase - the consumer loads
(Z21, Z22, Z23) on Yellow Phase which eventually affects
the total load Z2, Z1, Z3 of each phase thereby making the
feeder unstable.
Signal (waveforms) of the phase voltage, the line
voltage, the load current and the numerical data (values)
of the electrical input and output parameters for each
scenario are displayed on the computer screen as shown.
An initial sampling rate of 10 Hz at every 10 samples of
data gave very sluggish signal plot response. This was
stepped up during the test to a sampling rate of 1000Hz
using 100 samples at a lag time of 100ms which was use
for logging data/test.
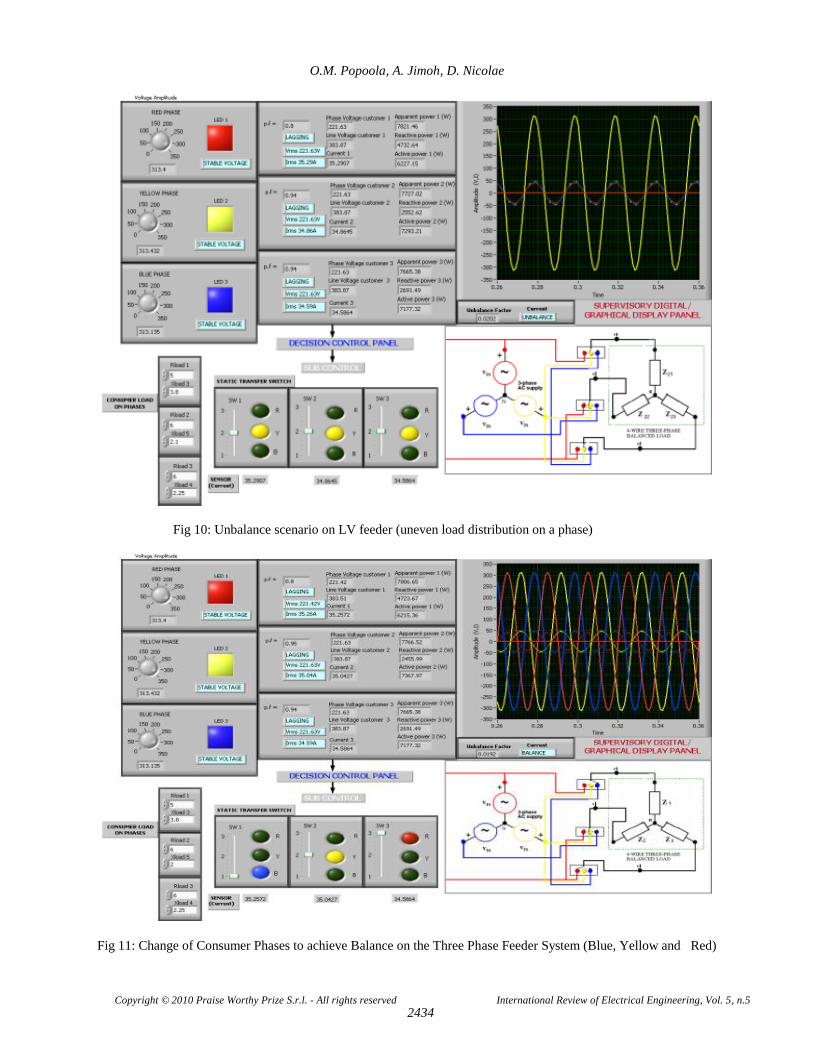
Result & Observation
The unbalance scenarios in Figure 9 & 10 with a value
of 0.021(2.11%) & 0.020(2.02%) were resolved using the
proposed technology, as shown in Fig. 11 & 12.
Loads were arranged such that the resultant load on
each phase is equal or approximate as shown in Figure
11; the Consumer using switch 1 is switched to the BLUE
phase from the RED phase, Consumer using switch 2 is
still on the YELLOW phase as previous and Consumer
using switch 3 is switched over to the RED phase.
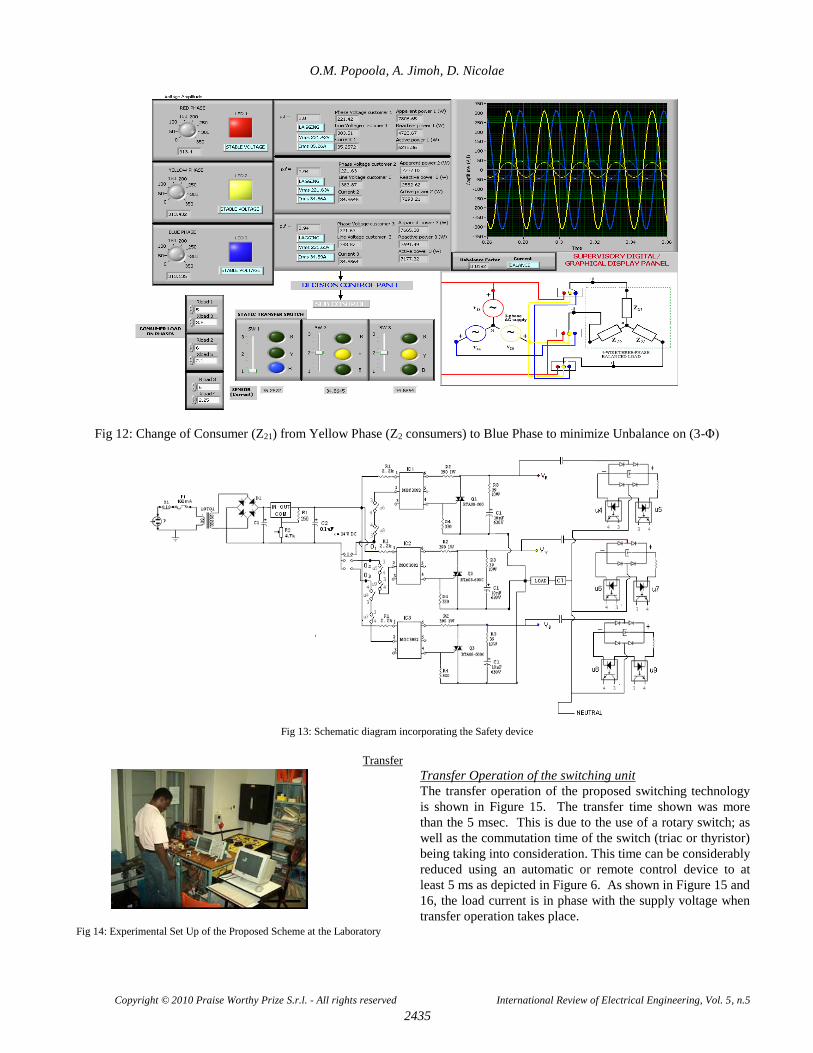
In Figure 12, the consumer load (Z21) is transfer or
changed from the YELLOW Phase to BLUE Phase which
can accommodate the load thereby achieving minimal
unbalance on feeder according to the statutory standard.
For the computation of the unbalance at the
supervisory control, the ANSI definition of voltage
unbalance among the other standards but expressed in
terms of current unbalance was applied for operational
and demonstrative purpose. Other standards can be
applied.
Current unbalance = 3(Imax-Imin)/(IR+IY+IB)*100% (13)
where IR, IY and IB are the phase current of R, Y, B, Imax
and Imin are the calculated maximal and minimal phase
currents.
Conclusion
From the different scenarios, the transfer of consumer
within the phases was accomplished within millisecond
due to automation of the switching device, while
computational function was able to show the state of the
feeder at any point in time in both numerical value and
display (indicator) forms, thereby assisting the operator
to known the feeder state at a glance.
From the waveforms, the signal for transfer operation
and the control algorithms are factors that aid the act of
the proposed technique. Summing up the observations,
proposed technology performance is dependent on the
computational aspect of the unit and the transfer time
(which is inclusive of when the signal is received for
transfer).
V. Experimental Implementation
For the implementation of switching unit of the
proposed technology using electronic components, the
schematic diagram in Fig 13 was used. The test was
performed with and without the safety device using a
variable three phase power supply at 220 V rms;
incandescent lamp of 100 W 230 V as load; a rotary
switch for change of phase. A Tektronics 2000 series
digital oscilloscope 4 channels as was used as the test
facility (Fig. 14).
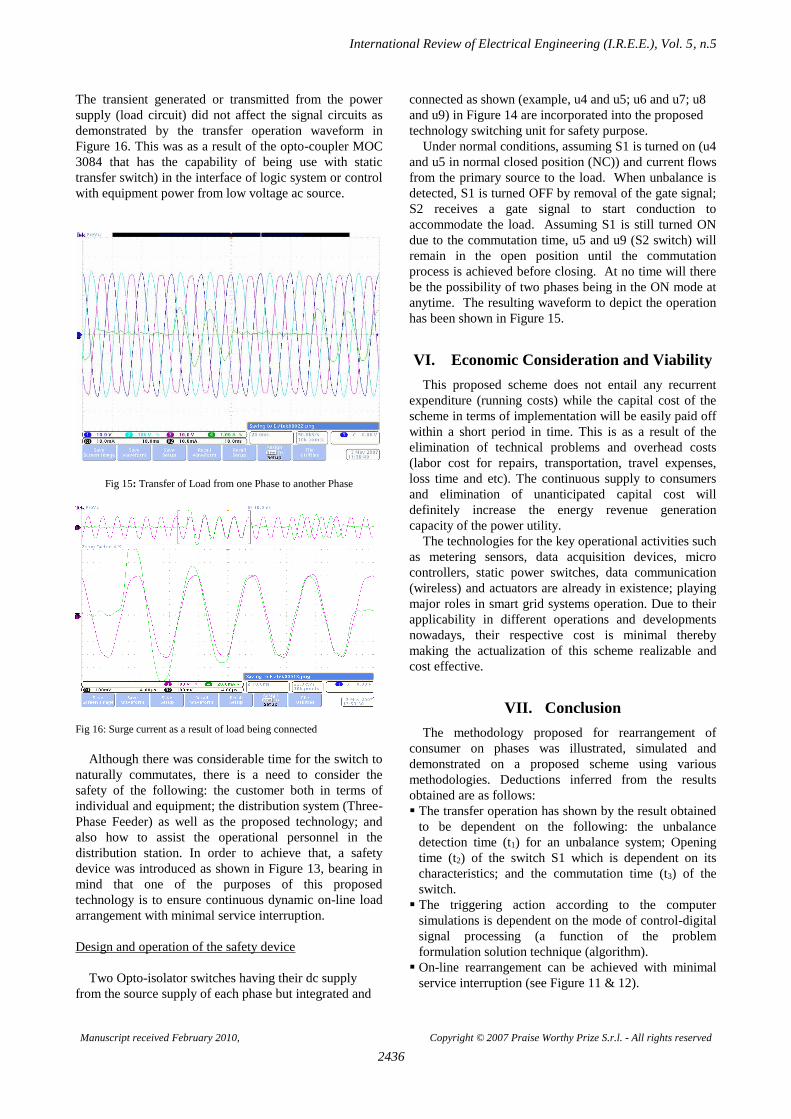
Hardware Result
The real time voltage and current waveforms of the test
circuit of Figure 14 is shown by the oscilloscope and
graphical output in Figure 14 & 15. The three - phase
voltage supply is shown by the waveform in Light Blue,
Red and Dark Blue. Each having a peak value between
290 and 311V as shown by a division of 10 V
representing 100V on the y-axis; the resultant Vrms 205
V – 220 V. The phase displacement is ±120°. The
magnitude of the current (Irms) is 0.455 A – 0.5A or
peak value of 0.65 A as shown by the green sinusoidal
waveform. The output shows that there are some
transient’s effects as a result of the use of the triac.
International Review of Electrical Engineering (I.R.E.E.), Vol. 5, n.5
Manuscript received February 2010, Copyright © 2007 Praise Worthy Prize S.r.l. - All rights reserved
2433
Fig 8: Proposed Technology for Optimal performance Block Panel
Fig 9: Unbalance scenario on the LV distribution feeder (3-Φ)

O.M. Popoola, A. Jimoh, D. Nicolae
Copyright © 2010 Praise Worthy Prize S.r.l. - All rights reserved International Review of Electrical Engineering, Vol. 5, n.5 2434
Fig 10: Unbalance scenario on LV feeder (uneven load distribution on a phase)
Fig 11: Change of Consumer Phases to achieve Balance on the Three Phase Feeder System (Blue, Yellow and Red)
O.M. Popoola, A. Jimoh, D. Nicolae
Copyright © 2010 Praise Worthy Prize S.r.l. - All rights reserved International Review of Electrical Engineering, Vol. 5, n.5
2435
Fig 12: Change of Consumer (Z21) from Yellow Phase (Z2 consumers) to Blue Phase to minimize Unbalance on (3-Φ)
Fig 13: Schematic diagram incorporating the Safety device
Fig 14: Experimental Set Up of the Proposed Scheme at the Laboratory
Transfer
Transfer Operation of the switching unit
The transfer operation of the proposed switching technology
is shown in Figure 15. The transfer time shown was more
than the 5 msec. This is due to the use of a rotary switch; as
well as the commutation time of the switch (triac or thyristor)
being taking into consideration. This time can be considerably
reduced using an automatic or remote control device to at
least 5 ms as depicted in Figure 6. As shown in Figure 15 and
16, the load current is in phase with the supply voltage when
transfer operation takes place.

International Review of Electrical Engineering (I.R.E.E.), Vol. 5, n.5
Manuscript received February 2010, Copyright © 2007 Praise Worthy Prize S.r.l. - All rights reserved
2436
The transient generated or transmitted from the power
supply (load circuit) did not affect the signal circuits as
demonstrated by the transfer operation waveform in
Figure 16. This was as a result of the opto-coupler MOC
3084 that has the capability of being use with static
transfer switch) in the interface of logic system or control
with equipment power from low voltage ac source.
Fig 15: Transfer of Load from one Phase to another Phase
Fig 16: Surge current as a result of load being connected
Although there was considerable time for the switch to
naturally commutates, there is a need to consider the
safety of the following: the customer both in terms of
individual and equipment; the distribution system (Three-
Phase Feeder) as well as the proposed technology; and
also how to assist the operational personnel in the
distribution station. In order to achieve that, a safety
device was introduced as shown in Figure 13, bearing in
mind that one of the purposes of this proposed
technology is to ensure continuous dynamic on-line load
arrangement with minimal service interruption.
Design and operation of the safety device
Two Opto-isolator switches having their dc supply
from the source supply of each phase but integrated and
connected as shown (example, u4 and u5; u6 and u7; u8
and u9) in Figure 14 are incorporated into the proposed
technology switching unit for safety purpose.
Under normal conditions, assuming S1 is turned on (u4
and u5 in normal closed position (NC)) and current flows
from the primary source to the load. When unbalance is
detected, S1 is turned OFF by removal of the gate signal;
S2 receives a gate signal to start conduction to
accommodate the load. Assuming S1 is still turned ON
due to the commutation time, u5 and u9 (S2 switch) will
remain in the open position until the commutation
process is achieved before closing. At no time will there
be the possibility of two phases being in the ON mode at
anytime. The resulting waveform to depict the operation
has been shown in Figure 15.
VI. Economic Consideration and Viability
This proposed scheme does not entail any recurrent
expenditure (running costs) while the capital cost of the
scheme in terms of implementation will be easily paid off
within a short period in time. This is as a result of the
elimination of technical problems and overhead costs
(labor cost for repairs, transportation, travel expenses,
loss time and etc). The continuous supply to consumers
and elimination of unanticipated capital cost will
definitely increase the energy revenue generation
capacity of the power utility.
The technologies for the key operational activities such
as metering sensors, data acquisition devices, micro
controllers, static power switches, data communication
(wireless) and actuators are already in existence; playing
major roles in smart grid systems operation. Due to their
applicability in different operations and developments
nowadays, their respective cost is minimal thereby
making the actualization of this scheme realizable and
cost effective.
VII. Conclusion
The methodology proposed for rearrangement of
consumer on phases was illustrated, simulated and
demonstrated on a proposed scheme using various
methodologies. Deductions inferred from the results
obtained are as follows:
The transfer operation has shown by the result obtained
to be dependent on the following: the unbalance
detection time (t1) for an unbalance system; Opening
time (t2) of the switch S1 which is dependent on its
characteristics; and the commutation time (t3) of the
switch.
The triggering action according to the computer
simulations is dependent on the mode of control-digital
signal processing (a function of the problem
formulation solution technique (algorithm).
On-line rearrangement can be achieved with minimal
service interruption (see Figure 11 & 12).

O.M. Popoola, A. Jimoh, D. Nicolae
Copyright © 2010 Praise Worthy Prize S.r.l. - All rights reserved International Review of Electrical Engineering, Vol. 5, n.5
2437
The computation analysis of the state of the Feeder was
achieved without any application of one’s indulgent and
judgment (see Figure 9, 10, 11, and 12).
Earlier discussions have establish the need to minimize
unbalance in the distribution system, however solution
and approaches proposed were designed to deal with
feeder reconfiguration from the standpoint of power loss
reduction and load balancing mostly on the medium
voltage distribution network; but with little emphases on
the method of implementations and the technology for
implementation for the low voltage distribution network.
The main aim of this study which was to propose and
research a method and technology for automatically
enhancing the performance of the feeders in the
secondary distribution network has been accomplished.
The idea of using automatic and remote technology
based on the open-transition switching concept has been
implemented with great success and shown to be
attainable as shown from the results obtained and
deduced in the course of the work. With reference to the
term of the focus of this research, the reliability and
functionality of the proposed technique has been
demonstrated, tested and found to be adequate.
Acknowledgements
This work was supported by Eskom, South Africa and
Tshwane University of Technology.
References
[1] A. Jimoh, O. M. Popoola, A.O. Ogunjuyigbe, Towards Optimum
Performance of a Distribution Feeder, The International
Conference on Electric Power systems 2007, 23rd -25th July,
Lagos, Nigeria.
[2] T, Chen and J. Cherng, Optimal Phase Arrangement of
Distribution Connected to a Primary Feeder for System
Unbalance Improvement and Loss Reduction Using Genetic
Algorithms, IEEE Transactions on Power Systems, vol.15 n.3,
2000:pp. 994-999.
[3] R. Khordishi, An Efficient Hybrid Evolutionary Algorithm for
Multi-Objective Distribution Feeder Reconfiguration,
International Review of Electrical Engineering, Vol.4 Part B,
No.6, pp. 1318-1325, Dec. 2009
[4] G. Sidana, Management of Sub transmission and Distribution
System in Power Utilities. GISdevelopment.net [Online].
Available from:http://A:\Mamagement%20of%20sub-
transmission%20 and %20distribution%20system%20i...
[Accesses: 21/10/2005].
[5] T. Niknami, R. Khordishi, and B.B. Firouzi, A Hybrid
Evolutionary Algorithm for Distribution Feeder Reconfiguration,
Sadham, Vol. 35, Part 2, April 2010, pp. 139-162. Indian
Academy of Science.
[6] K. Huang, H. Chin H, Distribution feeder energy conservation by
using heuristics fuzzy approach, Electrical Power and Energy
Systems, vol. 24, 2002: pp. 439 – 445.
[7] J. Teng, C. Chang, A Novel and Fast Three-Phase Load Flow for
Unbalanced Radial Distribution Systems, IEEE Transaction on
Power Systems, vol. 17 n. 4, 2000, pp. 1238-1244
[8] S. Mishra and D. Das, A Novel Active Power Loss Allocation
Scheme for Unbalanced Radial Power Distribution System,
International Review of Electrical Engineering, Vol.3, No.3, pp.
543-550, June 2008
[9] M.W. Siti, D.V. Nicolae, A.A. Jimoh, A. Ukil, Reconfiguration
and Load Balancing in the LV and MV Distribution Networks for
Optimal Performance, IEEE Transactions on Power Delivery,
Vol. 22, No. 4, pp. 2534-2540, Oct. 2007
[10] G.R. Regulavalasa, S.R. Annapantula, V.L.N. Sadhu and H.R.
Bhanagarapu, A New Algorithm of Distribution Networks
Determining Critical Switches, International Review of Electrical
Engineering, Vol.3, No.2, pp. 248-252, April 2008
[11] M. Tsay, & S.Chan, Improvement in system unbalance and loss
reduction of distribution feeders using transformer phase
rearrangement and load diversity, Electrical Power and Energy
Systems vol.25, 2005.
[12] A.V. Jouanne, Assessment of Voltage Unbalance, IEEE
Transaction on Power delivery,vol. 16 n.4, 2005 pp.782-790
[13] L.F. Ochoa, R.M. Ciric, A. Padilha-Feltrin, G.P. Harrison,
Evaluation of Distribution system losses due to Load unbalance,
15th Power Systems Computation Conference (PSCC),
vol.6,2005, pp.1-4
[14] M.W. Siti, A. Jimoh, D. Nicolae, Automatic load balancing in
Distribution Feeder, the Industrial Electronics Society
Conference 2005 (IECON 05), Raleigh North Caroline, United
State of America Date. Raleigh, pp 6-12.
[15] A. Jimoh, M. Siti, I.E. Davidson, Analysis of Technical Loss
Reduction Options in Domestic Feeders Using Engineering and
Economic Model, UIE International Conference, 18-22 Jan.
2004.
[16] O.M. Popoola, A.A. Jimoh, D.V. Nicolae, On-Line Remote and
Automatic Switching of Consumers’ Connection for Optimal
Performance of A Distribution Feeder, International Electrical
Electronic Engineering Conference (IEEE AFRICON 2007), 26th
– 28th September, 2007 Windhoek, Namibia.
[17] R. M. Ciric and H. Nouri, A New Method for Evaluation of
Distribution System Losses due to Load Unbalance, International
Review of Electrical Engineering, Vol.3, No.1, pp. 37-45, Feb.
2008
[18] F. A. Mohamed and H. N. Koivo, Multiobjective Genetic
Algorithms for Online Management Problem of Microgrid, International Review of Electrical Engineering, Vol.3, No.1, pp.
46-54, Feb. 2008
[19] M. Mashour, M. A. Golkar, S. M. Moghaddas-Tafreshi, Profit-
Based Reconfiguration Methodology for Multi-Feeder Multi-
Substation Distribution Network, International Review of
Electrical Engineering, Vol.5, No.1, part A, pp. 106-119, Feb.
2010
[20] NRS 048-2:2004 ELECTRICITY SUPPLY — QUALITY OF
SUPPLY Part 2: Voltage characteristics, compatibility levels,
limits and assessment methods
Authors’ information
1Electrical Engineering department, Tshwane University of
Technology, Pretoria. [email protected] 2Electrical Engineering department, Tshwane University of
Technology, Pretoria. [email protected] CORRESPONDING 3 Electrical Engineering department, Tshwane University of
Technology, eMalahleni campus. [email protected]
Olawale Popoola was born in Abeokuta,
Nigeria in 1966. He graduated from Federal
Polytechic, Ilaro, Nigeria in 1988 with a
Higher National Diploma (electrical
engineering), got a bachelor degree (quality)
and a Masters degree (electrical (power)
engineering) from Tshwane University of
Technology in 2005 & 2008 and presently
studying for his doctoral at the same
institution.
After graduation he worked with Witt and Bush Shipyard as a
Management trainee (Technical). He later joined Weatherford
International Services in Nigeria as a Joint Analysis Technician up to

O.M. Popoola, A. Jimoh, D. Nicolae
Copyright © 2010 Praise Worthy Prize S.r.l. - All rights reserved International Review of Electrical Engineering, Vol. 5, n.5
2438
1995. Thereafter he joined J.K Nigeria Limited as Branch Manager
(Port Harcourt) overseeing their oil operation and drilling services till
2001. Presently he is Energy Project Engineer at the Centre for Energy
and Electric Power, Tshwane University of Technology. His research
interests include Energy Management, Renewable and Sustainable
energy, and Demand Side Management, Quality Management, Special
focus on Continual Improvement in Learning Organization and Power
electronics application in Power Systems.
Mr Popoola is currently a senior member of both South Africa
Institute of Electrical Engineers and South Africa Quality Institute in
addition to being a member of South Africa Association for Energy
Efficiency.
Adisa A. Jimoh (M’86, SM’10) received the
B.Eng. and M.Eng. degrees from Ahmadu
Bello University (ABU), Zaria, Nigeria, in
1977 and 1980, respectively, and the Ph.D.
degree from McMaster University, Hamilton,
ON, Canada, in 1986.
He was with ABU until 1992, when he
moved to the Research and Development Unit, National Electric Power
Authority (NEPA), Lagos, Nigeria. He was with NEPA until 1996
when he moved to the University of Durban-Westville, Durban, South
Africa, where he taught courses and carried out research in high-
performance energy efficient electric machines and power systems and
power electronics. In 2001, he joined Tshwane University of
Technology, Pretoria, South Africa, where, as a Full Professor, he is the
Head of Department of Electrical Engineering and the leader of the
Energy and Industrial Power Systems research niche area. His research
interests are in electric machines, drives, and power-electronics
applications in power systems.
Dr. Jimoh is a Registered Engineer in South Africa.
Dan Valentin Nicolae (MIEEE) was born in
1948, in Bucharest, Romania. He graduated the
Polytechnic University of Bucharest, Romania in
July 1971 with Msc degree and got his doctorate
degree in 2004 at Vaal University of Technology,
South Africa.
After graduation he worked as researcher in the
Institute for Nuclear Technologies, National
Institute for Scientific and Technological Creativity - Avionics
Division, Bucharest, Romania.
In 1998 he joined Tshwane University of Technology, Electrical
Engineering Department, South Africa. He is doing research in the
field of power converters, control of electric machines and non-
conventional power extraction from high voltage transmission lines.
Dr. Nicolae is a member of Engineering Counsel of South Africa and
South African Institute of Electrical Engineers.