Embed Size (px)
Citation preview
Automatically Characterizing Large Scale Program Behavior
Timothy Sherwood
Erez Perelman
Greg Hamerly
Brad Calder
ASPLOS : Sherwood et. al. 2
Title
• Ideal: To understand the effects of cycle-level events on full program execution
• Challenge: To achieve this without doing complete detailed simulation
• How: Build a high-level model of program behavior that can be used in conjunction with limited detailed simulation
ASPLOS : Sherwood et. al. 3
Goals
• The goals of this research are:– To create an automatic system that is
capable of intelligently characterizing time-varying program behavior
– To provide both analytic and software tools to help with program phase identification
– To demonstrate the utility of these tools for finding places to simulate (SimPoints)
– Without full program detailed simulation
ASPLOS : Sherwood et. al. 4
Our Approach
• Programs are neither– Completely Homogenous– nor Totally Random
• Instead they are quite structured
• Discover this structure
• The key is the code that is executing– the code determines the program behavior
ASPLOS : Sherwood et. al. 5
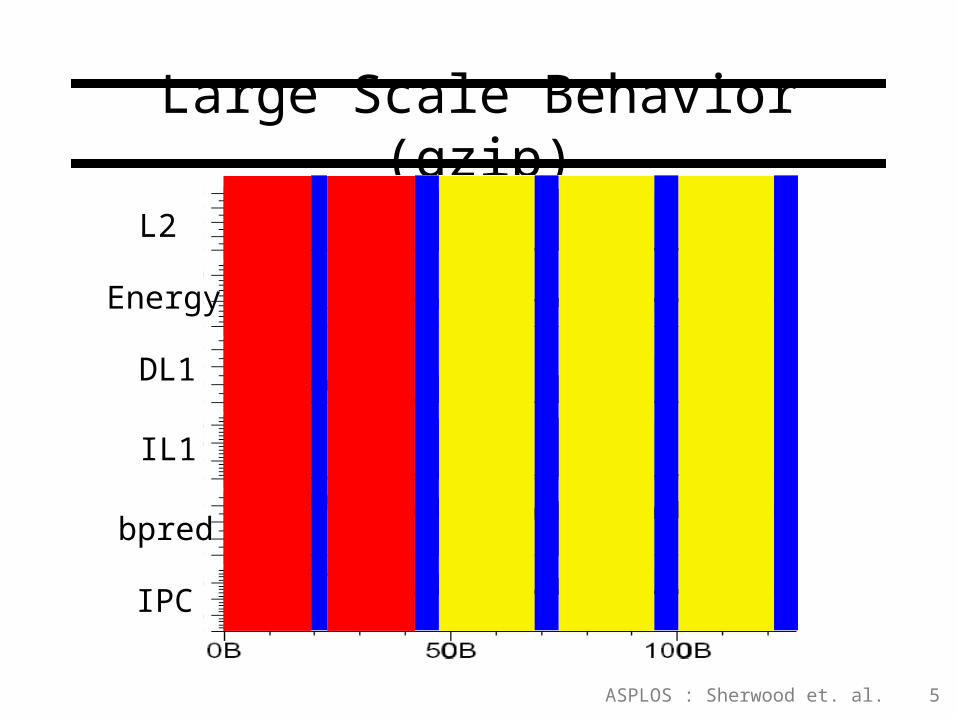
Large Scale Behavior (gzip)
IPC
Energy
DL1
IL1
L2
bpred
ASPLOS : Sherwood et. al. 6
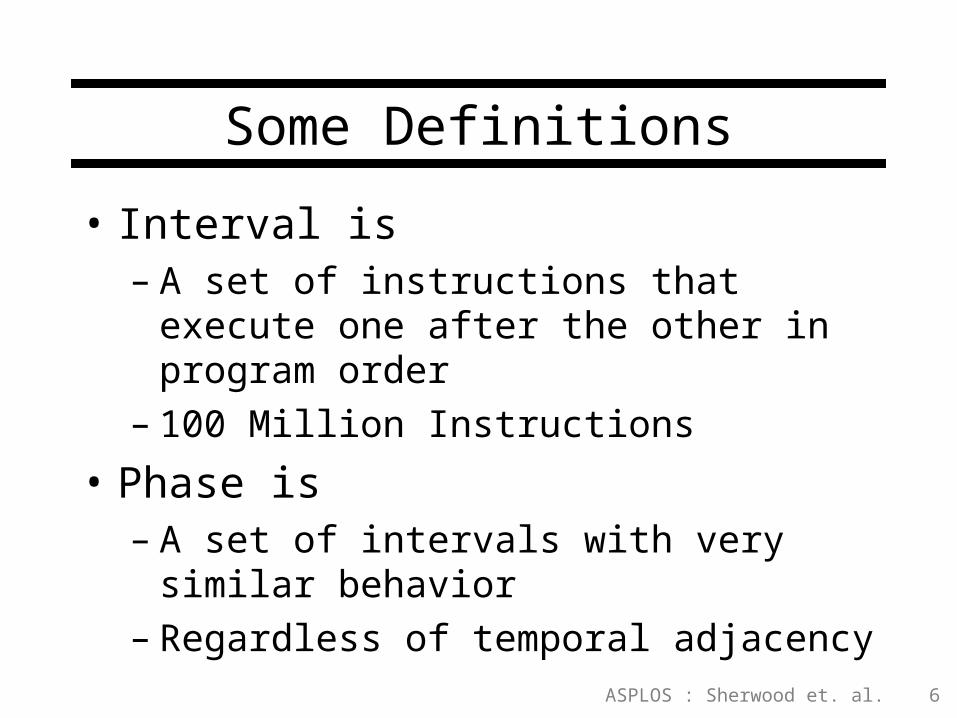
Some Definitions
• Interval is – A set of instructions that execute one after
the other in program order– 100 Million Instructions
• Phase is– A set of intervals with very similar behavior– Regardless of temporal adjacency
ASPLOS : Sherwood et. al. 7
Outline
• Examining the Programs
• Finding Phases Automatically
• Application to Efficient Simulation
• Conclusions
ASPLOS : Sherwood et. al. 8
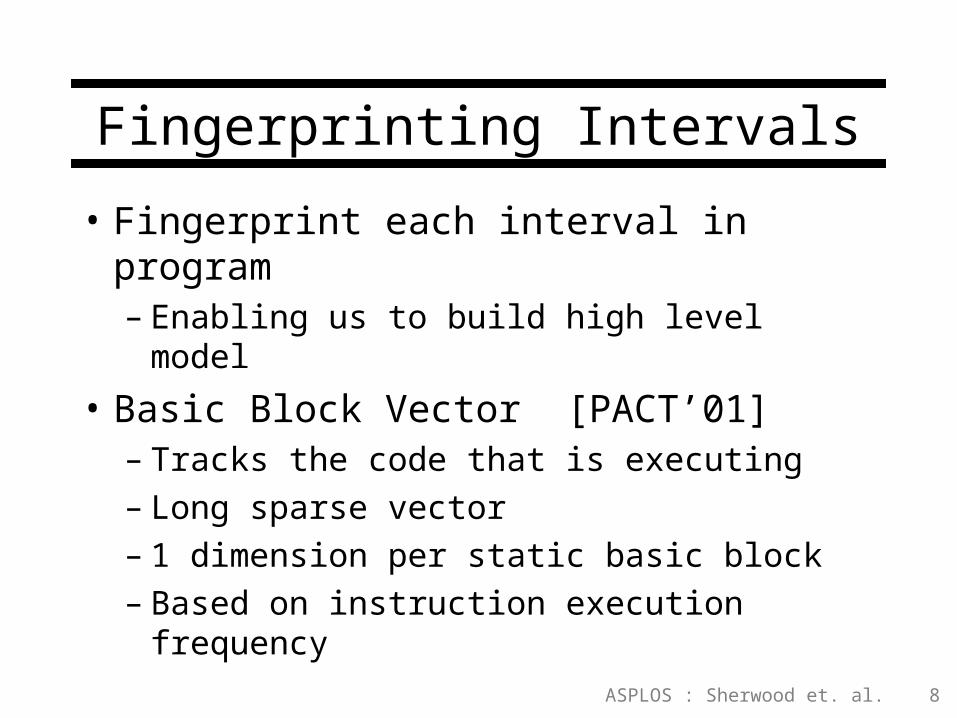
Fingerprinting Intervals
• Fingerprint each interval in program– Enabling us to build high level model
• Basic Block Vector [PACT’01]– Tracks the code that is executing– Long sparse vector– 1 dimension per static basic block– Based on instruction execution frequency
ASPLOS : Sherwood et. al. 9
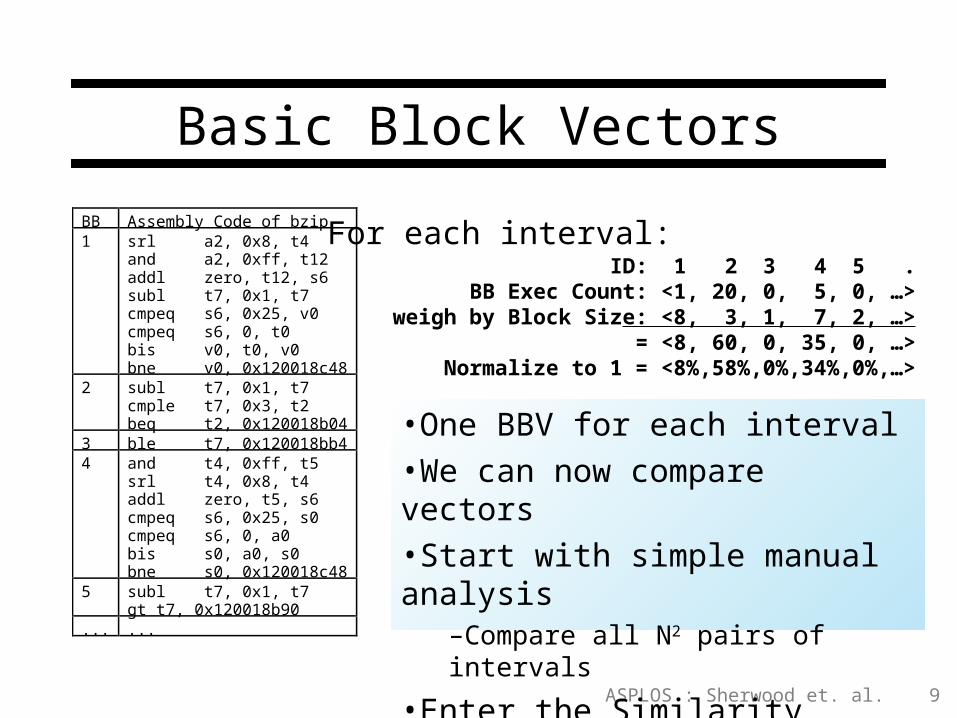
Basic Block Vectors
BB Assembly Code of bzip 1 srl a2, 0x8, t4
and a2, 0xff, t12 addl zero, t12, s6 subl t7, 0x1, t7 cmpeq s6, 0x25, v0 cmpeq s6, 0, t0 bis v0, t0, v0 bne v0, 0x120018c48
2 subl t7, 0x1, t7 cmple t7, 0x3, t2 beq t2, 0x120018b04
3 ble t7, 0x120018bb4 4 and t4, 0xff, t5
srl t4, 0x8, t4 addl zero, t5, s6 cmpeq s6, 0x25, s0 cmpeq s6, 0, a0 bis s0, a0, s0 bne s0, 0x120018c48
5 subl t7, 0x1, t7 gt t7, 0x120018b90
... ...
ID: 1 2 3 4 5 .BB Exec Count: <1, 20, 0, 5, 0, …>
weigh by Block Size: <8, 3, 1, 7, 2, …>= <8, 60, 0, 35, 0, …>
Normalize to 1 = <8%,58%,0%,34%,0%,…>
For each interval:
•One BBV for each interval•We can now compare vectors•Start with simple manual analysis
–Compare all N2 pairs of intervals
•Enter the Similarity Matrix…
ASPLOS : Sherwood et. al. 10
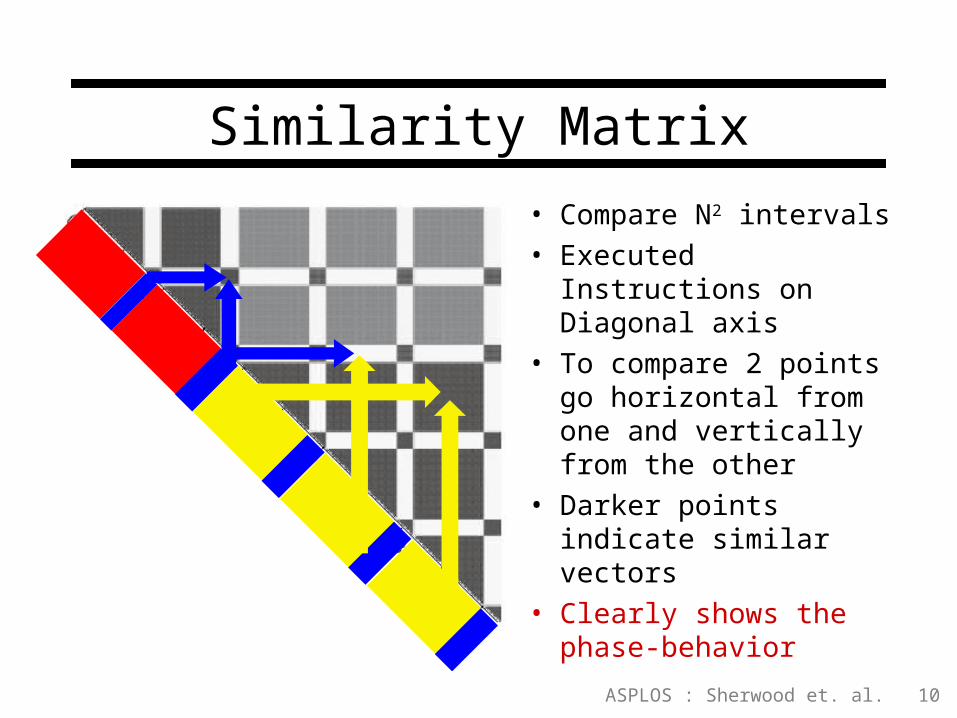
Similarity Matrix
• Compare N2 intervals• Executed Instructions
on Diagonal axis• To compare 2 points go
horizontal from one and vertically from the other
• Darker points indicate similar vectors
• Clearly shows the phase-behavior
ASPLOS : Sherwood et. al. 11
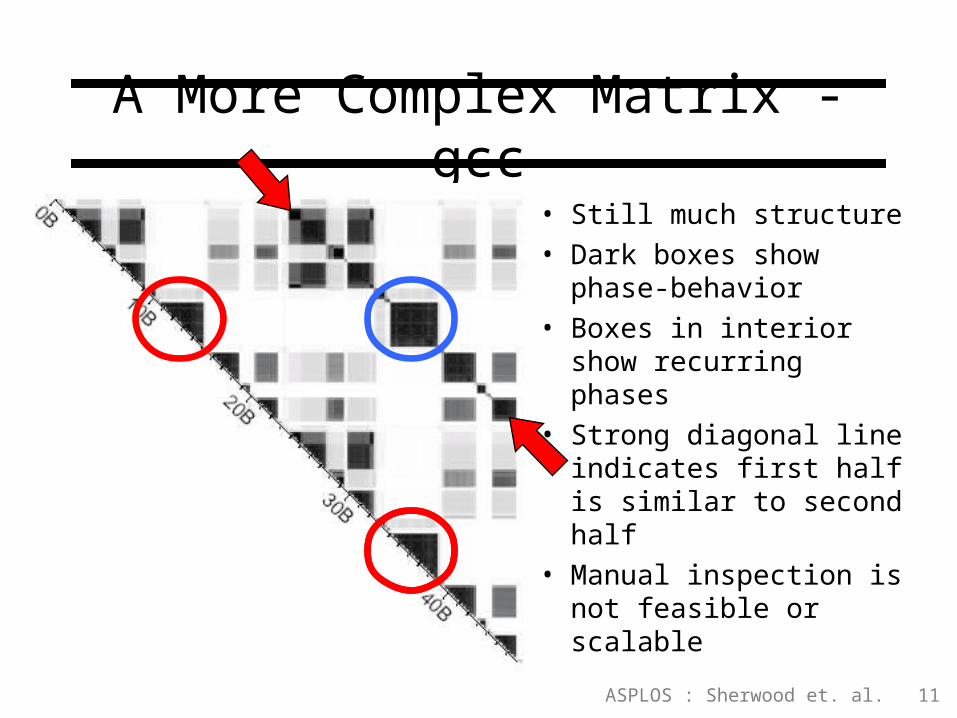
A More Complex Matrix - gcc
• Still much structure• Dark boxes show
phase-behavior• Boxes in interior show
recurring phases• Strong diagonal line
indicates first half is similar to second half
• Manual inspection is not feasible or scalable
ASPLOS : Sherwood et. al. 12
Outline
• Examining the Programs
• Finding Phases Automatically
• Application to Efficient Simulation
• Conclusions
ASPLOS : Sherwood et. al. 13
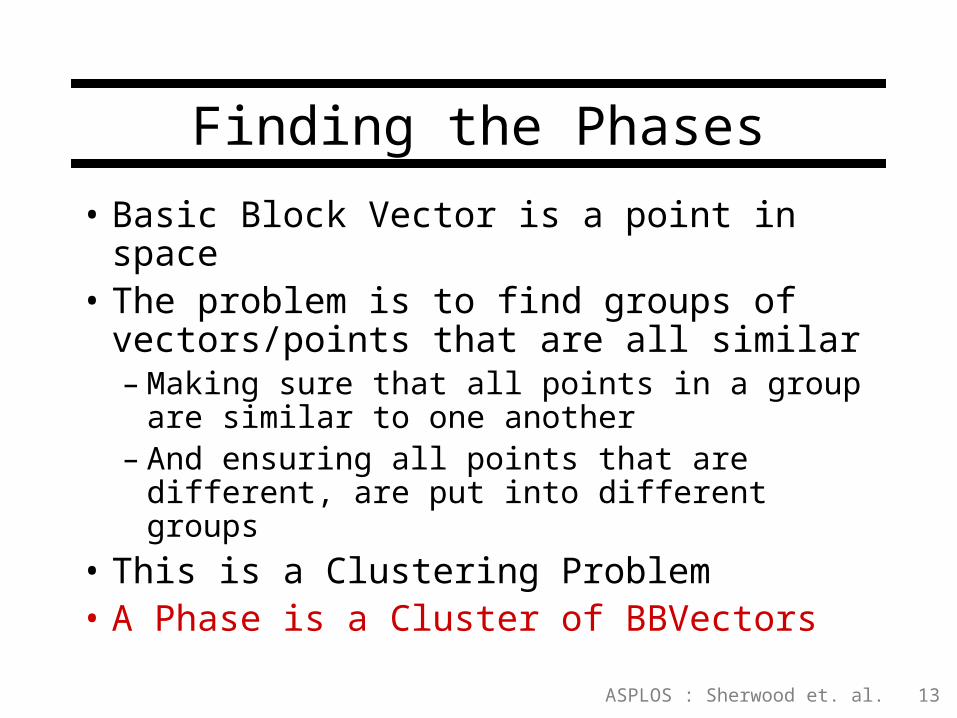
Finding the Phases
• Basic Block Vector is a point in space• The problem is to find groups of
vectors/points that are all similar– Making sure that all points in a group are
similar to one another– And ensuring all points that are different,
are put into different groups
• This is a Clustering Problem• A Phase is a Cluster of BBVectors
ASPLOS : Sherwood et. al. 14
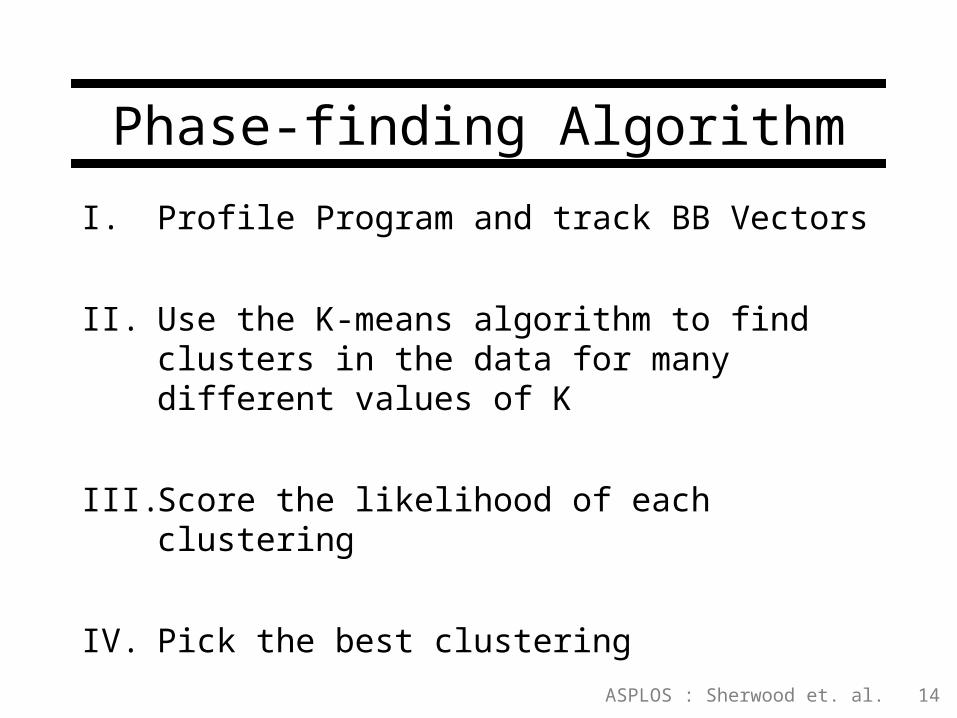
Phase-finding Algorithm
I. Profile Program and track BB Vectors
II. Use the K-means algorithm to find clusters in the data for many different values of K
III. Score the likelihood of each clustering
IV. Pick the best clustering
ASPLOS : Sherwood et. al. 15
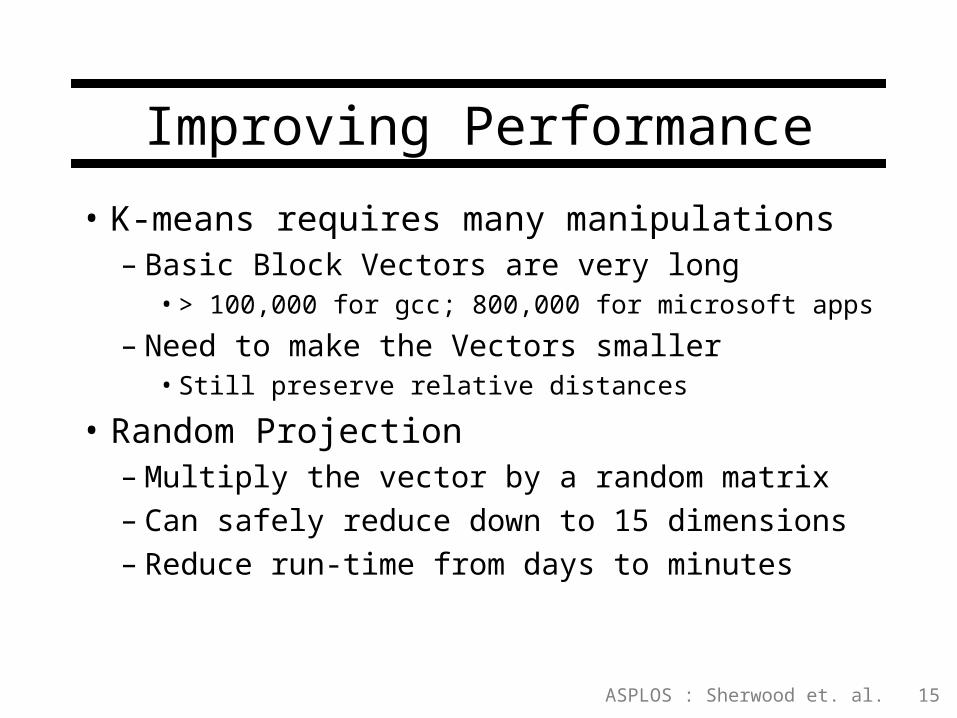
Improving Performance
• K-means requires many manipulations – Basic Block Vectors are very long
• > 100,000 for gcc; 800,000 for microsoft apps
– Need to make the Vectors smaller• Still preserve relative distances
• Random Projection– Multiply the vector by a random matrix– Can safely reduce down to 15 dimensions– Reduce run-time from days to minutes
ASPLOS : Sherwood et. al. 16
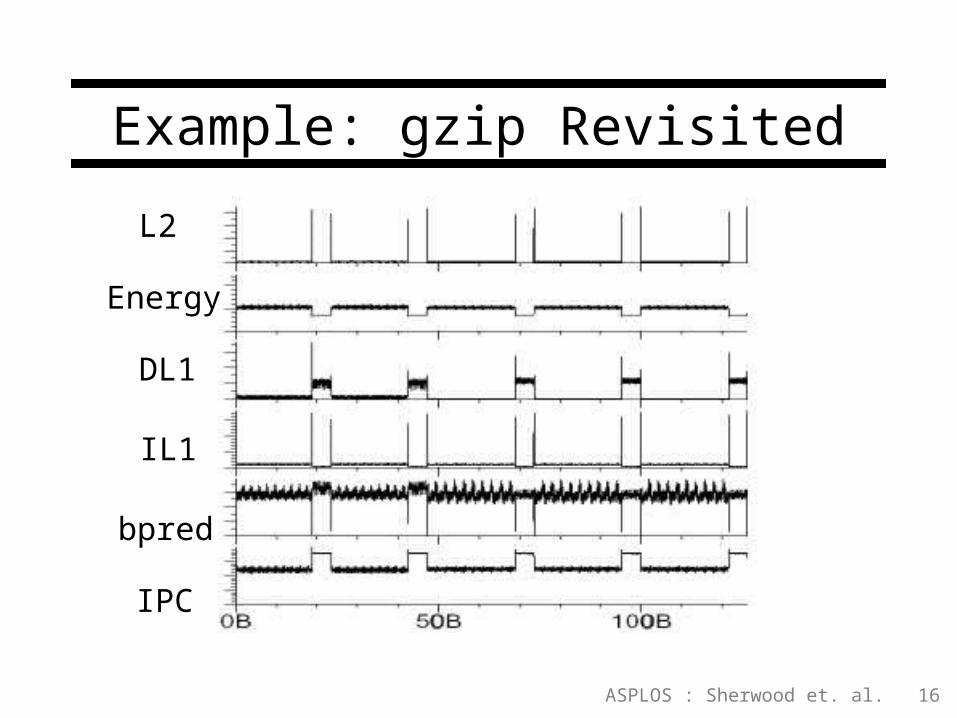
Example: gzip Revisited
IPC
Energy
DL1
IL1
L2
bpred
ASPLOS : Sherwood et. al. 17
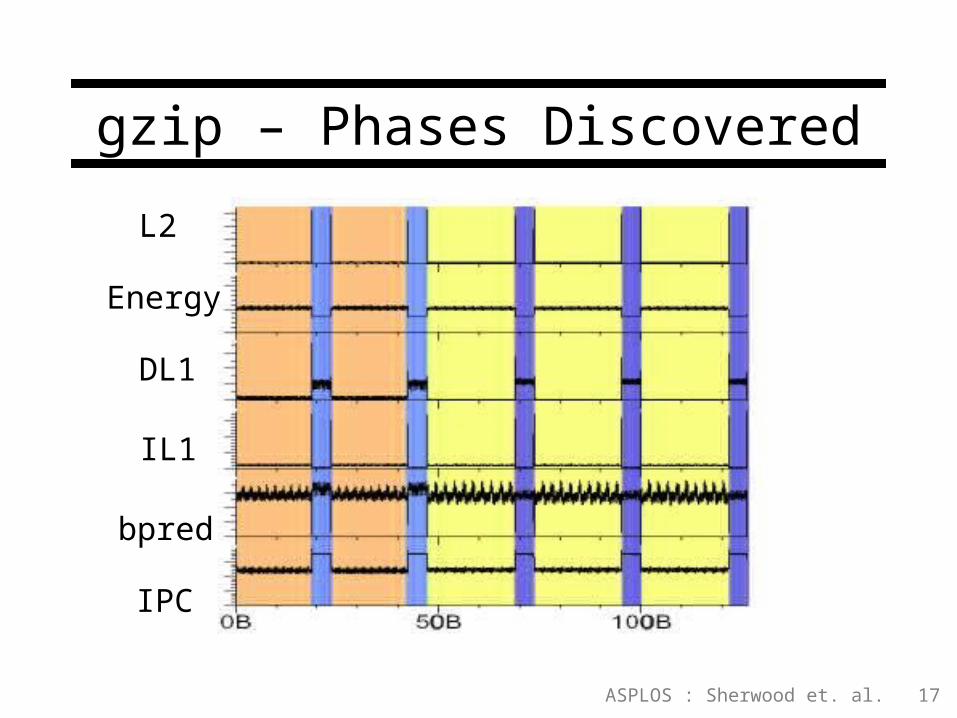
gzip – Phases Discovered
IPC
Energy
DL1
IL1
L2
bpred
ASPLOS : Sherwood et. al. 18
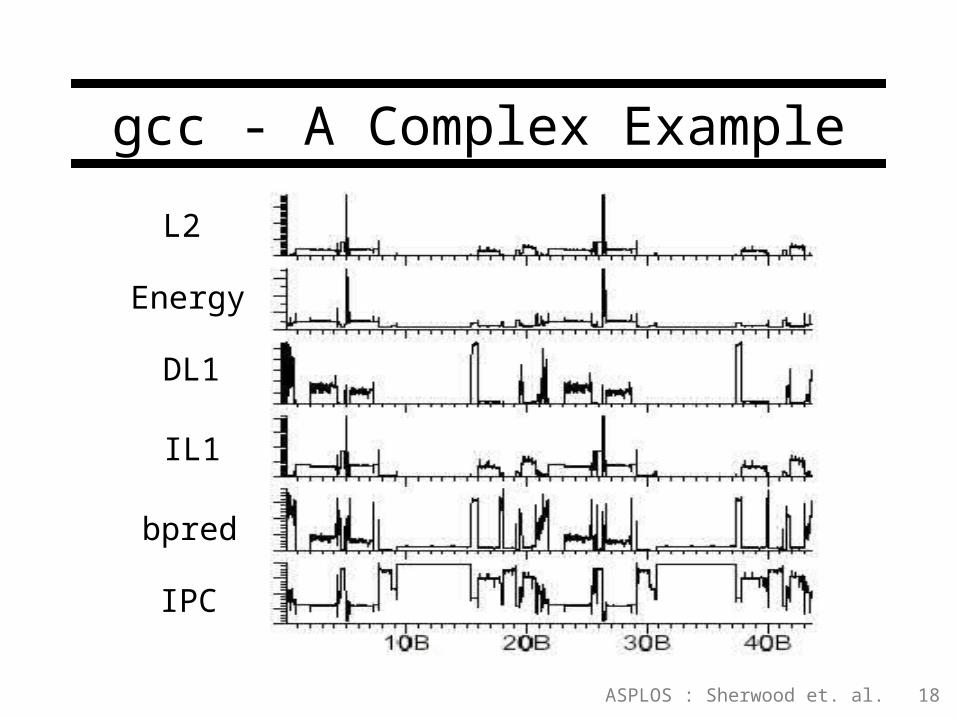
gcc - A Complex Example
IPC
Energy
DL1
IL1
L2
bpred
ASPLOS : Sherwood et. al. 19
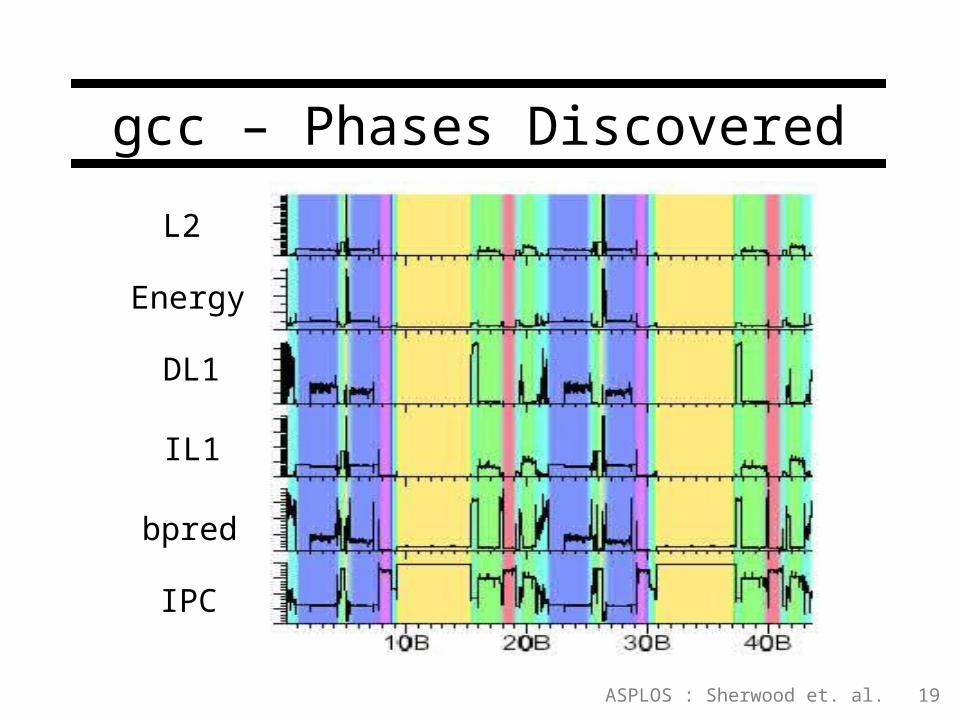
gcc – Phases Discovered
IPC
Energy
DL1
IL1
L2
bpred
ASPLOS : Sherwood et. al. 20
Outline
• Examining the Programs
• Finding Phases Automatically
• Application to Efficient Simulation
• Conclusions
ASPLOS : Sherwood et. al. 21
Efficient Simulation
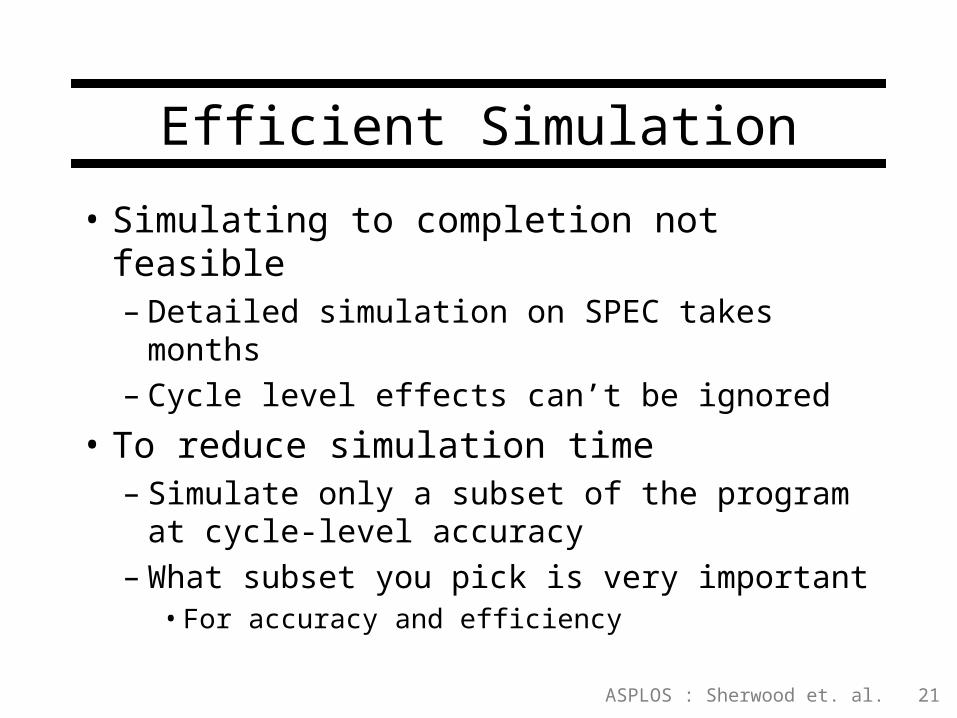
• Simulating to completion not feasible– Detailed simulation on SPEC takes months– Cycle level effects can’t be ignored
• To reduce simulation time– Simulate only a subset of the program at
cycle-level accuracy– What subset you pick is very important
• For accuracy and efficiency
ASPLOS : Sherwood et. al. 22
Simulation Options
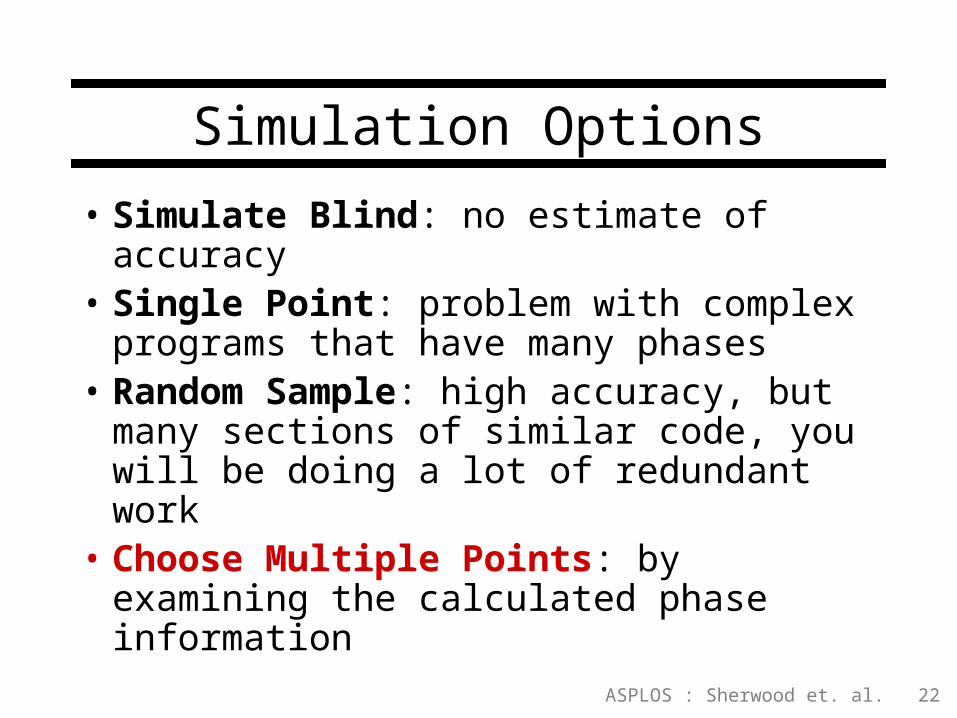
• Simulate Blind: no estimate of accuracy
• Single Point: problem with complex programs that have many phases
• Random Sample: high accuracy, but many sections of similar code, you will be doing a lot of redundant work
• Choose Multiple Points: by examining the calculated phase information
ASPLOS : Sherwood et. al. 23
Multiple SimPoints
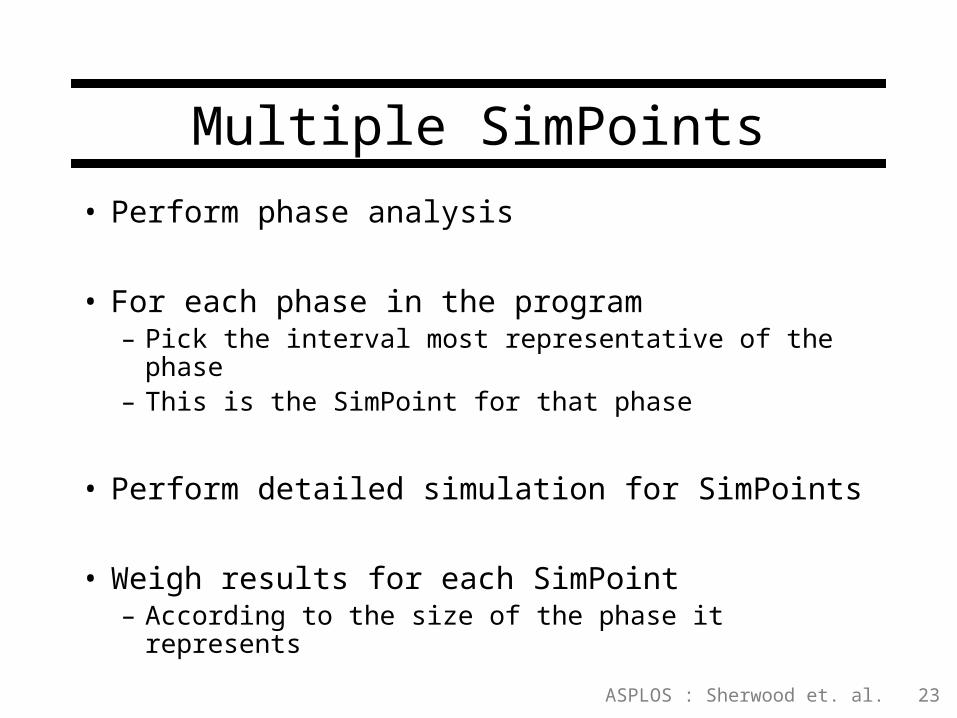
• Perform phase analysis
• For each phase in the program– Pick the interval most representative of the phase– This is the SimPoint for that phase
• Perform detailed simulation for SimPoints
• Weigh results for each SimPoint– According to the size of the phase it represents
ASPLOS : Sherwood et. al. 24
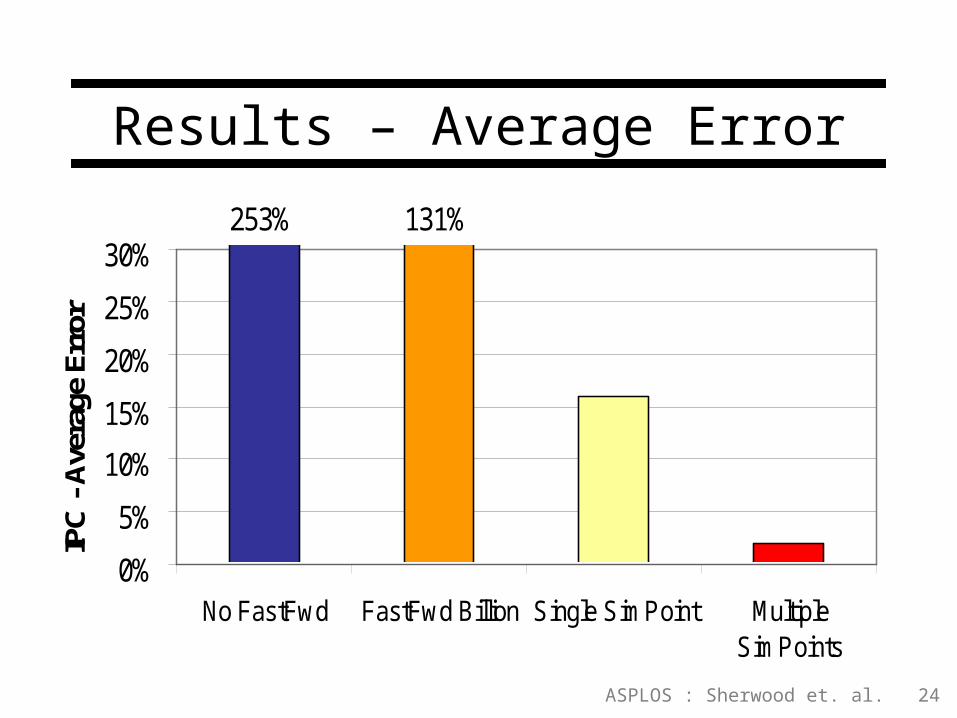
Results – Average Error
253% 131%
0%
5%
10%
15%
20%
25%
30%
No FastFwd FastFwd Billion Single SimPoint MultipleSimPoints
IPC
- A
vera
ge E
rror
ASPLOS : Sherwood et. al. 25
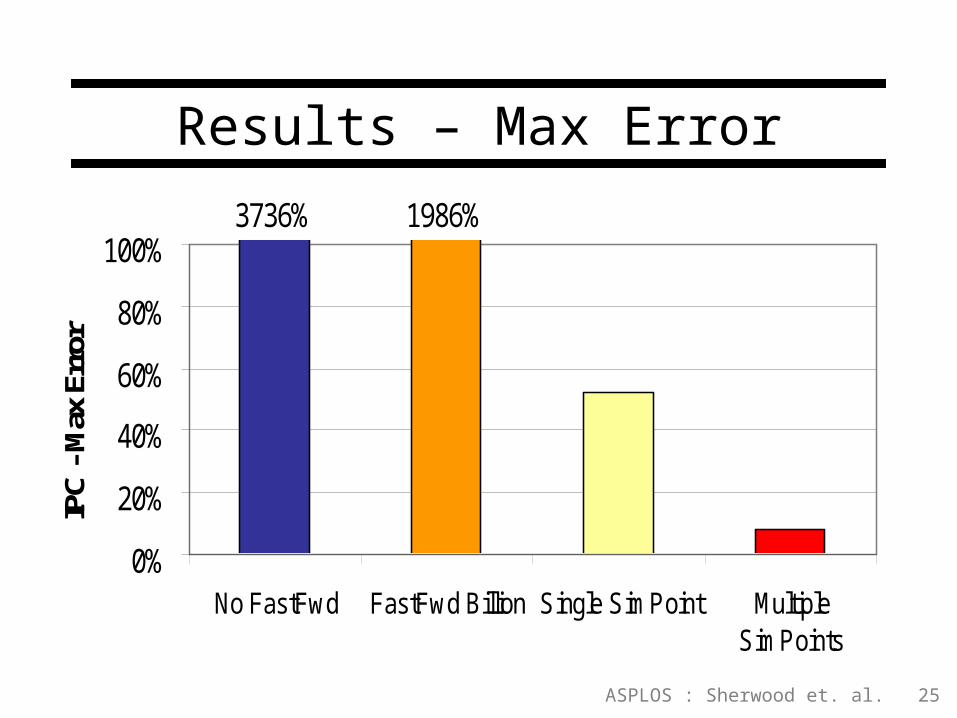
Results – Max Error3736% 1986%
0%
20%
40%
60%
80%
100%
No FastFwd FastFwd Billion Single SimPoint MultipleSimPoints
IPC
- M
ax E
rror
ASPLOS : Sherwood et. al. 26
Outline
• Examining the Programs
• Finding Phases Automatically
• Application to Efficient Simulation
• Conclusions
ASPLOS : Sherwood et. al. 27
Conclusions
• Gap between– Cycle level events– Full program effects
• Exploit large scale structure– Provide high level model– Find the model with no detail simulation– In conjunction with limited detail simulation
ASPLOS : Sherwood et. al. 28
Conclusions
• Our Strategy– Take advantage of structure found in program– Summarize the structure in the form of phases– Find phases using techniques from clustering
• Use this for doing efficient simulation– High accuracy– With orders of magnitude less time
• http://www.cs.ucsd.edu/~sherwood

ASPLOS : Sherwood et. al. 29


![Mikhail Perelman: Facts without Comments - ESTS Perelman[1].pdf · Mikhail Perelman 29 March 2013 was a day of real mourning for all Russian thoracic surgeons – our Teacher, our](https://img.pdfslide.us/doc/110x75/5c0fa2df09d3f241318b9c9b/mikhail-perelman-facts-without-comments-perelman1pdf-mikhail-perelman.jpg)