Embed Size (px)
Citation preview
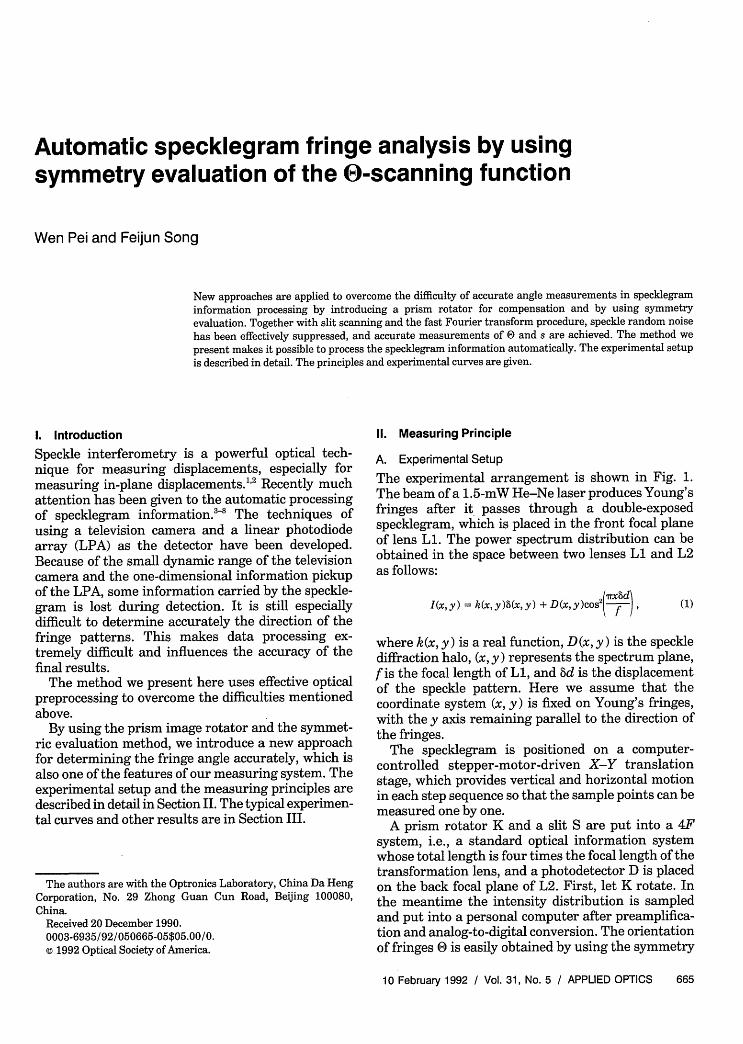
Automatic specklegram fringe analysis by usingsymmetry evaluation of the 0-scanning function
Wen Pei and Feijun Song
New approaches are applied to overcome the difficulty of accurate angle measurements in specklegraminformation processing by introducing a prism rotator for compensation and by using symmetryevaluation. Together with slit scanning and the fast Fourier transform procedure, speckle random noisehas been effectively suppressed, and accurate measurements of E0 and s are achieved. The method wepresent makes it possible to process the specklegram information automatically. The experimental setupis described in detail. The principles and experimental curves are given.
1. Introduction
Speckle interferometry is a powerful optical tech-nique for measuring displacements, especially formeasuring in-plane displacements."2 Recently muchattention has been given to the automatic processingof specklegram information. 8 The techniques ofusing a television camera and a linear photodiodearray (LPA) as the detector have been developed.Because of the small dynamic range of the televisioncamera and the one-dimensional information pickupof the LPA, some information carried by the speckle-gram is lost during detection. It is still especiallydifficult to determine accurately the direction of thefringe patterns. This makes data processing ex-tremely difficult and influences the accuracy of thefinal results.
The method we present here uses effective opticalpreprocessing to overcome the difficulties mentionedabove.
By using the prism image rotator and the symmet-ric evaluation method, we introduce a new approachfor determining the fringe angle accurately, which isalso one of the features of our measuring system. Theexperimental setup and the measuring principles aredescribed in detail in Section II. The typical experimen-tal curves and other results are in Section III.
The authors are with the Optronics Laboratory, China Da HengCorporation, No. 29 Zhong Guan Cun Road, Beijing 100080,China.
Received 20 December 1990.0003-6935/92/050665-05$05.00/0.© 1992 Optical Society of America.
11. Measuring Principle
A. Experimental Setup
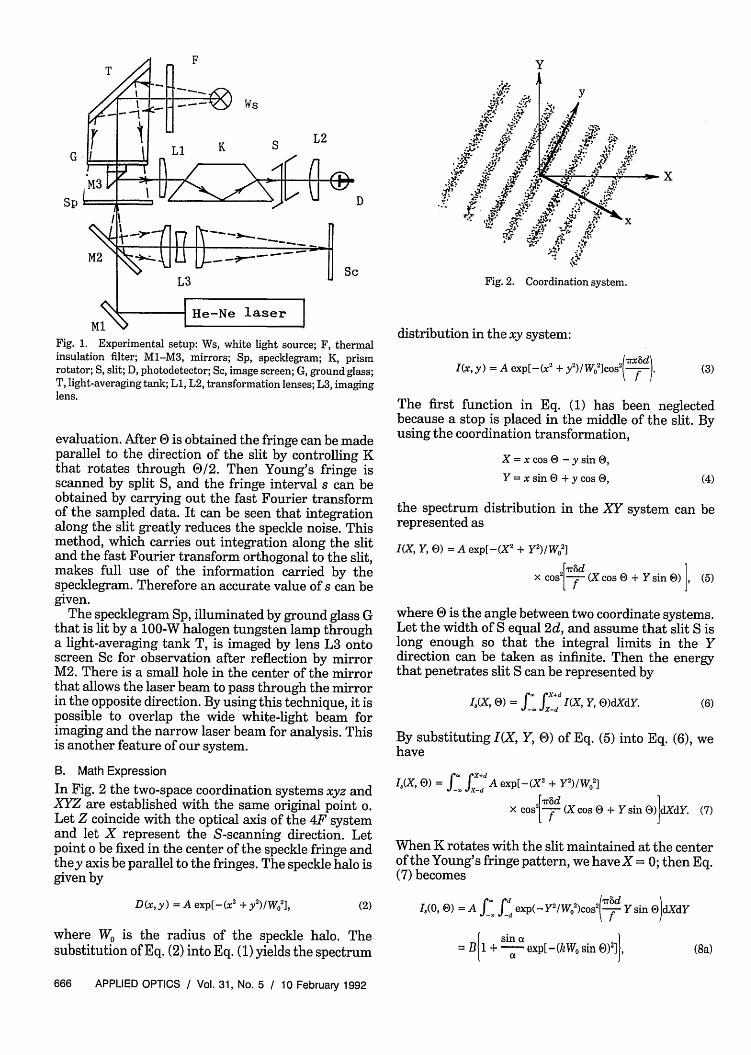
The experimental arrangement is shown in Fig. 1.The beam of a 1.5-mW He-Ne laser produces Young'sfringes after it passes through a double-exposedspecklegram, which is placed in the front focal planeof lens L1. The power spectrum distribution can beobtained in the space between two lenses Li and L2as follows:
I(x, y) = k(x, y)8(x, y) + D(x, y)cos2( f), (1)
where k(x, y) is a real function, D(x, y) is the specklediffraction halo, (x, y) represents the spectrum plane,f is the focal length of L1, and Ad is the displacementof the speckle pattern. Here we assume that thecoordinate system (x, y) is fixed on Young's fringes,with the y axis remaining parallel to the direction ofthe fringes.
The specklegram is positioned on a computer-controlled stepper-motor-driven X-Y translationstage, which provides vertical and horizontal motionin each step sequence so that the sample points can bemeasured one by one.
A prism rotator K and a slit S are put into a 4Fsystem, i.e., a standard optical information systemwhose total length is four times the focal length of thetransformation lens, and a photodetector D is placedon the back focal plane of L2. First, let K rotate. Inthe meantime the intensity distribution is sampledand put into a personal computer after preamplifica-tion and analog-to-digital conversion. The orientationof fringes 0 is easily obtained by using the symmetry
10 February 1992 / Vol. 31, No. 5 / APPLIED OPTICS 665
y
D
Fig. 2. Coordination system.
Fig. 1. Experimental setup: Ws, white light source; F, thermalinsulation filter; M1-M3, mirrors; Sp, specklegram; K, prismrotator; S, slit; D, photodetector; Sc, image screen; G, ground glass;T, light-averaging tank; L1, L2, transformation lenses; L3, imaginglens.
evaluation. After 0 is obtained the fringe can be madeparallel to the direction of the slit by controlling Kthat rotates through 0/2. Then Young's fringe isscanned by split S, and the fringe interval s can beobtained by carrying out the fast Fourier transformof the sampled data. It can be seen that integrationalong the slit greatly reduces the speckle noise. Thismethod, which carries out integration along the slitand the fast Fourier transform orthogonal to the slit,makes full use of the information carried by thespecklegram. Therefore an accurate value of s can begiven.
The specklegram Sp, illuminated by ground glass Gthat is lit by a 100-W halogen tungsten lamp througha light-averaging tank T, is imaged by lens L3 ontoscreen Sc for observation after reflection by mirrorM2. There is a small hole in the center of the mirrorthat allows the laser beam to pass through the mirrorin the opposite direction. By using this technique, it ispossible to overlap the wide white-light beam forimaging and the narrow laser beam for analysis. Thisis another feature of our system.
B. Math Expression
In Fig. 2 the two-space coordination systems xyz andXYZ are established with the same original point o.Let Z coincide with the optical axis of the 4F systemand let X represent the S-scanning direction. Letpoint o be fixed in the center of the speckle fringe andthey axis be parallel to the fringes. The speckle halo isgiven by
D(x,y) = A exp[-(x' + y')1W021, (2)
where W is the radius of the speckle halo. Thesubstitution of Eq. (2) into Eq. (1) yields the spectrum
distribution in the xy system:
I(x, y) = A exp[-(x' + y2)IW2]cos2( ). (3)
The first function in Eq. (1) has been neglectedbecause a stop is placed in the middle of the slit. Byusing the coordination transformation,
X=xcos( -ysinO,Y = x sin + y cos 0, (4)
the spectrum distribution in the XY system can berepresented as
I(X, Y, 0) = A exp[-(X' + Y')IW,']
X cos2[f (X cos E) + Ysin 0) ], (5)
where 0 is the angle between two coordinate systems.Let the width of S equal 2d, and assume that slit S islong enough so that the integral limits in the Ydirection can be taken as infinite. Then the energythat penetrates slit S can be represented by
0 J X , Ys,(x, E) =f J x d I(X, Y. ))dXdY. (6)
By substituting I(X, Y, 0) of Eq. (5) into Eq. (6), wehave
IsX , = fr JI A exp -WX + Y')/W0 ]
X cos2 1f (X Cos 0 + Y sin )JdXdY. (7)
When K rotates with the slit maintained at the centerof the Young's fringe pattern, we have X = 0; then Eq.(7) becomes
I,(0, 0) = A f fd exp(-Y'/W02)cos2 ( Ysin )dXdY
sin pB 1 + aexp [- (k Wo Sill E)2 I, (8a)
666 APPLIED OPTICS / Vol. 31, No. 5 / 10 February 1992
G
Sp
x
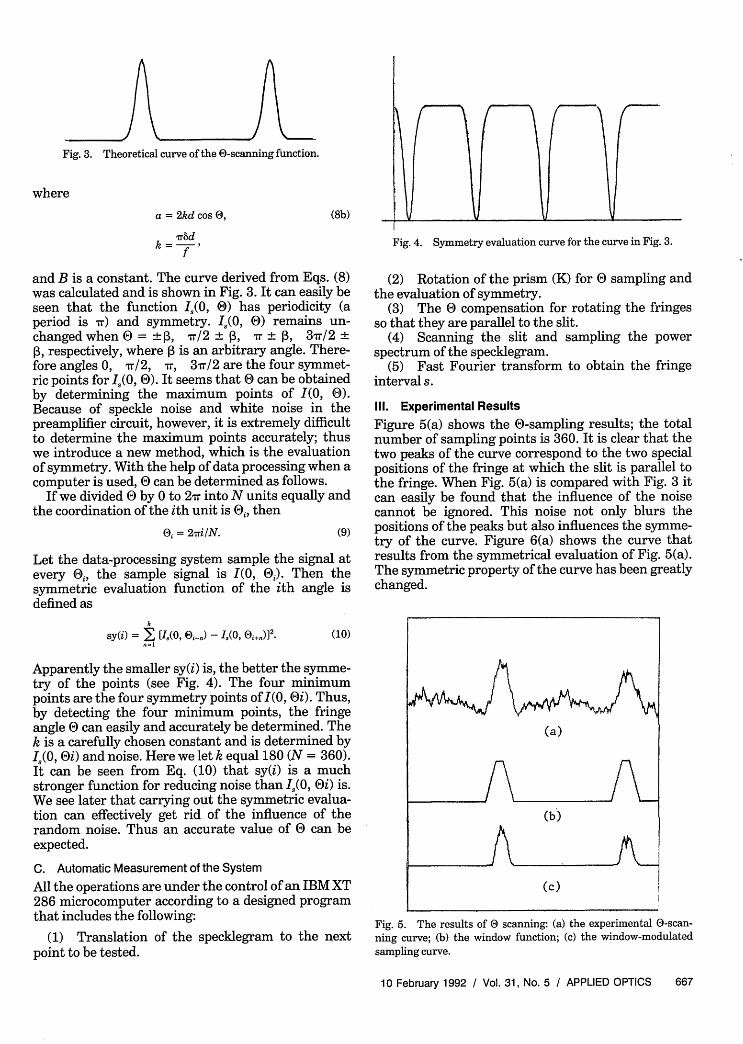
Fig. 3. Theoretical curve of the 0-scanning function.
where
a = 2kd cos 0,
7r~dk = -,
and B is a constant. The curve derived from Eqs. (8)was calculated and is shown in Fig. 3. It can easily beseen that the function I(0, ) has periodicity (aperiod is r) and symmetry. IO, 0) remains un-changed when = 13, Tr/2 1 3, Tr , 3r/2 13, respectively, where id is an arbitrary angle. There-fore angles 0, rr/2, Tr, 32 are the four symmet-ric points for IJ(O, 0). It seems that 0 can be obtainedby determining the maximum points of (0, 0).Because of speckle noise and white noise in thepreamplifier circuit, however, it is extremely difficultto determine the maximum points accurately; thuswe introduce a new method, which is the evaluationof symmetry. With the help of data processing when acomputer is used, 0 can be determined as follows.
If we divided 0 by 0 to 27r into N units equally andthe coordination of the ith unit is 0i, then
Oi = 2,milN. (9)
Let the data-processing system sample the signal atevery 0i, the sample signal is I(0, 0j). Then thesymmetric evaluation function of the ith angle isdefined as
k
sy(i) = I [I.(0, E)i-.) - I4(0, +]2.n-l
Apparently the smaller sy(i) is, the better the symme-try of the points (see Fig. 4). The four minimumpoints are the four symmetry points of I(0, 0i). Thus,by detecting the four minimum points, the fringeangle 0 can easily and accurately be determined. Thek is a carefully chosen constant and is determined byI,(0, i) and noise. Here we let k equal 180 (N = 360).It can be seen from Eq. (10) that sy(i) is a muchstronger function for reducing noise than IJ(O, 0i) is.We see later that carrying out the symmetric evalua-tion can effectively get rid of the influence of therandom noise. Thus an accurate value of 0 can beexpected.
C. Automatic Measurement of the System
All the operations are under the control of an IBM XT286 microcomputer according to a designed programthat includes the following:
(1) Translation of the specklegram to the nextpoint to be tested.
(8b)
Fig. 4. Symmetry evaluation curve for the curve in Fig. 3.
(2) Rotation of the prism (K) for e sampling andthe evaluation of symmetry.
(3) The 0) compensation for rotating the fringesso that they are parallel to the slit.
(4) Scanning the slit and sampling the powerspectrum of the specklegram.
(5) Fast Fourier transform to obtain the fringeintervals.
III. Experimental Results
Figure 5(a) shows the 0-sampling results; the totalnumber of sampling points is 360. It is clear that thetwo peaks of the curve correspond to the two specialpositions of the fringe at which the slit is parallel tothe fringe. When Fig. 5(a) is compared with Fig. 3 itcan easily be found that the influence of the noisecannot be ignored. This noise not only blurs thepositions of the peaks but also influences the symme-try of the curve. Figure 6(a) shows the curve thatresults from the symmetrical evaluation of Fig. 5(a).The symmetric property of the curve has been greatlychanged.
Fig. 5. The results of ) scanning: (a) the experimental 0-scan-ning curve; (b) the window function; (c) the window-modulated
(10)
sampling curve.
10 February 1992 / Vol. 31, No. 5 / APPLIED OPTICS 667
@
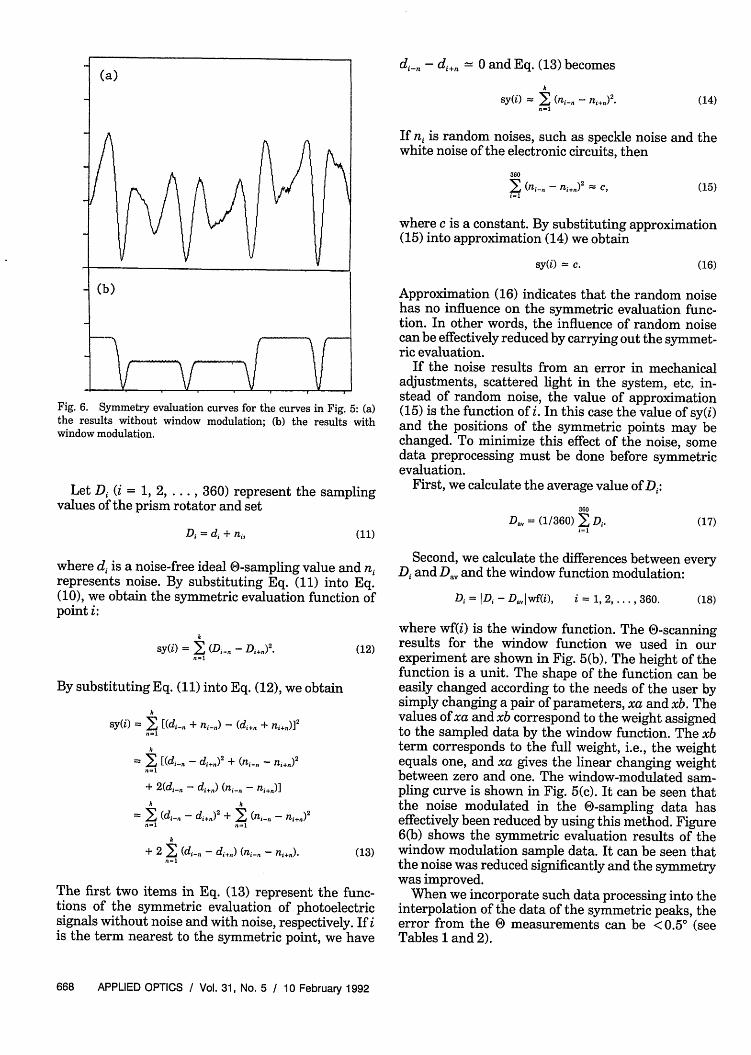
Fig. 6. Symmetry evaluation curves for the curves in Fig. 5: (a)the results without window modulation; (b) the results withwindow modulation.
Let Di (i = 1, 2, ... , 360) represent the samplingvalues of the prism rotator and set
Di,= di+ ni, (11)
di_ - di,, = 0 and Eq. (13) becomes
k
sy(i) = (_ - ni+n)2.n-i
(14)
If ni is random noises, such as speckle noise and thewhite noise of the electronic circuits, then
360
E (ni-n - ni+n)' = C,i=l
(15)
where c is a constant. By substituting approximation(15) into approximation (14) we obtain
sy(i) = c. (16)
Approximation (16) indicates that the random noisehas no influence on the symmetric evaluation func-tion. In other words, the influence of random noisecan be effectively reduced by carrying out the symmet-ric evaluation.
If the noise results from an error in mechanicaladjustments, scattered light in the system, etc. in-stead of random noise, the value of approximation(15) is the function of i. In this case the value of sy(i)and the positions of the symmetric points may bechanged. To minimize this effect of the noise, somedata preprocessing must be done before symmetricevaluation.
First, we calculate the average value of Di:
360
Da. = (1/360) Y Di.i=l
(17)
where di is a noise-free ideal 0-sampling value and nirepresents noise. By substituting Eq. (11) into Eq.(10), we obtain the symmetric evaluation function ofpoint i:
k
sy(i) = I (Di_ - Di+n)'. (12)n-1
By substituting Eq. (11) into Eq. (12), we obtain
k
sy(i) = T [(di + i-n) - (di+n + n+n)]'n-1
= 2 [(di -di+n)2 + (n_-n .)2
+ 2(din C di+n) (ni-n - ni+n)]
O k
= E (di -n di+n)2 + z (ni-n- ni+n)2n-i n-i
+ 2 k (din - di+n) (ni-n- +n). (13)n=1
The first two items in Eq. (13) represent the func-tions of the symmetric evaluation of photoelectricsignals without noise and with noise, respectively. If iis the term nearest to the symmetric point, we have
Second, we calculate the differences between everyDi and Dav and the window function modulation:
Di = IDi - DanIwf(i), i = 1, 2,..., 360. (18)
where wf(i) is the window function. The -scanningresults for the window function we used in ourexperiment are shown in Fig. 5(b). The height of thefunction is a unit. The shape of the function can beeasily changed according to the needs of the user bysimply changing a pair of parameters, xa and xb. Thevalues of xa and xb correspond to the weight assignedto the sampled data by the window function. The xbterm corresponds to the full weight, i.e., the weightequals one, and xa gives the linear changing weightbetween zero and one. The window-modulated sam-pling curve is shown in Fig. 5(c). It can be seen thatthe noise modulated in the 0-sampling data haseffectively been reduced by using this method. Figure6(b) shows the symmetric evaluation results of thewindow modulation sample data. It can be seen thatthe noise was reduced significantly and the symmetrywas improved.
When we incorporate such data processing into theinterpolation of the data of the symmetric peaks, theerror from the measurements can be <0.5° (seeTables 1 and 2).
668 APPLIED OPTICS / Vol. 31, No. 5 / 10 February 1992
(a)
(b)
=X
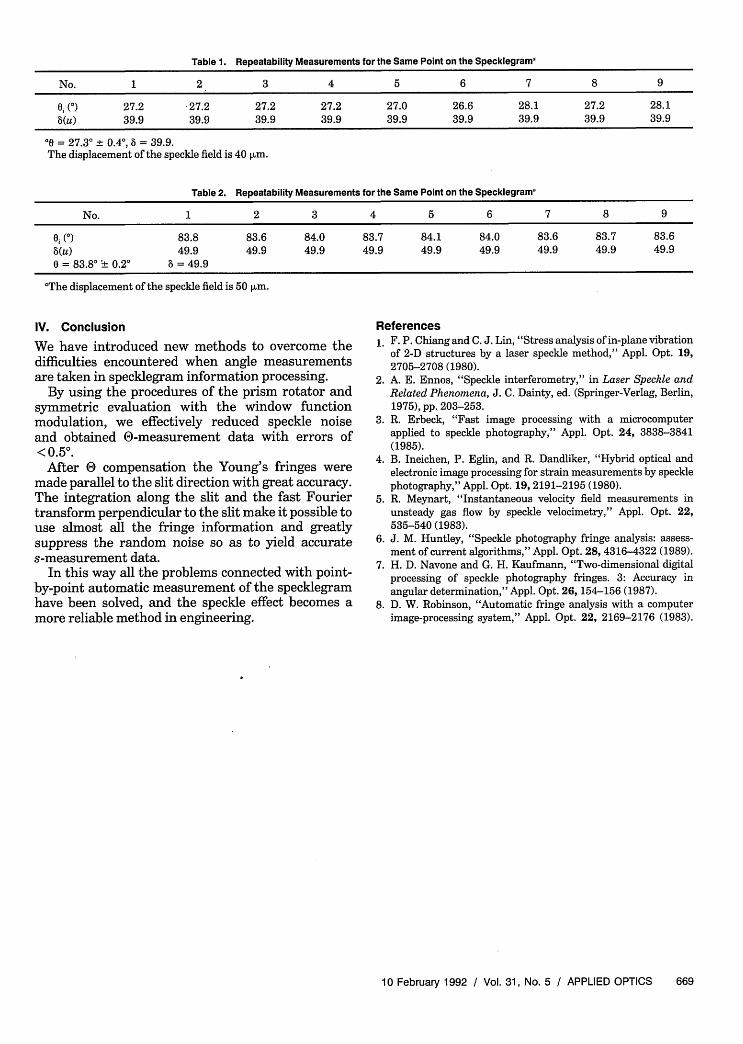
Table 1. Repeatability Measurements for the Same Point on the SpecklegramI
No. 1 2 3 4 5 6 7 8 9
9i () 27.2 27.2 27.2 27.2 27.0 26.6 28.1 27.2 28.18(u) 39.9 39.9 39.9 39.9 39.9 39.9 39.9 39.9 39.9
0s = 27.30 ± 0.40, 8 = 39.9.The displacement of the speckle field is 40 pLm.
Table 2. Repeatability Measurements for the Same Point on the SpecklegramI
No. 1 2 3 4 5 6 7 8 9
O () 83.8 83.6 84.0 83.7 84.1 84.0 83.6 83.7 83.68(u) 49.9 49.9 49.9 49.9 49.9 49.9 49.9 49.9 49.9
= 83.8° + 0.2° = 49.9
aThe displacement of the speckle field is 50 rim.
IV. Conclusion
We have introduced new methods to overcome thedifficulties encountered when angle measurementsare taken in specklegram information processing.
By using the procedures of the prism rotator andsymmetric evaluation with the window functionmodulation, we effectively reduced speckle noiseand obtained 0-measurement data with errors of< .50.
After 0 compensation the Young's fringes weremade parallel to the slit direction with great accuracy.The integration along the slit and the fast Fouriertransform perpendicular to the slit make it possible touse almost all the fringe information and greatlysuppress the random noise so as to yield accurates-measurement data.
In this way all the problems connected with point-by-point automatic measurement of the specklegramhave been solved, and the speckle effect becomes amore reliable method in engineering.
References1. F. P. Chiang and C. J. Lin, "Stress analysis of in-plane vibration
of 2-D structures by a laser speckle method," Appl. Opt. 19,2705-2708 (1980).
2. A. E. Ennos, "Speckle interferometry," in Laser Speckle andRelated Phenomena, J. C. Dainty, ed. (Springer-Verlag, Berlin,1975), pp. 203-253.
3. R. Erbeck, "Fast image processing with a microcomputerapplied to speckle photography," Appl. Opt. 24, 3838-3841(1985).
4. B. Ineichen, P. Eglin, and R. Dandliker, "Hybrid optical andelectronic image processing for strain measurements by specklephotography," Appl. Opt. 19, 2191-2195 (1980).
5. R. Meynart, "Instantaneous velocity field measurements inunsteady gas flow by speckle velocimetry," Appl. Opt. 22,535-540 (1983).
6. J. M. Huntley, "Speckle photography fringe analysis: assess-ment of current algorithms," Appl. Opt. 28, 4316-4322 (1989).
7. H. D. Navone and G. H. Kaufmann, "Two-dimensional digitalprocessing of speckle photography fringes. 3: Accuracy inangular determination," Appl. Opt. 26, 154-156 (1987).
8. D. W. Robinson, "Automatic fringe analysis with a computerimage-processing system," Appl. Opt. 22, 2169-2176 (1983).
10 February 1992 / Vol. 31, No. 5 / APPLIED OPTICS 669