Embed Size (px)
Citation preview

Original Research
Automatic Segmentation of White MatterHyperintensities in the Elderly UsingFLAIR Images at 3T
Erin Gibson, BS,1 Fuqiang Gao, MD,1 Sandra E. Black, MD,1,2
and Nancy J. Lobaugh, PhD1,2*
Purpose: To determine the precision and accuracy of anautomated method for segmenting white matter hyperin-tensities (WMH) on fast fluid-attenuated inversion-recov-ery (FLAIR) images in elderly brains at 3T.
Materials and Methods: FLAIR images from 18 individu-als (60–82 years, 9 females) with WMH burdens rangingfrom 1–80 cm3 were used. The protocol included the re-moval of clearly hyperintense voxels; two-class fuzzy C-means clustering (FCM); and thresholding to segmentprobable WMH. Two false-positive minimization (FPM)methods using white matter templates were tested. Preci-sion was assessed by adding synthetic hyperintense vox-els to brain slices. Accuracy was validated by comparingautomatic and manual segmentations. Whole-brain,voxel-wise metrics of similarity, under- and overestima-tion were used to evaluate both precision and accuracy.
Results: Precision was high, as the lowest accuracy in thesynthetic datasets was 93%. Both FPM strategies success-fully improved overall accuracy. Whole-brain accuracy forthe FCM segmentation alone ranged from 45%–81%, whichimproved to 75%–85% using the FPM strategies.
Conclusion: The method was accurate across the rangeof WMH burden typically seen in the elderly. Accuracylevels achieved or exceeded those of other approachesusing multispectral and/or more sophisticated patternrecognition methods.
Key Words: white matter hyperintensity; FLAIR; seg-mentationJ. Magn. Reson. Imaging 2010;31:1311–1322.VC 2010 Wiley-Liss, Inc.
WHITE MATTER HYPERINTENSITIES (WMH) on T2-weighted images are common in many central nervoussystem disorders, including cerebrovascular diseaseand dementia. WMH are typically seen as diffuse sig-nal increases in periventricular watershed regions,and as more focal ‘‘lesions’’ in deep white matter. His-tologically, WMHs have been associated with a varietyof pathological processes including edema, inflamma-tion, demyelination, axonal loss, and gliosis (1–3), allof which result in increased T2 relaxation times.Although WMHs are often present in elderly personswho exhibit normal cognition, impaired cognition inboth typical aging and dementia may be related toWMH burden (4,5). The possibility that WMHs haveconsequences for cognition in the elderly has moti-vated the development of segmentation methods tobetter assess this relationship.
Fast fluid-attenuated inversion-recovery (FLAIR)imaging offers advantages over conventional T2-weighted imaging for WMH detection because of theincreased contrast between WMH and other brain tis-sues arising from the nulling of signal from cerebro-spinal fluid (CSF). Several automated WMH detectionmethods have been proposed using FLAIR. Previousmethods have been designed and validated at 1.5Tusing patients with arterial vascular disease (6), mul-tiple sclerosis (7,8), Alzheimer’s disease (9), and el-derly patients (10–13). The majority of these WMHdetection methods are multispectral, incorporatingT2-weighted, and in some cases, proton density-weighted (PD), T1-weighted, and/or inversion recovery(IR) images together with the FLAIR image. Often, seg-mentation accuracy can be improved by increasingthe separation between the different tissue types byincorporating higher-dimensional feature spaces (6)or support-vector machine approaches (13). However,the high contrast between WMH and healthy tissueon FLAIR images allows for the possibility of segment-ing WMH using only FLAIR images. For example, Jacket al (9) developed a single-channel WMH segmenta-tion method that used the histogram of the FLAIRimage and a regression model to determine the appro-priate intensity threshold for WMH, and morerecently, Khayati et al (8) used a Bayesian classifier tosegment MS lesions on FLAIR images at 1.5T.
Additional supporting information may be found in the online versionof this article.1Cognitive Neurology, Sunnybrook Health Sciences Centre, Toronto,Ontario, Canada.2Division of Neurology, Faculty of Medicine, University of Toronto,Toronto, Ontario, Canada.
Contract grant sponsor: Canadian Institutes for Health Research (toN.J.L.).
*Address reprint requests to: N.J.L., 2075 Bayview Ave., Room A421,Sunnybrook Health Sciences Centre, Toronto, ON M4N 3M5, Canada.E-mail: [email protected]
Received December 5, 2008; Accepted October 6, 2009.
DOI 10.1002/jmri.22004Published online in Wiley InterScience (www.interscience.wiley.com).
JOURNAL OF MAGNETIC RESONANCE IMAGING 31:1311–1322 (2010)
VC 2010 Wiley-Liss, Inc. 1311
One of the main challenges in developing an auto-mated WMH segmentation using FLAIR is the minimi-zation of false-positive classifications. False positivesoccur because the signal intensity in WMHs typicallyoverlaps with that of normal tissue, even in the caseof high-dimensional, multispectral segmentations.Two different approaches are commonly used toaddress this challenge. In one, false positives areminimized by identifying seed voxels with very highsignal intensities on FLAIR or PD/T2-weighted ratioimages (11,14). Segmentation is accomplished byusing these seed voxels as input to a fuzzy-connectiv-ity algorithm, which assesses the degree of fuzzy affin-ity between spatially connected elements. Thisapproach successfully eliminates many false-positiveclassifications, especially those that occur at tissueinterfaces. Unfortunately, this approach is often asso-ciated with increased false-negative classifications,such that there is a tendency to miss small focalWMH, as well as voxels well within larger WMHs. Re-sidual false-positive classifications can also remain,particularly for artifacts resulting from CSF inflow(15). An alternative fuzzy-inference approach usesspatial priors from templates derived from segmentedT1-weighted images (10). The primary errors with thisapproach are that hyperintensities outside of probablewhite matter are not included. However, the advan-tage of this approach is that false negatives in whitematter are minimized.
The primary objectives of the present work were 1)to develop a robust automated method for segmentingWMH on FLAIR images at 3T, 2) to determine the pre-cision of the method using synthetic data, and 3) tovalidate the accuracy of the method by comparingautomatic and manual segmentations. A secondaryobjective was to determine the degree to which theautomated results could be improved with a smallamount of manual editing of the final segmentationresults.
MATERIALS AND METHODS
Subjects
Images from 18 elderly individuals (nine males andnine females) with previously diagnosed white matterdisease, and who were participating in research stud-ies at Sunnybrook Health Sciences Centre, wereincluded in this study. Participants were between theages of 60 and 82 years (mean ¼ 73.8, SD ¼ 8.0).Informed consent was obtained in accordance withthe Research Ethics Board.
Magnetic Resonance Imaging (MRI)
FLAIR images were acquired at 3T (General Electric,Milwaukee, WI, software v. 12.4 and 12.5) using aquadrature head coil. Images were oriented parallel tothe plane passing through the anterior and posteriorcommissure (2D T2FLAIR: TE ¼ 140 msec, TR ¼ 9300msec, TI ¼ 2200 msec, slice thickness ¼ 3 mmmatrix ¼ 256 � 192, field of view [FOV] ¼ 22 cm,phase FOV ¼ 0.75). Two additional datasets, acquired
in the same scanning session, were used for algorithmvalidation: a T1-weighted (3D, IR-prepped fast SPGR,TE � 3.1 msec, TI ¼ 300 msec, TR � 7 msec, flipangle ¼ 15�, slice thickness ¼ 1.4 mm, NEX ¼ 2); anda PD/T2-weighted sequence (dual-echo fast-spin echo,TEs ¼ 20, 103 msec, TR ¼ 2900 msec, echo-trainlength ¼ 12, slice thickness ¼ 3 mm, NEX ¼ 2).
Image Preprocessing
The WMH segmentation algorithm requires the re-moval of nonbrain tissues from the FLAIR image andthe correction of intensity inhomogeneities. These tworequirements can be achieved using any number offreely available software packages. We did not attemptto build these steps into the processing pipeline, espe-cially as the efficacy of signal intensity correctionsapplied during image reconstruction are platform-de-pendent. For our FLAIR data the preprocessingrequirements were achieved using N3 (16) (http://www.bic.mni.mcgill.ca/software/N3/; iterations ¼150, stop threshold ¼ 0.0001, distance ¼ 55 mm) andFSL’s bias correction procedures (17) (http://www.fmrib.ox.ac.uk/fsl/; ‘‘mfast’’ with default parameters)to correct intensity inhomogeneities, and FSL’s BrainExtraction Tool (18) to generate a ‘‘brain mask’’ toremove nonbrain tissues.
The tests of the algorithm’s precision required a seg-mented T1-weighted image (see below), so both man-ual and automatic WMH segmentations were per-formed on FLAIR images coregistered to the subject’sT1-weighted image. For the segmentation protocol out-lined below, the only required input was the masked,bias-corrected FLAIR image.
Automated WMH Segmentation
The WMH segmentation protocol is fully automaticand has four steps: 1) noise-reduction filtering, 2) re-moval of clearly hyperintense voxels, 3) two-classfuzzy C-means clustering (FCM), and 4) thresholdingto segment probable WMH. WMH segmentation is fol-lowed by an optional automatic false-positive minimi-zation (FPM) step. The procedure requires �2.5minutes on a Xeon E5440 processor with a clock-speed of 2.85 GHz. Full details are outlined in Fig. 1and are described below.
Filtering
An edge-preserving anisotropic diffusion filter (19)(five iterations, time step ¼ 0.0625, conduction ¼1.95) was applied to the bias-corrected, skull-strippedFLAIR image. Only minimal smoothing was performedusing the recommended time step and conductionparameters for 3D images (http://www.itk.org/ITKSoftwareGuide.pdf).
Removal of Unambiguously Hyperintense Voxels
This step was implemented to facilitate more accurateclassifications at higher WMH loads. The FCM algo-rithm, in its standard form, requires that the datasetscontain clusters that are roughly equivalent in size,
1312 Gibson et al.

which is the case for brain and background in mostslices. Since these compartments both greatly out-number hyperintense voxels, the two-class FCM gen-erally works well. In our preliminary studies, whenthe slice WMH load was large (>�6% of total brainslice volume), WMH volume was severely underesti-mated. It completely failed when the slice load wasvery large (ie, when WMH voxels outnumbered normalWM voxels). Removing unambiguously hyperintensevoxels prior to applying the two-class FCM algorithmmaintains the expected balance between brain, back-ground-CSF, and hyperintense voxels on all slices.
The filtered FLAIR image was intensity-normalizedto have a mean of zero and a variance of one. Exami-nation of the normalized images from two subjectsindicated that voxels with a normalized intensitygreater than 4.25 were obviously hyperintense,regardless of slice location. This threshold was fixed,and all voxels above this threshold were removedautomatically from the filtered FLAIR images, asshown in Fig. 2. To assess whether this manipulationreduced the size of the ‘‘hyperintensity’’ class to lessthan 6% of slice volume, the percent WMH load foreach slice was calculated using manually traced WMH(see below), before and after removal of clearly hyper-intense voxels.
Fuzzy Clustering
A two-class FCM algorithm was applied to the remain-ing voxels on a slice-by-slice basis. The FCM algo-rithm (20) is an unsupervised data clustering tech-nique to partition datasets into ‘‘C’’ different clusters.
Each data point is assigned a ‘‘fuzzy’’ membershipgrade that indicates the degree to which each datapoint belongs to each of the different clusters. It is asimple iterative procedure that works by minimizingan objective function representing the distance fromeach data point to the cluster means and weighted bythe data point’s membership grade. Voxels wereassigned a membership grade in each of two classes:brain and background-CSF (range, 0.0–1.0). The FCMclustering algorithm was applied twice to each voxel,in the axial and coronal planes, and the consensus ofthe two segmentations defined the final segmentation.This processing step increased the robustness of thefinal segmentation results by removing voxels
Figure 1. Flow diagram ofthe FLAIR FMH segmentationprotocol.
Figure 2. First-pass removal of voxels of obviously hyperin-tense voxels. A: Bias-corrected, skull stripped FLAIR image.B: Hyperintense voxels (signal intensity >4.25 on the inten-sity normalized FLAIR image) were removed from the originalFLAIR image before applying the FCM algorithm.
FLAIR Hyperintensity Segmentation 1313

incorrectly classified as hyperintense on slices withsmall numbers of voxels.
Identification of Hyperintensities
Hyperintense voxels are outliers in both classes andare assigned a membership grade greater than zero ineach (Fig. 3C). The first step in the segmentationapplies a threshold to the FCM results for the back-ground-CSF class. The FCM results for two datasetswith varying WMH load were used to define a mem-bership grade above which voxels were visually hyper-intense. The selected threshold was fixed and appliedto all test datasets. The FLAIR data were masked,retaining only voxels with membership grades abovethreshold (Fig. 3D).
This masking step did not directly segment WMH,but did clearly separate background/CSF and WMHvoxels based on FLAIR intensities (Fig. 3E). To obtainthe final segmentation, two histograms were com-puted (bin width ¼ 1 signal intensity unit). The firstused all values in the filtered FLAIR image (Fig. 3B)and the second used only those voxels in the maskeddataset (Fig. 3E). Starting from the right-hand tail ofeach histogram, the first bin found to contain unequalnumbers of voxels was set as the intensity thresholdfor hyperintensities for the slice (right arrow, Fig. 3E).Only voxels classified as hyperintense in both axialand coronal planes were segmented as hyperintense(Fig. 3F).
FPM
The algorithm as presented above produced accepta-ble results in many cases, but in all cases manualintervention (selecting and removal of false positives)would have improved the results. Our primary goalwas to develop a fully automatic WMH segmentationthat included minimal false positives. To remove themost common false positives, we used a white mattermask created from a thresholded probabilistic whitematter template (Montreal Neurological Institute [MNI]‘‘152,’’ available in the SPM software package; http://www.fil.ion.ucl.ac.uk/spm/) that had been registeredto the FLAIR image. The template registration wasaccomplished by registering the MNI template T1-weighted image to the skull-stripped, bias-corrected,unfiltered FLAIR image (affine, FSL) and the resultingtransformation matrix was used to move the whitematter template into the subject’s image space.
Two FPM strategies were tested. Both strategiesinvolved thresholding the white matter template, andthe threshold for each strategy was selected by exam-ining the results of two subjects with varying degreesof WMH burden across slices. For the first (FPM1), thesegmentation results were simply masked with thethresholded template (white matter probability ¼0.41). For the second (FPM2), hyperintensities wereremoved if they were not connected in 3D to thethresholded template. As the 3D connectivity rulemade FPM2 more liberal, a higher threshold was used(white matter probability ¼ 0.63). Any hyperintense
Figure 3. Segmentation of WMHs. A: Unmasked FLAIR image. B: FLAIR histogram. C: Pseudocolored image of FCM resultsfor background-CSF class. Hyperintense voxels are assigned a membership grade greater than zero in this class. To isolatehyperintensities, a threshold was applied and the result was used to mask the FLAIR. Colorbar indicates membership grade.D: Masked FLAIR image. E: FLAIR histogram after removal of voxels below threshold. WMH voxels are now clearly separatedfrom background-CSF voxels (arrows). For each slice, masked and unmasked histograms were compared, and the break inthe histogram was used as the threshold for segmenting the WMHs. F: Final segmentation results overlaid onto the inputFLAIR.
1314 Gibson et al.
voxels remaining after the FPM step were classified asWMH. To assess the impact of the specific thresholdvalues selected, six additional thresholds were tested,three above and three below the selected value, inincrements of 0.04 white matter probability.
To determine whether limited manual editing couldfurther improve the segmentation results, the auto-mated WMH segmentation masks for FPM2 (WM prob-ability threshold ¼ 0.63) were subjected to a maxi-mum of 5 minutes of manual editing per brain usingthe Analyze software package (Biomedical ImagingResource, Mayo Foundation, Rochester, MN; http://www.mayo.edu/bir/Software/Analyze/Analyze.html).The following actions were allowed for the manualediting step: removal of false positives (eg, flow arti-fact) by relabeling them as background; adding backin portions of WMH truncated by the template byrelabeling them as WMH class.
Assessment of Segmentation Precision: SyntheticData
The precision of the method was assessed by intro-ducing synthetic ‘‘hyperintensities’’ into the imagedata. The synthetic data were created by addingknown numbers of hyperintense voxels to brain slicesthat had no hyperintensities. Segmentation accuracywas assessed by comparing the results of the auto-matic protocol with manually traced WMH.
Images from six subjects with varying amounts ofatrophy and low to moderate whole-brain WMH loadwere used. For each subject, three to four axial slices(mean, 3.4 6 0.5) from the filtered FLAIR images wereused. A total of 22 slices were selected across variouslevels of the brain, and the proportion of recoveredvoxels was used to index the accuracy of the algo-rithm. Details are described below.
Slice Preparation
A threshold for hyperintense voxels was identifiedmanually for each selected slice, and any voxelexceeding this intensity threshold was removed. Sliceswere used only if less than 2% of the total slice vol-ume was removed (mean percentage of removed vox-els: 0.7% 6 0.5%).
Adding Synthetic Hyperintense Voxels
The manually identified WMH intensity threshold foreach slice was used as the lower limit of syntheticdata values. To find an appropriate upper limit, a his-togram of the entire volume was calculated for eachimage (bin width ¼ 1 signal intensity unit), and thevalue of the rightmost bin in the histogram containingfour or more voxels was set as the upper limit. Thus,the lower limit was specific to each base slice, whilethe upper limit was calculated only once for eachdataset. Synthetic data values were randomly selectedfrom this range. This procedure ensured that artificialpeaks were not created in the tail of the histogramand that no voxels were added with intensity valuesbelow what would reasonably be classified as a WMH.Note that because the segmentation operates strictly
on the vector of FLAIR intensity values, it was notnecessary to mimic the size or shape characteristicsof typical WMH (eg, Ref. 21).
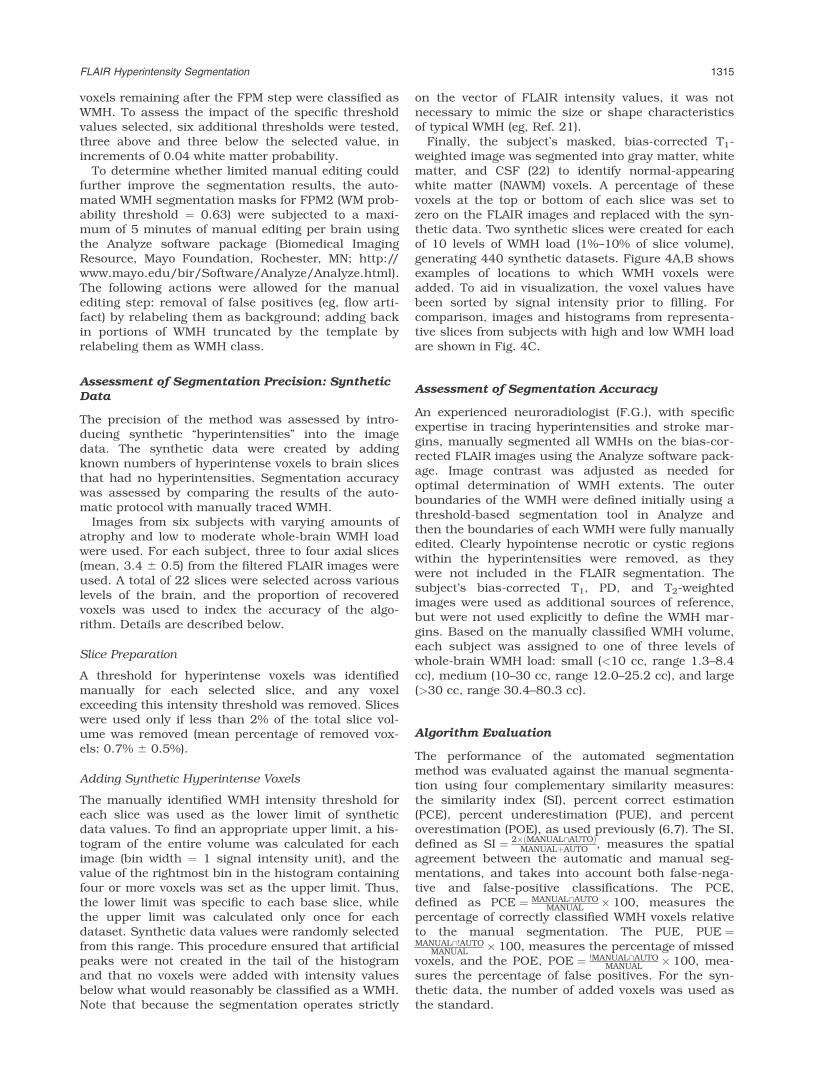
Finally, the subject’s masked, bias-corrected T1-weighted image was segmented into gray matter, whitematter, and CSF (22) to identify normal-appearingwhite matter (NAWM) voxels. A percentage of thesevoxels at the top or bottom of each slice was set tozero on the FLAIR images and replaced with the syn-thetic data. Two synthetic slices were created for eachof 10 levels of WMH load (1%–10% of slice volume),generating 440 synthetic datasets. Figure 4A,B showsexamples of locations to which WMH voxels wereadded. To aid in visualization, the voxel values havebeen sorted by signal intensity prior to filling. Forcomparison, images and histograms from representa-tive slices from subjects with high and low WMH loadare shown in Fig. 4C.
Assessment of Segmentation Accuracy
An experienced neuroradiologist (F.G.), with specificexpertise in tracing hyperintensities and stroke mar-gins, manually segmented all WMHs on the bias-cor-rected FLAIR images using the Analyze software pack-age. Image contrast was adjusted as needed foroptimal determination of WMH extents. The outerboundaries of the WMH were defined initially using athreshold-based segmentation tool in Analyze andthen the boundaries of each WMH were fully manuallyedited. Clearly hypointense necrotic or cystic regionswithin the hyperintensities were removed, as theywere not included in the FLAIR segmentation. Thesubject’s bias-corrected T1, PD, and T2-weightedimages were used as additional sources of reference,but were not used explicitly to define the WMH mar-gins. Based on the manually classified WMH volume,each subject was assigned to one of three levels ofwhole-brain WMH load: small (<10 cc, range 1.3–8.4cc), medium (10–30 cc, range 12.0–25.2 cc), and large(>30 cc, range 30.4–80.3 cc).
Algorithm Evaluation
The performance of the automated segmentationmethod was evaluated against the manual segmenta-tion using four complementary similarity measures:the similarity index (SI), percent correct estimation(PCE), percent underestimation (PUE), and percentoverestimation (POE), as used previously (6,7). The SI,defined as SI ¼ 2�ðMANUAL\AUTOÞ
MANUALþAUTO , measures the spatialagreement between the automatic and manual seg-mentations, and takes into account both false-nega-tive and false-positive classifications. The PCE,defined as PCE ¼ MANUAL\AUTO
MANUAL � 100, measures thepercentage of correctly classified WMH voxels relativeto the manual segmentation. The PUE, PUE ¼MANUAL\!AUTO
MANUAL � 100, measures the percentage of missedvoxels, and the POE, POE ¼ !MANUAL\AUTO
MANUAL � 100, mea-sures the percentage of false positives. For the syn-thetic data, the number of added voxels was used asthe standard.
FLAIR Hyperintensity Segmentation 1315
For the synthetic data, each similarity measure wasanalyzed using a repeated-measures analysis of variance(ANOVA, SPSS, Chicago, IL, v. 15.0.0, http://www.spss.com/) as a function of added hyperintensity load.The subject data were analyzed for one FPM threshold(see below) using a 3 (WMH burden: small, medium,large) � 3 (strategy: none, FPM1, FPM2) mixed-modelANOVA; and 3 (WMH burden) � 2 (strategy) ANOVAswere used to identify whether the FPM2 strategy withmanual editing produced better results than FPM2alone. Significant main effects and interactions wereassessed using post-hoc Newman–Keuls analysis. Signif-icance threshold was set at P< 0.05 for all analyses.
RESULTS
Removal of Clearly Hyperintense Voxels
WMH loads greater than 6% of the total slice vol-ume were found on 8% of the manually traced sli-
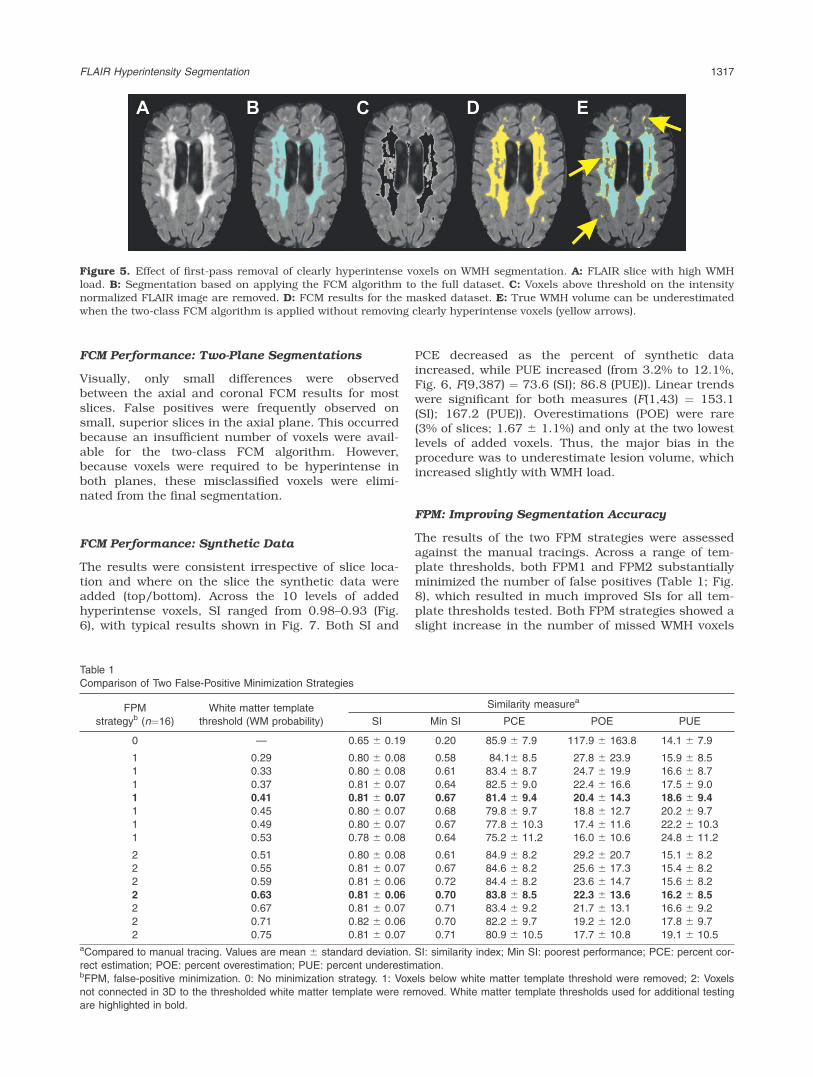
ces. This was reduced to 0.8% of slices followingthe first-pass removal procedure, and the resultswere consistent across slice WMH load (detailedresults are in tabular form in the online Supple-mental Material). Note that the manual tracings donot include artifact voxels and therefore do notindex the entire hyperintense volume for a givenslice. However, because artifact voxels comprise onlya small portion of the total slice volume (typically<�1%), the results confirm that the two-class FCMrequirement of two dominant tissue classes (brainand background-CSF) was met. If clearly hyperin-tense voxels were not removed, the segmentationunderestimated the true WMH volume, as shown inFig. 5. The first-pass removal procedure alsoimproved segmentation accuracy: small WMH weremore likely to be included, and the margins oflarger WMH expanded and were more consistentwith the manual tracing (arrows, Fig. 5E).
Figure 4. Synthetic and subject data at two levels of WMH load: 2% (left) and 10% (right) of total slice volume. Normal-appearing white matter voxels were identified from the subject’s segmented T1-weighted image. Starting at the top (A) or bot-tom (B) of the slice, these voxels were replaced by synthetic data. Note that the signal intensities of the added voxels havebeen sorted to aid in visualization. C: Correspondence of histograms of subject data at load levels comparable to the syn-thetic datasets.
1316 Gibson et al.
FCM Performance: Two-Plane Segmentations
Visually, only small differences were observedbetween the axial and coronal FCM results for mostslices. False positives were frequently observed onsmall, superior slices in the axial plane. This occurredbecause an insufficient number of voxels were avail-able for the two-class FCM algorithm. However,because voxels were required to be hyperintense inboth planes, these misclassified voxels were elimi-nated from the final segmentation.
FCM Performance: Synthetic Data
The results were consistent irrespective of slice loca-tion and where on the slice the synthetic data wereadded (top/bottom). Across the 10 levels of addedhyperintense voxels, SI ranged from 0.98–0.93 (Fig.6), with typical results shown in Fig. 7. Both SI and
PCE decreased as the percent of synthetic dataincreased, while PUE increased (from 3.2% to 12.1%,Fig. 6, F(9,387) ¼ 73.6 (SI); 86.8 (PUE)). Linear trendswere significant for both measures (F(1,43) ¼ 153.1(SI); 167.2 (PUE)). Overestimations (POE) were rare(3% of slices; 1.67 6 1.1%) and only at the two lowestlevels of added voxels. Thus, the major bias in theprocedure was to underestimate lesion volume, whichincreased slightly with WMH load.
FPM: Improving Segmentation Accuracy
The results of the two FPM strategies were assessedagainst the manual tracings. Across a range of tem-plate thresholds, both FPM1 and FPM2 substantiallyminimized the number of false positives (Table 1; Fig.8), which resulted in much improved SIs for all tem-plate thresholds tested. Both FPM strategies showed aslight increase in the number of missed WMH voxels
Table 1
Comparison of Two False-Positive Minimization Strategies
FPM
strategyb (n¼16)
White matter template
threshold (WM probability)
Similarity measurea
SI Min SI PCE POE PUE
0 — 0.65 6 0.19 0.20 85.9 6 7.9 117.9 6 163.8 14.1 6 7.9
1 0.29 0.80 6 0.08 0.58 84.16 8.5 27.8 6 23.9 15.9 6 8.5
1 0.33 0.80 6 0.08 0.61 83.4 6 8.7 24.7 6 19.9 16.6 6 8.7
1 0.37 0.81 6 0.07 0.64 82.5 6 9.0 22.4 6 16.6 17.5 6 9.0
1 0.41 0.81 6 0.07 0.67 81.4 6 9.4 20.4 6 14.3 18.6 6 9.4
1 0.45 0.80 6 0.07 0.68 79.8 6 9.7 18.8 6 12.7 20.2 6 9.7
1 0.49 0.80 6 0.07 0.67 77.8 6 10.3 17.4 6 11.6 22.2 6 10.3
1 0.53 0.78 6 0.08 0.64 75.2 6 11.2 16.0 6 10.6 24.8 6 11.2
2 0.51 0.80 6 0.08 0.61 84.9 6 8.2 29.2 6 20.7 15.1 6 8.2
2 0.55 0.81 6 0.07 0.67 84.6 6 8.2 25.6 6 17.3 15.4 6 8.2
2 0.59 0.81 6 0.06 0.72 84.4 6 8.2 23.6 6 14.7 15.6 6 8.2
2 0.63 0.81 6 0.06 0.70 83.8 6 8.5 22.3 6 13.6 16.2 6 8.5
2 0.67 0.81 6 0.07 0.71 83.4 6 9.2 21.7 6 13.1 16.6 6 9.2
2 0.71 0.82 6 0.06 0.70 82.2 6 9.7 19.2 6 12.0 17.8 6 9.7
2 0.75 0.81 6 0.07 0.71 80.9 6 10.5 17.7 6 10.8 19.1 6 10.5aCompared to manual tracing. Values are mean 6 standard deviation. SI: similarity index; Min SI: poorest performance; PCE: percent cor-
rect estimation; POE: percent overestimation; PUE: percent underestimation.bFPM, false-positive minimization. 0: No minimization strategy. 1: Voxels below white matter template threshold were removed; 2: Voxels
not connected in 3D to the thresholded white matter template were removed. White matter template thresholds used for additional testing
are highlighted in bold.
Figure 5. Effect of first-pass removal of clearly hyperintense voxels on WMH segmentation. A: FLAIR slice with high WMHload. B: Segmentation based on applying the FCM algorithm to the full dataset. C: Voxels above threshold on the intensitynormalized FLAIR image are removed. D: FCM results for the masked dataset. E: True WMH volume can be underestimatedwhen the two-class FCM algorithm is applied without removing clearly hyperintense voxels (yellow arrows).
FLAIR Hyperintensity Segmentation 1317

(PUE increased from 14% with no FPM to 16%–25%depending on threshold and strategy). No differencesin SI were found between the two FPM strategies. Theoverlap of the FPM2 strategy with the manual tracingresults across a range of WMH burden is shown inFig. 9.
Using FPM1, FLAIR hyperintensities were routinelyrejected in nonwhite matter structures, such as basalganglia and thalamus. Additionally, portions of someWMHs were rejected when they extended beyond thethresholded white matter compartment. If the tem-plate threshold was lowered to incorporate the missedvoxels, the improvement in underestimation was off-set by a much larger number of false positives (cf.thresholds of 0.29 vs. 0.41 for FPM1, Table 1). Thelargest source of error in the FPM2 data was theinclusion of ventricular CSF flow artifact, which wasseen in two of the 16 cases.
To further define the differences between the twoFPM strategies, one threshold was selected for eachmethod and the results were assessed as a function ofWMH load. As whole-brain similarity measures aremost commonly reported in the literature, we focusedour assessment of the current method at this level(Fig. 10A–C; see online Supplemental Material fordata in tabular form). Similarity measures at the slicelevel are also presented to compare with the simulateddata (Fig. 10D–F).
Whole-brain similarity was significantly improvedby both FPM measures for small and medium, but notlarge WMH burdens (SI, strategy � burden, F(4,26) ¼12.3). The improved SI was largely due to the sub-stantial reduction in overestimations. Overestimationswere disproportionately large at small lesion loadswith no FPM strategy (Fig. 10B; POE range: 77%–669%), and both FPM strategies successfully reducedPOE in this case (POE range: 8%–53%). Assessmentexcluding the small WMH burden data showed thatboth FPM strategies successfully reduced POE at bothmedium and large WMH burdens (strategy � burden,F(2,16) ¼ 8.5). The improvements in SI and POE were
accompanied by small increases (�4%) in underesti-mations across all burden levels (Fig. 10,C; F(2,26) ¼15.8).
Manual editing was applied only to the FPM2results, primarily because reclaiming the hyperinten-sities and partial hyperintensities missed by theFPM1 procedure would have required more than 5minutes to accomplish. Most of the manual correc-tions to the FPM2 segmentations consisted of remov-ing false positives. Manual editing was most beneficialwhen whole-brain WMH load was small, where POEwas reduced from �32% to �20% (Fig. 10B; F(2,13) ¼4.7).
At the level of individual slices, SI improved at loadlevels under 4%, and then stabilized at �0.90 forhigher loads (Fig. 10D). Similar results were seen foroverestimations, which reduced to �5% or less athigher loads (Fig. 10E). Underestimations stabilizedmore quickly to �10%, at WMH load levels >2% (Fig.10F). The values at which each of these measures sta-bilized is comparable to the range of the precision ofthe method as assessed by the synthetic data at thehighest load tested (Fig. 6).
DISCUSSION
The primary aim of this work was to develop and vali-date a fully automatic method for segmenting whitematter hyperintensities on 3T FLAIR images in the el-derly. The current approach had excellent precisionas assessed using synthetic data. It also fared wellagainst manual tracing, a commonly-used ‘‘goldstandard’’ for validating brain tissue segmentationalgorithms.
The use of synthetic data provided an objective testof the algorithm’s performance. The primary source oferror derived from the tendency of the algorithm tounderestimate the true hyperintensity volume. Themagnitude of underestimation was linearly related tothe number of added hyperintense voxels, and was re-stricted to voxels with the lowest intensities. Underes-timation was also present in the subject data, and
Figure 6. Changes in similarity index (SI) and percentunderestimation (PUE) as a function of percentage of syn-thetic data added. Data are mean 6 standard error of themean.
Figure 7. Segmentation of synthetic datasets. Top Row: Syn-thetic WMH voxels representing 1% (A), 5% (B), 10% (C) oftotal slice volume. Bottom Row: Yellow: correctly classifiedvoxels; Red: missed voxels. For these slices, SI ¼ 0.98, 0.95,0.91; PCE ¼ 96.5, 90.1, 83.9%; PUE ¼ 3.5, 9.9, 6.1% for1%, 5%, and 10%, respectively.
1318 Gibson et al.
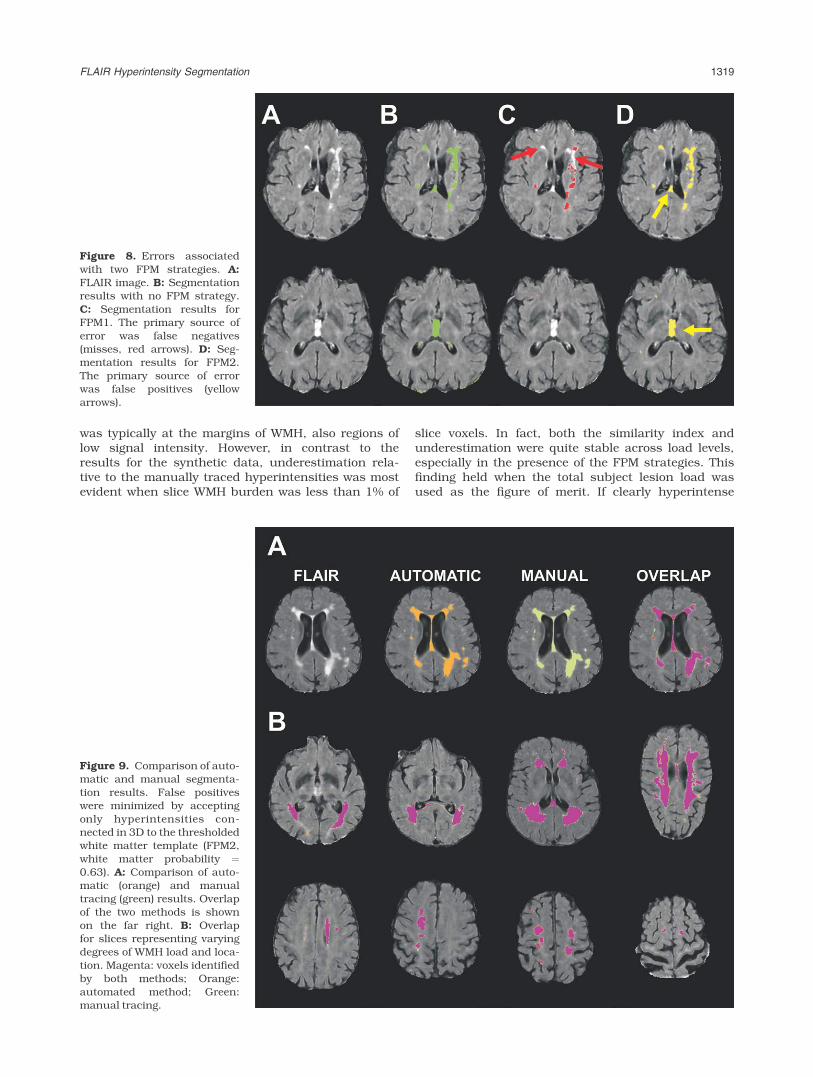
was typically at the margins of WMH, also regions oflow signal intensity. However, in contrast to theresults for the synthetic data, underestimation rela-tive to the manually traced hyperintensities was mostevident when slice WMH burden was less than 1% of
slice voxels. In fact, both the similarity index andunderestimation were quite stable across load levels,especially in the presence of the FPM strategies. Thisfinding held when the total subject lesion load wasused as the figure of merit. If clearly hyperintense
Figure 9. Comparison of auto-matic and manual segmenta-tion results. False positiveswere minimized by acceptingonly hyperintensities con-nected in 3D to the thresholdedwhite matter template (FPM2,white matter probability ¼0.63). A: Comparison of auto-matic (orange) and manualtracing (green) results. Overlapof the two methods is shownon the far right. B: Overlapfor slices representing varyingdegrees of WMH load and loca-tion. Magenta: voxels identifiedby both methods; Orange:automated method; Green:manual tracing.
Figure 8. Errors associatedwith two FPM strategies. A:FLAIR image. B: Segmentationresults with no FPM strategy.C: Segmentation results forFPM1. The primary source oferror was false negatives(misses, red arrows). D: Seg-mentation results for FPM2.The primary source of errorwas false positives (yellowarrows).
FLAIR Hyperintensity Segmentation 1319

voxels had not been removed from the data, our seg-mentations would have also failed on slices with thelargest WMH loads. The consistency of the underesti-mation values across WMH levels speaks to the effi-cacy of the first-pass removal step in maintaining thecorrect balance among tissue classes. In addition, ifthe algorithm is in fact ‘‘missing’’ voxels at higherlesion loads in the subject data, they are also voxelsthat are not likely to be included by an experiencedoperator.
Specific features incorporated into the procedure toimprove the accuracy of the method included the re-moval of clearly hyperintense voxels, the use of a con-sensus segmentation in two planes, and the incorpo-ration of a white matter mask to define the probablespatial locations for WMH. The first-pass removal stepwas designed to ensure more robust and consistentoperation of the FCM algorithm. Using the manuallysegmented data as a guide, 99% of slices had WMHloads �6% of the total slice volume after clearly
hyperintense voxels were removed. Thus, the first-pass removal step effectively reduced the WMH loadfor each slice to a range optimal for the two-classFCM. In fact, the less-than-perfect performance atthis step was restricted to eight slices from a singlesubject’s data, where slice WMH load was between 7%and 11%. Although striking differences were notobserved between the axial and coronal FCM results,the requirement that a voxel segment as hyperintensein both orientations avoided the need to reject imageslices from analysis due to an insufficient number ofvoxels for the FCM algorithm.
Both automatic FPM strategies were successfulacross a range of template thresholds. Additionally,the results suggest that accurate WMH segmentationsdo not depend on precise registration, as a simpleaffine registration of the template was sufficient toreduce false positives. The two FPM methods differedstatistically only with respect to under- and overesti-mations. For these metrics, the 3D connectivity rule
Figure 10. Similarity meas-ures as a function of WMH bur-den and FPM strategy. Leftpanels: Whole-brain WMH loadwas designated as small (<10cc), medium (10–30 cc), or large(>30 cc) based on manual trac-ing. Data are also shown col-lapsed across WMH burden:‘‘All.’’ Improvements in SI (A)and POE (B) are seen with allFPM strategies, and were espe-cially evident at small andmedium WMH loads. Smallerimprovements were seen forPUE (C). Right panels. Similar-ity data are presented based onpercent WMH found on the sliceby manual tracing. As for thewhole-brain results, the largestimpact of the FPM methods onthe SI (D) and POE (E) was atlow WMH levels (<5%). PUE (F)was stable for load levels >2%.Black: No FPM, segmentationonly; Red: FPM1, thresholdedtemplate applied to segmenta-tion; Green: FPM2, thresholdedtemplate plus 3D connectivityconstraint; Blue: FPM2þ, FPM2plus manual editing.
1320 Gibson et al.
(FPM2) outperformed the simple masking approach(FPM1). Given the small size of the differences (�1%),the choice of which FPM strategy is optimal for a givendataset or application depends on whether or notmanual intervention is deemed to be important tomore completely reduce false positives for small WMHloads. If a fully automated approach is indicated, itmay be more desirable use the thresholded white mat-ter template directly as a mask (FPM1). While thisstrategy was insensitive to WMH located outside theboundaries of typical white matter, and thus pro-duced the largest PUE, it was not as likely to includeCSF flow artifact. On the other hand, simply exclud-ing hyperintensities not connected in 3D to the whitematter template (FPM2) brought underestimations totheir best level, and adopting a semiautomatic strat-egy further improved both SI (�2%) and POE (�5%).The semiautomated procedure using FPM2 requiredthe least amount of manual reclassification, becausethere was a greater initial agreement with the manualtracings, and there were no instances where subsec-tions of WMH were misclassified.
The primary sources of error with this segmentationprocedure are directly linked to the sensitivity of theFLAIR sequence. CSF inflow artifact can be a majorsource of error on 2D FLAIR imaging (�50%) (15), butwas not prominent in the current dataset (�10%).However, prominent CSF flow artifact was easily elimi-nated as a major source of false positives by bothFPM methods. Second, there is continuing debate inthe literature regarding the relevance of thalamicinfarcts, lacunes, and cystic white matter hyperinten-sities (23–25) for cognitive decline and progression ofdementia. If these ‘‘black holes’’ on T1-weightedimages are in fact CSF-filled, they will tend to beblack holes on FLAIR images, and will not be includedin the WMH burden volume (eg, 26). Incorporatingthose hypointense voxels as a unique tissue compart-ment would require separate segmentation of PDand/or T1-weighted images. One of our ultimate goalsis to combine WMH and T1 segmentation results toachieve regional lobar tissue volumes (27). Therefore,the WMH segmentations and tracings were performedon FLAIR images coregistered to T1-weighted images.Performing the analysis in native acquisition spacewould avoid introducing interpolation error, and maybe an important factor to consider in certain instan-ces. However, the high similarity indices achievedindicate the procedure is robust with respect to theerror introduced from interpolating the image into thehigher resolution space.
The whole-brain accuracy of the present approachequaled or exceeded those derived from methods opti-mized for both single- and multichannel data at 1.5T.Our approach exceeded that of Admiraal-Behloul et al(10), who found SIs ranging from 0.70–0.82 acrossthree similar levels of WMH load using a multispec-tral, fuzzy segmentation. At large lesion loads, ourmethod had SIs similar to those derived using K-near-est neighbor (6) or multispectral fuzzy connectivityapproaches (7). At smaller whole-brain WMH loads,the current approach appears to have outperformedboth. At the slice level, high similarity indices and low
underestimations were achieved consistently at sliceloads >3% when an FPM strategy was used, and atslice loads >4% when the basic segmentation wasused.
An additional advantage of this approach is that itis straightforward to implement. Neither large trainingdatasets or labor-intensive manual labeling of hyper-intensities are required. For a given set of FLAIR ac-quisition parameters, only two thresholds need to beestablished. The first threshold is derived from nor-malized images and is used to exclude obviouslyhyperintense voxels, so that slice WMH load isroughly 6% in the most severely affected cases. Thisthreshold can be determined on a representative data-set with moderate to high WMH load. The secondthreshold establishes which voxels will be consideredoutliers in the background/CSF class. Very high simi-larity indices in the test dataset were achieved usingonly two subjects to establish the optimal values forboth thresholds. Because the segmentation procedurehas been designed and validated to perform equallywell across a wide range of lesion loads, appropriatesegmentation parameters can be selected by visualreference to only a small sample of test images.
In conclusion, the method presented here is thefirst, to our knowledge, to optimize segmentation ofWMH in the elderly on 3T FLAIR images. This unsu-pervised method does not require extensive trainingsets or manual segmentations. It is based on a quickand simple clustering algorithm which, in conjunctionwith a template-based FPM strategy, meets or exceedsthe results from more complex multichannel and/orpattern recognition techniques. Importantly, it deliv-ers consistent results across a range of WMH loads,suggesting it will be useful in larger cohort studies ofWMH in aging and dementia.
ACKNOWLEDGMENTS
We thank Joel Ramirez, Christopher Scott, andNaama Levy-Cooperman for feedback during algo-rithm development; and Jon Ween and Donald Stuss(Rotman Research Institute at Baycrest) for access toimaging data. The segmentation program, FLEX:Fuzzy Lesion EXtractor was compiled for Windowsand Unix/Linux operating systems, and is availableby contacting the corresponding author.
REFERENCES
1. Fazekas F, Kleinert R, Offenbacher H, et al. Pathologic correlatesof incidental MRI white matter signal hyperintensities. Neurology1993;43:1683–1689.
2. Matsusue E, Sugihara S, Fujii S, Ohama E, Kinoshita T, OgawaT. White matter changes in elderly people: MR-pathologic correla-tions. Magn Reson Med Sci 2006;5:99–104.
3. Fazekas F, Schmidt R, Scheltens P. Pathophysiologic mechanismsin the development of age-related white matter changes of thebrain. Dement Geriatr Cogn Disord 1998;9:2–5.
4. Nordahl CW, Ranganath C, Yonelinas AP, Decarli C, Fletcher E,Jagust WJ. White matter changes compromise prefrontal cortexfunction in healthy elderly individuals. J Cogn Neurosci 2006;18:418–429.
5. van der Flier WM, van Straaten EC, Barkhof F, et al. Small vesseldisease and general cognitive function in nondisabled elderly: theLADIS study. Stroke 2005;36:2116–2120.
FLAIR Hyperintensity Segmentation 1321

6. Anbeek P, Vincken KL, van Bochove GS, van Osch MJ, van derGrond J. Probabilistic segmentation of brain tissue in MR imag-ing. Neuroimage 2005;27:795–804.
7. Sajja BR, Datta S, He R, et al. Unified approach for multiple scle-rosis lesion segmentation on brain MRI. Ann Biomed Eng 2006;34:142–151.
8. Khayati R, Vafadust M, Towhidkhah F, Nabavi M. Fully automaticsegmentation of multiple sclerosis lesions in brain MR FLAIRimages using adaptive mixtures method and Markov random fieldmodel. Comput Biol Med 2008;38:379–390.
9. Jack CR Jr, O’Brien PC, Rettman DW, et al. FLAIR histogramsegmentation for measurement of leukoaraiosis volume. J MagnReson Imaging 2001;14:668–676.
10. Admiraal-Behloul F, van den Heuvel DMJ, Olofsen H, et al. Fullyautomatic segmentation of white matter hyperintensities in MRimages of the elderly. Neuroimage 2005;28:607–617.
11. Wu M, Rosano C, Butters M, et al. A fully automated method forquantifying and localizing white matter hyperintensities on MRimages. Psychiatry Res 2006;148:133–142.
12. Yoshita M, Fletcher E, DeCarli C. Current concepts of analysis ofcerebral white matter hyperintensities on magnetic resonanceimaging. Topics Magn Reson Imag 2005;16:399–407.
13. Lao Z, Shen D, Liu D, et al. Computer-assisted segmentation ofwhite matter lesions in 3D MR images using support vectormachine. Acad Radiol 2008;15:300–313.
14. Sajja B, Datta S, He R, Narayana P. A unified approach for lesionsegmentation on MRI of multiple sclerosis. Conf Proc IEEE EngMed Biol Soc 2004;3:1778–1781.
15. Bakshi R, Caruthers SD, Janardhan V, Wasay M. IntraventricularCSF pulsation artifact on fast fluid-attenuated inversion-recoveryMR images: analysis of 100 consecutive normal studies. AJNRAm J Neuroradiol 2000;21:503–508.
16. Sled JG, Zijdenbos AP, Evans AC. A nonparametric method forautomatic correction of intensity nonuniformity in MRI data.IEEE Trans Med Imaging 1998;17:87–97.
17. Zhang Y, Brady M, Smith S. Segmentation of brain MR imagesthrough a hidden Markov random field model and the expecta-tion-maximization algorithm. IEEE Trans Med Imaging 2001;20:45–57.
18. Smith SM. Fast robust automated brain extraction. Hum BrainMapp 2002;17:143–155.
19. Perona P, Malik J. Scale-space and edge detection using aniso-tropic diffusion. IEEE Trans Pattern Anal Mach Intell 1990;12:629–639.
20. Bezdek JC. Pattern recognition with fuzzy objective function algo-rithms. New York: Plenum Press; 1981.
21. Herskovits EH, Itoh R, Melhem ER. Accuracy for detection ofsimulated lesions: comparison of fluid-attenuated inversion-recovery, proton density-weighted, and T2-weighted syntheticbrain MR imaging. AJR Am J Roentgenol 2001;176:1313–1318.
22. Kovacevic N, Lobaugh NJ, Bronskill MJ, Levine B, Feinstein A,Black SE. A robust method for extraction and automatic segmen-tation of brain images. Neuroimage 2002;17:1087–1100.
23. Snowdon DA, Greiner LH, Mortimer JA, Riley KP, Greiner PA,Markesbery WR. Brain infarction and the clinical expression ofAlzheimer disease. The Nun Study. JAMA 1997;277:813–817.
24. Reed BR, Eberling JL, Mungas D, Weiner M, Kramer JH, JagustWJ. Effects of white matter lesions and lacunes on cortical func-tion. Arch Neurol 2004;61:1545–1550.
25. Mungas D, Harvey D, Reed BR, et al. Longitudinal volumetricMRI change and rate of cognitive decline. Neurol 2005;65:565–571.
26. Bastos Leite AJ, van Straaten EC, Scheltens P, Lycklama G, Bar-khof F. Thalamic lesions in vascular dementia: low sensitivity offluid-attenuated inversion recovery (FLAIR) imaging. Stroke 2004;35:415–419.
27. Dade LA, Gao FQ, Kovacevic N, et al. Semiautomatic brainregion extraction: a method of parcellating brain regions fromstructural magnetic resonance images. Neuroimage 2004;22:1492–1502.
1322 Gibson et al.


![3T]caP[[h ]Tgc [TeT[ 3T[TQaPcT - Novotel Sydney Central · 3t[tqapct 3t]cap[[h 5if(spwf$pdlubjm1bdlbhf qfsqfstpo ipvsdbobqft ipvstpgcfwfsbhft $pdlubjm1bdlbhf qfsqfstpo ipvstpgefmjdjpvt{dbobqft{](https://img.pdfslide.us/doc/110x75/5f6aa72c2199805f6a1a97e5/3tcaph-tgc-tet-3ttqapct-novotel-sydney-central-3ttqapct-3tcaph-5ifspwfpdlubjm1bdlbhf.jpg)