Embed Size (px)
Citation preview
AUTOMATIC POLARIMETER
ADP - 90
Table of Contents
I. APPLICATIONS AND FEATURES ................................................. 1
II. MAIN TECHNICAL PARAMETERS ............................................... 2
III. STRUCTURE AND BASIC PRINCIPLES ........................................ 3
3.1 BASIC PRINCIPLES OF APPLICATION .................................................... 3
3.2 OPTICAL ZERO PRINCIPLE ............................................................... 4
3.3 INSTRUMENT STRUCTURE ............................................................... 6
IV. OPERATION INSTRUCTIONS .................................................... 7
4.1 WORKING CONDITIONS .................................................................. 7
4.2 SETTINGS AND KEYS ...................................................................... 7
V. MAINTENANCE AND CHECK ....................................................17
5.1 INSTRUMENT MAINTENANCE ......................................................... 18
5.2 CHECK THE OPTICAL PATH ............................................................. 18
VI. TROUBLESHOOTING .............................................................. 19
1
I. Applications and Features
Automatic Polarimeter is a kind of instrument for measuring the optical rotation of a substance. Through
measuring the optical rotation, the polarimeter can be used to analyze the concentration, content, and
purity of a substance. It can widely be used in various fields, including sugar making, pharmaceuticals,
petroleum, food, chemical and other industrial sectors and related institutions.
ADP-90 hereinafter referred to as the instrument, uses light emitting diodes as the light source, avoiding
the trouble of frequent replacing sodium lights. The temperature control device within the instrument has
a heating and cooling function. If the temperature control type tube is used, it can measure the optical
rotation of a sample. The large-screen LCD display on the instrument provides WINDOWS interface, simple
and intuitive, stable and reliable. The measuring range is ±90° (optical rotation).
2
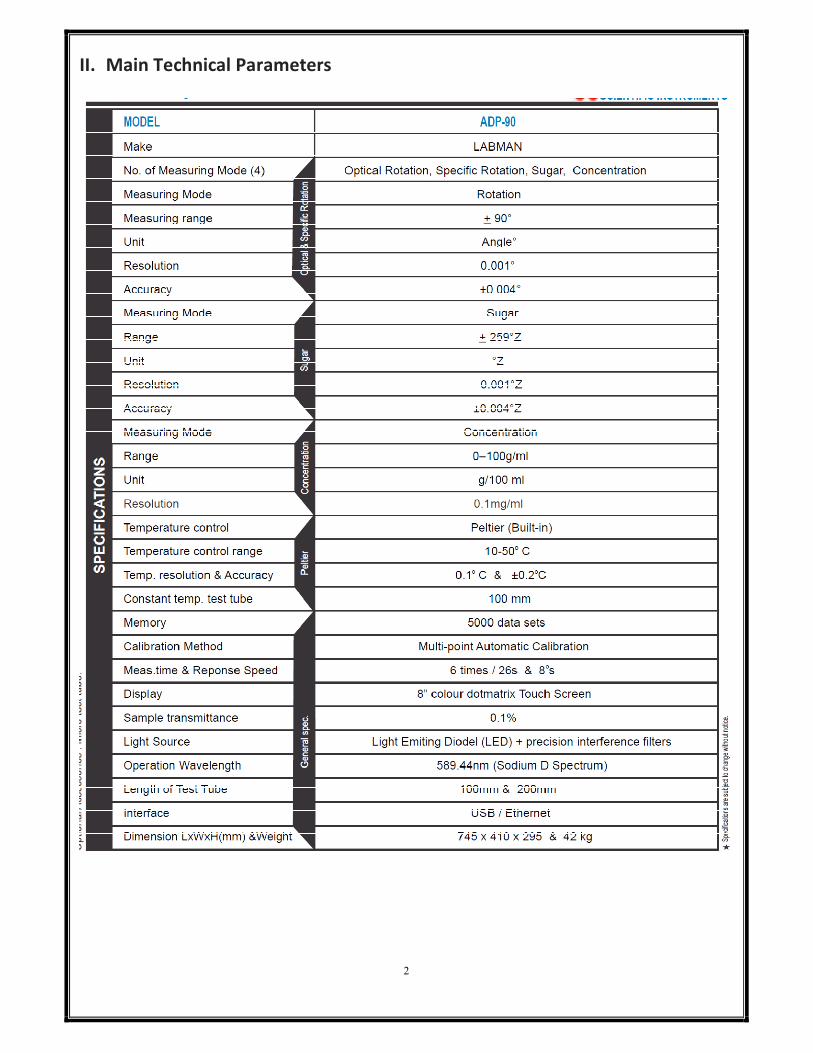
II. Main Technical Parameters
3
III. Structure and Basic Principles
3.1 Basic principles of application
As we all know, the visible light is a kind of electromagnetic wave with a wavelength of 380nm~780nm. In
the statistical law, the corresponding light vibrations happens in possible directions in the direction
perpendicular to the light propagation direction, and the corresponding amplitude of light vector (light
intensity) in all possible directions are the same, usually called the natural light. With certain devices (e.g., a
polarizer), the vibration direction can be fixed in a direction perpendicular to the light propagation direction,
to form a so-called plane-polarized light. When plane polarized light goes through a substance, the
vibration direction of polarized light will turn an angle, the substance is called optical material, and the
angle that polarized light turned is called optical rotation. If the plane polarized light goes through the
optically pure substance, and the optical rotation is determined by the following three factors:
1) The wavelength (λ) of the plane polarized light: for different wavelengths, the optical rotation is
different.
2) The temperature (t) of the optically active substance: for different temperatures, the optical rotation is
different.
3) The kind of an optically active substance: for different optically active substances, the optical rotation is
different.
The specific rotation [α]t λ represents the rotation capacity of a substance.
Typically, the predetermined length of the optical tube is 1dm (100mm), the concentration of the test
substance solution is 1g/mL, and the temperature t℃. When the plane polarized light is at the wavelength
λ, the measured optical rotation is called the specific rotation of the substance, [α]tλ. The specific rotation is
only determined by the structure of substance. Therefore, the specific rotation is the substance-specific
physical constant.
αtλ=[α]
tλ.L.C (1)
Where, L is the length of test solution (optical tube), with mm as unit; C is the concentration of the optically
active substance in the test solution. The instrument typically shows the result in the grams of optically
active substance in per 100mL solution.If the specific rotation [α]tλ of test substance is known in advance,
the optical rotation αtλ is measured at certain temperature and wavelength, the length of the test solution
is L, the concentration of optically active substances in solution (C) can be calculated with the formula (2)
4
C=αtλ/[α]
tλ.L (2)
If the solution contains a non-optically active, other than the optically substance, with concentration of
prepared solution and formula (2), the concentration of the optically active substance (C) can be obtained,
and the content of an optically active substance or purity can be calculated.
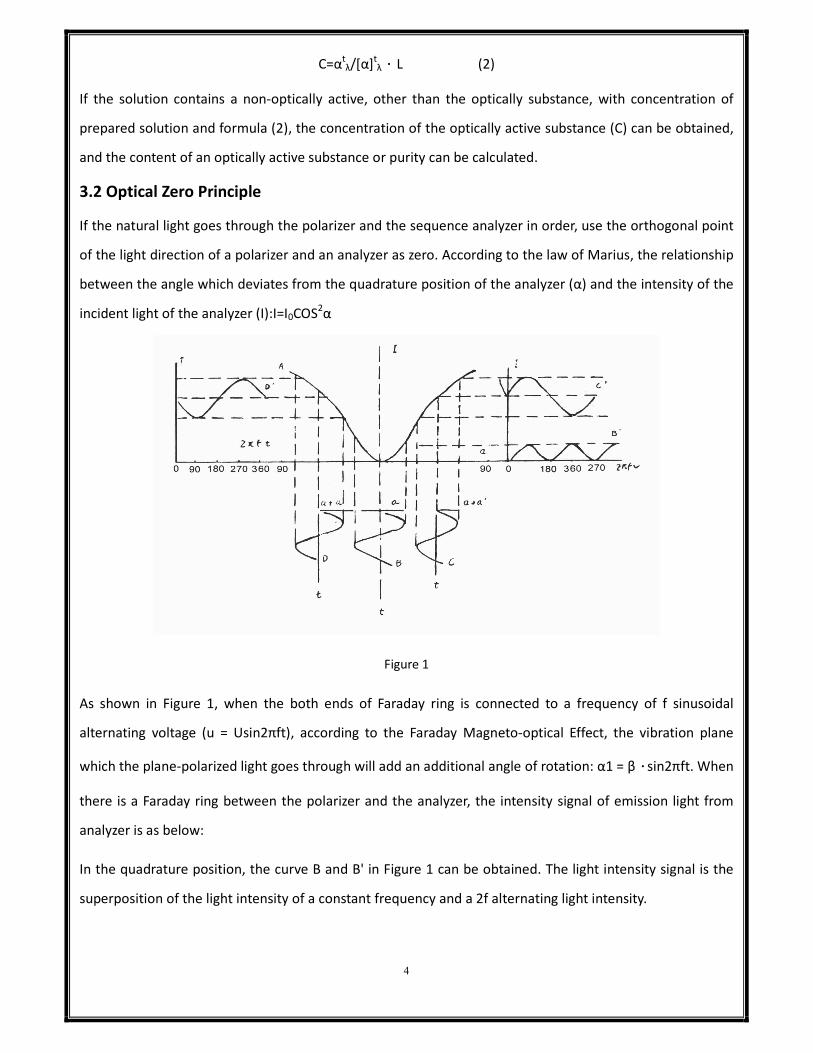
3.2 Optical Zero Principle
If the natural light goes through the polarizer and the sequence analyzer in order, use the orthogonal point
of the light direction of a polarizer and an analyzer as zero. According to the law of Marius, the relationship
between the angle which deviates from the quadrature position of the analyzer (α) and the intensity of the
incident light of the analyzer (I):I=I0COS2α
Figure 1
As shown in Figure 1, when the both ends of Faraday ring is connected to a frequency of f sinusoidal
alternating voltage (u = Usin2πft), according to the Faraday Magneto-optical Effect, the vibration plane
which the plane-polarized light goes through will add an additional angle of rotation: α1 = β.sin2πft. When
there is a Faraday ring between the polarizer and the analyzer, the intensity signal of emission light from
analyzer is as below:
In the quadrature position, the curve B and B' in Figure 1 can be obtained. The light intensity signal is the
superposition of the light intensity of a constant frequency and a 2f alternating light intensity.
5
a) When the quadrature position is deviated from the right, the curve C and C' in Figure 1 can be obtained.
The light intensity signal is the superposition of the light intensity of a constant frequency and a 2f
alternating light intensity, see curve C'.
b) When deviating from the quadrature position leftward, the curve D and D ' in Figure 1 can be obtained.
The light intensity signal is the superposition of the light intensity of a constant frequency and a 2f
alternating light intensity, see curve D'. However, the phase of the alternating light intensity is just the
opposite of alternating light intensity signals when deviating from the quadrature position.
Therefore, identify whether the alternating light intensity of the f component in signal intensity is zero. It
can accurately determine whether the polarizer and the analyzer are in an orthogonal position, identify the
phase of f component alternating light intensity, and determine whether the analyzer deviates from the
orthogonal to the left or right position.
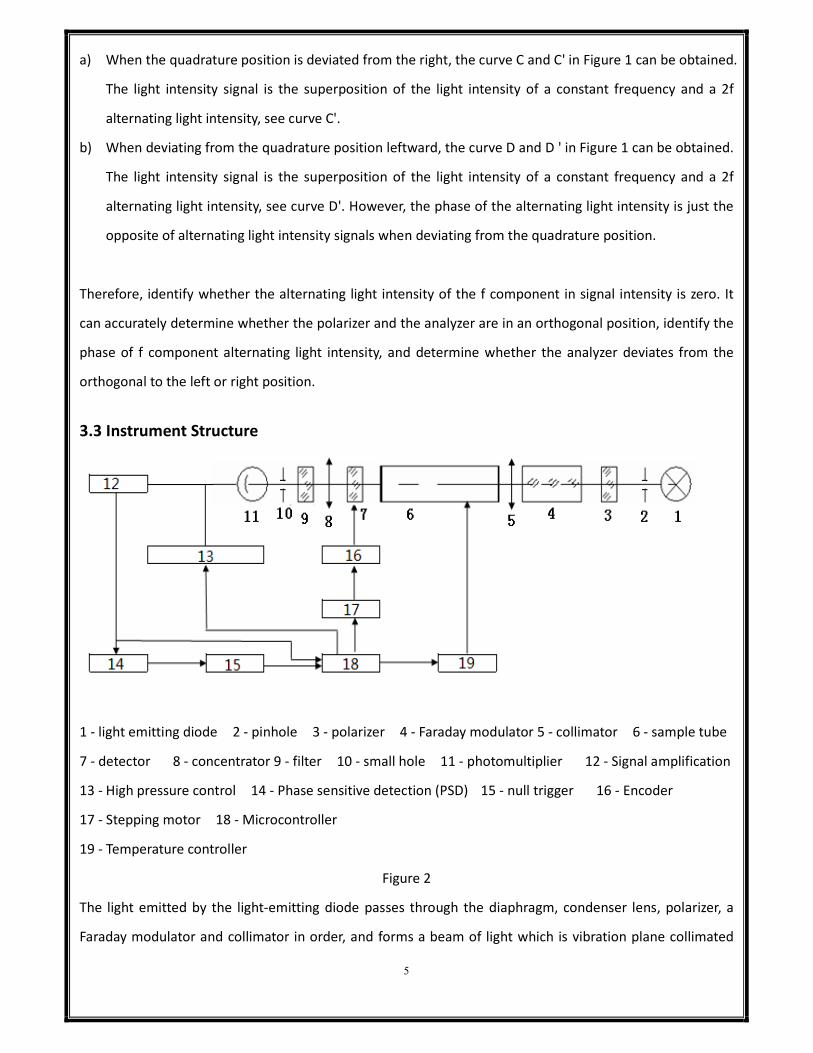
3.3 Instrument Structure
1 - light emitting diode 2 - pinhole 3 - polarizer 4 - Faraday modulator 5 - collimator 6 - sample tube
7 - detector 8 - concentrator 9 - filter 10 - small hole 11 - photomultiplier 12 - Signal amplification
13 - High pressure control 14 - Phase sensitive detection (PSD) 15 - null trigger 16 - Encoder
17 - Stepping motor 18 - Microcontroller
19 - Temperature controller
Figure 2
The light emitted by the light-emitting diode passes through the diaphragm, condenser lens, polarizer, a
Faraday modulator and collimator in order, and forms a beam of light which is vibration plane collimated
6
and plane polarized, changing with voltage alternating of the Faraday ring. The light goes through the tube
with test solution, enters the analyzer, and then passes through the receiving objective lens, filter and
diaphragm. The monochromatic light with wavelength of 589.3nm goes into the photomultiplier tube,
which converts the light intensity signals into electrical signals, and the light is amplified by the preamplifier.
The automatic high-intensity light is incident on the photomultiplier tube in accordance with an automatic
pressure change photomultiplier tube, in order to meet the requirement for measuring the colored sample
with lower transmittance.
If the analyzer deviates from orthogonal position of the polarized plane where the light reaches, the light
goes through the alternating light intensity signal with frequency f, and through the photomultiplier tube, it
is converted into an electrical signal with frequency f. According to figure 1, if the sample is left-handed, in
the position of D, the microcontroller controls the stepper motor, turns the analyzer from left to right, and
generates a pulse signal when passing the orthogonal position. After overshoot, the microcontroller
controls the stepper motor and rotates the detector from right to left. When the orthogonal position is
passed, it will also generate a pulse signal. The microcontroller also writes down the angle signal at this
time. After repeated "zero crossing trigger", the angle of the record is averaged, and the optical rotation of
the sample can be accurately measured.
The instrument has a temperature controller which can control the sample temperature. When the
temperature control is required, the temperature-type optical tube should be used. While sending the
actual temperature which is measured by the platinum resistance to the optical tube actual MCU side of
the LCD displaying the temperature value, at the same time, sending a signal to the temperature control
circuit, which controls the semiconductor cooling or heating, and make the temperature of the optical tube
is maintained around the set value. Whether to control temperature or not, it can operate keys on the LCD
display screen at any time.
7
IV.Operation Instructions
4.1 Working Conditions
1 The instrument should be installed on a stable work station, free of vibration. The instrument shall be
10cm away from the wall in all directions, in order to ensure effective heat dissipation.
2 The instrument should be kept in dry environment, free from moisture and corrosive gas. Make sure to
operate the instrument under the environment of 20℃.
3 The instrument uses 220V/50Hz AC power supply (AC electronic voltage regulator shall be used if the
power supply is instable). Get the power plug into an outlet and ensure safe grounding.
4.2 Settings and Keys
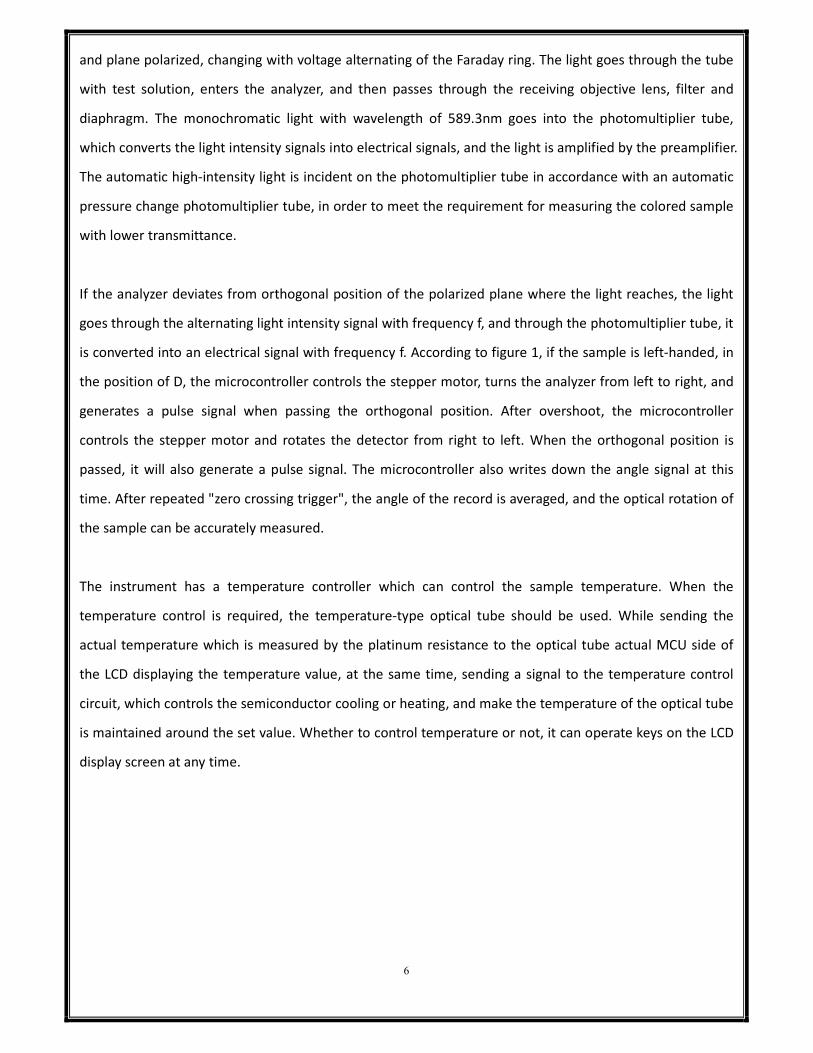
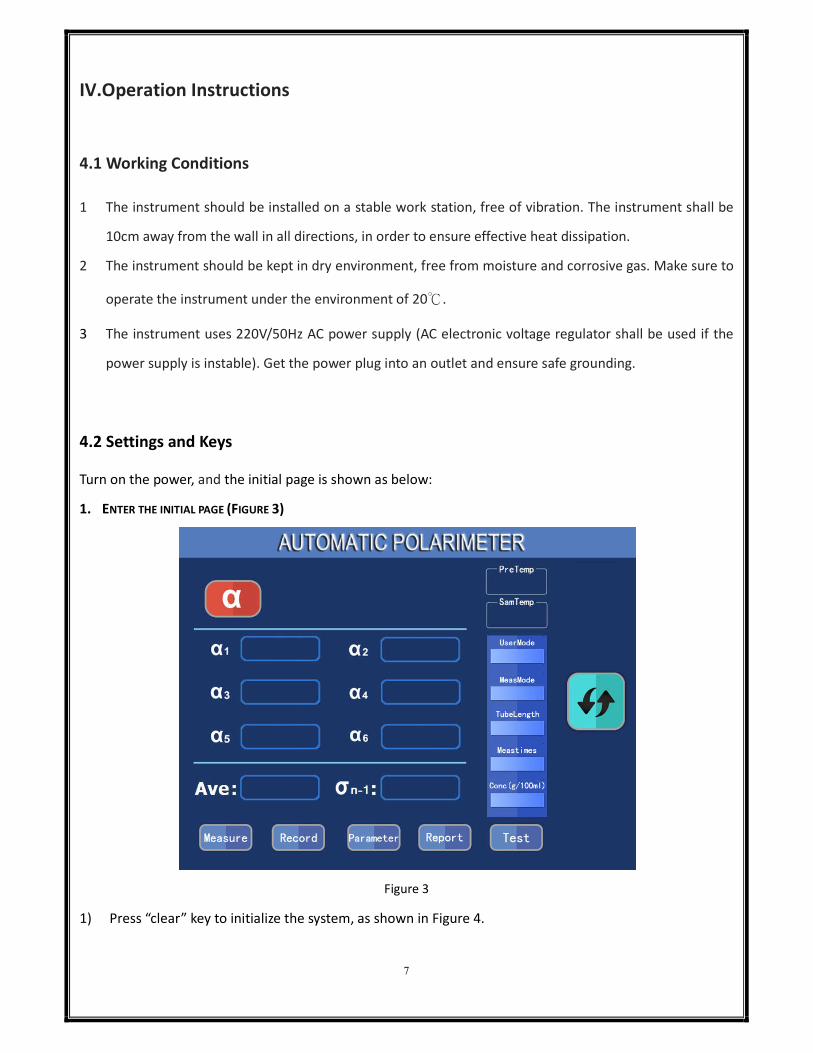
Turn on the power, and the initial page is shown as below:
1. ENTER THE INITIAL PAGE (FIGURE 3)
Figure 3
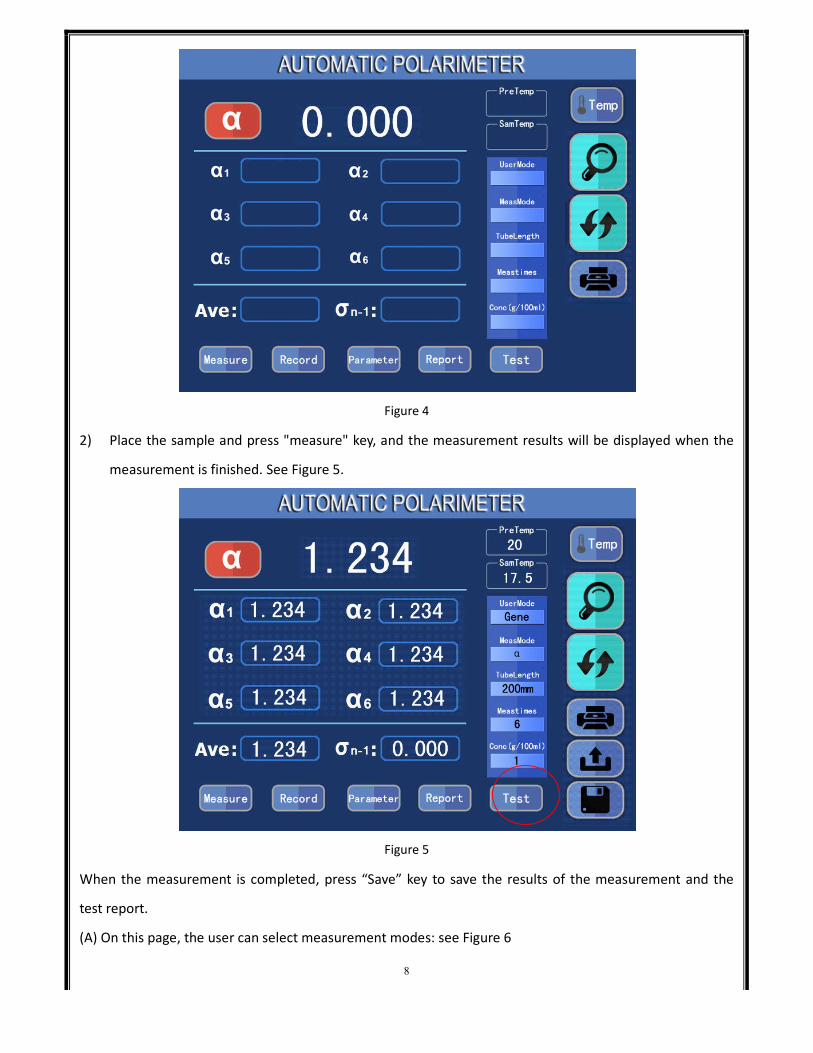
1) Press “clear” key to initialize the system, as shown in Figure 4.
8
Figure 4
2) Place the sample and press "measure" key, and the measurement results will be displayed when the
measurement is finished. See Figure 5.
Figure 5
When the measurement is completed, press “Save” key to save the results of the measurement and the
test report.
(A) On this page, the user can select measurement modes: see Figure 6
9
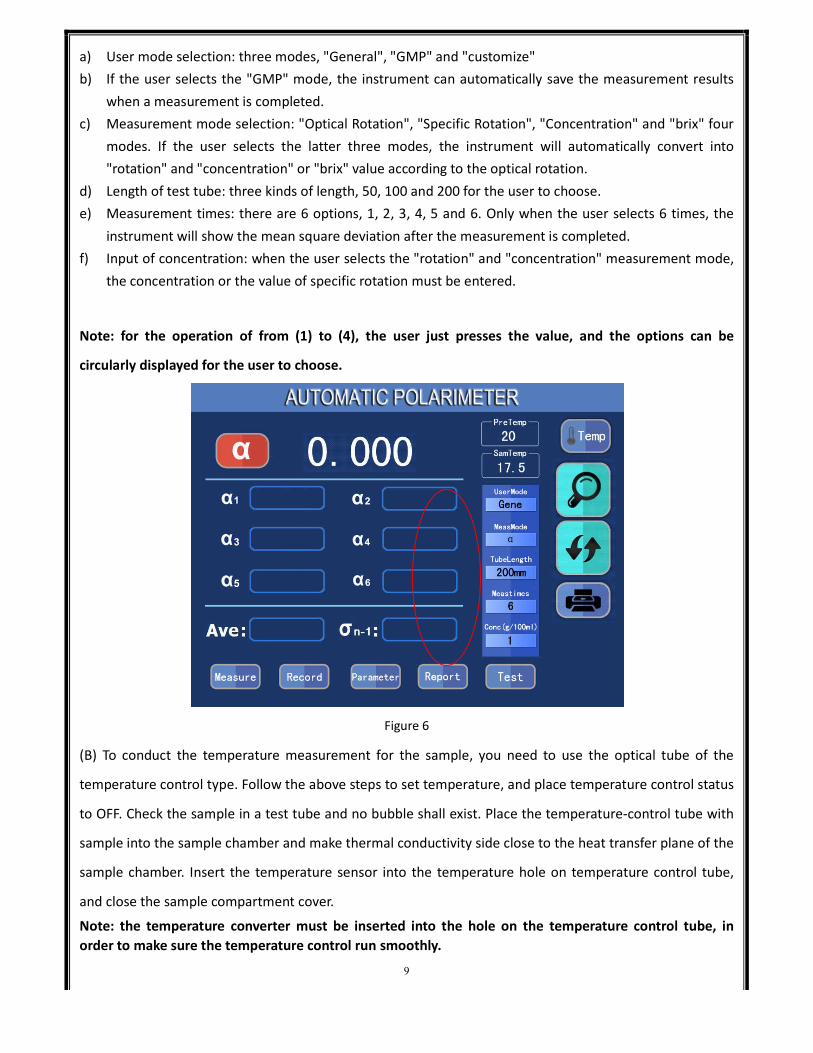
a) User mode selection: three modes, "General", "GMP" and "customize"
b) If the user selects the "GMP" mode, the instrument can automatically save the measurement results
when a measurement is completed.
c) Measurement mode selection: "Optical Rotation", "Specific Rotation", "Concentration" and "brix" four
modes. If the user selects the latter three modes, the instrument will automatically convert into
"rotation" and "concentration" or "brix" value according to the optical rotation.
d) Length of test tube: three kinds of length, 50, 100 and 200 for the user to choose.
e) Measurement times: there are 6 options, 1, 2, 3, 4, 5 and 6. Only when the user selects 6 times, the
instrument will show the mean square deviation after the measurement is completed.
f) Input of concentration: when the user selects the "rotation" and "concentration" measurement mode,
the concentration or the value of specific rotation must be entered.
Note: for the operation of from (1) to (4), the user just presses the value, and the options can be
circularly displayed for the user to choose.
Figure 6
(B) To conduct the temperature measurement for the sample, you need to use the optical tube of the
temperature control type. Follow the above steps to set temperature, and place temperature control status
to OFF. Check the sample in a test tube and no bubble shall exist. Place the temperature-control tube with
sample into the sample chamber and make thermal conductivity side close to the heat transfer plane of the
sample chamber. Insert the temperature sensor into the temperature hole on temperature control tube,
and close the sample compartment cover.
Note: the temperature converter must be inserted into the hole on the temperature control tube, in
order to make sure the temperature control run smoothly.
10
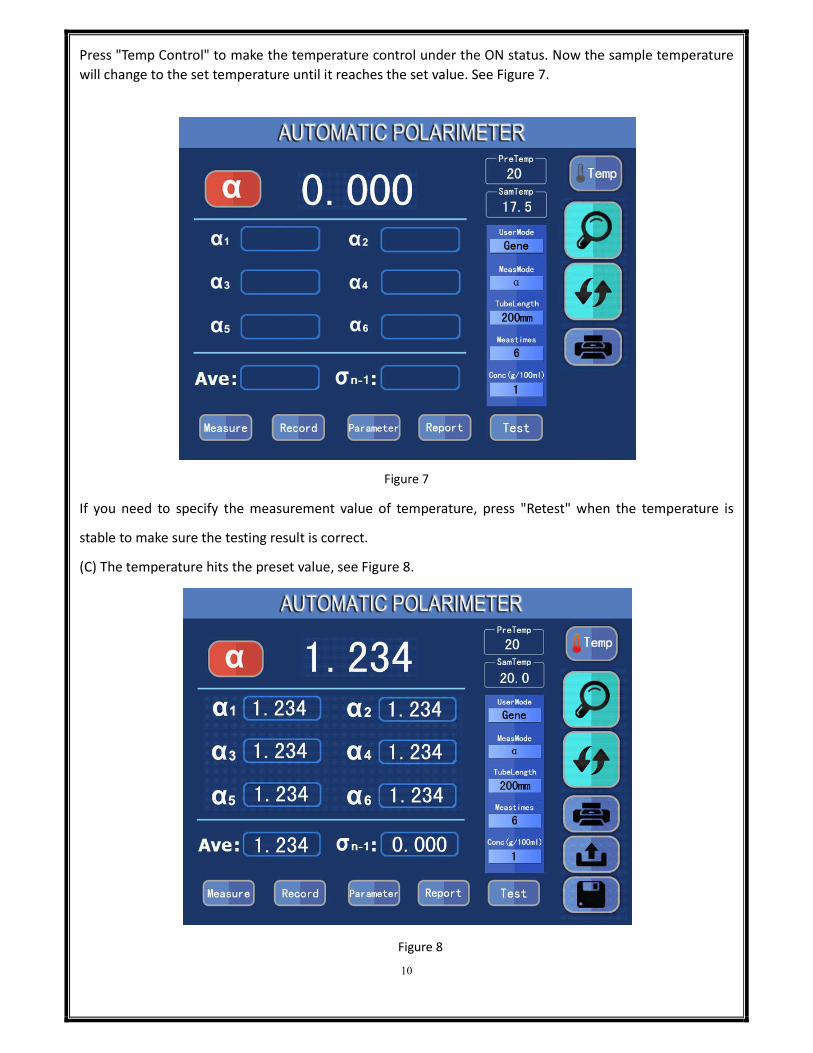
Press "Temp Control" to make the temperature control under the ON status. Now the sample temperature
will change to the set temperature until it reaches the set value. See Figure 7.
Figure 7
If you need to specify the measurement value of temperature, press "Retest" when the temperature is
stable to make sure the testing result is correct.
(C) The temperature hits the preset value, see Figure 8.
Figure 8
11
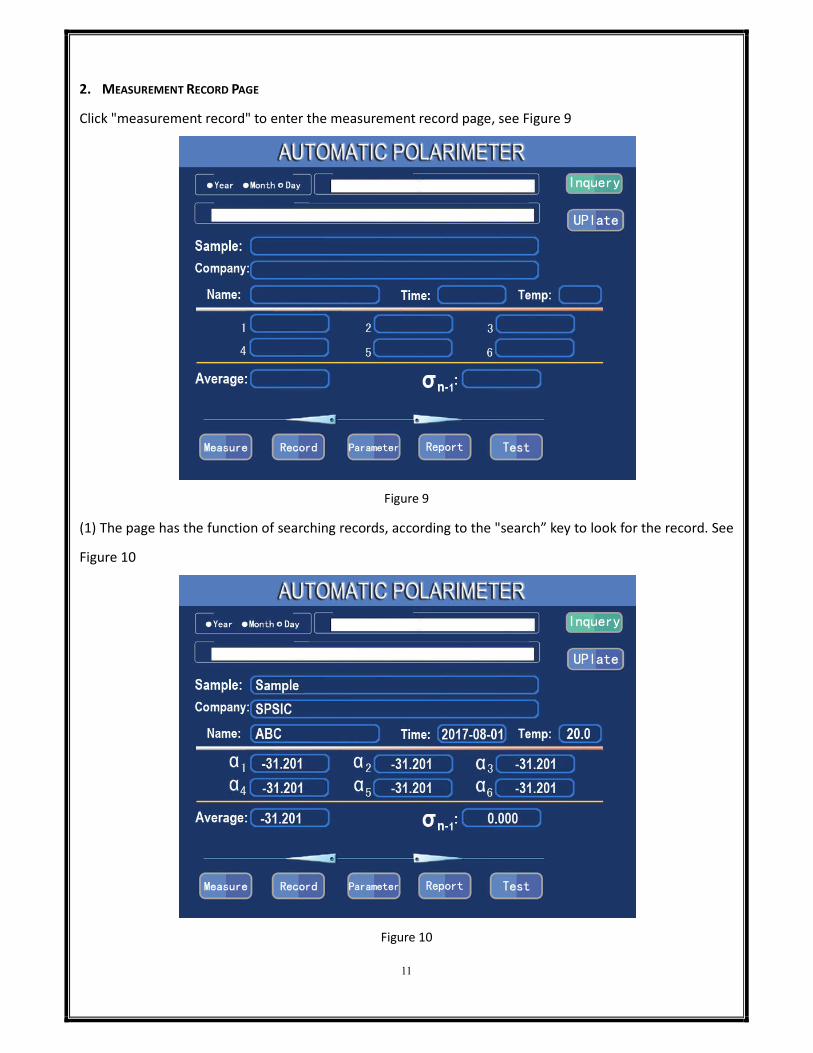
2. MEASUREMENT RECORD PAGE
Click "measurement record" to enter the measurement record page, see Figure 9
Figure 9
(1) The page has the function of searching records, according to the "search” key to look for the record. See
Figure 10
Figure 10
12
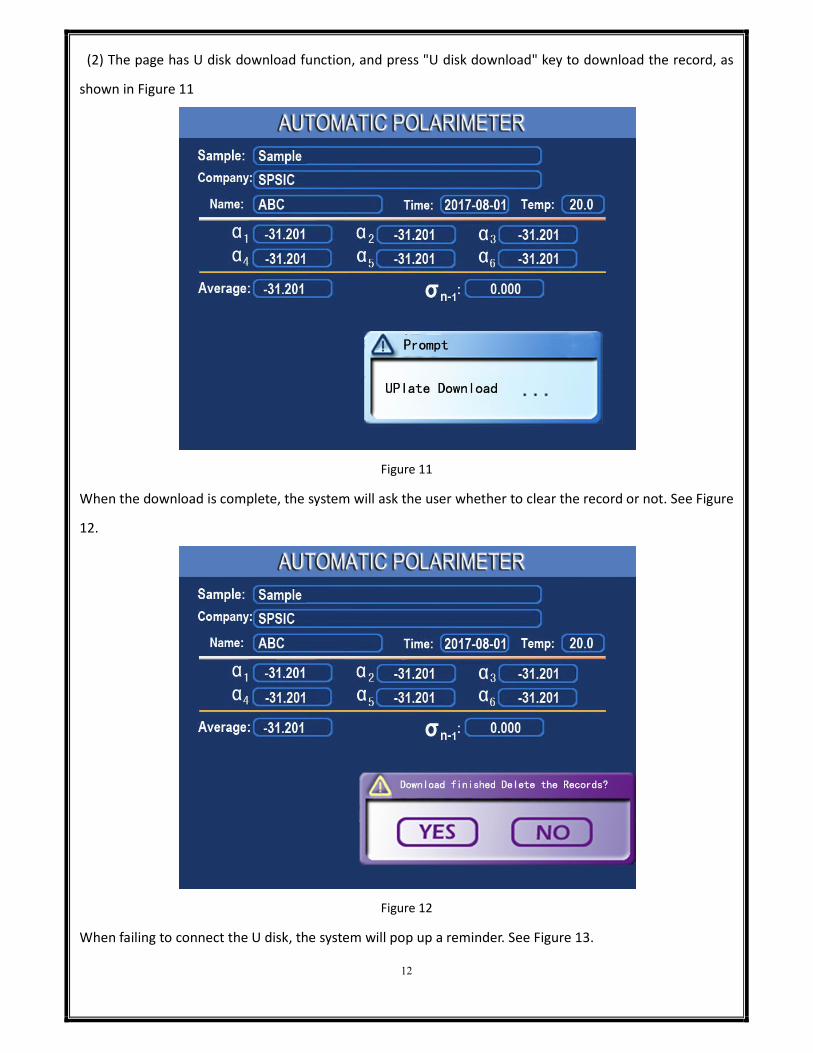
(2) The page has U disk download function, and press "U disk download" key to download the record, as
shown in Figure 11
Figure 11
When the download is complete, the system will ask the user whether to clear the record or not. See Figure
12.
Figure 12
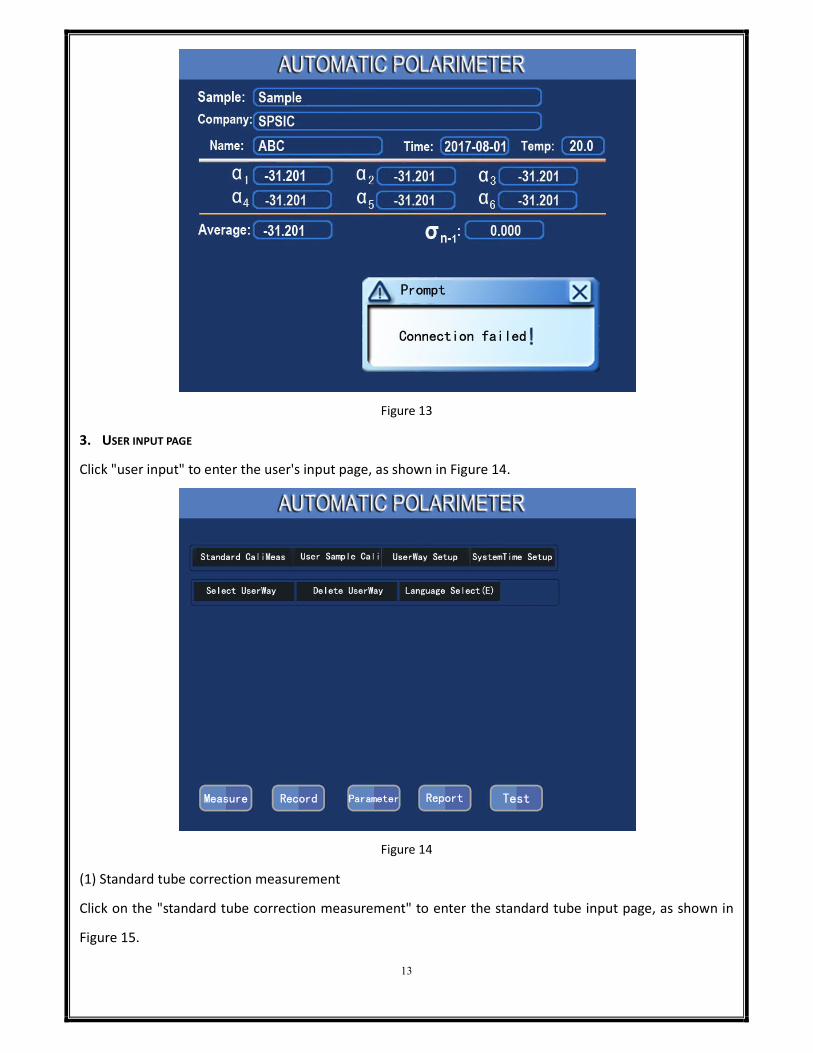
When failing to connect the U disk, the system will pop up a reminder. See Figure 13.
13
Figure 13
3. USER INPUT PAGE
Click "user input" to enter the user's input page, as shown in Figure 14.
Figure 14
(1) Standard tube correction measurement
Click on the "standard tube correction measurement" to enter the standard tube input page, as shown in
Figure 15.
14
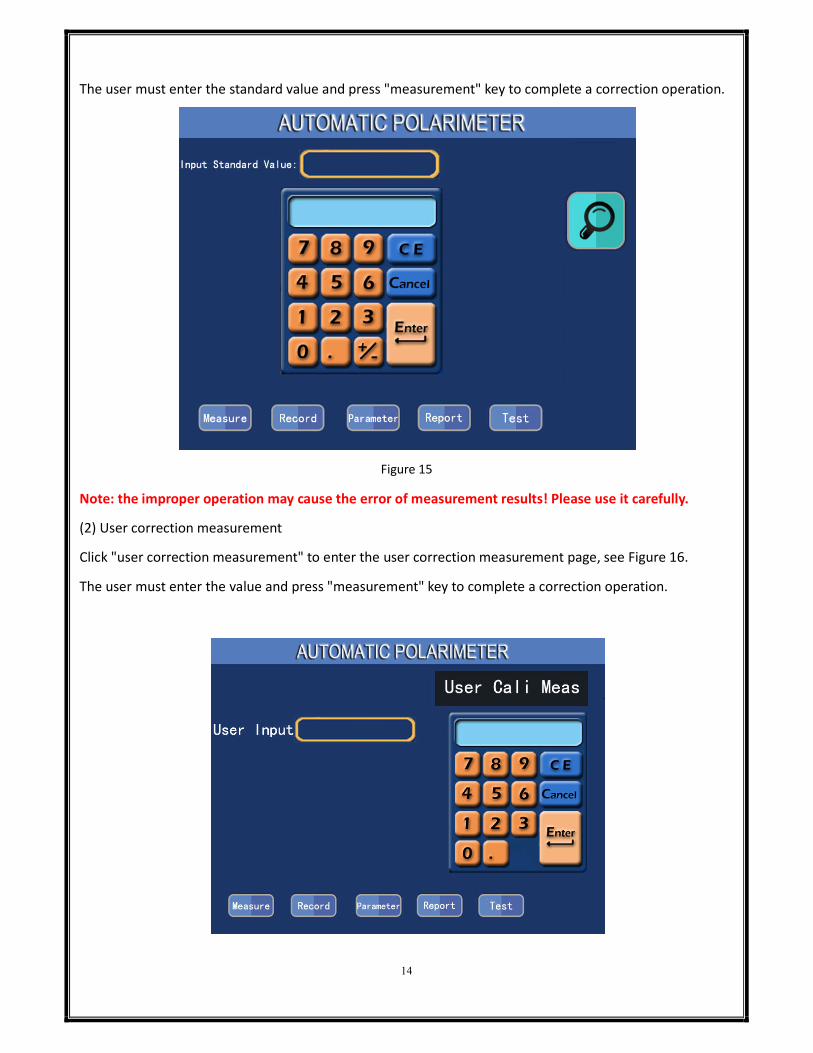
The user must enter the standard value and press "measurement" key to complete a correction operation.
Figure 15
Note: the improper operation may cause the error of measurement results! Please use it carefully.
(2) User correction measurement
Click "user correction measurement" to enter the user correction measurement page, see Figure 16.
The user must enter the value and press "measurement" key to complete a correction operation.
15
Figure 16
Note: user customized correction parameters are valid only when the user mode selects "custom".
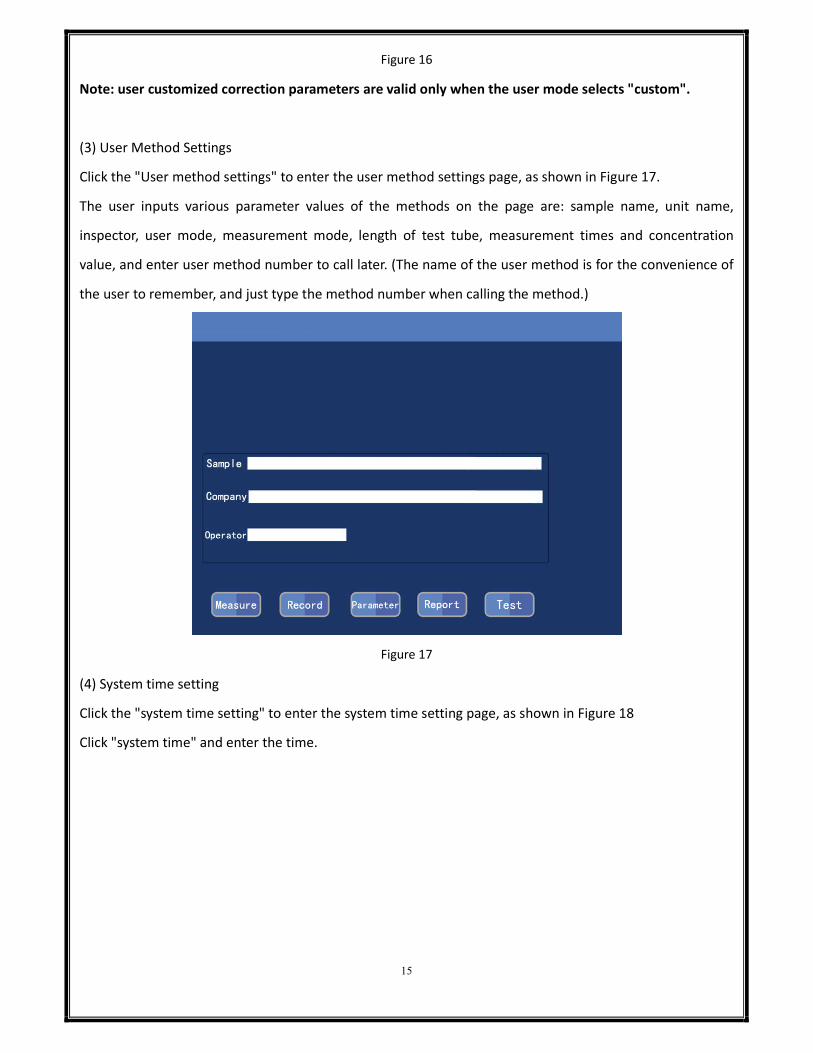
(3) User Method Settings
Click the "User method settings" to enter the user method settings page, as shown in Figure 17.
The user inputs various parameter values of the methods on the page are: sample name, unit name,
inspector, user mode, measurement mode, length of test tube, measurement times and concentration
value, and enter user method number to call later. (The name of the user method is for the convenience of
the user to remember, and just type the method number when calling the method.)
Figure 17
(4) System time setting
Click the "system time setting" to enter the system time setting page, as shown in Figure 18
Click "system time" and enter the time.
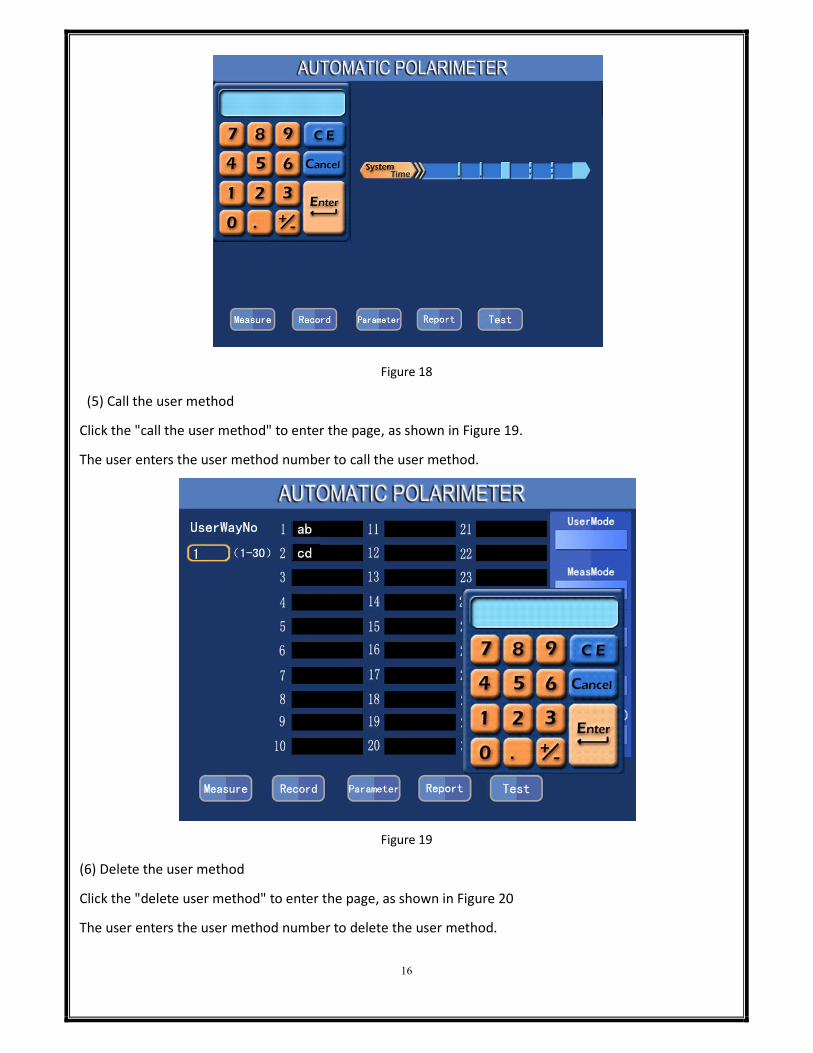
16
Figure 18
(5) Call the user method
Click the "call the user method" to enter the page, as shown in Figure 19.
The user enters the user method number to call the user method.
Figure 19
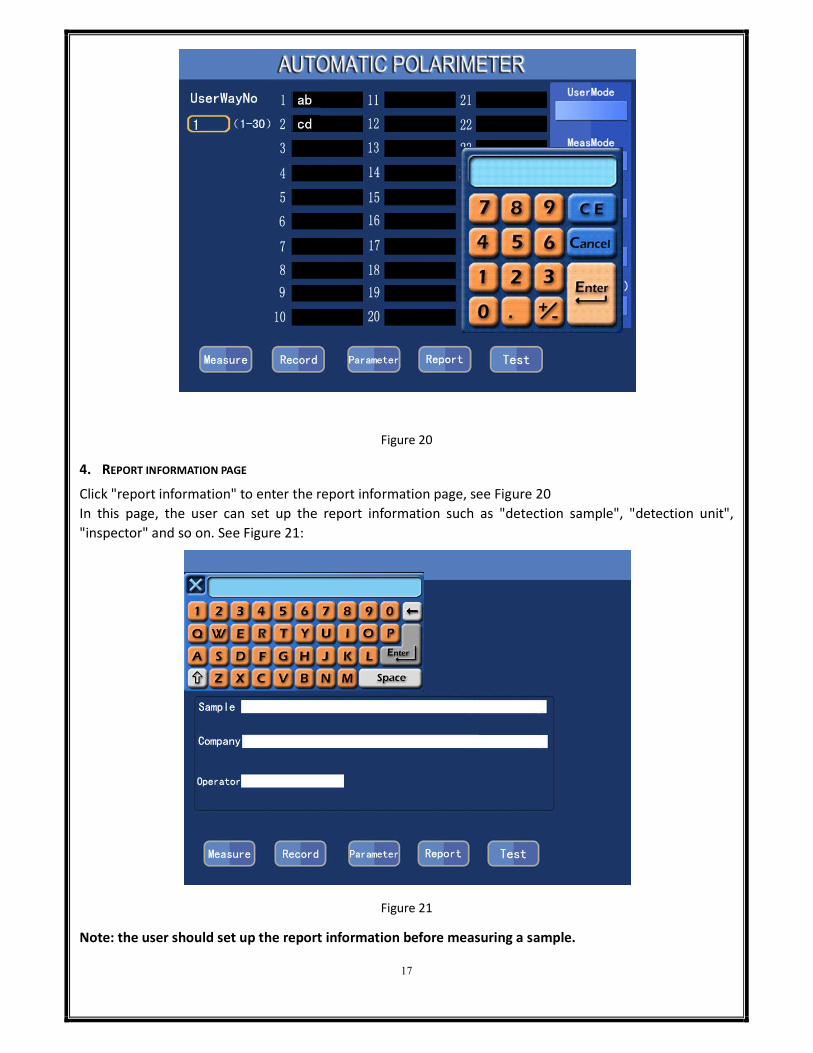
(6) Delete the user method
Click the "delete user method" to enter the page, as shown in Figure 20
The user enters the user method number to delete the user method.
17
Figure 20
4. REPORT INFORMATION PAGE
Click "report information" to enter the report information page, see Figure 20
In this page, the user can set up the report information such as "detection sample", "detection unit",
"inspector" and so on. See Figure 21:
Figure 21
Note: the user should set up the report information before measuring a sample.
18
V. Maintenance and Check
5.1 Instrument Maintenance
The instrument should be placed in a dry place, away from corrosive gases, and free of severe vibration.
After using for a period of time, due to the influence of the external environment, the surface of the optical
system may gather dust or mildew, which will affect the performance. It can be cleaned gently with a small
cotton stick dipped with the butyl acetate or ethanol.
If there is some moldy, after it has been wiped with cotton dipped in alcohol, then with a small amount of
cerium oxide (Pink) or calcium carbonate, wipe it again gently. Don't disassemble the optical parts. Once
the optical component is disassembled, it will destroy the original light path, which must be re-adjusted.
Otherwise the instrument performance will be affected or couldn't work anymore. If any optical
component must be removed for replacement, it should be sent to our factory to handle.
5.2 Check the Optical Path
Place a wafer with outer diameter of φ30mm at the outlet of test beam in the sample tank. In the dark
room, the user can see the spot which was projected from the test beam on the wafer. The spot should be
circular and almost share the same center point. If the spot is perceived obviously not round, or
significantly deviates from the center, it will affect the performance of the instrument, and should be sent
to our factory to deal with.
19
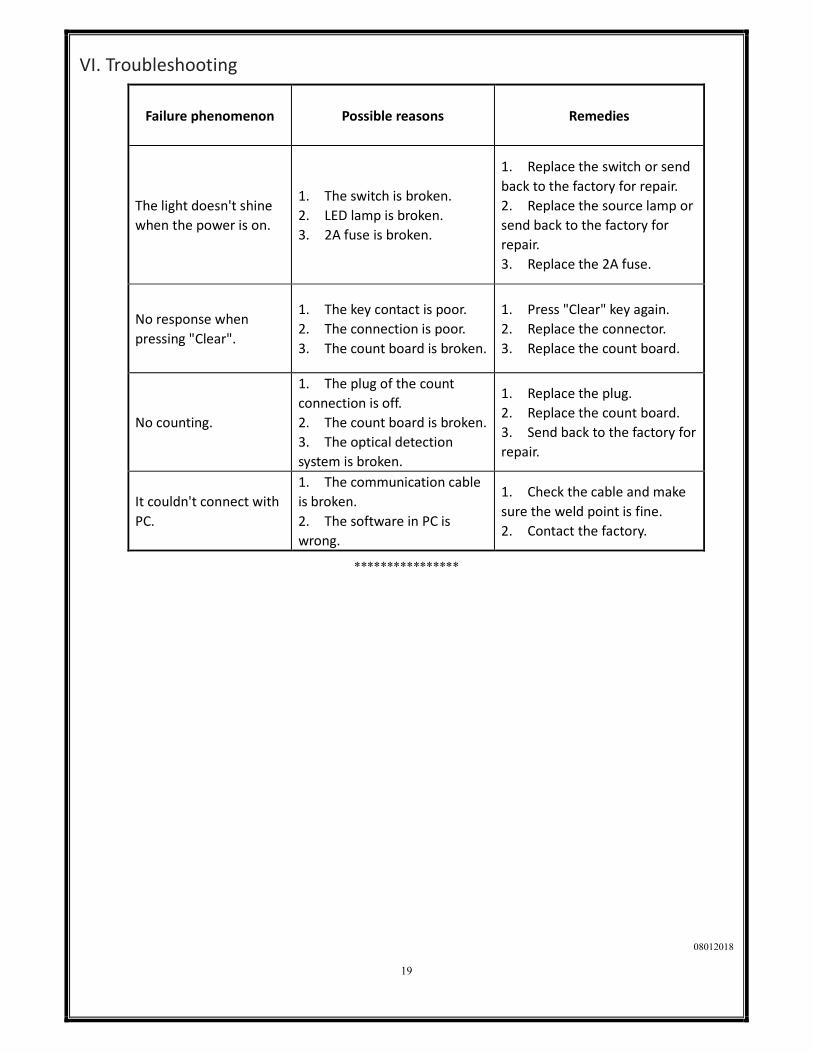
VI. Troubleshooting
Failure phenomenon Possible reasons Remedies
The light doesn't shine
when the power is on.
1. The switch is broken.
2. LED lamp is broken.
3. 2A fuse is broken.
1. Replace the switch or send
back to the factory for repair.
2. Replace the source lamp or
send back to the factory for
repair.
3. Replace the 2A fuse.
No response when
pressing "Clear".
1. The key contact is poor.
2. The connection is poor.
3. The count board is broken.
1. Press "Clear" key again.
2. Replace the connector.
3. Replace the count board.
No counting.
1. The plug of the count
connection is off.
2. The count board is broken.
3. The optical detection
system is broken.
1. Replace the plug.
2. Replace the count board.
3. Send back to the factory for
repair.
It couldn't connect with
PC.
1. The communication cable
is broken.
2. The software in PC is
wrong.
1. Check the cable and make
sure the weld point is fine.
2. Contact the factory.
****************
08012018