Embed Size (px)
Citation preview
Automatic Liquid Nitrogen Filling SystemSamuel J. Moss and William T. K. Johnson Citation: Review of Scientific Instruments 35, 909 (1964); doi: 10.1063/1.1746868 View online: http://dx.doi.org/10.1063/1.1746868 View Table of Contents: http://scitation.aip.org/content/aip/journal/rsi/35/7?ver=pdfcov Published by the AIP Publishing Articles you may be interested in An automatic liquid-nitrogen filling system for multiple Ge detectors Rev. Sci. Instrum. 80, 016102 (2009); 10.1063/1.3059684 An inexpensive alternate to levelsensing automatic filling systems for liquid nitrogen Rev. Sci. Instrum. 54, 1421 (1983); 10.1063/1.1137238 An Inexpensive Automatic Liquid Nitrogen Level Control System Using an Integrated Circuit J. Vac. Sci. Technol. 8, 424 (1971); 10.1116/1.1314477 An Automatic LiquidNitrogen Dispenser Rev. Sci. Instrum. 23, 446 (1952); 10.1063/1.1746356 Automatic Level Controller for Liquid Nitrogen Rev. Sci. Instrum. 21, 400 (1950); 10.1063/1.1745599
This article is copyrighted as indicated in the article. Reuse of AIP content is subject to the terms at: http://scitationnew.aip.org/termsconditions. Downloaded to IP:
130.113.86.233 On: Wed, 17 Dec 2014 21:20:19
NOTES 909
T 2= -180°C, and pg= 10-8 Torr, the error due to radiation pressure is 70%.
It is to be noted that radiation pressure produces a constant bias, independent of gas pressure, and does not affect linearity. Since the magnitude of the bias is very small at gas pressures of 10-5 Torr or larger, calibration of a Knudsen gauge against a McLeod gauge will not provide any indication of the magnitude of the error due to radiation pressure when measuring lower gas pressures.
The relevance of the above is considered to be twofold:
(1) A Knudsen gauge is sometimes used as an absolute pressure gauge. For this to be valid at gas pressures 10-5
Torr and lower, the calculation of the gauge constant must also include the radiation pressure bias, and this will require a knowledge of radiative surface characteristics.
(2) To extend the use of a Knudsen gauge to low gas pressures requires increasing the temperature differential so as to obtain a measurable deflection. As shown in Fig. 2, increasing Tl for a given T2 increases the error. Thus, assuming that other difficulties of construction and measurement are overcome, radiation pressure bias becomes a dominant operational consideration in the use of Knudsen gauges for the measurement of gas pressures of 10-6 Torr and lower.
* This work is part of an Absolute Pressure Gauge Feasibility Study conducted under contract NAS5-3212 from the NASA Goddard Space Flight Center.
1 Micro-Erg Laboratories Inc., Report No. C63-01, "Absolute Pressure Gauge Feasibility Study," final report under contract NAS5-3212 (June 1963).
2 S. Dushman, Scientific Foundations oj Vacuum Technique (John Wiley & Sons, Inc., New York, 1962), 2nd ed., p. 275.
Automatic Liquid Nitrogen Filling System SAMUEL J. Moss* AND WILLIAM T. K. JOHNsONt
Harry Diamond Laboratories, Washington, D. C.
(Received 19 September 1963; and in final form, 27 February 1964)
THE device described is an automatic filling apparatus for liquid nitrogen, controlled by a two-arm resis
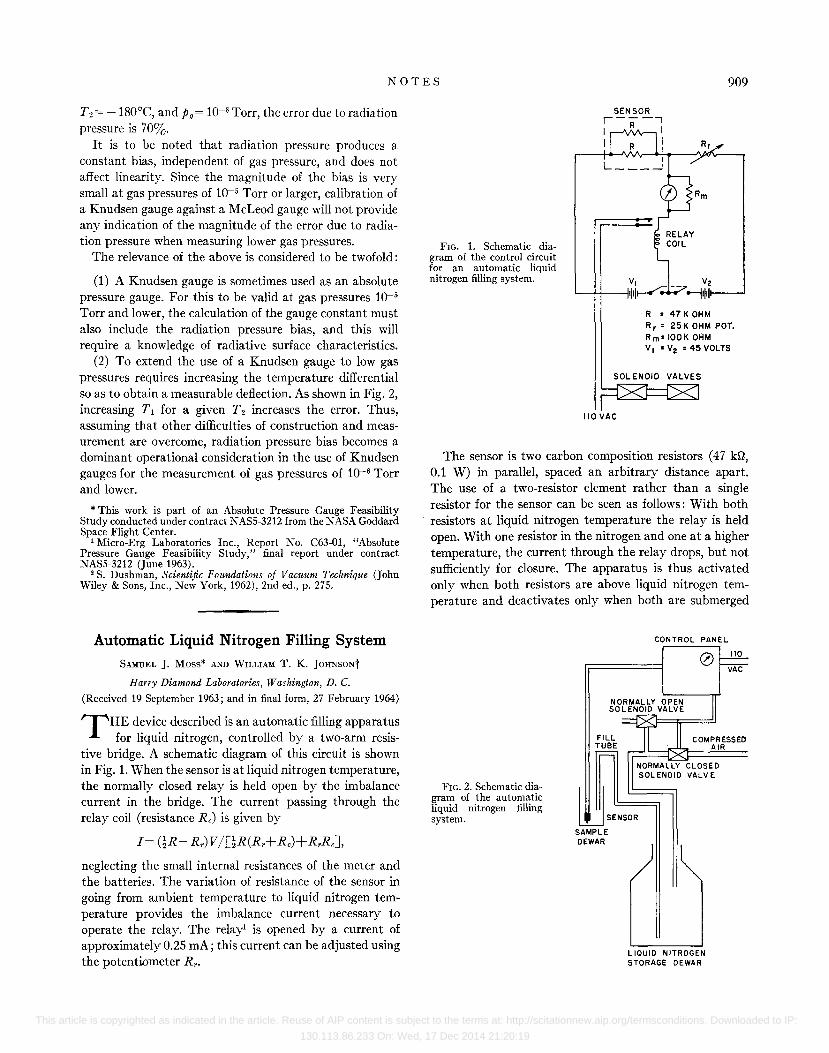
tive bridge. A schematic diagram of this circuit is shown in Fig. 1. When the sensor is at liquid nitrogen temperature, the normally closed relay is held open by the imbalance current in the bridge. The current passing through the relay coil (resistance Rc) is given by
neglecting the small internal resistances of the meter and the batteries. The variation of resistance of the sensor in going from ambient temperature to liquid nitrogen temperature provides the imbalance current necessary to operate the relay. The relay! is opened by a current of approximately 0.25 rnA; this current can be adjusted using the potentiometer Rr •
FIG. 1. Schematic diagram of the control circuit for an automatic liquid nitrogen filling system.
SENSOR r---"" I R I I I
R = 47KOHM
Rr = 25K OHM POT.
Rm= lOOK OHM
VI =V2 = 45 VOLTS
SOL ENOID VALVES
110 VAC
The sensor is two carbon composition resistors (47 kQ, 0.1 W) in parallel, spaced an arbitrary distance apart. The use of a two-resistor element rather than a single resistor for the sensor can be seen as follows: With both resistors at liquid nitrogen temperature the relay is held open. With one resistor in the nitrogen and one at a higher temperature, the current through the relay drops, but not sufficiently for closure. The apparatus is thus activated only when both resistors are above liquid nitrogen temperature and deactivates only when both are submerged
FIG. 2. Schematic diagram of the automatic liquid nitrogen filling system.
CONTROL PANEL
~SENSOR SAMPLE DEWAR
o
LIQUID NITROGEN STORAGE DEWAR
110
VAC
This article is copyrighted as indicated in the article. Reuse of AIP content is subject to the terms at: http://scitationnew.aip.org/termsconditions. Downloaded to IP:
130.113.86.233 On: Wed, 17 Dec 2014 21:20:19
910 KOTES
in the coolant; thus the system does not hunt about a single level. The spacing of the elements is dictated by the accuracy to which the liquid nitrogen level must be controlled.
Figure 2 is a schematic diagram of the automatic filling system. When the relay closes, compressed air is allowed to flow into the storage Dewar, forcing liquid into the sample holder. The solenoid valves return to their normal positions when the desired coolant level is reached. The normally open valve allows the excess pressure in the storage Dewar to be bled off, preventing overflow of the sample Dewar.
If the sensor IS either shorted or opened, causing an imbalance in the bridge, the current will increase to approximately 1 mAo If the meter opens, the current will be maintained at approximately 0.2 rnA by the shunt resistor Rm. These features make the system fail-safe for either a faulty sensor or meter, since the current required to hold open the relay and prevent liquid nitrogen from being pumped is only 0.15 mA, a current which a standard size 45-V battery can maintain for several months.
* Present address: Johns Hopkins University, Applied Physics Laboratory, Silver Spring, Maryland.
t Present address: Department of Physics, American University, Washington, D. C.
1 Model SVIC 40000 26.5 VDC, Advance Relay and Electric Company.
Reduction of Warm-Up Rate within a Dewar System by Helium Desorption
PETER. D. GIANINO
Air Force Cambridge Research Laboratories, Office of Aerospace Research, L. C. II anscom Field, Bedford, M assach~tsetts
(Received 9 December 1963; and in final form, 9 March 1964)
DURING a recent experimental study it became necessary to reduce the time rate of change of temperature
within a conventional-sized glass double Dewar system over the interval 4.2-77°K in order to allow time for a multitude of measurements within a small temperature interval. After the liquid helium boils out of the inner Dewar, its temperature increases from 4.2 to 77°K in 1-1! h. This warm-up rate is too rapid for our experiments. A test showed that the rate of heat penetrating the inner Dewar was approximately 32 caljh when almost all of the liquid helium was gone.
If a small amount of activated charcoal (6-14 mesh) is placed in the bottom of the inner Dewar, its warm-up rate will be reduced from 60-70oK/h to 5 to lOoK/h. I
Most of the heat leaking in is utilized in desorbing the
?Oc
60-
15,
10
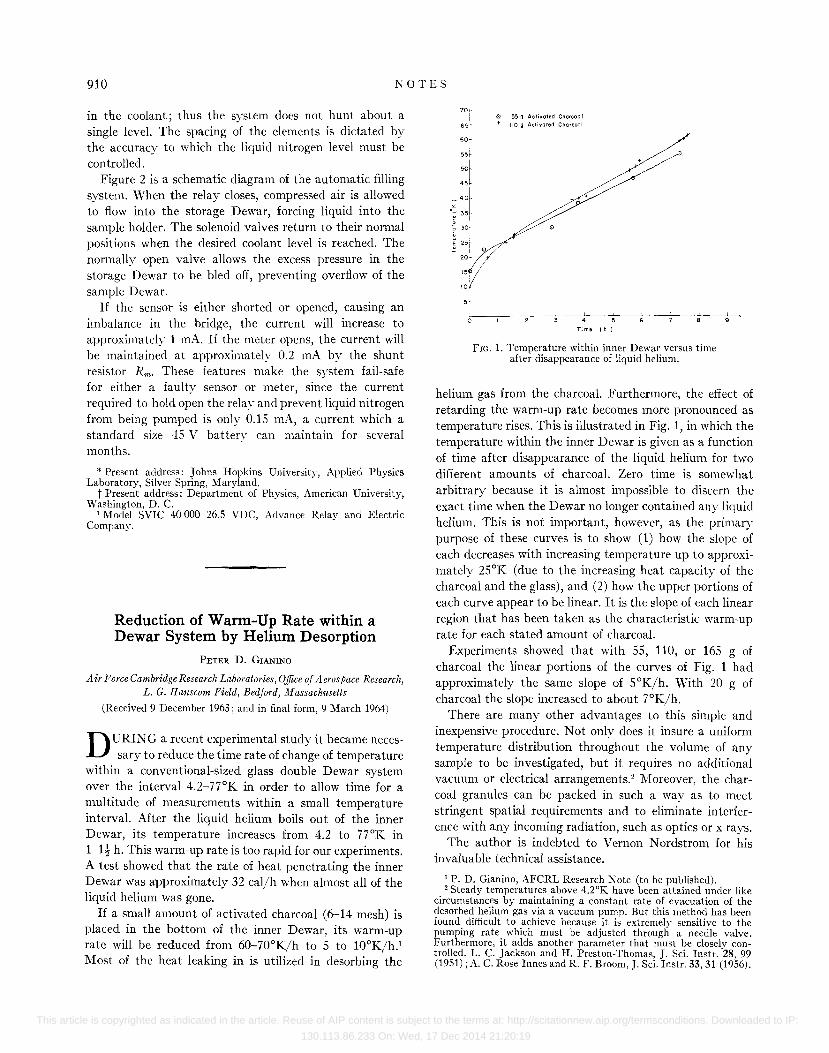
o 55 g Activated Charcoal + 110 ~ Acltvoted Charcoal
~--~---7--~----~5--~----~--~--~-
Time (h J
FiG. 1. Temperature within inner Dewar versus time after disappearance of liquid helium.
helium gas from the charcoal. Furthermore, the effect of retarding the warnl-Up rate becomes more pronounced as temperature rises. This is illustrated in Fig. 1, in which the temperature within the inner Dewar is given as a function of time after disappearance of the liquid helium for two different amounts of charcoal. Zero time is somewhat arbitrary because it is almost impossible to discern the exact time when the Dewar no longer contained any liquid helium. This is not important, however, as the primary purpose of these curves is to show (1) how the slope of each decreases with increasing temperature up to approximately 25°K (due to the increasing heat capacity of the charcoal and the glass), and (2) how the upper portions of each curve appear to be linear. It is the slope of each linear region that has been taken as the characteristic warm-up rate for each stated amount of charcoal.
Experiments showed that with 55, 110, or 165 g of charcoal the linear portions of the curves of Fig. 1 had approximately the same slope of 5°K/h. With 20 g of charcoal the slope increased to about 7°K/h.
There are many other advantages to this simple and inexpensive procedure. Not only does it insure a uniform temperature distribution throughout the volume of any sample to be investigated, but it requires no additional vacuum or electrical arrangements.2 Moreover, the charcoal granules can be packed in such a way as to meet stringent spatial requirements and to eliminate interference with any incoming radiation, such as optics or x rays.
The author is indebted to Vernon Nordstrom for his invaluable technical assistance.
1 P. D. Gianino, AFCRL Research Kote (to be published). 2 Steady temperatures above 4.2°K have been attained under like
circumstances by maintaining a constant rate of evacuation of the des orbed helium gas via a vacuum pump. But this method has been found difficult to achieve because it is extremelv sensitive to the pumping rate which must be adjusted through a needle valve. Furthermore, it adds another parameter that must be closely controlled. L. C. Jackson and H. Preston-Thomas, J. Sci. Instr. 28, 99 (1951); A. C. Rose-Innes and R. F. Broom, J. Sci. Instr. 33, 31 (1956).
This article is copyrighted as indicated in the article. Reuse of AIP content is subject to the terms at: http://scitationnew.aip.org/termsconditions. Downloaded to IP:
130.113.86.233 On: Wed, 17 Dec 2014 21:20:19