Embed Size (px)
Citation preview
DATA FUSION FOR MULTI-SCALE COLOUR 3D SATELLITE IMAGE GENERATION AND GLOBAL 3D VISUALIZATION
Yun Zhang, Pingping Xie, and Hui Li
Department of Geodesy and Geomatics Engineering, University of New Brunswick Fredericton, New Brunswick, Canada E3B 5A3
Email: [email protected]
Commission VII
ABSTRACT: This paper presents an automatic system for generating multi-scale colour 3D satellite images and dynamic visualization of 3D images through the Internet. Medium-resolution satellite images such as Landsat 7 and high-resolution satellite images such as Ikonos or QuickBird are the data sources for the multi-scale 3D images. New image fusion, colour enhancement and stereoscopy algorithms are developed for the generation of multi-scale colour 3D satellite images. Latest Internet technologies are integrated into the system for fast and dynamic visualization of colour 3D images at different scales. The concept of the 3D satellite image generation and the on-line dynamic visualization are presented. Since Landsat imagery has a global coverage and the Ikonos and QuickBird images can be acquired quickly for the areas of interest, the generation and on-line visualization of global colour 3D satellite images at different scales is possible with this new system. Different 3D objects on the Earth’s surface from mountain ranges, such as Rocky Mountains, to individual family houses and trees can be dynamically visualized and analyzed through the Internet across the world. This new system has a great potential to upgrade the state-of-the-art on-line mapping technologies such as Goolge Maps and/or MapQuest for global colour 3D satellite image visualization. KEY WORDS: Colour 3D generation, multi-scale satellite imagery, data fusion, global visualization, Internet.
1. INTRODUCTION Three-dimensional (3D) information of the Earth’s surface is important for a variety of geo-related applications. Colour 3D images can provide geo-scientists, environment planners, engineers, mapping experts and military officers with easy-to-understand colour images and useful height information, which make the interpretation of the environment of the areas of interest more efficient and more accurate. Such colour 3D images are, sometimes, crucial for the success of certain applications, which have also great values for daily activities of general public. Currently, a global coverage of Landsat images and digital elevation models (DEMs) has been made available at affordable costs, even free of charge for some areas. High resolution satellite stereo images from QuickBird or Ikonos can be acquired on demand for the areas of interest. Theoretically, the image and 3D information sources for building a global colour 3D image database have been ready. If a new technology can be developed to automatically generate natural colour 3D satellite images at different scales and dynamically visualize the colour 3D images online, the impact of satellite remote sensing on geo-related applications and daily life of general public will be significantly increased. Such a technology has also a great potential to upgrade the state-of-the-art 2D online mapping technologies from Goolge Maps and/or MapQuest for a global visualization of the Earth in colour 3D. This paper briefly introduces a new system for automatic generation of natural colour 3D satellite images of different scales and dynamical visualization of the colour 3D images online. Examples of the developed system are also presented.
2. TECHNICAL COMPOMENTS OF THE NEW 3D SYSTEM
Based on the general concept of Zhang (2002a), an automatic system has been developed to automatically generate colour 3D images and dynamically visualize natural colour 3D images on the Web. The system consists of seven major components:
(1) automatic image fusion to
a. produce 15-m pan-sharpened medium resolution Landsat natural colour images, and
b. produce 0.7-m pan-sharpened high resolution QuickBird (or 1-m Ikonos) natural colour image pairs;
(2) automatic reconstruction of medium resolution stereo image pairs using Landsat natural colour images and digital elevation models (DEMs);
(3) automatic colour enhancement for better colour 3D visualization;
(4) automatic image matching to find corresponding matching points in the stereo pairs;
(5) automatic epipolar image generation and colour 3D satellite image generation;
(6) fast data transfer through the Internet for effective visualization of large volume of 3D satellite images on the client end; and
(7) automatic parallax refinement for effective colour 3D viewing on the client end.
Figure 1 illustrates the general components for the generation of medium resolution Landsat colour 3D images and the online visualization of the 3D images, while Figure 2 shows the general components of the sub-system for the generation of high resolution QuickBird or Ikonos colour 3D images and online visualization. The majority of the components in the two sub-systems are similar, except for the components used to obtain medium resolution stereo image pairs from monoscopic Landsat images, because Landsat does not collect stereo images. 2.1 Automatic image fusion A new automatic image fusion approach has been developed (Zhang, 2002b; Zhang, 2004) and integrated into the automatic system for colour 3D image generation. The fusion technique can automatically panchromatic and multispectral images from Landsat, QuickBird, Ikonos, or any other sensors effectively without losing spatial detail or altering colour information. Figure 3 shows an example of the images before and after the image fusion using the fusion technique developed by Zhang (2002b).

The general concept and results of individual components are described in the following sections.
Figure 1. Flowchart of the generation of medium resolution colour 3D images from monoscopic Landsat images and the
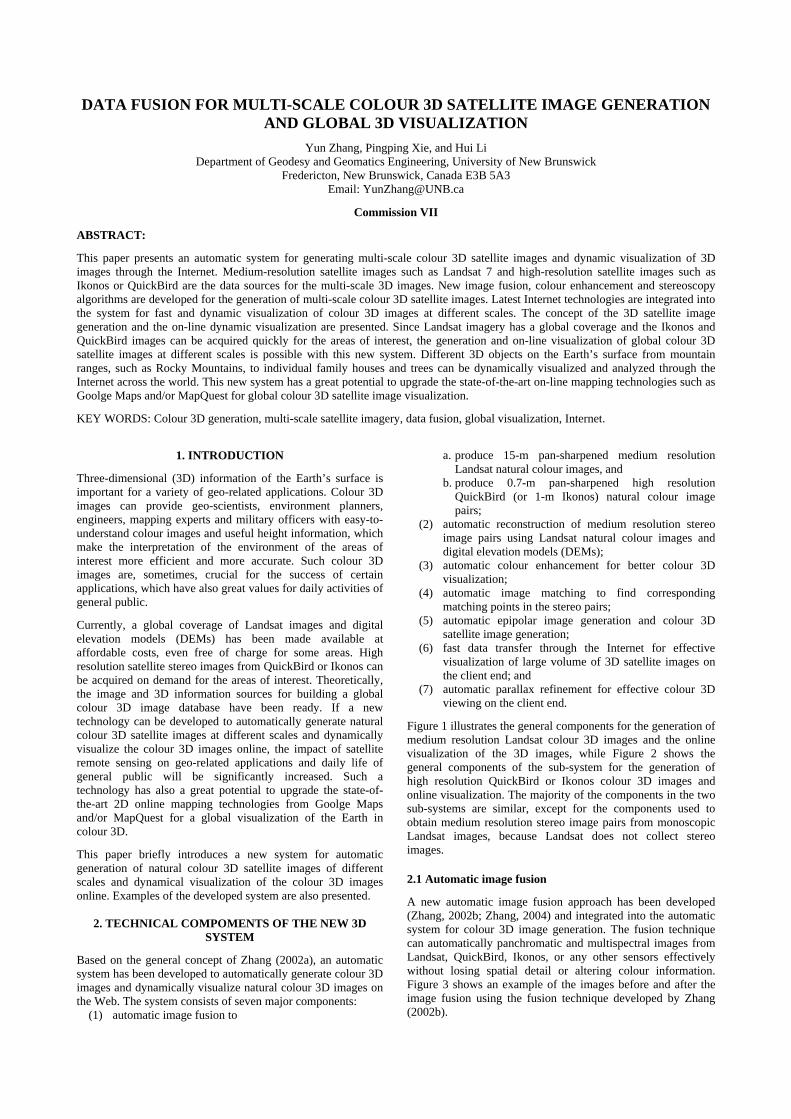
corresponding 3D online visualization 2.2 Automatic stereo image reconstruction To produce medium resolution colour 3D satellite images for global 3D visualization, Landsat imagery is an ideal data
course because of its high quality, global availability, and low cost. However, Landsat series does not collect stereo images and a direct generation of colour 3D images using Landsat imagery is not possible. An alternative solution was found and an automatic software tool was developed to reconstruct colour stereo image pairs according to available monoscopic Landsat images and corresponding DEMs. Figure 4 shows a Landsat image before and after stereo reconstruction.
Pan-sharpened image
Pan MS
Real-time online visualization
Colour 3D image generation
Image fusion
Image matching
Epipolar image generation
Anaglyph image forming
Data source
Stereo image reconstruction
Epipolar image pair
Colour anaglyph image
3D refining, zoom in/out, pan, etc.
Web browser
Java Applet
Stereo image (right)
Stereo image (left)
Image matching points
DEM
MS MS Pan Pan Data source
Figure 2. Flowchart of the generation of high resolution colour 3D
images from QuickBird or Ikonos image pairs and the corresponding 3D online visualization
Figure 3. Automatic image fusion, Ikonos, University of New Brunswick, Canada.
Left: Original panchromatic image (1 m); Center: Original natural colour image (4 m); Right: Fused natural colour image (1 m).
Image fusion
Image matching
Epipolar image generation
Anaglyph image forming
Epipolar image pair
Colour anaglyph image
3D refining, zoom in/out, pan, etc.
Web browser
Java Applet
Pan-sharpened image
Pan-sharpened image
Colour-enhanced image
Colour-enhanced image
Image matching points
Colour enhancement
Colour 3D image generation
Real-time online visualization
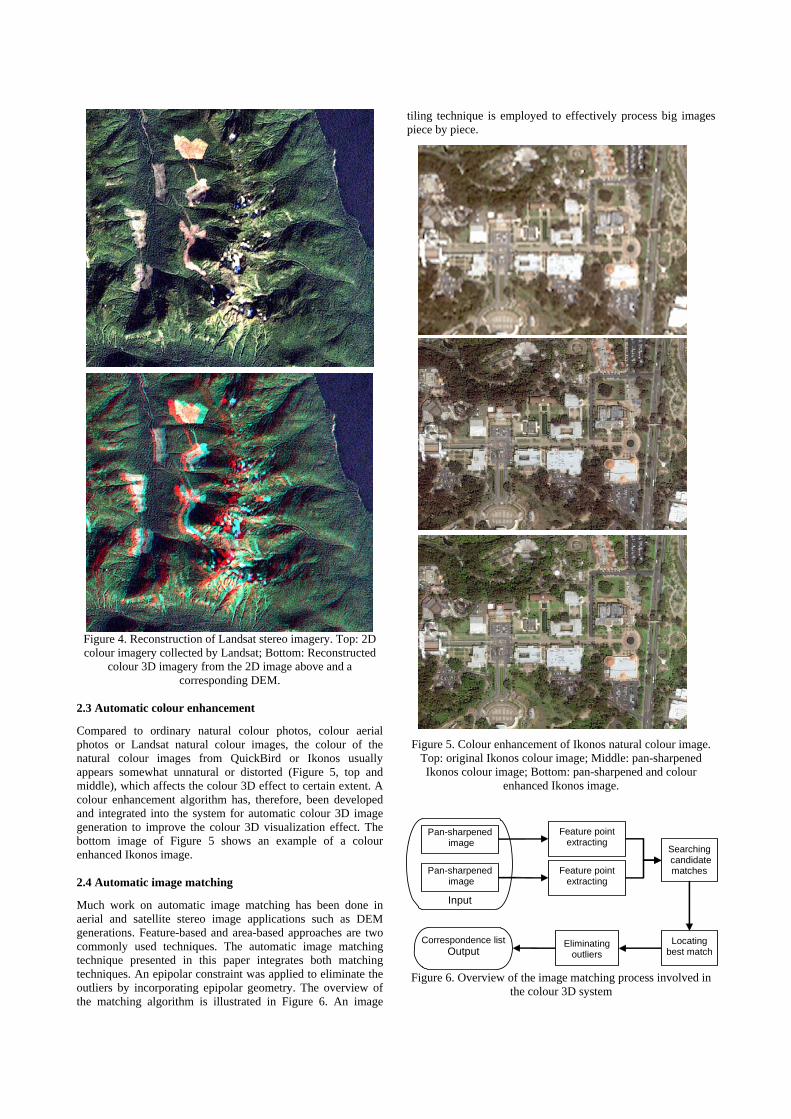
Figure 4. Reconstruction of Landsat stereo imagery. Top: 2D colour imagery collected by Landsat; Bottom: Reconstructed
colour 3D imagery from the 2D image above and a corresponding DEM.
2.3 Automatic colour enhancement Compared to ordinary natural colour photos, colour aerial photos or Landsat natural colour images, the colour of the natural colour images from QuickBird or Ikonos usually appears somewhat unnatural or distorted (Figure 5, top and middle), which affects the colour 3D effect to certain extent. A colour enhancement algorithm has, therefore, been developed and integrated into the system for automatic colour 3D image generation to improve the colour 3D visualization effect. The bottom image of Figure 5 shows an example of a colour enhanced Ikonos image. 2.4 Automatic image matching
Much work on automatic image matching has been done in aerial and satellite stereo image applications such as DEM generations. Feature-based and area-based approaches are two commonly used techniques. The automatic image matching technique presented in this paper integrates both matching techniques. An epipolar constraint was applied to eliminate the outliers by incorporating epipolar geometry. The overview of the matching algorithm is illustrated in Figure 6. An image
tiling technique is employed to effectively process big images piece by piece. Figure 5. Colour enhancement of Ikonos natural colour image.
Top: original Ikonos colour image; Middle: pan-sharpened Ikonos colour image; Bottom: pan-sharpened and colour
enhanced Ikonos image.
Pan-sharpened
image
Pan-sharpened image
Input
Feature point extracting
Feature point extracting
Searching candidate matches
Correspondence listOutput
Eliminating
outliers Locating
best match
Figure 6. Overview of the image matching process involved in the colour 3D system
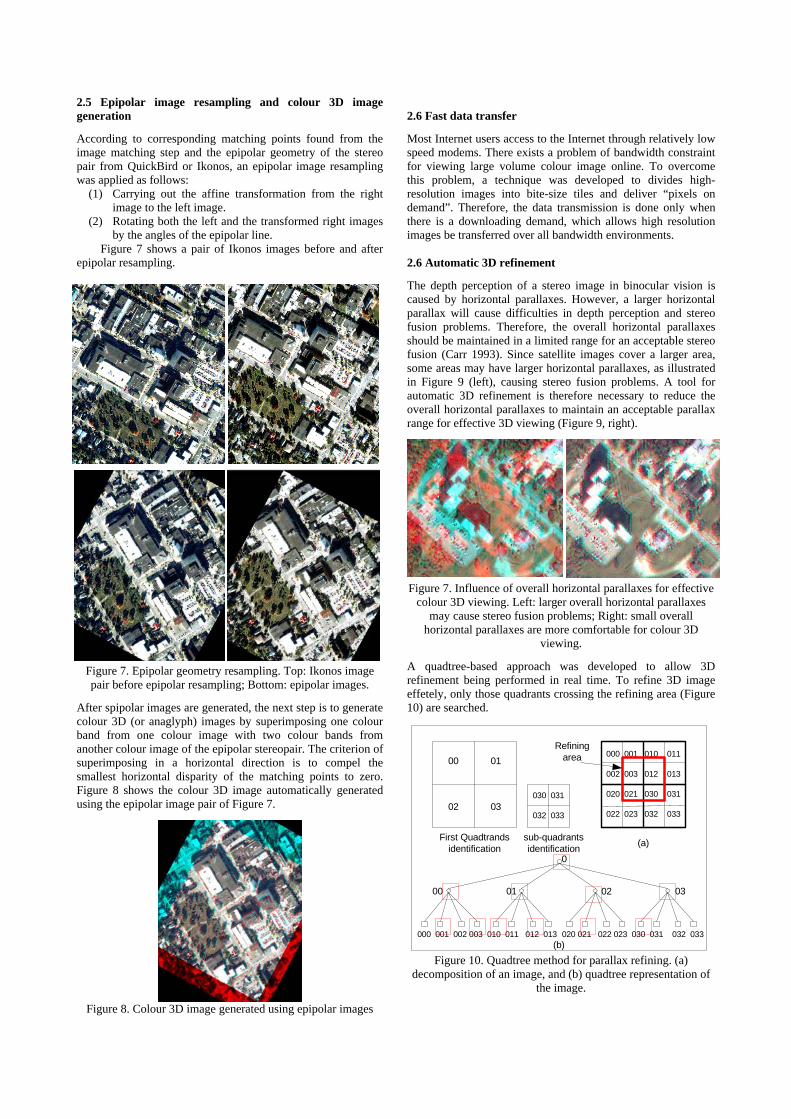
2.5 Epipolar image resampling and colour 3D image generation According to corresponding matching points found from the image matching step and the epipolar geometry of the stereo pair from QuickBird or Ikonos, an epipolar image resampling was applied as follows:
(1) Carrying out the affine transformation from the right image to the left image.
(2) Rotating both the left and the transformed right images by the angles of the epipolar line.
Figure 7 shows a pair of Ikonos images before and after epipolar resampling.
Figure 7. Epipolar geometry resampling. Top: Ikonos image pair before epipolar resampling; Bottom: epipolar images.
After spipolar images are generated, the next step is to generate colour 3D (or anaglyph) images by superimposing one colour band from one colour image with two colour bands from another colour image of the epipolar stereopair. The criterion of superimposing in a horizontal direction is to compel the smallest horizontal disparity of the matching points to zero. Figure 8 shows the colour 3D image automatically generated using the epipolar image pair of Figure 7.
Figure 8. Colour 3D image generated using epipolar images
2.6 Fast data transfer
Most Internet users access to the Internet through relatively low speed modems. There exists a problem of bandwidth constraint for viewing large volume colour image online. To overcome this problem, a technique was developed to divides high-resolution images into bite-size tiles and deliver “pixels on demand”. Therefore, the data transmission is done only when there is a downloading demand, which allows high resolution images be transferred over all bandwidth environments.
2.6 Automatic 3D refinement
The depth perception of a stereo image in binocular vision is caused by horizontal parallaxes. However, a larger horizontal parallax will cause difficulties in depth perception and stereo fusion problems. Therefore, the overall horizontal parallaxes should be maintained in a limited range for an acceptable stereo fusion (Carr 1993). Since satellite images cover a larger area, some areas may have larger horizontal parallaxes, as illustrated in Figure 9 (left), causing stereo fusion problems. A tool for automatic 3D refinement is therefore necessary to reduce the overall horizontal parallaxes to maintain an acceptable parallax range for effective 3D viewing (Figure 9, right). Figure 7. Influence of overall horizontal parallaxes for effective
colour 3D viewing. Left: larger overall horizontal parallaxes may cause stereo fusion problems; Right: small overall
horizontal parallaxes are more comfortable for colour 3D viewing.
A quadtree-based approach was developed to allow 3D refinement being performed in real time. To refine 3D image effetely, only those quadrants crossing the refining area (Figure 10) are searched.
00 01
02 03030 031
032 033
000 001 010 011
002 003 012 013
020 021 030 031
022 023 032 033
(a)
(b)
0
00 01 02 03
000 001 002 003 010 011 012 013 020 021 022 023 030 031 032 033
First Quadtrandsidentification
sub-quadrantsidentification
Refiningarea
Figure 10. Quadtree method for parallax refining. (a) decomposition of an image, and (b) quadtree representation of
the image.
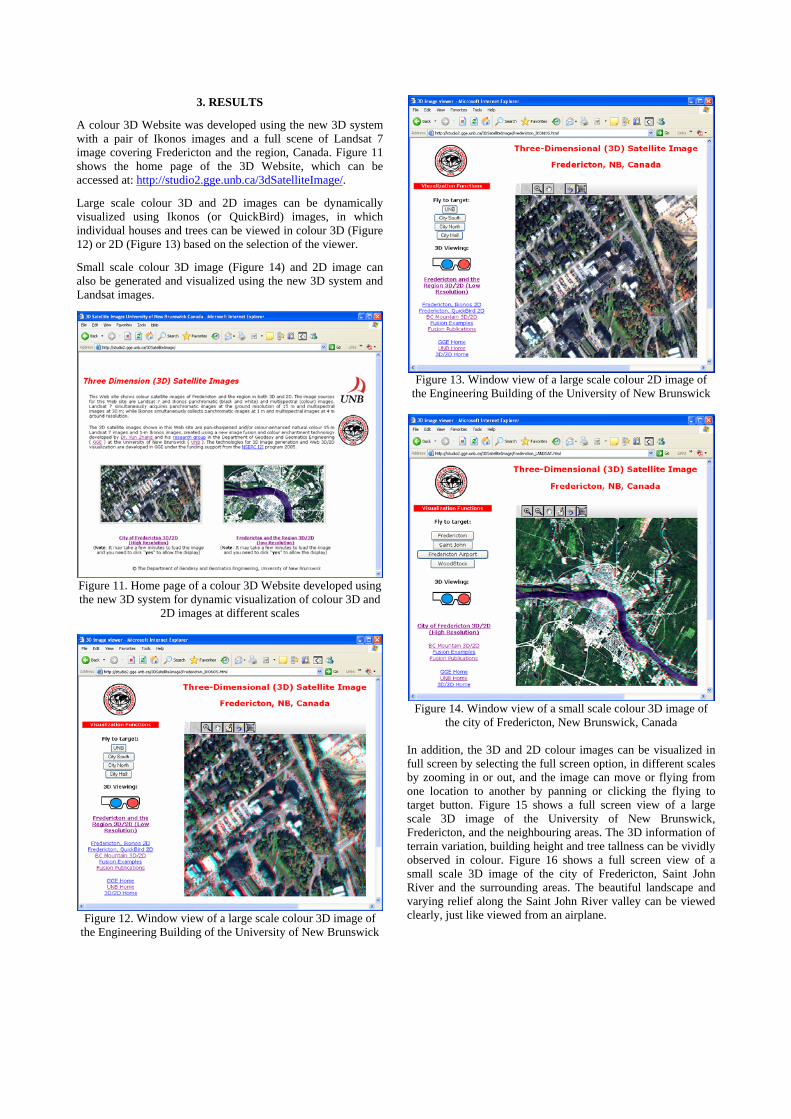
3. RESULTS
A colour 3D Website was developed using the new 3D system with a pair of Ikonos images and a full scene of Landsat 7 image covering Fredericton and the region, Canada. Figure 11 shows the home page of the 3D Website, which can be accessed at: http://studio2.gge.unb.ca/3dSatelliteImage/. Large scale colour 3D and 2D images can be dynamically visualized using Ikonos (or QuickBird) images, in which individual houses and trees can be viewed in colour 3D (Figure 12) or 2D (Figure 13) based on the selection of the viewer. Small scale colour 3D image (Figure 14) and 2D image can also be generated and visualized using the new 3D system and Landsat images.
Figure 13. Window view of a large scale colour 2D image of the Engineering Building of the University of New Brunswick
Figure 11. Home page of a colour 3D Website developed using the new 3D system for dynamic visualization of colour 3D and
2D images at different scales
Figure 14. Window view of a small scale colour 3D image of the city of Fredericton, New Brunswick, Canada
In addition, the 3D and 2D colour images can be visualized in full screen by selecting the full screen option, in different scales by zooming in or out, and the image can move or flying from one location to another by panning or clicking the flying to target button. Figure 15 shows a full screen view of a large scale 3D image of the University of New Brunswick, Fredericton, and the neighbouring areas. The 3D information of terrain variation, building height and tree tallness can be vividly observed in colour. Figure 16 shows a full screen view of a small scale 3D image of the city of Fredericton, Saint John River and the surrounding areas. The beautiful landscape and varying relief along the Saint John River valley can be viewed clearly, just like viewed from an airplane. Figure 12. Window view of a large scale colour 3D image of
the Engineering Building of the University of New Brunswick
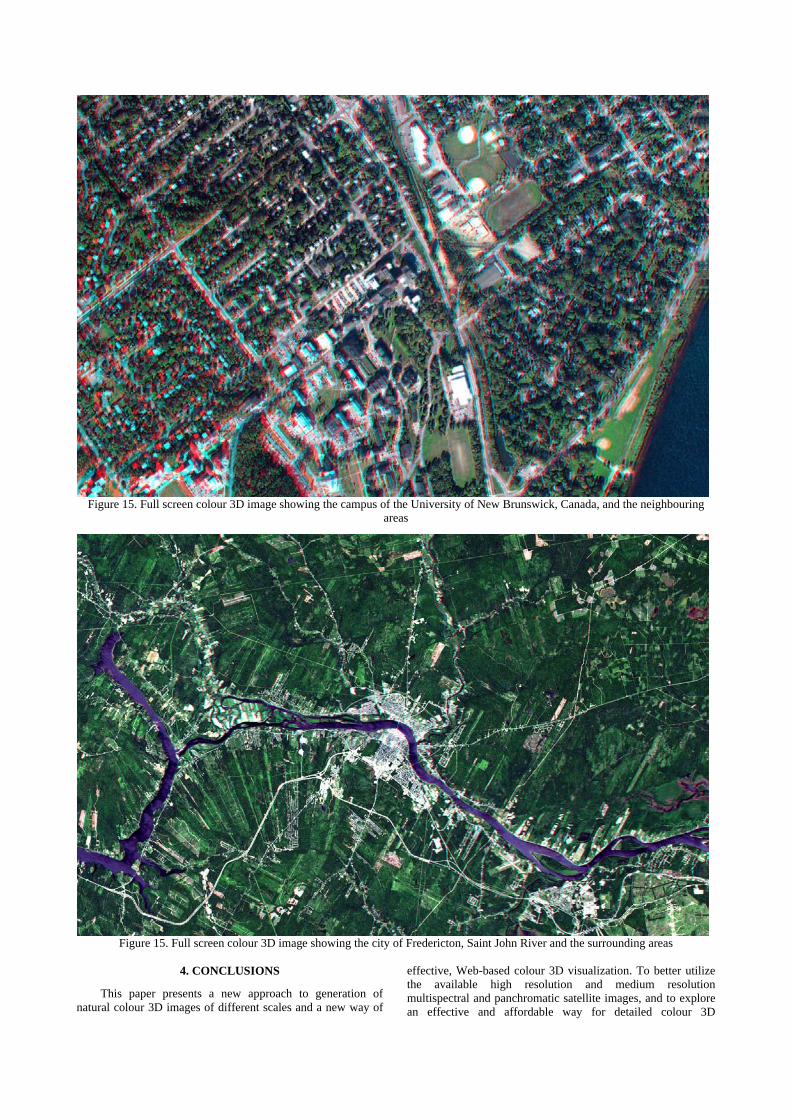
Figure 15. Full screen colour 3D image showing the campus of the University of New Brunswick, Canada, and the neighbouring
areas
Figure 15. Full screen colour 3D image showing the city of Fredericton, Saint John River and the surrounding areas
4. CONCLUSIONS
This paper presents a new approach to generation of
natural colour 3D images of different scales and a new way of
effective, Web-based colour 3D visualization. To better utilize the available high resolution and medium resolution multispectral and panchromatic satellite images, and to explore an effective and affordable way for detailed colour 3D

visualization, a image fusion process is necessary and the quality of the fusion results is crucial. This study and the results have demonstrated that it is possible to develop a online system for global colour 3D visualization using currently available Landsat images and DEMs. Detailed 3D visualization of the areas or regions of interest can be generated using high resolution satellites images, such as QuickBird or Ikonos. Different 3D objects on the Earth’s surface from mountain ranges to individual family houses and trees can be dynamically visualized and analyzed through the Internet across the world. This new system has a great potential to upgrade the state-of-the-art on-line mapping technologies used by Goolge Maps and/or MapQuest for global colour 3D visualization.
5. ACKNOWLEDGEMENTS The research was supported by the I2I program of the
Natural Science and Engineering Research Council (NSERC), Canada. The authors thank Mr. Rob Lunn, GIS supervisor of
the City of Fredericton, NB, Canada for providing the raw Ikonos image data.
REFERENCES
Carr, D.B., 1993. Production of Stereoscopic displays for Data
Analysis, Statistical Computing and Statistical Graphics Newsletter, April 1993
Zhang, Y., 2002a. Natural colour urban 3D modeling: A stereoscopic approach with IKONOS multispectrsal and panchromatic data. International Archives of Photogrammetry and Remote Sensing (IAPRS), Volume 34, Part 4 (ISPRS “GeoSpatial Theory, Processing and Applications”, Ottawa, July 2002).
Zhang, Y., 2002b. A New Automatic Approach for Effectively Fusing Landsat 7 as well as IKONOS Images. Proceedings of IEEE/IGARSS’02, Toronto, Canada, June 24-28, 2002.
Zhang, Y., 2004. Understanding Image Fusion. Photogrammetric Engineering & Remote Sensing, Vol. 70, No. 6, pp. 657-661.