Embed Size (px)
Citation preview

Automatic ImageAnalysis – Day 2
Mikko SyrjäsuoEarth ObservationFinnish Meteorological Institute
Graduate School summer course 2008: Automatic image analysis, Day 2 2
Segmentation of imagesSegmentation = dividing the image into (meaningful) regionsObject vs. background
Segmentation is typically based on either• finding boundaries (edges) that separate regions• combining similar subregions into larger regions
Application: recognition of targets (humans, galaxies, stars)partial targets (human face) or regions (land areas) forfurther analysis.
Graduate School summer course 2008: Automatic image analysis, Day 2 3
Segmentation of imagesIn most applications, a full segmentation of an image is not
necessary!!In some applications, no segmentation is needed at all!!
Partial or rough segmentation can be used• to detect/locate targets• to decide whether further processing is needed• in constructing a rough understanding of image contents
Graduate School summer course 2008: Automatic image analysis, Day 2 4
Finding boundaries or discontinuitiesThe boundaries between regions are discontinuities of
region content (types). Traditionally, these are called“edges” in images.
Edge detection is probably the oldest not yet satisfactorilysolved problem in image processing!
What is a discontinuity in a discrete world, by the way?
And in discrete world corrupted with noise?
Graduate School summer course 2008: Automatic image analysis, Day 2 5
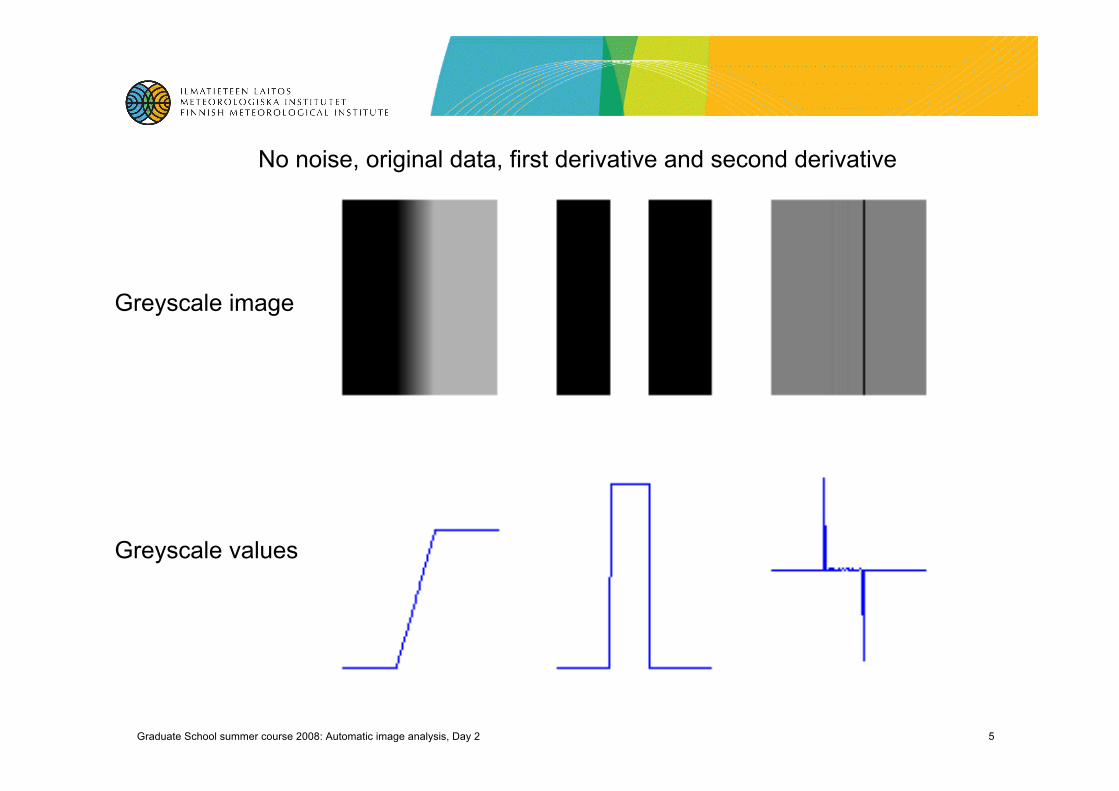
No noise, original data, first derivative and second derivative
Greyscale image
Greyscale values
Graduate School summer course 2008: Automatic image analysis, Day 2 6
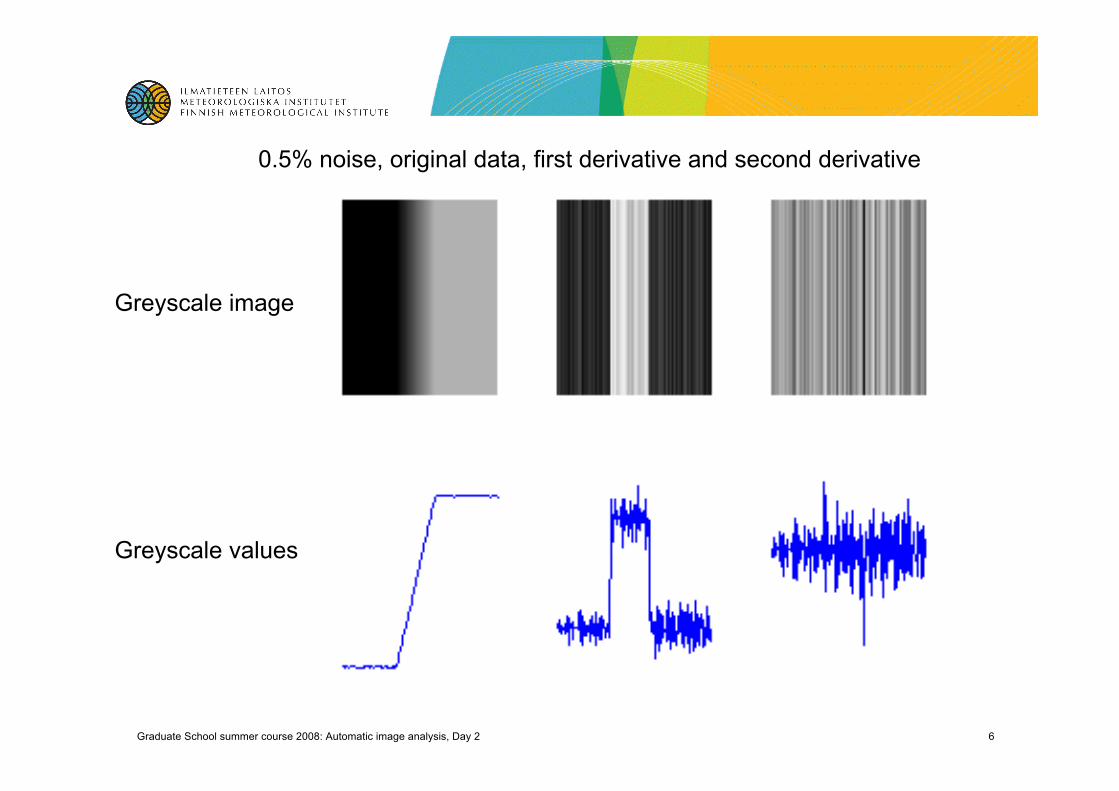
0.5% noise, original data, first derivative and second derivative
Greyscale image
Greyscale values
Graduate School summer course 2008: Automatic image analysis, Day 2 7
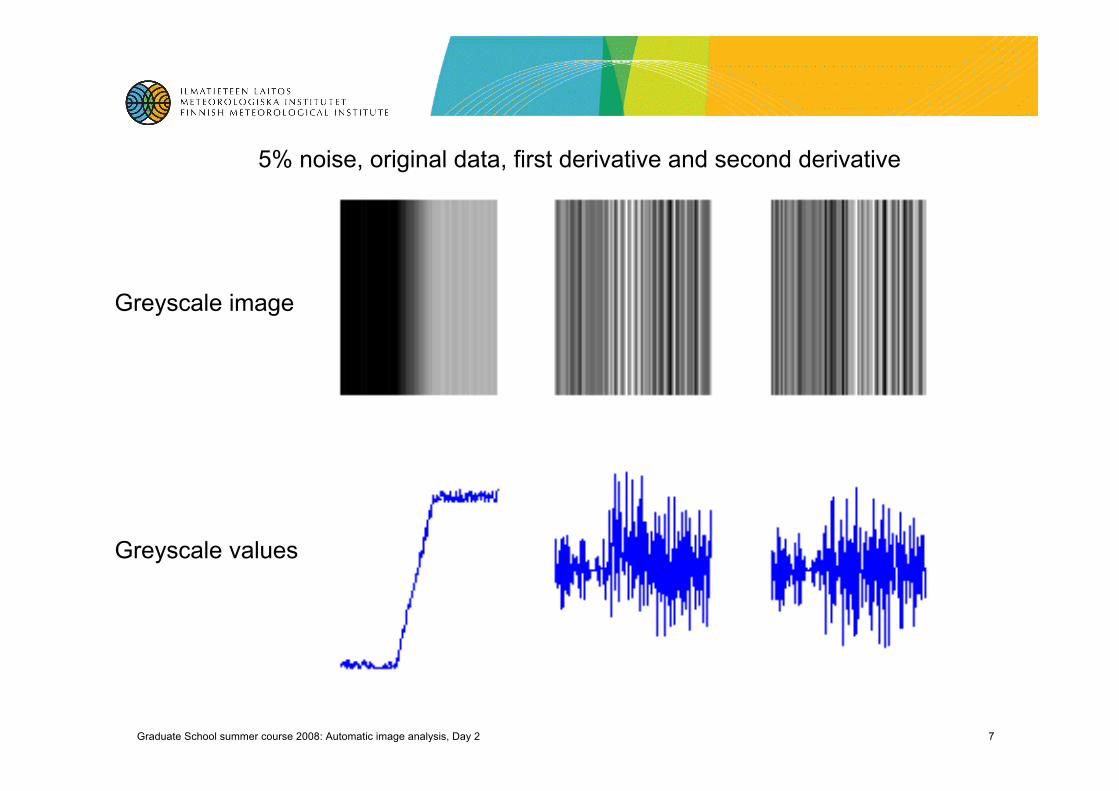
5% noise, original data, first derivative and second derivative
Greyscale image
Greyscale values
Graduate School summer course 2008: Automatic image analysis, Day 2 8
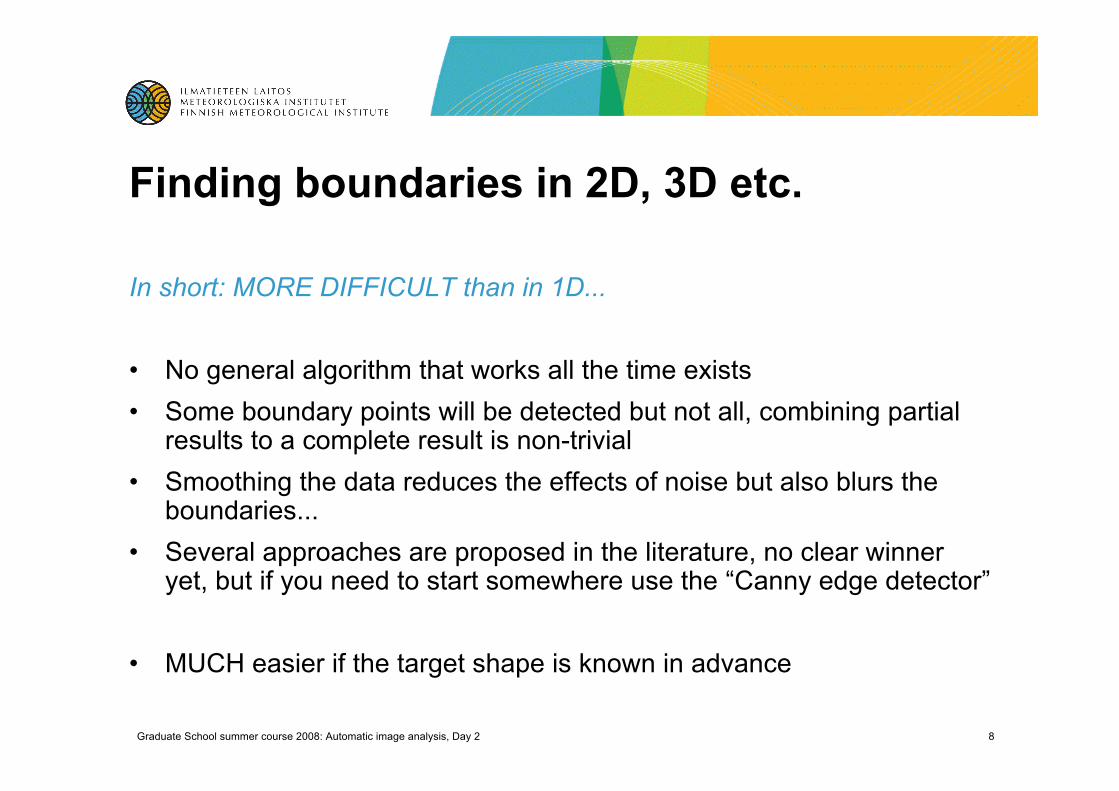
Finding boundaries in 2D, 3D etc.
In short: MORE DIFFICULT than in 1D...
• No general algorithm that works all the time exists• Some boundary points will be detected but not all, combining partial
results to a complete result is non-trivial• Smoothing the data reduces the effects of noise but also blurs the
boundaries...• Several approaches are proposed in the literature, no clear winner
yet, but if you need to start somewhere use the “Canny edge detector”
• MUCH easier if the target shape is known in advance
Graduate School summer course 2008: Automatic image analysis, Day 2 9
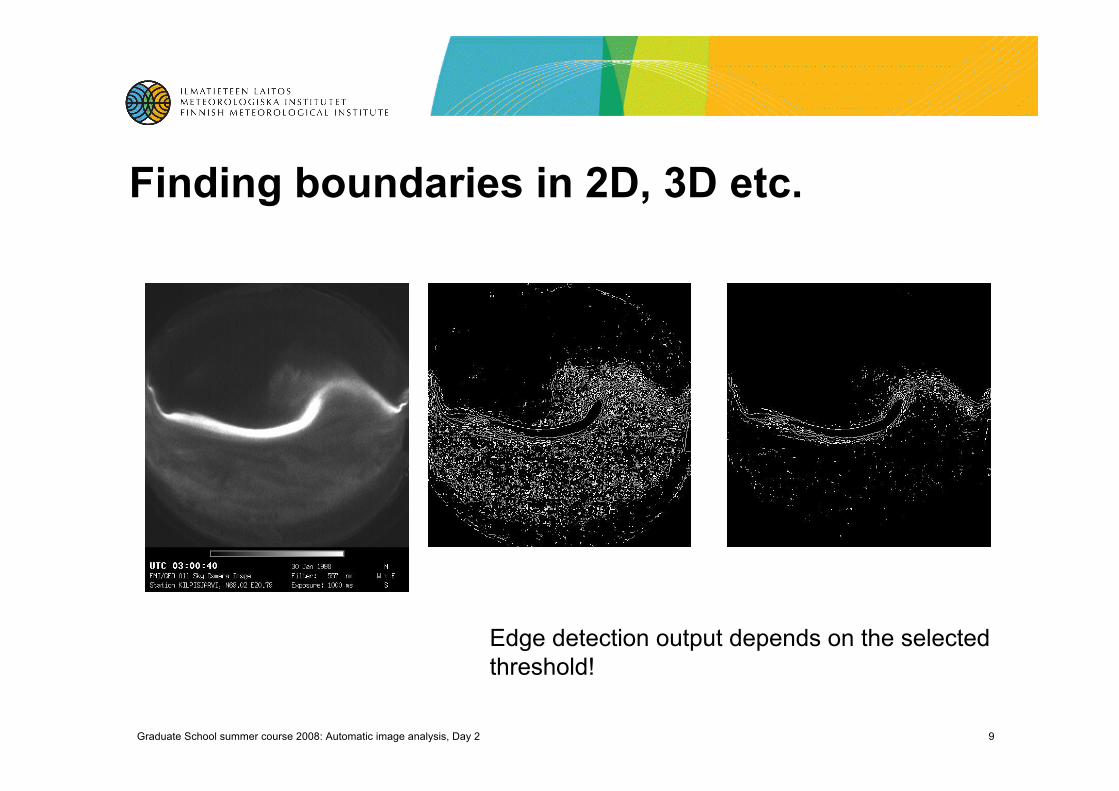
Finding boundaries in 2D, 3D etc.
Edge detection output depends on the selectedthreshold!
Graduate School summer course 2008: Automatic image analysis, Day 2 10
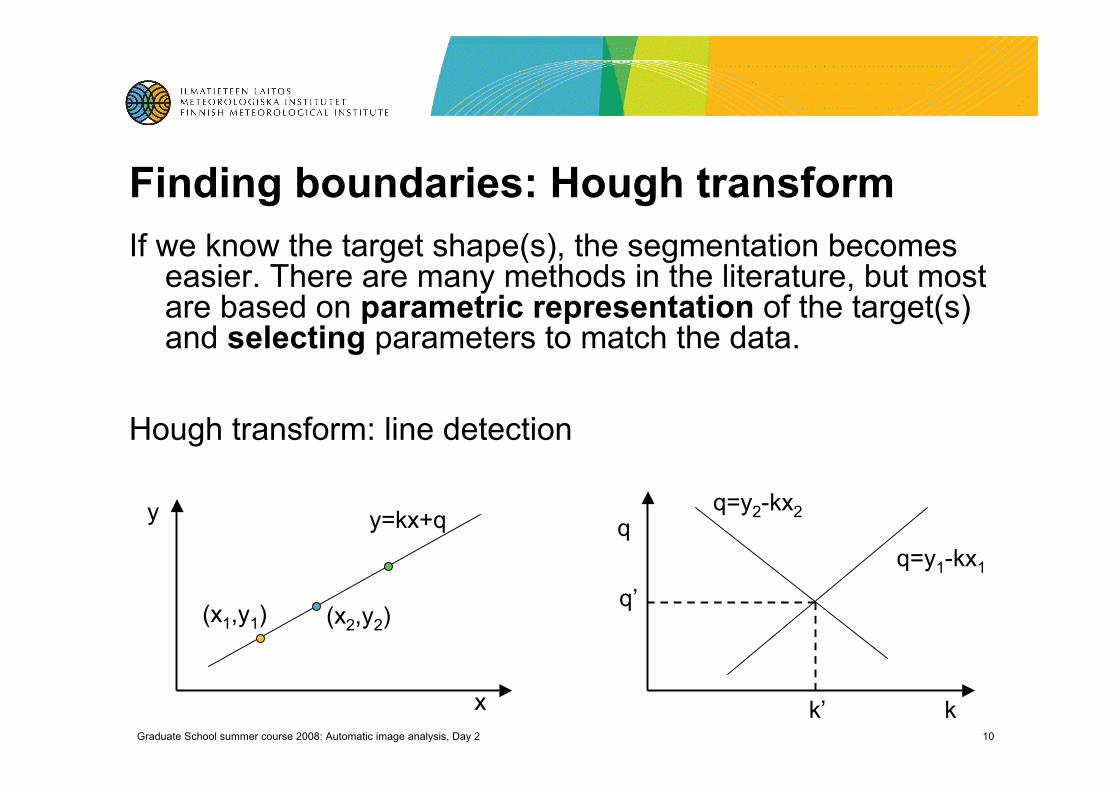
Finding boundaries: Hough transformIf we know the target shape(s), the segmentation becomes
easier. There are many methods in the literature, but mostare based on parametric representation of the target(s)and selecting parameters to match the data.
Hough transform: line detection
(x1,y1) (x2,y2)
x
y
k
qq=y2-kx2
q=y1-kx1
q’
k’
y=kx+q
Graduate School summer course 2008: Automatic image analysis, Day 2 11
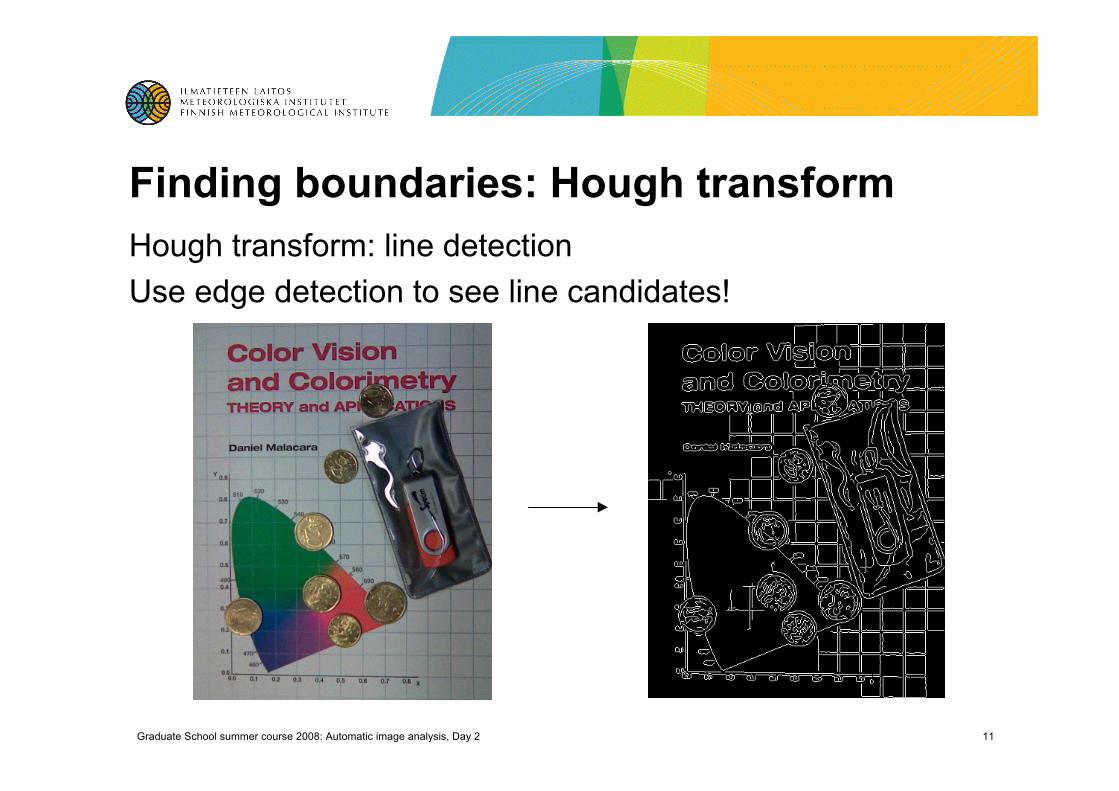
Finding boundaries: Hough transformHough transform: line detectionUse edge detection to see line candidates!
Graduate School summer course 2008: Automatic image analysis, Day 2 12
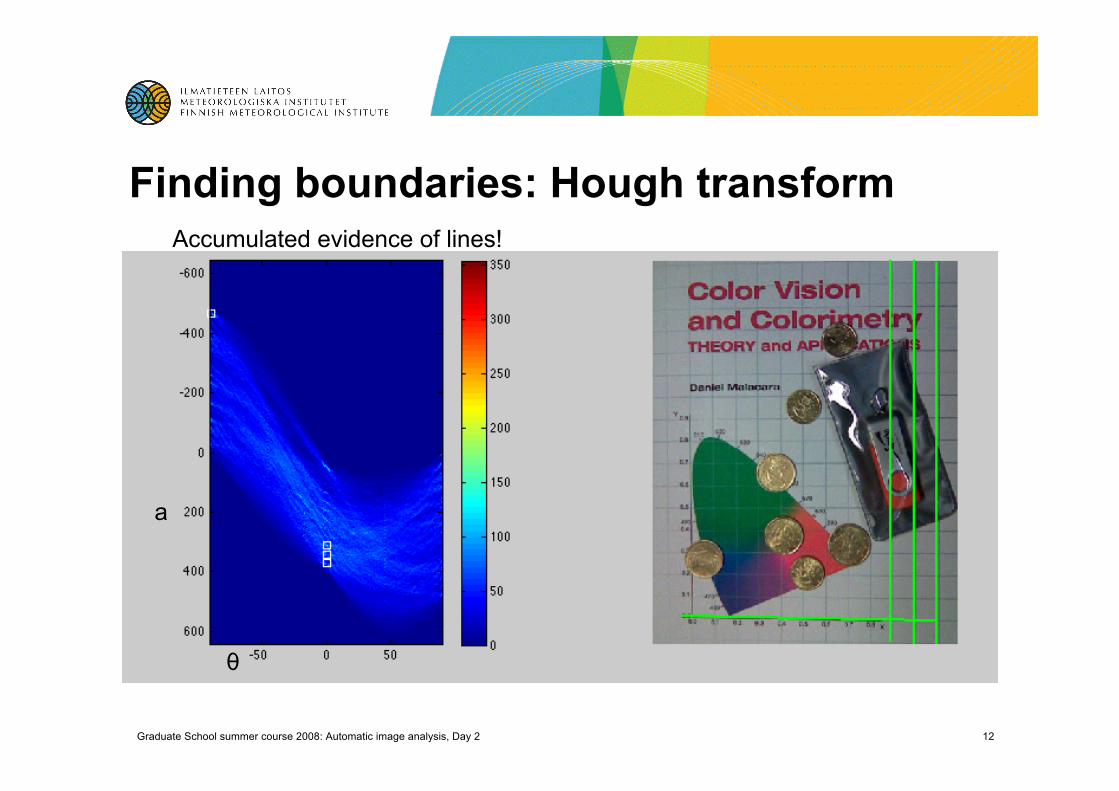
Finding boundaries: Hough transform
θ
a
Accumulated evidence of lines!
Graduate School summer course 2008: Automatic image analysis, Day 2 13
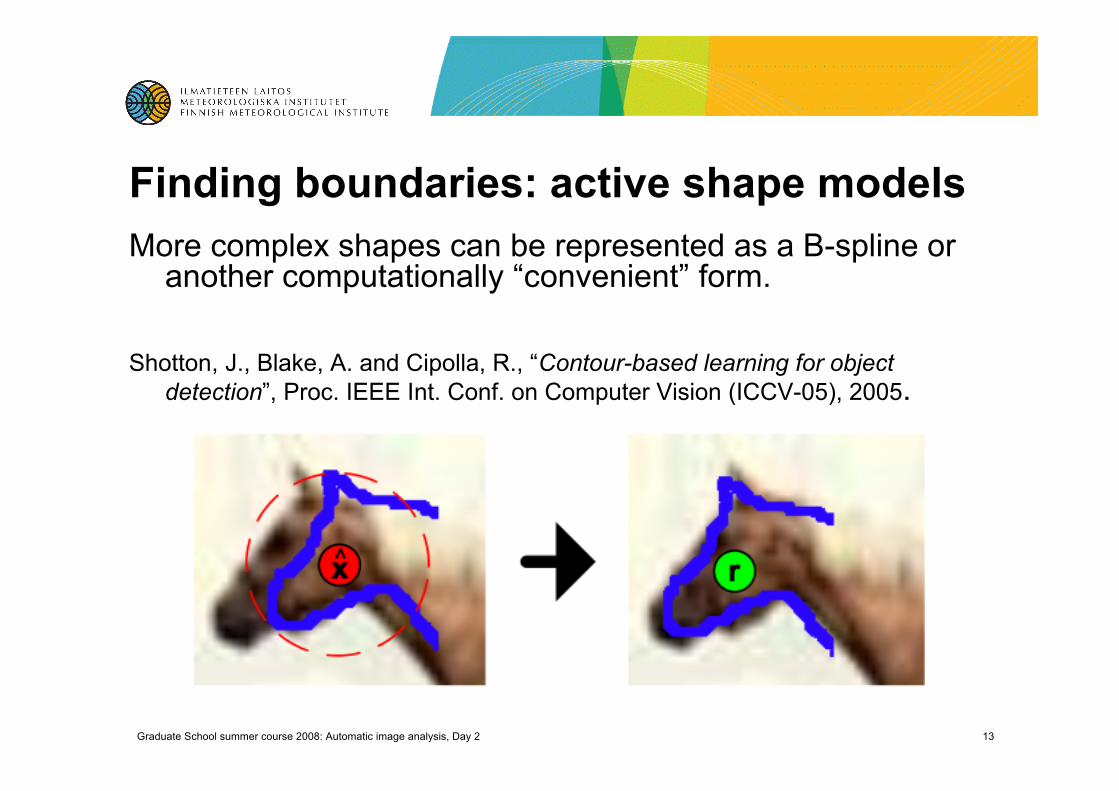
Finding boundaries: active shape modelsMore complex shapes can be represented as a B-spline or
another computationally “convenient” form.
Shotton, J., Blake, A. and Cipolla, R., “Contour-based learning for objectdetection”, Proc. IEEE Int. Conf. on Computer Vision (ICCV-05), 2005.
Graduate School summer course 2008: Automatic image analysis, Day 2 14
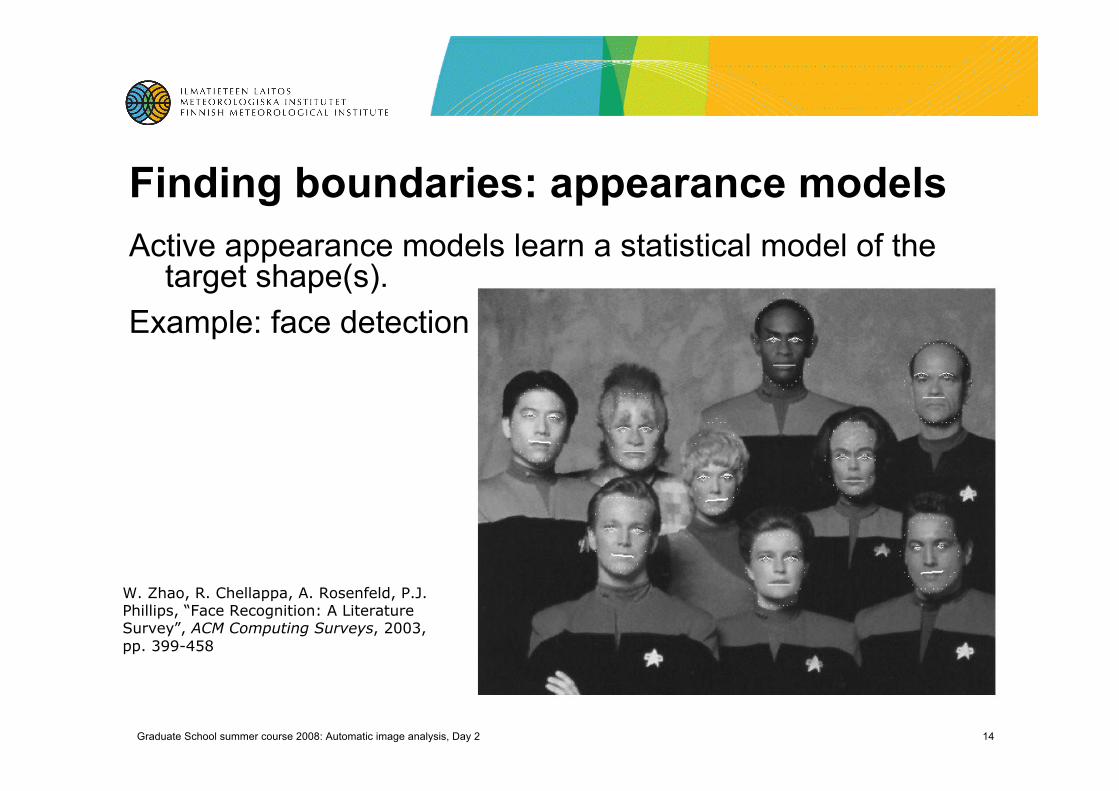
Finding boundaries: appearance modelsActive appearance models learn a statistical model of the
target shape(s).Example: face detection
W. Zhao, R. Chellappa, A. Rosenfeld, P.J.Phillips, “Face Recognition: A LiteratureSurvey”, ACM Computing Surveys, 2003,pp. 399-458
Graduate School summer course 2008: Automatic image analysis, Day 2 15
Boundary (shape) descriptions• The exact boundaries (object/region outlines) are usually
approximated• first few coefficients of Taylor/Fourier etc. series• splines• polygons
• Region properties are commonly expressed usingstatistics
• moments (area, centroid, eccentricity)
Graduate School summer course 2008: Automatic image analysis, Day 2 16
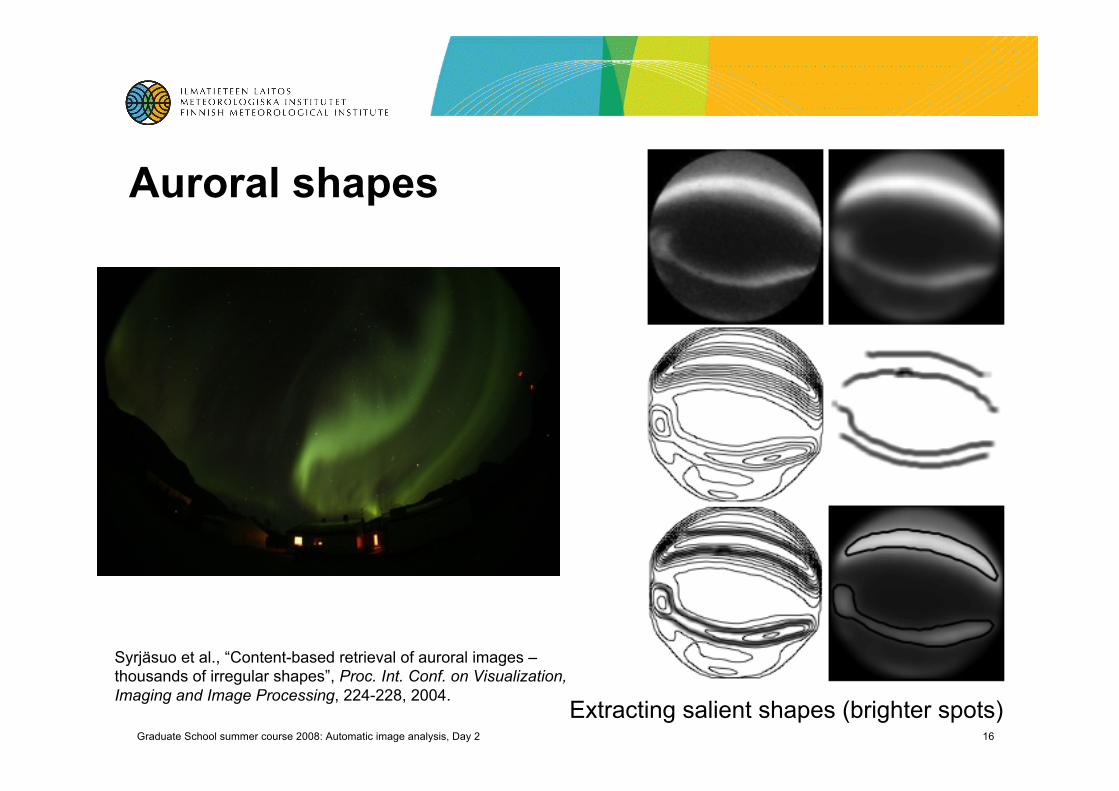
Auroral shapes
Extracting salient shapes (brighter spots)
Syrjäsuo et al., “Content-based retrieval of auroral images –thousands of irregular shapes”, Proc. Int. Conf. on Visualization,Imaging and Image Processing, 224-228, 2004.
Graduate School summer course 2008: Automatic image analysis, Day 2 17
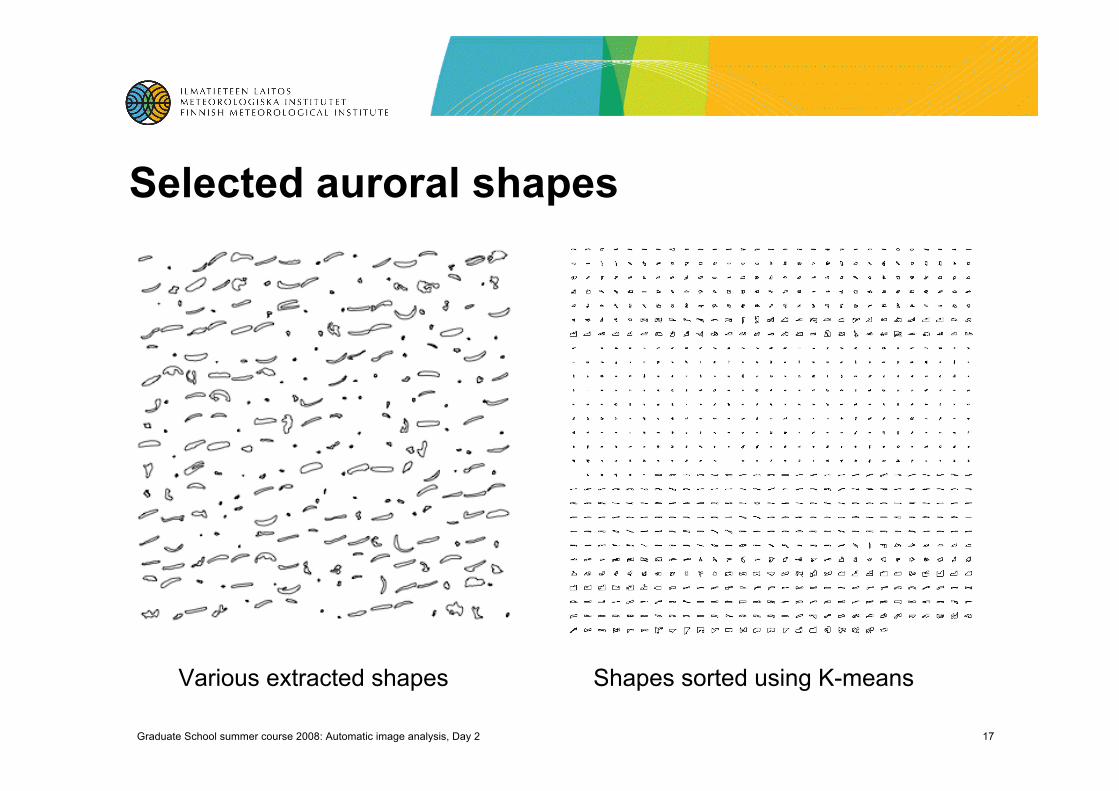
Selected auroral shapes
Various extracted shapes Shapes sorted using K-means
Graduate School summer course 2008: Automatic image analysis, Day 2 18
Similarity within a regionNote: a region is normally a continuous area of an image (volume in 3D
etc.)
The region “appearances” differ between regions• similarity is usually based on statistical measures• relate to multidimensional classification/clustering problems!
Some commonly used properties:• texture• colour• labels from classification/clustering based on (multidimensional) pixel
data values
Graduate School summer course 2008: Automatic image analysis, Day 2 19
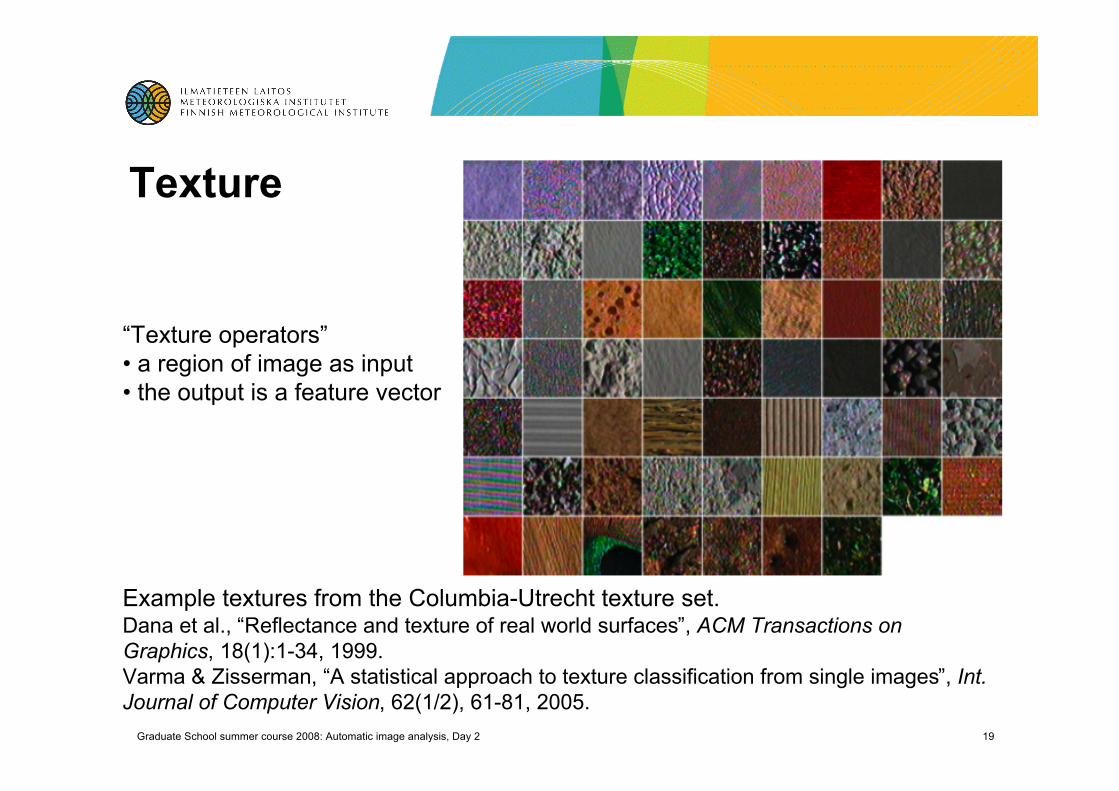
Texture
Example textures from the Columbia-Utrecht texture set.Dana et al., “Reflectance and texture of real world surfaces”, ACM Transactions onGraphics, 18(1):1-34, 1999.Varma & Zisserman, “A statistical approach to texture classification from single images”, Int.Journal of Computer Vision, 62(1/2), 61-81, 2005.
“Texture operators”• a region of image as input• the output is a feature vector
Graduate School summer course 2008: Automatic image analysis, Day 2 20
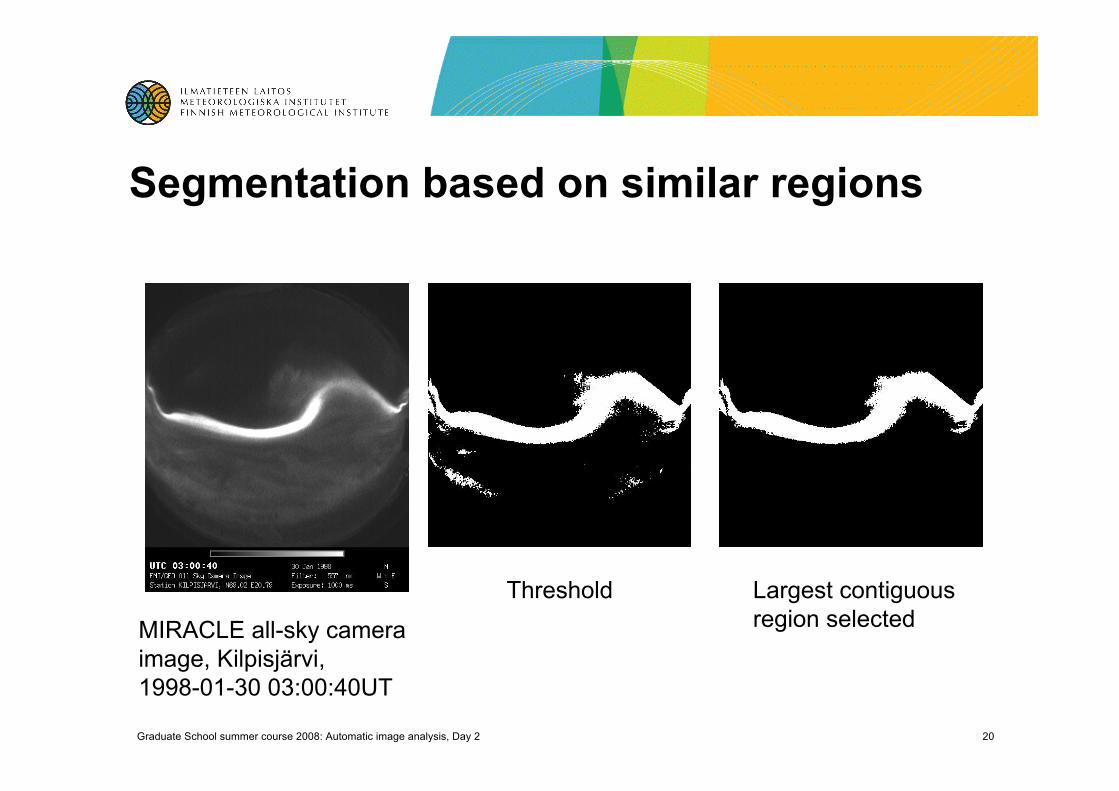
Segmentation based on similar regions
Threshold Largest contiguousregion selectedMIRACLE all-sky camera
image, Kilpisjärvi,1998-01-30 03:00:40UT
Graduate School summer course 2008: Automatic image analysis, Day 2 21
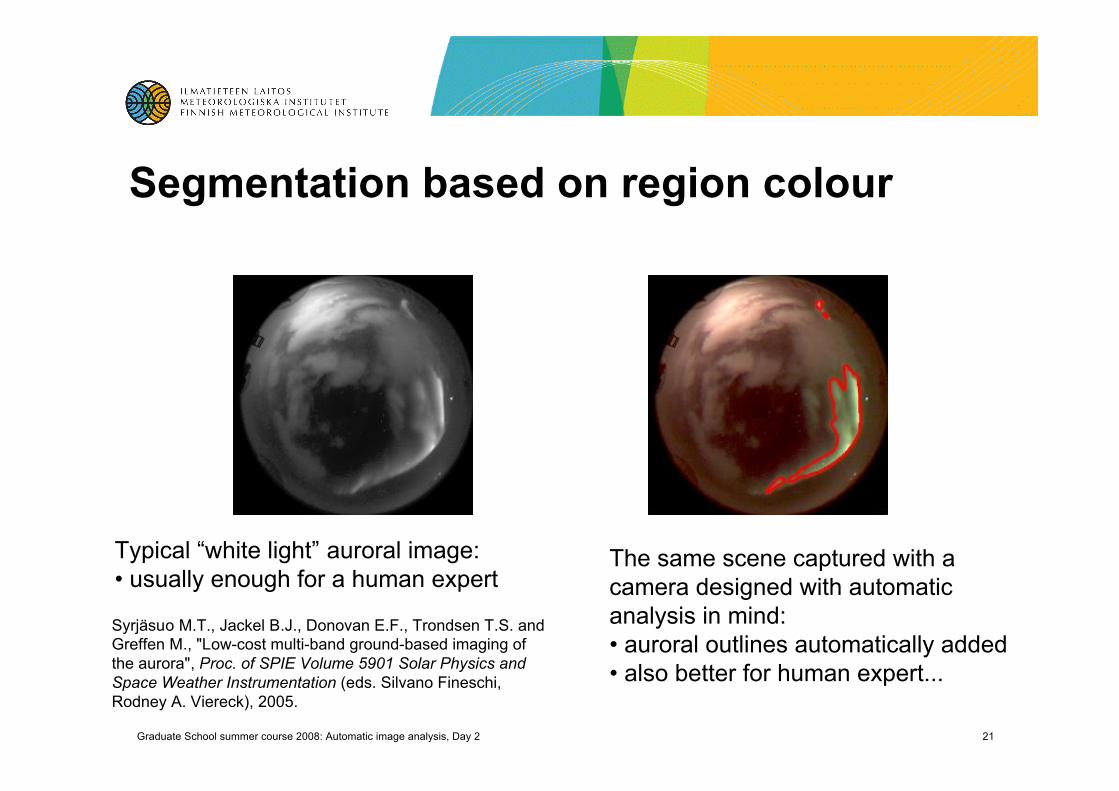
Segmentation based on region colour
Typical “white light” auroral image:• usually enough for a human expert
The same scene captured with acamera designed with automaticanalysis in mind:• auroral outlines automatically added• also better for human expert...
Syrjäsuo M.T., Jackel B.J., Donovan E.F., Trondsen T.S. andGreffen M., "Low-cost multi-band ground-based imaging ofthe aurora", Proc. of SPIE Volume 5901 Solar Physics andSpace Weather Instrumentation (eds. Silvano Fineschi,Rodney A. Viereck), 2005.
Graduate School summer course 2008: Automatic image analysis, Day 2 22
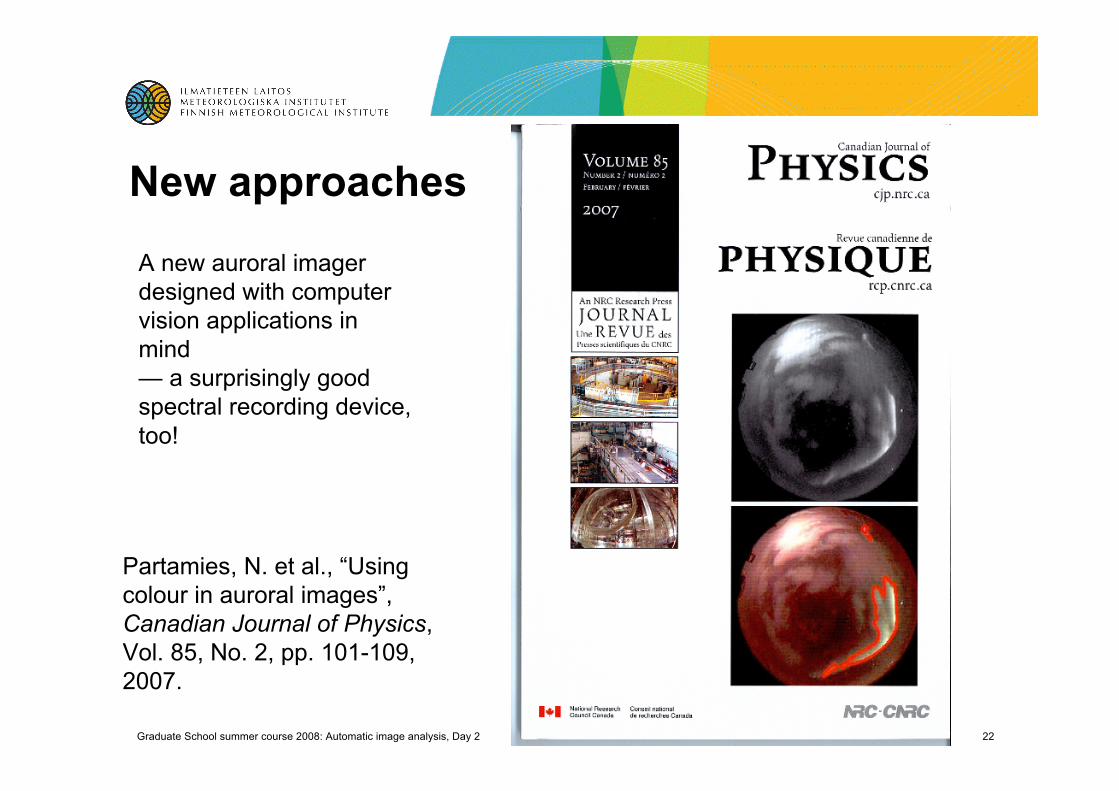
New approaches
Partamies, N. et al., “Usingcolour in auroral images”,Canadian Journal of Physics,Vol. 85, No. 2, pp. 101-109,2007.
A new auroral imagerdesigned with computervision applications inmind— a surprisingly goodspectral recording device,too!
Graduate School summer course 2008: Automatic image analysis, Day 2 23
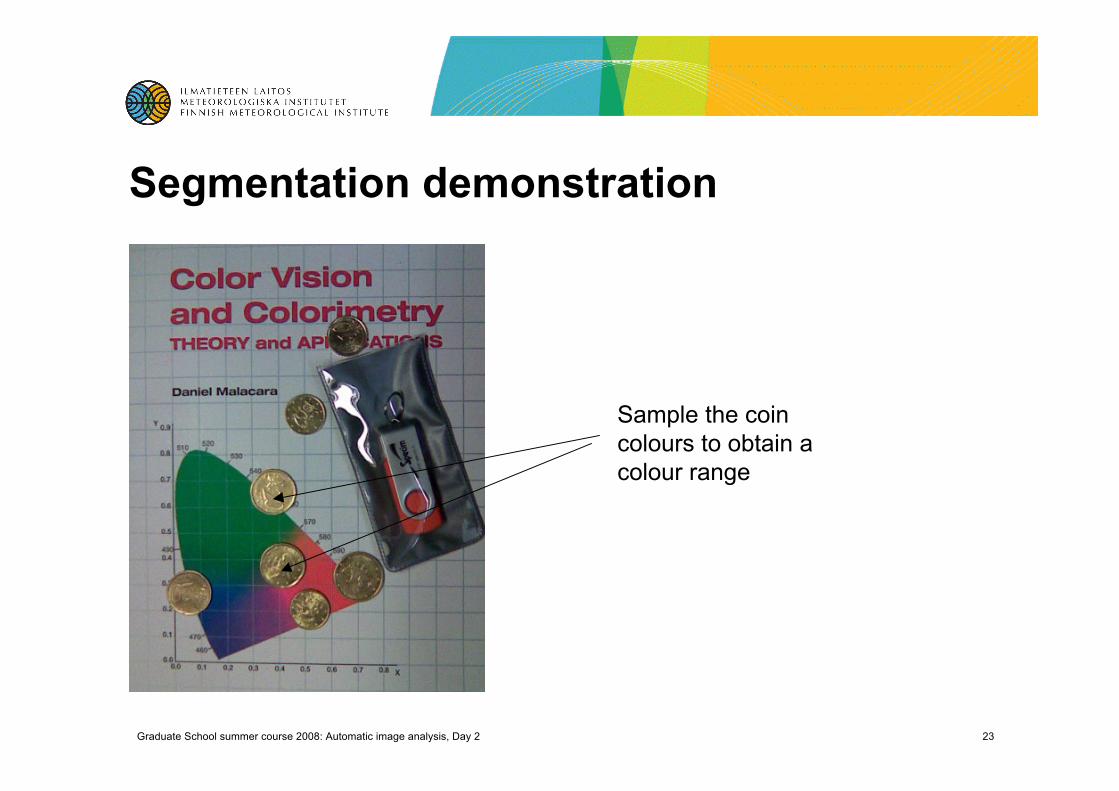
Segmentation demonstration
Sample the coincolours to obtain acolour range

Graduate School summer course 2008: Automatic image analysis, Day 2 24
Segmentation demonstration (cont.)
All pixels that have a RGB colour valuein the 3D-space
R=98...163G=85...148B=57...104
are shown in white.
Graduate School summer course 2008: Automatic image analysis, Day 2 25
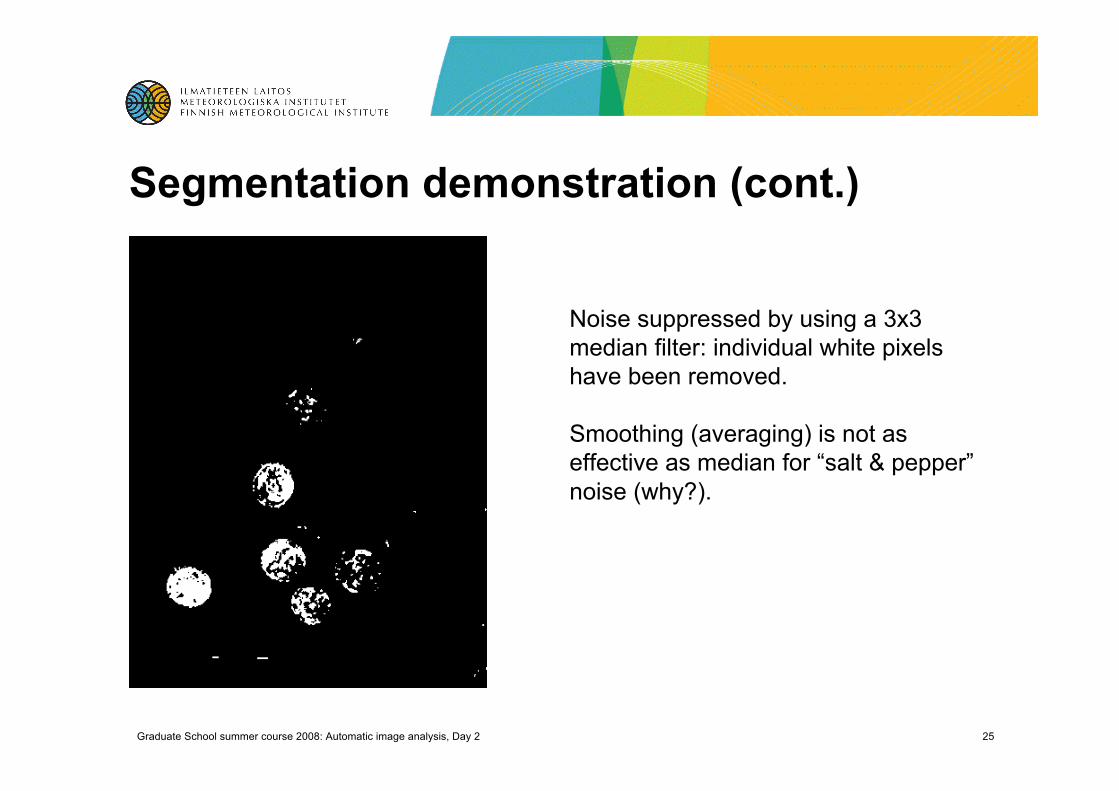
Segmentation demonstration (cont.)
Noise suppressed by using a 3x3median filter: individual white pixelshave been removed.
Smoothing (averaging) is not aseffective as median for “salt & pepper”noise (why?).
Graduate School summer course 2008: Automatic image analysis, Day 2 26
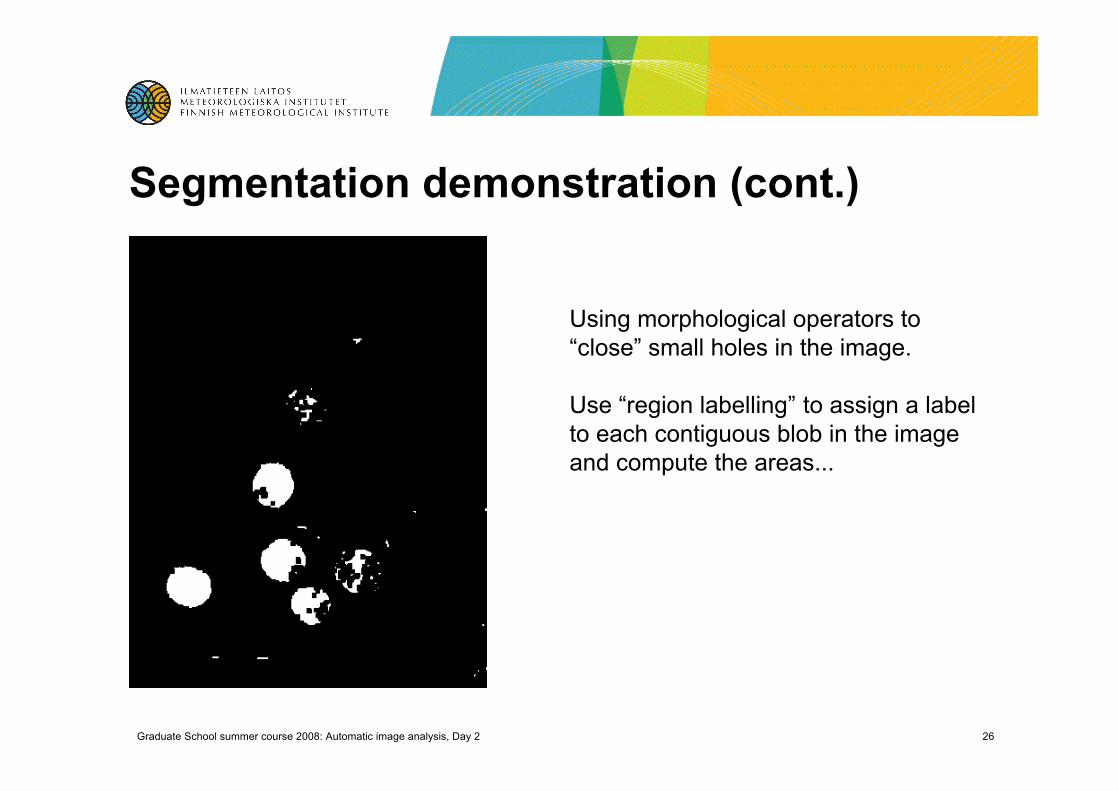
Segmentation demonstration (cont.)
Using morphological operators to“close” small holes in the image.
Use “region labelling” to assign a labelto each contiguous blob in the imageand compute the areas...
Graduate School summer course 2008: Automatic image analysis, Day 2 27
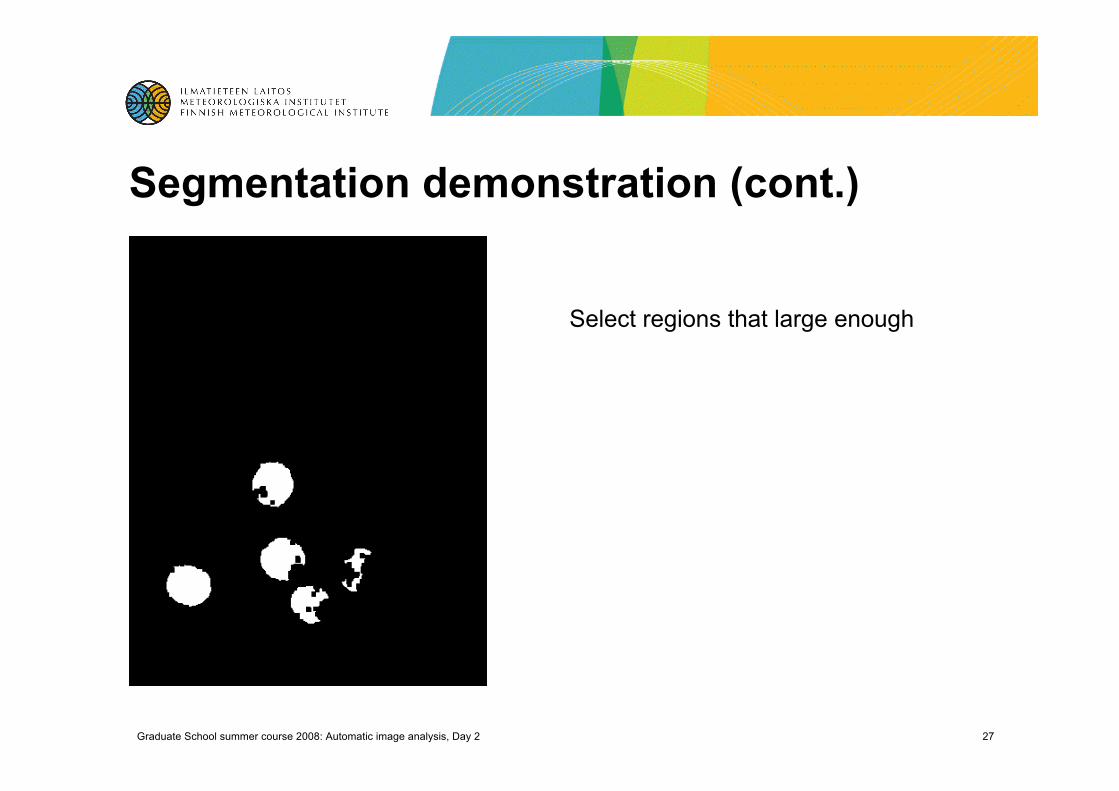
Segmentation demonstration (cont.)
Select regions that large enough
Graduate School summer course 2008: Automatic image analysis, Day 2 28
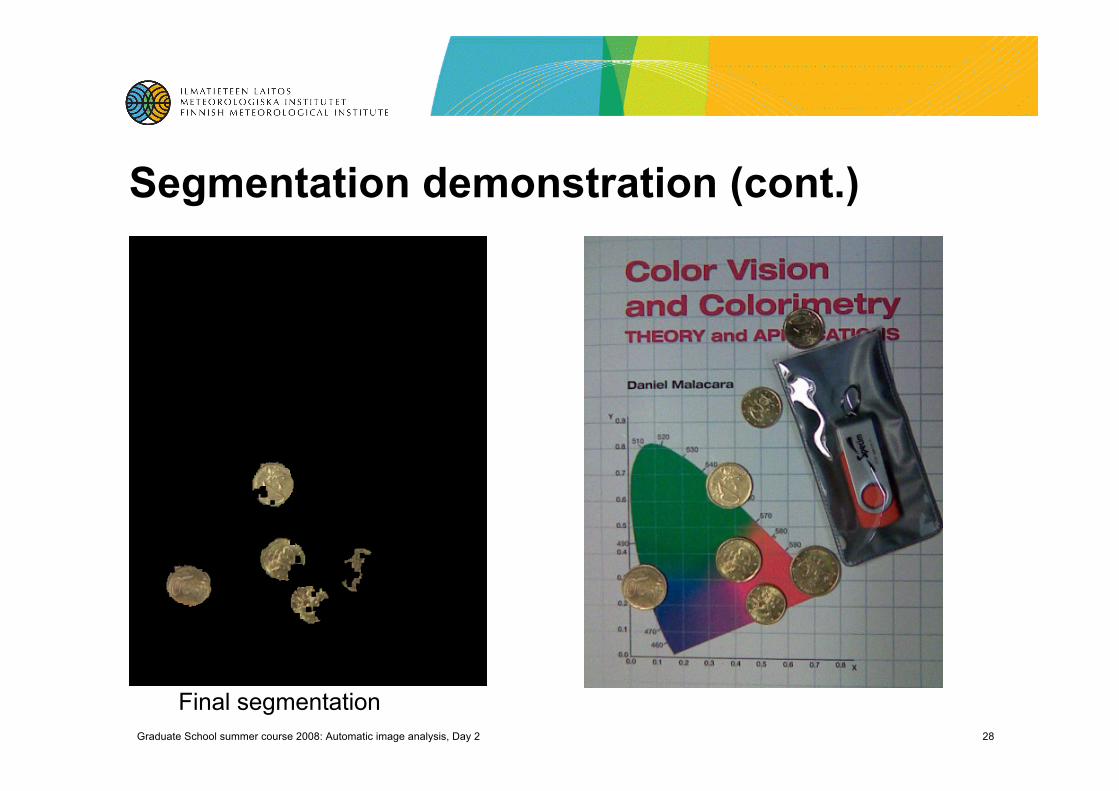
Segmentation demonstration (cont.)
Final segmentation
Graduate School summer course 2008: Automatic image analysis, Day 2 29
Detection, classification, adaptation• in many cases, the detection of a target is implemented as
a classification problem• known targets ⇒ matching model shapes• “blobs” ⇒ classification, clustering• “is this the same object?” (⇒ 1-class problems)
• multidimensional feature vectors• similarity metrics• distributions (curse of dimensionality!)• probabilistic (statistical) methods
Graduate School summer course 2008: Automatic image analysis, Day 2 30
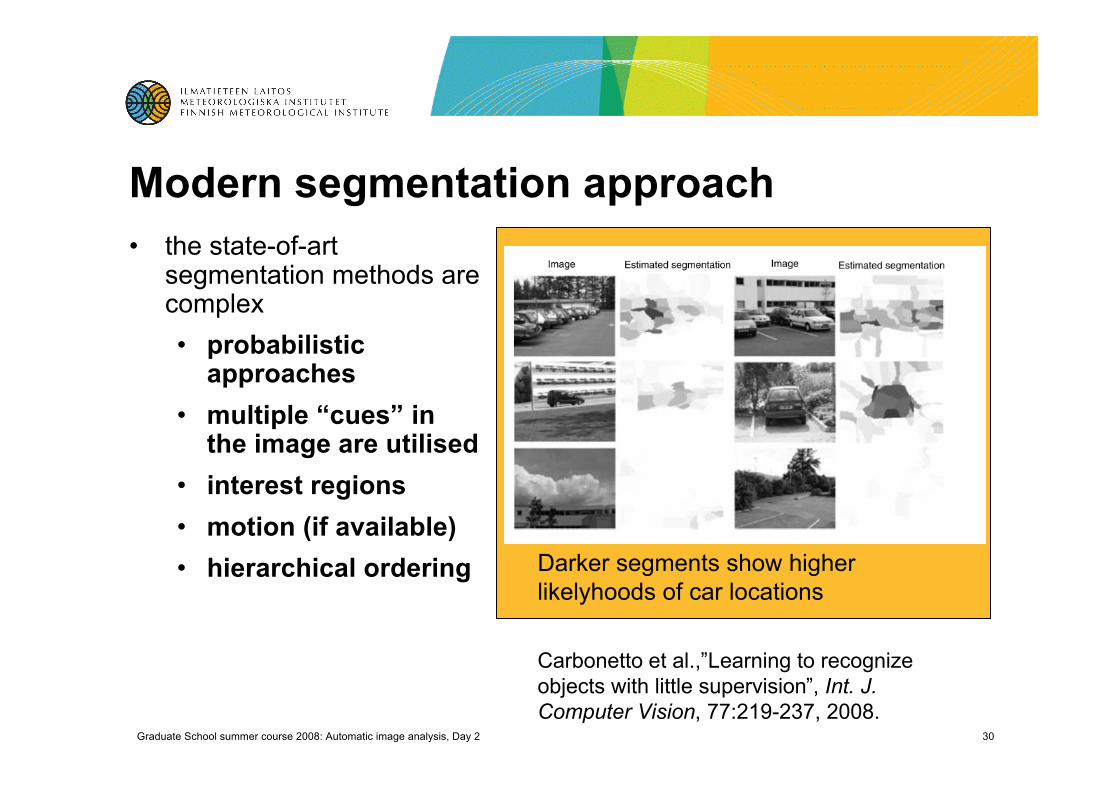
Modern segmentation approach• the state-of-art
segmentation methods arecomplex• probabilistic
approaches• multiple “cues” in
the image are utilised• interest regions• motion (if available)• hierarchical ordering
Carbonetto et al.,”Learning to recognizeobjects with little supervision”, Int. J.Computer Vision, 77:219-237, 2008.
Darker segments show higherlikelyhoods of car locations
Graduate School summer course 2008: Automatic image analysis, Day 2 31
Image understanding• the “ultimate goal” of automatic image analysis
• explaining the image contents• again, general solutions are more difficult (impossible)
than particular solutions• fortunately:
• not usually required in space physics or astronomyapplications!
Graduate School summer course 2008: Automatic image analysis, Day 2 32
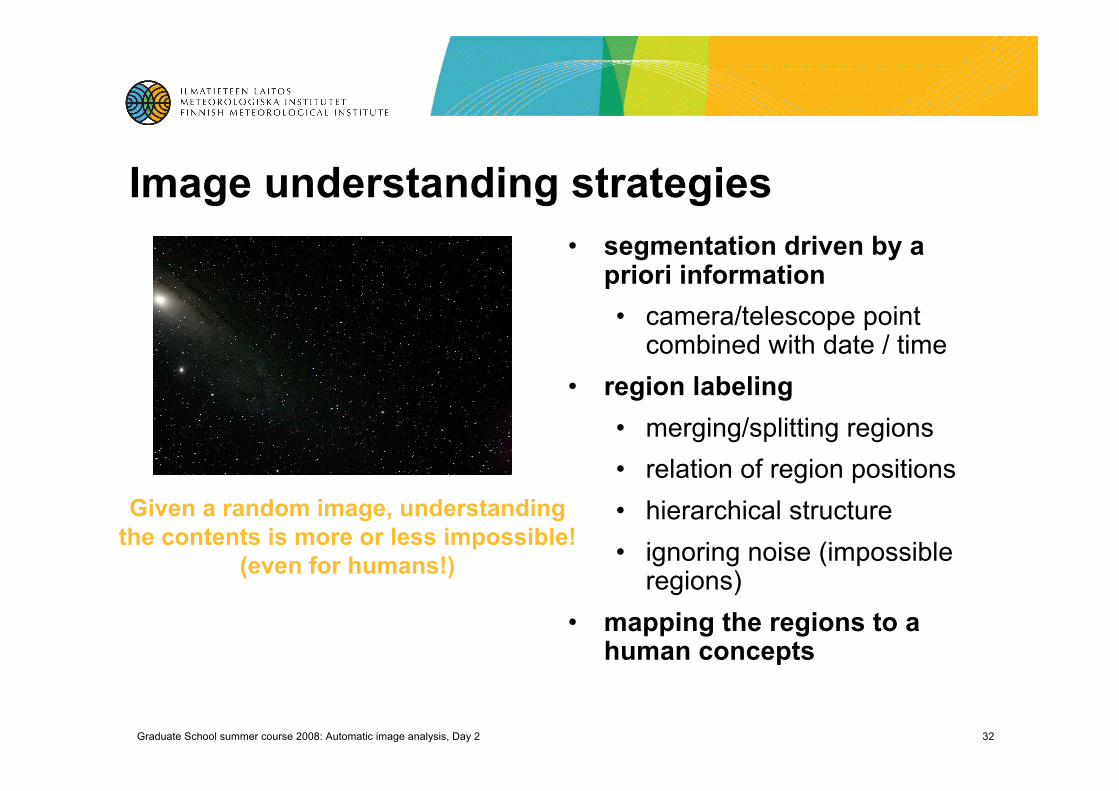
Image understanding strategies• segmentation driven by a
priori information• camera/telescope point
combined with date / time• region labeling
• merging/splitting regions• relation of region positions• hierarchical structure• ignoring noise (impossible
regions)• mapping the regions to a
human concepts
Given a random image, understandingthe contents is more or less impossible!
(even for humans!)
Graduate School summer course 2008: Automatic image analysis, Day 2 33
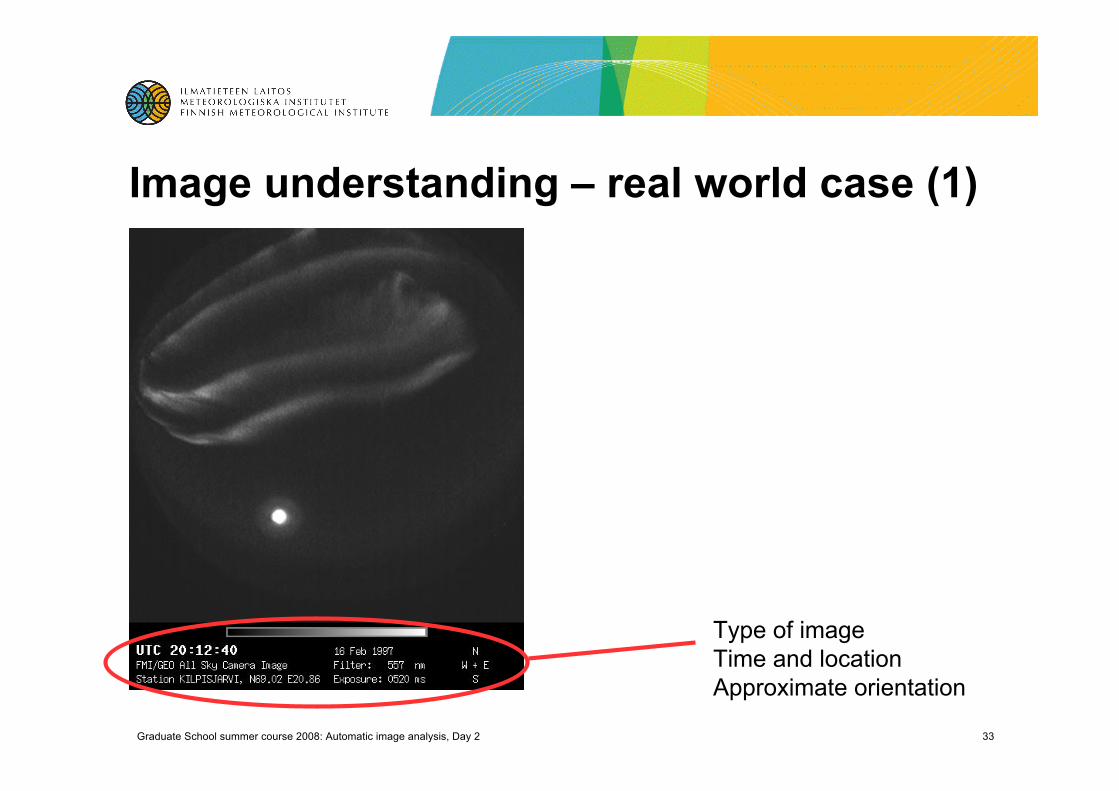
Image understanding – real world case (1)
Type of imageTime and locationApproximate orientation
Graduate School summer course 2008: Automatic image analysis, Day 2 34
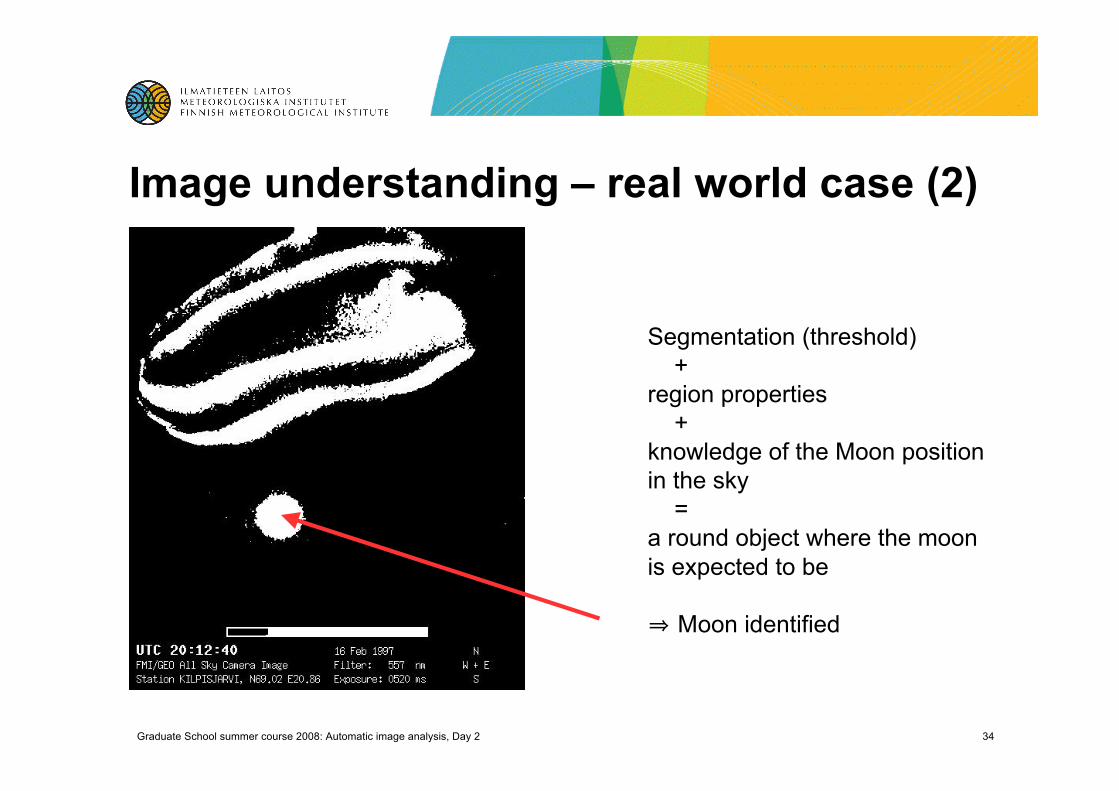
Image understanding – real world case (2)
Segmentation (threshold) +region properties +knowledge of the Moon positionin the sky =a round object where the moonis expected to be
⇒ Moon identified
Graduate School summer course 2008: Automatic image analysis, Day 2 35
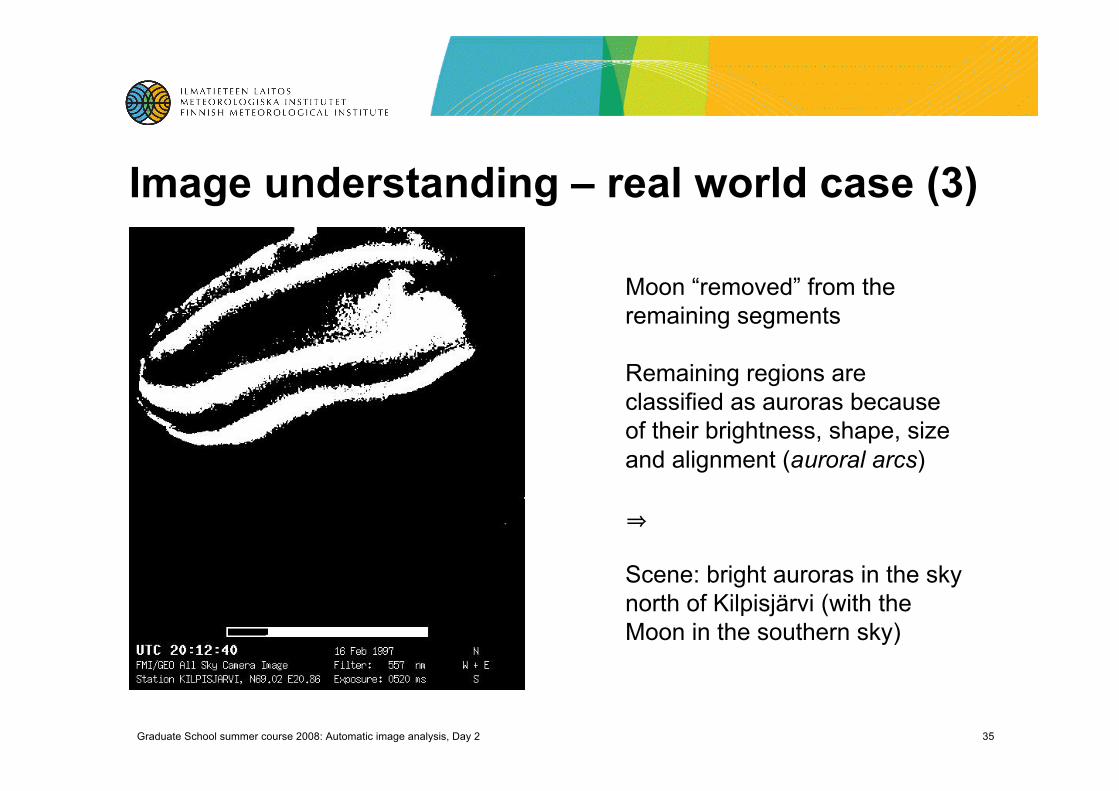
Image understanding – real world case (3)
Moon “removed” from theremaining segments
Remaining regions areclassified as auroras becauseof their brightness, shape, sizeand alignment (auroral arcs)
⇒
Scene: bright auroras in the skynorth of Kilpisjärvi (with theMoon in the southern sky)
Graduate School summer course 2008: Automatic image analysis, Day 2 36
Case study: auroral occurrence (1)• Auroral appearance depends on the time of day• Early studies have been performed manually
Syrjäsuo and Donovan, “Diurnal auroral occurrence statistics obtainedvia machine vision”, Annales Geophysicae, 22, 1103-1113, 2004.
• CANOPUS all-sky imager data from Gillam, Manitoba, Canada• 350,000 image subset• KNN classifier using a manually classified training set (supervised
learning)• several image features concatenated to form one multidimensional
feature vector for each image
Graduate School summer course 2008: Automatic image analysis, Day 2 37
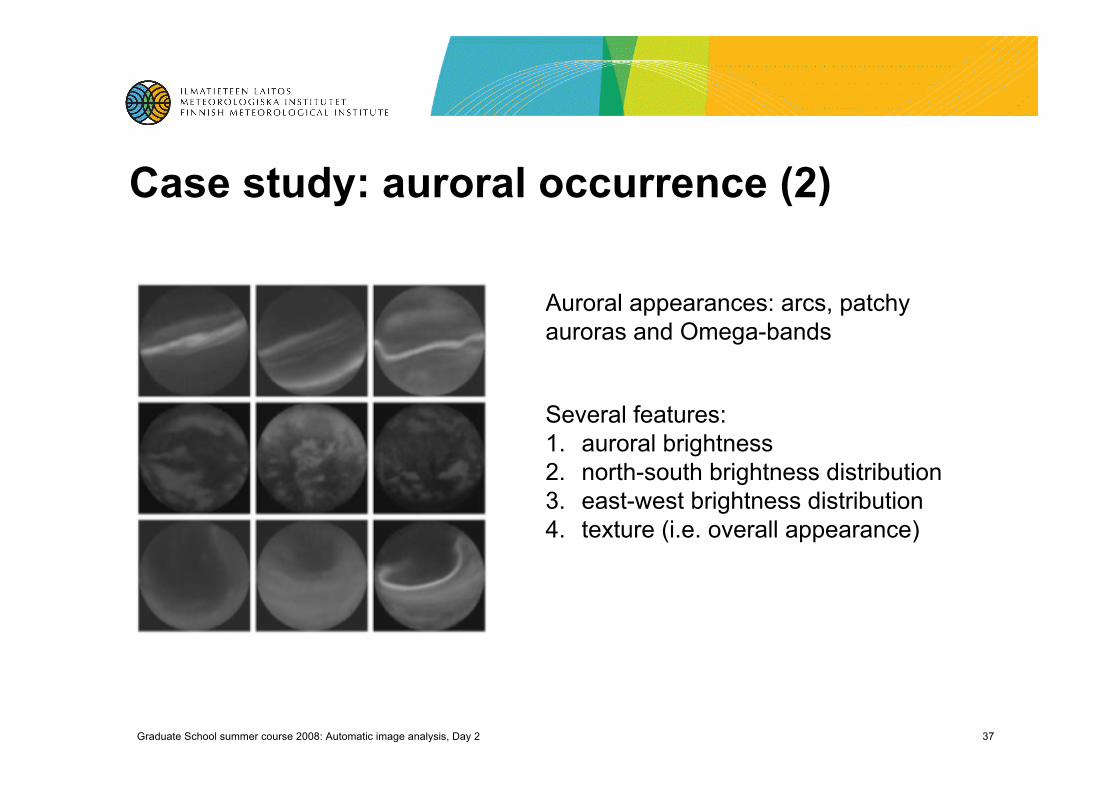
Case study: auroral occurrence (2)
Auroral appearances: arcs, patchyauroras and Omega-bands
Several features:1. auroral brightness2. north-south brightness distribution3. east-west brightness distribution4. texture (i.e. overall appearance)
Graduate School summer course 2008: Automatic image analysis, Day 2 38
Case study: auroral occurrence (3)• Classification into four categories
1. No aurora2. Arcs (one or more)3. Patchy aurora4. Omega-bands5. Other/reject
• 300 carefully selected sample images from categories2,3 and 4
Graduate School summer course 2008: Automatic image analysis, Day 2 39
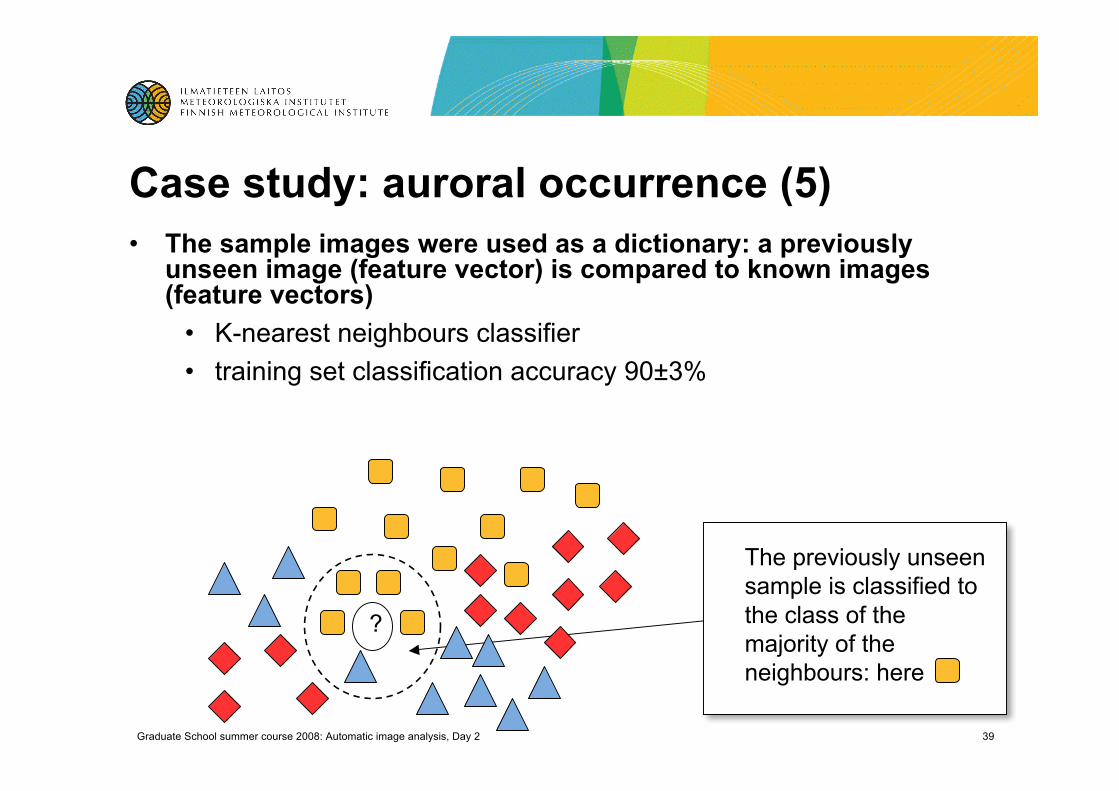
Case study: auroral occurrence (5)• The sample images were used as a dictionary: a previously
unseen image (feature vector) is compared to known images(feature vectors)
• K-nearest neighbours classifier• training set classification accuracy 90±3%
?
The previously unseensample is classified tothe class of themajority of theneighbours: here
Graduate School summer course 2008: Automatic image analysis, Day 2 40
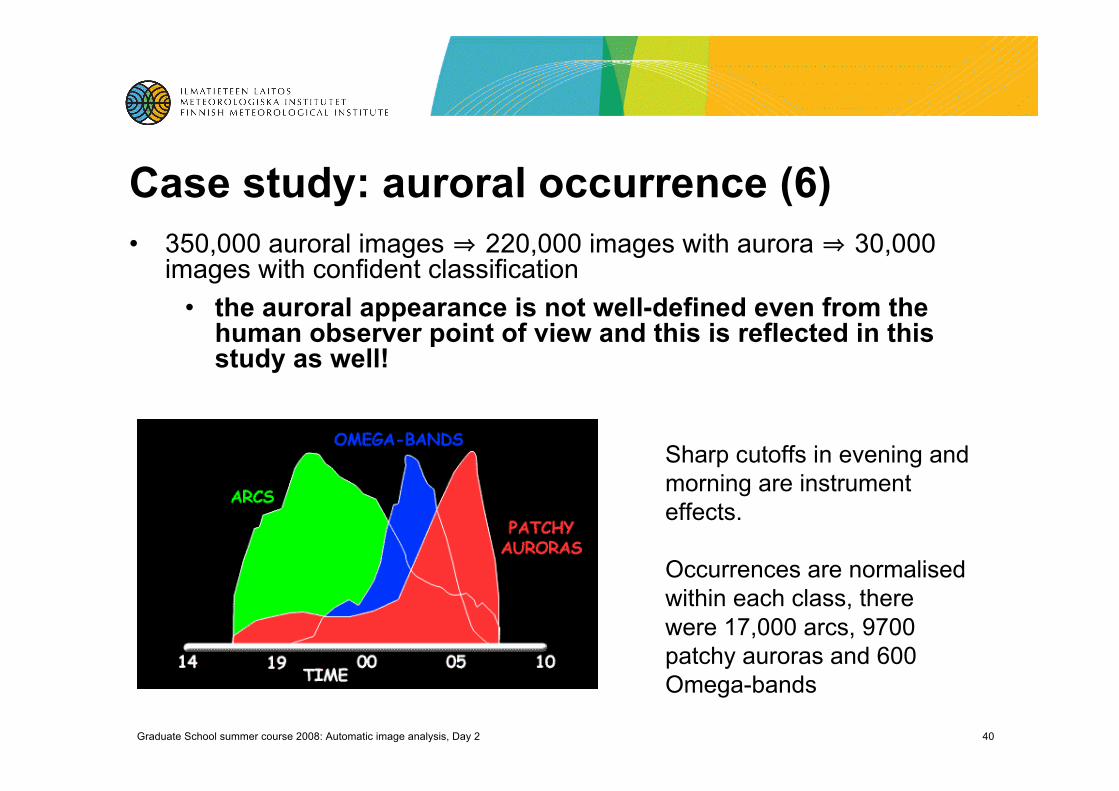
Case study: auroral occurrence (6)• 350,000 auroral images ⇒ 220,000 images with aurora ⇒ 30,000
images with confident classification• the auroral appearance is not well-defined even from the
human observer point of view and this is reflected in thisstudy as well!
Sharp cutoffs in evening andmorning are instrumenteffects.
Occurrences are normalisedwithin each class, therewere 17,000 arcs, 9700patchy auroras and 600Omega-bands
Graduate School summer course 2008: Automatic image analysis, Day 2 41
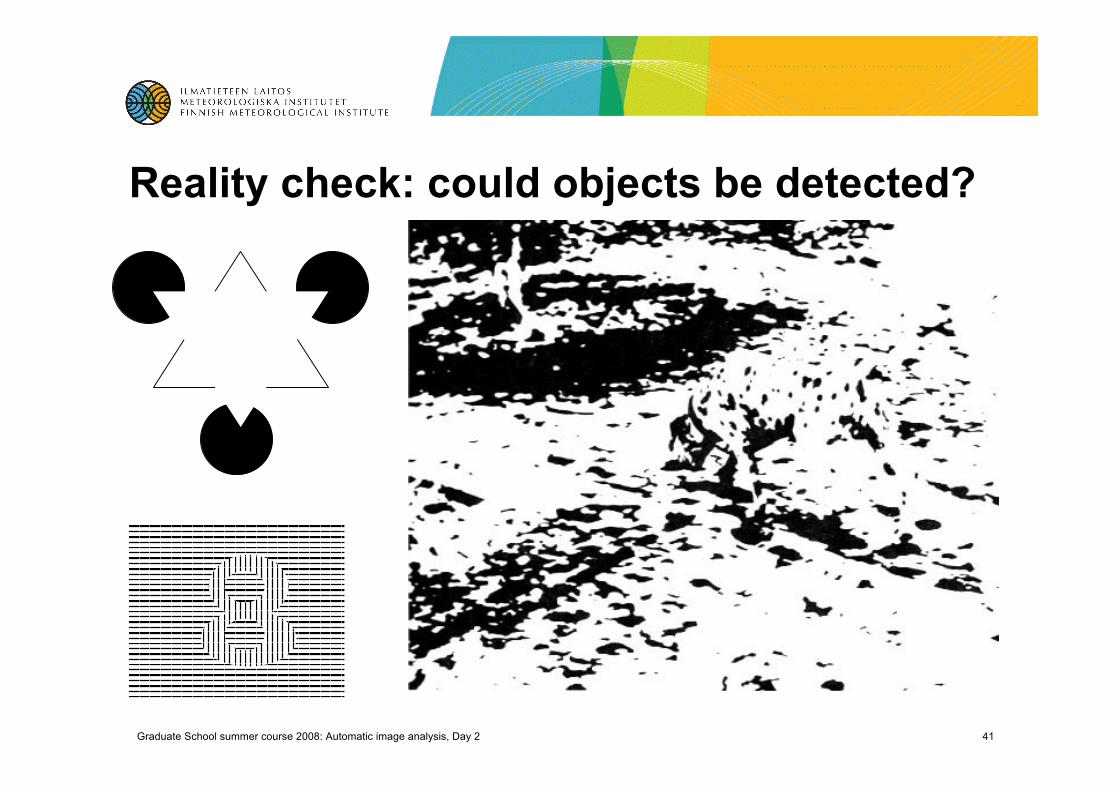
Reality check: could objects be detected?
Graduate School summer course 2008: Automatic image analysis, Day 2 42
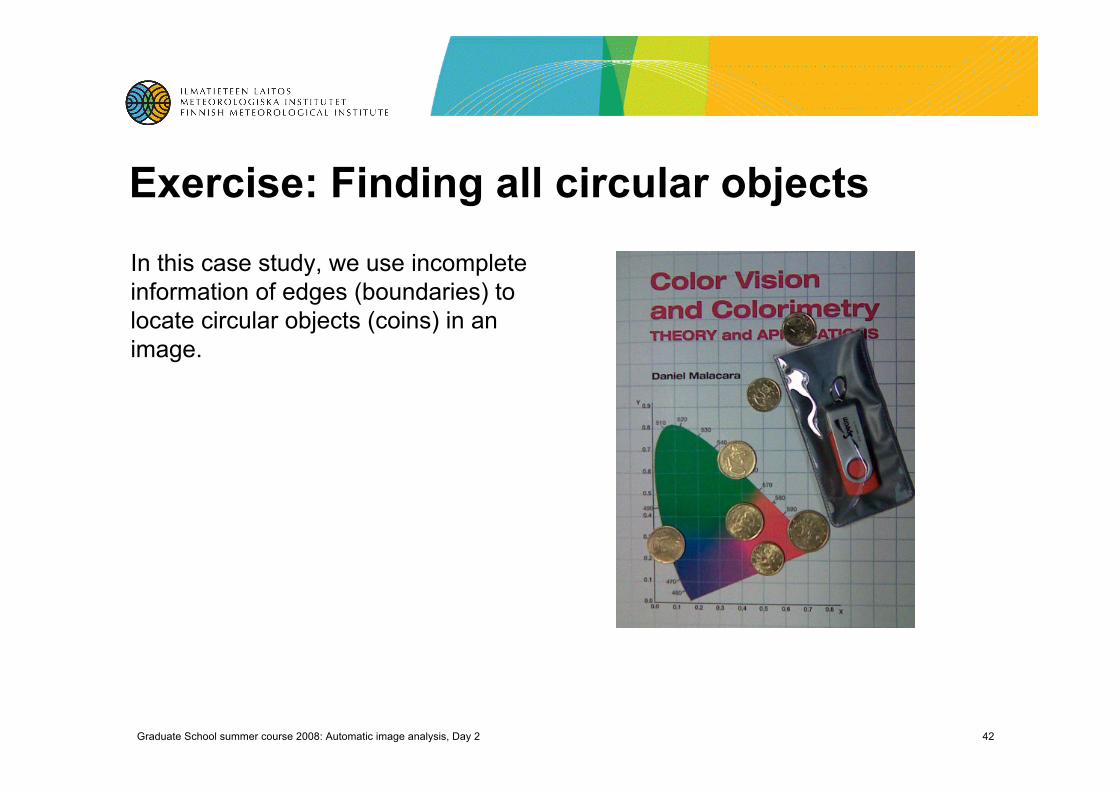
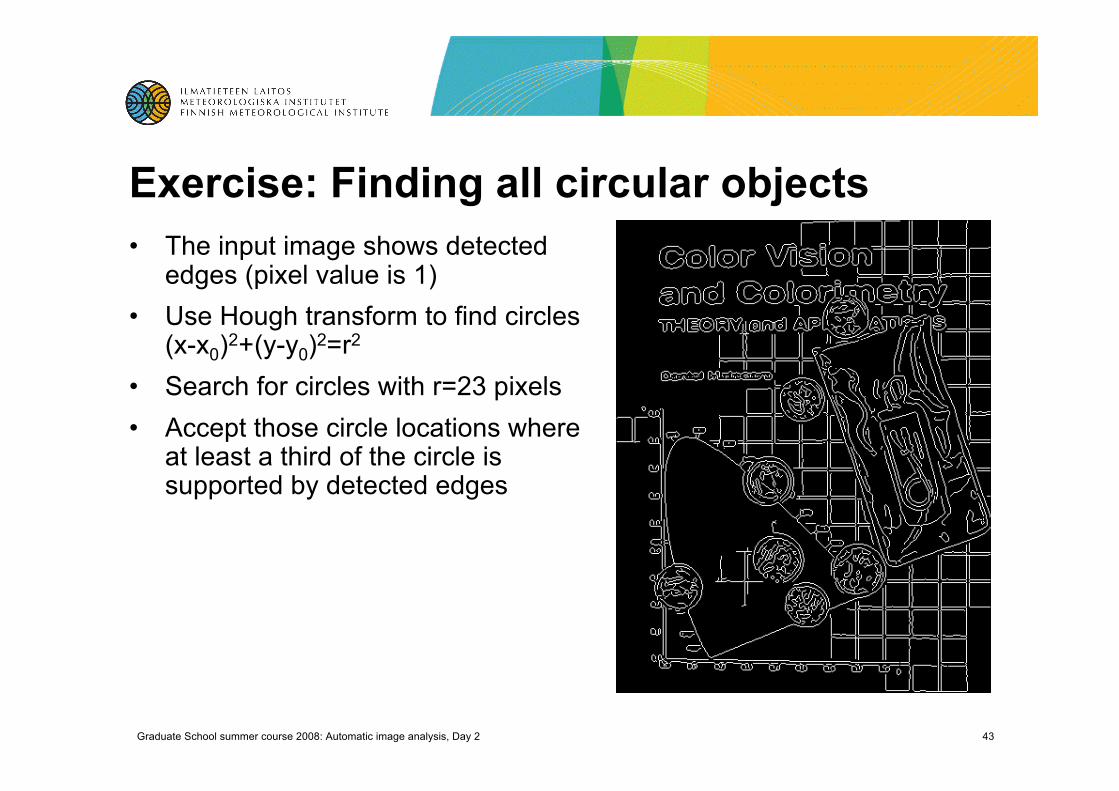
Exercise: Finding all circular objects
In this case study, we use incompleteinformation of edges (boundaries) tolocate circular objects (coins) in animage.
Graduate School summer course 2008: Automatic image analysis, Day 2 43
Exercise: Finding all circular objects• The input image shows detected
edges (pixel value is 1)• Use Hough transform to find circles
(x-x0)2+(y-y0)2=r2
• Search for circles with r=23 pixels• Accept those circle locations where
at least a third of the circle issupported by detected edges