Embed Size (px)
Citation preview

FAKULTÄT FÜR INFORMATIK DER TECHNISCHEN UNIVERSITÄT MÜNCHEN
Masterarbeit in Wirtschaftsinformatik
Automatic Extraction of
Design Decision Relationships
from a Task Management System
Matthias Ruppel

2
FAKULTÄT FÜR INFORMATIK DER TECHNISCHEN UNIVERSITÄT MÜNCHEN
Masterarbeit in Wirtschaftsinformatik
Automatische Extraktion Design von Entscheidungsbeziehungen aus einem Task
Management System
Automatic Extraction of
Design Decision Relationships
from a Task Management System
Bearbeiter: Matthias Ruppel Aufgabensteller: Prof. Dr. Florian Matthes Betreuer: Manoj Mahabaleshwar, Klym Shumaiev Abgabedatum: 15.09.2017

3
I assure the single handed composition of this bachelor thesis only supported by declared resources.
Garching b. München, den 15.09.2017 ________________________
Ort, Datum Unterschrift
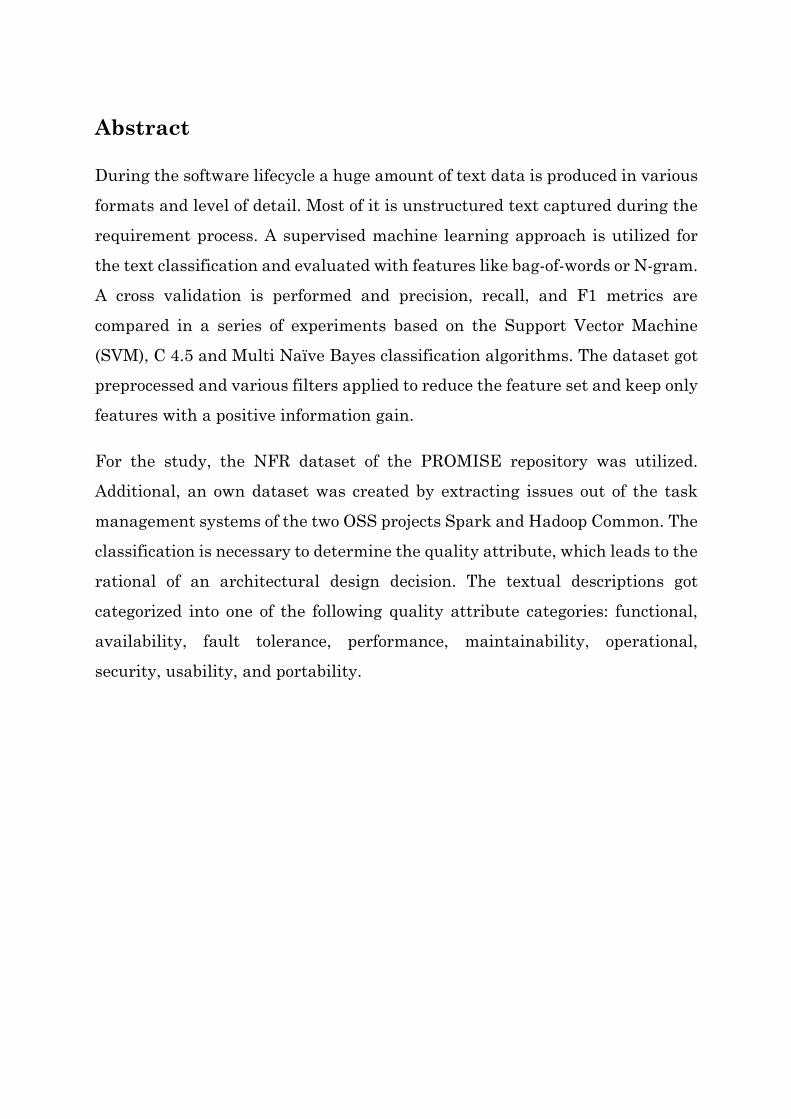
Abstract
During the software lifecycle a huge amount of text data is produced in various formats and level of detail. Most of it is unstructured text captured during the requirement process. A supervised machine learning approach is utilized for the text classification and evaluated with features like bag-of-words or N-gram. A cross validation is performed and precision, recall, and F1 metrics are compared in a series of experiments based on the Support Vector Machine (SVM), C 4.5 and Multi Naïve Bayes classification algorithms. The dataset got preprocessed and various filters applied to reduce the feature set and keep only features with a positive information gain.
For the study, the NFR dataset of the PROMISE repository was utilized. Additional, an own dataset was created by extracting issues out of the task management systems of the two OSS projects Spark and Hadoop Common. The classification is necessary to determine the quality attribute, which leads to the rational of an architectural design decision. The textual descriptions got categorized into one of the following quality attribute categories: functional, availability, fault tolerance, performance, maintainability, operational, security, usability, and portability.
4
Table of contents I. Introduction ......................................................................................................... 7 II. Background Literature .................................................................................... 9
2.1 Architectural Design Decisions ............................................................................. 9 2.2 Non-functional Requirements .............................................................................. 11 2.3 NFRs in Architectural Design .............................................................................. 13 2.4 Classifying Non-Functional Requirements ....................................................... 13 2.5 Relationship between NFRs and Rationale of an ADD .................................. 14 2.6 Evaluation Measures .............................................................................................. 15 2.7 Previous Research .................................................................................................. 17
2.7.1 Casamayor and Godoy ......................................................................................... 17 2.7.2 Zhang and Yang ................................................................................................... 18 2.7.3 Cleland-Huang ..................................................................................................... 18 2.7.4 Rosenhainer .......................................................................................................... 19 2.7.5 Zhang and Yang ................................................................................................... 20 2.7.6 Ott ......................................................................................................................... 20 2.7.7 Slankas and Williams .......................................................................................... 20 2.7.8 Kurtanovic and Maalej ........................................................................................ 21 2.7.9 Other researchers ................................................................................................. 21
III. Methodology ................................................................................................... 23 3.1 Data ............................................................................................................................ 24 3.1.1 PROMISE: NFR ..................................................................................................... 24 3.3 Categories ................................................................................................................. 30 3.4 Algorithms and Classifiers .................................................................................... 30 3.5 Language and Development environment ........................................................ 31 3.6 Packages and Tools ................................................................................................. 32 3.7 Data Preparation and Preprocessing ................................................................. 32
3.7.1 Preparation of the text database ......................................................................... 33 3.7.2 Word parsing and tokenization ........................................................................... 33 3.7.3 Stop-words removal .............................................................................................. 34 3.7.4 Lemmatization and stemming ............................................................................ 35 3.7.5 Feature selection .................................................................................................. 35
3.8 Training and Testing .............................................................................................. 39 3.8.1 SVM ...................................................................................................................... 40 3.8.2 C4.5 ....................................................................................................................... 40 3.8.3 Multinomial Naïve Bayes .................................................................................... 41
IV. Data Analysis and Results ........................................................................... 42 4.1 Keyword Matching .................................................................................................. 43 4.2 Comparison of the applied Machine Learning Algorithms ........................... 45
V. Limitations and Threats to Validity ........................................................... 47 VI. Conclusion and Outlook ............................................................................... 48 References .............................................................................................................. 50
5
List of figures Figure 1 Overall methodology ........................................................................................ 23Figure 2: Document tokenization ................................................................................... 34Figure 3: Subsequent steps after the feature selection ............................................. 36Figure 4: Feature selection .............................................................................................. 37Figure 5: Excerpt of the experiment setup ................................................................... 42
6
List of tables Table 1: Distribution of the PROMISE:NFR dataset ................................................. 25Table 2: Rules for classification of the quality attributes ......................................... 28Table 3: Distribution of the OSS dataset ...................................................................... 30Table 4: Parameters of StringToWordVector Filter of bag-of-words setting ........ 38Table 5: Parameters of StringToWordVector Filter of N-gram setting ................. 39Table 6: Performance of ZeroRule classifier ................................................................. 42Table 7: Evaluation of keyword matching .................................................................... 44Table 8: Comparison of the results, based on Availability (A) ................................. 45Table 9: Comparison of the results, based on Security (SE) .................................... 46Table 10: Attributes with a positive Information Gain value .................................. 46
7
I. Introduction
When a new system is getting developed, functional requirements are very easy to verify if they are fulfilled or not. Nevertheless, it is the success of a software system highly dependent on non-functional requirements (NFRs), which are much harder to capture. If NFRs are not proper fulfilled, significant and costly issues will arise. A recently deployed U.S. Army intelligence sharing application costing $2.7 billion has been labeled as useless due to capacity, performance, and usability issues (Slankas and Williams 2013). Electronic health record (EHR) systems have been severely criticized (for example, the one in Germany) for lack of usability and other non-functional requirements, which has been one of the prime reasons why some EHRs adoption have failed, or only deployed with a great delay like in Germany (Bertman, Skolnik et al. 2010).
Most of the software projects fail even before the first line of code gets written by a developer. In the report presented by May, some other conflicts are listed like vague requirements, poor user inputs while creating requirements, stakeholder conflicts, and poor architecture (May 1998).
JIRA combines issue tracking, agile project management, customizable workflow, and a pluggable integration framework to increase the velocity of the software development team. With JIRA, delivering quality software on time is easier (Mishra and Mishra 2013). The automated categorization (or classification) of texts into predefined categories has gained a lot of interest. Because of the almost unmanageable amount of documents in digital form a real need emerged to organize and classify them. Text classification classifier helps to reduce significantly the needed manpower what is usually needed to manually classify into functional and non-functional requirements (Sebastiani 2002).
8
The goal of this thesis is to systematically extract quality attributes out of an issue or task management system and derive out of this information, the reason behind an architectural design decision. For this, the different text classification settings will be compared and measured how effectively NFR statements can be identified within requirement documents.
The remaining of this paper is organized as follows: The second ‘Background Literature’ discusses related works regarding architectural design decisions (ADD), non-functional requirements and evaluation measures. The section ‘Methodology’ presents a text categorization with the use of machine learning algorithms. The performance of different settings are compared in the section ‘Data Analysis and Results’. The section ‘Limitations and Thread to Validity’ lists possible negative influence factors on the conducted methodology. A conclusion and outlook is provided in the last part.

9
II. Background Literature
2.1 Architectural Design Decisions
A design rationale is the reasoning behind a design and it provides an explanation of the design. The reasoning is usually undocumented or unstructured in practice. This brings the problem that once taken design decisions are hard to understand and it makes it also harder to uncover inconsistencies (Tang 2007).
Tang argues that argumentation-based design rationale methods are not used by the software industry, because of the missing way to use them effectively and include them into the workflow (Tang 2007). If a design decision is not captured, the understanding of the architecture design will vaporize (Perry and Wolf 1992).
Since a design decision is not explicit, it is difficult to review and evaluate the design of the architecture. The architecture design cannot be justified, validated and maintained easily (Tang 2007). When the rationale of the architecture design is captured, it provides a lot of insights into the architecture design.
Perry and Wolf stated, that as architecture design evolves, two effects can be ovserved: architectural erosion and architectural drift (Perry and Wolf 1992). Kruchten et al. defined architecture knowledge as its architecture design and its design rational (Kruchten, Lago et al. 2005).
Researchers suggested many solutions to stop the loss of design rationalization knowledge (Potts and Bruns 1988, Ramesh and Jarke 2001). Tang identified in his previous work, planning and architecture design as the two crucial steps (Tang 2005). The project plan sets the constraints for the architecture design, and the architecture design dictates the required resources in a project (Tang 2007).
10
Software architects use usually their intuition and experience to rationalize about their design decisions. The quality of their decisions depends strongly on the experience of the involved person. The design rationale is one of the key elements of the design decision making process (Dutoit, McCall et al. 2007).
Tang listed a number of frameworks to capture design decisions: ATAM, CBAM, View and Beyond, Use Case Driven Software Development and SeURAT (Tang 2007). For a company it would be beneficial to include one of this frameworks into the development process, because the lack of attention to architecture design usually result in systems with low level of quality. This leads to dissatisfaction of the stakeholders and high maintenance costs (Tang 2007).
11
2.2 Non-functional Requirements Software Requirements Specification (SRS) documents usually contain Non-functional requirements (NFRs) covered within functional requirements, which makes the classification of NFRs expensive regarding costs and time. Functional requirements (FR) can be assessed if they are fulfilled or not, but this kind of measurement does not exist for functional requirements (Tsui, Karam et al. 2016).
NFRs are made of textual sentences whose contents concern the expected qualities of a software system. The textual description, ”The response time of
general student management tasks shall take no longer than 5 seconds and the
response time of schedule generation shall take no longer than 30 seconds. PE” is a NFR instance out of the later described and used PROMISE:NFR dataset. The dataset consists of a textual description and the NFR type, which is performance (PE) in this instance. Such a requirement has a curial influence on a software system. The quality attribute is needed to prevent the software system from failure or dissatisfaction of the stakeholder (Zhang, Yang et al. 2011).
Abad & Karrras identified Time as a key factor to characterize availability, fault tolerance, and performance (Abad, Karras et al. 2017).
Within the requirements engineering community there is no consensus about the naming or definition of non-functional requirements (Glinz 2007). In contrast there is a consensus about the definition of FRs (Glinz 2007). NFRs describe properties and constraints of a software system (Kotonya and Sommerville 1998) and NFRs are usually not explicitly managed (Svensson, Gorschek et al. 2009).
Ghazarian proposed a classification taxonomy for functional requirements (Ghazarian 2012). A characterization of different types of functional requirements is provided. Ghazarian uncovered a taxonomical law, by proving that 85% of the functional requirements can be categorized with 5 requirement
12
categories (Ghazarian 2012). The taxonomy divides functional requirements into the following classes:
1. Data Input: Description of the data items that are to be inputted into the software system.
2. Data Output: The intermediate or final results of the system operations outputted to a device, including the contents of the outputs and the rules for displaying those contents.
3. Data Persistence: Descriptions of all the database related operations including reading, updating, inserting and deleting from/to a database.
4. Data Validation: Description of the validation rules required to ensure the correctness of the inputted data items in terms of the permissible domain of values, the value ranges, and their correct formats.
5. Business Logic: Description of the application or business rules including workflows and calculations that define and govern the operations in a particular application area.
6. Communication: Description of the rules and the contents for electronic communication, such as email communication, between a system and an outside party.
7. Event Trigger: Description of the stimulating actions, such as clicking on a menu item, link, or button, that trigger system operations.
8. User Interface Navigation: Description of the flow of the screens (i.e. the rules for transition between screens) that make up an application.
9. User Interface: Description of the static layout of the pages and screens that make up a system’s user interface.
10. External Call: Description of the function calls between two systems including the description of the parameters used to make such calls and their expected values or responses.
11. User Interface Logic: Description of the dynamic behavior of a system’s User interface (i.e., how the user interface interacts with its users).
12. External Call: Description of the behavior of an operation or function in an external component or system.

13
Motivated by the work of Ghazarian, a set of rules for the manual categorization of Non-functional Requirements are gathered. The quality attributes got derived by the categories and sub-categories presented in International Organization for Standardization ISO 9126 and are presented in the ‘Methodology’ section, where the curation of the OSS dataset gets described.
2.3 NFRs in Architectural Design Projects are usually limited in time and costs, but have usually different quality attribute requirements on the system architecture. During the elicitation process, requirements are kept in various documents and different formats, and usually they are not properly categorized. It is desirable to capture requirements with the respective problem and solution. Non-functional requirements (NFRs) have a strong impact on the architectural design of a software system (Yang, Bhuta et al. 2005). Quality attributes have also a positive influence on the satisfaction of stakeholders (Cleland-Huang, Settimi et al. 2006).
2.4 Classifying Non-Functional Requirements The goal of this thesis is to use text classification (TC) during the Requirements Engineering process, to automatically categorize software requirements statements (SRS) into quality attribute classes, to present them to the respective developer. So far, this labor intensive job is done manually. Software Requirements Specifications (SRS) are written in natural language which include functional and non-functional requirements. Many researchers applied already a text classification on requirements documents (Zhang and Tsai 2003, Cleland-Huang, Settimi et al. 2005).
ElicitO is a software tool, which supports the requirement analysis during the software development process by capturing all relevant non-functional requirements. It provides the user a knowledge repository and guides through elicitation interviews, to document precisely the non-functional requirements (Al Balushi, Sampaio et al. 2007).
14
Another way to guarantee the precise capture of the non-functional requirements, is to extend commonly used frameworks: An enhancement of the UML to better support the expression of NFRs (Cysneiros and do Prado Leite 2004). A similar approach is the elicitation of non-functional requirements during the use case creation with the stakeholder (Dörr, Kerkow et al. 2003).
2.5 Relationship between NFRs and Rationale of an ADD Cleland-HuangandSettimishowedhowtoclassifyNFRsautomaticallyinsoftgoals.Inthis
waytheassociationofsubgoalsandsoftgoalsareshowedwithoutconstructinga labor
intensiveSoftgoalInterdependencyGraph(SIG)(Cleland-Huang,Settimietal.2005).
15
2.6 Evaluation Measures The performance of the classification by the keyword matching method and the text classification with various machine learning algorithm is evaluated by calculating various metrics like accuracy, precision, recall and F-score measure. Nevertheless, it is also important to know that those measurements are biased and should only be used with a clear understanding of the biases, and corresponding identification of chance or base case levels of the statistic (Powers 2011). For example, it is eminent that the usage of only accuracy is not sufficient for an imbalanced data set. Within the application of a classification algorithm to categorize issues extracted of a task management system, such an imbalance could appear, that over 90% of the issues cover i.e. functional requirements and only the remaining 10% have an influence on the quality of the software system. Therefore, it is recommended to use additional measures like F-score (Jiang, Cukic et al. 2008). Therefore, to guarantee comparability of each classification and the models developed in other research paper, all results of the text classifications are shown with the measures accuracy, precision, recall and F-score. True positives and true negatives are correct classified instances of the test dataset. The performance of a classifier increases when false positives (FP) and false negatives (FN) are minimized. It is relatively straight forward to compute the performance measures for a binary classification problem. For a multi class classification (like the classification of quality attributes) provides the book “Data Mining: concepts and techniques” following definition (Han, Pei et al. 2011): True positives (TP) - These refer to the positive instances that were correctly labeled by the classifier. E.g. “TP of PE” is all PE instances that are classified as PE. Let TP be the number of true positives. True negatives (TN) - These are the negative instances that were correctly labeled by the classifier. E.g. “TN of PE” is all non-PE instances that are not
16
classified as PE. Let TN be the number of true negatives. False positives (FP) - These are the negative tuples that were incorrectly labeled as positive. E.g. “FP of PE” is all non-PE instances that are classified as PE. Let FP be the number of false positives. False negatives (FN) - These are the positive tuples that were mislabeled as negative. E.g. “FN of PE” is all PE instances that are not classified as PE. Let FN be the number of false negatives. Out of this values for a specific category the overall performance measures of a multi-classifier can be calculated (Mukkamala 2010): Accuracy is the overall correctness of the model and is calculated as the sum of correct classifications divided by the total number of classifications.
𝐴𝑐𝑐𝑢𝑟𝑎𝑐𝑦 = (𝑇𝑁 + 𝑇𝑃) (𝑇𝑁 + 𝐹𝑁 + 𝐹𝑃 + 𝑇𝑃)
Precision is a measure of the accuracy provided that a specific class has been predicted. It is defined by the formula:
𝑃𝑟𝑒𝑐𝑖𝑠𝑖𝑜𝑛567897:: = TP (TP + FP)
where TP and FP are the numbers of true positive and false positive predictions for the considered class. Precision is a value between 0 and 1. Recall is a measure of the ability of a prediction model to select instances of a certain class from a data set. It is defined by the formula:
RecallCDEFGEHH = TP (TP + FN)
where TP and FN are the numbers of true positive and false negative predictions for the considered class. The sum TP + FN is the total number of test examples of the considered class. The traditional F-score (or F1-score) is the harmonic mean of precision and recall:
𝐹𝑠𝑐𝑜𝑟𝑒 = 2 ∙1
1𝑅𝑒𝑐𝑎𝑙𝑙 +
1𝑃𝑟𝑒𝑐𝑖𝑠𝑖𝑜𝑛
= 2 ∙𝑃𝑟𝑒𝑐𝑖𝑠𝑖𝑜𝑛 ∙ 𝑅𝑒𝑐𝑎𝑙𝑙𝑃𝑟𝑒𝑐𝑖𝑠𝑖𝑜𝑛 + 𝑅𝑒𝑐𝑎𝑙𝑙
In the multi-class and multi-label case, this is the weighted average of the F1 score of each class.
17
2.7 Previous Research The automatic extraction and classification of requirements from text documents has been the focus of many requirements engineering researchers. In the following section, an overview about the preceding research in the field of automatic extraction of quality attributes are provided.
2.7.1 Casamayor and Godoy In 2010, Casamayor and Godoy, et al. presented a method to detect and classify NFRs. This is performed by using semi-supervised learning techniques during the requirement process. The classification is based on a reduced number of categorized requirements by taking advantage of the knowledge provided by uncategorized ones, as well as certain properties of text. The learning method also uses feedback to enhance classification performance (Casamayor, Godoy et al. 2010). A significant amount of requirements has to be manually labeled beforehand. With the help of this initial set of NFRs, further requirements could be evaluated. Classification uses the information of the already categorized requirements and a set of features. The semi-supervised approach resulted in accuracy rates above 70%. For the classification a multinomial Naïve Bayes classifier with an Expectation Maximization algorithm got utilized. For the evaluation of the text classifier the NFR dataset from the PROMISE repository was used. All 12 quality attribute classes were considered, which lead to an unbalanced distribution of data points. A previous study of the same author showed, that semi-supervised machine learning requires less human effort in labeling requirements than fully supervised methods. It can be even more improved, by including the feedback from analysts once integrated within a decision support system for managing requirements (Casamayor, Godoy et al. 2009).
18
2.7.2 Zhang and Yang Zhang and Yang et al. conducted in 2011 an empirical study on using text mining techniques to classify NFRs automatically. Three kinds of index terms, which are at different levels of linguistic semantics, as N-gram’s, individual words, and multi-word expressions (MWE), are used in representation of NFRs. SVM (Support Vector Machine) with a linear kernel as their classifier (Zhang, Yang et al. 2011). The reported precision was higher than of Cleland-Huang et al., although the recall was lower. An interesting result was that index term as individual words with Boolean weighting than MWE and N-gram’s. Automatic classification produces better results on categories of large sizes than on categories of small sizes. Zhang et al. propose to collect as many as possible NFRs of software system.
2.7.3 Cleland-Huang Cleland-Huang wrote in total three papers regarding the topic of automatic extraction of quality attributes. In 2005, he presented a goal-centric approach to managing Non-functional requirements. NFRs got divided into different softgoals of a system and construct a softgoal interdependency graph (SIG) to trace both direct and indirect impacts of software changes on NFRs. Then, a probabilistic network model is used to dynamically retrieve links between classes affected by a functional and elements within the SIG. Constructing a SIG is labor-intensive and time-consuming task because of the lack of automatic approaches (Cleland-Huang, Settimi et al. 2005).
In the following year, the author proposed an information retrieval method to automatically discover and identify NFRs from system specification. Structured and unstructured documents could be used for this method. It gets highly emphasized that, an early detection of NFRs enables system level constraints to be considered and incorporated into early architectural designs in contrast of being refactored at a later time. Different types of NFRs are
19
characterized by distinct keywords (index terms) that can be learned from documents of the respective quality attribute category. However, the method of selecting index terms “as they are” and no linguistic properties of the index terms are considered. (Cleland-Huang, Settimi et al. 2006).
The last paper, covers the automatic extraction of NFRs and got published by Cleland-Huang, et al in 2007: An iterative approach is introduced to detect and classify non-functional requirements in datasets which are completely different to the initial training sets. The classifier uses information retrieval methods to find and identify NFRs. The method assumes that different types of NFR are characterized by the use of relatively distinct keywords that are called ‘indicator terms’. When those indicator terms are learned for a specific NFR type, they can be used to detect requirements, sentences, or phrases, related to this type (Cleland-Huang, Settimi et al. 2007).
During the first phase of the research, a keyword matching on the datasets got performed and evaluated in the chapter ‘Data Analysis and Results’ by using the Keywords extracted of the last two papers published by Cleland-Huang. The research paper is building the theoretical foundation of combining the rational of an architectural design decision with quality attributes.
2.7.4 Rosenhainer Rosenhainer proposed that identifying and documenting early crosscutting concerns is critical in requirements specifications. Two techniques are suggested to be used for this: identification through inspection and an identification supported by information retrieval (IR). The first aspect is done manually and the second semi-automatic. The identification of requirements-level crosscutting concerns has been neglected in software projects which lead to project failures in many cases. Rosenhainer found that IR based technique had better results than the manual method. The relation between functional and non-functional requirements have validated his findings (Rosenhainer 2004).
20
2.7.5 Zhang and Yang In the study conducted by Zhang and Yang, a vector space model and machine learning technique are employed to classify NFRs automatically. Index terms were used to transfer NFRs into numeric vectors and measured on their performances on the automatic classification of NFRs. As a machine learning classifier SVM with linear kernel and information gain for feature selection got utilized. The experiments suggested that individual words, when used as the index terms, have the best performance in classifying NFRs automatically (Zhang, Yang et al. 2011).
2.7.6 Ott Ott showed how an automatic classification of requirements can be used to improve the review process and introduced a model of a socio-technical system for requirement classification. He evaluated the model within the automotive industry by comparing manual, semi-automatic, fully-automatic classification of requirements with a team of ten practitioners. The automatic classification of requirements for multiple aspects is feasible with a high accuracy (Ott 2013).
2.7.7 Slankas and Williams Slankas and Williams developed an approach to effectively extracting non-functional requirements in available natural language documents through automated natural language processing. They examined data of agreements, install manuals, regulations, request for proposals, requirements specifications, and user manuals for present NFRs. Those non-functional requirements were categorized into 14 categories. For this, they used a word vector representation of the NFRs together with Support Vector Machine (SVM), K-Nearest Neighbor and Naive Bayes classifier (Slankas and Williams 2013).
21
2.7.8 Kurtanovic and Maalej Kurtanovic and Maalej categorized functional requirements and non-functional requirements with supervised machine learning. A binary classifier got utilized to differentiate between functional requirements and non-functional requirements.
The result got used as the input for a multi-class classifier to identifying usability, security, operational, and performance NFRs. The precision of over 90% got achieved by using Support Vector Machine and using lexical features (Kurtanovic and Maalej 2017).
2.7.9 Other researchers Tran and Chung presented a tool to explicitly represent NFRs. The approach was, to consider NFRs as the root of a design goal which influences the solution as well as having an impact on the development. To show implicit relationships of NFRs, ontology and graphic visualization are used to express softgoals and their interdependency (Tran and Chung 1999).
Rahimi and Cleland-Huang presented a data mining approach for automatic extraction and modeling of quality concerns from requirements. A basic goal model from the requirements specification is build and each concern is modeled as a softgoal (Rahimi, Mirakhorli et al. 2014).
Knauss and Cleland-Huang extracted clarification patterns from software team communication artifacts within the lifecycle of a requirement. A Naive Bayes approach got utilized to automatically detect requirements (Knauss, Damian et al. 2012).
Hussain and Kosseim used linguistic knowledge to classify non-functional
22
requirements in SRS (Software Requirements Specification) documents (Hussain, Kosseim et al. 2008).

23
III. Methodology
In this chapter the methods, techniques, data & tools, data preparation & data preprocessing, and training & testing that were used during the master thesis for the text classification and categorization of quality attribute are detailed and extensively discussed. In the depicted figure 1 is the overall methodology shown in a block diagram, adapted by (Selvakumar and Rajaram 2011).
Figure 1 Overall methodology
24
3.1 Data For a performant text classification with a high accuracy, it is important to have a reliable set of data. For this thesis two dataset got used: The NFR dataset from the PROMISE repository and an own dataset was created. The developed dataset was sampled and extracted from the task management system of two open source projects. The domain of the datasets is different and the time of elicitation within the software lifecycle is also different. The datasets are available as comma separated (CSV) file and as attribute-relation file format (ARFF) file. The header section of the ARFF file got enhanced with all necessary meta information. Both sets contain around 700 instances.
3.1.1 PROMISE: NFR To train the machine learning algorithm to automatically categorize issues of a task management system into quality attributes a dataset is needed. A dataset which depicts fully all facets of this use case was not public accessible. The NFR dataset from the PROMISE web site (http://promisedata.org/repository) was the closest to the prerequisites. It consists of 625 natural language requirements (255 functional requirements and 370 non-functional requirements) gathered during the conceptual phase of software projects. The requirements are categorized into 10 quality requirement categories: Availability (A), Look & Feel (LF), Maintainability (MN), Operability (O), Performance (PE), Scalability (SC), Security (SE), Usability (US), Fault Tolerance (FT), and Portability (PO) and one constraint category: Legal & Licensing (L). Additional, it occurs that the category Functionality (F), which is the largest proportion in the data set, amount for 40.8% of the dataset. Table 1 shows the distribution of the dataset. The table shows that some classes of the NFR dataset are underrepresented. There is a skew distribution among the NFR categories in the data set: The largest category ‘usability’ has 67 instances while the smallest category ‘Portability’ has only one instance. These categories constitute the ground truth for the research. There are three attributes in the set: Project id, requirement text and class. The first allows the assignation to

25
15 different projects, while the second column contains the entire text of a particular requirement. The third column is the quality attribute of the corresponding text in column 2. Potential issues with such a dataset are the underrepresentation of some categories (Witten, Frank et al. 2016) with class imbalances. He proposes strategies for machine learning algorithm under imbalanced learning scenarios (He and Garcia 2009). The issue with rare instances of a target class and rare instances are very similar phenomena (Weiss 2004).
Requirements Class #Requirements Percent Functional (F) 255 40.80% Availability (A) 21 3.36% Fault Tolerance (FT) 10 1.60% Legal (L) 13 2.08% Look & Feel (LF) 38 6.08% Maintainability (MN) 17 2.72% Operational (O) 62 9.92% Performance (PE) 54 8.64% Portability (PO) 1 0.16% Scalability (SC) 21 3.36% Security (SE) 66 10.56% Usability (US) 67 10.72% Total 625 100%
Table 1: Distribution of the PROMISE:NFR dataset
3.1.2 OSS Dataset Data extraction Design decisions can be classified into different abstraction levels: high-level, medium-level, and realization-level decisions (van der Ven and Bosch 2013). Within development phase of the software lifecycle the taken decisions, tracked in a task management system, are either medium-level or realization-level decisions (Bhat, Shumaiev et al. 2017).
26
Since the problem statement of this thesis states a task management system as the environment for the classification, the requirement statements gathered during the conceptual phase were not sufficient to learn and compare different machine learning algorithms. The dataset of research based on the automatic extraction of design decisions from issue management systems conducted at the chair of Software Engineering for Business Information Systems (sebis) got used as a starting point. The dataset contained 778 issues from the open source projects Apache Spark and Apache Hadoop common. The JIRA task management system of those two open source software (OSS) projects is publicly accessible and is comparable to similar systems used in business applications. The dataset got downloaded in the CSV format from SocioCortex (http://www.sociocortex.com/), a AKM tool developed at the aforementioned chair of TUM.
Data curation Not all constituents of an issue got extracted from the task management system. The properties summary and description are normally the instructions for the developer and therefore sufficient for the categorization of the quality attribute. Comments got neglected during this categorization. At the beginning all extracted issues were cleaned up by removing code snippets, comments and URLs embedded within the running text. The goal was to allow a focus on the information provided by natural language.
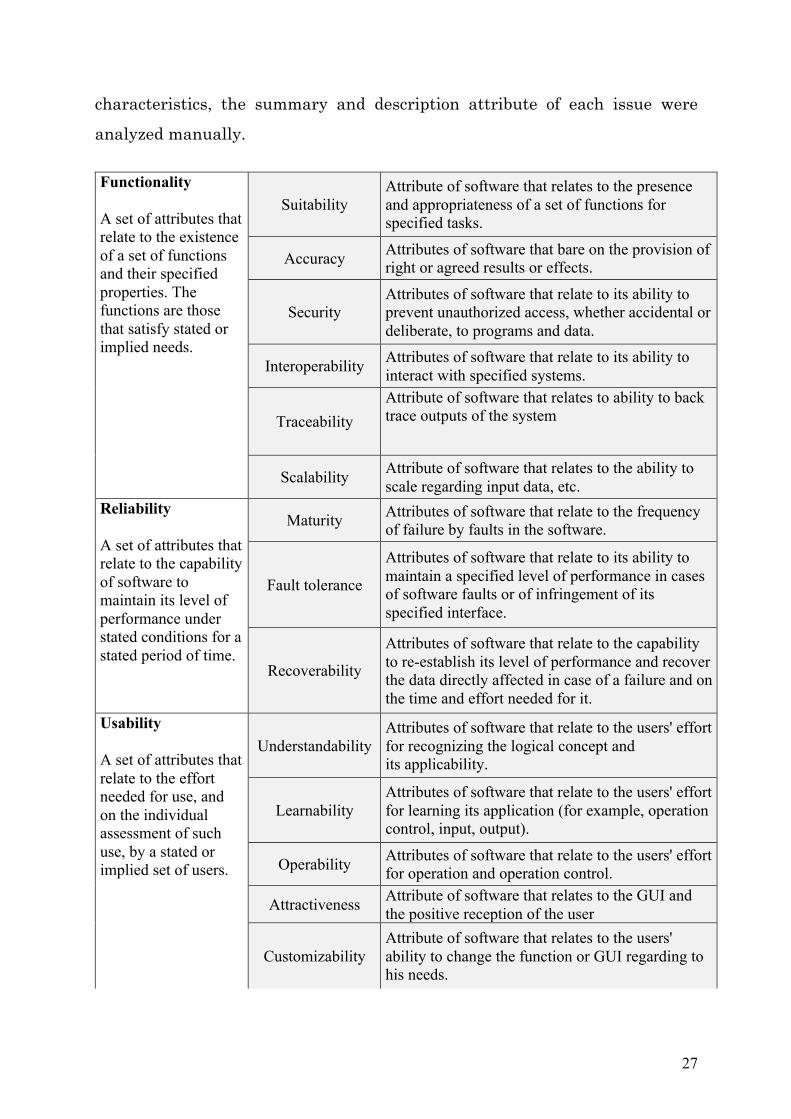
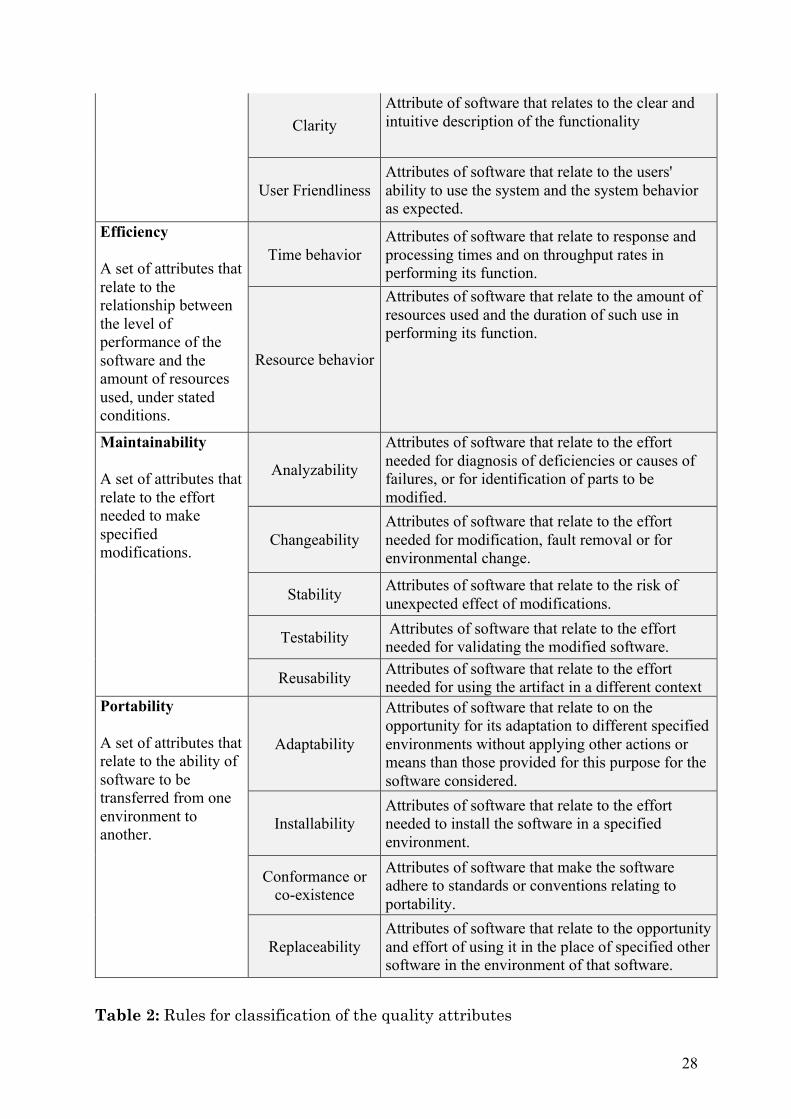
Manual Labeling During the manual labeling table 2 based on Berander, et al. and ISO 9126 were used to ensure a proper classification of the issues (Berander, Damm et al. 2005). The original characterization got enhanced to match with the ISO 9126 standard. There is no exact definition of quality attributes within software projects which could be used as a reference. Based on the aforementioned
27
characteristics, the summary and description attribute of each issue were analyzed manually. Functionality A set of attributes that relate to the existence of a set of functions and their specified properties. The functions are those that satisfy stated or implied needs.
Suitability Attribute of software that relates to the presence and appropriateness of a set of functions for specified tasks.
Accuracy Attributes of software that bare on the provision of right or agreed results or effects.
Security Attributes of software that relate to its ability to prevent unauthorized access, whether accidental or deliberate, to programs and data.
Interoperability Attributes of software that relate to its ability to interact with specified systems.
Traceability Attribute of software that relates to ability to back trace outputs of the system
Scalability Attribute of software that relates to the ability to scale regarding input data, etc.
Reliability A set of attributes that relate to the capability of software to maintain its level of performance under stated conditions for a stated period of time.
Maturity Attributes of software that relate to the frequency of failure by faults in the software.
Fault tolerance
Attributes of software that relate to its ability to maintain a specified level of performance in cases of software faults or of infringement of its specified interface.
Recoverability
Attributes of software that relate to the capability to re-establish its level of performance and recover the data directly affected in case of a failure and on the time and effort needed for it.
Usability A set of attributes that relate to the effort needed for use, and on the individual assessment of such use, by a stated or implied set of users.
Understandability Attributes of software that relate to the users' effort for recognizing the logical concept and its applicability.
Learnability Attributes of software that relate to the users' effort for learning its application (for example, operation control, input, output).
Operability Attributes of software that relate to the users' effort for operation and operation control.
Attractiveness Attribute of software that relates to the GUI and the positive reception of the user
Customizability Attribute of software that relates to the users' ability to change the function or GUI regarding to his needs.
28
Clarity Attribute of software that relates to the clear and intuitive description of the functionality
User Friendliness Attributes of software that relate to the users' ability to use the system and the system behavior as expected.
Efficiency A set of attributes that relate to the relationship between the level of performance of the software and the amount of resources used, under stated conditions.
Time behavior Attributes of software that relate to response and processing times and on throughput rates in performing its function.
Resource behavior
Attributes of software that relate to the amount of resources used and the duration of such use in performing its function.
Maintainability A set of attributes that relate to the effort needed to make specified modifications.
Analyzability
Attributes of software that relate to the effort needed for diagnosis of deficiencies or causes of failures, or for identification of parts to be modified.
Changeability Attributes of software that relate to the effort needed for modification, fault removal or for environmental change.
Stability Attributes of software that relate to the risk of unexpected effect of modifications.
Testability Attributes of software that relate to the effort needed for validating the modified software.
Reusability Attributes of software that relate to the effort needed for using the artifact in a different context
Portability A set of attributes that relate to the ability of software to be transferred from one environment to another.
Adaptability
Attributes of software that relate to on the opportunity for its adaptation to different specified environments without applying other actions or means than those provided for this purpose for the software considered.
Installability Attributes of software that relate to the effort needed to install the software in a specified environment.
Conformance or co-existence
Attributes of software that make the software adhere to standards or conventions relating to portability.
Replaceability Attributes of software that relate to the opportunity and effort of using it in the place of specified other software in the environment of that software.
Table 2: Rules for classification of the quality attributes
29
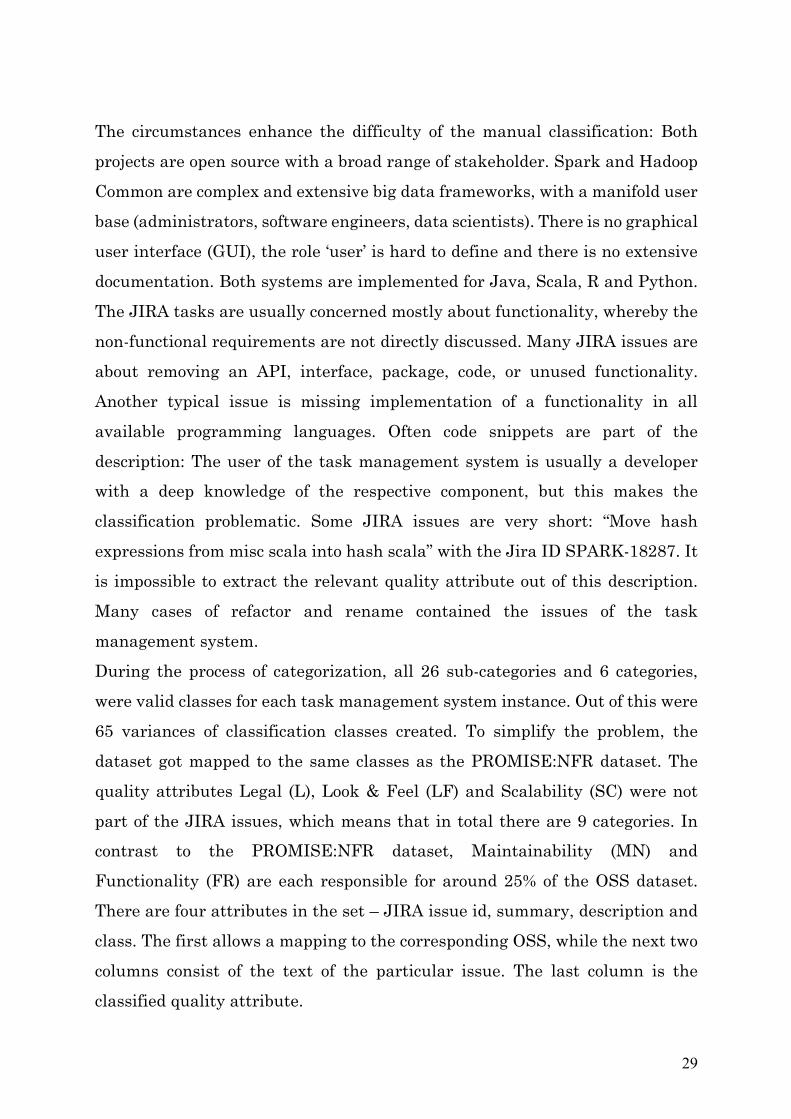
The circumstances enhance the difficulty of the manual classification: Both projects are open source with a broad range of stakeholder. Spark and Hadoop Common are complex and extensive big data frameworks, with a manifold user base (administrators, software engineers, data scientists). There is no graphical user interface (GUI), the role ‘user’ is hard to define and there is no extensive documentation. Both systems are implemented for Java, Scala, R and Python. The JIRA tasks are usually concerned mostly about functionality, whereby the non-functional requirements are not directly discussed. Many JIRA issues are about removing an API, interface, package, code, or unused functionality. Another typical issue is missing implementation of a functionality in all available programming languages. Often code snippets are part of the description: The user of the task management system is usually a developer with a deep knowledge of the respective component, but this makes the classification problematic. Some JIRA issues are very short: “Move hash expressions from misc scala into hash scala” with the Jira ID SPARK-18287. It is impossible to extract the relevant quality attribute out of this description. Many cases of refactor and rename contained the issues of the task management system. During the process of categorization, all 26 sub-categories and 6 categories, were valid classes for each task management system instance. Out of this were 65 variances of classification classes created. To simplify the problem, the dataset got mapped to the same classes as the PROMISE:NFR dataset. The quality attributes Legal (L), Look & Feel (LF) and Scalability (SC) were not part of the JIRA issues, which means that in total there are 9 categories. In contrast to the PROMISE:NFR dataset, Maintainability (MN) and Functionality (FR) are each responsible for around 25% of the OSS dataset. There are four attributes in the set – JIRA issue id, summary, description and class. The first allows a mapping to the corresponding OSS, while the next two columns consist of the text of the particular issue. The last column is the classified quality attribute.
30
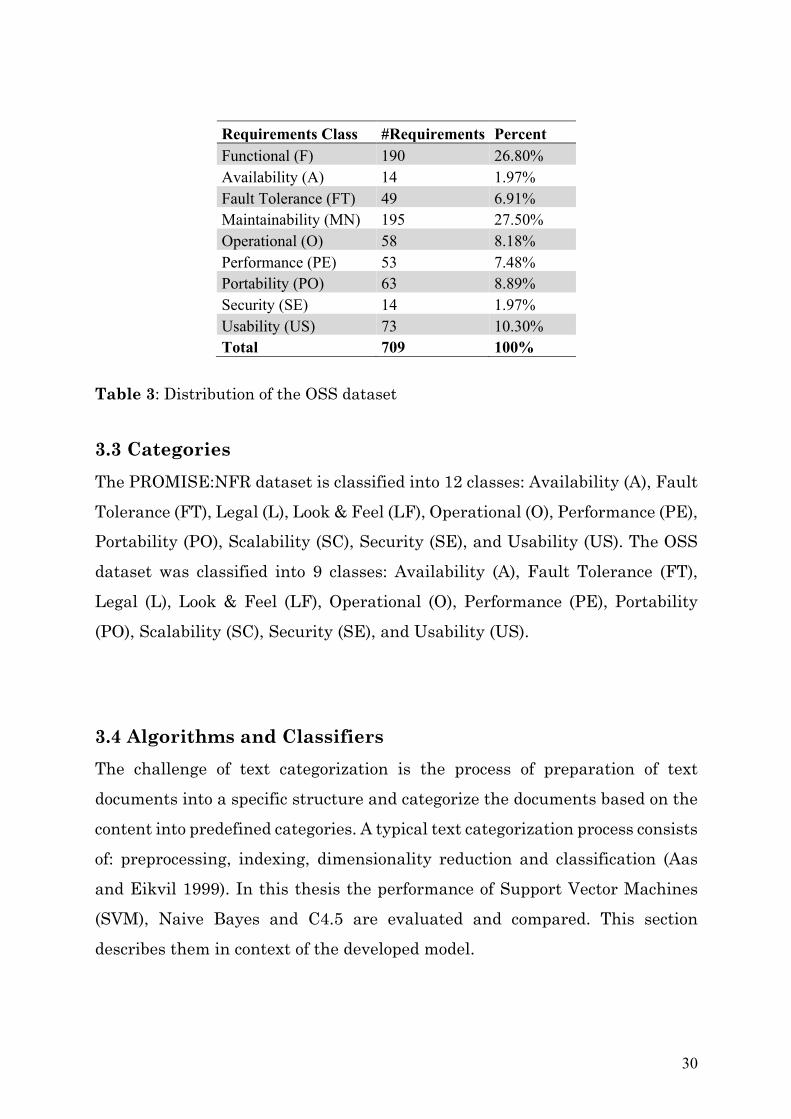
Requirements Class #Requirements Percent Functional (F) 190 26.80% Availability (A) 14 1.97% Fault Tolerance (FT) 49 6.91% Maintainability (MN) 195 27.50% Operational (O) 58 8.18% Performance (PE) 53 7.48% Portability (PO) 63 8.89% Security (SE) 14 1.97% Usability (US) 73 10.30% Total 709 100%
Table 3: Distribution of the OSS dataset
3.3 Categories The PROMISE:NFR dataset is classified into 12 classes: Availability (A), Fault Tolerance (FT), Legal (L), Look & Feel (LF), Operational (O), Performance (PE), Portability (PO), Scalability (SC), Security (SE), and Usability (US). The OSS dataset was classified into 9 classes: Availability (A), Fault Tolerance (FT), Legal (L), Look & Feel (LF), Operational (O), Performance (PE), Portability (PO), Scalability (SC), Security (SE), and Usability (US).
3.4 Algorithms and Classifiers The challenge of text categorization is the process of preparation of text documents into a specific structure and categorize the documents based on the content into predefined categories. A typical text categorization process consists of: preprocessing, indexing, dimensionality reduction and classification (Aas and Eikvil 1999). In this thesis the performance of Support Vector Machines (SVM), Naive Bayes and C4.5 are evaluated and compared. This section describes them in context of the developed model.

31
In its first version, a trivial classification based on the appearance of certain words got implemented. The keywords were extracted from previous research and evaluated regarding the performance analysis (Cleland-Huang, Settimi et al.
2007), (Slankas and Williams 2013). No preprocessing of the data got performed. A custom Scala program reads the unstructured files line by line, analyzes the buffered data for the appearance of keywords, and marks them with the applicable category. The performance was rather unsatisfying and can be found in the Data Analysis and Results section.
3.5 Language and Development environment The text mining and text classification were evaluated with the help of the data mining and machine learning platform WEKA (Weikato Environment for Knowledge Analysis). The development of the original version of WEKA started 1993 at the University of Waikato, New Zealand. In 1997 the software got rewritten from scratch in Java, including the implementation and algorithms. The open source software is issued under the GNU General Public License (GPL v2) and further developed and maintained by the Machine Learning Group of the University of Waikato. WEKA supports several standard data mining tasks such as classification, clustering and visualization that can be used for practical data mining and machine learning works. WEKA is in both academia and business far-reaching and has an active community. The software got downloaded more than 1.4 million times from SourceForge, since the release in April 2000 (Hall, Frank et al. 2009).
For all subsequent evaluations both Graphical User Interface (GUI) and Java Archive (JAR) of WEKA in version 3.8.1 were used. For some tasks, custom JAVA code got implemented. Models can be created using the GUI, the Simple CLI or within JAVA code and can be used interchangeable. Additional there is no platform dependency of the WEKA artifacts. The native data format is the ARFF file format, but C4.5, CSV, and XRRF data files are also supported. During the research the ARFF (attribute-relation file format) format was used,
32
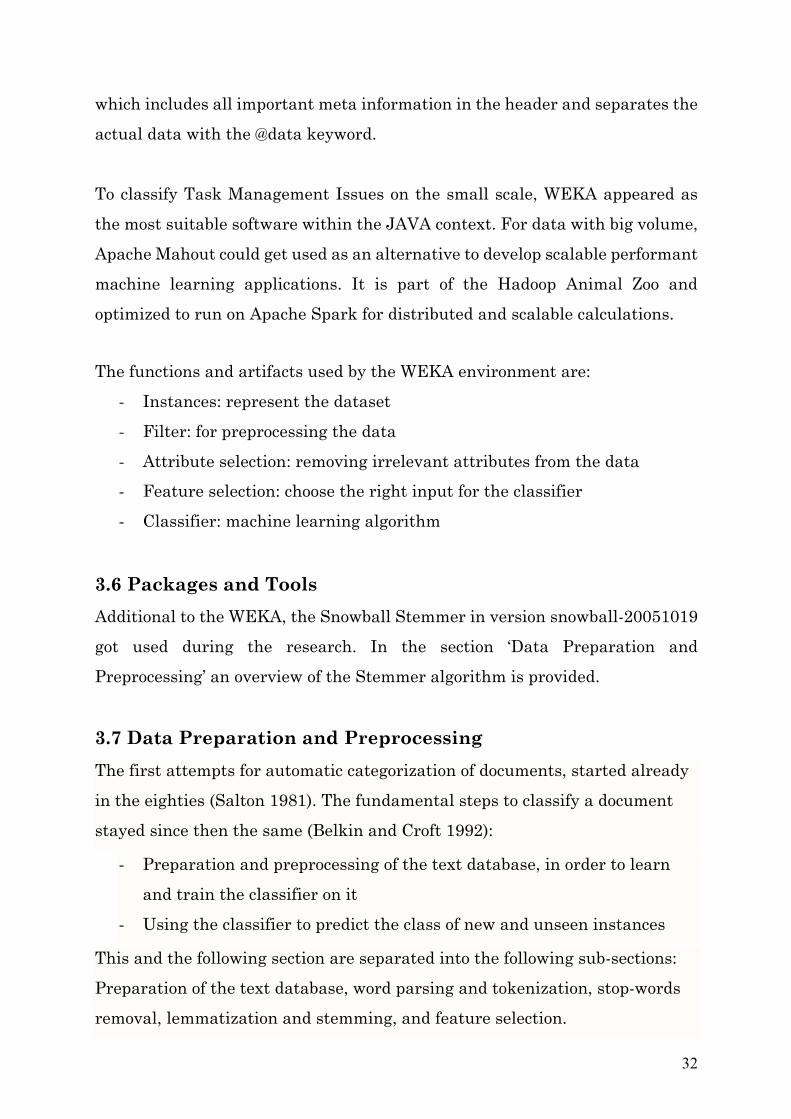
which includes all important meta information in the header and separates the actual data with the @data keyword. To classify Task Management Issues on the small scale, WEKA appeared as the most suitable software within the JAVA context. For data with big volume, Apache Mahout could get used as an alternative to develop scalable performant machine learning applications. It is part of the Hadoop Animal Zoo and optimized to run on Apache Spark for distributed and scalable calculations.
The functions and artifacts used by the WEKA environment are: - Instances: represent the dataset - Filter: for preprocessing the data - Attribute selection: removing irrelevant attributes from the data - Feature selection: choose the right input for the classifier - Classifier: machine learning algorithm
3.6 Packages and Tools Additional to the WEKA, the Snowball Stemmer in version snowball-20051019 got used during the research. In the section ‘Data Preparation and Preprocessing’ an overview of the Stemmer algorithm is provided.
3.7 Data Preparation and Preprocessing The first attempts for automatic categorization of documents, started already in the eighties (Salton 1981). The fundamental steps to classify a document stayed since then the same (Belkin and Croft 1992):
- Preparation and preprocessing of the text database, in order to learn and train the classifier on it
- Using the classifier to predict the class of new and unseen instances
This and the following section are separated into the following sub-sections: Preparation of the text database, word parsing and tokenization, stop-words removal, lemmatization and stemming, and feature selection.
33
3.7.1 Preparation of the text database As a first step of the proposed methodology, the dataset of the OSS projects, the CSV file got loaded into Microsoft Excel. The manual labeling process was performed and the relevant information got exported into a CSV file. The file needed a conversion into the UTF-8 file format. In an iterative process encoding and formatting errors got removed. The text contained non English characters such as @, #, $, &, ^. Those characters were removed, since those are insignificant for the classification process. This ensured a proper base for a use within a custom Scala implementation and also for WEKA. This preparation concerned mainly the OSS dataset. The PROMISE NFR dataset is provided as a ARFF file, and needed no preparation.
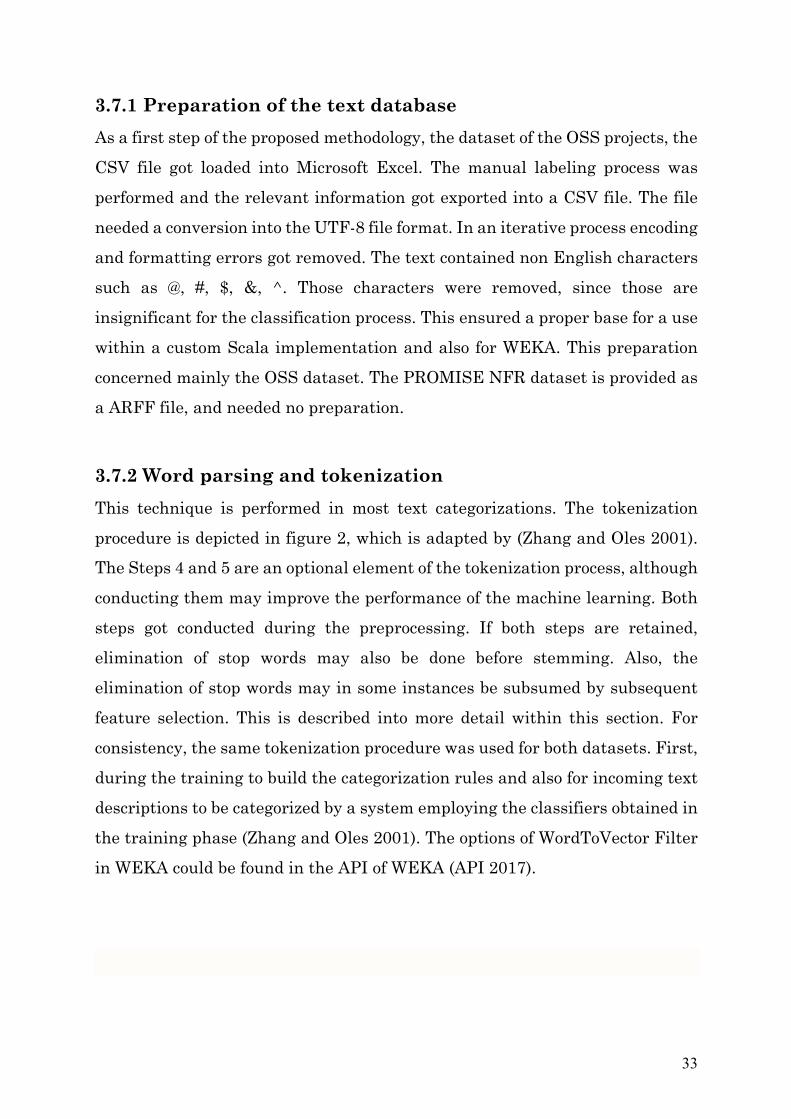
3.7.2 Word parsing and tokenization This technique is performed in most text categorizations. The tokenization procedure is depicted in figure 2, which is adapted by (Zhang and Oles 2001). The Steps 4 and 5 are an optional element of the tokenization process, although conducting them may improve the performance of the machine learning. Both steps got conducted during the preprocessing. If both steps are retained, elimination of stop words may also be done before stemming. Also, the elimination of stop words may in some instances be subsumed by subsequent feature selection. This is described into more detail within this section. For consistency, the same tokenization procedure was used for both datasets. First, during the training to build the categorization rules and also for incoming text descriptions to be categorized by a system employing the classifiers obtained in the training phase (Zhang and Oles 2001). The options of WordToVector Filter in WEKA could be found in the API of WEKA (API 2017).
34
3.7.3 Stop-words removal A common technique is the discard of recurring words like conjunctions, prepositions, base verbs, etc. Those terms got removed from the datasets, because the poor characterizing makes them unsuitable for text classification. Different datasets of stop word exist: Because of the amount and the blandness character of the words, the dataset provided by the Princeton University got used during the preprocessing (Princeton University, 2017).
1. Read in document d.
2. Segment document d into sections (if any) whose separate identity is significant for categorization.
5. Delete stopwords, i.e., common words not useful for categorization.
4. Convert all tokens to canonical forms, i.e., do stemming.
3. Tokenize each section that contains text.
6. Output a tokenized representation of the document from which the list of tokens in each section can be
determined.
Figure 2: Document tokenization

35
3.7.4 Lemmatization and stemming The lemmatization of a word is the process of determining its lemma. The lemma could be understood as the “common root” of various related inflectional forms. An example for this would be security, secured and secure are all derived from the lemma secure. An application for approximated lemmatization is the stemming. Stemming algorithms work by removing the suffix of the word, according to some grammatical rules for use in Information Retrieval.
The idea of stemming is to improve the IR performance generally, by bringing the meaning of a word under one heading variant form. The ground base got laid out by Porter, which is the reason why the technique is sometimes Porter stemming algorithm (Porter 1980). When using stemming with WEKA, ‘porter’ has to be selected for English texts. The original Porter stemmer got developed for English, but on the Snowball Stemming website many other languages are provided. German is suitable for the Stemming, but for Chinese it is not an appropriate technique.
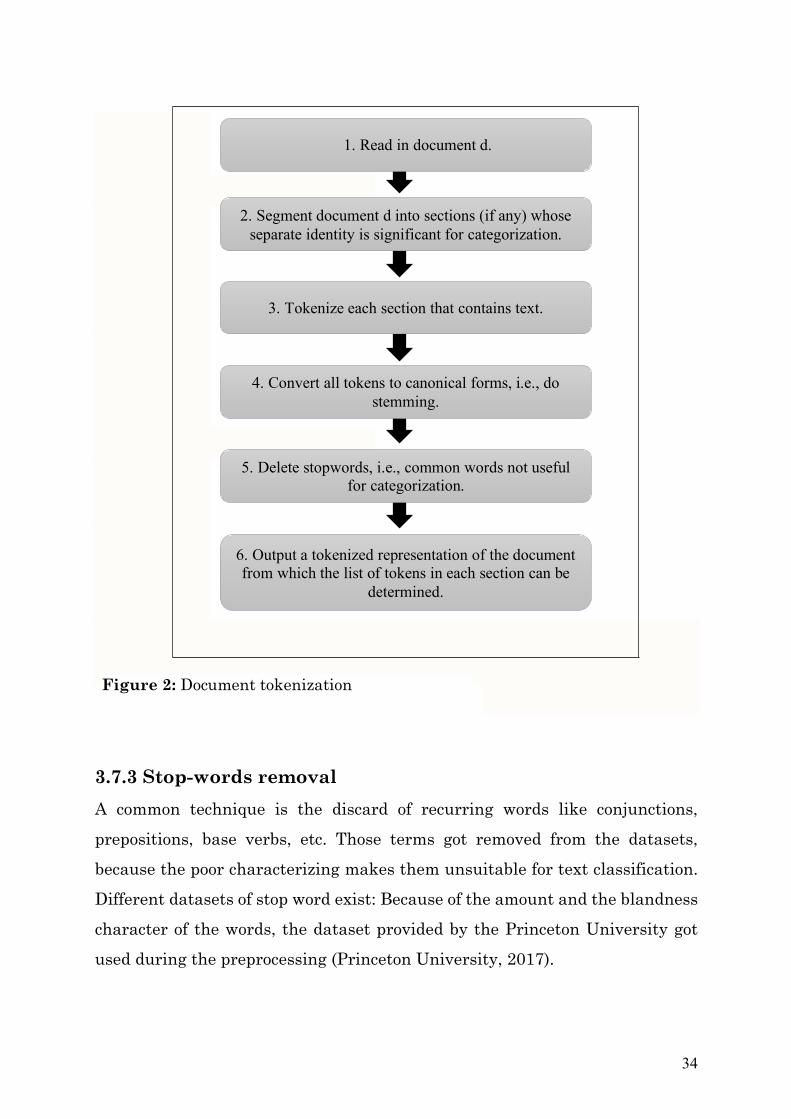
3.7.5 Feature selection The preceding steps result in a set of terms, which still could be further refined, by removing terms that have a low prediction ability regarding the categories or which are strongly correlated with other terms. The feature selection phase usually leads to a more efficient classification. The subsequent steps after the feature selection are depicted in figure 3, adapted by (Wongpun and Srivihok 2008).
36
It is beneficial to evaluate a number of different views of the machine learning dataset. A view of the dataset is a subset of features, ascertained with feature selection. The most popular techniques are: Correlation based feature selection, information gain based feature selection and learner based feature selection.
In this research Information Gain (IG) was utilized for feature selection (Vapnik 2013), (Rosenhainer 2004). It is a classic method for feature selection in machine learning, and will be used in this context to select informative index terms for the automatic classification of quality attributes. IG is defined as the expected reduction in entropy caused by partitioning NFRs according to a given term (Vapnik 2013).
Within WEKA, Information Gain can be applied, by using the supervised attribute filter AttributeSelection. The filter has determining input parameter: Evaluator and Search. For the Evaluator the InfoGainAttributeEval were used and Ranker for the search. By setting the threshold of the ranker to 0, only attributes with a positive Information Gain stay as features in the dataset. After using this function the PROMISE:NFR 1297 words were reduced to 45 words and the 10873 N-gram’s were reduced to 93. In the OSS dataset out of 3417 word only 18 and from the 54883 N-gram’s 27 stayed.
Feature Selection
Model Specification and Selection
Evaluation Model Estimation
Figure 3: Subsequent steps after the feature selection
37
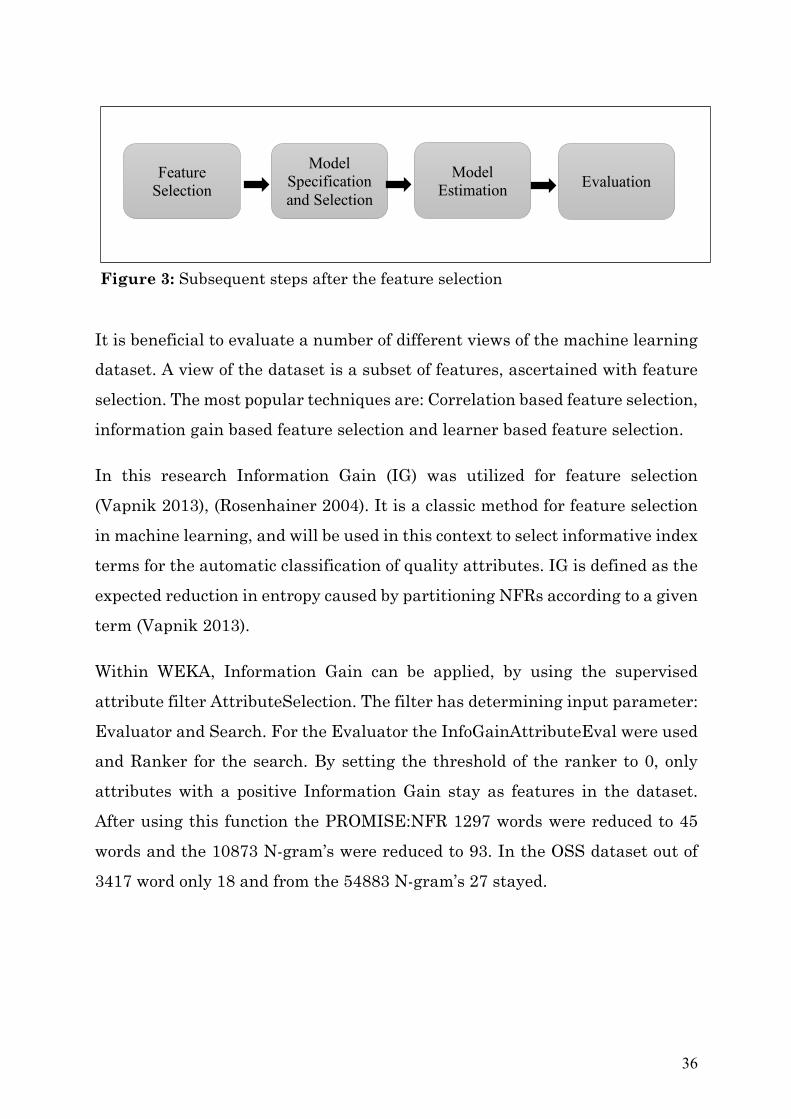
The preprocessing settings were modified using the Weka StringToWordVector Filter. The filter converts String attributes into a set of attributes representing word occurrence (depending on the tokenizer) information from the text contained in the strings. The set of attributes is determined by the first training dataset (API 2017). The most important properties of this filter are: TFTransform/IDFTransform, lowerCaseTokens, minTermFreq, stemmer, tokenizer, and stopwords.
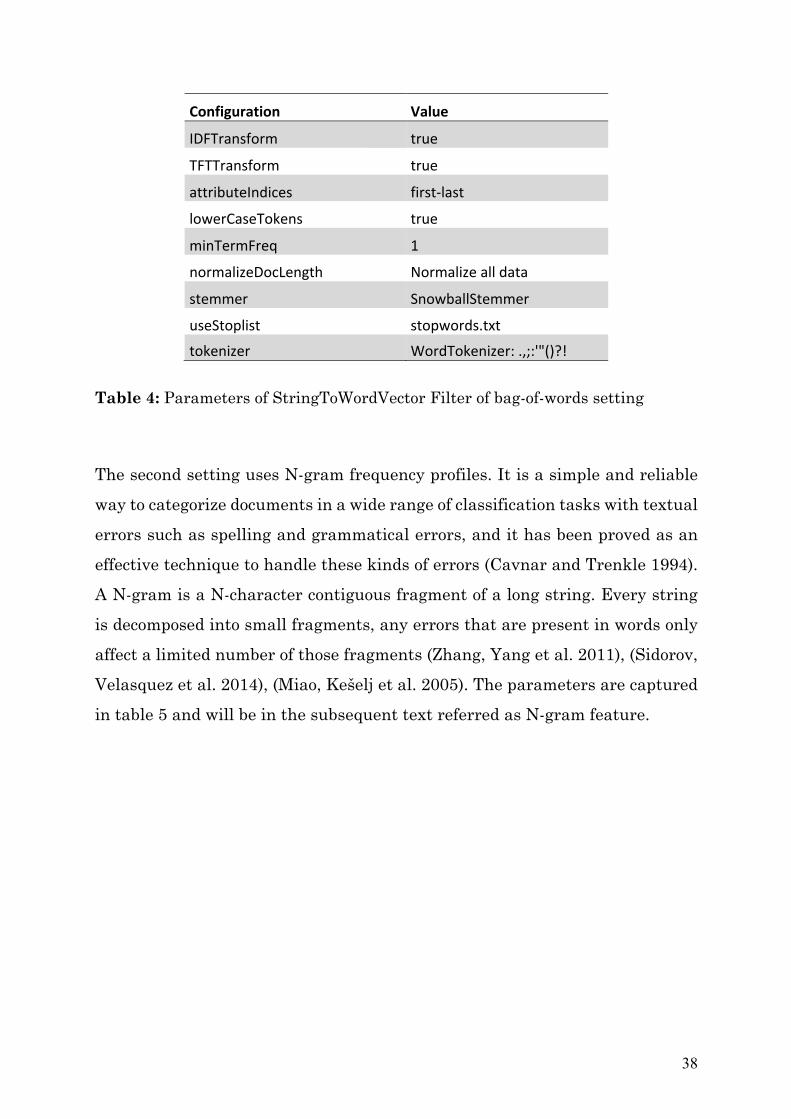
Two settings were reused of previous studies handling classification problems using machine learning. The first setting calculates the term frequency/inverse document for all words. By this, the vector of tf-idf scores are called bag-of-words feature, which will be used later in the training of the classifier. Bag-of-words is the method of treating each word as a feature, without concern for each word’s relation to other word in term of ordering (in contrast to N-gram) (Kaczynski, Gandy et al. 2016), (Hassan 2016). The parameters are captured in table 4 and will be in the subsequent text referred as bag-of-words feature. TF-IDF scores are the most frequent used weighting scheme (Joachims 1996)
1. Assemble the set of tokenized representations of the training documents.
2. From the assembled set, select a set of features relevant to document membership in category.
3. Output the list L of selected features for this training set and this category.
Figure 4: Feature selection
38
Configuration Value
IDFTransform true
TFTTransform true
attributeIndices first-last
lowerCaseTokens true
minTermFreq 1
normalizeDocLength Normalizealldata
stemmer SnowballStemmer
useStoplist stopwords.txttokenizer WordTokenizer:.,;:'"()?!
Table 4: Parameters of StringToWordVector Filter of bag-of-words setting
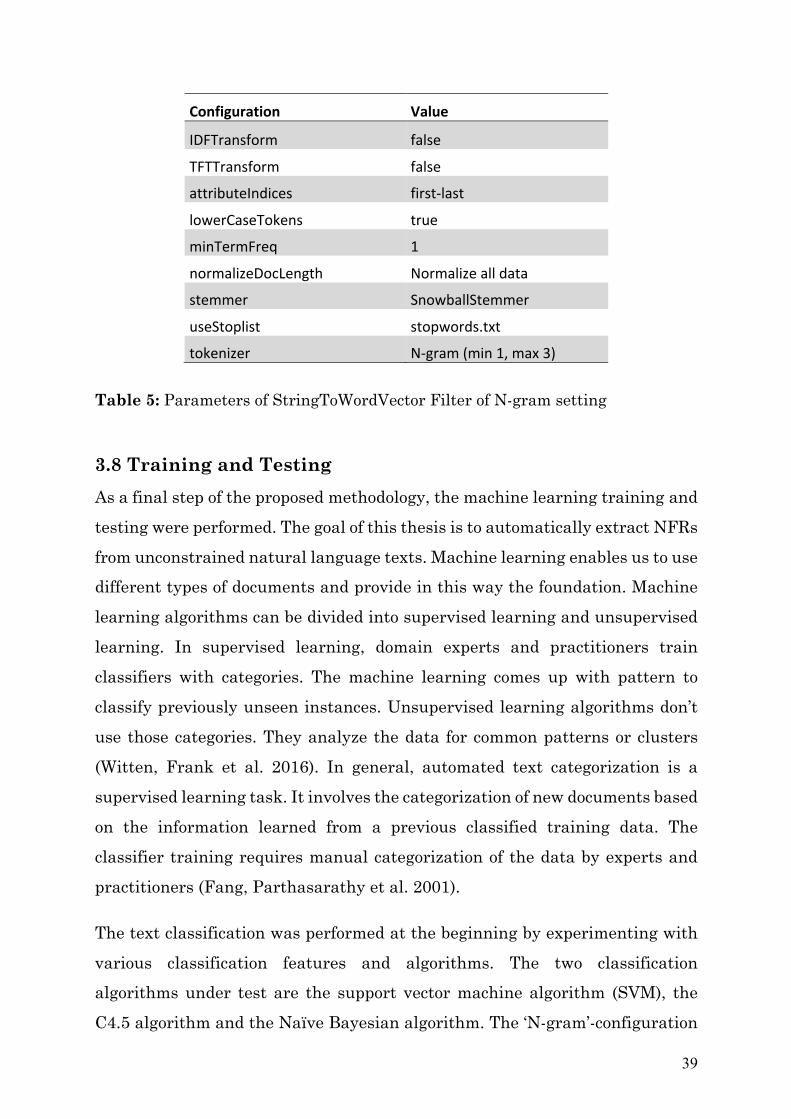
The second setting uses N-gram frequency profiles. It is a simple and reliable way to categorize documents in a wide range of classification tasks with textual errors such as spelling and grammatical errors, and it has been proved as an effective technique to handle these kinds of errors (Cavnar and Trenkle 1994). A N-gram is a N-character contiguous fragment of a long string. Every string is decomposed into small fragments, any errors that are present in words only affect a limited number of those fragments (Zhang, Yang et al. 2011), (Sidorov, Velasquez et al. 2014), (Miao, Kešelj et al. 2005). The parameters are captured in table 5 and will be in the subsequent text referred as N-gram feature.
39
Configuration Value
IDFTransform false
TFTTransform false
attributeIndices first-last
lowerCaseTokens true
minTermFreq 1
normalizeDocLength Normalizealldata
stemmer SnowballStemmer
useStoplist stopwords.txt
tokenizer N-gram(min1,max3)
Table 5: Parameters of StringToWordVector Filter of N-gram setting
3.8 Training and Testing As a final step of the proposed methodology, the machine learning training and testing were performed. The goal of this thesis is to automatically extract NFRs from unconstrained natural language texts. Machine learning enables us to use different types of documents and provide in this way the foundation. Machine learning algorithms can be divided into supervised learning and unsupervised learning. In supervised learning, domain experts and practitioners train classifiers with categories. The machine learning comes up with pattern to classify previously unseen instances. Unsupervised learning algorithms don’t use those categories. They analyze the data for common patterns or clusters (Witten, Frank et al. 2016). In general, automated text categorization is a supervised learning task. It involves the categorization of new documents based on the information learned from a previous classified training data. The classifier training requires manual categorization of the data by experts and practitioners (Fang, Parthasarathy et al. 2001).
The text classification was performed at the beginning by experimenting with various classification features and algorithms. The two classification algorithms under test are the support vector machine algorithm (SVM), the C4.5 algorithm and the Naïve Bayesian algorithm. The ‘N-gram’-configuration
40
had only word features that include a bag of N-gram’s with single words, word bigrams, word trigrams. The set of word was filtered regarding stop words and also lemmatized. The ‘bag-of-words’-configuration contains only single words with the value of term frequency/inverse document. Also those words got filtered regarding stop words and lemmatized. For both datasets the Zero-Rule classifier was performed, which aimed to represent a simple model to be used as a baseline.
3.8.1 SVM Dan and Lihua stated in their comparison of text classification, that support vector machine algorithm (SVM) had the best performance (Dan, Lihua et al. 2013). The actual utilized algorithm is called Sequential Minimal Optimization (SMO) which is the WEKA version of the support vector machine algorithm (SVM). SMO implements the sequential minimal optimization algorithm for training a support vector classifier, using polynomial or Gaussian kernels. Missing values are replaced globally and nominal attributes are transformed into binary ones, as attributes are normalized by default (Witten, Frank et al. 2016). The amount of memory required by SMO is linear to the size of the data (Naughton, Stokes et al. 2010). SVM performed significantly better on classification problems (Wu, Chang et al. 2006). SVM classifiers finds the optimal separator between two classes (Abad, Karras et al. 2017) The advantages of SVM are classification power, robustness and the ability to handle noisy data (Abbasi and Chen 2005).
3.8.2 C4.5 Both datasets with both configurations were tested using the C4.5 algorithm. This algorithm is implemented in WEKA under the name J48 algorithm. C4.5 builds decision trees from a set of training data, using the concept of information entropy. According to Hussain et al., the parameter minimum number of instances in a leaf get set to 6 to aid overfitting (Hussain, Kosseim et al. 2008). During the training and testing, the parameters of J48 algorithm
41
were set to a confidence level of 25%, pruned C 4 and the 2 as the min number of objects.
3.8.3 Multinomial Naïve Bayes Also the datasets are going to be tested using the Naive Bayes algorithm. This machine learning algorithm is a practical probabilistic classifier and has been utilized in many studies. The naive Bayes text classifier performs well in the standard benchmark collections, competing with state-of-the-art text classifiers (Kim, Han et al. 2006). The algorithm selects the class with the highest probability of a given a specific document. It assumes that each feature of a class exists independently of other features. Naïve Bayes classifiers typically require fewer trained instances than other classifiers and performs well in real-world problems (Abad, Karras et al. 2017). For the model evaluation within the Weka machine learning system the following techniques could be used: training dataset, supplied test-set, percentage split and cross validation. For very large data one of the first three techniques should be used. Cross-validation can further be divided into holdout method, k-fold cross validation and Leave-one-out cross validation. The pros of k-fold cross validation is an accurate performance estimation and the cons are small samples of performance estimation, overlapped training data, elevated type I error for comparison and underestimated performance variance or overestimated degree of freedom for comparison (Refaeilzadeh, Tang et al. 2009). Based on the number of instances of each set, a cross-validation was used. It provides a more accurate estimation of the performance than the other techniques in small datasets. Common values for k are 5 and 10, which is depending on the number of instances. Since the data set is not very large with less than 1000 instances, 10-fold-cross validation got performed (Witten, Frank et al. 2016). For all experiments precision, recall, and the F1 score got calculated as discussed in the previous chapter.
42
IV. Data Analysis and Results
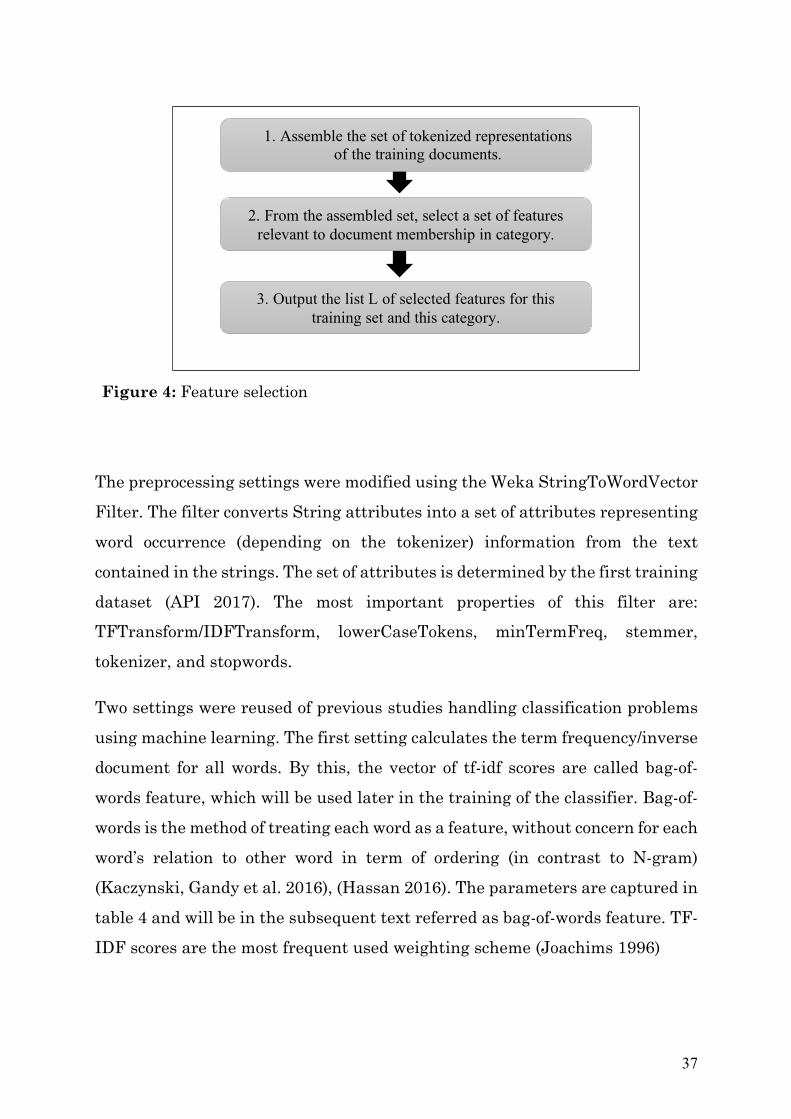
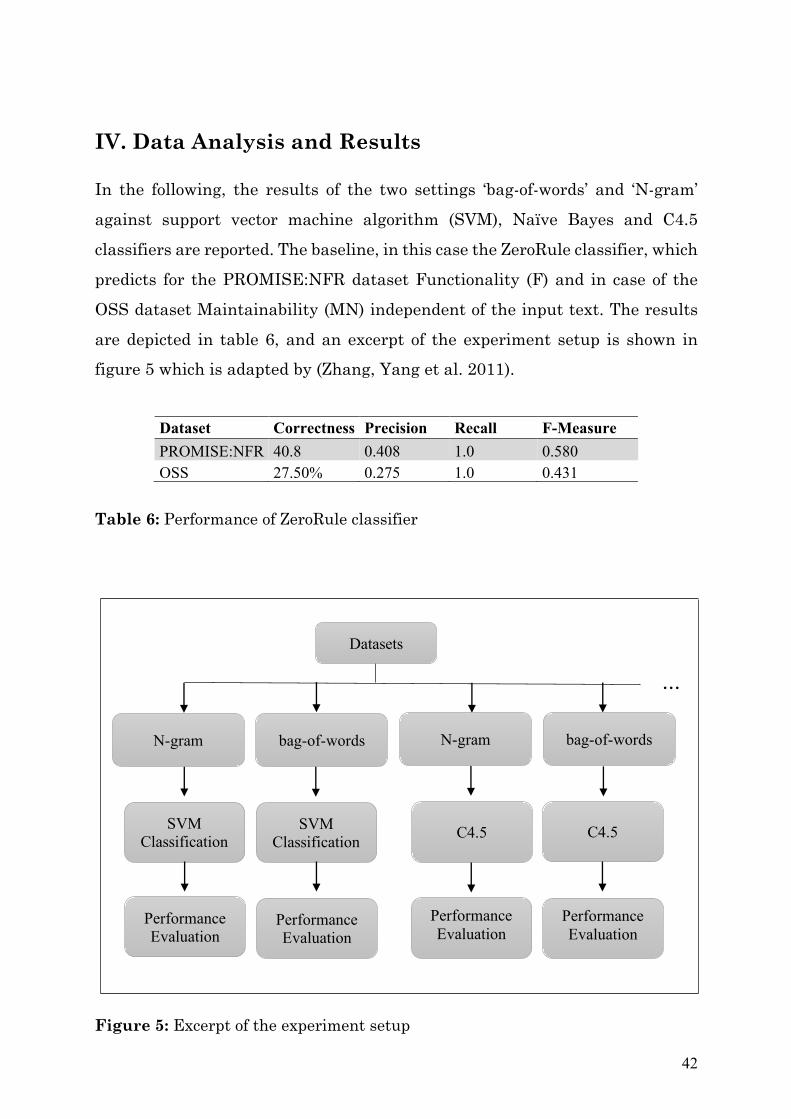
In the following, the results of the two settings ‘bag-of-words’ and ‘N-gram’ against support vector machine algorithm (SVM), Naïve Bayes and C4.5 classifiers are reported. The baseline, in this case the ZeroRule classifier, which predicts for the PROMISE:NFR dataset Functionality (F) and in case of the OSS dataset Maintainability (MN) independent of the input text. The results are depicted in table 6, and an excerpt of the experiment setup is shown in figure 5 which is adapted by (Zhang, Yang et al. 2011).
Dataset Correctness Precision Recall F-Measure PROMISE:NFR 40.8 0.408 1.0 0.580 OSS 27.50% 0.275 1.0 0.431
Table 6: Performance of ZeroRule classifier
Figure 5: Excerpt of the experiment setup
Datasets
bag-of-words
C4.5 SVM Classification
SVM Classification C4.5
Performance Evaluation
Performance Evaluation
Performance Evaluation
Performance Evaluation
N-gram bag-of-words N-gram
...
43
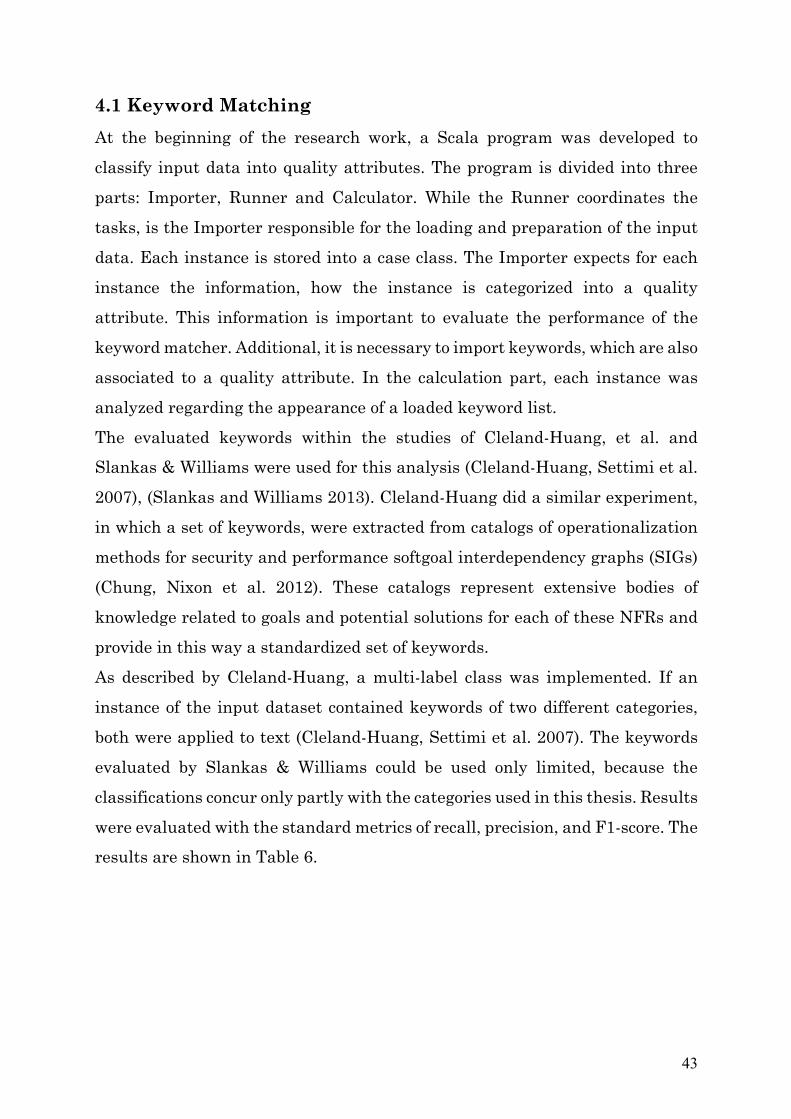
4.1 Keyword Matching At the beginning of the research work, a Scala program was developed to classify input data into quality attributes. The program is divided into three parts: Importer, Runner and Calculator. While the Runner coordinates the tasks, is the Importer responsible for the loading and preparation of the input data. Each instance is stored into a case class. The Importer expects for each instance the information, how the instance is categorized into a quality attribute. This information is important to evaluate the performance of the keyword matcher. Additional, it is necessary to import keywords, which are also associated to a quality attribute. In the calculation part, each instance was analyzed regarding the appearance of a loaded keyword list. The evaluated keywords within the studies of Cleland-Huang, et al. and Slankas & Williams were used for this analysis (Cleland-Huang, Settimi et al. 2007), (Slankas and Williams 2013). Cleland-Huang did a similar experiment, in which a set of keywords, were extracted from catalogs of operationalization methods for security and performance softgoal interdependency graphs (SIGs) (Chung, Nixon et al. 2012). These catalogs represent extensive bodies of knowledge related to goals and potential solutions for each of these NFRs and provide in this way a standardized set of keywords. As described by Cleland-Huang, a multi-label class was implemented. If an instance of the input dataset contained keywords of two different categories, both were applied to text (Cleland-Huang, Settimi et al. 2007). The keywords evaluated by Slankas & Williams could be used only limited, because the classifications concur only partly with the categories used in this thesis. Results were evaluated with the standard metrics of recall, precision, and F1-score. The results are shown in Table 6.
44
Dataset PaperQualityAttribute Precision Recall F-Measure
OSS (Cleland-Huangetal.,2007) A 0.031 0.286 0.056 MN 0.256 0.287 0.271 O 0.077 0.603 0.136 PE 0.095 0.396 0.154 SE 0.026 0.929 0.050 US 0.126 0.740 0.215 (Slankasetal.,2013) A 0.045 0.214 0.074 O 0.073 0.052 0.061 SE 0.122 0.786 0.212 US 0.101 0.151 0.121
PROMISE:NFR (Cleland-Huangetal.,2007) A 0.052 1.000 0.100 MN 0.063 1.000 0.118 O 0.104 0.952 0.188 PE 0.150 0.926 0.258 SC 0.050 1.000 0.095 SE 0.122 0.970 0.217 US 0.119 0.955 0.211 (Slankasetal.,2013) A 0.131 1.000 0.232 O 0.462 0.194 0.273 SE 0.778 0.106 0.187 US 0.418 0.567 0.481
Table 7: Evaluation of keyword matching
It is noticeable that the precision of the keyword matcher is very low. Only Maintainability (MN) in the OSS dataset has a higher value compared to the other results. But considering that the ZeroRule algorithm has a correct prediction of instances value of only 27,50% for the quality attribute, it shows that this method is not performing well within the contemplated dataset. In comparison, the keywords of Slankas performed better on the PROMISE:NFR dataset: Operational (O), Security (SE) and Usability (US) have all a better performance than the ZeroRule classifier. Nevertheless, it is a much better performance desirable, which leads to the next section ‘Comparison of the applied Machine Learning Algorithms’.

45
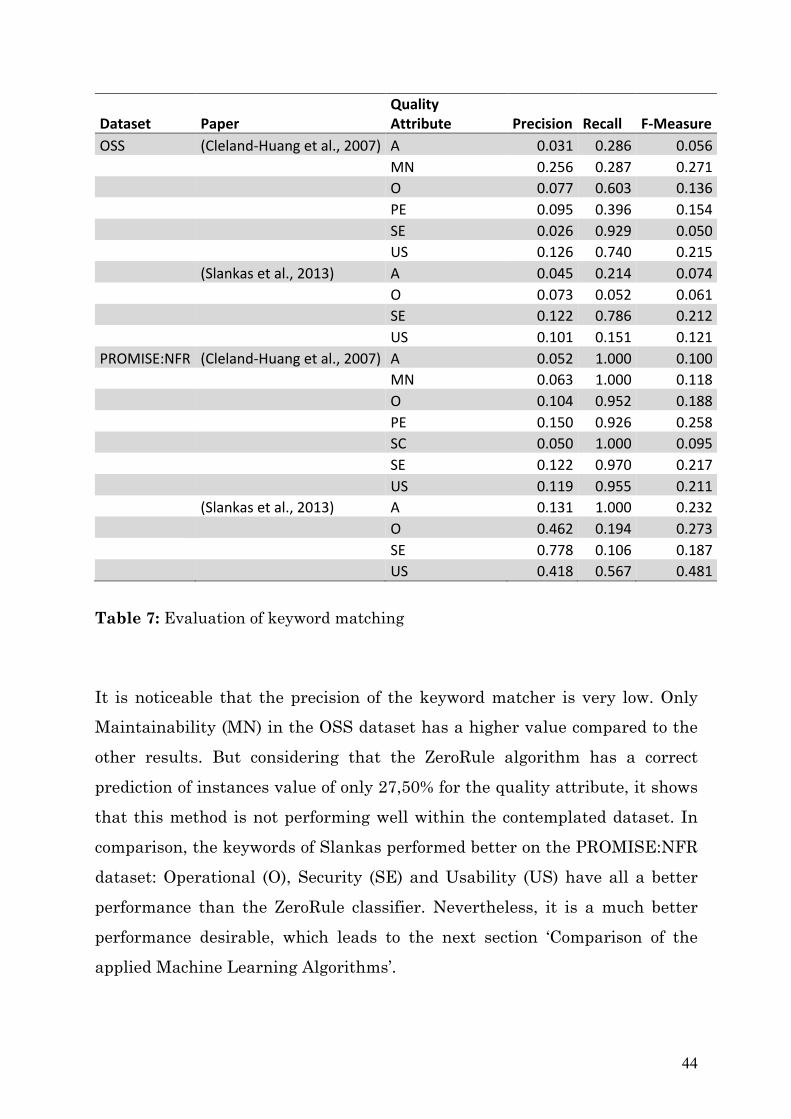
4.2 Comparison of the applied Machine Learning Algorithms After the keyword matching a complete text classification, as described in the Methodology section, got performed on the two datasets. The classification of the PROMISE:NFR dataset had the highest value of prediction in the combination of the N-gram configuration with the Multi Naïve Bayes classifier. The combination of bag-of-words and J48 classifier had the worst performance and it was 12% worse than the best combination. The classification of the OSS dataset had in comparison the best performance with this configuration. It is noticeable that the correct prediction of instances value of all configurations is almost the same. Compared to the feature attributes evaluated within the PROMISE:NFR dataset, the amount of words and N-gram words is a lot smaller. For the quality attributes availability and security is the precision very high. The feature setting ‘bag-of-words’ performs within the OSS dataset considerable better. Table 8 and 9 show the results of the quality attributes availability and security. Table 10 shows the extracted features out of the two datasets.
Dataset Featuresetting Classifier Correctness Precision Recall F-MeasurePROMISE:NFR bag-of-words J48 60.32% 0.583 0.333 0.427 Nbmult 65.92% 0.500 0.476 0.488 SMO 64.16% 0.833 0.238 0.37 N-gram J48 63.04% 0.556 0.476 0.513 Nbmult 68.48% 0.750 0.571 0.649 SMO 67.36% 0.917 0.524 0.667OSS bag-of-words J48 45.27% 1.000 0.286 0.444 Nbmult 43.86% 0.400 0.286 0.333 SMO 44.71% 0.800 0.286 0.421 N-gram J48 44.00% 0.800 0.286 0.421 Nbmult 44.00% 0.800 0.286 0.421 SMO 43.72% 1.000 0.286 0.444
Table 8: Comparison of the results, based on Availability (A)
46
Dataset Featuresetting Classifier Correctness Precision Recall F-MeasurePROMISE:NFR bag-of-words J48 60.32% 0.655 0.545 0.595 Nbmult 65.92% 0.7 0.636 0.667 SMO 64.16% 0.789 0.455 0.577 N-gram J48 63.04% 0.585 0.576 0.58 Nbmult 68.48% 0.756 0.515 0.613 SMO 67.36% 0.756 0.47 0.579OSS bag-of-words J48 45.27% 0.889 0.571 0.696 Nbmult 43.86% 0.833 0.714 0.769 SMO 44.71% 1.000 0.714 0.833 N-gram J48 44.00% 0.889 0.571 0.696 Nbmult 44.00% 1.000 0.357 0.526 SMO 43.72% 1.000 0.643 0.783
Table 9: Comparison of the results, based on Security (SE)
Table 10: Attributes with a positive Information Gain value
Dataset Featuresetting keywords
PROMISE:NFR bag-of-words
second,onli,us,no,access,with,interfac,avail,user,than,oper,minut,time,year,compli,author,easi,more,under,90%,hour,player,allow,server,support,after,standard,respons,let,includ,updat,0,can,class,per,train,longer,regul,mainten,ensur,environ,successfulli,simultan,expect
n-gram
us,second,onli,user,the,shall,no,productshallb,access,with,interfac,interfacewith,avail,beavail,to,oper,minut,time,than,of,year,after,complywith,compli,author,updat,interfacewithth,easi,inund,under,allow,90%,90%of,shallinterfac,hour,shallallow,shallbeavail,beeasi,tous,server,shallinterfacewith,standard,and,theproductmust,productmust,shallbeeasi,player,usersshal,systemshalllet,5second,responsetim,shalllet,let,beavailablefor,availablefor,includ,by,0,per,respons,train,longer,regul,class,displai,mainten,ensur,environ,forus,shallensur,onlyauthor,shallensurethat,ensurethat,easyto,beeasyto,longerthan,successfulli,availableforus,secondsth,usingth,simultan,nomor,nomorethan,expect,expectedto,haveaccessto,haveaccess,tosuccessfulli,inunder5,benomor,under5,beno
OSS bag-of-wordsremov,authent,test,add,support,upgrad,configur,unsaferow,perform,column,renam,auth,token,credenti,speed,cooki,password
n-gram
remov,add,authent,test,support,upgrad,perform,improv,unsaferowin,column,renam,unsaferow,supportunsaferowin,auth,supportunsaferow,token,removeit,credenti,speed,improveperform,isbasedon,cooki,authenticationmechan,theauthent,httpauthent,password
47
V. Limitations and Threats to Validity
In the following section, the results will be proved against validity. Both datasets were tested with cross validation. This means that the text classification was trained with the same dataset which got utilized for testing. Abad & Karras identified this as a thread regarding validity (Abad, Karras et al. 2017). Abad & Karras identified in the PROMISE:NFR dataset incorrect labeled instances: R2.18 “The product shall allow the user to view previously downloaded search results, CMA reports and appointments” is labeled as NFR, although it is a functional requirement (Abad, Karras et al. 2017). The same argument is valid for the OSS dataset: The classification of the requirements got done with a lot of care, by using a precisely defined set of rules. Nevertheless, it is possible that an instance got wrong labeled manually. Not all quality attributes are covered: In the Spark and Hadoop Common OSS projects no instance were classified as Legal (L), Look & Feel (LF) or Scalability (SC). Within the PROMISE:NFR dataset, only one requirement is labeled as PO. A category with such a low appearance should be dismissed from the text classification. Xue and Hall showed that an unbalanced data has a negative impact of the performance of a classifier (Xue and Hall 2015).

48
VI. Conclusion and Outlook
The final part of the thesis summarizes the previous parts and provides a conclusion and scope for subsequent studies. It also discusses problems which appeared throughout the research. The usage of two datasets showed that the text categorization is strongly dependent on the re-use within the same domain and with a similar source of textual information. The OSS dataset provided a very technical point of view on the program, where in contrast a web application project requirements document, which is written for customer outside of this domain, will use a complete different language and terminology. The three subsequent research papers by Cleland-Huang show a similar evolution: In the beginnig SRS documents were classified using SIG graphs. Out of this SIG graphs, also the rational for a architectural design decision can be extracted. Cleland-Huang proposed in the end a tool to implement it into the development lifecycle. It uses information out of the current project and gurantees in this way, that the same domain and terminology are used for the classification. This increases the performance of the classifier significantely. Regarding quality attributes, recall is considered by Cleland-Huang more important than precision when the classification on the available documents is performed. (Cleland-Huang, Settimi et al. 2006). Categories of large sizes showed a better performance comparing to categories of small sizes. Zhang & Yang showed that the amount of collected NFRs is related to the performance. (Zhang, Yang et al. 2011) Another way of feature attribute generation would be the Stanford Parser: It is a natural language parser that evaluates the grammatical structure of sentences. For example, which groups of words build ‘phrases’ and if a words is a subject or an object of a verb. Probabilistic parsers use knowledge of language
49
gained from hand-parsed sentences to try to produce the most likely analysis of new sentences. Slankas and Williams proposed the ‘other’ category to avoid the classification of NFRs into categories in which they do not belong. If the “other” NFRs were placed into existing categories, machine learning algorithms would perform less effectively (Slankas and Williams 2013). Another improvement could be the usage of under- and oversampling strategies to build a hybrid training. Sampling strategies can improve the classification accuracy (Laurikkala 2001). Another improvement of the precision could bring the implementation of a multi-label class classifier. WEKA does not support multi-class classifier, but the extension MEKA (meka.sourceforge.net) allows it.
50
References
Aas,K.andL.Eikvil(1999).Textcategorisation:Asurvey,Technicalreport,Norwegiancomputingcenter. Abad,Z.S.H.,etal.(2017)."Whatworksbetter?astudyofclassifyingrequirements."arXivpreprintarXiv:1707.02358. Abbasi,A.andH.Chen(2005)."ApplyingauthorshipanalysistoArabicwebcontent."IntelligenceandSecurityInformatics:75-93. AlBalushi,T.H.,etal.(2007).ElicitO:aqualityontology-guidedNFRelicitationtool.InternationalWorkingConferenceonRequirementsEngineering:FoundationforSoftwareQuality,Springer. API,O.(2017)."WEKAOnlineAPIbyPentaho."Retrieved13.September,2017,fromhttp://wiki.pentaho.com/display/DATAMINING/StringToWordVector. Belkin,N.J.andW.B.Croft(1992)."Informationfilteringandinformationretrieval:Twosidesofthesamecoin?"CommunicationsoftheACM35(12):29-38. Berander,P.,etal.(2005)."Softwarequalityattributesandtrade-offs."BlekingeInstituteofTechnology. Bertman,J.,etal.(2010)."EHrsgetafailinggradeonusability."InternalMedicineNews43(11):50. Bhat,M.,etal.(2017).AutomaticExtractionofDesignDecisionsfromIssueManagementSystems:AMachineLearningBasedApproach.EuropeanConferenceonSoftwareArchitecture,Springer. Casamayor,A.,etal.(2009)."Arecommendersystemforclassificationofnon-functionalrequirements."Proceedingsofthe10thArgentineSymposiumonArtificialIntelligence(ASAI’2009)inthe38thArgentineMeetingsonInformaticsandOperationsResearch(JAIIO’2009). Casamayor,A.,etal.(2010)."Identificationofnon-functionalrequirementsintextualspecifications:Asemi-supervisedlearningapproach."InformationandSoftwareTechnology52(4):436-445. Cavnar,W.B.andJ.M.Trenkle(1994)."N-gram-basedtextcategorization."AnnArborMI48113(2):161-175. Chung,L.,etal.(2012).Non-functionalrequirementsinsoftwareengineering,SpringerScience&BusinessMedia.

51
Cleland-Huang,J.,etal.(2005).Goal-centrictraceabilityformanagingnon-functionalrequirements.Proceedingsofthe27thinternationalconferenceonSoftwareengineering,ACM. Cleland-Huang,J.,etal.(2006).Thedetectionandclassificationofnon-functionalrequirementswithapplicationtoearlyaspects.RequirementsEngineering,14thIEEEInternationalConference,IEEE. Cleland-Huang,J.,etal.(2007)."Automatedclassificationofnon-functionalrequirements."RequirementsEngineering12(2):103-120. Cysneiros,L.M.andJ.C.S.doPradoLeite(2004)."Nonfunctionalrequirements:Fromelicitationtoconceptualmodels."IEEEtransactionsonSoftwareengineering30(5):328-350. Dan,L.,etal.(2013).ResearchoftextcategorizationonWEKA.IntelligentSystemDesignandEngineeringApplications(ISDEA),2013ThirdInternationalConferenceon,IEEE. Dörr,J.,etal.(2003).Elicitingefficiencyrequirementswithusecases.Ninthinternationalworkshoponrequirementsengineering:foundationforsoftwarequality.InconjunctionwithCAiSE. Dutoit,A.H.,etal.(2007).Rationalemanagementinsoftwareengineering,SpringerScience&BusinessMedia. Fang,Y.,etal.(2001).Usingclusteringtoboosttextclassification.ICDMWorkshoponTextMining(TextDM'01). Ghazarian,A.(2012).Characterizationoffunctionalsoftwarerequirementsspace:Thelawofrequirementstaxonomicgrowth.RequirementsEngineeringConference(RE),201220thIEEEInternational,IEEE. Glinz,M.(2007).Onnon-functionalrequirements.RequirementsEngineeringConference,2007.RE'07.15thIEEEInternational,IEEE. Hall,M.,etal.(2009)."TheWEKAdataminingsoftware:anupdate."ACMSIGKDDexplorationsnewsletter11(1):10-18. Han,J.,etal.(2011).Datamining:conceptsandtechniques,Elsevier. Hassan,D.(2016).InvestigatingtheEffectofCombiningTextClusteringwithClassificationonImprovingSpamEmailDetection.InternationalConferenceonIntelligentSystemsDesignandApplications,Springer. He,H.andE.A.Garcia(2009)."Learningfromimbalanceddata."IEEEtransactionsonknowledgeanddataengineering21(9):1263-1284. Hussain,I.,etal.(2008)."Usinglinguisticknowledgetoclassifynon-functionalrequirementsinSRSdocuments."NaturalLanguageandInformationSystems:287-298.
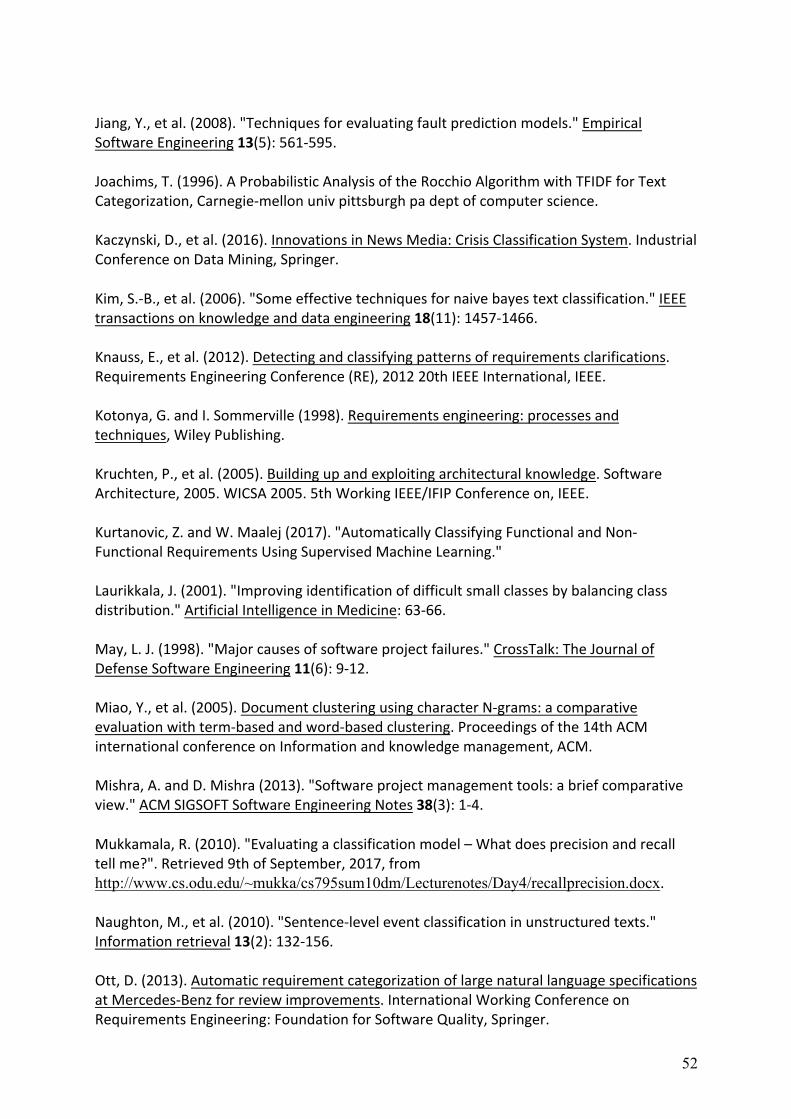
52
Jiang,Y.,etal.(2008)."Techniquesforevaluatingfaultpredictionmodels."EmpiricalSoftwareEngineering13(5):561-595. Joachims,T.(1996).AProbabilisticAnalysisoftheRocchioAlgorithmwithTFIDFforTextCategorization,Carnegie-mellonunivpittsburghpadeptofcomputerscience. Kaczynski,D.,etal.(2016).InnovationsinNewsMedia:CrisisClassificationSystem.IndustrialConferenceonDataMining,Springer. Kim,S.-B.,etal.(2006)."Someeffectivetechniquesfornaivebayestextclassification."IEEEtransactionsonknowledgeanddataengineering18(11):1457-1466. Knauss,E.,etal.(2012).Detectingandclassifyingpatternsofrequirementsclarifications.RequirementsEngineeringConference(RE),201220thIEEEInternational,IEEE. Kotonya,G.andI.Sommerville(1998).Requirementsengineering:processesandtechniques,WileyPublishing. Kruchten,P.,etal.(2005).Buildingupandexploitingarchitecturalknowledge.SoftwareArchitecture,2005.WICSA2005.5thWorkingIEEE/IFIPConferenceon,IEEE. Kurtanovic,Z.andW.Maalej(2017)."AutomaticallyClassifyingFunctionalandNon-FunctionalRequirementsUsingSupervisedMachineLearning." Laurikkala,J.(2001)."Improvingidentificationofdifficultsmallclassesbybalancingclassdistribution."ArtificialIntelligenceinMedicine:63-66. May,L.J.(1998)."Majorcausesofsoftwareprojectfailures."CrossTalk:TheJournalofDefenseSoftwareEngineering11(6):9-12. Miao,Y.,etal.(2005).DocumentclusteringusingcharacterN-grams:acomparativeevaluationwithterm-basedandword-basedclustering.Proceedingsofthe14thACMinternationalconferenceonInformationandknowledgemanagement,ACM. Mishra,A.andD.Mishra(2013)."Softwareprojectmanagementtools:abriefcomparativeview."ACMSIGSOFTSoftwareEngineeringNotes38(3):1-4. Mukkamala,R.(2010)."Evaluatingaclassificationmodel–Whatdoesprecisionandrecalltellme?".Retrieved9thofSeptember,2017,fromhttp://www.cs.odu.edu/~mukka/cs795sum10dm/Lecturenotes/Day4/recallprecision.docx. Naughton,M.,etal.(2010)."Sentence-leveleventclassificationinunstructuredtexts."Informationretrieval13(2):132-156. Ott,D.(2013).AutomaticrequirementcategorizationoflargenaturallanguagespecificationsatMercedes-Benzforreviewimprovements.InternationalWorkingConferenceonRequirementsEngineering:FoundationforSoftwareQuality,Springer.
53
Perry,D.E.andA.L.Wolf(1992)."Foundationsforthestudyofsoftwarearchitecture."ACMSIGSOFTSoftwareEngineeringNotes17(4):40-52. Porter,M.F.(1980)."Analgorithmforsuffixstripping."Program14(3):130-137. Potts,C.andG.Bruns(1988).Recordingthereasonsfordesigndecisions.SoftwareEngineering,1988.,Proceedingsofthe10thInternationalConferenceon,IEEE. Powers,D.M.(2011)."Evaluation:fromprecision,recallandF-measuretoROC,informedness,markednessandcorrelation." Rahimi,M.,etal.(2014).Automatedextractionandvisualizationofqualityconcernsfromrequirementsspecifications.RequirementsEngineeringConference(RE),2014IEEE22ndInternational,IEEE. Ramesh,B.andM.Jarke(2001)."Towardreferencemodelsforrequirementstraceability."IEEEtransactionsonSoftwareengineering27(1):58-93. Refaeilzadeh,P.,etal.(2009).Cross-validation.Encyclopediaofdatabasesystems,Springer:532-538. Rosenhainer,L.(2004).Identifyingcrosscuttingconcernsinrequirementsspecifications.ProceedingsofOOPSLAEarlyAspects. Salton,G.(1981).Ablueprintforautomaticindexing.ACMSiGiRForum,ACM. Thisnotesummarizessomeofthecurrentlyavailableinsightsinautomaticindexing.
Theemphasisisonaspectsthatareexpectedtobeusefulinapracticalautomaticindexingapplications.Thediscussionisnecessarilycursory,butthereferenceswillleadinterestedreaderstoadeepertreatmentoftheindexingproblem.
Sebastiani,F.(2002)."Machinelearninginautomatedtextcategorization."ACMcomputingsurveys(CSUR)34(1):1-47. Selvakumar,J.andM.Rajaram(2011)."Performanceevaluationofrequirementsengineeringmethodologyforautomateddetectionofnonfunctionalrequirements."InternationalJournalonComputerScienceandEngineering3(8):2991. Sidorov,G.,etal.(2014)."Syntacticn-gramsasmachinelearningfeaturesfornaturallanguageprocessing."ExpertSystemswithApplications41(3):853-860. Slankas,J.andL.Williams(2013).Automatedextractionofnon-functionalrequirementsinavailabledocumentation.NaturalLanguageAnalysisinSoftwareEngineering(NaturaLiSE),20131stInternationalWorkshopon,IEEE. Svensson,R.B.,etal.(2009)."Qualityrequirementsinpractice:Aninterviewstudyinrequirementsengineeringforembeddedsystems."RequirementsEngineering:FoundationforSoftwareQuality5512:218-232.

54
Tang,A.(2005)."Managingprojectriskswitharchitecturemodelling,”."AustralianProjectManager-JournaloftheAustralianInstituteofProjectManagement15(2):13-14. Tang,A.S.S.(2007).Arationale-basedmodelforarchitecturedesignreasoning,SwinburneUniversityofTechnology,FacultyofInformation&CommunicationTechnologies. Tran,Q.andL.Chung(1999).NFR-Assistant:Toolsupportforachievingquality.Application-SpecificSystemsandSoftwareEngineeringandTechnology,1999.ASSET'99.Proceedings.1999IEEESymposiumon,IEEE. Tsui,F.,etal.(2016).Essentialsofsoftwareengineering,Jones&BartlettLearning. vanderVen,J.S.andJ.Bosch(2013).Makingtherightdecision:supportingarchitectswithdesigndecisiondata.EuropeanConferenceonSoftwareArchitecture,Springer. Vapnik,V.(2013).Thenatureofstatisticallearningtheory,Springerscience&businessmedia. Weiss,G.M.(2004)."Miningwithrarity:aunifyingframework."ACMSIGKDDexplorationsnewsletter6(1):7-19. Witten,I.H.,etal.(2016).DataMining:Practicalmachinelearningtoolsandtechniques,MorganKaufmann. Wongpun,S.andA.Srivihok(2008).Comparisonofattributeselectiontechniquesandalgorithmsinclassifyingbadbehaviorsofvocationaleducationstudents.DigitalEcosystemsandTechnologies,2008.DEST2008.2ndIEEEInternationalConferenceon,IEEE. Wu,Y.-C.,etal.(2006).Ageneralandmulti-lingualphrasechunkingmodelbasedonmaskingmethod.CICLing,Springer. Xue,J.-H.andP.Hall(2015)."Whydoesrebalancingclass-unbalanceddataimproveAUCforlineardiscriminantanalysis?"IEEEtransactionsonpatternanalysisandmachineintelligence37(5):1109-1112. Yang,Y.,etal.(2005)."Value-basedprocessesforCOTS-basedapplications."IEEEsoftware22(4):54-62. Zhang,D.andJ.J.Tsai(2003)."Machinelearningandsoftwareengineering."SoftwareQualityJournal11(2):87-119. Zhang,T.andF.J.Oles(2001)."Textcategorizationbasedonregularizedlinearclassificationmethods."Informationretrieval4(1):5-31. Zhang,W.,etal.(2011).Anempiricalstudyonclassificationofnon-functionalrequirements.TheTwenty-ThirdInternationalConferenceonSoftwareEngineeringandKnowledgeEngineering(SEKE2011).

55