Embed Size (px)
Citation preview

Automatic compensation :
Consumer experience of provisioning delays, loss of
service and missed appointments
Presentation of Quantitative Findings
16th March, 2017

CONTENTS
Slide #
Background, objectives & approach 4
Fixed Line researchConsumers
Executive summary 8Demographics, services used 12Reliance on services, switching behaviour 16Experience of and impact of loss of service/delayed provisioning 20Experience of and impact of loss of service 28Compensation for loss of service 47Experience of missed appointments and compensation 51
SMEsExecutive summary 61Firmographics, services used 64Reliance on services, switching behaviour 72Experience of and impact of loss of service/delayed provisioning 78Experience of and impact of loss of service 87Compensation for loss of service 106Experience of missed appointments and compensation 112
Minimum standards & willingness to pay more/less for better/worse service 121
Mobile Research Consumers 130SMEs 147Minimum standards & willingness to pay more/less for better/worse service 164

Background, objectives &
approach

Background
Two of Ofcom’s current projects relate to service quality across the supply chains for fixed and mobile communications
The Automatic Compensation project focuses on retail communications providers for both fixed and mobile communications. The project is considering whether to require retail CPs to pay residential consumers and SMEs automatic compensation when service quality problems occur that affect fixed or mobile services. If so, the project will consider at what value compensation should be set.Research with Consumers and SMEs was needed to feed into both of these projects, the objectives of which are detailed overleaf
The Quality of Fixed Networks (QoFN) project focuses on quality of service within the fixed voice and broadband wholesale market. This project is exploring issues such as whether the standards set by Ofcom meet consumers and businesses’ needs and expectations, how to regulate the service quality that Openreach delivers to retail communications providers and how Ofcom may require Openreach to provide better service where this will deliver better value to end users.
Research with Consumers and SMEs was needed to feed into both of these projects, the objectives of which are detailed overleaf
*NB: Ofcom already sets regulated minimum standards for Openreach for the timely completion of repairs and installations*
4.

5.
Consumer & SME expectations of standards of service quality for fixed & mobile services Expectations of service reliability and understand what constitutes ‘reliable’ Experiences and expectations around service faults/outages
Frequency of service faults and the nature of these Experiences of getting a repair? What are expectations/priorities?
Experiences and expectations around new service installations
Impact/harm/detriment caused by Quality of Service issues for fixed & mobile services QoS problems experienced and the frequency of these Length of time to resolve and satisfaction with this Detriment experienced Action taken to mitigate the problem and associated costs Experiences, expectations and satisfaction around compensation Possible mitigating actions that could be taken by the retail CP Willingness to pay to avoid QoS problems in the future
Willingness to pay for incrementally better service for fixed & mobile services How do users balance price and service quality? Willingness to pay for incrementally better service above baseline expectations? Willingness to accept lower levels of service in return for a lower price?
Objectives
1
2
3

6.
Consumers - In home CAPI interviewsWe spoke to a nationally and regionally representative sample of 2,088 adults
across the UK. Random location interviewing was used to ensure a good
geographical spread. Controls were applied by region and sub-region, then
quotas were set on age, gender, working status and tenure. Note: The mobile
phone questions were taken from a similar earlier study*
SMEs - CATI interviewsWe spoke to 1,006 telecoms decision makers across the UK. An interlocking
quota sample based on country/region and size was implemented. In addition to
controlling the sample this way, non-interlocking quotas were set on industry
sector to ensure broad alignment with UK business profiles. Note: The mobile
phone questions were merged with those from an earlier study in order to boost
the total number of mobile phone ‘loss of service’ interviews*.
Screening: All respondents were responsible for telecoms approach, policy and
purchasing – covering the day to day processes, as well as the decision making
Weighting: In both cases, our final data has been weighted in order to align it
to the sample profile of each universe
Timing: Interviews were undertaken between 16th December, 2016 and 27th
January, 2017. *The earlier interviews took place between 25th August and
28th September, 2016
Approach

Automatic compensation :
Consumer experience of provisioning delays, loss of
service and missed appointments
Fixed Line Research:
Consumers

Fixed line research: Consumer executive summary (1)
8.
Overall, consumers have a greater reliance on broadband and mobile than Landline
2 in 3 say their HH would struggle to function without these vs 1 in 4 for landline
Price is the dominant factor in the choice of provider.
Broadband speed (35%) and reliability (30%) are also key for internet
Bundling is important to 1 in 3, in relation to both landline (33%) and internet (29%)
A quarter (24%) have experienced a complete loss (for more than one hour, within the last 2
years) of their fixed line service, whilst 1 in 20 (5%) have experienced a LoS during provisioning
or upgrading
On average, the complete LoS lasted 3.5 days and the provisioning/upgrading LoS 1.9 days
Three quarters (77%) reported their LoS to their provider
Overall, they waited 12 hours before doing so and their service was restored after 4.3 days
Just over half (54%) are satisfied with their providers ability to resolve the LoS
They become increasingly dissatisfied after waiting 3 days for their restoration
<1day = 76% satisfied, 1-3 days = 65% satisfied, 4+ days = 13% satisfied
Two fifths (41%) have switched any fixed line service in the past 5 years
27% have switched both, 11% broadband (only) and 4% landline (only)

Fixed line research: Consumer executive summary (2)
9.
After probing, 30% of consumers expect to be compensated for the impact of their LoS.
On average, they expect c£35 – to be paid as a credit on their account or cash
Only 7% received compensation for their LoS, with 3% asking for it. Of those that did
not receive compensation, 7% asked for it and 88% did not (5% didn’t know)
1 in 10 (8%) changed supplier as a direct result of their LoS. Similar proportions are
actively looking to change (7%), wanted to change, but stayed as they were within their
minimum contact period (7%) or stayed for other reasons (6%)
Three fifths (58%) feel their LoS had a negative impact on their HH generally

Fixed line research: Consumer executive summary (3)
10.
1 in 4 (27%) of those experiencing a LoS waited in for an engineer visit, with 1 in 10
taking time off
On average, 1½ days is considered reasonable notice for an amendment to an engineer
appointment
4% have ever experienced a missed appointment, with 3% doing so in the last 2 years
On average, they spend 2 hours waiting for an engineer
On average, they spend 3 hours trying to set up another appointment
3 in 4 contact their provider. All used the phone. On average, they contacted
their provider 3 times
Only 8% received compensation for their missed appointment, with 4% asking for it.
Of those that did not receive compensation, 15% asked for it and 79% did not (4% didn’t
know)
After probing, 41% of consumers expect to be compensated. On average, they expect
c£50 – to be paid as a credit on their account or cash

Section 1 Demographics, Services used

Male48%
Female52%
4%
38%
13%
8%
28%
6%
0%
3%
0%
Full time education
Working full time
Working part time
Looking after home/family
Retired from paid work
Unemployed
Work/training scheme
Permanently sick/disabled
Don't know/ref
12.
Key sample criteria: Gender, age, working status, SEG, HH composition
Gender Working status
Age
Demographics
A2 Gender, A3 Age, A4 Working Status, A5a SEG. D2 How many adults (age 16+) live in your household? D3 And how many children (under 16)?
Base: Total Sample Consumer n=2088
# of adults in household
23%
29%
23%
25%
AB
C1
C2
DE
SEG
9%
32%
34%
25%
16-24
25-44
45-64
65+
22%
56%
15%
8%
One
Two
Three
Four or more
# of children in household
14%
13%
4%
2%
66%
One
Two
Three
Four or more
None

75%
8%
5%
2%
15%
12%
10%
9%
9%
7%
9%
7%
6%
England
South East
London
South West
West Midlands
East of England
East Midlands
North West
Yorkshire and theHumber
North East
Scotland
Wales
Northern Ireland
13.
Key sample criteria: Country/region, urbanity and HH ownership
Region Urbanity
Location
A5b Urbanity (from sample), Region (from sample), D1 Home Ownership
Base: Total Sample Consumer n=2088
Home ownership status
86%
14%
35%
20%
16%
15%
12%
2%
Urban
Medium town
Smaller city/large town
Large city
Small town
Rural
Rural
Remote rural
34%
28%
22%
15%
1%
0%
Owned outright
Being bought onmortgage
Rented from LA/HA
Rented from privatelandlord
Other
Don't know

20%
74%
87%
74%
22%
Telephone landline (used only forbroadband connection)
Telephone landline (not mobile) - usedfor making and/or receiving calls
Fixed broadband internet connection
Smartphone
Standard mobile phone
16-24 25-44 45-64 65+ ABC1 C2DE Urban Rural
199 682 702 505 1053 1035 1904 184
27% 29% 18% 7% 18% 21% 21% 10%
54% 61% 78% 92% 75% 72% 72% 87%
91% 95% 94% 66% 93% 81% 87% 86%
97% 92% 80% 35% 81% 67% 75% 68%
6% 8% 21% 48% 19% 25% 21% 28%
14.
Almost 9 in 10 have fixed broadband. Three quarters have smartphones
(correlated with younger age) or use telephone landlines for making/receiving
calls (correlated with older age)
S1a Which of the following do you have at home or use personally?
Base: Total Sample Consumer n=2088
Communication services currently used
Consumer
AGE UrbanitySEG

Section 2Reliance on Services, Switching behaviour

16.
Greater reliance on Internet and Mobile than Landline. Two-thirds say
household would “struggle to function” without these. Households feel they
could cope just under a week without Internet (much longer for landline).
Importance of telecoms services currently used
27%
66% 65%22%
23%20%
29%
8%9%22%
3% 6%
Landline telephone Fixed Internet connection Mobile phone
My household would notfind day to day activityimpeded without thisservice
My household would ratherthe service was availablebut could manage withoutit
My household could managebut only for a limitedperiod without it
My household wouldstruggle to function withoutit
D1 Thinking again about your [landline / broadband / Mobile phone] service, how much does your household rely on each of these?
Base: All Consumers using landline/broadband/mobile phone n=1941/1794/1931
Mean # days household
able to cope without service 45.4 6.2 10.5

17.
When last changed supplier or upgraded existing service
Internet likely to have been changed/upgraded more recently than landline for
calls. More than a quarter have changed/upgraded broadband services within the
past 2 years.
22% 22%17%
15%24%
15%
19%
20%
23%
15%
16%
19%
28%
17%25%
Landline used only for Broadband Landline used for making & receiving calls Fixed Broadband Internet
Within last 2years
2-5 years ago
5 to 10 years ago
10 or more yearsago
Never/can'tremember
Within last 5 years: 44% 33% 44%
C1 When did you last change your (service) supplier or upgrade your existing service with the same supplier?
Base: All Consumers with LL used only for BB n=432, all with LL used for making/receiving calls n=1509, all with fixed broadband internet n=1794

18.
Price is the dominant factor in choice of provider across services. With Internet,
Broadband speed and reliability are key for around a third. Bundling is important for
some in relation to Landline and Broadband (most likely bundled together)
Main factors that influenced choice of provider (unprompted)
68%
33%
24%
17%
4%
3%
3%
2%
4%
Price
Bundled with other services
Reliability
Trusted brand
Only one available in area at time
Speed of installation
Responsiveness to faults
Customer service
Can't remember
C2a/b/c. Thinking back to when you chose your (service), what were the main factors that influenced your choice of provider?
Base: All Consumers that have a landline but no fixed broadband and changed their provider in the last 10 years n=96, all that have a fixed broadband connection and
changed their provider in the last 10 years n=1479, all with a mobile service n=1931
62%
35%
30%
29%
16%
8%
6%
4%
1%
1%
Price
Broadband speed
Reliabilty
Bundled with other services
Trusted brand
Customer service
Only one available in area at time
Speed of installation
Responsiveness to faults
Can't remember
67%
20%
19%
15%
11%
11%
11%
10%
10%
7%
5%
3%
1%
6%
Price
Data allowance
Reliability
Trusted brand
Data coverage
Broadband speed
Bundled with other services
Choice of handsets
Voice call coverage
Customer service
Voice call quality
Only one available in area …
Responsiveness to faults
Can't remember

Section 3Experience of and impact of loss of service/delayed provisioning
20.
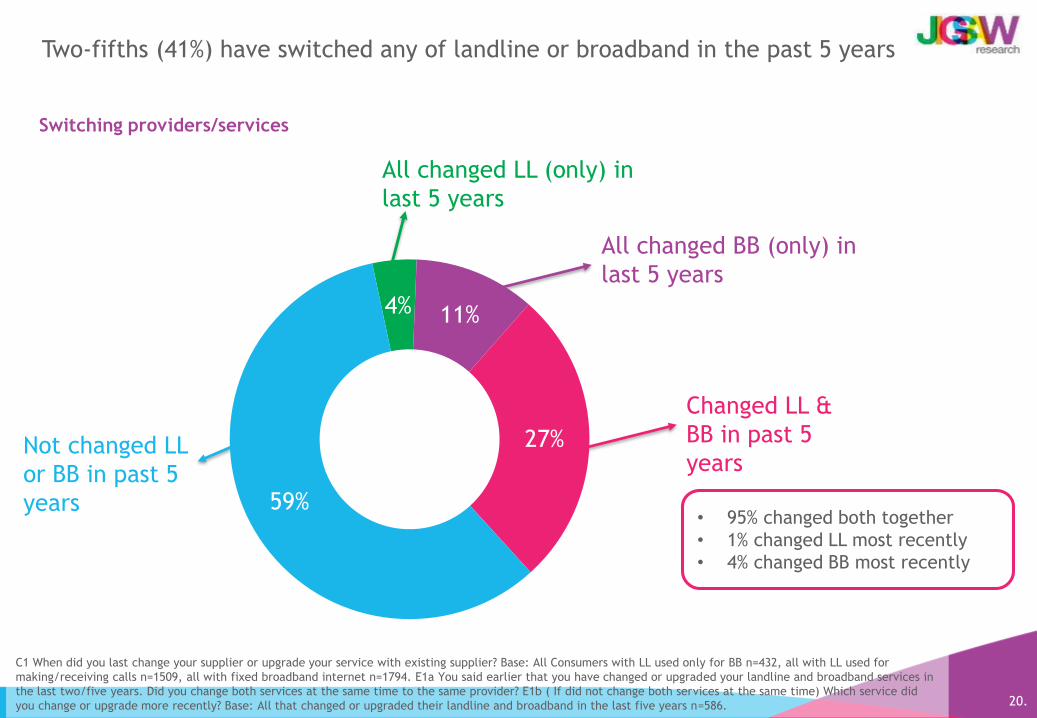
Two-fifths (41%) have switched any of landline or broadband in the past 5 years
Switching providers/services
C1 When did you last change your supplier or upgrade your service with existing supplier? Base: All Consumers with LL used only for BB n=432, all with LL used for
making/receiving calls n=1509, all with fixed broadband internet n=1794. E1a You said earlier that you have changed or upgraded your landline and broadband services in
the last two/five years. Did you change both services at the same time to the same provider? E1b ( If did not change both services at the same time) Which service did
you change or upgrade more recently? Base: All that changed or upgraded their landline and broadband in the last five years n=586.
All changed BB (only) in
last 5 years
Changed LL &
BB in past 5
years
All changed LL (only) in
last 5 years
Not changed LL
or BB in past 5
years• 95% changed both together
• 1% changed LL most recently
• 4% changed BB most recently
4% 11%
27%
59%
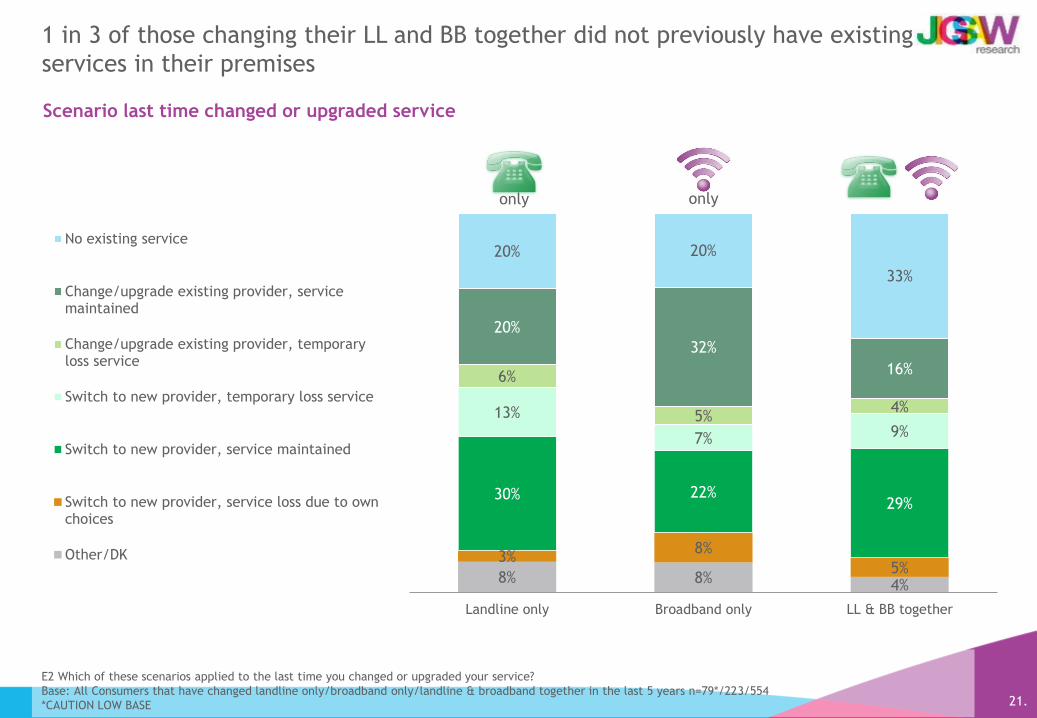
21.
Scenario last time changed or upgraded service
1 in 3 of those changing their LL and BB together did not previously have existing
services in their premises
8% 8% 4%
3%8%
5%
30% 22%29%
13%
7% 9%
6%
5%4%
20%
32%
16%
20% 20%
33%
Landline only Broadband only LL & BB together
No existing service
Change/upgrade existing provider, servicemaintained
Change/upgrade existing provider, temporaryloss service
Switch to new provider, temporary loss service
Switch to new provider, service maintained
Switch to new provider, service loss due to ownchoices
Other/DK
E2 Which of these scenarios applied to the last time you changed or upgraded your service?
Base: All Consumers that have changed landline only/broadband only/landline & broadband together in the last 5 years n=79*/223/554
*CAUTION LOW BASE
only only

8%
3%
30%
13%
6%
20%
20%
Landline only
No existing service
Change/upgradeexisting provider,service maintained
Change/upgradeexisting provider,temporary loss service
Switch to newprovider, temporaryloss service
Switch to newprovider, servicemaintained
Switch to newprovider, service lossdue to own choices
Other/DK
22.
Scenario last time changed or upgraded service
On average 6.4 days to service activation for Landline only. 94% said this was in
line with provider information and 92% felt the time taken was reasonable.
E2 Which of these scenarios applied to the last time you changed or upgraded your service? Base: All Consumer that have changed landline most recently in the last 5 years n=79* E3 Did you
move home at the same time? Base: All not ‘other/dk’ at E2 n=74*. E4 Did the change or upgrade require an engineer to visit your home to install new lines or other equipment? Base: All not
‘no existing service’ ‘service loss due to own choices’ or ‘other/dk’ at E2 n=54*. E5 Approximately how many calendar days after placing the order was the service activated or upgraded?
Base: all that had a new landline service n=72* (not including other/dk or those without service due to own choices at E2). E5b And was this in line with the time period you had been given by
your provider? E6a Do you think the time it took was reasonable? Base: All where service activated n=72*
*CAUTION LOW BASE
35% said
change
required
engineer
visit
32%
had
moved
home
at the
same
time
only
0%
6%
1%
10%
1%
11%
1%
13%
12%
7%
12%
15%
11%
Not yet
22+ days
15 to 21
11 to 14
8 to 10
Seven
Six
Five
Four
Three
Two
One
Zero
6.4
Service activation/upgrade (days)
In line with time period
given by provider?
94%
Reasonable timing?
92%
Of the 6 who said no, 1 said “1 day”,
3 said “2 days”, 2 said “7 days”,
Mean (days)

8%
8%
22%
7%
5%
32%
20%
BB only
No existing service
Change/upgradeexisting provider,service maintained
Change/upgradeexisting provider,temporary loss service
Switch to newprovider, temporaryloss service
Switch to newprovider, servicemaintained
Switch to newprovider, service lossdue to own choices
Other/DK
23.
On average 8.5 days to service activation for Broadband only. 93% said this was
in line with provider information and 88% felt the time taken was reasonable.
E2 Which of these scenarios applied to the last time you changed or upgraded your service? Base: All Consumer that have changed broadband most recently in the last 5 years n=223 E3 Did you
move home at the same time? Base: All not ‘other/dk’ at E2 n=204. E4 Did the change or upgrade require an engineer to visit your home to install new lines or other equipment? Base: All not
‘no existing service’, ‘service loss due to own choices’ or ‘other/dk’ at E2 n=145. E5 Approximately how many calendar days after placing the order was the service activated or upgraded?
Base: all that had a new broadband service n=185 (not including other/dk or those without service due to own choices at E2). E5b And was this in line with the time period you had been given
by your provider? E6a Do you think the time it took was reasonable? Base: All where service activated n=184
33% said
change
required
engineer
visit
28%
had
moved
home
at the
same
time
1%
7%
4%
14%
11%
20%
1%
7%
5%
8%
9%
13%
1%
Not yet
22+ days
15 to 21
11 to 14
8 to 10
Seven
Six
Five
Four
Three
Two
One
Zero
Mean (days) 8.5 In line with time period
given by provider?
93%
Reasonable timing?
88%
Of the 23 who said no, the average
(mean) was 5 days to be reasonable
onlyScenario last time changed or upgraded service Service activation/upgrade (days)

4%5%
29%
9%
4%
16%
33%
LL & BB together
No existing service
Change/upgradeexisting provider,service maintained
Change/upgradeexisting provider,temporary loss service
Switch to newprovider, temporaryloss service
Switch to newprovider, servicemaintained
Switch to newprovider, service lossdue to own choices
Other/DK
24.
On average 10.8 days to service activation for combined Landline & Broadband.
92% said this was in line with provider information and 86% felt the time taken
was reasonable.
E2 Which of these scenarios applied to the last time you changed or upgraded your service? Base: All Consumer that have changed landline & broadband together in the last 5 years n=554. E3
Did you move home at the same time? Base: All not ‘other/dk’ at E2 n=530. E4 Did the change or upgrade require an engineer to visit your home to install new lines or other equipment? Base:
All not ‘no existing service ’, ‘service loss due to own choices’ or ‘other/dk’ at E2 n=323. E5 Approximately how many calendar days after placing the order was the service activated or
upgraded? Base: all that had a new landline & broadband service n=501 (not including other/dk or those without service due to own choices at E2). E5b And was this in line with the time
period you had been given by your provider? E6a Do you think the time it took was reasonable? Base: All where service activated n=500
44% said
change
required
engineer
visit
40%
had
moved
home
at the
same
time
0%
9%
9%
16%
9%
23%
0%
10%
4%
6%
5%
7%
2%
Not yet
22+ days
15 to 21
11 to 14
8 to 10
Seven
Six
Five
Four
Three
Two
One
Zero
Mean (days) 10.8 In line with time period
given by provider?
92%
Reasonable timing?
86%
Of the 6 who said no, 1 said “1 day”,
3 said “2 days”, 2 said “7 days”,
Scenario last time changed or upgraded service Service activation/upgrade (days)

25.
5% of our sample had experienced loss of service during provisioning or
upgrading for any of LL, BB or LL&BB). On average this loss was 9 days.
Experience of loss of service (any service) during provisioning or upgrading – how long without the service?
9%
2%
6%
9%
13%
12%
11%
17%
2%
11%
17%
Don't know
Over 50 days
21-50 days
11-20 days
6-10 days
3-5 days
2 days
1 day
6-24 hours
1-6 hours
< one hour
E8 You said earlier that you experienced a loss of service during provisioning or upgrading. How long were you without service during the changeover period? Base; all
consumer that experienced loss of service during provisioning or upgrading n=112
Mean (days) 9.1Base sizes too low to analyse
by specific services

26.
Amongst past switchers, a reasonable activation time to acquire the service
from scratch would be around a week for Internet or Landline/Internet
combined (slightly lower for landline only)
(Amongst switchers in past 5 years): If didn’t have service at all, what would be reasonable activation time?
2%
0
8%
3%
27%
0
8%
9%
9%
28%
6%
0
22+ days
15 to 21
11 to 14
8 to 10
Seven
Six
Five
Four
Three
Two
One
< one day
E7 I’d like you to imagine that you did not have (service) at all and had placed an order to have the service installed. How many days would you consider it reasonable to
wait for it to be activated? Base: all consumers who had switched landline/broadband/both most recently in past 5 years and had existing landline service n=61*,
broadband n=183, landline & broadband n=376. *CAUTION LOW BASE
Mean (days) 5.5
3%
1%
10%
5%
28%
1%
10%
5%
9%
22%
6%
1%
22+ days
15 to 21
11 to 14
8 to 10
Seven
Six
Five
Four
Three
Two
One
< one day
Mean (days) 6.5 6.6
1%
2%
12%
5%
33%
1%
12%
6%
9%
12%
7%
0
22+ days
15 to 21
11 to 14
8 to 10
Seven
Six
Five
Four
Three
Two
One
< one day
only only

27.
Amongst all with the service, on average a week (6.6 days) would be
acceptable for landline activation; slightly lower for broadband (5.8 days)
If didn’t have service at all, what would be reasonable activation time?
17%
28%
2%
10%
4%
11%
15%
12%
1%
8 or more
Seven
Six
Five
Four
Three
Two
One
< one day
G16 I’d like you to imagine that you did not have (service) at all and had placed an order to have the service installed. How many days would you consider it reasonable
to wait for it to be activated? Base: all consumer with a landline n=1961, all with broadband n=1798
Mean (days) 6.6
16%
29%
1%
10%
6%
10%
14%
14%
1%
8 or more
Seven
Six
Five
Four
Three
Two
One
< one day
Mean (days) 5.8

Section 4Experience of and impact of loss of service

29.
Within the last 2 years, a quarter (24%) have ever experienced complete loss of
service for more than one hour
Experience loss of service in last 2 years
10%
21%
76%
Landline
Broadband
None
E9a Over the last 2 years, have you experienced a complete loss of service for more than one hour for the following services taken by your household? By loss of service,
we mean complete inability to make or receive voice calls or to access the internet. Please don’t include instances when your connection speed was slower than usual,
but do include those that occurred as a result of a fault on your existing service. E9b Did you lose your landline and your broadband service at the same time? E9c Which
service did you lose most recently? E9d When you lost your landline service did you also lose your broadband at the same time? E9e When you lost your broadband service
did you also lose your landline at the same time? Base: Total Sample Consumers n=2088
2%
12%
10%
Landline ONLY
Broadband ONLY
Landline &Broadbandtogether
Most recent loss of service

30.Base: All Consumer n=2088
Loss of service
n=450
Loss of service
during
provisioning or
upgrading n=63
Loss of service due to a
fault
Loss of service during
provisioning or upgrading
Delayed
Provisioning n=25
New service
Delayed
Provisioning n=19
Provisioning NOT within
time-scale given
Did not have existing
service at property.
Provisioning NOT within
time-scale given
Any
loss/delay
29%
NO
loss/delay
71%
% incidence in each group within the CONSUMER population
1%
2% 5%
24%
Overall, 29% had experienced any loss or delay with regard to their fixed line
telecommunications services. The vast majority of these were related to loss of
existing services due to a fault, rather than issues with provisioning/upgrading

31.
On average, a complete LoS lasts 3.5 days. A LoS involving broadband (only) lasts
a day less (2.7 days) and a reported LoS a day more (4.4 days), whereas a loss of
service during provisioning or upgrading lasts approximately 2 days
How long experienced loss of service for?
F1 Thinking about the most recent loss of your landline due to a fault / delay in service change or upgrade on your landline/broadband/ how long did you experience a
loss of service for? Base: All that experienced a loss of service n=450, broadband n=228, landline n=222
Base: All that experienced loss of service during provisioning or upgrading n=63* *CAUTION LOW BASE
Mean (days)
3.5
Mean (days)
1.9
Loss of serviceLoss of service
during provisioning
or upgrading
4%
2%
1%
3%
2%
7%
13%
14%
14%
0
1%
5%
33%
2%
Don't know
Unresolved
50+ days
21-50 days
11-20 days
6-10 days
3-5 days
2 days
1 day
18-23 hours
12-18 hours
6-12 hours
1-6 hours
< one hour
41%
0
0
0
0
8%
7%
6%
14%
0
0
3%
18%
3%
Don't know
Unresolved
50+ days
21-50 days
11-20 days
6-10 days
3-5 days
2 days
1 day
18-23 hours
12-18 hours
6-12 hours
1-6 hours
< one hour
2.7
4.5
Any landline
broadband only
Any Loss of service
4.4
0.6
Non-reported LoS
Reported LoS
Any LoS
during provisioning
or upgradingMedian 1.0
Median 2.0
Median 0.3
Median 2.0
Median 0.1
Median 1.0

7%
14%
14%
17%
17%
5%
23%
3%
4%
2%
2%
5%
8%
4%
26%
54%
Don't know
6+ days
3-5 days
2 days
1 day
6-23 hours
1-6 hours
< one hour
Wait beforecontact
Time takento restore
How long wait after loss did you contact your provider?
How long did it take for service to be restored after first notification?
32.
On average, three-quarters reported their fault to their provider. Of these,
more than half made contact within the hour – almost exclusively via the
telephone and half just once
Experience of loss of service (any service)
F2a Did you report your Landline/Broadband/Landline & Broadband loss of service / delay in your new order to your provider? Base: Loss of service n=450
F2b why did you not contact your provider Base: all not reporting n=96*. F2c How long after you (lost service/expected service to be installed/upgraded) did you contact
the provider to let them know? F2d How did you contact your provider? F2e How many times did you contact your provider? F5 How long did it take for your service to be
restored after you first notified your provider of the issue? BASE: all who reported n=348. *CAUTION LOW BASE
37%
22%
21%
Didn't think would last long/wait much longer
Fixed/installed before had time to report
Looked at provider website for updates
YES
77%
Reported to provider?
ANY: Loss of service
Why NOT reported?
Mean:
0.5 days
53% contacted once, 19% twice, 28% 3+times
95% contacted via phone, 2% email, 2% webchat, 3% other
NO
21%(DK 2%)
Mean:
4.3 days

33.
Those losing any landline service were more likely to report it to their provider
Experience of loss of service – Any loss vs. broadband only vs. Any landline
F2a Did you report your Landline/Broadband/Landline & Broadband loss of service / delay in your new order to your provider? Base: Loss of service n=450, broadband
n=228, landline n=222. F2b why did you not contact your provider Base: all not reporting n=96*. F2c How long after you (lost service/expected service to be
installed/upgraded) did you contact the provider to let them know? F2d How did you contact your provider? F2e How many times did you contact your provider? F5 How
long did it take for your service to be restored after you first notified your provider of the issue? BASE: all who reported n=348. *CAUTION LOW BASE
37%
22%
21%
30%
Didn't think would last long/wait much longer
Fixed/installed before had time to report
Looked at provider website for updates
Other
77%
Reported to provider?
Why NOT reported?
53% contacted once
19% twice
28% 3+times
95% via phone
2% email
2% webchat
3% other
72% 82%
Any landlinebroadband onlyAny loss of service
YES
21% 27% 16%
broadband onlyAny loss of service
NO
Any landline
No significant differences
by BB only vs. Any LL
How reported?

34.
On average, it takes 4.3 days to restore a service. Broadband (only) losses are
restored more quickly
4%
10%
9%
15%
20%
6%
31%
3%
3%
2%
0
6%
6%
3%
26%
58%
Don't know
6+ days
3-5 days
2 days
1 day
6-23 hours
1-6 hours
< one hour
How long wait after loss/expectation before contacting provider?
How long did it take for service to be restored after first notification?
F2c How long after you (lost service/expected service to be installed/upgraded) did you contact the provider to let them know?
F5 How long did it take for your service to be restored after you first notified your provider of the issue?
BASE: all who reported n=348, broadband only n=164, any landline n=184
Experience of loss of service (any service) – amongst those reporting a LoS
Mean:
0.4 days
Mean:
2.4 days
11%
17%
18%
18%
14%
4%
15%
2%
6%
1%
3%
3%
9%
5%
26%
51%
Don't know
6+ days
3-5 days
2 days
1 day
6-23 hours
1-6 hours
< one hour
7%
14%
14%
17%
17%
5%
23%
3%
4%
2%
2%
5%
8%
4%
26%
54%
Don't know
6+ days
3-5 days
2 days
1 day
6-23 hours
1-6 hours
< one hour
Wait beforecontact
Time takento restore
Mean:
0.5 days
Mean:
4.3 days
Mean:
0.6 days
Mean:
6.1 days
broadband onlyAny loss of service Any landline
Median 0.0 Median 1.0 Median 0.1 Median 2.0Median 0.0 Median 1.0

35.
Only a quarter reported a loss of service during provisioning or upgrading
to their provider.
Experience of loss of service (any service) during provisioning or upgrading
F2a Did you report your Landline/Broadband/Landline & Broadband loss of service / delay in your new order to your provider? Base: loss of service during provisioning or
upgrading n=63* *CAUTION LOW BASE SIZE
YES
25%
Reported to provider?
ANY: Loss of service
during provisioning
or upgrading
NO
58%
(DK 17%)

36.
Consumers become increasingly dissatisfied with their provider’s ability to
resolve the issue as the length of time to resolve increases
Satisfaction with provider ability to resolve loss of service
x by how long did it take for your service to be restored after first notifying the provider
F6 Overall, how satisfied or dissatisfied were you with the length of time it took your provider to resolve your loss of service for your (service), using the following scale?
Base: All with a complete loss of service n=450, F5 How long did it take for your service to be restored after you first notified your provider of the issue? BASE: all who
reported n=348, all where service restored within 1 day n=105, 1-3 days n=136, 2 days or more n=162, more than 3 days n=83* *CAUTION LOW BASE
Total “satisfied”
4%
20%
7%15%
39%
57%10%
3%
10%
17%
22%
12%
14%
10%
11%
8%
37%
43%
49%
29%
10%18%
34%
16%
5% 3%
Loss of Service Up to 1 day 1-3 days 2 days or more More than 3 days
Very satisfied
Fairly satisfied
Neither/nor
Fairly dissatisfied
Very dissatisfied
54% 76% 65% 34% 13%

37.
Just over half were satisfied with their provider’s ability to resolve their loss of
service
Satisfaction with provider ability to resolve loss of service
F6 Overall, how satisfied or dissatisfied were you with the length of time it took your provider to resolve your loss of service for your (service), using the following scale?
Base: All with a complete loss of service n=450, landline or landline & broadband loss of service n=222, broadband only loss of service n=228. Loss of service during
provisioning or upgrading n=63*
Total “satisfied”
4% 3% 5%
18%20% 25%
15%
7%
10%11%
10%6%
12%9%
14% 11%
37% 36%38%
20%
18% 17% 18%
36%
Any LoS Any LL LoS BB only LoS Temp LoS duringprovisioning or upgrading
Very satisfied
Fairly satisfied
Neither/nor
Fairly dissatisfied
Very dissatisfied
DK/NA
54% 52% 56% 56%
No difference in
satisfaction by reported
vs not reported
38.
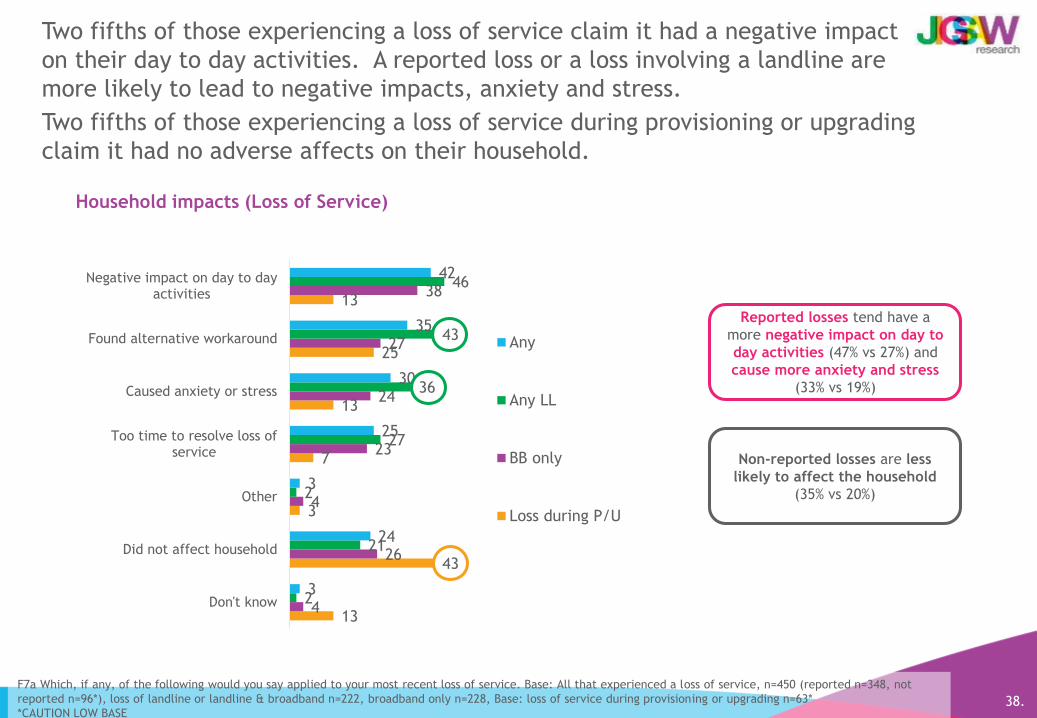
Two fifths of those experiencing a loss of service claim it had a negative impact
on their day to day activities. A reported loss or a loss involving a landline are
more likely to lead to negative impacts, anxiety and stress.
Two fifths of those experiencing a loss of service during provisioning or upgrading
claim it had no adverse affects on their household.
F7a Which, if any, of the following would you say applied to your most recent loss of service. Base: All that experienced a loss of service, n=450 (reported n=348, not
reported n=96*), loss of landline or landline & broadband n=222, broadband only n=228, Base: loss of service during provisioning or upgrading n=63*
*CAUTION LOW BASE
Household impacts (Loss of Service)
13
43
3
7
13
25
13
4
26
4
23
24
27
38
2
21
2
27
36
43
46
3
24
3
25
30
35
42
Don't know
Did not affect household
Other
Too time to resolve loss ofservice
Caused anxiety or stress
Found alternative workaround
Negative impact on day to dayactivities
Any
Any LL
BB only
Loss during P/U
Reported losses tend have a
more negative impact on day to
day activities (47% vs 27%) and
cause more anxiety and stress
(33% vs 19%)
Non-reported losses are less
likely to affect the household
(35% vs 20%)

12%
67%
6%
3%
3%
9%
Don't know
No cost
More than £50
£21-50
£11-20
<£10
39.
Amongst those who found an alternative workaround, mobiles were heavily
used as a substitute; largely with no direct financial cost associated
Experience of a loss of service
35%
Found an alternative workaround
Any loss of service
broadband only Any landline Loss during P/U
Actions taken to reduce impact
F7a Which, if any, of the following would you say applied to your most recent loss of {relevant service} OR delay to activation or upgrade of your {relevant service} ?Base: All that experienced a
loss of service Total n=450. F7b> What, if anything, did you do to reduce the impact of this [telephone landline / fixed broadband ] loss of service / delay to activation or upgrade of your service?
Base: all who found an alternative workaround n=160, any landline n=96*, broadband only n=64*. F7c> Thinking about the factors you mentioned, what were the direct financial costs to you (e.g.
cost of mobile calls) and the people in your household that were caused by your most recent loss of service / delay in service installation? Base: all that did something and found an alternative
workaround – any service n=152, any landline n=91*, broadband only n=61*. *CAUTION LOW BASE
Direct financial costs of these actions
4%
3%
1%
7%
8%
11%
18%
49%
53%
56%74%
Didn't do anything
Other
Used dongle
Tethered laptop to mobile via wifi
Used backup Internet connection
Went/worked from other location
Used mobile wifi instead
Used mobile to access Internet
Used mobile to access emails
Used mobile to receive calls
Used mobile to make calls
£5427% 43%
broadband only 59% Any landline 83%
broadband only 40% Any landline 67%
broadband only 59% Any landline 49%
broadband only 58% Any landline 43%
£45 £60
broadband only 25% Any landline 13%
25%
Any BB only Any LL
£232 excl. no cost
£294 excl. no cost
£212 excl. no cost
Median 0.0 Median 0.0Median 0.0

F7d To what extent were your normal activities affected by this workaround? Base: all that found alternative workaround any loss of service n=160, broadband loss only
n=64*, any landline loss n=96*. F10 To what extent were your normal activities affected by this loss of service? Please use a scale where 0 indicates ‘not affected’ (i.e.
was able to carry out same activity as would have done in event of no loss of service) and 5 indicates a very large impact (i.e. it was not possible to do any of the things
you usually do using the service you lost. Base: all that did NOT find an alternative workaround any loss of service n=290, broadband loss only n=164, any landline loss
n=126. *CAUTION LOW BASE
16% 15%
13% 15%
29% 24%
11%11%
12% 17%
20% 17%
Foundworkaround
Noworkaround
40.
Two thirds of those that found a workaround claim that it had a negative
impact on their normal activities.
Extent to which normal activities affected by workaround/loss of service
62% 55%
Total “had an
impact”
19% 20%
18% 16%
25%19%
16%
13%
9%
15%
13% 18%
Foundworkaround
No workaround
0 - notaffected
1
2
3
4
5 - verygreatimpact
Any loss of
service broadband only
21%26%
21%16%
23%12%
20%
15%
7%
12%
9%18%
Foundworkaround
Noworkaround
Any landline
58% 54% 65% 55%
Base too small to look at
this by loss of service due
to provisioning or
upgrading

41.
Key negative impacts of loss were an inability to use WiFi or contact/be
contacted
Experience of a loss of service
42%
Loss/delay had a negative impact on day to day activities
11%
3%
8%
12%
38%
38%
40%
50%
63%
None of these
Other
Incurred bank charges/late payment
Missed/rearranged gatherings/appointments
Negative impact on work related activities
Unhappiness/arguments in household
Unable complete household tasks
People unable to contact/be contacted
Unable use WiFi
Any of following applied?
F9 Did any of the following apply to your most recent loss of {relevant service} OR delay in installation / upgrade? Base: all that had a negative impact all loss of service
n=186, broadband only n=84, any landline n=102. *CAUTION LOW BASE
46%
Any loss of
service
Any landline
LoS
broadband only 66% Any landline 60%
broadband only 37% Any landline 61%
broadband only 42% Any landline 38%
broadband only 33% Any landline 42%
broadband only 41% Any landline 36%
13%
Loss during
provisioning or
upgrading
38%
Broadband only
LoS

42.
The majority (89%) of those who took time to try and resolve their loss of
service, called their provider. About half spent time trying to fix it themselves
Experience of a loss of service
25%
Took time to try to resolve loss of service
9%
47%
89%
Other
Spent time trying tofix by self
Called provider
Actions taken to try to resolve
F8a What did you do to try to resolve your loss of service? F8b How much time did you and other people in your household spend trying to get your service(s) fixed? Please
think about all the things that you and others in your household spent time on to resolve the loss (e.g. time spent on the phone with your provider or time spent trying to
fix the problem yourselves). It should not include the time spent waiting for an engineer visit(s).
Base: all loss of service that took time to resolve n=107
7%
6%
5%
9%
10%
7%
4%
37%
15%
Don't know
None
Longer
2-5 days
2 days
1 day
6-12 hours
1-6 hours
< 1 hour
Time taken trying to get services fixed
Base too small to look at
this by other subgroups
Mean:
2.5 days
Median 0.1
Mean amongst those
saying less than one day
0.2 (median 0.1) days
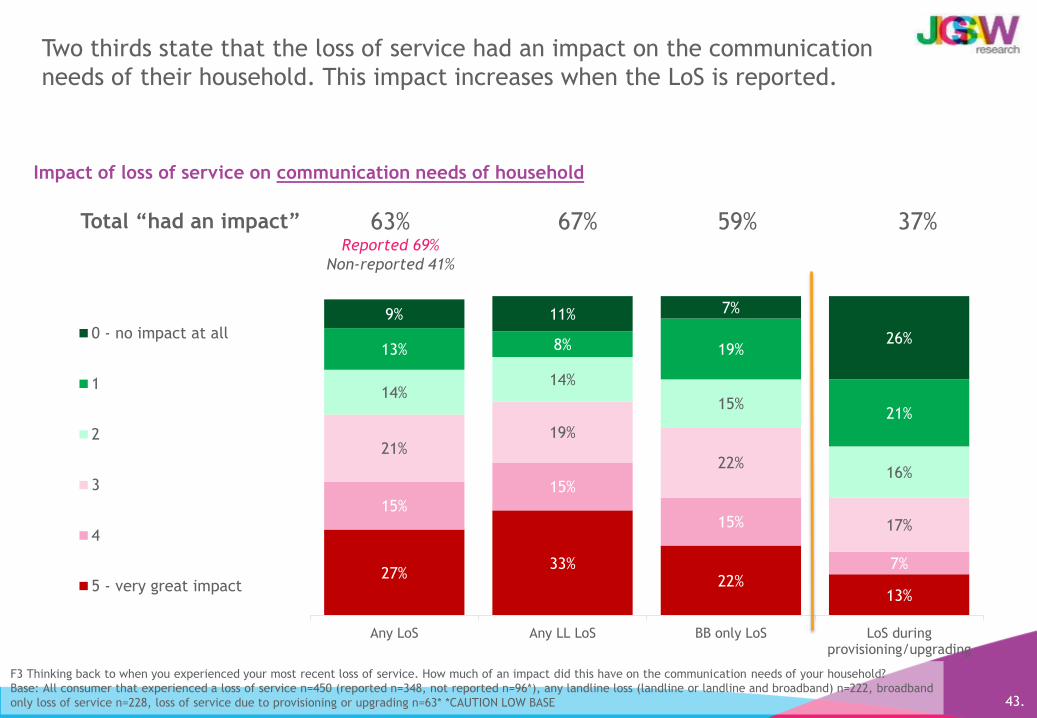
43.
Two thirds state that the loss of service had an impact on the communication
needs of their household. This impact increases when the LoS is reported.
Impact of loss of service on communication needs of household
F3 Thinking back to when you experienced your most recent loss of service. How much of an impact did this have on the communication needs of your household?
Base: All consumer that experienced a loss of service n=450 (reported n=348, not reported n=96*), any landline loss (landline or landline and broadband) n=222, broadband
only loss of service n=228, loss of service due to provisioning or upgrading n=63* *CAUTION LOW BASE
27%33%
22%13%
15%
15%
15%
7%
21%19%
22%
17%
14%14%
15%
16%
13% 8% 19%
21%
9% 11% 7%
26%
Any LoS Any LL LoS BB only LoS LoS duringprovisioning/upgrading
0 - no impact at all
1
2
3
4
5 - very great impact
63%Reported 69%
Non-reported 41%
67% 59% 37%Total “had an impact”

58%Reported 62%
Non-reported – 42%
61% 55% 31%
44.
Three fifths state that the loss of their service had an impact on the household
generally. Again, this impact increases when the LoS is reported.
Impact of loss of service on household generally
F15 How much of an impact did the loss of your {relevant service} / delay in service activation or upgrade have on your household? Base: All consumer that experienced a
loss of service n=450 (reported n=348, not reported n=96*), any landline loss (landline or landline and broadband) n=222, broadband only loss of service n=228,
loss of service due to provisioning or upgrading n=63*. *CAUTION LOW BASE
21% 25%18%
10%
14%15%
13%
3%
23%21%
24%
18%
14%13%
16%
15%
14% 13% 16%
9%
13% 13% 14%
44%
Any LoS Any LL LoS BB only LoS LoS duringprovisioning/upgrading
0 - no impact at all
1
2
3
4
5 - very great impact
Total “had an impact”

45.
Overall, 1 in 4 had spend time waiting in for engineer visit(s), with 1 in 10
taking time off work in order to do so
Incidence of waiting for engineer visit(s) or taking time off work
F13 Did you, or people in your household have to wait in for an engineer to visit? F14a Did you or any other people in your household need to take time off work as a
consequence of your loss of service? Base: All that experienced a loss of service n=450, any Landline n=222, Broadband only n=228, loss of service due to provisioning or
upgrading n=63* *CAUTION LOW BASE
27% 20% 34%Proportion had to spend time
waiting in for engineer visit(s)
(any loss of service)
Unpaid6%
Paid/holiday3%
No88%
Not sure4%
You/others in household
have to take time off work?
(any loss of service)
Unpaid6%
Paid/holiday4%
No87%
Not sure2%
Any loss of
service Any landline
Unpaid6%
Paid/holiday4%
No87%
Not sure3%
broadband only
29%
Unpaid2%
Paid/holiday2%
No85%
Not sure11%
LoS during
provisioning
/upgrading

Section 5Compensation for loss of service

5% 3% 4% 8%
82% 87%78%
82%
7% 4%9%
6%4% 3% 6%
2%3% 3% 4% 2%
Any loss of service BB only Any landline Loss during P/U
Asked & received
Not asked but received
Asked & NOT received
NOT asked, NOT received
Don't know
47.
NET compensation received
7% had received compensation for a loss of service and 4% for a loss of service
due to provisioning or upgrading
Compensation
Any loss of
service Any landlinebroadband only Loss during
provisioning/upgrading
8% 6% 10% 4%
COMPENSATION SUMMARY. H1a Did you receive any compensation from your provider for this loss of service/delay in installation/activation? H1c/d Did you ask for
compensation or was it offered/did you ask for compensation in regard to the loss of service? All that experienced a loss of service n=450, any landline loss (LL only or
LL&BB) n=222, broadband only loss n=228, loss of service due to provisioning or upgrading n=63* *CAUTION LOW BASE

48.
The vast majority had not asked for compensation – key reasons being a lack of
expectation or a belief that it wouldn’t be worth the effort
Experience of loss of service or delayed provisioning
YES 8%
Received compensation for loss of service/delayed provisioning?
5%
88%
7%
Don't know
Did not ask
Asked
Asked for compensation?
3%1%1%1%3%3%4%4%7%
15%18%
26%31%
Other
Changing providers
Not interested
Not necessary
Assumed asked for
Too much hassle
Didn’t occur to me
Outage resolved
Forgot
Didn't know how
Not provider's fault
Not worth it
Didn’t expect to get
Why not ask?
NO
93%
H1a Did you receive any compensation from your provider for this loss of service/delay in installation/activation? All that experienced a loss of service or delay
provisioning (any service) n=557 H1c/d Did you ask for compensation or was it offered/did you ask for compensation in regard to the loss of service? Base: all that did not
receive compensation n=514. H1e Why did you not ask for compensation? Base: all who did not get or ask for compensation n=454.

49.
30% of consumers expect to be compensated for the impact that the loss of
service had on their household. On average, they would expect approximately
£35 (£10 per day) – to be paid as a credit on their account or in cash
Expected compensation (amongst all with complete loss of service yet not received/asked/offered)
19%
51%
2%
2%
3%
8%
8%
7%
Don't know
No need, no adverse impact
£201+
£101-200
£51-100
£26-50
£11-25
<£10
H1k Thinking back to the loss of service you have described and all of the impacts that the loss of
service had on your household what level of payment do you think would be enough to
compensate your household for that impact? All who experienced a complete loss of service but
did not receive ask for or get compensation n=368, any landline los n=171, broadband only los
n=197. H1l What form would you like that compensation to take? Base: all giving an amount n=111
Level of payment enough to compensate household for impact (per day)
£34
7%
7%
36%
64%
Free service upgrade
Future discounts/reductions
Cash
Credit on account
Form would expect compensation to take
30%£92 excl. no need
Median 0.0
Broadband (only) LoS£20£63 excl. no need Median 0.0
Any Landline LoS£52£132 excl. no need Median 0.0
Landline & Broadband LoS£53£64 excl. no need
Median 0.0
Due to the combination of questions this is based on a combined and unweighted sample, excluding those requesting compensation of > £1,000
<H1g>: What was the monetary value of this compensation? Base: All that received compensation from the provider and found it reasonable at H1h (n=14) <H1i> How much would have been enough
to compensate for the {problem} you experienced? Base: All that received compensation from the provider and did not find it reasonable at H1g (n=12) <H1k> Thinking back to the loss
of service you have described and all of the impacts that the loss of service had on your household what level of payment do you think would be enough to compensate your
household for that impact? All who experienced a complete loss of service but did not receive ask for or get compensation (n=281)
Level of payment enough to compensate household for impact
£10

50.
Impact on attitudes to supplier relationship
1 in 10 (8%) changed supplier as a direct result of their loss of service and a
similar proportion either looked into changing but decided to stay (7%) or are
actively looking to change (7%). 2 in 5 respondents accept that services losses occur
from time to time and a quarter are happy with the response of their provider.
H1m Taking everything into account that happened when you lost service, the processes you went through and the time taken to get your service restored, has this had
any of the following effects on your attitudes towards your relationship with the supplier?
Base: All who experienced loss of service n=450, any landline (LL or LL&BB) loss of service n=222, BB only loss of service n=228, loss of service due to provisioning or
upgrading n=63* *CAUTION LOW BASE
Experience of loss of service
2
56
2
0
0
3
2
23
17
3
17
7
5
5
7
9
23
40
6
19
6
8
9
8
7
24
41
5
18
6
6
7
7
8
24
41
Other
No impact
Thought about changing supplier as a direct result ofthe issue but have not looked into it
You looked into changing supplier as a direct result ofthe issue but decided not to because of other reasons
You are actively looking to change your supplier as adirect result of the issue
Looked into changing supplier as a direct result of theissue but decided not to because you were still…
Changed supplier since the problem occured as adirect result of the issue
Happy with their response to dealing with the issue
You accepted that service loss occurs sometimesLoss of Service
Any LL Loss of Service
BB only Loss of Service
Loss due to provisioning/upgrading

Section 6Experience of missed appointments and compensation

52.
1 ½ days, on average, is considered reasonable notice of a cancellation/change
to an engineer appointment. Two-fifths would say 24 hours.
Reasonable notice for an engineer appointment to be cancelled or changed by provider
I1 Some telephone line or broadband installation or repair processes require an engineer to visit the customer’s home to carry out the work. Customers are usually given a
specific time slot within which to expect the engineer’s visit and sometimes engineers fail to arrive within the allotted time slot. What do you consider to be a reasonable
amount of notice for an engineer appointment to be cancelled or changed by your provider? Please give your answer in hours or days.
Base: Total Sample Consumer n=2088
2 days
1 day (24h)
More than 2 days
< 1 day
Mean
1.6
days
15%
28%
44%
13%
No difference by those that
have had a service issue in
the last 2 years

53.
4% have had experience of a missed appointment. 3 in 5 of these rearranged
their appointment for another day, whilst the engineer turned up later that day
for 1 in five
Experience of a missed appointment
26%
3%
6%
3%
17%
45%
None in past 2 years
Five or more
Four
Three
Two
One
I2a Have you ever experienced a missed appointment regarding a landline and/or broadband service (i.e. where an engineer was scheduled to arrive at your home within
a specified appointment window and did not turn up within that time)? This could be, for example, to install a new service or repair an existing service. Base: Total
Sample n=2088. I2b Overall how many missed appointments have you experienced in the last two years? I3 What happened after the appointment was missed? I8 M9dHow
much time did you and other people in your household spend trying to get another appointment? (e.g. time spent on the phone with your provider). It should not include
the time spent while waiting for the original missed appointment. Base: all that experienced a missed appointment n=72* *CAUTION LOW BASE
4%
Ever experienced?
How many in last 2 years?
6%
4%
12%
20%
58%
Other
Still waiting for re-arrangement
Cancelled altogether
Engineer turned up later that day
Rearranged for another day
What happened after appointment missed?

54.
On average, consumers spent 2 hours waiting for their engineer to arrive. The
waiting meant that 3 in 5 couldn’t do other things and it made 2 in 5 feel anxious.
Only 1 in 3 were able to spend less than an hour rearranging their next appointment
Experience of a missed appointment
5%
6%
19%
19%
13%
36%
Don't know
Did not spend any time
2 days or more
1 day (24 hours)
6-12 hours
1-6 hours
I2a Have you ever experienced a missed appointment regarding a landline and/or broadband service (i.e. where an engineer was scheduled to arrive at your home within
a specified appointment window and did not turn up within that time)? This could be, for example, to install a new service or repair an existing service. Base: Total
Sample n=2088. I4 How much time did you spend waiting for the engineer to arrive? I6 M4 Which, if any, of the following would you say applied to your most recent
missed appointment? I7 M11 Which of the following actions did you or other people in your household take to rearrange the appointment that had been missed?
Base: all that experienced a missed appointment n=72* CAUTION LOW BASE
4%
Ever experienced?
Time spent waiting for engineer to arrive
3%
14%
5%
12%
14%
30%
41%
57%
Don't know
Not affected
Paid for engineer to fix
Unpaid time off work
Had to take paid leave/holiday
Took time to re-arrange
Increased anxiety & stress
Waiting meant not doing other things
Which applied to most recent missed appointment?
9%
18%
8%
10%
22%
33%
Don't know
Did not spend any time
More than 8 hours
3-8 hours
1-3 hours
< one hour
Time spent trying to get another appointment
Mean: 1.8 days Mean: 2.8 hours
Median 0.3
Mean amongst those
saying less than one day:
0.2 days (median 0.2 days)
Median 0.5
Mean amongst those
saying less 8 hours: 1.0
(median 0.5)

14%
5%
5%
7%
12%
73%
Nothing
Other
Checked provider website
Used other company to fix
Assumed provider would contact
Contacted provider
55.
Three quarters (73%) contacted their provider to re-arrange the appointment.
All used the phone. Only 2 in 5 (43%) needed to contact their provider once
Experience of a missed appointment
3%
2%
2%
100%
Other
Webchat
Phone
I9a How did you contact your provider? I9b How many times did you contact your provider? I9a M12 How did you contact your provider? I9b M13 How many times did you
contact your provider? Base: All that contacted the provider n=53* CAUTION LOW BASE
How contacted?
11%
7%
8%
11%
21%
43%
6+ times
5 times
4 times
3 times
Twice
Once
How many times contacted provider?
3.3
Actions taken by you/household to re-arrange

56.
3 in 5 claim that the loss in working hours that resulted from the missed
appointment had a negative impact on their household
Experience of a missed appointment
I11 How much of an impact did this loss of working hours, have on your household Please use a scale of 0 to 5 where 0 denotes “No impact at all” and 5 denotes
“Very great impact”. I5 Thinking back to when you experienced a missed appointment, how much of an impact did this have on you and your household? Please use a
scale of 0 to 5 where 0 denotes “No impact at all” and 5 denotes “Very great impact”. Base: all that experienced a missed appointment n=72* *CAUTION LOW BASE
12%
23%
9%
9%
13%
9%
33%
34%
12%
13%
21%
12%
General impact onhousehold
Loss of working hours
0 - no impact at all 1 2 3 4 5 - very great impact
Impact of the missed appointment on household
60%
66%
% had
an impact

4%
73%
15%
3%4%
Asked & received
Not asked but received
Asked & NOT received
NOT asked, NOT received
Don't know
57.
NET compensation received
Overall, only 8% received compensation for their missed appointment
Missed appointment compensation
8%
I12a Did you receive any compensation from your provider for this missed appointment? I12b/c Did you ask for compensation or was it offered by the provider/did you ask
for compensation. Base: all that experienced a missed appointment n=72* *CAUTION LOW BASE

58.
Only 8% had received compensation for their missed appointment. The vast
majority did not ask for compensation – key reasons being a lack of expectation,
a belief that it wouldn’t be worth it and a lack of knowledge about how to do it
I12a M16 Did you receive any compensation from your provider for this missed appointment? Base: all with missed appointment n=72* I12bi Did you ask for compensation
in regards to the missed appointment? We are referring to you proactively asking for compensation rather than simply notifying your provider of the missed appointment.
Base: all who did not receive compensation n=65* I12c M18a Why did you not ask for compensation? Base: all who did not get or ask for compensation n=52*.
*CAUTION LOW BASE
YES
8%
4%
79%
16%
Don't know
Did not ask
Asked
17%
1%
7%
26%
28%
37%
Other
Forgot
Not providers fault
Didn't know how
Not worth it
Didn’t expect to get
NO
92%
Asked for compensation? Why not ask?
Experience of a missed appointment
Received compensation for missed appointment?

59.
41% of consumers expect to be compensated for a missed appointment. On
average, they would expect approximately £50 – to be paid as a credit on their
account or in cash
Hypothetical missed appointment
22%
15%
22%
1%
6%
9%
11%
9%4%
None expected
Not sure if should receive
Would expect but not sure how much
£201+
£101-200
£51-100
£26-50
£11-25
<£10
I13a I’d like you to imagine a situation where you had been given an appointment time by your supplier for an engineer to visit your home to install, repair or upgrade one
of your services and the engineer did not turn up at all. Would you expect to be compensated for this missed appointment? and if so, how much? Base: all consumer that
have NOT experienced a missed appointment n=2016
I13b M23 Why would you not expect to receive any compensation for the missed appointment? Base: all not expecting compensation n=733
I12c M24 What form would you expect that compensation to take? Base: all expecting compensation and giving an amount n=819
Expect to be compensated for a missed appointment?
2%
5%
31%
62%
Free service upgrade
Future discounts/reductions
Cash
Credit on account
Form would expect compensation to take
41%
16%9%
2%4%5%6%8%11%11%13%
19%
Don’t know
Other
Quickly resolved
Too much hassle
Don't do that sort of thing
Depends on circumstances
Not a problem
Didn't know how
No great loss/inconvenience
Just one of those things
Just don't expect it
Why not expect to receive compensation?
36%
Mean
£52£80
amongst those able to give a value

Automatic compensation :
Consumer experience of provisioning delays, loss of
service and missed appointments
Fixed Line Research:
SMEs

Fixed line research: SME executive summary (1)
61.
More than half say their business would struggle to cope without fixed broadband and
landline. However, the importance of landline is linked to its role in providing broadband
Larger SMEs (10+ emps) are more reliant upon broadband and landline services
Price dominates as the influencing factor in provider choice
Larger SMEs are more likely to cite broadband speed
3 in 5 (59%) have switched any fixed line service in the past 5 years
27% have switched both, 18% broadband (only) and 14% landline (only)
39% have experienced a complete loss of fixed line service
On average, the LoS lasted c5 days (c3 days for larger SMEs)
89% reported their LoS to their provider (96% of larger SMEs). They waited 5 hours
before reporting it and service was restored after 5.3 days (3.4 days for Larger SMEs)
Half (48%) are satisfied with their providers ability to resolve their LoS.
SMEs also become increasingly dissatisfied after waiting 3 days for their restoration
<1day = 74% satisfied, 1-3 days = 49% satisfied, 4+ days = 12% satisfied
The LoS prevented people working in 2 in 5 businesses. On average, 26 working hours
were lost in these businesses
Three fifths (61%) felt their LoS had a negative impact on their business generally
(73% respectively for Larger SMEs)
Fixed line research: SME executive summary (2)
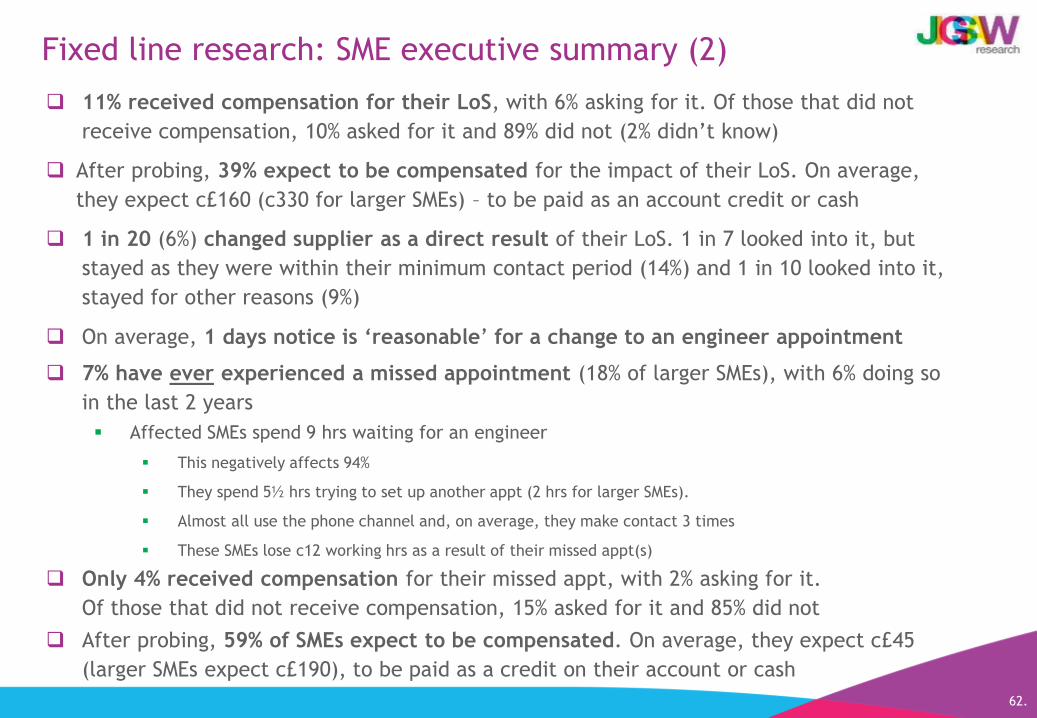
62.
11% received compensation for their LoS, with 6% asking for it. Of those that did not
receive compensation, 10% asked for it and 89% did not (2% didn’t know)
After probing, 39% expect to be compensated for the impact of their LoS. On average,
they expect c£160 (c330 for larger SMEs) – to be paid as an account credit or cash
1 in 20 (6%) changed supplier as a direct result of their LoS. 1 in 7 looked into it, but
stayed as they were within their minimum contact period (14%) and 1 in 10 looked into it,
stayed for other reasons (9%)
On average, 1 days notice is ‘reasonable’ for a change to an engineer appointment
7% have ever experienced a missed appointment (18% of larger SMEs), with 6% doing so
in the last 2 years
Affected SMEs spend 9 hrs waiting for an engineer
This negatively affects 94%
They spend 5½ hrs trying to set up another appt (2 hrs for larger SMEs).
Almost all use the phone channel and, on average, they make contact 3 times
These SMEs lose c12 working hrs as a result of their missed appt(s)
After probing, 59% of SMEs expect to be compensated. On average, they expect c£45
(larger SMEs expect c£190), to be paid as a credit on their account or cash
Only 4% received compensation for their missed appt, with 2% asking for it.
Of those that did not receive compensation, 15% asked for it and 85% did not

Section 1 Firmographics, Services used

Primary19%
Retail/ W'sale32%
Services34%
Govt 9%
Third sector
6% 31%
24%
19%
10%
4%
3%
1%
9%
< £50k
£50k-£100k
Over £100k-£250k
Over £250k-£500k
Over £500k-£1m
Over £1m-£5m
Over £5m
Don't know/ref
6%8%
5%32%
13%4%5%
2%2%1%1%0%
5%5%
3%9%
Agriculture, forestry, fishing
Manufacturing
Construction
Retail/wholesale
Professional, scientific, tech
Accommodation, food service
Information, communication
Arts, entertainment, rec
Transportation, storage
Financial, insurance
Real estate
Admin, support service
Other service
Human health, social work
Education
Third sector
64.
Key sample criteria: Firmographics
Industry group UK company turnover
Sector detail
Industry sector and Company size
F4 into which of the following bands does the company turnover in the UK fall? B1 How many employees (including yourself) are there in the company in the UK, including
both fulltime and part time workers? B2b. How many sites or offices does your organisation operate from in the UK, including this one? B4a SIC code (from sample)
Base: All SME n=1006
Number of employees(Including self)
36%
29%
26%
5%
2%
2%
0%
0%
1
2
3-4
5-9
10-19
20-49
50-99
100-249
94%
5%
1%
1
2
3+
Number of UK sites/offices
NET #employees
91%
96%
4%
1%
1-4
1-9
10-49
50-249

88%
6%
4%
2%
12%
16%
8%
11%
5%
7%
13%
9%
7%
England
South West
South East
West Midlands
East of England
North East
East Midlands
London
North West
Yorkshire and theHumber
Scotland
Wales
Northern Ireland
65.
Key sample criteria: Country/region, urbanity and job title
Region Urbanity
Location
B4b Urbanity (from sample), Region (from sample). B3a What is your job title?
Base: All SME n=1006
Job Title
73%
27%
15%
14%
27%
17%
22%
5%
Urban
Large city
Smaller city/large town
Medium town
Small town
Rural
Rural, nr urban
Remote rural
57%
18%
1%
5%
2%
2%
1%
5%
9%
Owner / Proprietor
Managing Director
Partner / ManagingPartner
Senior Manager (NET)
PA / Office manager
Company secretary
IT/Telecoms director
Other director
Other

66.
75% of landline and 70% of broadband are business contracts (significantly higher in
larger SMEs). Around half of these contracts contain SLAs and around a fifth specific
compensation/refund arrangements (again, both higher in larger SMEs)
Business Contracts
B8A Does your company have a specific business contract for your landline service or do you just have an ordinary residential contract? Base: all with landline n=957, 1-9
employees n=624, 10-249 employees n=333. B8C Does the contract contain specifically agreed levels of service quality (a Service Level Agreement), for example an
agreement to repair faults within a certain time frame? B8D Does the contract specify compensation and/or refund arrangements if certain quality service levels are not
met? Base: all with landline business contract n=816, 1-9 employees n=491, 10-249 employees n=325. B11A Does your company have a specific business contract for your
broadband service or do you just have an ordinary residential contract? Base: all with broadband n=873, 1-9 employees n=544, 10-249 employees n=329. B11C Does the
contract contain specifically agreed levels of service quality (a Service Level Agreement), for example an agreement to repair faults within a certain time frame? B11D
Does the contract specify compensation and/or refund arrangements if certain quality service levels are not met? Base: all with broadband business contract n=724, 1-9
employees n=408, 10-249 employees n=316.
Proportion which are
BUSINESS contracts
70%
68%
96%
Total
1-9 employees
10-249 employees
75%
74%
96%
Total
1-9 employees
10-249 employees
Contract contains specifically
agreed SLA
53%
52%
67%
Total
1-9 employees
10-249employees
57%
56%
73%
Total
1-9 employees
10-249employees
22%
21%
33%
Total
1-9 employees
10-249employees
23%
22%
33%
Total
1-9 employees
10-249employees
Contract specifies compensation
and/or refund arrangements
if certain quality service
levels not met
Don’t
know
1%
1%
-
28%
29%
13%
49%
50%
34%
Don’t
know
1%
1%
1%
30%
31%
15%
49%
50%
36%

67.
58% of SMEs buy any communications services in a bundled package. This is
likely to be a bundle of landline and broadband
Bundling of services
Yes58%
No 29%
N/a*13%
*Only one service used
Any services bundled together from the same supplier?
100%
99%
8%
Fixed landline
Broadband internet
Mobile phone
Almost all those
bundling have
one bundle with
one supplier
(98%). 2% have
two bundles.
Services bundled (all bundles)
92% of all with
bundle
+ only
+ +
B15 Do you buy any of your communications services together in one bundled package from the same provider? Base: all SME n=1006
B16 How many different providers do you have bundled services with? B17 And which of these services are supplied as a bundle package? Base: all SME who bundle n=538
6% of all with
bundle
45% of 10-249 SMEs do
NOT bundle
Only 4% of 10-249
SMEs use just one
1% of all with
bundle
+ only

68.
Monthly spend on telecoms services
Average bundle spend is c£80 per month
1%
12%3% 0% 0%
5%
12%
3%15%
0%
32%
15%
28%
24%
3%
19% 14% 27% 13%
13%
12% 15%
15%
20%
34%
12%20%
10%25%
45%
20%12% 15%
3% 4%
LL/BB Line Rental LL Calls Fixed broadband Mobile phone Typical bundle
Don't know/Ref
£50+
£31-50
£21-30
£11-20
<£10
Nothing
Mean £39.50 £44.20 £45.70 £54.40 £80.10
B18/B19 Approximately how much do you pay for your landline/broadband/mobile/bundle per month?
Base: All SME n=1006

69.
Total annual spend on telecoms services
As expected, total annual spend increases with size of SME. Average annual spend is
c£1,340
19% 19%
4%
34% 36%
6%
22% 22%
19%
10% 9%
20%
2% 1%
16%
13% 13%
22%
Overall spend 1-9 employees 10-249 employees
Don't know/Ref
£5000-£9,000
£2000-£4,999
£1000-£1999
£500-999
<£500
£1,337.90 £1,118.30 £6,694.2
B18/B19 Approximately how much do you pay for your landline/broadband/mobile/bundle per month? Base: all SME n=1006
Mean

1-9 10-249 Urban Rural Remote
(653) (353) (741) (207) (58)
90% 63% 88% 90% 86%
5% 31% 7% 6% 7%
3% 31% 4% 3% 5%
80% 93% 81% 83% 77%
56% 51% 53% 65% 64%
7% 4% 8% 2% 1%
22% 43% 25% 17% 13%
55% 63% 51% 67% 53%
44% 57% 43% 50% 44%
14% 17% 12% 22% 14%
7% 12% 7% 7% 5%
1% 3% 1% 3% 5%
2% 12% 2% 5% 0%
6% 19% 7% 5% 6%
89%
7%
4%
81%
56%
6%
23%
55%
45%
14%
7%
1%
3%
7%
Standard PSTN landline telephone
ISDN 2/2e
ISDN 30
Fixed broadband internet connection (NET)
Copper/standard broadband (via fixed line)
Cable broadband (usually provided byVirgin Media)
Fibre/superfast broadband (via fixed line)
MOBILES (NET)
Smartphone
Standard mobile phone
Mobile broadband (via a USBmodem/dongle)
Other broadband (e.g. satellite, fixedwireless)
Leased lines or private circuits
Ethernet/symmetrical up/down connection
70.
Larger SMEs have more sophisticated services (e.g. ISDN, fibre/superfast, smartphones).
Cable and fibre/superfast associated with urban areas.
S2 Which of the following do you have in your business?
Base: All SME n=1006
Communication services currently used
Business
SIZE OF BUSINESS Urbanity

Section 2Reliance on Services, Switching behaviour

72.
More than half feel their business would struggle to cope without fixed
broadband or landline
Importance of telecoms services currently used
53%59%
48%
28%25%
23%
13% 9%
17%
6% 7% 11%
Landline telephone Fixed Internet connection Mobile phone
My business would not findday to day activity impededwithout this service
My business would ratherthe service was availablebut could manage withoutit
My business could managebut only for a limitedperiod without it
My business would struggleto function without it
D1 Thinking again about your [landline / broadband / Mobile phone] service, how much does your business rely on each of these?
Base: All SME using landline/broadband/mobile phone n=957/873/577
Mean # days business
able to cope without service 14.8 14.7 20.3

73.
Importance of landline to businesses is likely to be linked to its role in
providing broadband rather than calls
Importance of telecoms services currently used
53%
71%
52%
28%
18%
29%
13%5%
13%
6% 5% 6%
ANY Landline Landline used ONLY for broadband Landline used for CALLS
My business would not findday to day activity impededwithout this service
My business would ratherthe service was availablebut could manage withoutit
My business could managebut only for a limitedperiod without it
My business would struggleto function without it
D1 Thinking again about your [landline / broadband / Mobile phone] service, how much does your business rely on each of these?
Base: All SME using landline (total) n=957, used only for broadband n=232, used for calls n=889
Mean # days business
able to cope without service 14.8 4.1 15.1

74.
Larger SMEs significantly more reliant upon broadband and landline services compared to
smaller businesses. No difference in reliance upon mobiles.
Level of reliance upon of telecoms services currently used
81%
80%
93%
19%
20%
7%
Total
1-9 employees
10-249 employees
High/medium Low
D1 Thinking again about your [landline / broadband / Mobile phone] service, how much does your business rely on each of these?
Base: All SME using landline/broadband/mobile phone n=957/873/577
84%
83%
96%
16%
17%
4%
Total
1-9 employees
10-249 employees
High/medium Low
72%
72%
72%
28%
28%
28%
Total
1-9 employees
10-249 employees
High/medium Low
High/medium: My business would struggle to function without it/could manage but only for a limited period without it
Low: My business would rather the service was available but could manage without it / would not find day to day activity impeded without this service

75.
When last changed supplier or upgraded existing service
Internet likely to have been changed/upgraded more recently than
landline for calls. Especially the case for larger SMEs
14%
34% 31%11%
11%
6%14%
9%
10%16%
16%
18%
45%
30%35%
Landline used only for Broadband Landline used for making & receiving calls Fixed Broadband Internet
Within last 2years
2-5 years ago
5 to 10 years ago
10 or more yearsago
Never/can'tremember
Within last 5 years: 61%(1-9 = 60%, 10-249 = 70%)
46%(1-9 = 46%, 10-249 = 51%)
54%(1-9 = 53%, 10-249 = 65%)
C1 When did you last change your (service) supplier or upgrade your existing service with the same supplier?
Base: All with LL used only for BB n=232 (1-9 n=114/10-249 =118), all with LL used for making/receiving calls n=889 (1-9 n=585/10-249 =304), all with fixed broadband
internet n=873 (1-9 n=544/10-249 =329),

76.
Price dominates as the influencing factor in provider choice. Larger SMEs (10-249 emps)
less likely to cite this, and more likely to cite broadband speed
Main factors that influenced choice of provider (unprompted)
59%
13%
11%
6%
5%
2%
2%
0%
2%
4%
Price
Only one available in area at time
Reliability
Trusted brand
Customer service
Bundled with other services
Speed of installation
Responsiveness to faults
Other
Can't remember
C2a/b/c. Thinking back to when you chose your (service), what were the main factors that influenced your choice of provider?
Base: All that have a landline but no fixed broadband and changed their provider in the last 10 years n=72, all that have a fixed broadband connection and changed their
provider in the last 10 years n=635, all with a mobile service n=577
51%
23%
20%
15%
11%
9%
7%
3%
1%
3%
4%
Price
Reliabilty
Trusted brand
Broadband speed
Customer service
Bundled with other services
Only one available in area at time
Responsiveness to faults
Speed of installation
Other
Can't remember
47%
25%
22%
17%
13%
8%
5%
5%
5%
2%
1%
1%
0%
5%
3%
Price
Reliability
Voice call coverage
Data coverage
Trusted brand
Customer service
Data allowance
Bundled with other services
Voice call quality
Only one available in area at time
Broadband speed
Choice of handsets
Responsiveness to faults
Other
Can't remember
• Only 39% of 10+ SMEs cite price vs. 52% of 1-9
• 24% of 10+ SMEs cite broadband speed vs. only 15% of 1-9• 14% of 10+ SMEs cite customer
service vs. only 8% of 1-9s
Section 3Experience of and impact of loss of service/delayed provisioning

78.
Almost 6 in 10 (59%) have switched any of landline or broadband in the past 5
years
Switching providers/services
C1 When did you last change your supplier or upgrade your service with existing supplier? Base: All with LL used only for BB n=232, all with LL used for making/receiving
calls n=889, all with fixed broadband internet n=873. E1a You said earlier that you have changed or upgraded your landline and broadband services in the last two/five
years. Did you change both services at the same time to the same provider? Base: All that changed or upgraded their landline or broadband in the last five years n=348.
E1b Which service did you change or upgrade more recently? All that did not change both services at the same time n=74*
All changed BB (only) in
last 5 years
Changed LL &
BB in past 5
years
All changed LL (only) in
last 5 years
Not changed LL
or BB in past 5
years• 84% changed both together
• 6% changed LL most recently
• 10% changed BB most recently
14%
18%
27%
41%

79.
Scenario last time changed or upgraded service
SMEs are most likely to change/upgrade with their existing provider
1% 4% 3%0%0% 0%
34%23%
31%
2%10%
9%2% 3%
6%
53% 45%
46%
9%14%
5%
Landline only Broadband only LL & BB together
No existing service
Change/upgrade existing provider, servicemaintained
Change/upgrade existing provider, temporaryloss service
Switch to new provider, temporary loss service
Switch to new provider, service maintained
Switch to new provider, service loss due to ownchoices
Other/DK
E2 Which of these scenarios applied to the last time you changed or upgraded your service?
Base: All that have changed landline/broadband/landline & broadband in the last 5 years 142/180/274
only only

1%0%
34%
2%2%
53%
9%
Landline only
No existing service
Change/upgradeexisting provider,service maintained
Change/upgradeexisting provider,temporary loss service
Switch to newprovider, temporaryloss service
Switch to newprovider, servicemaintained
Switch to newprovider, service lossdue to own choices
Other/DK
80.
Scenario last time changed or upgraded service (Landline only)
On average it takes 13 days to activate/upgrade a Landline (only). 82% said this
was in line with provider information and 88% felt the time taken was reasonable
E2 Which of these scenarios applied to the last time you changed or upgraded your service? Base: All that have changed landline most recently in the last 5 years n=142
E3 Did you move premises at the same time? Base: All not ‘other/dk’ at E2 n=139. E4 Did the change or upgrade require the installation of new lines or other services? Base: All not ‘no existing
service’, ‘other/dk’ or lost service due to own actions at E2 n=131. E5 Approximately how many calendar days after placing the order was the service activated or upgraded? Base: all that had
a new landline service n=139 (not including other/dk or those without service due to own choices). E5b And was this in line with the time period you had been given by your provider? E6a Do
you think the time it took was reasonable? Base: All where service activated n=138
9% said
change
required
installation
new lines or
other
services
6%
moved
premises
at the
same
time
only
13%
0%
21%
4%
10%
4%
13%
0%
1%
2%
3%
7%
18%
2%
Don’t know
Not yet
22+ days
15 to 21
11 to 14
8 to 10
Seven
Six
Five
Four
Three
Two
One
Zero
Mean (days)
13
Service activation (days)
In line with time period
given by provider?
82%
Reasonable timing?
88%
Of the 6 who said no, 1 said “1 day”,
3 said “2 days”, 2 said “7 days”,

4%0%
23%
10%
3%
45%
14%
Broadband only
No existing service
Change/upgradeexisting provider,service maintained
Change/upgradeexisting provider,temporary loss service
Switch to newprovider, temporaryloss service
Switch to newprovider, servicemaintained
Switch to newprovider, service lossdue to own choices
Other/DK
81.
Scenario last time changed or upgraded service (Broadband only)
On average 16 days to service activation for Broadband only. 86% said this was in
line with provider information and 83% felt the time taken was reasonable.
E2 Which of these scenarios applied to the last time you changed or upgraded your service? Base: All that have changed broadband most recently in the last 5 years n=180
E3 Did you move premises at the same time? Base: All not ‘other/dk’ at E2 n=177. E4 Did the change or upgrade require the installation of new lines or other services? Base: All not ‘no existing
service’ other/dk’ or lost service due to own actions at E2 n=157. E5 Approximately how many calendar days after placing the order was the service activated or upgraded? Base: all that had a
new broadband service n=176 (not including other/dk or those without service due to own choices). E5b And was this in line with the time period you had been given by your provider? E6a Do
you think the time it took was reasonable? Base: All where service activated n=176
12%
0%
22%
10%
16%
5%
17%
2%
7%
1%
2%
2%
3%
0
Don't know
Not yet
22+ days
15 to 21
11 to 14
8 to 10
Seven
Six
Five
Four
Three
Two
One
Zero
Mean (days)
16
Service activation (days)
In line with time period
given by provider?
86%
Reasonable timing?
83%
Of the 23 who said no, the average
(mean) was 5 days to be reasonable
only
25% said
change
required
installation
new lines or
other
services
5%
moved
premises
at the
same
time

3%0%
31%
9%
6%
46%
5%
LL & BB together
No existing service
Change/upgradeexisting provider,service maintained
Change/upgradeexisting provider,temporary loss service
Switch to newprovider, temporaryloss service
Switch to newprovider, servicemaintained
Switch to newprovider, service lossdue to own choices
Other/DK
82.
Scenario last time changed or upgraded service (LL&BB together)
It takes 15 days for combined Landline & Broadband to be activated. 84% said
this was in line with provider information and 82% felt the time taken was
reasonable.
E2 Which of these scenarios applied to the last time you changed or upgraded your service? Base: All that have changed landline & broadband together in the last 5 years n=274. E3 Did you
move premises at the same time? Base: All not ‘other/dk’ at E2 n=266. E4 Did the change or upgrade require an engineer to visit your home to install new lines or other equipment? Base: All
not ‘no existing service’ other/dk’ or lost service due to own actions at E2 n=246. E5 Approximately how many calendar days after placing the order was the service activated or upgraded?
Base: all that had a new landline & broadband service n=264 (not including other/dk or those without service due to own choices). E5b And was this in line with the time period you had been
given by your provider? E6a Do you think the time it took was reasonable? Base: All where service activated n=261
19%
1%
17%
11%
12%
7%
9%
0%
4%
0%
1%
6%
11%
2%
Don't know
Not yet
22+ days
15 to 21
11 to 14
8 to 10
Seven
Six
Five
Four
Three
Two
One
Zero
Mean (days)
15
Service activation (days)
In line with time period
given by provider?
84%
Reasonable timing?
82%
Of the 6 who said no, 1 said “1 day”,
3 said “2 days”, 2 said “7 days”,
15% said
change
required
installation
new lines or
other
services
10%
moved
premises
at the
same
time

83.
6% of our sample had experienced loss of service (during provisioning or
upgrading for any of LL, BB or LL&BB). On average this loss was 24 days.
Experience of loss of service due to provisioning or upgrading (any service) – how long without the service?
10%
7%
13%
7%
10%
18%
5%
7%
1%
8%
24%
Don't know
Over 50 days
21-50 days
11-20 days
6-10 days
3-5 days
2 days
1 day
6-24 hours
1-6 hours
< one hour
E8 You said earlier that you experienced a temporary service loss when ordering a new service or upgrading. How long were you without service during the changeover
period? Base; all that experienced a loss of service due to provisioning or upgrading n=74* *CAUTION LOW BASE
Mean (days) 24Base sizes too low to analyse
by specific services
Mean amongst those saying
less than 365 days: 10.7 days

84.
Amongst switchers, just over a week on average would be considered a
reasonable activation time if a business didn’t have an existing service
(Amongst switchers in past 5 years): If didn’t have service at all, what would be reasonable activation time?
3%6%
0%13%
6%25%
0%10%
3%12%15%
8%0%
Don't know
22+ days
15 to 21
11 to 14
8 to 10
Seven
Six
Five
Four
Three
Two
One
Zero
E7 I’d like you to imagine that you did not have (service) at all and had placed an order to have the service installed. How many days would you consider it reasonable to
wait for it to be activated? Base: all who had switched landline/broadband/both most recently in past 5 years and had existing landline service n=134, broadband n=160,
landline & broadband n=256
Mean (days) 8
0%3%4%
15%5%
27%0%
14%2%
10%8%9%
4%
Don't know
22+ days
15 to 21
11 to 14
8 to 10
Seven
Six
Five
Four
Three
Two
One
Zero
Mean (days) 8 8
0%4%
0%17%
3%28%
0%20%
4%8%10%
6%0%
Don't know
22+ days
15 to 21
11 to 14
8 to 10
Seven
Six
Five
Four
Three
Two
One
Zero
only only

85.
Amongst all with the service, on average 6 days would be acceptable for
landline activation; slightly longer for broadband (7 days)
If didn’t have service at all, what would be reasonable activation time?
2%
16%
26%
0%
11%
3%
10%
14%
17%
1%
Don’t know
8 or more
Seven
Six
Five
Four
Three
Two
One
Zero
G16 I’d like you to imagine that you did not have (service) at all and had placed an order to have the service installed. How many days would you consider it reasonable
to wait for it to be activated? Base: all with a landline n=957, all with broadband n=873
Mean (days) 6
2%
17%
27%
0%
12%
3%
10%
13%
15%
1%
Don't know
8 or more
Seven
Six
Five
Four
Three
Two
One
Zero
Mean (days) 7

Section 4Experience of and impact of loss of service

87.
Almost two-fifths (39%) have ever experienced a complete loss of service for
more than one hour. Larger SMEs are more likely to have experienced this.
Experience of loss of service
31%
41%
48%
26%
30%
62%
26%
31%
61%
Landline
Broadband
None
Total
1-9employees
10-249employees
E9a Over the last 2 years, have you experienced a complete loss of service for more than one hour for the following services taken by your business? By loss of service, we
mean complete inability to make or receive voice calls or to access the internet. Please don’t include instances when your connection speed was slower than usual, but
do include those that occurred as a result of a fault on your existing service. E9b Did you lose your landline and your broadband service at the same time? E9c Which
service did you lose most recently? E9d When you lost your landline service did you also lose your broadband at the same time? E9e When you lost your broadband service
did you also lose your landline at the same time? Base: Total Sample with landline or broadband n=991
6%
12%
20%
Landline ONLY
Broadband ONLY
Landline & Broadbandtogether
Most recent loss of service

88.
Overall, 42% of SMEs had experienced any loss or delay with regard to
telecommunications services. The vast majority of these were related to loss of
existing services due to a fault, rather than issues with provisioning/upgrading
% incidence in each group within the SME population
PRIORITY GROUP DEFINITIONS. Base: All SME with a fixed line (LL, BB or LL&BB) not mobile only n=991
Any
loss/delay
42%
Loss of
existing
service
n=420
Loss of service
due to
provisioning or
upgrading
n=20
Loss of service due to a
fault
Loss of service during
provisioning or upgrading
Delayed
Provisioning
n=24
New service
Delayed
Provisioning
n=9
Provisioning NOT within
time-scale given
Did not have existing
service at property.
Provisioning NOT within
time-scale given
1%
5% 6%
39%
NO
loss/delay
58%

89.
Loss of service clearly very variable, but on average lasted around 4 days for
broadband (only), rising to almost a week for any landline
How long experienced loss of service for?
2%
2%
6%
5%
5%
14%
15%
13%
7%
25%
4%
Don't know
Unresolved
21+ days
11-20 days
6-10 days
3-5 days
2 days
1 day
6-23 hours
1-6 hours
< one hour
F1 Thinking about the most recent loss of your (service) due to a fault on your (service) how long did you experience a loss of service for? Base: All that experienced a loss
of service Total n=420, any landline n=259, broadband only n=161
Mean (days) 5.2 Mean (days) 3.7 5.9
3%
2%
3%
2%
1%
12%
16%
3%
15%
4%
36%
3%
Don't know
Unresolved
21+ days
11-20 days
6-10 days
3-5 days
2 days
1-2 days
1 day
6-23 hours
1-6 hours
< one hour
1%
2%
8%
7%
8%
15%
15%
12%
9%
19%
4%
Don't know
Unresolved
21+ days
11-20 days
6-10 days
3-5 days
2 days
1 day
6-23 hours
1-6 hours
< one hour
Any
landline
only
Any loss
(total)

90.
Larger SMEs likely to have experienced their loss of service over a shorter time
frame
How long experienced loss of service for (any service)?
2%
2%
6%
5%
5%
14%
15%
13%
7%
25%
4%
Don't know
Unresolved
21+ days
11-20 days
6-10 days
3-5 days
2 days
1 day
6-23 hours
1-6 hours
< one hour
F1 Thinking about the most recent loss of your (service) due to a fault on your (service) how long did you experience a loss of service for? Base: All that experienced a loss
of service Total n=420, 1-9 n=251, 10-249 n=169
Mean (days) 5.2 Mean (days) 5.3 3.2
2%
2%
6%
5%
6%
14%
15%
13%
9%
24%
4%
Don't know
Unresolved
21+ days
11-20 days
6-10 days
3-5 days
2 days
1 day
6-23 hours
1-6 hours
< one hour
0%
2%
4%
2%
5%
16%
14%
11%
4%
39%
2%
Don't know
Unresolved
21+ days
11-20 days
6-10 days
3-5 days
2 days
1 day
6-23 hours
1-6 hours
< one hour
Total 1-9
employees
10-249
employees

91.
On average, almost 9 in 10 reported to provider (96% of larger SMEs). Of these,
almost three-quarters made contact within the hour – almost all via telephone,
half just once. A quarter had a recurring fault.
Experience of loss of service (any service)
F2a Did you report your Landline/Broadband/Landline & Broadband loss of service?
Base: ANY SERVICE: loss of service n=420, 1-9 employees n=251, 10-249 employees n=169. F2c How long after you (lost service/expected service to be installed/upgraded)
did you contact the provider to let them know? F2d How did you contact your provider? F2e How many times did you contact your provider? F5 How long did it take for
your service to be restored after you first notified your provider of the issue? F4 Which of the following best matches what happened when you reported the loss of
service? BASE: all who reported n=388, 1-9 employees n=226, 10-249 n=162
91%
4%
3%
7%
91%
4%
3%
7%
89%
5%
3%
8%
Phone
Webchat
Other
1-9
88%
Reported to provider?
Why NOT reported?
1%
17%
10%
11%
16%
8%
27%
0%
1%
1%
1%
1%
5%
3%
18%
72%
Don't know
6+ days
3-5 days
1-2 days
1 day
6-23 hours
1-6 hours
< one hour
Wait beforecontact
Time takento restore
Mean:
0.2 days
How long wait after loss/expectation before contacting provider?
How long did it take for service to be restored after first notification?
NO
11%
Mean:
5.3 days
51%
22%
24%
3%
51%
22%
24%
3%
46%
22%
31%
1%
Once
2-3 times
4 or more times
Don't know
Total
89%10-249
96%
62%
24%
3%
11%
61%
25%
3%
11%
67%
20%
2%
11%
Fixed first time reported
Same fault again after repair
Provider fixed without reporting
Other
What happened when reported?
1-9
5.4 days
10-249
3.4 days
Of the 32 who did not report, 8
looked at providers website for
updates, 5 said it was fixed before
they had time to report, 6 didn’t
think it would last very long

92.
Businesses experiencing any LL loss were more likely to report it to their
provider. On average, broadband (only) faults were restored more quickly
(within c3 days)
Experience of loss of service (any service)
F2a Did you report your Landline/Broadband/Landline & Broadband loss of service?
Base: ANY SERVICE: loss of service n=420, broadband only n=161, any landline n=169. F2c How long after you (lost service/expected service to be installed/upgraded) did
you contact the provider to let them know? F2d How did you contact your provider? F2e How many times did you contact your provider? F5 How long did it take for your
service to be restored after you first notified your provider of the issue? F4 Which of the following best matches what happened when you reported the loss of service?
BASE: all who reported n=388, broadband only n=143, any landline n=245
91%
4%
3%
7%
99%
0%
1%
0%
88%
5%
5%
11%
Phone
Webchat
Other
BB only
84%
Reported to provider?
51%
22%
24%
3%
56%
21%
20%
2%
48%
23%
26%
3%
Once
2-3 times
4 or more times
Don't know
Total loss
89%Any LL
91%
62%
24%
3%
11%
60%
29%
2%
9%
62%
22%
3%
13%
Fixed first time reported
Same fault again after repair
Provider fixed without reporting
Other
What happened when reported?
Why NOT reported?
1%
17%
10%
11%
16%
8%
27%
0%
1%
1%
1%
1%
5%
3%
18%
72%
Don't know
6+ days
3-5 days
1-2 days
1 day
6-23 hours
1-6 hours
< one hour
Wait beforecontact
Time takento restore
Mean:
0.2 days
How long wait after loss/expectation before contacting provider?
How long did it take for service to be restored after first notification?
NO
11%
Mean:
5.3 days
BB only
2.9 days
Any LL
6.3 days
Of the 32 who did not report, 8
looked at providers website for
updates, 5 said it was fixed before
they had time to report, 6 didn’t
think it would last very long

93.
SMEs become increasingly dissatisfied with their provider’s ability to resolve
the issue as the length of time to resolve increases
F6 Overall, how satisfied or dissatisfied were you with the length of time it took your provider to resolve your loss of service for your (service), using the following scale?
Base: All with a complete loss of service. Total n=420, F5 How long did it take for your service to be restored after you first notified your provider of the issue? BASE: all
who reported n=388, all where service restored within 1 day n=164, 1-3 days n=131, more than 3 days n=77*
*CAUTION LOW BASE
Satisfaction with provider ability to resolve loss of service
x by how long did it took for your service to be restored after first notifying the provider
Total “satisfied”
2% 1% 0%11%
25%
2%
21%
61%
11%
3%
13%
12%
15%
19%
17%
4%
29%
40%
32%
12%19%
35%
17%
0%
Loss of Service Up to 1 day 1-3 days More than 3 days
Very satisfied
Fairly satisfied
Neither/nor
Fairly dissatisfied
Very dissatisfied
DK/NA
48% 74% 49% 12%

2% 0% 0% 2% 0%
25% 25% 25%16%
29%
11%11%
17%
12%
11%
15%15%
10%
21%12%
29%29% 30% 33%
26%
19%19% 17% 17%
20%
Loss of Service 1-9 employees 10-249 employees BB only Any LL
Very satisfied
Fairly satisfied
Neither/nor
Fairly dissatisfied
Very dissatisfied
DK/NA
94.
Overall around half are satisfied with the length of time their provider took to
resolve their loss of service (slightly lower satisfaction if business had lost their
landline – either on it’s own or with broadband)
Satisfaction with provider ability to resolve loss of service
F6 Overall, how satisfied or dissatisfied were you with the length of time it took your provider to resolve your loss of service for your (service), using the following scale?
Base: All with a complete loss of service. Total n=420, 1-9 n=251, 10-249 n=169, broadband only n=161, any landline n=259
48% 48% 47% 50% 47%Total “satisfied”

95.
Two-thirds found an alternative workaround to the loss of service. Half stated it had
a negative impact on their work-related activities, whilst more than two-fifths felt it caused stress
Larger SMEs / those losing any landline were more likely to be negatively impacted by their service
loss
F7a Which, if any, of the following would you say applied to your most recent loss of service? Base: All that experienced a loss of service
Total n=420, 1-9 n=251, 10-249 n=169 landline only n=90*, broadband only n=161, landline and broadband together n=189, any landline n=259
*CAUTION LOW BASE
0
5
3
53
57
66
70
1
1
7
44
46
52
67
1
1
7
44
47
53
67
Don't know
Other
Did not affect business
Caused anxiety or stress
Too time to resolve loss ofservice
Negative impact on workrelated activities
Found alternativeworkaround
Total loss
1-9employees
10-249employees
Experience of loss of service
Business impacts (by service lost)
2
2
17
37
43
48
49
0
0
2
48
49
55
76
Don't know
Other
Did not affect business
Caused anxiety or stress
Took time to resolve loss ofservice
Negative impact on workrelated activities
Found alternativeworkaround
Any LL
BB only
Business impacts (by business size)

96.
Amongst those who found an alternative workaround, mobiles were most likely
to be involved. More than half claim no direct financial cost resulting from their
alternative workaround actions. BB (only) workarounds typically cost less.
Experience of a complete loss of service (any service)
Found an alternative workaround
10%
8%
2%
3%
3%
3%
3%
33%
37%
62%
82%
19%
0%
2%
0%
2%
6%
15%
43%
48%
43%
45%
12%
6%
2%
2%
3%
4%
6%
35%
40%
57%
73%
Didn't do anything
Other
Alternative landline to receive calls
Used backup Internet connection
Alternative landline to make calls
Used dongle
Went/worked from other location
Used mobile to access Internet
Used mobile to access emails
Used mobile to receive calls
Used mobile to make calls
Actions taken to reduce impact
F7a Which, if any, of the following would you say applied to your most recent loss of service? Base: All that experienced a loss of service. Total n=420.
F7b> What, if anything, did you do to reduce the impact of this loss of service? Base: all who found an alternative workaround n=252, broadband only n=85*, any landline
n=195. F7c> Thinking about the factors you mentioned, what were the direct financial costs to you (e.g. cost of mobile calls) and the people in your business that were
caused by your most recent loss of service? Base: all who did something n=255, broadband only n=73 any landline n=182. *CAUTION LOW BASE
19%
54%
12%
9%
6%
23%
50%
7%
9%
12%
20%
53%
11%
7%
10%
Don't know
No direct financial cost
£200+
£50-200
<£50 £270
Direct financial costs of these actions
BB only
49%Total loss
67%Any LL
76%
Mean
£186
£293
£798 excl. no direct
cost
£526 excl. no direct
cost
£877 excl. no direct
cost
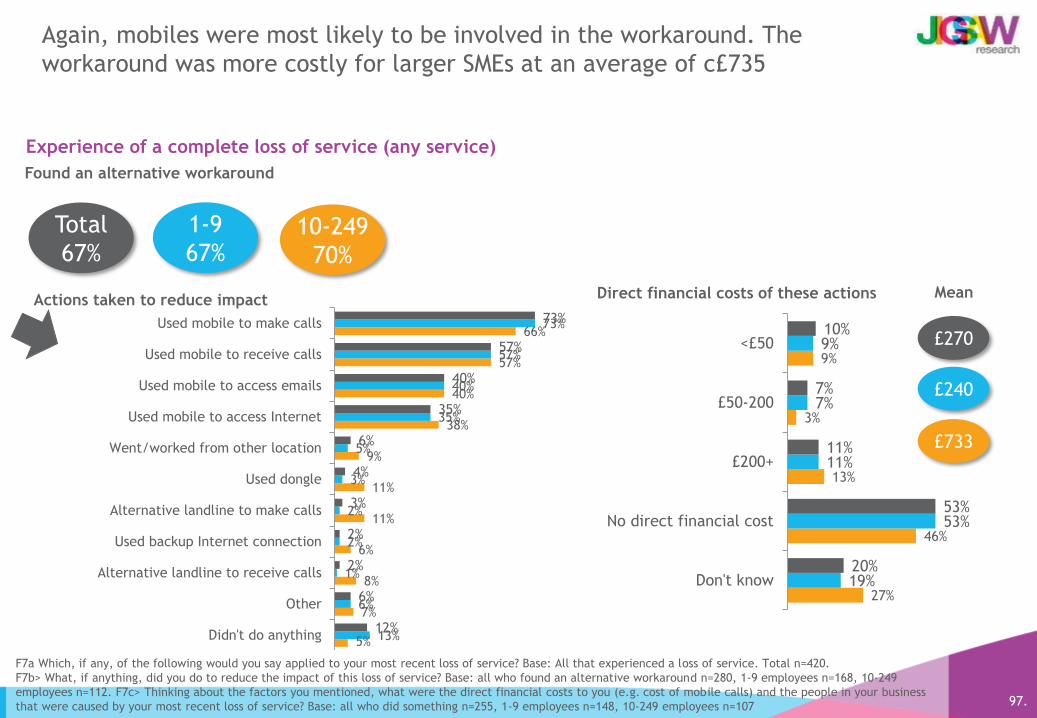
97.
Again, mobiles were most likely to be involved in the workaround. The
workaround was more costly for larger SMEs at an average of c£735
Experience of a complete loss of service (any service)
Found an alternative workaround
5%
7%
8%
6%
11%
11%
9%
38%
40%
57%
66%
13%
6%
1%
2%
2%
3%
5%
35%
40%
57%
73%
12%
6%
2%
2%
3%
4%
6%
35%
40%
57%
73%
Didn't do anything
Other
Alternative landline to receive calls
Used backup Internet connection
Alternative landline to make calls
Used dongle
Went/worked from other location
Used mobile to access Internet
Used mobile to access emails
Used mobile to receive calls
Used mobile to make calls
Actions taken to reduce impact
F7a Which, if any, of the following would you say applied to your most recent loss of service? Base: All that experienced a loss of service. Total n=420.
F7b> What, if anything, did you do to reduce the impact of this loss of service? Base: all who found an alternative workaround n=280, 1-9 employees n=168, 10-249
employees n=112. F7c> Thinking about the factors you mentioned, what were the direct financial costs to you (e.g. cost of mobile calls) and the people in your business
that were caused by your most recent loss of service? Base: all who did something n=255, 1-9 employees n=148, 10-249 employees n=107
27%
46%
13%
3%
9%
19%
53%
11%
7%
9%
20%
53%
11%
7%
10%
Don't know
No direct financial cost
£200+
£50-200
<£50 £270
Direct financial costs of these actions
1-9
67%
Total
67%10-249
70%
Mean
£240
£733

52%(1-9=51% / 10+ =69%)
70%(1-9=69% / 10+ =83%)
75%(1-9=74% / 10+ =79%)
56%(1-9=53% / 10+ =86%)
20%29%
17%
22%
20%
11%
15%14%
13%11%
15% 13%
Found workaround No workaround
0 - notaffected
1
2
3
4
5 - verygreatimpact
98.
Two thirds of those that found a workaround claim that it had a negative
impact on their normal activities (the workaround negatively affected three
quarters of larger SMEs).
Extent to which normal activities affected by workaround/loss of service
F7d To what extent were your normal activities affected by this workaround? Base: all that found alternative workaround and did something n=255, broadband only n=73*,
any landline n=182. F10 To what extent were your normal activities affected by this loss of service? Please use a scale where 0 indicates ‘not affected’ (i.e. was able to
carry out same activity as would have done in event of no loss of service) and 5 indicates a very large impact (i.e. it was not possible to do any of the things you usually
do using the service you lost. Base: all that did NOT find an alternative workaround n=140, broadband only n=76*, any landline n=64* *CAUTION LOW BASE
57%(1-9=56% / 10+ =72%)
62%(1-9=61% / 10+ =85%)
Total “had
an impact”
22% 20%
28%24%
24%
12%
10%
10%
3%
15%
12%20%
Found workaround No workaround
20%
39%
14%
21%
19%
9%16%
20%16%
6%16%5%
Found workaround No workaround
Any loss of
service
broadband only Any
landline

99.
The majority (95%) of those who took time to try and resolve their loss of
service, called their provider. About half spent time trying to fix it themselves.
Half spent less than 6 hours trying to fix their fault.
Experience of a complete loss of service (any service)
Took time to try to resolve loss of service
4%
27%
51%
94%
8%
27%
55%
95%
7%
27%
55%
95%
Other
Looked at providerwebsite
Spent time trying tofix by self
Called provider
Actions taken to try to resolve
F8a What did you do to try to resolve your loss of service? F8b How much time did you and other people in your business spend trying to get your service(s) fixed? Please
think about all the things that you and others in your business spent time on to resolve the loss (e.g. time spent on the phone with your provider or time spent trying to
fix the problem yourselves). It should not include the time spent waiting for an engineer visit(s).
Base: all that took time to resolve n=235, 1-9 employees n=134, 10-249 employees n=101, total loss n=235, broadband only n=87*, any landline n=148
*CAUTION LOW BASE
3%
12%
1%
6%
1%
3%
10%
3%
6%
55%
0%
9%
5%
8%
3%
3%
2%
3%
6%
60%
0%
9%
4%
8%
3%
3%
3%
3%
6%
60%
Don't know
No time spent
Longer
2-5 days
2 days
1-2 days
1 day
12-23 hours
6-12 hours
Up to 6 hours
Time taken trying to get services back
1-9
46%
Total
47%10-249
57%

100.
The majority (95%) of those who took time to try and resolve their loss of
service, called their provider. About half spent time trying to fix it themselves.
Half spent less than 6 hours trying to fix their fault.
4%
27%
51%
94%
8%
27%
55%
95%
7%
27%
55%
95%
Other
Looked at providerwebsite
Spent time trying tofix by self
Called provider
F8a What did you do to try to resolve your loss of service? F8b How much time did you and other people in your business spend trying to get your service(s) fixed? Please
think about all the things that you and others in your business spent time on to resolve the loss (e.g. time spent on the phone with your provider or time spent trying to
fix the problem yourselves). It should not include the time spent waiting for an engineer visit(s).
Base: all that took time to resolve n=235, 1-9 employees n=134, 10-249 employees n=101, total loss n=235, broadband only n=87*, any landline n=148
BB only
43%Total loss
47%Any LL
49%
8%
24%
51%
95%
5%
32%
62%
96%
7%
27%
55%
95%
Took time to try to resolve loss of service
Actions taken to try to resolve
Time taken trying to get services back
Experience of a complete loss of service (any service)
0%
6%
2%
9%
2%
2%
4%
4%
8%
63%
1%
17%
8%
5%
5%
5%
1%
3%
2%
54%
0%
9%
4%
8%
3%
3%
3%
3%
6%
60%
Don't know
No time spent
Longer
2-5 days
2 days
1-2 days
1 day
12-23 hours
6-12 hours
Up to 6 hours

101.
Key negative impacts of loss were time wasted (especially micros) – and work
disrupted and stress (especially larger SMEs and BB (only) loss of service).
6 in 10 claimed an impact on supplier communications and more than half felt
an impact on sales or revenue
Experience of a complete loss of service (any service)
Loss of service had a negative impact
0%
2%
32%
40%
52%
62%
79%
76%
70%
3%
0%
28%
34%
56%
62%
66%
69%
86%
3%
0%
28%
34%
56%
62%
67%
69%
85%
None of these
Other
Impact on brand
Longer working hours
Impact on sales or revenue
Impact on communications with suppliers
Disruption to staff ability to work
Stress
Manager time wasted
Any of following applied?
F9 Did any of the following apply to your most recent loss of service? Base: all that had a negative impact n=264, 1-9 employees n=142, 10-249 employees n=121
Any that had a negative impact through total loss of service n=264, broadband only n=108, any landline n=156
1-9
52%
Total
53%10-249
66%
3%
1%
26%
33%
59%
60%
62%
70%
85%
3%
0%
34%
37%
47%
66%
79%
67%
84%
3%
0%
28%
34%
56%
62%
67%
69%
85%
BB only
48%Total loss
53%Any LL
55%

102.
Larger SMEs less likely to say no-one was prevented from working
Experience of loss of service
F11 As a result of your loss of [landline telephone / fixed broadband] how many people, if any, were prevented from working? Base: all loss of service n=420, 1-9
employees n=251, 10-249 employees n=169 F12 Approximately how many working hours do you think were lost as a result of your loss of [landline telephone /
fixed broadband] / delay in service activation or upgrade? Please don't include the time taken to fix the issue. Base: all where people prevented from working
n=199 1-9 employees n=103, 10-249 employees n=96* *CAUTION LOW BASE
People prevented from working by loss of service
48%
33%
17%
2%
61%
1%
15%
23%
60%
4%
15%
21%
None prevented from working
5+ people
2-4 people
One
Total
1-9 employees
10-249 employees
Working hours lost as result of loss service
1
Mean
1
7
7%
4%
30%
16%
11%
18%
4%
6%
9%
17%
22%
16%
19%
12%
6%
9%
19%
21%
16%
19%
11%
Don’t know
No time
25+ hours
9-24 hours
5-8 hours
3-4 hours
1-2 hours
Total
1-9 employees
10-249employees
26 hours
Mean
16 hours
150 hours

67% 66% 80% 62% 69%
32% 31%
43%
29% 34%
19% 19%
15%
21%18%
16% 16%
21%
12%18%
11% 11%
12%
14%9%
7% 7%
5%
4%8%
14% 15%
4%
20%12%
Loss of Service 1-9 employees 10-249 employees BB only Any LL
0 - no impact at all
1
2
3
4
5 - very great impact
103.
Overall, two thirds feel the loss of service had an impact on the communication
needs of their business (a very great impact in a third of cases). This is driven
by loss of any landline. Loss of broadband alone is less impactful. Larger SMEs
felt the impact more than smaller ones
Impact of loss of service on communication needs of business
F3 Thinking back to when you experienced your most recent loss service. How much of an impact did this have on the communication needs of your business? Base: All that
experienced a loss of service Total n=420, 1-9 n=251, 10-249 n=169 landline only n=90*, broadband only n=161, any landline n=259, landline and broadband together n=189
*CAUTION LOW BASE
Total “had an impact”

61% 61% 73% 61% 62%
29% 29%39%
29% 29%
18% 18%
18%
20% 16%
15% 14%
17%
12% 16%
11% 12%
7%
9% 12%
8% 8%
9%
3%
10%
19% 19%11%
27%15%
Loss of Service 1-9 employees 10-249 employees BB only Any LL
0 - no impact at all
1
2
3
4
5 - very great impact
104.
Three fifths feel that the loss of their service had an impact on their business
generally. Larger SMEs felt the impact more than smaller ones
F15 How much of an impact did the loss of your {relevant service} / delay in service activation or upgrade have on your business? Base: All that experienced a loss of
service Total n=420, 1-9 n=251, 10-249 n=169, landline only n=90, broadband only n=161, any landline n=259 *CAUTION LOW BASE
Total “had an impact”
Impact of loss of service on business generally

Section 5Compensation for loss of service

2% 2% 5% 1% 3%
79% 79% 70% 81% 76%
8% 8% 18%11%
8%
5% 5% 2% 5%5%
6% 6% 5% 2%8%
All loss of service 1-9 employees 10-249 employees Loss of BB (only) Any loss of LL
Asked & received
Not asked but received
Asked & NOT received
NOT asked, NOT received
Don't know
106.
NET compensation received
11% received compensation for their LoS. Larger SMEs more likely to have
asked for yet not received compensation for loss of service
Compensation for loss of service
11% 11% 7% 7% 14%
COMPENSATION SUMMARY: Base: All that experienced a loss of service Total n=420, 1-9 n=251, 10-249 n=169, broadband only n=161, any landline n=259

107.
The vast majority have not asked for compensation – key reasons being a lack
of expectation, a belief that it wouldn’t be worth the effort or because the
provider wasn’t at fault
Experience of a loss of service (any LL/BB or LL&BB)
2%
89%
10%
Don't know
Did not ask
Asked
11%
Received compensation for loss of service?
Asked for compensation?
2%2%
3%
5%
8%
10%
13%
18%
19%23%
Issue unresolved
Too busy
Not eligible due to T&Cs
Not bothered
Forgot
Minor issue/no impact
Didn't know how
No provider fault
Didn’t expect to get
Not worth it
Why not ask?
89% No
Yes
H1a Did you receive any compensation from your provider for this loss of service? All that experienced a loss of service n=420 H1c/d Did you ask for compensation or was
it offered/did you ask for compensation in regard to the loss of service? Base: all that did not receive compensation n=384. H1e Why did you not ask for compensation?
Base: all who did not get or ask for compensation n=321.

108.
Around two-fifths would expect some compensation for loss of service. Majority
of these would expect it in the form of account credit
Expected compensation (amongst all with loss of service yet not received/asked/offered)
26%
35%
12%
5%
7%
5%
7%
3%
Don't know
No need, no adverse impact
£201+
£101-200
£51-100
£26-50
£11-25
<£10
H1k Thinking back to the loss of service you have described and all of the impacts that the loss of service had on your business what level of payment do you think would
be enough to compensate your business for that impact? All who experienced a complete loss of service but did not receive ask for or get compensation n=321
H1l What form would you like that compensation to take? Base: all giving an amount n=129
Level of payment enough to compensate business for impact
£160
4%
12%
28%
62%
Free service upgrade
Future discounts/reductions
Cash
Credit on account
Form would expect compensation to take
39%
Mean
1-9 employees£151
10-249 employees £330
BB (only) LoS£160
Any LL LoS£126
£301 excl. “no need”
£282 excl. “no need”
£730 excl. “no need”
£301 excl. “no need”
£300 excl. “no need”

109.
Impact on attitudes to supplier relationship
More than half of SMEs accept that service loss can occur. Some have looked
into switching as a result of service loss but only 6% have actually done so
H1m Taking everything into account that happened when you lost service, the processes you went through and the time taken to get your service restored, has this had
any of the following effects on your attitudes towards your relationship with the supplier?
Base: All who experienced loss of service for any/LL only/BB only/LL&BB n=420, 1-9 employees n=251, 10-249 employees n=169
2
7
5
3
7
5
16
14
52
3
8
9
9
8
6
13
16
52
3
8
8
9
8
6
14
16
52
Other
No impact
Thought about changing supplier as a direct result of the issuebut have not looked into it
You looked into changing supplier as a direct result of the issuebut decided not to because of other reasons
You are actively looking to change your supplier as a directresult of the issue
Changed supplier since the problem occured as a direct resultof the issue
Looked into changing supplier as a direct result of the issue butdecided not to as still within minimum contract period
Happy with their response to dealing with the issue
You accepted that service loss occurs sometimesAny loss of service
1-9 employees
10-249 employees
Experience of loss of service (any LL/BB or LL&BB)

110.
Impact on attitudes to supplier relationship
More than half of SMEs accept that service loss can occur. Some have looked
into switching as a result of service loss but only 6% have actually done so
H1m Taking everything into account that happened when you lost service, the processes you went through and the time taken to get your service restored, has this had
any of the following effects on your attitudes towards your relationship with the supplier?
Base: All who experienced loss of service for any/LL only/BB only/LL&BB n=420, Landline only n=90*, Broadband only n=161, Landline & Broadband n=169
*CAUTION LOW BASE
12
8
9
8
9
6
8
11
56
4
8
8
9
7
6
17
19
51
3
8
8
9
8
6
14
16
52
Other
No impact
Thought about changing supplier as a direct result of the issuebut have not looked into it
You looked into changing supplier as a direct result of the issuebut decided not to because of other reasons
You are actively looking to change your supplier as a directresult of the issue
Changed supplier since the problem occured as a direct resultof the issue
Looked into changing supplier as a direct result of the issue butdecided not to as still within minimum contract period
Happy with their response to dealing with the issue
You accepted that service loss occurs sometimesAny loss of service
Any LL loss
BB (only) loss
Experience of loss of service (any LL/BB or LL&BB)

Section 6Experience of missed appointments and compensation

112.
0.8 days on average is considered reasonable notice of a cancellation/change
to an engineer appointment. Around half say 24 hours is sufficient.
Reasonable notice for an engineer appointment to be cancelled or changed by provider
5%10%
48%
29%
8%
I1 Some telephone line or broadband installation or repair processes require an engineer to visit the customer’s home to carry out the work. Customers are usually given a
specific time slot within which to expect the engineer’s visit and sometimes engineers fail to arrive within the allotted time slot. What do you consider to be a reasonable
amount of notice for an engineer appointment to be cancelled or changed by your provider? Please give your answer in hours or days.
Base: Total Sample with landline or broadband n=991
Longer
1 day (24h)
No notice
1-23 hoursMean
0.8
days
Less than an hour
Mean 1-9 employees:
0.8 days
Mean 10-249 employees:
1.0 days

113.
7% have had experience of a missed appointment (more than twice that
amongst larger SMEs who are also more likely to have had more than one
occurrence)
Experience of a missed appointment
4%
8%
5%
7%
55%
21%
16%
7%
4%
8%
24%
40%
15%
8%
4%
8%
28%
38%
None in past 2 years
Five or more
Four
Three
Two
One
I1a Have you ever experienced a missed appointment regarding a landline and/or broadband service (i.e. where an engineer was scheduled to arrive at your home within
a specified appointment window and did not turn up within that time)? This could be, for example, to install a new service or repair an existing service.
Base: Total Sample with a landline or broadband n=991. 1-9 employees n=641, 10-249 n=350. I2b Overall how many missed appointments have you experienced in the last
two years? I3 What happened after the appointment was missed? Base: all that experienced a missed appointment n=108, 1-9 employees n=52*, 10-249 employees n=56*
*CAUTION LOW BASE
7%
Ever experienced?
How many in last 2 years?
5%
2%
4%
21%
69%
Other
Still waiting for re-arrangement
Cancelled altogether
Engineer turned up later that day
Rearranged for another day
What happened after appointment missed (last 2 years)?
7% 18%
Total 1-9 employees10-249
employees
81% of 10-
249 emps

114.
6 in 10 SMEs say they experienced anxiety and stress as result of the missed
appointment. More than half took time to re-arrange or lost staff working time
Experience of a missed appointment
4%
14%
23%
14%
16%
29%
Don't know
Didn't spend any time
Longer
8 hours
3-8 hours
1-2 hours
I2a Have you ever experienced a missed appointment regarding a landline and/or broadband service (i.e. where an engineer was scheduled to arrive at your business
within a specified appointment window and did not turn up within that time)? This could be, for example, to install a new service or repair an existing service. Base:
Total Sample n=2088. I4 How much time did you spend waiting for the engineer to arrive? I6 M4 Which, if any, of the following would you say applied to your most
recent missed appointment? Base: all that experienced a missed appointment in past 2 years n=97*. I8 M9dHow much time did you and other people in your business spend
trying to get another appointment? (e.g. time spent on the phone with your provider). It should not include the time spent while waiting for the original missed
appointment. *CAUTION LOW BASE
Ever experienced?
Time spent waiting for engineer to arrive
4%
8%
33%
52%
59%
61%
Not affected
Had to pay overtime
Missed/rearranged meetings
Lost staff work time
Took time to re-arrange
Increased anxiety and stress
Which applied to most recent missed appointment?
1%
12%
5%
13%
45%
24%
Don't know
Did not spend any time
More than 8 hours
3-8 hours
1-3 hours
< one hour
Time spent trying to get another appointment
7% 7% 18%
Total 1-9 employees10-249
employees
Mean: 9.4 hours
Mean: 9.7 hours
Mean: 7.8 hours
Mean: 5.5 hours
Mean: 5.9 hours
Mean 2.2 hours

115.
More than 8 in 10 SMEs contacted their provider to re-arrange the missed
appointment (majority by phone). On average contact was made 3.4 times.
Experience of a missed appointment
5%
8%
95%
Webchat
Phone
I7 M11 Which of the following actions did you or other people in your business take to rearrange the appointment that had been missed? Base: all that experienced a
missed appointment in past 2 years n=97* I9a How did you contact your provider? I9b How many times did you contact your provider? I9a M12 How did you contact your
provider? I9b M13 How many times did you contact your provider? Base: All that contacted the provider n=83* CAUTION LOW BASE
How contacted?
14%
4%
7%
26%
17%
31%
6+ times
5 times
4 times
3 times
Twice
Once
How many times contacted provider?
3.4
7%
17%
26%
83%
Nothing
Checked provider website
Assumed provider would contact
Contacted provider
Actions taken by you/others to re-arrange
Mean

116.
On average 12 working hours were lost as a result of the missed appointment
and more than half felt it had had an impact on business or on working hours lost
Experience of a missed appointment
I10 Approximately how many working hours do you think were lost as a result of your missed appointment? Please don't include the time taken to fix the issue
I11 How much of an impact did this loss of working hours, have on your business Please use a scale of 0 to 5 where 0 denotes “No impact at all” and 5 denotes
“Very great impact”. I5 Thinking back to when you experienced a missed appointment, how much of an impact did this have on you and your business ? Please use a
scale of 0 to 5 where 0 denotes “No impact at all” and 5 denotes “Very great impact”. Base: all that experienced a missed appointment in the past 2 years n=97*
*CAUTION LOW BASE
17%
19%
12%
9%
11%
15%
16%
18%
10%
9%
32%
30%
Generalimpact onbusiness
Loss ofworking hours
0 - no impact at all 1 2 3 4 5 - very great impact
Impact of the missed appointment on business
24%
9%
12%
10%
25%
21%
Didn't spend any time
Longer
24 hours
9-23 hours
3-8 hours
1-2 hours
Approximate working hours lost as result
11.6 57%
59%
% had
an impact
Mean

82%
14%
2%2%
Asked & received
Not asked but received
Asked & NOT received
NOT asked, NOT received
117.
NET compensation received
Overall, only 4% received compensation for their missed appointment
Missed appointment compensation
4%
COMPENSATION SUMMARY: Base: all that experienced a missed appointment in the past 2 years n=97* *CAUTION LOW BASE

118.
Only 4% received compensation for a missed appointment. Majority of SMEs had
not asked for this anyway; largely because the either didn’t expect to receive
any or that the amount would not be worth the effort
Experience of a missed appointment
85%
15%
Did not ask
Asked
I12a M16 Did you receive any compensation from your provider for this missed appointment? Base: all with missed appointment in past 2 years n=97* I12bi Did you ask for
compensation in regards to the missed appointment? We are referring to you proactively asking for compensation rather than simply notifying your provider of the missed
appointment. I12c M18a Why did you not ask for compensation? Base: all who did not get or ask for compensation n=73*. *CAUTION LOW BASE
4%
Received compensation for missed appointment?
Asked for compensation?
12%
8%
13%
14%
19%
39%
Other
Not providers fault
Didn't know how
Forgot
Not worth it
Didn’t expect to get
Why not ask?
96%

119.
59% of SMEs expect compensation for a missed appointment, 41% do not -
mainly because “these things happen” or because it would have a minimal
financial impact to their business
Hypothetical missed appointment
39%
12%
0
0
26%
4%
4%
5%
7%
1%
2%
28%
13%
0
0
33%
1%
3%
6%
11%
2%
2%
29%
12%
33%
1%
3%
6%
11%
2%
2%
None expected
Not sure if should receive
Would expect but not sure how much
£201+
£101-200
£51-100
£26-50
£11-25
<£10
Total
1-9 employees
10-249 employees
I13a I’d like you to imagine a situation where you had been given an appointment time by your supplier for an engineer to visit your business to install, repair or upgrade
one of your services and the engineer did not turn up at all. Would you expect to be compensated for this missed appointment? and if so, how much? Base: all that have
not experienced a missed appointment n=883, 1-9 employees n=589, 10-249 employees n=294. I13b M23 Why would you not expect to receive any compensation for the
missed appointment? Base: all who don’t expect compensation n=289 I12c M24 What form would you expect that compensation to take? Base: all who gave amount n=204
Expect to be compensated for a missed appointment?
7%
8%
32%
58%
1%
3%
34%
65%
1%
3%
34%
65%
Free service upgrade
Future discounts/reductions
Cash
Credit on account
Form would expect compensation to take
0%
1%
3%
3%
9%
2%
7%
16%
10%
16%
40%
1%
2%
2%
3%
3%
5%
5%
8%
11%
19%
45%
1%
1%
2%
3%
3%
4%
5%
8%
11%
19%
44%
Used back ups
Not eligible due to T&Cs
Minor issue
Never thought about it
Just a one-off
Amount not worth it
Didn't expect to get
Issue quickly resolved
Not bothered
No financial impact
These things happen
Total
1-9 employees
10-249 employees
Why not expect to receive compensation?
Mean 59% expect
compensation
41% not sure /
expected
£45
£38
£192
£80amongst those able to give a
value
£502amongst those able to give a
value
£95 amongst those able to give a
value

Automatic compensation :
Minimum standards & willingness to pay more/less for
better/worse service: Consumers

121.
On average, 5 days is considered a reasonable wait time for an installation
appointment. 11 days (1 ½ weeks) is considered to be unacceptable
C1/C1h Please think back to when you experienced [E1a] for [fixed line/BB]. How long do you think it would have been reasonable to wait until the first suitable
appointment for an engineer to visit? Reasonable’ does not have to mean your ‘ideal’ situation, but one that would be generally satisfactory to you. Please give your
answer in terms of calendar days C2 And what would be an unacceptable length of time to wait? Please give your answer in terms of calendar days
landline/broadband installation n=1898 / experienced provision n=278 / all asked hypothetical question n=1620
Reasonable wait time for appointment (days) Unacceptable wait time for appointment (days)
CONSUMERS: Installation of a new fixed line broadband service or landline service
13%
26%
1%
11%
5%
13%
20%
10%
0%
8 or more
Seven
Six
Five
Four
Three
Two
One
Zero
All with
landline/broadband
54%
19%
2%
6%
4%
7%
6%
2%
0%
8 or more
Seven
Six
Five
Four
Three
Two
One
Zero
All with
landline/broadband
Mean 5.4
Median 5.0
Mean 11.3
Median 8.0
All that have
experienced provision
All that have not
experienced provision
Mean 6.2
Median 5.0
Mean 5.3
Median 5.0
All that have
experienced provision
All that have not
experienced provision
Mean 13.4
Median 10.0
Mean 10.9
Median 8.0

122.
Around half initially claim they would not accept a reduced price for a delayed
install and slightly higher proportions would not pay more for a faster install
34%41% 44%
50% 50%56%
Accept £5 less for16 days install
Accept £5 less for14 days install
Accept £10 lessfor 16 days install
Accept £10 lessfor 14 days install
Wouldn't acceptany delay/pricechange for 14
day install
Wouldn't acceptany delay/pricechange for 16
day install
13%20%
36%
19%26%
44%
56%64%
Pay £15 morefor install within
10 days
Pay £10 morefor install within
10 days
Pay £5 morefor install within
10 days
Pay £15 morefor install within
8 days
Pay £10 morefor install within
8 days
Pay £5 morefor install within
8 days
Wouldn't acceptany price change/improvement inservice within 8
days
Wouldn't acceptany price change/improvement inservice within 10
days
C3 An appointment is usually available within 12 days for an engineer to visit you to install a fixed line service and the installation price is £40. Which of the following
best describes why you would be unwilling to accept a slower installation at a cheaper price? Landline/broadband installation n=1898 All with landline/broadband
unwilling to accept slower installation n=1069 C4 Which of the following best describes why you would be unwilling to pay a higher price for faster installation?
All with landline/broadband unwilling to pay high price for faster installation n=1064
63%
38%
8%
I wouldn't want an installation longer than 12
days
The price decreases weren't enough to justify the longer
installation
Would expect it to be free
40%
49%
12%
I'm happy with a 12 day installation period
The price increases were too much to justify the
faster installation
Would expect it to be free or very cheap
Unwilling to accept delayed
install / reduction in price
Unwilling to pay more for faster install Price would accept for
8 DAY installation
Price reduction would accept
for 14 DAY installation
£23.30 mean
£20.00 median
CONSUMERS: Installation of a new fixed line broadband service or landline service – Trade off scenarios
Pay nothing
extra = 91%
No price reduction = 33%
(Base too small
to show
acceptable prices)

123.
On average, 3 days is considered an reasonable wait time for a fault to be
fixed. Just under a week (6 days) is considered to be unacceptable
CONSUMERS: Loss of service to fixed line broadband service or landline service
C5b Please think back to when you experienced loss of service for [fixed line/BB/mobile]. How long do you think it would have been reasonable to wait for the fault to be
fixed? Reasonable’ does not have to mean your ‘ideal’ situation, but one that would be generally satisfactory to you. Please give your answer in terms of calendar days
C6 And what would be an unacceptable length of time to wait? Please give your answer in terms of calendar days
landline/broadband installation n=1898 / experienced loss of service n=345 / all asked hypothetical question n=1553
Reasonable wait time for fault to be fixed (days) Unacceptable wait time for fault to be fixed (days)
2%
6%
1%
6%
5%
15%
36%
28%
1%
8 or more
Seven
Six
Five
Four
Three
Two
One
Zero
All with
landline/broadband
18%
21%
4%
12%
9%
19%
15%
3%
0%
8 or more
Seven
Six
Five
Four
Three
Two
One
Zero
All with
landline/broadband
Mean 2.8
Median 2.0
Mean 6.1
Median 5.0
All that have
experienced BB/LL LoS
All that have not
experienced BB/LL LoS
Mean 2.6
Median 2.0
Mean 2.8
Median 2.0
All that have
experienced BB/LL LoS
All that have not
experienced BB/LL LoS
Mean 6.2
Median 4.0
Mean 6.1
Median 5.0

50%
61%
39%
50%
Accept repairwithin 3 days for£5 off next bill
Accept repairwithin 3 days for£10 off next bill
Woild not acceptrepair within 3days for £10 off
next bill
Woild not acceptrepair within 3
days for £5 off nextbill
19%26%
44%
23%29%
48%52%
56%
Pay £15 for repairwithin 1 day
Pay £10 for repairwithin 1 day
Pay £5 for repairwithin 1 day
Pay £15 for repairon same day
Pay £10 for repairon same day
Pay £5 for repairon same day
Wouldn't acceptany price change/improvement inservice on same
day
Wouldn't acceptany price change/improvement inservice within 1
day
124.
Half claim they would not accept a £5 reduction in price for a delayed repair,
whilst more than half would not pay more for a faster repair
CONSUMERS: Loss of service to fixed line broadband service or landline service – Trade off scenarios
C7 Which of the following best describes why you would be unwilling to accept a slower repair time for a discount off your net bill?
landline/broadband installation n=1898 All with landline/broadband unwilling to accept slower repair time n=736
C8 Which of the following best describes why you would be unwilling to pay a price for a faster repair?
All with landline/broadband unwilling to pay high price for faster installation n=990
54%
28%
14%
12%
I'm happy with a 2 day wait for a repair
The prices were too much to justify the faster repair
Would expect it to be free
My current service provider offers better than
2 days for repair
68%
24%
12%
10%
I wouldn't want to wait longer than 2 days
The discount wasn't enough to justify the additional
wait
My current service provider offers better than 2 days for
repair
Would expect it to be free
Price would pay
for repair within 1 day
Nothing
extra = 93%
(no reduction in payment = 19%)
£27.80 mean
£20.00 median
Unwilling to pay more for faster repair
Price would accept for
3 day repair
Unwilling to accept delayed repair
/ reduction in price
(Base too small
to show
acceptable prices)

125.
On average, 5 ½ days is considered an reasonable wait time for an installation
appointment. 14 ½ days (2 weeks) is considered to be unacceptable
C1/C1h Please think back to when you experienced [E1a] for [fixed line/BB]. How long do you think it would have been reasonable to wait until the first suitable
appointment for an engineer to visit? Reasonable’ does not have to mean your ‘ideal’ situation, but one that would be generally satisfactory to you. Please give your
answer in terms of calendar days C2 And what would be an unacceptable length of time to wait? Please give your answer in terms of calendar days
landline/broadband installation n=990 / experienced provision n=232 / all asked hypothetical question n=758
Acceptable wait time for appointment (days) Unacceptable wait time for appointment (days)
SMEs: Installation of a new fixed line broadband service or landline service
1%
14%
23%
1%
11%
3%
14%
21%
12%
0%
Don't know
8 or more
Seven
Six
Five
Four
Three
Two
One
Zero
All with
landline/broadband
1%
54%
16%
4%
5%
3%
10%
6%
0
0
Don't know
8 or more
Seven
Six
Five
Four
Three
Two
One
Zero
All with
landline/broadband
Mean 5.6
Median 4.0
Mean 14.5
Median 8.0
All that have
experienced provision
All that have not
experienced provision
Mean 6.7
Median 6.0
Mean 5.3
Median 3.0
All that have
experienced provision
All that have not
experienced provision
Mean 14.5
Median 9.0
Mean 14.4
Median 8.0

126.
Around half initially claim they would not accept a reduced price for a delayed
install and a similar proportion would not pay more for a faster install
32%
42% 40%47%
53%60%
Accept £5 lessfor 16 days
install
Accept £5 lessfor 14 days
install
Accept £10 lessfor 16 days
install
Accept £10 lessfor 14 days
install
Wouldn't acceptany delay/pricechange for 14
day install
Wouldn't acceptany delay/pricechange for 16
day install
29%33%
50%
35%39%
52%48% 50%
Pay £15 morefor install within
10 days
Pay £10 morefor install within
10 days
Pay £5 morefor install within
10 days
Pay £15 morefor install within
8 days
Pay £10 morefor install within
8 days
Pay £5 morefor install within
8 days
Wouldn't acceptany pricechange/
improvement inservice within 8
days
Wouldn't acceptany pricechange/
improvement inservice within 10
days
C3 Which of the following best describes why you would be unwilling to accept a slower installation at a cheaper price?
landline/broadband installation n=990 All with landline/broadband unwilling to accept slower installation n=604
C4 Which of the following best describes why you would be unwilling to pay a higher price for faster installation?
All with landline/broadband unwilling to pay high price for faster installation n=388
61%
56%
2%
I wouldn't want an installation longer than 12 days
The price decreases weren't enough to justify the longer
installation
Would expect it to be included
42%
42%
5%
I'm happy with a 12 day installation period
The price increases were too much to justify the faster
installation
Would expect it to be included
SMEs: Installation of a new fixed line broadband service or landline service – Trade off scenarios
Price would accept for
8 DAY installation
No price reduction = 18%
£26.8 mean
£20.0 median
Unwilling to pay more for faster install
Unwilling to accept delayed
install / reduction in price
Price reduction would accept
for 14 DAY installation
Pay nothing
extra = 77%(Base too small
to show
acceptable prices)

127.
On average, 1 ½ days is considered an reasonable wait time for a fault to be
fixed. Half a week (3.9 days) is considered to be unacceptable
SMEs: Loss of service to fixed line broadband service or landline service
C5b Please think back to when you experienced loss of service for [fixed line/BB/mobile]. How long do you think it would have been reasonable to wait for the fault to be
fixed? Reasonable’ does not have to mean your ‘ideal’ situation, but one that would be generally satisfactory to you. Please give your answer in terms of calendar days
C6 And what would be an unacceptable length of time to wait? Please give your answer in terms of calendar days
landline/broadband installation n=990 / experienced loss of service n=339 / all asked hypothetical question n=651
Acceptable wait time for loss of service (days) Unacceptable wait time for loss of service (days)
1%
0%
1%
0%
1%
1%
7%
22%
65%
1%
Don’t know
8 or more
Seven
Six
Five
Four
Three
Two
One
Zero
All with
landline/broadband
1%
7%
11%
1%
5%
5%
20%
49%
3%
0%
Don't kmow
8 or more
Seven
Six
Five
Four
Three
Two
One
Zero
All with
landline/broadband
Mean 1.6
Median 1.0
Mean 3.9
Median 2.0
All that have
experienced BB/LL LoS
All that have not
experienced BB/LL LoS
Mean 4.2
Median 3.0
Mean 3.9
Median 2.0
All that have
experienced BB/LL LoS
All that have not
experienced BB/LL LoS
Mean 1.7
Median 1.0
Mean 1.5
Median 1.0

29%37%
63%71%
Accept repairwithin 3 days
for £5 off nextbill
Accept repairwithin 3 daysfor £10 offnext bill
Wouldn'taccept repairwithin 3 daysfor £10 offnext bill
Wouldn'taccept repairwithin 3 daysfor £5 off next
bill
48%56%
61%57% 61% 64%
36% 39%
Pay £15 forrepair
within 1 day
Pay £10 forrepair
within 1 day
Pay £5 forrepair
within 1 day
Pay £15 forrepair
on same day
Pay £10 forrepair
on same day
Pay £5 forrepair
on same day
Wouldn'taccept any
price change/improvement in
service onsame day
Wouldn'taccept any
price change/improvement inservice within 1
day
128.
3 in 5 claim they would not accept a reduced price for a delayed repair, whilst
1 in 3 would not pay more for a faster repair
C7 Which of the following best describes why you would be unwilling to accept a slower repair time for a discount off your net bill?
landline/broadband installation n=990 All with landline/broadband unwilling to accept slower repair time n=705
C8 Which of the following best describes why you would be unwilling to pay a price for a faster repair?
All with landline/broadband unwilling to pay high price for faster installation n=339
40%
29%
23%
14%
I'm happy with a 2 day wait for a repair
The prices were too much to justify the faster repair
My current service provider offers better than 2 days for
repair
Would expect it to be included
68%
33%
21%
3%
I wouldn't want to wait longer than 2 days
The discount wasn't enough to justify the additional wait
My current service provider offers better than 2 days for
repair
Would expect it to be included
SMEs: Loss of service to fixed line broadband service or landline service – Trade off scenarios
Price would accept for
3 day repair
£188.30 mean
£50.00 median
Unwilling to accept delayed repair
/ reduction in price
Unwilling to pay more for faster repair
(no reduction in payment = 7%)
Nothing
extra = 77%
Price would pay
for repair within 1 day
(Base too small
to show
acceptable prices)

Automatic compensation :
Consumer experience of provisioning delays, loss of
service and missed appointments
Mobile Service Research:
Consumers

Mobile research: Consumer executive summary (1)
130.
Consumers have a greater reliance on mobile and broadband than Landline
2 in 3 say their HH would struggle to function without these vs. 1 in 4 for landline
Price is the dominant factor in the choice of mobile provider (67%). Data allowance
(20%) and reliability (19%) are the next most important factors
1 in 10 (8%) experienced a loss of service in an area where they would normally get
good coverage, in the last 12 months
Almost half (46%) reported this to their provider
On average, this LoS lasted for 3.3 days
Loss of contactability (45%) was the key impact faced by households, along with
inability to use apps (24%), negative impact on work activities (22%) and stress (19%)
77% of HHs experienced no direct financial costs, whilst 12% were unsure. Of the 11%
that did experience costs, the average additional cost was c£8
59% tried to restore their mobile service, with 37% contacting their provider and 23%
rebooting their device. On average consumers spent c3 days trying to get their mobile
service fixed, although half (49%) spend no time at all
More than half did nothing to reduce the impact of their LoS
29% used their landline to make calls and 14% used it to receive calls
44% felt frustrated by the loss of service, 31% were annoyed and 30% stressed

Mobile research: Consumer executive summary (2)
131.
Only 8% received compensation for their LoS, with 1% asking for it. Of those that did
not receive compensation, 8% asked for it and 89% did not (3% didn’t know)
After probing, 18% expect to be compensated for the impact of their LoS. On average,
they expect c£13 – to be paid as a credit on their account or cash
Three quarters (74%) describe their loss of mobile service as ‘very or fairly inconvenient’
Half (50%) feel that regular progress updates from providers would be useful during a
future loss of service

132.
Greater reliance on Internet and Mobile than Landline. Two-thirds say
household would “struggle to function” without these. Households feel they
could cope just under a week without Internet (much longer for landline).
Importance of telecoms services currently used
27%
66% 65%22%
23%20%
29%
8%9%22%
3% 6%
Landline telephone Fixed Internet connection Mobile phone
My household would notfind day to day activityimpeded without thisservice
My household would ratherthe service was availablebut could manage withoutit
My household could managebut only for a limitedperiod without it
My household wouldstruggle to function withoutit
WAVE 2 CONSUMER: D1 Thinking again about your [landline / broadband / Mobile phone] service, how much does your household rely on each of these?
Base: All Consumers using landline/broadband/mobile phone n=1941/1794/1931
Mean # days household
able to cope without service 45.4 6.2 10.5
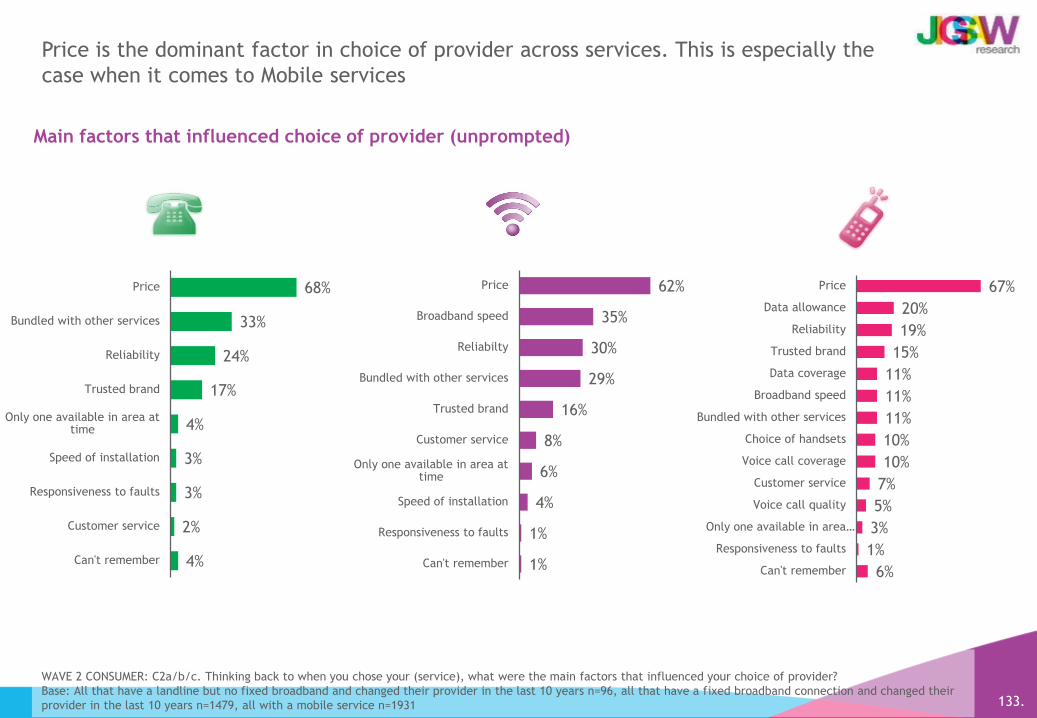
133.
Price is the dominant factor in choice of provider across services. This is especially the
case when it comes to Mobile services
Main factors that influenced choice of provider (unprompted)
68%
33%
24%
17%
4%
3%
3%
2%
4%
Price
Bundled with other services
Reliability
Trusted brand
Only one available in area at time
Speed of installation
Responsiveness to faults
Customer service
Can't remember
WAVE 2 CONSUMER: C2a/b/c. Thinking back to when you chose your (service), what were the main factors that influenced your choice of provider?
Base: All that have a landline but no fixed broadband and changed their provider in the last 10 years n=96, all that have a fixed broadband connection and changed their
provider in the last 10 years n=1479, all with a mobile service n=1931
62%
35%
30%
29%
16%
8%
6%
4%
1%
1%
Price
Broadband speed
Reliabilty
Bundled with other services
Trusted brand
Customer service
Only one available in area at time
Speed of installation
Responsiveness to faults
Can't remember
67%
20%
19%
15%
11%
11%
11%
10%
10%
7%
5%
3%
1%
6%
Price
Data allowance
Reliability
Trusted brand
Data coverage
Broadband speed
Bundled with other services
Choice of handsets
Voice call coverage
Customer service
Voice call quality
Only one available in area …
Responsiveness to faults
Can't remember

134.
8% of mobile users have experienced loss of service in an area where they
would normally get good coverage. Almost half reported this to their provider.
Experienced loss of voice and/or data services on mobile phone?
Loss of service*
8%
Error on bill 2%
Other1%
No loss90%
WAVE 1 CONSUMER: E2a Over the last 12 months, have you experienced any of the following in relation to your mobile phone? Base: All who use a mobile n=1872
*Loss of service in an area where you would normally get good coverage, for more than 1 hour. E2b did you report this loss of service to your provider? Base: all mobile
loss of service n=137
8% loss YES 46%
Reported to provider?

135.
In a third of cases the loss was fixed without a report to the provider; on
average restoration of service was 3.3 days but a quarter of cases remained
unresolved and for a fifth the same fault reoccurred following the fix
Experience of loss of mobile service
WAVE 1 CONSUMER: E3b Which of the following best matches what happened following your loss of mobile service? E3a How long in total did it initially take to restore
your mobile service to normal? Base: E3c Including the period of time before you reported the fault to your provider, how long in total were you without your mobile
phone service? Base: All with mobile loss of service n=137
10%
26%
16%
8%
5%
26%
10%
Don't know
Unresolved
Longer
1 day
6-23 hours
1-6 hours
< one hour
Mean: 3.3 days
How long initially took to restore mobile service to normal?
27%
32%
22%
19%
Other
Provider fixedwithout having to
report
Same faulthappened again
after fix
Fixed first time
What happened following loss of mobile service?
YES 46%
Reported to provider?

136.
Loss of contactability was the key impact faced by households. When
prompted, around a quarter mentioned inability to use apps and around a fifth
a negative impact on work or increased anxiety/stress
WAVE 1 CONSUMER E6: Thinking back to when you experienced your loss of mobile service how did this affect you and the people in your household? E7 Which, if any, of
the following would you say applied to your most recent loss of mobile service? Base: all with loss of mobile service n=113
5
17
9
3
3
3
4
6
9
10
12
12
14
19
22
24
45
Don't know
No effect on household
Other
Missed appointments
Missed TV shows/catch up
Increased mobile bill
Had to use payphone
Negative impact study/homework
Unable complete household tasks
Increased landline bill
Had to use different location
Unhappiness/arguments
Time to resolve loss of service
Increased anxiety/stress
Negative impact on work related activities
Unable to use mobile/tablet apps
Unable contact/be contacted
Experience of loss of service
Household impacts (prompted)
1
38
3
3
3
4
6
7
8
24
Don't know
No effect on household
Unable go online
Frustrating
Worrying/upsetting/isolating
Annoying
Inconvenient/nuisance
Unable work/homework
Poor reception/no service
Unable contact/be contacted
Household impacts (unprompted)

137.
The majority of households experienced no direct financial costs as a result of
their loss of service. Where they did face costs, these were an average of £7.80
WAVE 1 E7 Which, if any, of the following would you say applied to your most recent loss of mobile service? Base: all with loss of mobile service n=113
E8 Thinking about the factors you mentioned, what were the direct financial costs to your household for all of the following because of your most recent loss of mobile
service? Base: all mentioning specific* factors n=50*. E9 Overall what were the direct financial costs to you and your business/the people in your household because of
your most recent service loss to? all not mentioning specific factors n=63*. E11: Still thinking about the direct financial costs to you and the people in your household. If
there were any other direct financial costs not included in the factors mentioned previously, could you please indicate the amount of these costs below? Base: all
mentioning specific* factors n=50*. E8 / E9 / E11 Summary table - Base: all with loss of mobile service n=113. *CAUTION LOW BASE
Experience of loss of service
12%
77%
5%
2%
4%
Don't know
No direct financial cost
£50+
£11-50
<£10
Direct financial costs of these impacts
Mean
5
17
9
3
3
3
4
6
9
10
12
12
14
19
22
24
45
Don't know
No effect on household
Other
Missed appointments
Missed TV shows/catch up
Increased mobile bill
Had to use payphone
Negative impact study/homework
Unable complete household tasks
Increased landline bill
Had to use different location
Unhappiness/arguments
Time to resolve loss of service
Increased anxiety/stress
Negative impact on work related activities
Unable to use mobile/tablet apps
Unable contact/be contacted
Household impacts (prompted)
£7.80
NB: bases are too small to split
out the individual costs
associated with particular issues

138.
More than half didn’t do anything to reduce the impact of their mobile service
loss; using a landline to make/receive calls was the most likely action. Two-
fifths felt frustrated by the loss of service. Annoyance and stress were
outcomes for a third.
Experience of loss of mobile service
52%
8%
1%
6%
9%
9%
14%
29%
Didn't do anything
Other
Used dongle
Mobile wifi
Used (alternative) mobile
Went/worked from other location
Used landline to receive calls
Used landline to make calls
Actions taken to reduce impact
WAVE 1 CONSUMER: E13 What, if anything did you do to reduce the impact of this mobile phone loss of service?
E18a How did this mobile phone loss of service make you feel? Base: all with loss of mobile service n=113
14%
16%
7%
8%
15%
18%
21%
30%
31%
44%
Not negatively affected at all
Not seriously affected
Ignored
Not valued
Worried
Angry
Cut off
Stressed
Annoyed
Frustrated
How loss of service made you feel

139.
Over a third contacted their provider (most by phone) in an attempt to fix or
restore service their service. Around a quarter resorted to rebooting their
device.
Experience of loss of mobile service
41%
5%
1%
1%
11%
12%
16%
23%
37%
Didn't do anything
Other
Used another company to try fix
Contacted Ofcom
Checked provider website fordetails
Research to try fix issue by self
Asked a relative/friend
Rebooted
Contacted provider
Actions taken to fix/restore service
WAVE 1 CONSUMER: E14 Which of the following actions did you or other people in your household take to fix/restore your mobile service? Base: all with loss of mobile
service n=113. E15 How did you contact your provider? E16 How many times did you contact your provider via each?
Detail of contact made
Of the 43 who contacted their provider, 32 did
so via phone, 6 via email, 4 via webchat, 7 in
another way

140.
On the whole, four in five were not prevented from working as a result of their
loss of mobile service
Experience of loss of mobile service
WAVE 1 E12a: As a result of your Loss of Mobile, were you prevented from working for any length of time? E12: Please indicate the number of hours you were
prevented from working Base: all loss of mobile service and use mobile for work purposes n=52* *CAUTION LOW BASE
7%
81%
2%
2%
7%
Don't know
Not prevented from working
11-25 hours
6-10 hours
1-5 hours
Prevented from working by loss of service (if use mobile for work)

141.
On average people spent around 3 days trying to get their mobile service fixed,
but around half spent no time at all. Very few had to wait in for an engineer
visit
Experience of loss of mobile service
WAVE 1 CONSUMER E12di How much time did you and other people in your household spend trying to get your mobile service fixed? Please think about all the
things that you and others in your business spent time on to resolve the loss from the point at which the loss occurred until you had service again. This should
include the time taken to contact your provider and any attempts to repair the service yourself. It should not include the time spent waiting for an engineer
visit(s). E12dii And how much time, if any, did you and other people in your household spend waiting in for an engineer visit or visits? Base: all with mobile loss of
service n=113.
Time you/others spent waiting in for engineer visits
49%
9%
14%
4%
7%
9%
8%
Didn't spend any time
Don't know
More than 5 hours
2-5 hours
1-2 hours
30 minutes to an hour
Up to 30 minutes
Time you/others spent trying to get service fixed
3.2 days
Mean
90%
2%
4%
2%
2%
Didn't spend any time
Don't know
Longer
1 day
1-6 hours
9.5 hours
Mean
NB: This excludes the person claiming
to spend 5,000 hours over a 6 month
period

82%
7%1%
Mobile
Asked & received
Not asked but received
Asked & NOT received
NOT asked, NOT received
Don't know
142.
NET compensation received
Fewer than one in ten received any compensation or temporary alternative
services following the loss of mobile service
Experience of loss of mobile service
WAVE 1 CONSUMER: E19 Did you receive any compensation from your provider for this loss of service? Base: all mobile loss of service n=113 E20a/b Did you ask for
compensation in regards to the loss of service or was it offered by your provider? Base: all mobile loss of service n=113 E28a Did your provider offer any temporary
alternative services while your Mobile was/were out of service? What were they? Base: all loss of mobile service n=113
8%
3%
88%
1%
1%
9%
Don't know
No
Other
Specific engineerappointment windows
Regular progressupdates
Received any compensation? Did provider offer any temporary alternative services?

143.
The vast majority neither asked for nor received compensation. Key rationale
for not asking is that people don’t expect to get it or feel it’s not worth it
Experience of loss of mobile service
3%
89%
8%
Don't know
Did not ask
Asked
YES
8%
Received compensation for loss of mobile service?
Asked for compensation?
18%
3%
12%
19%
25%
28%
Other
Forgot
Not providers fault
Didn't know how
Not worth it
Didn’t expect to get
NO
92%Why not ask?
WAVE 1 CONSUMER: E19 Did you receive any compensation from your provider for this loss of service? E20a/b Did you ask for compensation in regards to the loss of
service or was it offered by your provider? Base: all mobile loss of service n=113 E21 Why did you not ask for compensation? Base: all not asking n=94* *CAUTION LOW BASE

144.
Half wouldn’t expect any compensation for mobile loss of service of this
nature; for most this was because the outage was short-lived
Experience of loss of mobile service
34%
48%
10%
8%
Don't know
Wouldn't expect any
>£10
<£10
WAVE 1 CONSUMER E25c How much, if anything, would you expect to receive as compensation to completely make up for the loss of service you experienced?
Base: All who experienced mobile loss of service n=113
E26 Why would you not expect to receive any compensation? Base: all not expecting to receive n=57* *CAUTION LOW BASE
Level of payment enough to compensate for impact
£13.00 18%Mean
4%
9%
4%
6%
7%
10%
10%
20%
34%
Don't know
Other
Don't know how
No financial loss
Don't expect it
Hassle/not bothered
Area fault
Not provider fault
Not long/quickly resolved
Why not?

145.
Three quarters would describe their loss of mobile service as inconvenient.
Half feel that regular progress updates from providers would be useful during a
future loss of service
Experience of loss of mobile service
WAVE 1 CONSUMER E18b Which of the following best describes the impact of the loss of mobile service on your household? E29 To what extent would the following
have been useful to you during your loss of service? Base: all with mobile loss of service n=113
Perceived usefulness of concepts during loss of service
7%
19%
40%
34%
Mobile
Very inconvenient
Fairly inconvenient
Not very inconvenient
Not inconvenient at all
74%NET inconvenient
22%
21%
21%
36%
7%
8%
30%
11%
19%
10%
Regular progressupdates
Specificappointment
windows
Don't know Not at all useful Not very useful Fairly useful Very useful
21%
50%
% useful

Automatic compensation :
Consumer experience of provisioning delays, loss of
service and missed appointments
Mobile Service Research:
SMEs

Mobile research: SME executive summary (1)
147.
Half (48%) feel business would struggle to cope without a mobile phone
Price is the main factor affecting provider choice (47%). Larger SMEs (10+ employees)
are less likely to cite this, and more likely to mention customer service (14%)
1 in 8 (12%) have experienced a loss of service in an area where they would normally
get good coverage, in the past 12 months
Only a third (37%) reported this to their provider
On average, this LoS lasted for 4.3 days
2 in 5 (41%) were satisfied with their providers ability to resolve the matter
Loss of contactability (69%) was the key business impact, along with inability to receive
enquiries (39%), time taken to resolve (38%) and the need to use of different location (33%)
Half (47%) did nothing to reduce the impact of their LoS. 41% used their landline to
make calls and 35% used it to receive calls
47% felt frustrated by the LoS, 17% were angry and 16% annoyed
The LoS prevented people working in 14% of businesses. On average, 3 hours were lost
across these businesses
63% of SMEs experienced no direct financial costs, whilst 22% were unsure. Of the 16%
that experience additional costs, the average cost was c£380

Mobile research: SME executive summary (2)
148.
73% tried to restore their mobile service, with 40% contacting their provider or
rebooting their device. 24% checked the provider website for updates
On average, SMEs spent 3½ hours trying to get their mobile service fixed, but half
spend no time at all
Only 8% received compensation for their LoS, with no SME asking for it. Of those that
did not receive compensation, 3% asked for it and 97% did not
Two thirds (63%) feel that regular progress updates from providers would be useful
during a future loss of service
More than half (55%) describe their loss of mobile service as ‘very or fairly inconvenient’
31% of SMEs expect to be compensated for the impact of their LoS. On average, they
expect c90 – to be paid as a credit on their account or cash

149.
Around half feel business would struggle to cope without a mobile phone
Importance of telecoms services currently used
53%59%
48%
28%25%
23%
13% 9%
17%
6% 7% 11%
Landline telephone Fixed Internet connection Mobile phone
My business would not findday to day activity impededwithout this service
My business would ratherthe service was availablebut could manage withoutit
My business could managebut only for a limitedperiod without it
My business would struggleto function without it
SME: D1 Thinking again about your [landline / broadband / Mobile phone] service, how much does your household rely on each of these?
Base: All SME using landline/broadband/mobile phone n=957/873/577
Mean # days business
able to cope without service 14.8 14.7 20.3

150.
Price dominates as the influencing factor in provider choice. Larger SMEs (10+
employees) are less likely to cite this, and more likely to cite mobile customer
service (14%)
Main factors that influenced choice of provider (unprompted)
59%
13%
11%
6%
5%
2%
2%
0%
2%
4%
Price
Only one available in area at time
Reliability
Trusted brand
Customer service
Bundled with other services
Speed of installation
Responsiveness to faults
Other
Can't remember
SME: C2a/b/c. Thinking back to when you chose your (service), what were the main factors that influenced your choice of provider?
Base: All that have a landline but no fixed broadband and changed their provider in the last 10 years n=72, all that have a fixed broadband connection and changed their
provider in the last 10 years n=635, all with a mobile service n=577
51%
23%
20%
15%
11%
9%
7%
3%
1%
3%
4%
Price
Reliabilty
Trusted brand
Broadband speed
Customer service
Bundled with other services
Only one available in area at time
Responsiveness to faults
Speed of installation
Other
Can't remember
47%
25%
22%
17%
13%
8%
5%
5%
5%
2%
1%
1%
0%
5%
3%
Price
Reliability
Voice call coverage
Data coverage
Trusted brand
Customer service
Data allowance
Bundled with other services
Voice call quality
Only one available in area at time
Broadband speed
Choice of handsets
Responsiveness to faults
Other
Can't remember
• Only 39% of 10+ SMEs cite price vs. 52% of 1-9
• 24% of 10+ SMEs cite broadband speed vs. only 15% of 1-9• 14% of 10+ SMEs cite customer
service vs. only 8% of 1-9s

151.
12% of SME mobile users have experienced loss of service in an area where they
would normally get good coverage. Over a third reported this to their provider.
Experienced loss of voice and/or data services on mobile phone?
Loss of service*
12%
Error on bill 1%
Other1%
No loss86%
COMBO SME: E2a Over the last 12 months, have you experienced any of the following in relation to your mobile phone? Base: All who use a mobile n=868
*Loss of service in an area where you would normally get good coverage, for more than 1 hour. E2b Did you report your mobile phone loss of service to your provider?
Base: all mobile loss of service n=122
12% loss YES 37%
Reported to provider?
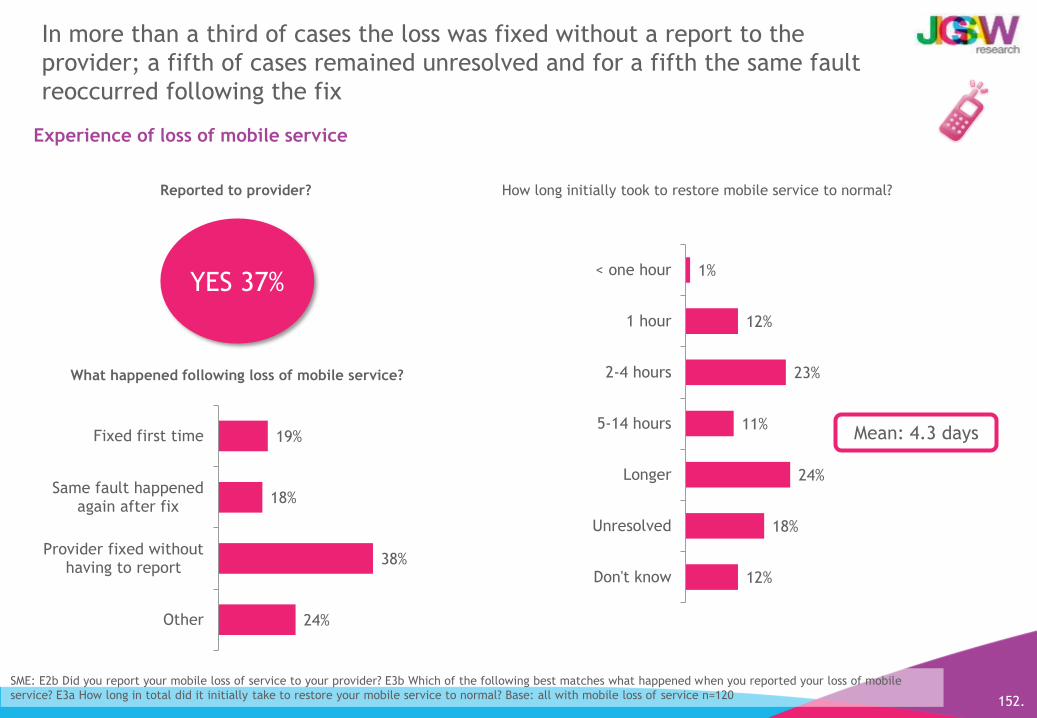
152.
In more than a third of cases the loss was fixed without a report to the
provider; a fifth of cases remained unresolved and for a fifth the same fault
reoccurred following the fix
Experience of loss of mobile service
SME: E2b Did you report your mobile loss of service to your provider? E3b Which of the following best matches what happened when you reported your loss of mobile
service? E3a How long in total did it initially take to restore your mobile service to normal? Base: all with mobile loss of service n=120
24%
38%
18%
19%
Other
Provider fixed withouthaving to report
Same fault happenedagain after fix
Fixed first time
What happened following loss of mobile service?
12%
18%
24%
11%
23%
12%
1%
Don't know
Unresolved
Longer
5-14 hours
2-4 hours
1 hour
< one hour
How long initially took to restore mobile service to normal?
Mean: 4.3 days
YES 37%
Reported to provider?

153.
Overall two-fifths are satisfied but a third are dissatisfied with their provider’s
ability to resolve their mobile loss of service (larger SMEs more polarised)
Experience of loss of mobile service
6% 5% 10%
17% 16%
33%16% 17%
5%20% 21% 7%
22% 21% 32%
19% 20%14%
All SME 1-9 employees 10-249 employees
Very satisfied
Fairly satisfied
Neither
Fairly dissatisfied
Very dissatisfied
Don't know/na
SME: E5 Overall, how satisfied or dissatisfied were you with your provider’s ability to resolve this loss of service?
Base: all mobile loss of service n=122, 1-9 employees n=77*, 10-249 employees n=45* CAUTION LOW BASE
Satisfaction with provider ability to resolve loss of service
41% 41% 46%NET Satisfied

154.
Loss of contactability to/from customers was the key business impact
SME E6: Thinking back to when you experienced your loss of mobile service how did this affect you and your business? E7 Which, if any, of the following would you say
applied to your most recent loss of mobile service? Base: all answering about loss of mobile service n=90* * CAUTION LOW BASE
16
12
12
13
14
14
16
20
33
38
46
69
No impact
Increased landline bill
Missed/rearranged meetings
Unable access files on network
Unable access/process payments
Unable buy products/services
Unable work from a location
Unable sell products/services
Had use different location
Took time to resolve loss service
Unable receive enquiries
Unable contact/be contacted
Experience of loss of service
Business impacts (prompted)
5
47
2
2
3
5
6
9
9
12
14
Don't know
No impact
Unable contact staff
Unable sell/deliver products/services
Unable receive emails
Had work from different location
Unable make outgoing calls
Unable function/operate
Loss earnings/business/hours
Unable contact customers
Customers unable contact us
Business impacts (unprompted)
NB: Sample for 10-249 employees
only 31 so can’t be shown

155.
The majority of SMEs experienced no direct financial costs as a result of their
loss of service. Where they did face costs, these were an average of £382
Experience of loss of service
22%
63%
5%
0%
6%
5%
Don't know
No direct financial cost
£1,000+
£251-£999
£21-£250
£1-£20
£382
Direct financial costs of these actions*
Mean
16
12
12
13
14
14
16
20
33
38
46
69
No impact
Increased landline bill
Missed/rearranged meetings
Unable access files on network
Unable access/process payments
Unable buy products/services
Unable work from a location
Unable sell products/services
Had use different location
Took time to resolve loss service
Unable receive enquiries
Unable contact/be contacted
Business impacts (prompted)
SME E7 Which, if any, of the following would you say applied to your most recent loss of mobile service? Base: all with loss of mobile service n=90*
E8 Thinking about the factors you mentioned, what were the direct financial costs to your business for all of the following because of your most recent loss of mobile
service? Still thinking about the direct financial costs to your business. If there were any other direct financial costs not included in the factors mentioned previously,
could you please indicate the amount of these costs below? Base: all with loss of mobile service n=90* *CAUTION LOW BASE
NB: bases are too small to split
out the individual costs
associated with particular issues

156.
The loss of service prevented staff in 1 in 7 SMEs from working, however,
number of hours lost was relatively low
Experience of loss of mobile service
SME E12B: As a result of your Loss of Mobile, how many people, if any, were prevented from working? E12c Approximately how many working hours do you think
were lost as a result of your loss of mobile service? Please don't include the time taken to fix the issue? Base: all loss of mobile service n=90* *CAUTION LOW BASE
9%
62%
13%
14%
3%
Don't know
None
Longer
2-4 hours
1 hour
People prevented from working by loss of service
2%
83%
14%
Don't know
None prevented from working
1 to 4
Working hours lost as result of loss mobile service
2.9
hours
Mean

157.
Most likely action to reduce the impact was to use landline for calls. Almost
half say the loss of mobile service left them feeling frustrated
Experience of loss of mobile service
47%
1%
2%
2%
7%
14%
7%
35%
41%
Didn't do anything
Other
Contacted third party to provideservices
Used back up Internet connection
Mobile wifi
Used alternative mobile
Went/worked from other location
Used landline to receive calls
Used landline to make calls
Actions taken to reduce impact
SME: E13 What, if anything did you do to reduce the impact of this mobile phone loss of service?
E18a How did this mobile phone loss of service make you feel? Base: all answering on mobile loss of service n=90* CAUTION LOW BASE
12%
12%
1%
2%
6%
13%
16%
17%
47%
Not negatively affected at all
Not seriously affected
Cut off
Ignored
Worried
Stressed
Annoyed
Angry
Frustrated
How loss of service made you feel

158.
Two fifths contacted their provider or rebooted - and a further quarter checked
their provider website for details. Contact was mainly via telephone (72%),
although 1 in 5 (19%) used webchat or email (17%).
Experience of loss of mobile service
27%
7%
2%
2%
4%
21%
24%
40%
40%
Didn't do anything
Other
Used another company to try fix
Contacted Ofcom
Asked a relative/friend
Research to try fix issue by self
Checked provider website fordetails
Rebooted
Contacted provider
Actions taken to fix/restore service
SME: E14 Which of the following actions did you or other people in your business take to fix/restore your mobile service? Base: all answering on mobile loss of service
n=90*. E15 How did you contact your provider? Base: all who contacted provider/checked provider website n=55* *CAUTION LOW BASE
Detail of contact made
72%
19%
17%
5%
Phone
Webchat
Other

159.
More than half spent no time trying to get their mobile service fixed and no
one spent time waited in for an engineer
Experience of loss of mobile service
E12di How much time did you and other people in your business spend trying to get your mobile service fixed? Please think about all the things that you and
others in your business spent time on to resolve the loss from the point at which the loss occurred until you had service again. This should include the time taken
to contact your provider and any attempts to repair the service yourself. It should not include the time spent waiting for an engineer visit(s). E12dii And how
much time, if any, did you and other people in your business spend waiting in for an engineer visit or visits? Base: All answering on mobile loss of service n=90*
*CAUTION LOW BASE
Time you/others spent waiting in for engineer visits
51%
6%
12%
5%
10%
16%
Didn't spend any time
Don't know
Longer
2-4 hours
1-2 hours
< 1 hour
Time you/others spent trying to get service fixed
3 ½ hours
Mean
2%
97%
Don't know
Didn't spend any time

0%
89%
3%8%0%
Mobile
Asked & received
Not asked but received
Asked & NOT received
NOT asked, NOT received
Don't know
160.
NET compensation received
Fewer than one in ten received any compensation
Experience of loss of mobile service
SME: E19 Did you receive any compensation from your provider for this loss of service? E20a/b Did you ask for compensation in regards to the loss of service or was it
offered by your provider? Base: all answering on mobile loss of service n=90*
E28a Did your provider offer any temporary alternative services while your Mobile was/were out of service? What were they? Base: all loss of mobile service n=90*
*CAUTION LOW BASE
8%
97%
3%
No
Other
Received any compensation? Did provider offer any temporary alternative services?

161.
The vast majority neither asked for nor received compensation. Key rationale
for not asking is that people feel it’s not worth it or they don’t expect to get it
Experience of loss of mobile service
97%
3%
Did not ask
Asked
8%
Received compensation for loss of mobile service?
Asked for compensation?
13%
1%
3%
3%
3%
4%
7%
7%
8%
20%
33%
Other
Never thought of it
Too busy
Not bothered
Issue unresolved
Didn't know how
Minor issue
Forgot
Not provider fault
Didn’t expect to get
Not worth it
92%
Why not ask?
SME: E19 Did you receive any compensation from your provider for this loss of service? E20a/b Did you ask for compensation in regards to the loss of service or was it
offered by your provider? Base: all answering on mobile loss of service n=90*
E21 Why did you not ask for compensation? Base: all who didn’t ask for compensation n=82* *CAUTION LOW BASE

162.
After probing, a third expect some form of compensation for a loss of mobile
service.
Experience of loss of mobile service
27%
42%
7%
1%
8%
7%
8%
Don't know
Wouldn't expect any
£75+
£50-75
£26-50
£11-25
£1-10
E25c How much, if anything, would you expect to receive as compensation to completely make up for the loss of service you experienced?
Base: All answering on mobile loss of service n=90* *CAUTION LOW BASE
Level of payment enough to compensate for impact
31%£89
Mean

163.
More than half found their loss of mobile service to be inconvenient. More than
6 in 10 would find regular progress updates useful.
Experience of loss of mobile service
SME E18b Which of the following best describes the impact of the loss of mobile service on your business? E29 To what extent would the following have been
useful to you during your loss of service?
Base: all answering on mobile loss of service n=90* *CAUTION LOW BASE
13%
23%
58%
13%
9%
24%
7%
39%
13%
Regular progressupdates
Specificappointment
windows
Don't know Not at all useful Not very useful Fairly useful Very useful
Perceived usefulness of concepts during loss of service
20%
63%
% useful
24%
21%
23%
31%
Mobile
Very inconvenient
Fairly inconvenient
Not very inconvenient
Not inconvenient at all
55%NET inconvenient

Automatic compensation :
Minimum standards & willingness to pay more/less for
better/worse service: Consumers & SMEs

165.
11 hours is considered the maximum reasonable wait time for a fault to be fixed
on a mobile service. Around a day (23.7 hours) is considered to be unacceptable
CONSUMERS: Loss of service on mobile phone service
C10 Please think back to when you experienced a loss of service for your mobile phone service. How long do you think it is reasonable for the maximum wait until your
provider has successfully resolved the fault? ‘Reasonable’ does not have to mean your ‘ideal’ situation, but one that would be generally satisfactory to you. Please give
your answer in terms of hours C11 And what would be an unacceptable length of time to wait? Again, please give your answer in terms of hours
mobile loss of service n=1872 / experienced loss of mobile service n=137 / hypothetical loss of mobile phone n=1735
Acceptable wait time for loss of service (hours) Unacceptable wait time for loss of service (hours)
0%
1%
5%
2%
19%
12%
12%
15%
33%
2%
Don’t know
Longer
37-48 hours
25-36 hours
24 hours
8-23 hours
5-7 hours
3-4 hours
1-2 hours
Zero
All with
Mobile
1%
9%
14%
10%
14%
16%
15%
13%
10%
0%
Don’t know
Longer
37-48 hours
25-36 hours
24 hours
8-23 hours
5-7 hours
3-4 hours
1-2 hours
Zero
All with
Mobile
Mean 11.0
Median 5.0
Mean 23.7
Median 12.0
All that have
experienced mobile LoS
All that have not
experienced mobile LoS
Mean 12.4
Median 4.0
Mean 10.9
Median 5.0
All that have
experienced mobile LoS
All that have not
experienced mobile LoS
Mean 24.3
Median 12.0
Mean 23.6
Median 12.0

166.
14 hours is considered the maximum reasonable wait time for a fault to be
fixed on a mobile service. 30 hours is considered to be unacceptable
SMEs: Loss of service on mobile phone service
C10 Please think back to when you experienced a loss of service for your mobile phone service. How long do you think it is reasonable for the maximum wait until your
provider has successfully resolved the fault? ‘Reasonable’ does not have to mean your ‘ideal’ situation, but one that would be generally satisfactory to you. Please give
your answer in terms of hours C11 And what would be an unacceptable length of time to wait? Again, please give your answer in terms of hours
mobile loss of service n=639 / experienced loss of mobile service n=101 / hypothetical loss of mobile phone n=538
Acceptable wait time for loss of service (hours) Unacceptable wait time for loss of service (hours)
5%
3%
3%
0%
30%
9%
7%
15%
27%
0%
Don’t know
Longer
37-48 hours
25-36 hours
24 hours
8-23 hours
5-7 hours
3-4 hours
1-2 hours
Zero
All with
Mobile
3%
13%
20%
12%
12%
8%
7%
13%
13%
0%
Don't know
Longer
37-48 hours
25-36 hours
24 hours
8-23 hours
5-7 hours
3-4 hours
1-2 hours
Zero
All with
Mobile
Mean 13.9
Median 6.0
Mean 30.0
Median 24.0
All that have
experienced mobile LoS
All that have not
experienced mobile LoS
Mean 9.7
Median 4.0
Mean 14.8
Median 6.0
All that have
experienced mobile LoS
All that have not
experienced mobile LoS
Mean 21.4
Median 12.0
Mean 31.7
Median 24.0

Extra analysis
Fixed Line Research:
Consumers

6%
6%
27%
9%
4%
21%
28%
All
No existing service
Change/upgradeexisting provider,service maintained
Change/upgradeexisting provider,temporary loss service
Switch to newprovider, temporaryloss service
Switch to newprovider, servicemaintained
Switch to newprovider, service lossdue to own choices
Other/DK
168.
Scenario last time changed or upgraded service (any service)
On average 9.8 days to service activation for any service. 92% said this was in
line with provider information and 87% felt the time taken was reasonable.
E2 Which of these scenarios applied to the last time you changed or upgraded your service? Base: All Consumer that have changed (any service) in the last 5 years n=856 E3 Did you move home
at the same time? Base: All not ‘other/dk’ at E2 n=808. E4 Did the change or upgrade require an engineer to visit your home to install new lines or other equipment? Base: All not ‘no existing
service’ ‘service loss due to own choices’ or ‘other/dk’ at E2 n=522. E5 Approximately how many calendar days after placing the order was the service activated or upgraded? Base: all that
had a new service n=758 (not including other/dk or those without service due to own choices at E2). E5b And was this in line with the time period you had been given by your provider? E6a Do
you think the time it took was reasonable? Base: All where service activated n=522
40% said
change
required
engineer
visit
36%
had
moved
home
at the
same
time
0%
8%
7%
15%
9%
21%
1%
9%
5%
6%
6%
9%
3%
Not yet
22+ days
15 to 21
11 to 14
8 to 10
Seven
Six
Five
Four
Three
Two
One
Zero
9.8
Service activation/upgrade (days)
In line with time period
given by provider?
92%
Reasonable timing?
87%
Of those who said no, the mean for a
reasonable time was 5.2 days
Mean (days)

6%
6%
27%
18%
9%
21%
4%12%
21%16%
28%33%
All NOT in line with time period given
No existing service
Change/upgradeexisting provider,service maintained
Change/upgradeexisting provider,temporary loss service
Switch to newprovider, temporaryloss service
Switch to newprovider, servicemaintained
Switch to newprovider, service lossdue to own choices
Other/DK
169.
Scenario last time changed or upgraded service (any service)
Overall, a quarter (28%) did not have an existing service at their property, a
quarter (25%) changed or upgraded with their existing provider and a third (36%)
switched to a new provider.
E2 Which of these scenarios applied to the last time you changed or upgraded your service? Base: All that have changed (any service) in the last 5 years n=856; All where service
activation/upgrade was NOT in line with the time period given by their provider (excluding those who say service loss to own choice or DK at E2 which is why those codes then
don’t appear) n=101
25%
change/
upgrade
existing
provider
36%
change/
upgrade
new
provider
28%
change/
upgrade
existing
provider
40%
change/
upgrade
new
provider