Embed Size (px)
Citation preview
MAPPS/ASPRS 2006 Fall Conference November 6 – 10, 2006 * San Antonio, Texas
AUTOMATIC BUILDING FEATURE EXTRACTION USING LIDAR DATA AND DIGITAL MAP
Jun-chul Kim, Senior Engineer
Image/System Group Satrec Initiative Co.
461-26 Jeonmin-dong, Yuseong-gu, Daejeon 305-811, Korea
Sung-woong Shin, Senior Engineer Kyung-ok Kim, Director Spatial Information Team
Telematics/USN Research Division, ETRI (Electronics and Telecommunications Research Institute)
[email protected] [email protected]
ABSTRACT
This paper introduces an algorithm for Automatic Building Feature Extraction (ABFE) from LiDAR data and digital map. The proposed algorithm determines polygon features corresponding to building boundaries based on spatial analysis of digital map data and density analysis of LiDAR data. The purpose of this study is to extract building features automatically from LiDAR point cloud data by additional application of digital map data in order for more accurate and reliable feature extraction. Difficulties occur in building extraction by using LiDAR data only, especially due to various facilities such as antenna and rooftop structures on top of the building. By virtue of the accuracy and the periodic update of 1:5,000 digital map data, the complementary application of the digital map data for the building boundary extraction covers the weakness of LiDAR point cloud data information and increases overall accuracy and reliability of the results. The effectiveness of the proposed algorithm is tested and verified in this study. In conclusion, the application of the proposed ABFE algorithm is expected to reduce the time and cost for interactive building boundary extraction significantly.
INTRODUCTION
Recently, there have been a significant amount of research efforts put into the field of feature extraction. Feature extraction is a technique which is used for the analysis and interpretation of data obtained by multi-sensors (LiDAR data, satellite image and aerial photo imagery) for a variety of tasks and applications. 3D data in urban areas is in great demand for many applications such as urban planning, telecommunication, environment monitoring, and so on. Especially, ABFE tools and approach have been used on the image registration, triangulation and other various parts.
The most of research works have been focused on building detection and reconstruction from airborne laser scanning data in automated fashion (Morgan and Habib 2001; Vosselman and Dijkman, 2001; Elaksher and Bethel, 2002, Cho and Jwa, 2004). For example, among of them, Vosselman and Dijkman(2001) used ground planes. These ground planes reduce the search space and eliminate the building detection problem. Segmentation based on the raw data (Morgan and Habib, 2001) such as using triangulated irregular network (TIN) minimized interpolation errors which degrade the performance. Cho and Jwa(2004) presented an automatic building extraction approach that utilized a concept of pseudo-grid which virtually contains laser point data in each grid form. The pseudo-grid size is employed to remove noise and seed points are extract during TIN generation for terrain. Lee and Yu(2003, 2004) used digital map and LiDAR data for building extraction for updating the digital map and 3D-Modeling.
The purpose of the proposed algorithm is to extract polygon features corresponding to building boundaries automatically. It is meaningful to extract the 3D polygon features automatically with high accuracy by using both 1:5,000
MAPPS/ASPRS 2006 Fall Conference November 6 – 10, 2006 * San Antonio, Texas
digital map data and LiDAR point cloud data. In specific, this paper concerns the case in which buildings have various facilities on the roof. These complex
on-the-roof structures are shown on many buildings located in the studied area, and the building roof cannot be formed in one plane in this case. In order to extract the true boundary of the building automatically, it is very useful to apply the 1:5,000 digital map data. A strategy for removing the ground points by using pseudo-terrain TIN generated from elevation layers of the digital map data is also presented in this paper. In addition, building objects extracted from digital map data are utilized for grouping building candidate points of LiDAR point cloud data and the proposed building detection algorithm is based on density analysis of points.
The proposed ABFE algorithm can be applied to various fields such as ortho-photo generation, sensor modeling, image registration, digital building model(DBM) generation, 3D city facilities construction and digital map update. The application of the proposed ABFE algorithm as well as the following visual assessment and validation will reduce the time and cost for interactive building boundary extraction significantly.
DATA PREPARATION
The dataset used in this study are 1:5,000 scale digital map, LiDAR point cloud data in LAS format and Aerial
image. It covers a populated urban area of Daejeon city of Korea. The detail information of the dataset is shown in Table 1.
Table 1. Test-bed Dataset
No. Data Description Acquisition/ Revision Date
1 Digital Map Map Number - 36710056 Dxf format Scale 1:5,000
2003
2 LiDAR Point Cloud
The ALTM 30/70 LAS format average point density - 0.6m
2005.11
3 Aerial Image Frame, Daejeon(N) 2005.11
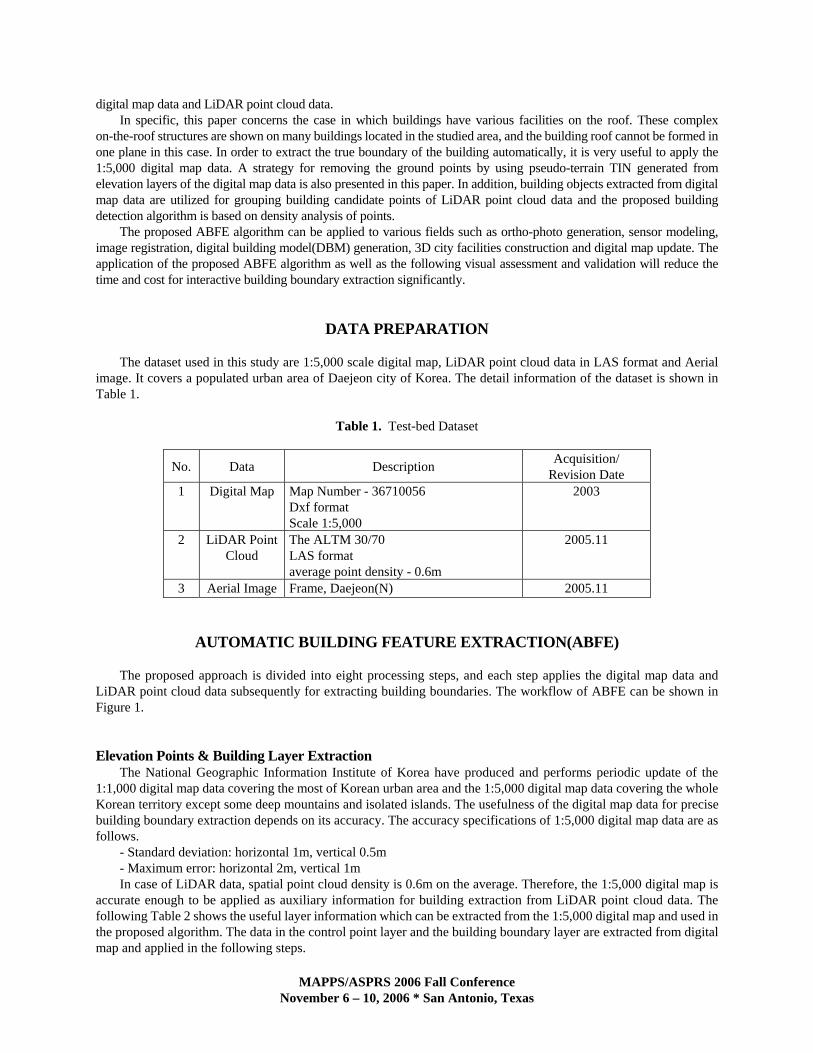
AUTOMATIC BUILDING FEATURE EXTRACTION(ABFE) The proposed approach is divided into eight processing steps, and each step applies the digital map data and
LiDAR point cloud data subsequently for extracting building boundaries. The workflow of ABFE can be shown in Figure 1.
Elevation Points & Building Layer Extraction The National Geographic Information Institute of Korea have produced and performs periodic update of the
1:1,000 digital map data covering the most of Korean urban area and the 1:5,000 digital map data covering the whole Korean territory except some deep mountains and isolated islands. The usefulness of the digital map data for precise building boundary extraction depends on its accuracy. The accuracy specifications of 1:5,000 digital map data are as follows.
- Standard deviation: horizontal 1m, vertical 0.5m - Maximum error: horizontal 2m, vertical 1m In case of LiDAR data, spatial point cloud density is 0.6m on the average. Therefore, the 1:5,000 digital map is
accurate enough to be applied as auxiliary information for building extraction from LiDAR point cloud data. The following Table 2 shows the useful layer information which can be extracted from the 1:5,000 digital map and used in the proposed algorithm. The data in the control point layer and the building boundary layer are extracted from digital map and applied in the following steps.
MAPPS/ASPRS 2006 Fall Conference November 6 – 10, 2006 * San Antonio, Texas
Figure 1. Automatic Building Feature Extraction - Workflow
Table 2. Layer Category of Digital Map(about Building and Terrain)
Level-1 Level-2 Level-3 Layer Name Layer Code
terrain nature altitude point 7217 triangulation point 7311 national
control point bench mark 7312 horizontal control point 7321
terrain control point aerial survey
control point altitude control point 7322 building 4111 house 4112 row house 4113 constructing building 4114 apartment 4115 non-wall building 4116 green house 4117 Temporary building 4118
building building boundary
building boundary
grouped house boundary 4119
MAPPS/ASPRS 2006 Fall Conference November 6 – 10, 2006 * San Antonio, Texas
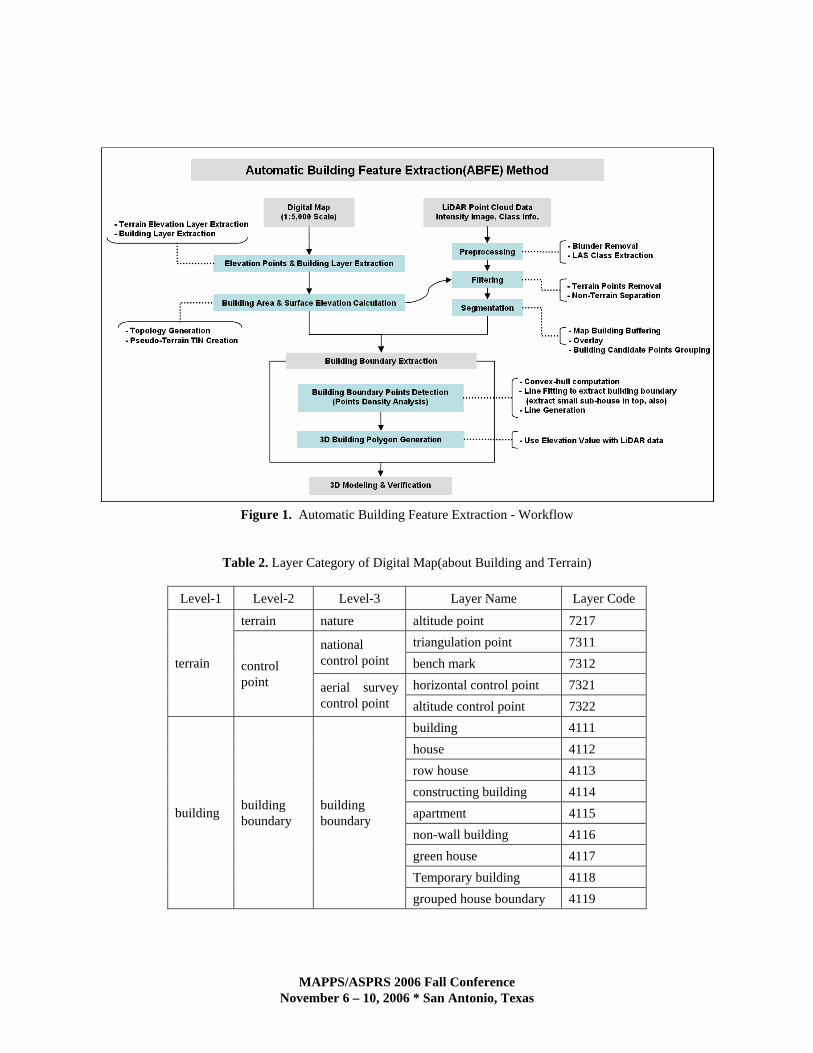
Building Area & Surface Elevation Calculation The extracted building layer consists of a set of poly-lines. The poly-lines are converted to polygons by applying
topological logics. After calculating the minimum and the maximum size of building, the size ratio is used in order to remove the facilities except the building from LiDAR data. The control points which were extracted from the digital map in the previous step are used to generate terrain TIN. A threshold is determined and applied for distinguishing buildings from terrain features such as road surface, playground, and so on, and then the Pseudo-Terrain TIN excluding buildings can be generated (Figure 2).
Figure 2. Elevation Layers extracting from Digital Map and Pseudo-Terrain TIN using that
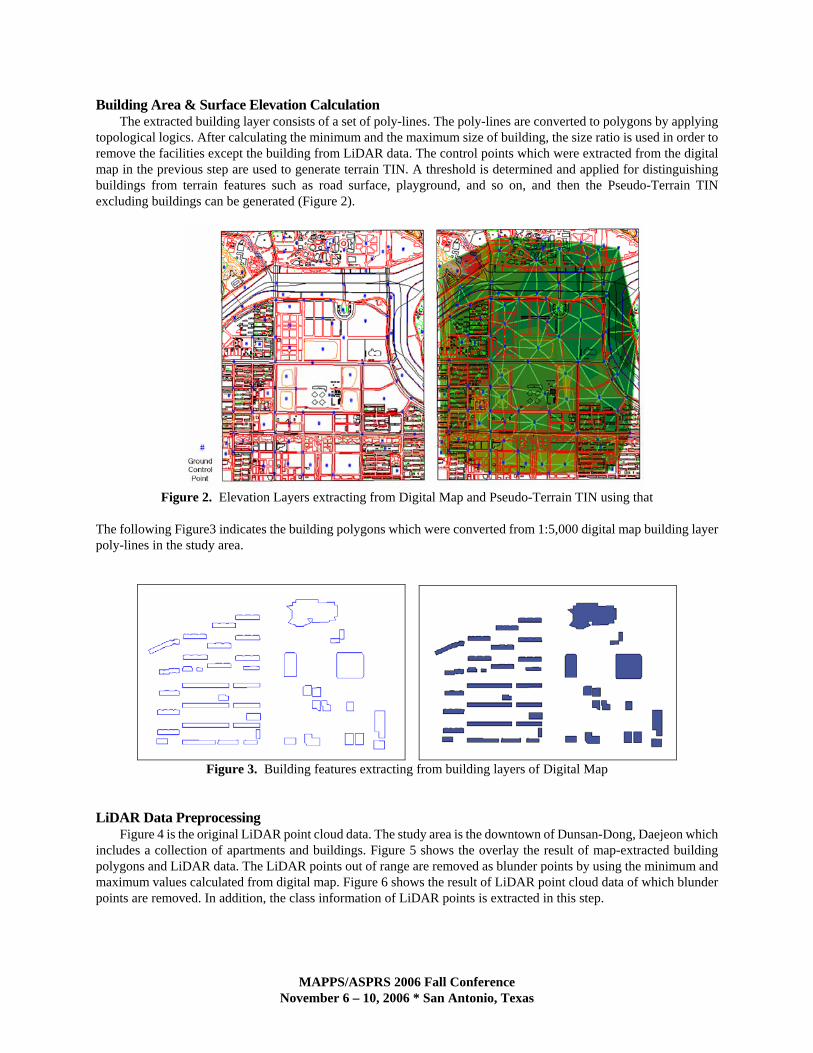
The following Figure3 indicates the building polygons which were converted from 1:5,000 digital map building layer poly-lines in the study area.
Figure 3. Building features extracting from building layers of Digital Map
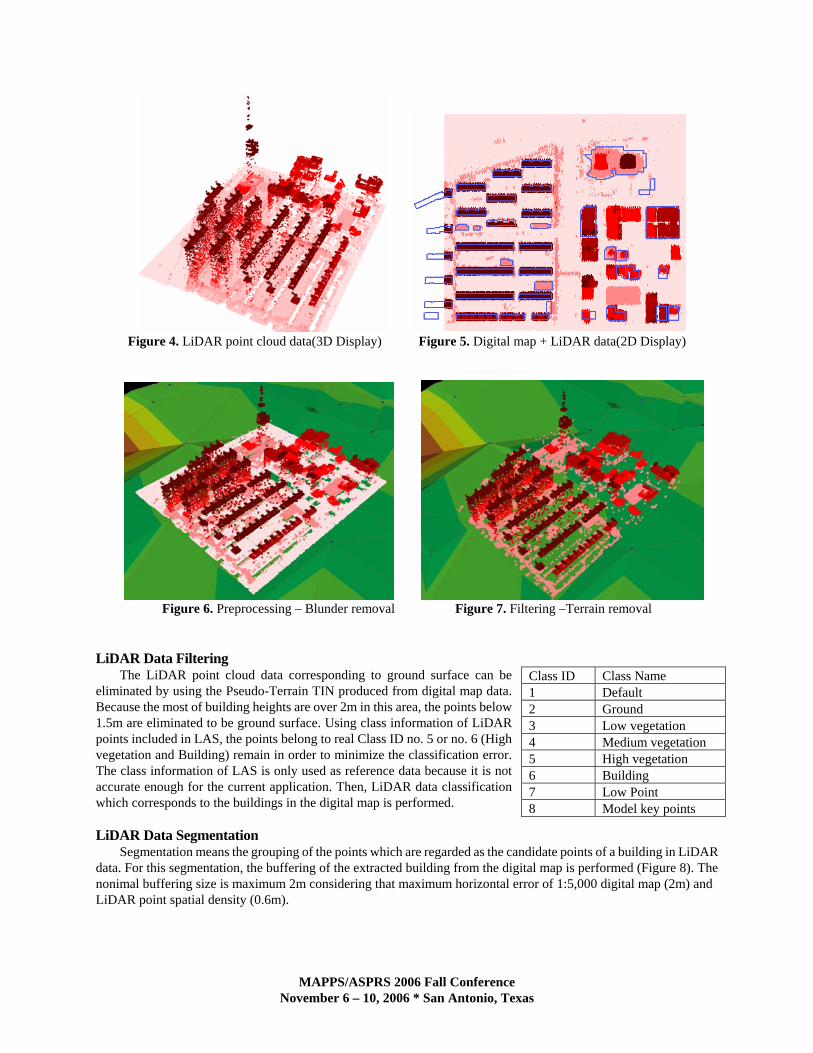
LiDAR Data Preprocessing
Figure 4 is the original LiDAR point cloud data. The study area is the downtown of Dunsan-Dong, Daejeon which includes a collection of apartments and buildings. Figure 5 shows the overlay the result of map-extracted building polygons and LiDAR data. The LiDAR points out of range are removed as blunder points by using the minimum and maximum values calculated from digital map. Figure 6 shows the result of LiDAR point cloud data of which blunder points are removed. In addition, the class information of LiDAR points is extracted in this step.
MAPPS/ASPRS 2006 Fall Conference November 6 – 10, 2006 * San Antonio, Texas
Figure 4. LiDAR point cloud data(3D Display) Figure 5. Digital map + LiDAR data(2D Display)
Figure 6. Preprocessing – Blunder removal Figure 7. Filtering –Terrain removal
LiDAR Data Filtering
The LiDAR point cloud data corresponding to ground surface can be eliminated by using the Pseudo-Terrain TIN produced from digital map data. Because the most of building heights are over 2m in this area, the points below 1.5m are eliminated to be ground surface. Using class information of LiDAR points included in LAS, the points belong to real Class ID no. 5 or no. 6 (High vegetation and Building) remain in order to minimize the classification error. The class information of LAS is only used as reference data because it is not accurate enough for the current application. Then, LiDAR data classification which corresponds to the buildings in the digital map is performed.
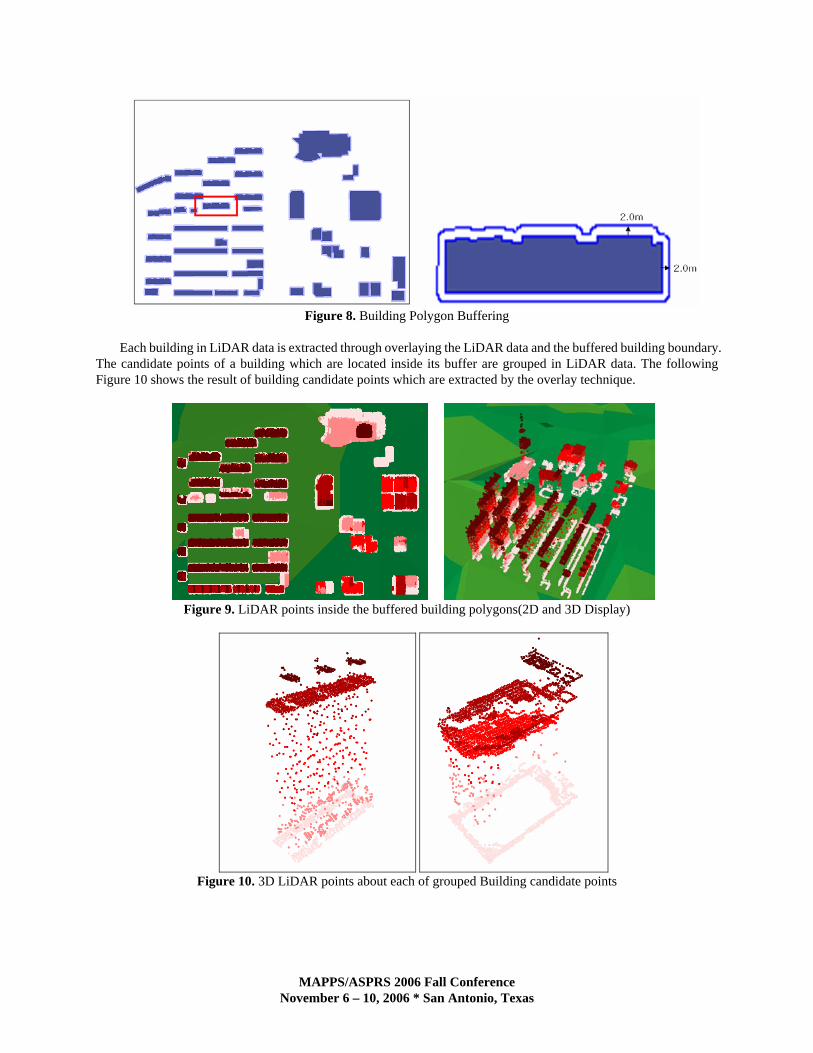
LiDAR Data Segmentation
Segmentation means the grouping of the points which are regarded as the candidate points of a building in LiDAR data. For this segmentation, the buffering of the extracted building from the digital map is performed (Figure 8). The nonimal buffering size is maximum 2m considering that maximum horizontal error of 1:5,000 digital map (2m) and LiDAR point spatial density (0.6m).
Class ID Class Name 1 Default 2 Ground 3 Low vegetation 4 Medium vegetation 5 High vegetation 6 Building 7 Low Point 8 Model key points
MAPPS/ASPRS 2006 Fall Conference November 6 – 10, 2006 * San Antonio, Texas
Figure 8. Building Polygon Buffering
Each building in LiDAR data is extracted through overlaying the LiDAR data and the buffered building boundary.
The candidate points of a building which are located inside its buffer are grouped in LiDAR data. The following Figure 10 shows the result of building candidate points which are extracted by the overlay technique.
Figure 9. LiDAR points inside the buffered building polygons(2D and 3D Display)
Figure 10. 3D LiDAR points about each of grouped Building candidate points
MAPPS/ASPRS 2006 Fall Conference November 6 – 10, 2006 * San Antonio, Texas
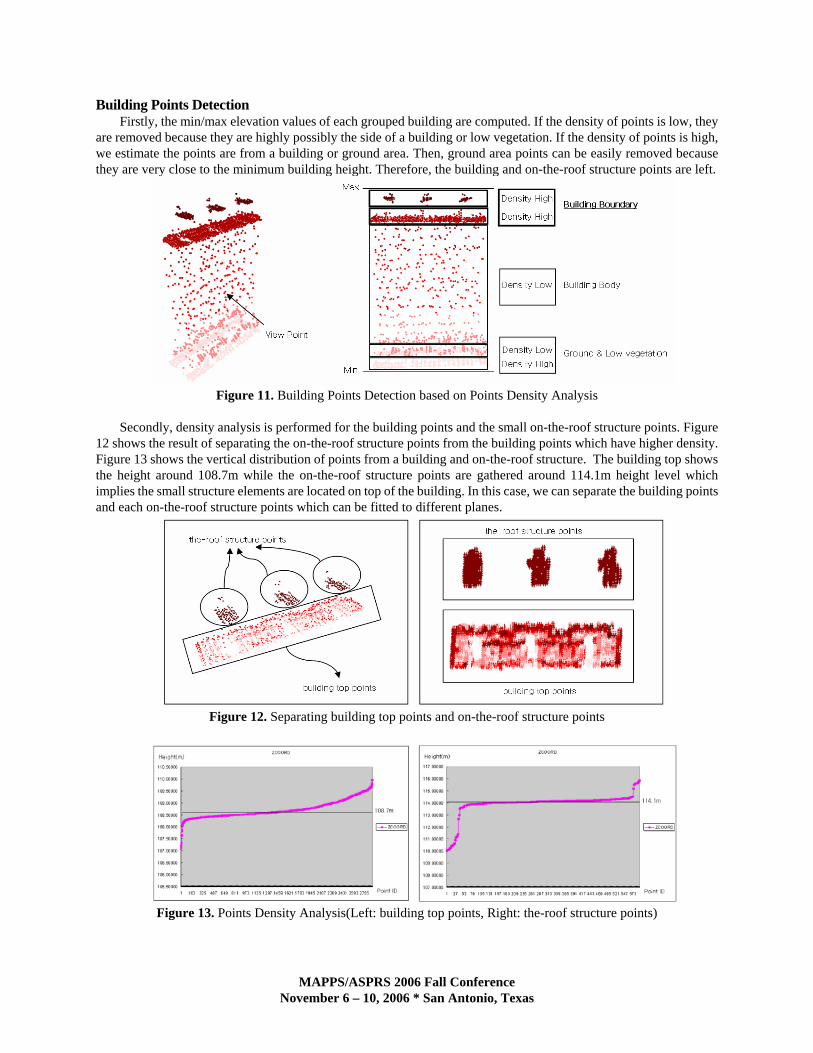
Building Points Detection Firstly, the min/max elevation values of each grouped building are computed. If the density of points is low, they
are removed because they are highly possibly the side of a building or low vegetation. If the density of points is high, we estimate the points are from a building or ground area. Then, ground area points can be easily removed because they are very close to the minimum building height. Therefore, the building and on-the-roof structure points are left.
Figure 11. Building Points Detection based on Points Density Analysis
Secondly, density analysis is performed for the building points and the small on-the-roof structure points. Figure
12 shows the result of separating the on-the-roof structure points from the building points which have higher density. Figure 13 shows the vertical distribution of points from a building and on-the-roof structure. The building top shows the height around 108.7m while the on-the-roof structure points are gathered around 114.1m height level which implies the small structure elements are located on top of the building. In this case, we can separate the building points and each on-the-roof structure points which can be fitted to different planes.
Figure 12. Separating building top points and on-the-roof structure points
Figure 13. Points Density Analysis(Left: building top points, Right: the-roof structure points)
MAPPS/ASPRS 2006 Fall Conference November 6 – 10, 2006 * San Antonio, Texas
3D Building Polygon Generation Polygon generation is the step to extract building boundary containing the building candidate points. First of all,
the convex-hull of building boundary candidate points is generated. Then, the line-fitting for extracting the building boundary is performed as it has been applied for road surface extraction from laser ranging data in previous studies (Manandhar and Shibasaki, 2000, Manandhar and Shibasaki, 2001). This method is based on a simple algorithm that connects an outline pre-point to the next-point inside convex-hull in sequence. It can extract various building shapes which can not be detected by using the convex hull only. In the next step, the building boundary lines extracted by the line-fitting are simplified by generalization. Figure 14 shows the results of the extracted boundary lines of a building and on-the-roof structure elements.
Figure 14. Building Feature Extraction
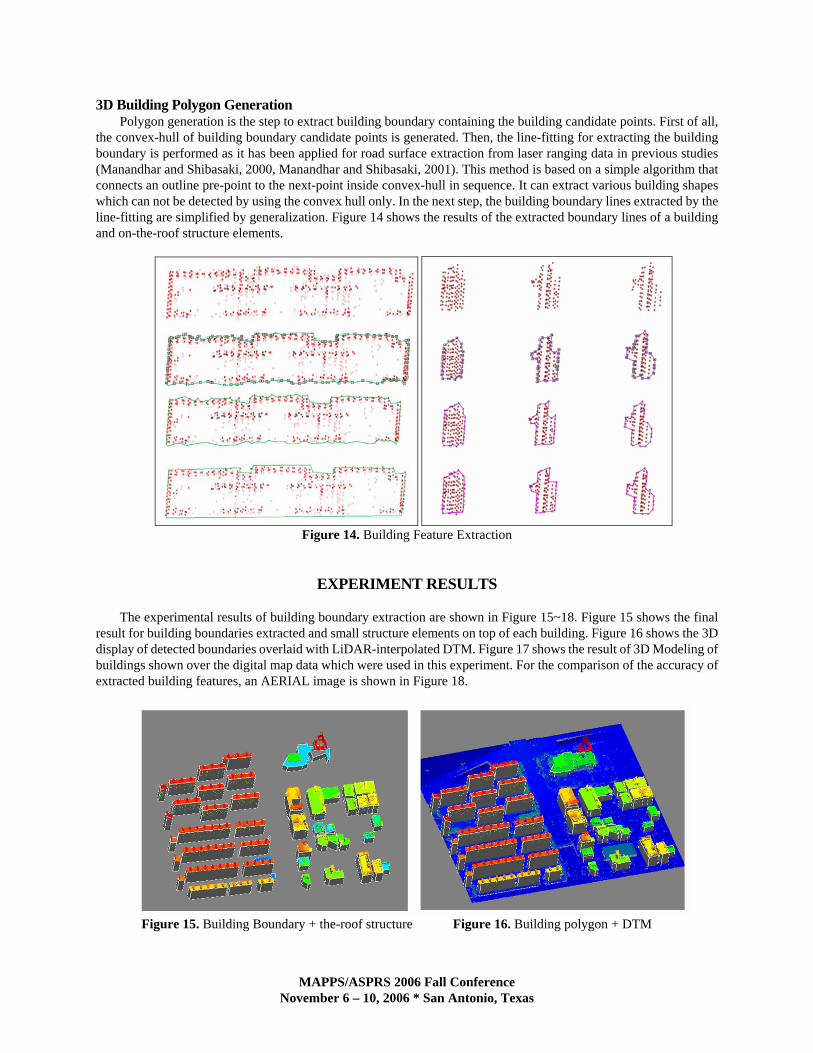
EXPERIMENT RESULTS
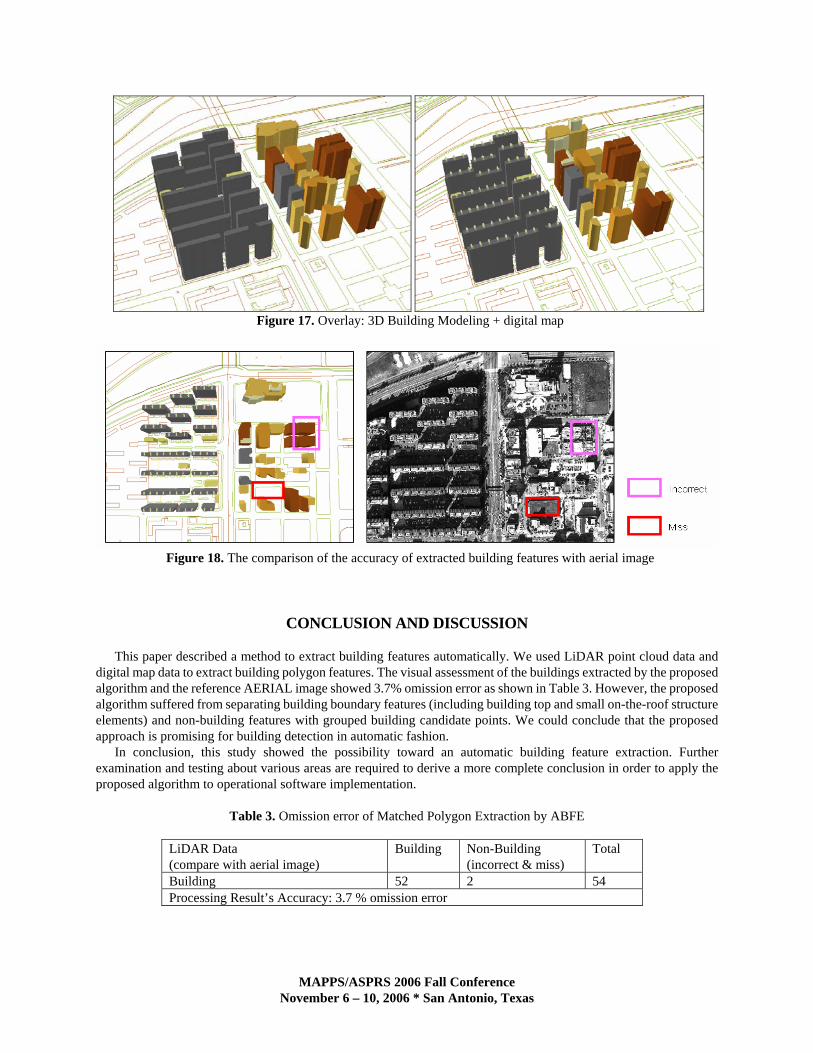
The experimental results of building boundary extraction are shown in Figure 15~18. Figure 15 shows the final result for building boundaries extracted and small structure elements on top of each building. Figure 16 shows the 3D display of detected boundaries overlaid with LiDAR-interpolated DTM. Figure 17 shows the result of 3D Modeling of buildings shown over the digital map data which were used in this experiment. For the comparison of the accuracy of extracted building features, an AERIAL image is shown in Figure 18.
Figure 15. Building Boundary + the-roof structure Figure 16. Building polygon + DTM
MAPPS/ASPRS 2006 Fall Conference November 6 – 10, 2006 * San Antonio, Texas
Figure 17. Overlay: 3D Building Modeling + digital map
Figure 18. The comparison of the accuracy of extracted building features with aerial image
CONCLUSION AND DISCUSSION
This paper described a method to extract building features automatically. We used LiDAR point cloud data and digital map data to extract building polygon features. The visual assessment of the buildings extracted by the proposed algorithm and the reference AERIAL image showed 3.7% omission error as shown in Table 3. However, the proposed algorithm suffered from separating building boundary features (including building top and small on-the-roof structure elements) and non-building features with grouped building candidate points. We could conclude that the proposed approach is promising for building detection in automatic fashion.
In conclusion, this study showed the possibility toward an automatic building feature extraction. Further examination and testing about various areas are required to derive a more complete conclusion in order to apply the proposed algorithm to operational software implementation.
Table 3. Omission error of Matched Polygon Extraction by ABFE
LiDAR Data (compare with aerial image)
Building Non-Building (incorrect & miss)
Total
Building 52 2 54 Processing Result’s Accuracy: 3.7 % omission error
MAPPS/ASPRS 2006 Fall Conference November 6 – 10, 2006 * San Antonio, Texas
REFERENCES Manandhar, D., Shibasaki, R.(2000). Geo-referencing of Multi Sensor Range Data for Vehicle-borne Laser Mapping
System, 21st Asian Conference on Remote Sensing(ACRS), 4-8 December, Taipei, Vol 2, pp. 932-937 Manandhar, D. Shibasaki, R.(2001). Vehicle-borne Laser Mapping System (VLMS) for 3-D Urban GIS Database, 7th
Computers in Urban Planning and Urban Management Conf.(CUPUM 2001), July 18-20, University of Hawaii at Manoa, USA, CD-ROM publication
Morgan, M. and Habib, A.(2001). 3D TIN for Automatic Building Extraction from airborne Laser Scanning Data. Proceedings of the ASPRS “Gateway to the New Millennium”, St. Louis, Missouri 2001.
Vosselman, G. and Dijkman, S.(2001). 3D Building Model Reconstruction from point clouds and ground plans, International Archives of Photogrammetry and Remote Sensing, Annapolis, MD, XXXIV(3/W4): 37-43.
Ahmed F. Elaksher and James S. Bethel(2002). Building extraction using lidar data, ACMS-ASPRS 2002 annual conference proceedings, unpaginated CD-ROM.
Wonhee Lee, Kiyun Yu(2003). The renewal of digital map using LiDAR data. Proceedings of KSGPC(Korean Society of Surveying, Geodesy, Photogrammetry, and Cartography), Seoul, Korea.
Woosug Cho, Yoon-Seok Jwa, Hwi-Jeong Chang and Sung-Hun Lee(2004). Pseudo-Grid Based Building Ex-traction Using Airborne LIDAR Data, 20th ISPRS Con-gress, Istanbul, unpaginated CD-ROM.
Wonhee Lee, Kiyun Yu(2004). The 3-dimensional modeling of buildings in urban areas using digital maps and LidAR data. Proceedings of KSCE(Korean Society of Civil Engineers) No24 2ho (2004. 3) pp.311-318 , Seoul, Korea.