Embed Size (px)
Citation preview

This article has been accepted for inclusion in a future issue of this journal. Content is final as presented, with the exception of pagination.
IEEE TRANSACTIONS ON INSTRUMENTATION AND MEASUREMENT 1
Automated Visual Inspection of Glass BottleBottom With Saliency Detection
and Template MatchingXianen Zhou , Yaonan Wang, Changyan Xiao , Qing Zhu , Xiao Lu, Hui Zhang, Ji Ge, and Huihuang Zhao
Abstract— Glass bottles are widely used as containers in thefood and beverage industry, especially for beer and carbonatedbeverages. As the key part of a glass bottle, the bottle bottomand its quality are closely related to product safety. Therefore,the bottle bottom must be inspected before the bottle is usedfor packaging. In this paper, an apparatus based on machinevision is designed for real-time bottle bottom inspection, anda framework for the defect detection mainly using saliencydetection and template matching is presented. Following a briefdescription of the apparatus, our emphasis is on the imageanalysis. First, we locate the bottom by combining Hough circledetection with the size prior, and we divide the region of interestinto three measurement regions: central panel region, annularpanel region, and annular texture region. Then, a saliencydetection method is proposed for finding defective areas inside thecentral panel region. A multiscale filtering method is adopted tosearch for defects in the annular panel region. For the annulartexture region, we combine template matching with multiscalefiltering to detect defects. Finally, the defect detection resultsof the three measurement regions are fused to distinguish thequality of the tested bottle bottom. The proposed defect detectionframework is evaluated on bottle bottom images acquired byour designed apparatus. The experimental results demonstratethat the proposed methods achieve the best performance incomparison with many conventional methods.
Index Terms— Defect detection, machine vision, multiscalefiltering, saliency detection, template matching.
I. INTRODUCTION
GLASS bottles are widely used as containers in the foodand beverage industry, especially for beer and carbon-
Manuscript received July 10, 2018; revised October 7, 2018; acceptedNovember 26, 2018. This work was supported in part by the NationalScience Foundation of China under Grant 61733004, Grant 61703155, Grant61573134, and Grant 61503128, in part by the Hunan Key Project of Researchand Development Plan under Grant 2017XK2102, Grant 2018GK2022, andGrant 2018JJ3079, and in part by the Innovation Project of PostgraduateStudent in Hunan Province of China under Grant CX2017B108. The AssociateEditor coordinating the review process was Emanuele Zappa. (Correspondingauthors: Changyan Xiao; Qing Zhu.)
X. Zhou, Y. Wang, C. Xiao, and Q. Zhu are with the National EngineeringLaboratory for Robot Visual Perception and Control Technology, College ofElectrical and Information Engineering, Hunan University, Changsha 410082,China (e-mail: [email protected]; [email protected]).
X. Lu is with the College of Engineering and Design, Hunan NormalUniversity, Changsha 410081, China.
H. Zhang is with the College of Electrical and Information Engineering,Changsha University of Science and Technology, Changsha 410114, China.
J. Ge is with the Advanced Micro and Nanosystems Laboratory, Universityof Toronto, Toronto, ON M5S 3G8, Canada.
H. Zhao is with the College of Computer Science and Technology,Hengyang Normal University, Hengyang 421008, China.
Color versions of one or more of the figures in this paper are availableonline at http://ieeexplore.ieee.org.
Digital Object Identifier 10.1109/TIM.2018.2886977
ated beverages [1], because glass bottles are easy to mold,easy to recycle, relatively inexpensive, and highly resistant tointernal pressure [2]. However, glass bottles can also be easilydamaged in the transport process and in various manufacturingprocesses. In addition, smudges and foreign material may existon the bottle surface, especially on reused bottles [3]. Thebottle bottom is a key part of a glass bottle. If a bottle thatpossesses bottom defects is filled, potential hazards may occurduring product storage and transportation. Hence, the qualityof the bottle bottom must be strictly checked before filling thebottle.
The conventional bottle bottom inspection methods rely onmanual inspection, and they suffer from inherent inconsis-tency and unreliability because the entire inspection processis subjective and very tedious [4], [5]. As a promising andnondestructive measurement technique, machine vision-baseddefect detection has been widely applied in medicine [6], [7],food [8], beverage [4], and many other fields [9]–[17]. Thisapproach also provides a flexible solution to bottle bottomquality control. To date, even though many patents related tobottle bottom inspection devices have been filed [3], [18], [19]and there exist several commercial vision systems available forbottle inspections [20], [21]. However, there are still manyproblems to be solved, such as the inaccurate localizationof bottle bottom, the difficulty in defect detection of textureregion, and the interference of gray-value variety across thecentral panel. Some directly related papers are also discussed.Shafait et al. [22] presented a simple method. They first locatethe center of the bottle bottom with a generalized Houghtransform. Then, they check each gray value in the region ofinterest (ROI) to distinguish defective regions. If the intensityof an individual pixel does not lie within the tolerance limit,then the pixel is designated as an outlier. Otherwise, the pixelis labeled as normal. This is a simple and fast method becauseit depends on only two thresholds. However, the result issusceptible to the impact of many factors, such as light inten-sity inhomogeneity and bottom thickness variety. To enhancethe robustness, Duan et al. [4] introduced a defect detectionapproach based on a back propagation neural network for thebottle bottom and bottle body. The 6-D features, including thegradient and many binary values obtained by thresholds, arefirst calculated. Then, two artificial neural networks are usedfor low-level inspection and high-level judgment. The structureof the network is complicated. Therefore, training the networkis time-consuming. To accelerate the process, Ma et al. [23]and Huang et al. [24] employed least squares circle detection
0018-9456 © 2019 IEEE. Personal use is permitted, but republication/redistribution requires IEEE permission.See http://www.ieee.org/publications_standards/publications/rights/index.html for more information.

This article has been accepted for inclusion in a future issue of this journal. Content is final as presented, with the exception of pagination.
2 IEEE TRANSACTIONS ON INSTRUMENTATION AND MEASUREMENT
and redefined randomized circle detection algorithms to locatethe ROI of the bottle bottom, and they applied the blobalgorithm and discrete Fourier transform (DFT) to detectdefects in the panel and texture regions, respectively [25].However, there is no further discussion regarding how toobtain blobs. Consider that global thresholding segmentation(GTS) and adaptive thresholding segmentation (ATS) are twosimple and popular methods to obtain blobs, they will bediscussed in the comparison experiments in this paper. Allthese traditional methods have some common problems. Forexample, when glass chips and transparent foreign particlesare present on the bottle bottom, the thicknesses of the bottlebottoms are different, or foreign materials and contaminantsexist in the texture region. Precisely detecting defects aredifficult.
To find a suitable solution for bottle bottom inspection,many similar works in surface defect detection problemsare further analyzed. Liu et al. [1] combined a support vec-tor machine with fuzzy theory to inspect defects of thebottle body. In [26], a simple method of thresholding andedge extracting was used to detect defects on mouths ofvials. Zhou et al. [27] used a fast sparse-representation-baseddetection algorithm to detect surface defects on bottle caps.A wavelet-based method was used for defect detectionin [28]–[30]. Many anisotropic diffusion model (AD)-basedmethods [31]–[35] are also widely used for surface defectdetection, especially for low-contrast images. Superpixel seg-mentation and a bi-Gaussian filter were fused to extractdefects on the inner surface of can ends [4]. Saliency detec-tion methods are also a good choice for object detectionand surface defect detection [36]–[38]. Moreover, the activecontour model [39], [40], Gabor filtering [41], [42], and theexpectation-maximization technique [43] could also be usedfor surface defect detection. Although there are many surfacedefect detection algorithms, they were mostly developed tosolve specific problems. Hence, only few of these algorithmscan be directly applied to bottle bottom inspection.
In this paper, we present an automated visual apparatus,and we propose a framework using the saliency detection andtemplate matching for bottle bottom inspection with real-timespeed. The emphasis is placed on image processing algorithmsfor defect detection across different bottle bottom regions. Themain contribution of this paper is fourfold.
1) An automated visual detection system is designed todetect defects for bottle bottoms.
2) A defect detection framework with saliency detectionand template matching for glass bottle bottoms is pro-posed. The proposed framework consists of three parts,which are applied to detect defects in the central panel,annular panel, and annular texture region of glass bottlebottoms.
3) We propose saliency detection algorithms that include aredefined geodesic saliency detection and a 1-D saliencydetection based on multiscale mean filtering used fordefect detection in panel regions of bottle bottoms.These methods can improve the robustness of defectdetection by raising the contrast between the backgroundarea and all suspected defects.
Fig. 1. System structure and electrical control system of the developedapparatus. (a) System structure. (b) Electrical control system.
4) We propose an annular texture region defect detectionmethod composed of template matching and multiscalemean filtering, which can improve the robustness togray-value variety.
This paper is organized as follows. The system architecture,imaging system, and defects and challenges are introduced inSection II. Section III illustrates the proposed defect detectionframework for glass bottle bottoms. The experimental resultsare presented in Section IV. Finally, Section V presents theconclusion.
II. SYSTEM DESIGN
In this section, the system architecture of the glass bottlebottom inspection apparatus is first introduced, and particularconsiderations regarding the illumination scheme are pre-sented. Then, the image properties and the challenges fordefect detection are investigated.
A. System Architecture
The system structure and electrical control system are illus-trated in Fig. 1. The apparatus mainly consists of three com-ponents: 1) an electromechanical device; 2) an imaging sys-tem; and 3) a processing module. Among these components,the electromechanical device is composed of motors (1.1),converters (1.2), an encoder (1.3), and so on. This componentis used to achieve automatic motion control and sorting ofbottles. The imaging system, which consists of a camera(2.1), light source (2.2), and photosensor (2.3), is designedto acquire high-quality images for the fast-moving test items.The processing module is composed of a computer (3.1)and programmable logic controller (PLC) (3.2). This moduleis adopted to process the obtained image and control theoperation of the machine. The glass bottle is grabbed byboth conveyor belts (1.6), as shown in Fig. 1(a). When it istransmitted to the photoelectric sensor (2.3), a trigger signalis generated, and this signal is received by the PLC (3.2).Then, the PLC generates two signals to turn on the planarlight source (2.2) immediately and to trigger the camera (2.1),which captures a bottom image. Finally, the computer (3.1)implements the proposed defect detection framework andoutputs the results. If any defect of a bottle bottom is detected,the bottle is considered as defective, which is not approvedby the visual inspection system. In other words, the defectivebottle will be removed from the production line by an aircylinder (1.5).

This article has been accepted for inclusion in a future issue of this journal. Content is final as presented, with the exception of pagination.
ZHOU et al.: AUTOMATED VISUAL INSPECTION OF GLASS BOTTLE BOTTOM WITH SALIENCY DETECTION AND TEMPLATE MATCHING 3
Fig. 2. Demonstrate the structure of a glass bottle and our designed imagingsystem. (a) Bottle. (b) Bottom. (c) Real imaging system. (d) Real bottomimage.
B. Imaging System
The glass bottle is usually composed of three parts includingbottom, body, and mouth, as shown in Fig. 2(a). The bottlebottom consists of two parts: a texture region and a panelregion, as shown in Fig. 2(b). We focus on defect detectionin the central panel region and annular region of the bottlebottom. To capture an image that can display these abnormalregions clearly, we designed the imaging system composed ofa camera and a planar light source, as shown in Fig. 2(c).The camera, which is installed in a closed box, in whichthe inner surface is painted black in order to avoid ambientlight interference, is situated above the bottle and looks downat the bottle bottom through the neck opening of the bottle.The bottom is, in turn, illuminated from below by a planarlight source, which is sufficiently large to illuminate the entirebottom. The limiting camera resolution, ILCR, is calculatedby ILCR = (SFOV/SMD) ∗ NPD, where SFOV and SMD denotethe sizes of the field of view (FOV) and minimal defect,respectively. The minimal defect requires at least NPD pixelsto represent. In this paper, SFOV ≈ 120 mm, SMD = 1mm, NPD = 4. Hence, the minimum resolution meeting ourrequirement is 480 × 480. A camera with a resolution of648 × 483 is sufficient to satisfy the inspection requirement.The real image from the in-field inspection is acquired in agrayscale format, as shown in Fig. 2(d).
C. Defects and Challenges
As shown in Fig. 2(d), in an ideal situation, images of thenormal bottle bottoms generally have relatively uniform graylevels in each region. However, due to different thicknesses ofbottle bottoms, the image of a normal bottle bottom also hasirregular gray levels. In addition, the bottle bottom inspectionis considered to be particularly difficult due to many other
Fig. 3. Typical defects of bottle bottoms with (a) smudginess,(b) glass detritus, (c) transparent film, (d) paperclip, (e) damaged bottom, and(f) bubble. Here, the red ellipse marked regions are magnified and displayedat the lower right corner of each subfigure, and the digits represent the meangray values of the white rectangular regions.
complex factors. Here, beer bottles are used for demonstration.After the beer inside the bottle has been consumed, thereare cases where cigarette butts, transparent films, bottle caps,paperclips, and so forth are pressed into the bottle; addition-ally, foreign particles including glass chips due to bottle mouthcracks enter the bottle [3]. Such foreign particles, includingglass detritus, transparent film, paperclips, and many varietiesof materials, have different types of optical characteristics tosuch an extent that it is extremely difficult to detect all ofthese objects simultaneously. Moreover, the bottle bottom issusceptible to damage during transportation and processing.
To further understand the complexity of bottle bottominspection, we divide bottle bottom flaws into four differenttypes according to the reflected features in the obtainedimages.
1) Opaque Foreign Objects: The gray level of opaque for-eign objects in the bottle bottom image is clearly lowerthan that of the normal region. In addition, the edges ofthe opaque foreign objects are very clear and sharp. Takethe large glass detritus and the paperclip as examples,as shown in Fig. 3(b) and (d).
2) Transparent Foreign Objects: The region correspondingto transparent foreign objects in the bottle bottom imageis similar to the normal region. The edges are not sharp.Take the transparent film as an example, as shownin Fig. 3(c).
3) Contaminants: As shown in Fig. 3(a), the gray level ofthe contaminant region is typically lower than that of thenormal region. In addition, the differences in boundaryregion are not very large.
4) Self-Defects: Their marginal region is generally smooth.The gray feature of the obtained image is in completecontrast to that of the contaminant. Take the broken glassand bubble as examples, as shown in Fig. 3(e) and (f).
From the previous analysis, the main challenges in detectingbottle bottom defects can be summarized as follows.
1) The gray values of the panel region change in a greatrange for different bottle bottom images, even thoughthese images are obtained by the same system with thesame parameter settings, and the corresponding tested

This article has been accepted for inclusion in a future issue of this journal. Content is final as presented, with the exception of pagination.
4 IEEE TRANSACTIONS ON INSTRUMENTATION AND MEASUREMENT
bottles are also the same type of glass bottle. The prob-lem may also be caused by the thicknesses of differentbottoms being different. For example, the average grayvalue of the white rectangular region in Fig. 3(a) is 188,while that of the region in Fig. 3(b) is 132. Specifi-cally, even for the same bottom image, the grayscaledistribution may vary remarkably in different locations,as shown in Fig. 3(d).
2) The contrast between the defective region and the nor-mal region is very low; for instance, when a trans-parent film exists on the bottom, the correspondingcaptured image is shown in Fig. 3(c). The grayscalevalues of defects are very different. When the bottomhas been broken, the grayscale values of the brokenregion are larger than those of the background, as shownin Fig. 3(e). When smudges, paperclips, transparent film,and other foreign materials exist on the bottom, the grayvalues of the defective regions are smaller than those ofthe normal region, as shown in Fig. 3(a)–(d).
3) The category of defects, the scale of defects, and theposition of defects are diverse.
4) Defects, particularly small and low-contrast defects,existing in the texture region are difficult to detectbecause the texture size, shape, and grayscale level mayalso change sharply.
III. BOTTLE BOTTOM INSPECTION METHOD
To overcome the problems described earlier, we proposedan image analysis pipeline for glass bottle bottom inspectionaccording to the features of defects. As shown in Fig. 4,the bottom is first located through a Hough transform circledetection. Then, the bottom is divided into the central panelregion and annular region, the latter is further segmentedinto two subregions: the annular panel region and the annulartexture region. In the following, three different algorithms areapplied to detect defects in different regions, where defectdetection methods based on a geodesic distance transform andmultiscale filtering are proposed for inspecting defects in thecenter panel region and the annular panel region, respectively.A defect detection method based on template matching isproposed for detecting defects in the annular texture region.Finally, the inspection results of the three regions are fused todistinguish the quality of the entire bottle bottom, as well as todisplay a complete result of defect detection. The consumedtime of our entire framework is approximately 133 ms whenthe framework is executed on a computer configured withan Intel(R) Core(TM) i5-4210U (1.7–2.4 GHz) and 6 GBof memory. The consumed time of each process and thecorresponding proportion of total time consumption are alsogiven in Fig. 4. Defect detection with our framework onnine tested bottle bottom is given in Fig. 5. It is clear thatthe majority of typical defects can be correctly detected.By changing the parameter settings, the proposed framework isapplicable to a diversity of bottle bottom samples with variouscolors and sizes. However, the shape of the bottom of thetested bottle must be cylindrical since the ROI of the bottlebottom image is obtained by the Hough circle detection. Theschematic of a tested bottle model is given in Fig. 2(a).
Fig. 4. Proposed defect detection framework.
Fig. 5. Defect detection with the proposed framework. (a)–(i) Defectdetection results for typical glass bottle bottoms. Here, the detection resultsare marked with rectangles in the lower right corner of (a)–(f) correspondingto the typical defects in Fig. 3. The red “Bad” and green “Good” in the upperleft corner of each figure, respectively, indicate the unqualified and qualifiedbottle bottoms.
A. Measurement Region Localization
Due to mechanical vibration from conveyor motion andrandom errors of the software system, the ROI of the bottledoes not present at a fixed position in the obtained images.Therefore, it is necessary to locate the object beforehand.
In this paper, we combine circle detection with size priors toobtain the ROI because the bottle bottom is a standard circularobject and has a fixed size for a certain type of bottle. We usethe 21HT algorithm [44], which consists of two steps, radiusdetection and center detection, to obtain the ROI of the bottom.21HT, which requires less memory and has higher efficacythan the traditional Hough circle detection method [45], is oneof the most popular circle detection methods and has beenimplemented in many popular image processing tools, such asOpenCV and MATLAB. After localization, the input imageis divided into two measurement regions, namely, the centralpanel region and annular region, as shown in Fig. 6(b) and (c),the latter is defined by its inner radius Ra_min and outerradius Ra_max. The radius of the central panel region is Rc.Ra_min, Ra_max, and Rc are set according to prior knowledge

This article has been accepted for inclusion in a future issue of this journal. Content is final as presented, with the exception of pagination.
ZHOU et al.: AUTOMATED VISUAL INSPECTION OF GLASS BOTTLE BOTTOM WITH SALIENCY DETECTION AND TEMPLATE MATCHING 5
Fig. 6. Measurement region localization. (a) Glass bottle bottom location.The red circle is the region obtained by the proposed localization method. Theregion in the green circle is the central panel region. The region between thelarge blue circle and the small blue circle is the annular region. (b) Enlargedfigure of the central panel region. (c) Enlarged figure of the original annularregion. (d) Annular region unwrapping. (e) Canny edges. (f) Edges that belongto the texture region. (g) Central line of the annular texture region obtainedby polynomial fitting. (h) Annular panel and texture regions obtained by thesize prior of the regular texture. (i) Annular panel region. (j) Annular textureregion.
of the bottle bottom. To ensure reliability for defect detection,we reserve a common panel region for the central panel regionand annular region, as shown in Fig. 6(a), which is betweenthe green circle and the small blue circle. The annular region isa ring-shaped image, which is inconvenient for the follow-upimage processing. Thus, we transform it into a rectangularimage with the radial development approach [8] in polarcoordinates with pole O and polar axis L denoted by thewhite dotted line in Fig. 6(a), where the polar angle θ ismeasured clockwise from the axis L. Followed, the annularregion unwrapping image, as shown in Fig. 6(d), namedas the annular region, is further divided into two subparts,namely, annular panel region and annular texture region, andthe corresponding flowchart is presented in Fig. 6(d)–(j). It ismainly composed of three steps: edge extraction, denoising,and polynomial fitting. The rectangular image obtained bythe radial development approach is first fed into the Cannyalgorithm to abstract edges since each texture generally hasa sharp boundary. Then, the interference connected edges aresearched and removed according to two features: the lengthof the connected edge denoted by FLCE, and the ratio of theheight to width denoted by FRHW. If FLCE and FRHW of anedge are too large or too small, the edge is considered as aninterference edge and removed. Finally, the remaining edgesare taken as the input data, and we use a polynomial of degreethree to fit the input data, which is similar to [46]. p1, p2, p3,and p4 are four coefficients of the polynomial x = f (y),which is given as
f (y) = p1 + p2y + p3y2 + p4y3. (1)
Depending on the x-coordinates and the y-coordinate ofthe input data, four coefficients can be obtained with the leastsquares method. In other words, the central line of all regulartexture regions, i.e., f (y), is obtained, as shown by the whiteline in Fig. 6(g). Finally, we combine the height prior of thetexture region with the central line to obtain the annular textureregion and annular panel region, as shown in Fig. 6(i) and (j).We realign the annular texture region by the polynomial fittingwithout a requirement of f (0◦) = f (360◦). Because the mainpurpose of the fitting is to divide the annular region into twosubregions: annular panel region and annular texture region.Moreover, the fitted result usually has little effect on the finaldefect detection result since the majority of interference edgeshave been removed.
B. Defect Detection in Annular Texture Region
Defects in the annular region are diverse. Moreover,the complex structures of the bottle bottom make the gray-leveldistribution vary remarkably with changing location. Thesefactors dramatically increase the difficulty of defect detection.Fortunately, in the same bottom image, the majority of textureregions are usually similar to each other in shape and size.Hence, we propose a template-matching-based defect detectionalgorithm named TM for short, as shown in Fig. 7, whichincludes three steps: regular texture localization, templateextraction, and template matching and defect recognition.
1) Regular Texture Localization: Regular texture localiza-tion consists of three subparts: gray projection, mean filtering,and ridge detection, as shown in Fig. 7(a)–(c). First, the pro-jection profile of the ROI strip is obtained by accumulat-ing the gray levels in the x-coordinate direction. However,the obtained 1-D signal is very noisy, as shown in Fig. 7(b).To reduce noise, mean filtering is used for smoothing theprojection profile. Ridges generally appear on the central linebetween the two adjacent texture regions. On this basis, we canlocate each regular texture region by detecting ridges in they-coordinate direction. Finally, we search all local peaks ofthe obtained 1-D signal, and beginning from the first peak,we remove those peaks separated by less than a distancethreshold, which is set manually according to the width priorof the texture region. The remaining ridges are the final ridgedetection result, as shown in 7(c).
2) Template Extraction: For different bottle bottoms,although these bottles belong to the same type, the differencesin regular texture are particularly great because the used timeis inconsistent for recycled bottles. Thus, we must extract thecorresponding template of regular texture for each tested bottlebottom.
The flowchart of template extraction is presentedin Fig. 7(d)–(g). First, we transform the curvilinear strip intoa regular rectangular image to facilitate the follow-up processof image processing, as shown in Fig. 7(d). Then, the widthof each texture region and the appearance frequency of eachwidth are computed. Finally, we obtain the regular textureregions with the maximum frequency and take the averagegray levels of all obtained texture regions as the template,as shown in 7(g), because the defective regions cover only theminority of the whole annular region, and their appearance

This article has been accepted for inclusion in a future issue of this journal. Content is final as presented, with the exception of pagination.
6 IEEE TRANSACTIONS ON INSTRUMENTATION AND MEASUREMENT
Fig. 7. Process of detecting defects in the annular texture region. (a) Annulartexture region. (b) Projection profile, the corresponding mean filtering andthe local maximum of the mean filtering signal. The location of the localmaximum of the mean filtering projection profile is marked by the blue “∇ .”(c) y-coordinate localization of each regular texture. The green line denotes thelocation of the local maximum of the mean filtering projection profile, whichis generally the y-coordinate central line of both adjacent regular textures.(d) Rectangular image of the annular texture region. (e) Texture regions usedfor generating the template of the texture region. The objective regular textureregions are marked by the white numbers. (f) Enlarged figures of the objectivetextures for generating the template. (g) Average template of the texture region.(h) Rectangular image of annular texture region and template matching.(i) Correlation coefficient and the multiscale filtering result. (j) Defectdetection result in the annular texture region.
frequency is typically very low. Consider that the template isthe average appearance of many defect-free texture regions,it is named average template, which always takes the samesize as the matched subimage in the rectangular image duringmatching or correlation measurement.
3) Template Matching and Defect Recognition: The over-all process of template matching and defect recognition is
illustrated in Fig. 7(h)–(j). First, the correlation coefficientdenoted by R(x, y), as shown by the red curve in Fig. 7(i),between the average template and the rectangular image is cal-culated from the equation (2): where TW and TH , respectively,represent the width and the height of the average template.IW and IH are the width and the height of the rectangularimage, IH = TH . IAT (x, y) and T (i, j) denote a pixel in therectangular and template images, respectively. The coordinatesof the former are x and y, and those of the latter are i andj . T and I AT (x, y) are the average values of the templateand subimage of the rectangular image, where the coordinatesof the center of the latter are x and y. Both of them aregiven as
T = 1
TH TW
TH∑
i=1
TW∑
j=1
T (i, j) (3)
I AT (x, y) = 1
TH TW
TH∑
i=1
TW∑
j=1
IAT (x + i, y + j) (4)
where x and y in (2), as shown at the bottom of the nextpage and (4) are a constant and a variable, respectively,x = (IH + 1)/2, and y ∈ [(TW − 1)/2, IW − TW + 1]. Theprocess of template matching is similar to a kernel filter. Thedifference is that the template slides only along the centralline of the rectangular image. As shown in Fig. 7(h) and (i),a defect generally appears as a valley on the correspondingcorrelation coefficient signal. However, the local variationcaused by defects on the correlation coefficient curve maynot be obvious and may contain noise. Hence, R(x, y) is fedinto an approach, which combines a multiscale mean filteringalgorithm with the traditional valley detection method [47]to further highlight defective areas. For the multiscale meanfiltering algorithm, the 1-D correlation coefficient signal isfirst filtered by mean filtering with different scales of filteringmasks. Then, the maximum response under all scales istaken as the final filtering output. After this process, defectsgenerally appear as the obvious valleys on the filtered signal,as shown by the green curve in Fig. 7(i). Finally, a thresholdTcc, as shown by the blue line in Fig. 7(i), is adopted todiscriminate desired defects from noisy interference. The partswhose values are lower than Tcc are considered as the realdefective segments, as shown in Fig. 7(j).
C. Defect Detection in Annular Panel Region
In Fig. 8, the full flowchart of defect detection for theannular panel region is presented. The proposed method iscalled MMF for short because it based on multiscale meanfiltering.
1) Projection and Multiscale Mean Filtering: The projec-tion profile of the annular panel region, S(y), is calculatedby
S(y) = 1
l(y)
l(y)∑
x=1
IAP (x, y) (5)

This article has been accepted for inclusion in a future issue of this journal. Content is final as presented, with the exception of pagination.
ZHOU et al.: AUTOMATED VISUAL INSPECTION OF GLASS BOTTLE BOTTOM WITH SALIENCY DETECTION AND TEMPLATE MATCHING 7
Fig. 8. Flowchart of defect detection for the annular panel region.(a) Annular panel region IAP (x, y), where the white rectangular regions inthe left and right of the image are normal and defective regions, respectively.(b) Projection profile S(y). (c) Mean filtering masks with different scalesW (y, bi ). (d) Mean filtering results with different scale masks F(y, bi ).(e) D(y, bi ), the differences between S(y) and F(y, bi ). (f) R(y), the maximaof the mean filtering results with multiscale masks. (g) Defect detection resultin the annular panel region.
where IAP(x, y) denotes the annular panel region subimageand l(y) is computed by
l(y) = f (y) − TH − 1
2− 1 (6)
where TH denotes the height of the average template and it isan odd number. The input annular panel region is illustratedin Fig. 8(a), the corresponding 1-D signal projection profileS(y), as shown in Fig. 8(b), has considerable noise, andthe grayscale values of defects and background often changeremarkably in different locations. In addition, defects alwaysclearly appear in the local region. The sizes of defects aregenerally very small compared with that of the background.To suppress noise, S(y) is fed into the mean filtering as
F(y, b) = S(y) ∗ W (y, b) =b∑
t=1
S(y + t)W (t, b) (7)
where “*” denotes the convolution operation, and W (y, b) isa general mean filter mask with one row and b columns, that
is,
W (y, b) = 1
b[1, 1, . . . , 1] (8)
with the mask width b as the scale parameter, i.e., the scalesand mask widths are one-to-one correspondence.
2) Differences Between Projection Profile and FilteringResults: We make defects more noticeable by calculating
D(y, b) = |F(y, b) − S(y)|. (9)
3) Obtain Maxima and Defect Recognition: To makedefects with different sizes more noticeable, we set b withdifferent values and calculate the maximum response underall these scales, i.e., b = {b1, b2, . . . , bK }, K denotes thenumber of different scales of the filter mask, whose value isempirically configured. The values of b are set evenly betweenSDmin and SDmax, which are the minimal and maximal scales ofall possible defects, respectively. They satisfy the requirementthat bk+1 − bk = (SDmax − SDmin)/(K − 1), b1 = SDmin, andbK = SDmax , where SDmin and SDmax are set by the priorknowledge of defects. We compute the final result by
R(y) = arg maxSDmin≤bi≤SDmax
{D(y, bi )}. (10)
For example, when we set K = 4, SDmin = 3, and SDmax = 21.The widths of the mask are b1 = 3, b2 = 9, b3 = 15, andb4 = 21, the masks with different scales are shown in Fig. 8(c).
For the defective and normal regions, the mean filteringresults obtained by different scale filters are quite different,as shown in Fig. 8(d). Similarly, R(y) generally has a largevalue at the defective region. Conversely, the values of R(y)are especially small in the normal region, as revealed inFig. 8(e). Hence, the maxima of filtering results with differentscales are selected for distinguishing the normal and defectiveregions, as shown in Fig. 8(f). Finally, the parts with R(y) >Tmf are regarded as the desired defective regions, as shownin Fig. 8(g).
D. Defect Detection in Central Panel Region
Many foreign objects may exist in the central panel region.The sizes and shapes of foreign objects are distinct fromeach other, and the position is unknown. Fortunately, thereis a common property in that they often cover a small closedarea with a local homogeneous gray-level distinct from mostof the background region. Meanwhile, defects are typicallyconsidered as rare phenomena compared with normal regions.Hence, defective regions will potentially attract the visualattention of the surveyor [48]. Based on this, we proposedtwo new saliency detection methods for detecting defects inthe central panel region. One method, named region growinggeodesic saliency (RGGS), is an improved geodesic saliencydetection algorithm that combines a redefined region growingalgorithm with geodesic distance transform. The other, called
R(x, y) = (IAT (i + x, j + y) − I AT (x, y))(T (i, j) − T )√∑THi=1
∑TWj=1 (IAT (i + x, j + y) − I AT (x, y))2
∑THi=1
∑TWj=1 (T (i, j) − T )2
(2)
This article has been accepted for inclusion in a future issue of this journal. Content is final as presented, with the exception of pagination.
8 IEEE TRANSACTIONS ON INSTRUMENTATION AND MEASUREMENT
Fig. 9. Pipelines of the original geodesic saliency detection and our improvedmethod. (a) Original geodesic saliency detection algorithm. (b) Undirectedweighted graph structure of the original geodesic saliency detection. (c) Ourimproved method.
region growing Euclidean saliency (RGES), replaces the geo-desic distance with Euclidean distance to further accelerate theformer.
In the original geodesic saliency detection algorithm [49],the flowchart is mainly composed of two steps: obtainingpatches by simple linear iterative clustering (SLIC) [50] or rec-tangular image patches and computing the saliency value bythe geodesic distance transform, as shown in Fig. 9(a), whichis usually used for salient object segmentation in color images.The basic idea of the geodesic distance transform with rectan-gular patches is given as follows. For an image, an undirectedweighted graph is constructed, G = {V , E}. The verticescontain all image patches {Pi } and a virtual background nodeB, V = {Pi } ∪ {B}. There are two types of edges: internaledges that connect all adjacent internal patches and boundaryedges that connect image boundary patches to the backgroundnode. E = {(Pi , Pj )|Pi is adjacent to Pj }∪{(Pi , B)|Pi is onthe image boundary}, as shown in Fig. 9(b), where the greenbottle in the center of the image is the salient object that needsto be extracted. Patches with red and white boundaries areboundary and internal patches, respectively. The white spheredenotes the virtual background node B , which is connected toall boundary patches. The geodesic saliency of a patch P isthe accumulated edge weights along the shortest path from Pto background node B on the graph G
S(P) = minn−1∑
i=1
d(P ′
i , P ′i+1
)(11)
such that P ′i ∈ {Pi }, (P ′
i , P ′i+1) ∈ {E} and consider that P ′
1 =P , P ′
n is just B , and P ′i is adjacent to P ′
i+1.Wei et al. [49] presented two different methods, including
rectangular image patches of 10 × 10 pixels and irregularsuperpixels obtained by the SLIC algorithm [50] as imagepatches in order to obtain image patches. The former namedGS_GD is faster, and the latter called GS_SP is more accurate.
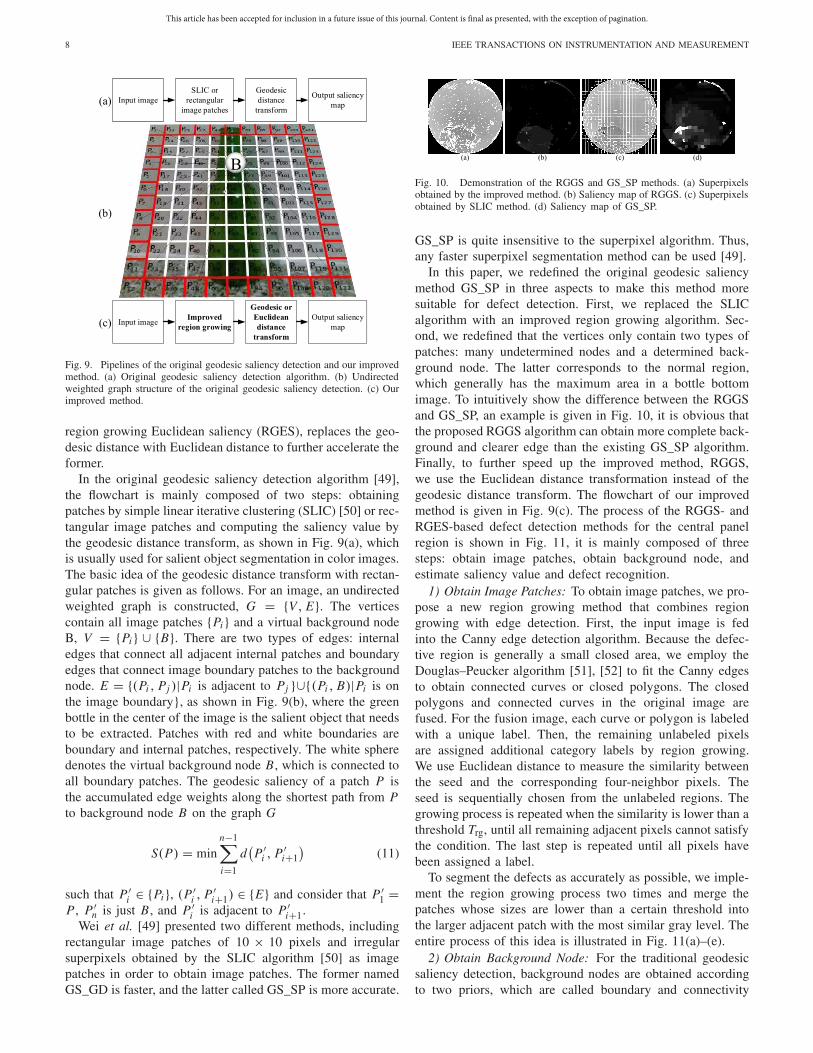
Fig. 10. Demonstration of the RGGS and GS_SP methods. (a) Superpixelsobtained by the improved method. (b) Saliency map of RGGS. (c) Superpixelsobtained by SLIC method. (d) Saliency map of GS_SP.
GS_SP is quite insensitive to the superpixel algorithm. Thus,any faster superpixel segmentation method can be used [49].
In this paper, we redefined the original geodesic saliencymethod GS_SP in three aspects to make this method moresuitable for defect detection. First, we replaced the SLICalgorithm with an improved region growing algorithm. Sec-ond, we redefined that the vertices only contain two types ofpatches: many undetermined nodes and a determined back-ground node. The latter corresponds to the normal region,which generally has the maximum area in a bottle bottomimage. To intuitively show the difference between the RGGSand GS_SP, an example is given in Fig. 10, it is obvious thatthe proposed RGGS algorithm can obtain more complete back-ground and clearer edge than the existing GS_SP algorithm.Finally, to further speed up the improved method, RGGS,we use the Euclidean distance transformation instead of thegeodesic distance transform. The flowchart of our improvedmethod is given in Fig. 9(c). The process of the RGGS- andRGES-based defect detection methods for the central panelregion is shown in Fig. 11, it is mainly composed of threesteps: obtain image patches, obtain background node, andestimate saliency value and defect recognition.
1) Obtain Image Patches: To obtain image patches, we pro-pose a new region growing method that combines regiongrowing with edge detection. First, the input image is fedinto the Canny edge detection algorithm. Because the defec-tive region is generally a small closed area, we employ theDouglas–Peucker algorithm [51], [52] to fit the Canny edgesto obtain connected curves or closed polygons. The closedpolygons and connected curves in the original image arefused. For the fusion image, each curve or polygon is labeledwith a unique label. Then, the remaining unlabeled pixelsare assigned additional category labels by region growing.We use Euclidean distance to measure the similarity betweenthe seed and the corresponding four-neighbor pixels. Theseed is sequentially chosen from the unlabeled regions. Thegrowing process is repeated when the similarity is lower than athreshold Trg, until all remaining adjacent pixels cannot satisfythe condition. The last step is repeated until all pixels havebeen assigned a label.
To segment the defects as accurately as possible, we imple-ment the region growing process two times and merge thepatches whose sizes are lower than a certain threshold intothe larger adjacent patch with the most similar gray level. Theentire process of this idea is illustrated in Fig. 11(a)–(e).
2) Obtain Background Node: For the traditional geodesicsaliency detection, background nodes are obtained accordingto two priors, which are called boundary and connectivity

This article has been accepted for inclusion in a future issue of this journal. Content is final as presented, with the exception of pagination.
ZHOU et al.: AUTOMATED VISUAL INSPECTION OF GLASS BOTTLE BOTTOM WITH SALIENCY DETECTION AND TEMPLATE MATCHING 9
Fig. 11. Process of defect detection in the central panel region. (a) Cannyedges. (b) Polygons. (c) Region growing. (d) Region growing iteration.(e) Small area fusion. (f) Background node. The patch with red boundariesis the determined background node whose area is a maximum, and the otherpatches with red and white boundaries are undetermined nodes. (g) RGGS.(h) Defects obtained by RGGS map. (i) RGES. (j) Defects obtained by RGESmap.
priors [49]. The former prior indicates that the image bound-ary is mostly background. The latter prior indicates thatbackground regions are generally large and homogeneous.However, in this paper, we use only the connectivity priorbecause defects may appear on the boundary. The imagepatch whose size is the largest one is taken as the determinedbackground node. {Pi } is an image patch, and assume that PB
denotes the determined background node. PB belongs to {Pi }|PB | = max{|Pi |} (12)
where |PB | and |Pi | denote the areas of PB and Pi , respec-tively. The central panel region, as shown in Fig. 6(b), is takenas an example, the patches obtained by the proposed methodare shown in Fig. 11(f).
3) Estimate Saliency Value and Defect Recognition: Con-sider that the distance between the defective region and thenormal region is relatively large. In contrast to the originalgeodesic saliency, the geodesic saliency value is the lengthof the shortest path to a virtual background node. In thispaper, we take the length of the shortest path to the determinedbackground node PB as the geodesic saliency value
S(P) = min
(n−2∑
i=1
(P ′
i , P ′i+1
) + d(P ′
n−1, PB))
(13)
such that P ′i ∈ {Pi }, (P ′
i , P ′i+1) ∈ {E}. Consider that P ′
1 =P , and P ′
i is adjacent to P ′i+1. S(P) and d(P ′
i , P ′i+1) denote
the saliency value of the node P and the Euclidean distancebetween both adjacent nodes P ′
i and P ′i+1, respectively. Note
that we calculate the shortest paths of all image patches byDijkstra’s algorithm [53] for better accuracy.
Fig. 12. Developed visual inspection machine for bottle bottom inspection.(a) Front view of the real system. (b) Side view of the real system.
To further accelerate the proposed saliency detection,we compute the Euclidean distance between the undeterminednodes and the determined background node rather than calcu-lating the geodesic distance between the undetermined nodesand the determined background node, i.e., the saliency valueof Pi can be given as
S(Pi ) = d(Pi , PB). (14)
The saliency maps of RGGS and RGES are presentedin Fig. 11(g) and (i), respectively. It is obvious that the saliencyvalues of the defective regions are typically clearly greaterthan those of normal areas. Thus, a simple threshold methodis sufficient to extract defects. In this paper, we define thatthose regions whose saliency values and areas are greater thanthe thresholds Tsm and Tarea, respectively, are taken as thereal defects. The final results obtained by utilizing the defectrecognition rules on the RGGS and RGES saliency maps areshown in Fig. 11(h) and (j), respectively.
IV. EXPERIMENTS
In this section, the defect detection algorithms are testedon bottle bottom images whose resolution and gray levels are648×483 and 256. First, we construct three glass bottle bottomdatabases for our statistical analysis. All images in thesedatabases are acquired with our apparatus. The photograph ofour developed system is shown in Fig. 12. The first databaseincluding 253 normal images and 977 typical defect imagesis applied to validate our framework, where there are 372,602, and 702 defect-free region subimages of the centralpanel, annular panel, and annular texture region, respectively.The second database including the 29 bottle bottom images isused for methods comparison and parameter sensitivity analy-sis. The other database including 11 images, which are selectedfrom the 29 bottle bottom images, is used to analyze theperformance of the localization method. Then, experiments areperformed on these three data sets for evaluating the parametersensitivity and performances of the ROI localization and defectdetection. Experiments are conducted on a computer equippedwith an Intel(R) Core(TM) i5-4210U (1.7–2.4 GHz) and 6 GBof memory. The program is implemented in Visual C++. Theoriginal images and all experimental results are available.1
1https://pan.baidu.com/s/1AUesUSinEq8N2C0O5zaY8w, download code:4mq8

This article has been accepted for inclusion in a future issue of this journal. Content is final as presented, with the exception of pagination.
10 IEEE TRANSACTIONS ON INSTRUMENTATION AND MEASUREMENT
A. Measures
To evaluate the performance of the proposed localizationmethod, the center deviation EX , EY , and radius mismatchER are defined as
EX = |X F − X M | (15)
EY = |YF − YM | (16)
ER = |RF − RM | (17)
where X M , YM , and RM are obtained by manual calibration,while X F , YF , and RF are the results of the localizationalgorithm. | ∗ | denotes the absolute operation.
To evaluate the defect detection performance, we applyfive other measures, including precision (Pr ), recall (Re),F-Measure (Fβ ), accuracy (Ac), and false detection rate (Fd ),which are, respectively, given as
Pr = TP
TP + FP(18)
Re = TP
TP + FN(19)
Fβ = (1 + β2)Pr Re
β2 Pr + Re(20)
Ac = TP + TN
TP + TN + FP + FN(21)
Fd = FP
TP + TN + FP + FN(22)
where true positive (TP), true negative (TN), false posi-tive (FP), and false negative (FN) correspond to the counts ofdefective unqualified, defect-free qualified, defect-free unqual-ified, and defective qualified, respectively. β is a weightparameter for Pr and Re. It is set to one in this paper. Ac isthe proportion of correct inspection results. Pr and Re denotethe rates of the correctly detected unqualified products in thetotal defective and unqualified bottoms, respectively. Exceptthe last measure, Fd , the larger the values of these measuresare, the better is the performance of the method.
B. Parameter Sensitivity Analysis
The proposed framework mainly includes five key parame-ters: Trg, Tsm, Tarea, Tcc, and Tmf. The first three ones belongto the RGGS- and RGES-based defect detection methods,whereas Tcc and Tmf belong to the TM- and MMF-baseddefect detection methods for the annular texture and annularpanel regions, respectively. Consider that we adopt differentalgorithms on three measurement regions, the parameter sensi-tivity is calculated on the separate measurement region beforefusion. All parameters except Trg are selected by maximizingtheir corresponding Fβ . When the value of one parameter ischosen from a range, those of the others remain unchanged.A total of 29 images whose defective regions have beenmarked manually are used for analyzing the sensitivity of theparameters. Measures are calculated by taking each defectiveregion as the basic unit. In the following, we successivelyanalyze the sensitivities of Tcc of TM, Tmf of MMF, and Trg,Tsm, and Tarea of RGES.
To verify the sensitivities of Tmf and Tcc, the values of Pr ,Re, and Fβ are calculated on the annular panel and texture
Fig. 13. Measures when Tcc and Tmf change. (a)Curves of Pr , Re , and Fβwhen Tcc varies from −50 to −15 with step 5. (b) Curves of Pr , Re, and Fβwhen Tmf varies from 2 to 6 with step 1.
Fig. 14. Measures when Trg, Tsm, and Tarea change. (a) Curves of Pr , Re ,and Fβ when Trg ranges from 4 to 20 with step 4. (b) Curves of Pr , Re, andFβ when Tsm ranges from 5 to 25 with step 5. (c) Curves of Pr , Re , and Fβwhen Tarea ranges from 2 to 18 with step 4.
regions of 29 testing images, respectively. As shown in Fig. 13,it is clear that when Tmf and Tcc are set to the proper values,the corresponding values of Fβ can achieve the greatest onesvalues, i.e., Tm f = 3 and Tcc = −30.
To verify the sensitivities of Trg, Tsm, and Tarea, the valuesof all measures are computed on the central panel regionof 29 testing images, and the results are given in Fig. 14. Trg isthe only parameter in the process of obtaining patches for thepanel region. A good parameter setting of Trg can ensure thatthe defective regions are divided singly as much as possible,while Re can measure this ability. Hence, we use Re to verifythe performance of the region growing for defect detection.Re is inversely proportional to Trg. It is a sensible decisionthat we set Trg = 4 for all cases. Tsm and Tarea are parametersof defect recognition in the central panel region. The largerthe values of Tsm and Tarea are, the smaller is the value ofRe. These phenomena occur because the saliency values andarea values of the defective region are typically larger than thecorresponding thresholds.
C. Method Validation
To evaluate the performance of our framework on the entirebottle bottom, the first data sets including 1230 bottle bottomimages in total are used for testing. The key parameters are

This article has been accepted for inclusion in a future issue of this journal. Content is final as presented, with the exception of pagination.
ZHOU et al.: AUTOMATED VISUAL INSPECTION OF GLASS BOTTLE BOTTOM WITH SALIENCY DETECTION AND TEMPLATE MATCHING 11
TABLE I
QUANTITATIVE INDICES OF THE PROPOSED FRAMEWORK FOR DEFECTDETECTION. THE BOLDED VALUES DENOTE THE BEST RESULTS
TABLE II
PARAMETER SETTINGS OF OUR FRAMEWORK FOR DETECTING DEFECTS
OF THREE DIFFERENT TYPES OF BOTTLE BOTTOMS
Fig. 15. Defect detection results of three different types of bottle bottoms.
configured as Tcc = −35, Tmf = 12, Trg = 16, Tsm = 30,and Tarea = 6. The defect detection performances are verifiedusing the obtained data, the quantitative indices are listedin Table I. Obviously, the false detection rate appears lowon all the bottom regions. An exception is with the annulartexture region, where the Fd index takes a comparativelyhigh value due to the complex background and structures.Generally, the proposed framework performs well on the goodbottle samples with a moderately low over inspection rate(i.e., Fd ). Moreover, the total precision and false detectionrate are almost equal to the corresponding best results ofthese three measurement regions. This phenomenon may occurbecause for the final results, the FP errors increase if the testedbottle bottom is qualified, while the FN errors are accumulatedwhen the defects are in only one region of the three regions.Otherwise, the errors are eliminated.
To validate the conclusion that the proposed frameworkcan be used for many types of bottle bottoms, we test ourframework with three different types of bottle bottoms, whichhave large differences in the texture structure. The parametersettings are given in Table II. Defect detection results are givenin Fig. 15. It is obvious that defects in the three bottom imagescan be detected accurately by changing parameter settings,although the types of bottle bottoms are different.
D. Quantitative Analysis and Comparison
There are four parts addressing the overall bottom inspectionissue. Some steps of the proposed pipeline can be replacedwith other methods. In this section, we compare the methodsof the proposed framework with other existing approaches,but only on separate steps. For the panel regions, we compare
our methods with AD [34], GTS [54], and ATS [54]. For thetexture region, we compare the proposed template-matching-based method (TM) with the DFT-based method [24]. A briefintroduction about these comparison methods is given asfollows.
1) AD: He et al. [34] presented an inverse P–M diffu-sion model for rail surface defect image enhancementinspired by Tsai’s method [32]. It is mainly composedof four steps: nonlinear diffusion, difference operation,threshold binarization, and noise removal. There arethree parameters: k, λ, and Niter, where k is a constantand acts as an edge strength threshold, λ is a weightingparameter and Niter denotes the number of iterations.Consider that the features of a rail surface image aresimilar to those of the panel region of bottle bottomimage, we compare AD with our method.
2) GTS and ATS: Image thresholding enjoys a centralposition in all types of image segmentation applicationsbecause of its implementation simplicity and computa-tional speed [54]. Basic global thresholding and adaptivethresholding using Otsu’s method [55] are two of themost popular thresholding methods. The former has onlyone parameter TGTS, which needs to be set manually.The latter is parameter-free. They have been applied toabstract features or to acquire the connected domainfor detecting bottle bottom defects [4], [25]. In thispaper, the central panel region of the bottle bottomimage is first divided into many parts by thresholding.Then, connected domain analysis is employed on thesegmentation results to obtain all suspected defects.Finally, the desired defects are distinguished accordingto the area and grayscale values of each connectedregion.
3) DFT: DFT is the most important discrete transform usedto perform Fourier analysis in many practical applica-tions [56]. It converts a finite sequence of equally spacedsamples of a function into the same-length sequenceof equally spaced samples of the discrete-time Fouriertransform. Some researchers have found that there isa definite relationship between the regularity of textureand the Fourier spectrum. In addition, the 2-D DFT canbe used to remove the regular texturing of a bottle bot-tom image [24]. The DFT-based method mainly consistsof four parts: DFT, low-pass filtering in the frequencydomain, inverse DFT, and ATS. It is also a parameter-free method.
To compare the performance of the above conventionalapproaches and our methods, first, we accurately mark alldefective regions for 29 tested bottle bottom images, whichare sufficient to evaluate the performances of methods becausethere are up to 458, 341, and 147 defective areas in thecentral panel, annular panel, and annular texture regions,respectively. Second, we calculate the precision, recall, andF-Measure by taking each detected defective region and thetrue defective region as the basic unit. Moreover, we obtainthe time consumption (Tcs) of each comparison approach.
1) Circle Detection for ROI Localization: To analyze theperformance of the ROI location method, the boundaries of

This article has been accepted for inclusion in a future issue of this journal. Content is final as presented, with the exception of pagination.
12 IEEE TRANSACTIONS ON INSTRUMENTATION AND MEASUREMENT
TABLE III
ERRORS OF THE LOCALIZATION RESULTS OF THE 11 TESTING IMAGESBY THE PROPOSED LOCATION METHOD. THE 13th ROW MARKED AS
“MEAN” IS THE AVERAGE VALUE OF THE
CORRESPONDING RESULT
ROI regions of 11 bottle bottom images are first markedmanually. Then, the center and radius, which are denoted byX M , YM , and RM , respectively, are obtained by the traditionalHough transform circle detection algorithm [45].
Finally, the 21HT algorithm is verified on the 11 calibratedimages. The errors of the localization results are shownin Table III. The mean value of EX is slightly lower than thatof EY because the testing bottle is clamped by two conveyors,as shown in Fig. 1(a), which can suppress the bottle shiftingin the x-direction. The average value of ER is also small,lower than four pixels, because the difference in size betweenthe two bottles that belong to the same bottle type is verysmall. In addition, the size is fixed and cannot be affected byadditional factors.
2) Annular Texture Region Defect Detection and Analysis:a) Parameters setting and testing results: For each
method, we employ a parameter setting method that is similarto parameter sensitivity analysis to evaluate the performanceand set the optimal parameters. For TM, we set Tcc = −30.29 annular texture subimages are the inputs to TM and DFT fortesting. The statistical results and some typical visual resultsare shown in Table IV and Fig. 16, respectively.
b) Results analysis: As shown in Table IV, we can easilyfind that the comprehensive performance of TM is better thanthat of DFT. In Fig. 16, we can also discover that small sizelow-contrast defects locating at the boundary of the textureregion can be detected by the proposed TM method, as shownin Fig. 16(b), whereas DFT cannot detect these defects. Whena defect with a small size exists in the center of the textureregion, it is difficult to be detected correctly by TM and DFT,as shown in Fig. 16(c) and (d). This is a drawback of thetwo methods. Note that the values of Pr , Re, and Fβ of thesemethods are not very high because there are many disputedregions that are falsely marked by the normal or defectiveflag, for instance, even many large and low-contrast defectsmay also be falsely marked, as shown in Fig. 16(c) and (d).However, these values still have some reference significancefor comparing different methods.
3) Annular Panel Region Defect Detection and Analysis:a) Parameters setting and testing results: For MMF
and GTS, we set Tmf = 2.3 and TGTS = 140. For AD,
TABLE IV
QUANTITATIVE INDICES FOR DEFECT DETECTION IN THE ANNULARTEXTURE REGION. NOTE THAT WE TAKE EACH TESTING SUBIMAGE
AS A BASIC UNIT TO COMPUTE THE MEASURE Ac . FOR EXAMPLE,FOR TM, Ac = 27/29 DENOTES THAT 27 SUBIMAGES ARE
CORRECTLY DETECTED. THE BOLDED VALUESDENOTE THE BEST RESULTS
Fig. 16. Visual comparison results of defect detection in the annular textureregion using different methods. (a)–(d) Defect detection results for the annulartexture region of four bottom images. The first to third rows of each figure arethe ground truth, the results of TM and DFT, respectively.
TABLE V
QUANTITATIVE INDICES FOR DEFECT DETECTION INTHE ANNULAR PANEL REGION
k = 100, λ = 1/2, and Niter = 2. 29 annular panel subimagesare used as inputs of four comparison methods for testing.The statistical results and typical visual results are shownin Table V and Fig. 17, respectively.
b) Results analysis: As observed in Table V, it is clearthat MMF can achieve the best performance compared with theother three methods in terms of precision, recall, F-Measure,and accuracy. Moreover, MMF is also the fastest methodamong the compared approaches. The main advantage is thatmany low-contrast defects can be detected by the proposedMMF because the contrast between saliency regions and thebackground region was enhanced by the multiscale meanfiltering algorithm.
4) Central Panel Region Defect Detection and Analysis:a) Parameter settings and testing results: For RGGS,
parameter settings are Trg = 4, Tsm = 10, and Tarea = 6.

This article has been accepted for inclusion in a future issue of this journal. Content is final as presented, with the exception of pagination.
ZHOU et al.: AUTOMATED VISUAL INSPECTION OF GLASS BOTTLE BOTTOM WITH SALIENCY DETECTION AND TEMPLATE MATCHING 13
Fig. 17. Visual comparison results of defect detection in the annular panelregion using different methods. (a)–(d) Defect detection results for the annularpanel region of four bottom images. The first to fifth rows of each figure arethe ground truth, the results of MMF, AD, ATS, and GTS, respectively.
TABLE VI
QUANTITATIVE INDICES FOR DEFECT DETECTION IN
THE CENTRAL PANEL REGION
For RGES, Tarea = 4, and the other parameters are same asthose for RGGS. The parameter settings of AD in this test arethe same as the defect detection test in annular panel region.For GTS, TGTS = 150. 29 central panel region subimages areused for testing. The statistical results are shown in Table VI,and some typical visual results are presented in Fig. 18.
b) Results analysis: The F-Measure, accuracy, and recallof RGES and RGGS have achieved the highest level amongthe considered methods. Meanwhile, precision has a high level.Furthermore, as observed in Fig. 18, our method has twomerits over the comparative approaches: first, the proposedmethod can detect small and low-contrast defects accuratelysince we have used the improved saliency detection algorithm
Fig. 18. Visual comparison results of defect detection in the centralpanel region using different methods. (a)–(d) Defect detection results for thecentral panel region of four bottom images. The first to sixth rows of eachfigure are the ground truth, the results of RGGS, RGES, AD, ATS, and GTS,respectively.
to increase the contrast between suspected defects and thebackground region. Second, the proposed method can obtainaccurate boundaries of defective regions, even for thoseobscure defects, because we have combined region growingwith the Canny algorithm, which can precisely detect defectedges.
V. CONCLUSION
In this paper, we have presented a machine vision apparatusfor real-time bottle bottom inspection with improved saliencydetection and template matching algorithms. First, the bottomis located by 21HT with the shape prior constraint, and it isdivided into three parts: central panel region, annular panelregion, and annular texture region, for defect detection. Then,separate algorithms are proposed for different measurementregions. We improved the geodesic saliency detection fordetecting defects in the central panel region. We employedmultiscale mean filtering to inspect defects in the annular panelregion. In the annular texture region, we combined templatematching with multiscale mean filtering for defect detection.Finally, we used images obtained with our designed systemto perform many experiments. The results revealed that themajority of defects with a small size and low contrast can

This article has been accepted for inclusion in a future issue of this journal. Content is final as presented, with the exception of pagination.
14 IEEE TRANSACTIONS ON INSTRUMENTATION AND MEASUREMENT
be inspected correctly. For the three measurement regions,the proposed algorithms can achieve the highest F-Measure,accuracy, and recall while having a high level of precisioncompared with other methods, where the precision of TM,MMF, and RGES are 88.83%, 75.95%, and 41.03%, respec-tively. For the first two methods, the precision increased by7.88% and 30.12%, respectively. The precision of the lastmethod is slightly lower than that of ATS, but the recall,F-measure, and accuracy of RGES are obviously better thanthose of the other existing methods. Moreover, the proposedmethods are robust to pixel value fluctuations. There are stillsome defects that cannot be correctly detected, particularlydefects with a small size in the texture region. In the future,we plan to combine the proposed strategy with machinelearning methods to further improve the precision of defectdetection.
ACKNOWLEDGMENT
The authors would like to thank Guangzhou VANTA Pack-ing Machinery Technology Company Ltd., Guangdong, China,for their joint development of the inspection machine. Theywould also like to thank the editors and anonymous reviewersfor their help in improving this paper.
REFERENCES
[1] H. Liu, Y. Wang, and F. Duan, “An empty bottle intelligent inspectorbased on support vector machines and fuzzy theory,” in Proc. 6th WorldCongr. Intell. Control Automat., Jun. 2006, pp. 9739–9743.
[2] Y. Yoshino, “Plastic pressure bottle,” U.S. Patent 4 254 882 A,Mar. 10, 1981.
[3] H. Yoshida, “Bottle bottom inspection apparatus,” U.S. Patent 4 943 713A, Jul. 24, 1990.
[4] F. Duan, Y.-N. Wang, H.-J. Liu, and Y.-G. Li, “A machine visioninspector for beer bottle,” Eng. Appl. Artif. Intell., vol. 20, no. 7,pp. 1013–1021, Oct. 2007.
[5] R. T. Chin and C. A. Harlow, “Automated visual inspection: A sur-vey,” IEEE Trans. Pattern Anal. Mach. Intell., vol. PAMI-4, no. 6,pp. 557–573, Nov. 1982.
[6] Y. Wang, J. Ge, H. Zhang, and B. Zhou, “Intelligent injection liquidparticle inspection machine based on two-dimensional Tsallis entropywith modified pulse-coupled neural networks,” Eng. Appl. Artif. Intell.,vol. 24, no. 4, pp. 625–637, Jun. 2011.
[7] H. Zhang et al., “Automated machine vision system for liquid particleinspection of pharmaceutical injection,” IEEE Trans. Instrum. Meas.,vol. 67, no. 6, pp. 1278–1297, Jun. 2018.
[8] T. Chen, Y. Wang, C. Xiao, and Q. M. J. Wu, “A machine visionapparatus and method for can-end inspection,” IEEE Trans. Instrum.Meas., vol. 65, no. 9, pp. 2055–2066, Sep. 2016.
[9] J. Killing, B. W. Surgenor, and C. K. Mechefske, “A machine visionsystem for the detection of missing fasteners on steel stampings,” Int.J. Adv. Manuf. Technol., vol. 41, nos. 7–8, p. 808, Apr. 2009.
[10] T. Chen, Y. Wang, and C. Xiao, “An apparatus and method for real-timestacked sheets counting with line-scan cameras,” IEEE Trans. Instrum.Meas., vol. 64, no. 7, pp. 1876–1884, Jul. 2015.
[11] Y. Li, Y. F. Li, Q. L. Wang, D. Xu, and M. Tan, “Measurement anddefect detection of the weld bead based on online vision inspection,”IEEE Trans. Instrum. Meas., vol. 59, no. 7, pp. 1841–1849, Jul. 2010.
[12] W. C. Li and D. M. Tsai, “Defect inspection in low-contrast LCD imagesusing Hough transform-based nonstationary line detection,” IEEE Trans.Ind. Informat., vol. 7, no. 1, pp. 136–147, Feb. 2011.
[13] S. Ghorai, A. Mukherjee, M. Gangadaran, and P. K. Dutta, “Automaticdefect detection on hot-rolled flat steel products,” IEEE Trans. Instrum.Meas., vol. 62, no. 3, pp. 612–621, Mar. 2013.
[14] C. S. Nandi, B. Tudu, and C. Koley, “A machine vision-based maturityprediction system for sorting of harvested mangoes,” IEEE Trans.Instrum. Meas., vol. 63, no. 7, pp. 1722–1730, Jul. 2014.
[15] R. G. Lins and S. N. Givigi, “Automatic crack detection and measure-ment based on image analysis,” IEEE Trans. Instrum. Meas., vol. 65,no. 3, pp. 583–590, Mar. 2016.
[16] R. Shanmugamani, M. Sadique, and B. Ramamoorthy, “Detection andclassification of surface defects of gun barrels using computer visionand machine learning,” Measurement, vol. 60, pp. 222–230, Jan. 2015.
[17] H. Zhang, X. Jin, Q. M. J. Wu, Y. Wang, Z. He, and Y. Yang, “Automaticvisual detection system of railway surface defects with curvature filterand improved Gaussian mixture model,” IEEE Trans. Instrum. Meas.,vol. 67, no. 7, pp. 1593–1608, Jul. 2018.
[18] L. B. Baldwin, “Device for optimally illuminate bottles for bottominspection,” U.S. Patent 5 436 722 A, Jul. 25, 1995.
[19] B. L. Hall and L. B. Baldwin, “Machine for inspecting the bottom ofglass containers,” U.S. Patent, 5 349 435 A Sep. 20, 1994.
[20] Heuft Corp. (2013). Heuft Inline Covering Everything: ContinuousEmpty Bottle Inspection. [Online]. Available: https://heuft.com/en/product/beverage/empty-containers/empty-bottle-ins%pection-heuft-inline
[21] Krones Corp. (2016). The Latest Generation Of Thoroughness: SmartAnd Reliable Inspection Of Empty Containers. [Online]. Available:https://www.krones.com/en/products/machines/linatronic-735-empty-bottle%-inspector.php
[22] F. Shafait, S. M. Imran, and S. Klette-Matzat, “Fault detection andlocalization in empty water bottles through machine vision,” in Proc.E-Tech, Jul. 2004, pp. 30–34.
[23] S. Ma, B. Huang, H. Wang, and J. Guo, “Algorithm research onlocation of bottle mouth and bottom in intelligent empty bottle inspectionsystem,” in Proc. IEEE Int. Conf. Automat. Logistics, Aug. 2009,pp. 819–824.
[24] B. Huang, S. Ma, Y. Lv, H. Zhang, C. Liu, and H. Wang, “Researchon bottom detection in intelligent empty bottle inspection system,”Indonesian J. Elect. Eng. Comput. Sci., vol. 11, no. 10, pp. 5571–5578,Oct. 2013.
[25] B. Huang et al., “Research and implementation of machine visiontechnologies for empty bottle inspection systems,” Eng. Sci. Technol.Int. J., vol. 21, no. 1, pp. 159–169, Feb. 2018.
[26] Z. F. Yang and J. Y. Bai, “Vial bottle mouth defect detection based onmachine vision,” in Proc. IEEE Int. Conf. Inf. Automat., Aug. 2015,pp. 2638–2642.
[27] W. Zhou, M. Fei, H. Zhou, and K. Li, “A sparse representation basedfast detection method for surface defect detection of bottle caps,”Neurocomputing, vol. 123, pp. 406–414, Jan. 2014.
[28] X. Li, S. K. Tso, X.-P. Guan, and Q. Huang, “Improving automaticdetection of defects in castings by applying wavelet technique,” IEEETrans. Ind. Electron., vol. 53, no. 6, pp. 1927–1934, Dec. 2006.
[29] H. Y. T. Ngan, G. K. H. Pang, S. P. Yung, and M. K. Ng, “Waveletbased methods on patterned fabric defect detection,” Pattern Recognit.,vol. 38, no. 4, pp. 559–576, Apr. 2005.
[30] G. Lambert and F. Bock, “Wavelet methods for texture defect detection,”in Proc. Int. Conf. Image Process., Oct. 1997, pp. 201–204.
[31] S.-M. Chao and D.-M. Tsai, “Anisotropic diffusion with generalizeddiffusion coefficient function for defect detection in low-contrast surfaceimages,” Pattern Recognit., vol. 43, no. 5, pp. 1917–1931, May 2010.
[32] D.-M. Tsai, C.-C. Chang, and S.-M. Chao, “Micro-crack inspectionin heterogeneously textured solar wafers using anisotropic diffusion,”Image Vis. Comput., vol. 28, no. 3, pp. 491–501, Mar. 2010.
[33] S.-M. Chao and D.-M. Tsai, “An anisotropic diffusion-based defectdetection for low-contrast glass substrates,” Image Vis. Comput., vol. 26,no. 2, pp. 187–200, Feb. 2008.
[34] Z. He, Y. Wang, F. Yin, and J. Liu, “Surface defect detection for high-speed rails using an inverse P-M diffusion model,” Sensor Rev., vol. 36,no. 1, pp. 86–97, Jan. 2016.
[35] C.-S. Chen, C.-M. Weng, and C.-C. Tseng, “An efficient detectionalgorithm based on anisotropic diffusion for low-contrast defect,” Int.J. Adv. Manuf. Technol., vol. 94, nos. 9–12, pp. 4427–4449, Feb. 2018.
[36] X. Zhou, Y. Wang, Q. Zhu, C. Xiao, and X. Lu, “SSG: Super-pixel segmentation and GrabCut-based salient object segmenta-tion,” Vis. Comput., pp. 1–14, Jan. 2018. [Online]. Available:https://link.springer.com/article/10.1007%2Fs00371-018-1471-4
[37] K.-B. Lee, M.-S. Ko, J. J. Lee, T.-M. Koo, and K.-H. Park, “Defectdetection method for TFT-LCD panel based on saliency map model,” inProc. IEEE Region Conf. (TENCON), vol. 1, Nov. 2004, pp. 223–226.
[38] X. Bai, Y. Fang, W. Lin, L. Wang, and B.-F. Ju, “Saliency-based defectdetection in industrial images by using phase spectrum,” IEEE Trans.Ind. Informat., vol. 10, no. 4, pp. 2135–2145, Nov. 2014.
[39] Y. Gan and Q. Zhao, “An effective defect inspection method for LCDusing active contour model,” IEEE Trans. Instrum. Meas., vol. 62, no. 9,pp. 2438–2445, Sep. 2013.

This article has been accepted for inclusion in a future issue of this journal. Content is final as presented, with the exception of pagination.
ZHOU et al.: AUTOMATED VISUAL INSPECTION OF GLASS BOTTLE BOTTOM WITH SALIENCY DETECTION AND TEMPLATE MATCHING 15
[40] K. Song and Y. Yan, “Micro surface defect detection method forsilicon steel strip based on saliency convex active contour model,”Math. Problems Eng., vol. 2013, Nov. 2013, Art. no. 429094, doi:10.1155/2013/429094.
[41] L. Tong, W. K. Wong, and C. K. Kwong, Differential Evolution-Based Optimal Gabor Filter Model for Fabric Inspection. Amsterdam,The Netherlands: Elsevier, 2016.
[42] L. Jia, C. Chen, J. Liang, and Z. Hou, “Fabric defect inspection basedon lattice segmentation and Gabor filtering,” Neurocomputing, vol. 238,pp. 84–102, May 2017.
[43] D. M. Tsai and Y.-C. Hsieh, “Machine vision-based positioning andinspection using expectation–maximization technique,” IEEE Trans.Instrum. Meas., vol. 66, no. 11, pp. 2858–2868, Nov. 2017.
[44] H. K. Yuen, J. Princen, J. Illingworth, and J. Kittler, “Comparative studyof Hough transform methods for circle finding,” Image Vis. Comput.,vol. 8, no. 1, pp. 71–77, Feb. 1989.
[45] R. Duda and P. Hart, “Using the Hough transforms to detect lines andcurves in pictures,” Commun. ACM, vol. 15, no. 1, pp. 11–15, 1972.
[46] X. Zhou, Y. Wang, Q. Zhu, and Z. Miao, “Circular object detection inpolar coordinates for 2D LIDAR data,” in Proc. Chin. Conf. PatternRecognit., Nov. 2016, pp. 65–78.
[47] D. Eberly, R. Gardner, B. Morse, S. Pizer, and C. Scharlach, “Ridgesfor image analysis,” J. Math. Imag. Vis., vol. 4, no. 4, pp. 353–373,Dec. 1994.
[48] F. Bonnin-Pascual and A. Ortiz, “A probabilistic approach for defectdetection based on saliency mechanisms,” in Proc. IEEE Emerg. Technol.Factory Automat. (ETFA), Sep. 2014, pp. 1–4.
[49] Y. Wei, F. Wen, W. Zhu, and J. Sun, Geodesic Saliency Using Back-ground Priors. Berlin, Germany: Springer, 2012.
[50] R. Achanta, A. Shaji, K. Smith, A. Lucchi, P. Fua, and S. Süsstrunk,“SLIC superpixels compared to state-of-the-art superpixel methods,”IEEE Trans. Pattern Anal. Mach. Intell., vol. 34, no. 11, pp. 2274–2282,Nov. 2012.
[51] U. Ramer, “An iterative procedure for the polygonal approximationof plane curves,” Comput. Graph. Image Process., vol. 1, no. 3,pp. 244–256, Nov. 1972.
[52] D. H. Douglas and T. K. Peucker, “Algorithms for the reduction ofthe number of points required to represent a digitized line or itscaricature,” Cartographica, Int. J. Geograph. Inf. Geovis., vol. 10, no. 2,pp. 112–122, Dec. 1973.
[53] E. W. Dijkstra, “A note on two problems in connexion with graphs,”Numerische Mathematik, vol. 1, no. 1, pp. 269–271, Dec. 1959.
[54] R. C. Gonzalez and R. Woods, Digital Image Processing, 3rd ed. Bejing,China: Publishing House Electronics Industry, 2017, pp. 763–769.
[55] N. Otsu, “A threshold selection method from gray-level histograms,”IEEE Trans. Syst., Man, Cybern., vol. SMC-9, no. 1, pp. 62–66,Jan. 1979.
[56] G. Strang, “Wavelets,” Amer. Sci., vol. 82, no. 3, pp. 250–255, 1994.
Xianen Zhou received the B.S. degree from theHunan University of Science and Engineering,Yongzhou, China, in 2010, and the M.S. degree incircuits and systems from the East China Universityof Technology, Nanchang, China, in 2013. He iscurrently pursuing the Ph.D. degree with HunanUniversity, Changsha, China.
His current research interests include machinevision, machine learning, and automatic visualdetection systems.
Yaonan Wang received the B.S. degree in computerengineering from the East China University of Tech-nology, Nanchang, China, in 1981, and the M.S.and Ph.D. degrees in electrical engineering fromHunan University, Changsha, China, in 1990 and1994, respectively.
From 1998 to 2000, he was a Senior HumboldtFellow in Germany, and from 2001 to 2004, he wasa Visiting Professor with the University of Bremen,Bremen, Germany. Since 1995, he has been a Pro-fessor with Hunan University. His current research
interests include intelligent control, image processing, and computer visionsystems for industrial applications.
Changyan Xiao received the B.Eng. and M.S.degrees in mechanical and electronic engineeringfrom the National University of Defense Technology,Changsha, China, in 1994 and 1997, respectively,and the Ph.D. degree in biomedical engineeringfrom Shanghai Jiaotong University, Shanghai, China,in 2005.
From 2008 to 2009, he was a Visiting Post-Doctoral Researcher with the Division of ImageProcessing, Leiden University Medical Center, Lei-den, Netherlands. Since 2005, he has been an Asso-
ciate Professor and a Full Professor with the College of Electrical andInformation Engineering, Hunan University, Changsha. His current researchinterests include medical imaging, machine vision, and embedded instruments.
Qing Zhu received the B.Sc., M.Sc., and Ph.D.degrees in electrical engineering from Hunan Uni-versity, Changsha, China, in 1989, 2000, and 2008,respectively.
She is currently an Associate Professor and a Ph.D.Supervisor with the College of Electrical and Infor-mation Engineering, Hunan University. Her currentresearch interests include voice and image process-ing and network and communication technology.
Xiao Lu received the B.E. degree in electrical engi-neering from Hunan University, Changsha, China,in 2007, the M.S. degree in electrical engineeringfrom Southeast University, Nanjing, China, in 2010,and the Ph.D. degree in electrical engineering fromHunan University in 2016.
She is currently an Associate Professor withHunan Normal University, Changsha. Her currentresearch interests include machine vision, patternrecognition, and machine learning.
Hui Zhang received the B.S., M.S., and Ph.D.degrees in pattern recognition and intelligent systemfrom Hunan University, Changsha, China, in 2004,2007, and 2012, respectively.
He is currently an Assistant Professor with theCollege of Electrical and Information Engineering,Changsha University of Science and Technology,Changsha. He is also a Visiting Scholar with theComputer Vision and Sensing System Laboratory,Department of Electrical and Computer Engineering,University of Windsor, Windsor, ON, Canada. His
current research interests include machine vision, sparse representation, andvisual tracking.
Ji Ge received the B.S. and M.S. degrees inmechatronics engineering from the Jiangxi Univer-sity of Science and Technology, Ganzhou, China,in 2002 and 2005, respectively, and the Ph.D. degreein pattern recognition and intelligent system fromHunan University, Changsha, China, in 2012.
He is currently a Post-Doctoral Fellow with theDepartment of Mechanical and Industrial Engineer-ing, University of Toronto, Toronto, ON, Canada.His current research interests include machine learn-ing and computer vision.
Huihuang Zhao received the Ph.D. degree inmechano-electronic engineering from Xidian Uni-versity, Xi’an, China, in 2010.
From 2013 to 2015, he was a Post-DoctoralResearcher with Hunan University, Changsha,China. From 2016 to 2017, he was an AcademicVisitor with the School of Computer Science andInformatics, Cardiff University, Cardiff, U.K, wherehe has been a Sponsor Researcher with the School ofComputer Science and Informatics since 2017. He iscurrently an Associate Professor with the College of
Computer Science and Technology, Hengyang Normal University, Hengyang,China. His current research interests include image processing, compressivesensing, deep learning, and 3-D geometry processing.


![Automated Conflict Detection Between Medical Care Pathwayspure-oai.bham.ac.uk/ws/files/42669716/MitConSemanticsPaper_CameraReady.pdf · and Osteoarthritis [41] (bottom). The pathways](https://img.pdfslide.us/doc/110x75/5d57943088c9938c368b65e0/automated-conflict-detection-between-medical-care-pathwayspure-oaibhamacukwsfiles42669716mitconsemanticspaper.jpg)