Embed Size (px)
Citation preview
Automated Trace Gas Trapping System (ATGTS)
Daniel CashenAlex Esbrook
Chirs GlinieckiAdam GrisdaleTom HancaskyAlex KersteinJosh Kowalski
3rd December, 2008ECE 480, Michigan State University
ECE Facilitator: Dr. John DellerME Facilitator: Dr. Ranjan Mukherjee
Sponsored by Dr. Nathaniel Ostrom & Dr. Kurt SmemoFunded by the MSU Biogeochemistry Environmental Research Initiative
Executive Summary
Modern agricultural practices contribute significantly to global greenhouse gas emissions, and two critical
gases released by these agricultural processes are carbon dioxide (CO2) and nitrous oxide (N2O). The release
rates of these gases are poorly understood on local scales. In order to mitigate the release of them through
new agricultural practices, a method of monitoring the release of these gases on a local scale is needed.
Team 7 designed an automated device capable of trapping these gases as they are released over a one month
time period without supervision. The trapping of these gases is facilitated by the use of two molecular sieve
traps, which physically trap the CO2 and N2O molecules in the sieve. To successfully trap these gases, a
desiccant trap is included to remove water molecules from the air. A chemical CO2 trap is also implemented
to remove CO2 from the N2O sample. Control of the gas flow through the system is facilitated by a pump
and solenoid valves regulated by a microcontroller. Power for the system is provided by a battery, capable
of providing 25 aH of power. The physical structure and other components of the ATGTS are designed to
keep the device at ambient conditions to correctly model the release of these gases on a global scale.
Acknowledgments
We would like to thank Dr. Nathaniel Ostrom for insuring the success of this project through his personal
devotion. He worked very hard to provide us with the resources to complete the requirements that he clearly
laid out. The research that Dr. Kurt Smemo in regard to the proof of concept was also a critical reference.
Dr. John Deller’s long hours spent grading and providing feedback on our written output was important to
our success this semester. Dr. Ranjan Mukherjee was also referenced for mechanical questions. We would
like to thank Professor Erik Goodman for his instruction on the professional product development process.
Mr. M.A. Kovalcik was very helpful in developing the software required for the program. We would also like
to thank the members of the ECE and ME shops for their hard work and long hours assisting us with our
project.
Contents1 Introduction 1
2 Design of the ATGTS 22.1 Identification and Translation of Customer Requirements . . . . . . . . . . . . . . . . . . . . 22.2 Mechanical Requirements . . . . . . . . . . . . . . . . . . . . . . . . . . . . . . . . . . . . . . 52.3 Mechanical Control . . . . . . . . . . . . . . . . . . . . . . . . . . . . . . . . . . . . . . . . . . 62.4 Electrical Devices & Control . . . . . . . . . . . . . . . . . . . . . . . . . . . . . . . . . . . . . 62.5 Conceptual Designs . . . . . . . . . . . . . . . . . . . . . . . . . . . . . . . . . . . . . . . . . . 72.6 Design Process: Budgeting & Planning . . . . . . . . . . . . . . . . . . . . . . . . . . . . . . . 8
3 Technical description of work 93.1 Hardware Design . . . . . . . . . . . . . . . . . . . . . . . . . . . . . . . . . . . . . . . . . . . 9
3.1.1 First Level . . . . . . . . . . . . . . . . . . . . . . . . . . . . . . . . . . . . . . . . . . 93.1.2 Second Level . . . . . . . . . . . . . . . . . . . . . . . . . . . . . . . . . . . . . . . . . 103.1.3 Third Level . . . . . . . . . . . . . . . . . . . . . . . . . . . . . . . . . . . . . . . . . . 113.1.4 Fourth Level . . . . . . . . . . . . . . . . . . . . . . . . . . . . . . . . . . . . . . . . . 11
3.2 Hardware Implementation . . . . . . . . . . . . . . . . . . . . . . . . . . . . . . . . . . . . . . 113.3 Software and Interface Design . . . . . . . . . . . . . . . . . . . . . . . . . . . . . . . . . . . . 143.4 Software Implementation . . . . . . . . . . . . . . . . . . . . . . . . . . . . . . . . . . . . . . . 16
4 Testing 18
5 Conclusion 205.1 Future Work . . . . . . . . . . . . . . . . . . . . . . . . . . . . . . . . . . . . . . . . . . . . . 205.2 Closing Remarks . . . . . . . . . . . . . . . . . . . . . . . . . . . . . . . . . . . . . . . . . . . 20
6 Appendix 226.1 Technical Roles . . . . . . . . . . . . . . . . . . . . . . . . . . . . . . . . . . . . . . . . . . . . 226.2 Gantt Chart . . . . . . . . . . . . . . . . . . . . . . . . . . . . . . . . . . . . . . . . . . . . . . 286.3 Bill of Materials . . . . . . . . . . . . . . . . . . . . . . . . . . . . . . . . . . . . . . . . . . . 326.4 Literature and website refrences . . . . . . . . . . . . . . . . . . . . . . . . . . . . . . . . . . . 336.5 Electrical Schematics . . . . . . . . . . . . . . . . . . . . . . . . . . . . . . . . . . . . . . . . . 346.6 Mechanical Calculations . . . . . . . . . . . . . . . . . . . . . . . . . . . . . . . . . . . . . . . 366.7 Mechanical Figures . . . . . . . . . . . . . . . . . . . . . . . . . . . . . . . . . . . . . . . . . . 37
Team 7: Automated Trace Gas Trapping System ECE 480
1 Introduction
Many scientists regard climate change as the most critical contemporary issue threatening the earth’s
ecosystem. In response, international agreements have been drafted to monitor and control the emissions of
greenhouse gases, such as the Kyoto Protocol. One major component of these protocols is the development
of emissions trading schemes such as carbon crediting. Carbon crediting refers to purchasable credits which
allow a company to emit a certain amount of greenhouse gases. An integral part of this drive is to both
reduce greenhouse gas emissions and research new methods to quantify these emissions. In order to facilitate
future carbon crediting programs, it is of great interest to develop a method by which to measure trace
amounts of nitrous oxide (N2O) and carbon dioxide (CO2) emissions from soil to the atmosphere.
As part of the global drive to control greenhouse gas emissions, efforts are underway to understand the
emission of greenhouse gases from agricultural practices. N2O and CO2 produced by the microbes within soil
are released when it is tilled or otherwise disturbed. These gases are produced by the microbes within the soil.
As a result, deforestation and the creation of farmland are leading contributors to the release of greenhouse
gases into the atmosphere. Typically, levels of CO2 in the atmosphere are modeled using techniques from
meteorology, but measurements of a much finer resolution must be developed if carbon crediting programs
are to be implemented effectively.
The amount of N2O that is released into the atmosphere by agricultural soils is by comparison not well
understood (Hengeveld, 1995). More accurate measurements regarding N2O emissions in particular are
crucial to the understanding and control of greenhouse gases. While N2O is much less prevalent than CO2
in the atmosphere, it is one thousand times more capable of retaining heat, rendering it an even greater
contributor to heat retention in the atmosphere.
To measure the flux of these gases from the soil over time, a remote trapping system must be designed.
This trapping can occurring using molecular sieve, aka. molsiv, which traps gases based on their molecular
volume. The trapped gases will then be removed and isotropically analyzed in order to determine their origin.
This device will facilitate future carbon crediting systems by providing a method of measuring local emissions
of greenhouse gases, as well as tools for analyzing the origins of these gases to improve land management.
The key to this new approach is the use of molecular sieve (molsiv) for trapping gases. Molsiv physically
filters out molecules of a given size from air passing through it. The trapped molecules can later be removed
from the molsiv without significant isotopic fractioning. Because of this, existing techniques in isotopic
analysis can be applied to determine the microbial origins of these gases.
The ATGTS will trap a sample of each gas on molsiv. These sampling events will occur in succession,
1
Team 7: Automated Trace Gas Trapping System ECE 480
each lasting approximately five minutes. Undesired gases will be sequentially removed by a desiccant and
chemical CO2 trap before reaching the molsiv. After both sampling events occur, six hours elapse before
the next sampling events. This trend will continue for a one month period called the test span. The pump
should operate sufficiently slowly during each sampling event to allow scrubbing of N2O and CO2 from the
respective chambers. At the end of the test span, all four traps in the system should be replaced with
new empty traps, and the filled traps will be sent back to the lab for analysis. Furthermore, the six hour
period separating sampling events should incorporate any rainfall and changes in ambient temperature to
the sampling chamber. Lastly, the device must also measure and record the air temperature and humidity
inside and outside of the device.
For the readers convenience, all figures and tables in this document are referenced by section and then
order of appearance. For example, Figure 4.1 is the first figure of Section 4. While some figures are included
in the body of the text, many are included in the appendix, Section 6. If so desired, the reader should feel
free to detach this section from the rest of the document to provide a quick reference. The appendix begins
on page 22 and will be referenced throughout the body of the report.
2 Design of the ATGTS
2.1 Identification and Translation of Customer Requirements
The first step in our design process was to identify our customer requirements and use these to establish
the required subsystems of our device. In their proposal, the sponsor provided a list of nine requirements
for the ATGTS.
1. Provide continuous measurement of CO2 and N2O over a period of weeks to months regardless of
weather events.
2. Allow sequential trapping of H2O and CO2 which compete with N2O for exchange sites on molecular
sieve.
3. Sufficient flow rate for relatively rapid headspace purging/scrubbing in order to reduce power require-
ments, but slow enough to foster complete adsorption of N2O on the molecular sieve.
4. Compact and easily deployable, yet with sufficient chamber area to encompass spatial variability.
2
Team 7: Automated Trace Gas Trapping System ECE 480
5. Although solar power is desirable to minimize battery size and power requirement, the system should
have sufficient power to operate for one complete cycle (e.g. 1 month) and function in low light
environments (e.g. under forest canopy).
6. After CO2 and N2O are trapped from the system, the chamber should be equilibrated with the atmo-
sphere.
7. Internal chamber temperature and moisture conditions should approximate ambient conditions.
8. Gas recovery from the molecular sieve after trapping must be close to 100% with no significant isotopic
fractionation.
9. The system is developed to be deployed over bare soil (e.g. agricultural soils) or where the vegetation
has been removed and the below ground biomass left intact.
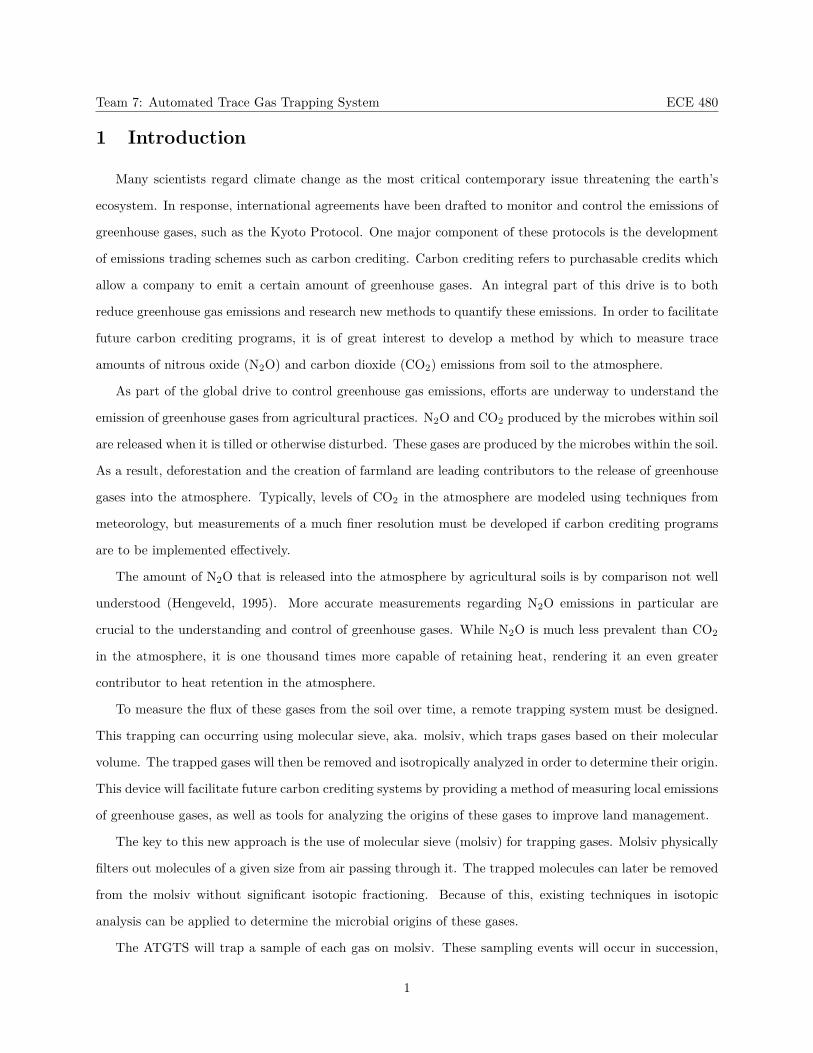
To further understand these requirements, the House of Quality technique was utilized. This is shown
in Figure 2.1. The first step in forming the House of Quality was to identify customer wants. Team 7 came
up with a listing of ten customer wants from the nine requirements listed above. Next, the importance of
these wants was discussed. Continuous measurement, removal of undesired gases from sample volumes, and
automation were regarded as the most important.
Figure 2.1: House of Quality for the ATGTS
Team 7 then created a list of eight measures by which these wants could be quantified. Correlations
between these measures were then established. Finally, weights were assigned to each want and measure
3
Team 7: Automated Trace Gas Trapping System ECE 480
pair. By multiplying these weights with the relative importance of that particular want, the importance of
each measure was established. This yielded the most important measure to be the minimization of power,
which confirmed our expectations. In talking with project sponsors, preliminary target numbers for each
specification were drafted.
Following the House of Quality, a FAST diagram was used to identify the structure of the device. This
diagram is shown in Figure 2.2. Using the FAST diagram, requirements were drafted for the needed subsys-
tems. Team 7 identified the main function of the ATGTS as measuring soil flux for data extrapolation and
analysis. To do this, the ATGTS need to be able to obtain samples of gases and replicate environmental
conditions. Two separate gas samples are needed, meaning that two traps are required, and thus two sam-
pling events. Molecular sieve traps will be used to hold the gases, and so the sample volumes must be passed
through the traps. This is done by controlling the air flow through the system, which is accomplished by a
combination of solenoid valves and a pump. These components are governed by the microcontroller.
Figure 2.2: FAST diagram for the ATGTS
To replicate environmental conditions, three key factors are required. First, rainfall must be simulated,
necessitating a method to collect rainfall and deliver it to the soil flux chamber. Second, the air in the soil
flux chamber must be equilibrated with the outside atmosphere at the conclusion of each sampling event.
A fan and door with access to the outside atmosphere will be included for this purpose. Finally, moisture
must be removed from the sample volumes so that the molecular sieve traps can function properly. Thus, a
desiccant trap is needed to keep the traps from clogging.
4
Team 7: Automated Trace Gas Trapping System ECE 480
Design requirements of the ATGTS will now be broken down. First, mechanical requirements on the size
and organization of the traps will be discussed. Next, methods for controlling the mechanical portions of the
project will be developed. Finally, the electrical controls and electromechanical devices required to facilitate
the ATGTS’s operation are discussed.
2.2 Mechanical Requirements
The system must be designed to completely trap trace gases using molecular sieve. The main chamber
will serve as a collection facility for gases released by the soil. Then, CO2 and N2O must be collected from
this chamber. There are many constraints on the system based upon the properties of the molecular sieve.
The molecular sieve can not be exposed to any water vapor as the pores in the molecular sieve will clog with
water instead of the desired trace gas. This provides the need for a desiccant trap to remove water vapor
from the air before it reaches the molecular sieve.
To maintain a closed system during trapping, a system of sub-chambers is used. It is important to realize
that the sampling of gases must be in a closed system to control sample volume. Therefore, if a sub-chamber
is to be used, it must be isolated from the soil flux chamber during the sampling process. Also, CO2 and N2O
must be trapped in various stages. The molecular sieve filters these gases based on their molecular volume,
and remain in the trap until they are removed in an offsite process. The molecule volume of CO2 and N2O
is very similar, and N2O is thousands of times less abundant in the atmosphere than CO2 (Halpert, 1996).
If both gases were to collect on the same trap, it would be impossible to measure the percentage of N2O. It
is because of this that the system must be designed to strip CO2 from the sample prior to trapping the N2O
on the molecular sieve. The best way to strip the CO2 from the gas without affecting the concentration of
the N2O is to use a chemical CO2 trap.
Sub-chambers are required to provide different sample sizes for both gas trapping systems. CO2 is much
more prevalent in the atmosphere, and will require a smaller sub chamber than N2O to operate within the
constraints of the molecular sieve. Two sub-chambers are needed to have the device function in the same
manner as the ATGTS proof of concept test.
Air flow is created by a pump and redirected by valves opening and closing. These control details are
discussed further in the next section. Due to the effect of soil moisture on microbial processes, the mechanical
design must also accommodate rain water collection. This system will distribute the rain water into the main
chamber to provide regular atmospheric moisture conditions. Following the sample cycle, the main chamber
and sub-chambers are equilibrated with atmospheric conditions.
5

Team 7: Automated Trace Gas Trapping System ECE 480
2.3 Mechanical Control
Figure 6.6 shows the flow of gas through the system. The control of the gas flow is critical to accurate
sampling. This flow will be controlled by a pump and a series of solenoid controlled valves. During the
rest cycle, the system is off, and gases will accumulate within the soil flux chamber. During sampling, the
pump will switch on and begin to pull the sample from the sealed sub-chamber through the system, with the
N2O trapping occurring first. A pair of 2-way solenoid valves will regulate airflow into and out of the N2O
sub chamber. This air will be pulled through the first 3-way solenoid valve into the H2O desiccant trap. A
second 3-way valve will redirect the air flow through a chemical CO2 trap followed by a N2O molecular sieve
trap. This air will then flow through the pump and back into the N2O sub chamber, maintaining a closed
system.
The CO2 trapping event is very similar to the N2O trapping event. However, there are two major
differences between the two flow paths. First, the CO2 sub-chamber is much smaller than the N2O sub-
chamber. Second, after the second 3-way solenoid valve, the air will be redirected through a single CO2
molecular sieve trap.
Moisture conditions within the flux chamber must be equilibrated with the atmosphere to ensure relevant
trace gas producing conditions. This means that rainfall must be collected in a reservoir atop the device and
dropped into the chamber using a rainfall dispersal grate.
2.4 Electrical Devices & Control
The electrical system will provide direction and power to the mechanical control while taking simple
measurements. The CY3214-PSOCEval USB microcontroller is the backbone of this control system. Two
removable humidity/temperature sensors are also provided for measuring these quantities inside and outside
the soil flux chamber. Gas expansion and microbial activity both depend heavily on temperature, thus,
accurate readings are important to BERI’s soil research. The data gathered from these sensors will be
stored electronically. This unit will provide a downloadable file at the end of the month cycle that details
temperature cycles over the course of the month.
The microcontroller will also control the flow cycle and air equilibration process of the entire system. This
entails regulating the air pump, solenoid valves, and electronic actuators to provide the gas flow as described
in the mechanical control section. A state machine is simulated to control the device as it operates.
The microcontroller will provide logic signals for these actions. However, power for device operation is
provided by a battery system via reed relays. This battery must power the closed system for the duration of
6
Team 7: Automated Trace Gas Trapping System ECE 480
one month. This battery system will also require a fault LED. This fault LED will display to the user that
the battery is low. The electrical control of this system must be robust enough to operate uninterrupted for
the duration of one month.
2.5 Conceptual Designs
The design of this system has to provide a deployable self contained unit that is robust enough to operate
for the duration of one month. This provides a triage in the design of the system that defines some parameters
as more immediately important. For this reason, the exhaust fan, pump, and traps are designed first. The
desiccant, chemical CO2, N2O, and CO2 traps are designed with quick connect fittings at each end of the
trap so they can be easily taken off and replaced at the end of the one month test span.
The design of the sub-chamber is the most critical issue facing Team 7. There are several designs for
the two sub-chambers. One design entails two separate sub-chambers and a door on the soil flux chamber
that opens to let gas circulate inside each of the sub-chambers. The door would be opened and closed by
a servo motor. Each sub-chamber will have two valves; one of the valves will open to the trap system and
the other will open to the pump. For the purging process, the trap valve will close and the pump valve will
open allowing fresh air to circulate through the sub-chambers.
Another design includes the two sub-chambers in a single housing with a wall dividing the two chambers.
The sub-chamber housing design consists of a cylinder inside of another cylinder. Holes will be machined
along the side of each cylinder as shown in appendix Figure 6.9. A servo motor will rotate the outside
sub-chamber allowing the holes to line up, allowing air to circulate inside the two sub-chambers. A valve
between the two sub-chambers will be mounted on the dividing wall. It will open when the purging process
begins, allowing the air to circulate from both sub-chambers through the pump valve, while the trap valves
will be closed. There are five valves (two valves lead to the traps, two valves lead to the pump and one valve
is on the wall) in this design.
The last design is a plastic cube sub-chamber housing. This design still incorporates a wall dividing the
two sides, but it does not utilize a valve. There will be four valves that connect to the housing, two that lead
to the traps and two that lead to the pump. Due to the segregation of the two samples, this sub-chamber
design allows for the elimination of the purging procedure. A Figure of this sub-chamber is included in
appendix Figure 6.10.
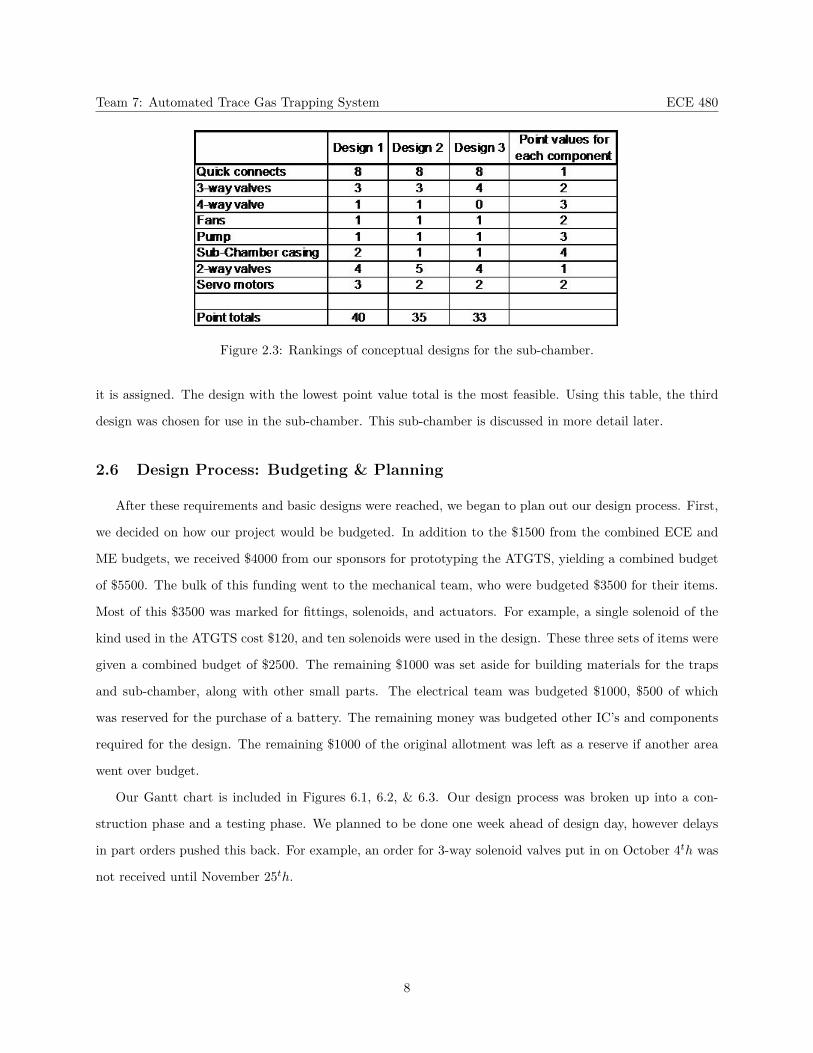
The feasibility of the described prospective designs is ranked in Table 2.3. Point values for each component
denote the importance of each component. The more important the component is, the higher point value
7
Team 7: Automated Trace Gas Trapping System ECE 480
Figure 2.3: Rankings of conceptual designs for the sub-chamber.
it is assigned. The design with the lowest point value total is the most feasible. Using this table, the third
design was chosen for use in the sub-chamber. This sub-chamber is discussed in more detail later.
2.6 Design Process: Budgeting & Planning
After these requirements and basic designs were reached, we began to plan out our design process. First,
we decided on how our project would be budgeted. In addition to the $1500 from the combined ECE and
ME budgets, we received $4000 from our sponsors for prototyping the ATGTS, yielding a combined budget
of $5500. The bulk of this funding went to the mechanical team, who were budgeted $3500 for their items.
Most of this $3500 was marked for fittings, solenoids, and actuators. For example, a single solenoid of the
kind used in the ATGTS cost $120, and ten solenoids were used in the design. These three sets of items were
given a combined budget of $2500. The remaining $1000 was set aside for building materials for the traps
and sub-chamber, along with other small parts. The electrical team was budgeted $1000, $500 of which
was reserved for the purchase of a battery. The remaining money was budgeted other IC’s and components
required for the design. The remaining $1000 of the original allotment was left as a reserve if another area
went over budget.
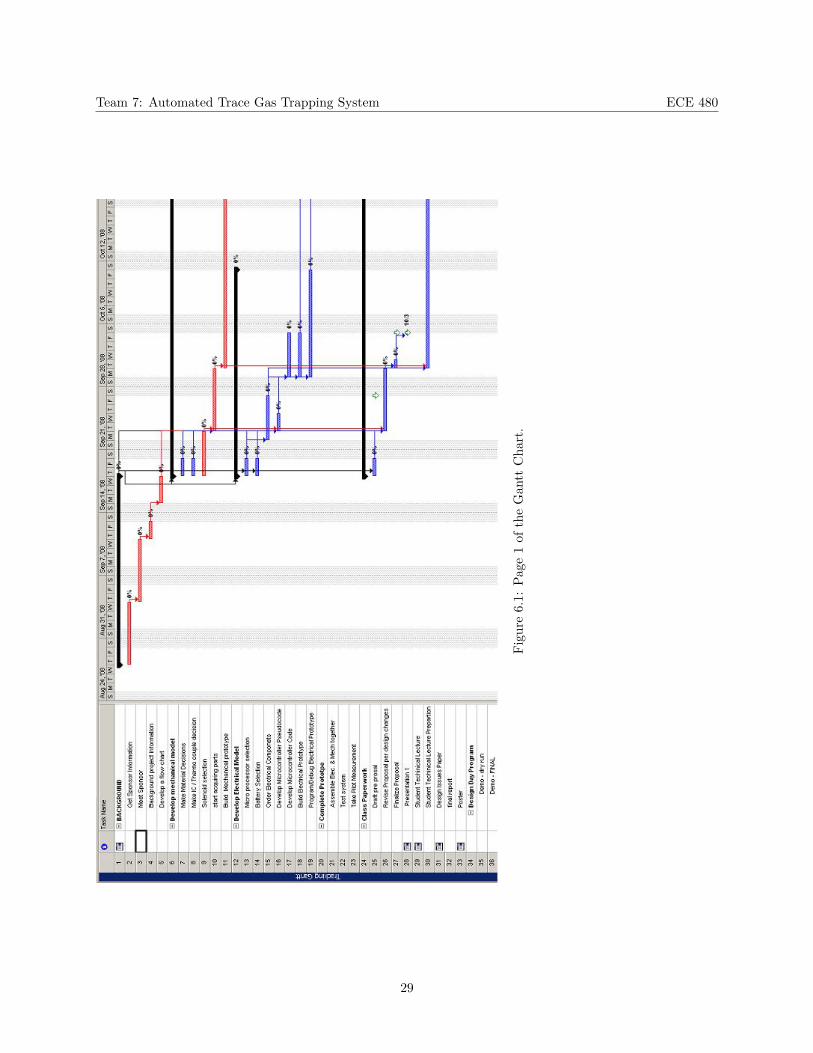
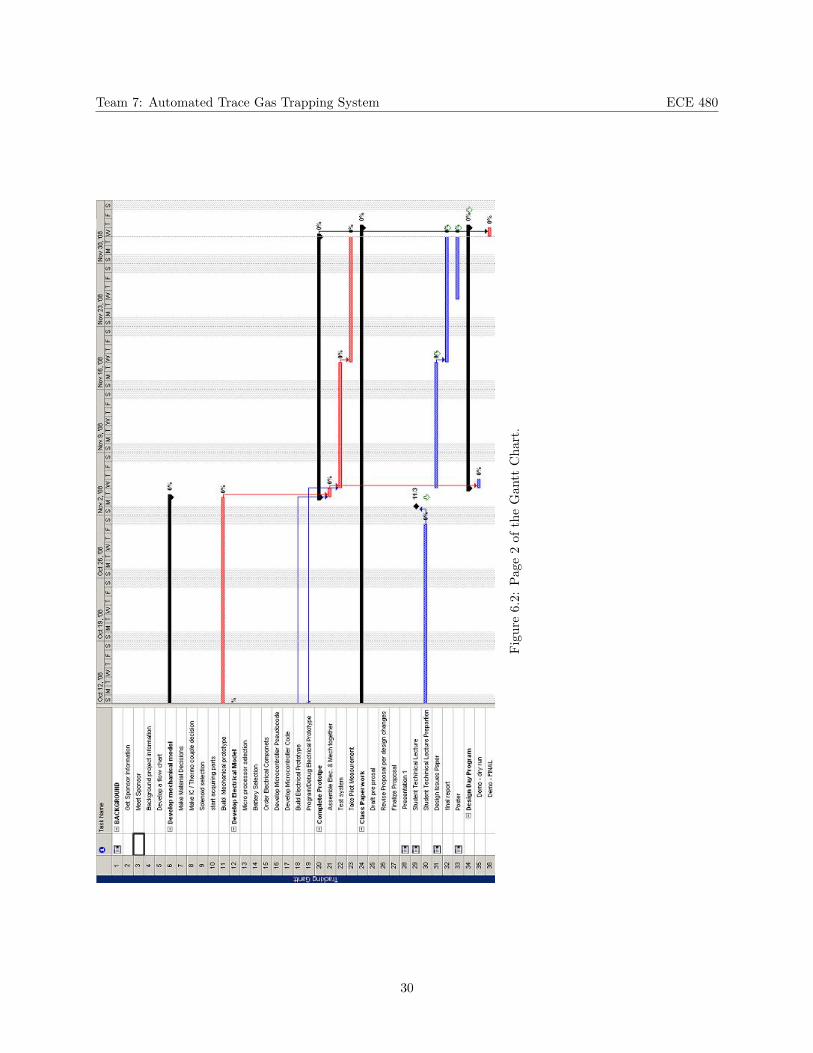
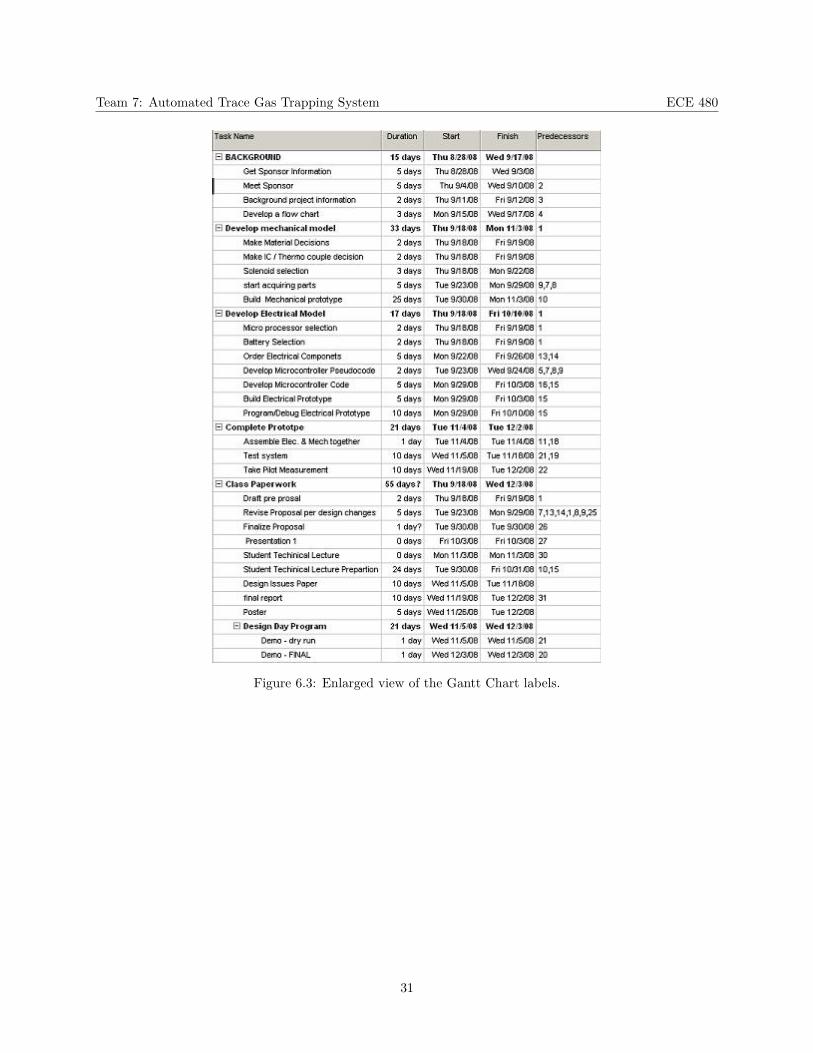
Our Gantt chart is included in Figures 6.1, 6.2, & 6.3. Our design process was broken up into a con-
struction phase and a testing phase. We planned to be done one week ahead of design day, however delays
in part orders pushed this back. For example, an order for 3-way solenoid valves put in on October 4th was
not received until November 25th.
8
Team 7: Automated Trace Gas Trapping System ECE 480
3 Technical description of work
This section details the work done by Team 7 to fit the design criteria established in Section 2. First,
the physical design and layout of the ATGTS are explained. Next, the implementation of this hardware
is included. This section includes many details about why and how certain hardware choices were made.
Following this, the new software designed for the ATGTS is brought up, followed by guidelines for how the
microcontroller implements this software.
3.1 Hardware Design
The design of the ATGTS consists of a 300mm diameter PVC cylinder outer casing, which will be
separated into four separate levels. The outer casing is oriented vertically and the levels are divided by
6.35mm thick PVC sheet. The first level consists of the soil flux chamber, volume sampling sub-chamber,
rainfall dispersal grate, and a fan with access to ambient air to equilibrate the flux chamber. The second
level contains all four chemical or sieve traps and an access door for trap removal/replacement. The third
level houses the pumps, 3-way valves, power supply, and microcontroller, while the fourth level serves as the
rainfall reservoir.
3.1.1 First Level
The first level, or the soil flux chamber, is approximately 250mm in height, and is the support for the
device. This level sits directly above the soil surface being sampled. The assembled chamber is seen in Figure
6.8. 50mm of this chamber height extends into the soil to aid in stability of the ATGTS. Contained within
this soil flux chamber is the sub-chamber housing. Two sub-chambers are formed out of 6.35mm thick PVC
rectangular housing, and serve as the gas sampling volumes. The N2O and CO2 sub-chambers will be 150ml
and 20ml volumes respectively and divided are by a 6.35mm thick PVC wall.
The sub-chamber housing design chosen makes use of a split chamber design coupled with a 6.35mm thick
Aluminum sliding door controlled by an electric linear actuator. The design is illustrated in Figure 6.10.
Both the N2O and smaller CO2 sub-chambers are visible in this Figure. This design eliminates problems seen
by a conventional swinging door design in reference to sealing the chambers. Using the sliding door design
with ball bearings mounted in tracks allows for a sandwiching of the door by sealant material, providing
an airtight seal. The sealing material chosen was Viton. Viton is relatively easy to work with, and is also
chemically inert, an important consideration in the ATGTS. A notch is made into the far left side of the
9
Team 7: Automated Trace Gas Trapping System ECE 480
sub-chamber for the aluminum door to slide into and provide a tight seal.
Initially, this sub chamber design possessed a large dead volume in the back of N2O chamber. This
resulted in insufficient flow through the sub chamber, which could corrupt results. To correct this, Team 7
incorporated a rear vent on one end of the sub chamber. This vent is seen on the far right side of Figure
6.10. This smaller door allows air in the flux chamber excited by the fan to move throughout the N2O
chamber, eliminating the concern of a dead volume occurring in the chamber. The sliding aluminum door is
lengthened so that when the sub-chamber is open, the rear vent is pushed open by the sliding door. This is
shown by the red sliding door pushing the rear vent open in Figure 6.10. The addition of a small spring and
Viton on this door ensures a seal when the sub-chamber is closed. The major structure of the sub-chamber
is made of PVC.
Located 50mm below the sub-chamber is the rainfall dispersal grate. When rain is released from the
fourth level rainfall reservoir, it must be evenly distributed over the sample soil. This is achieved with a
sloping perforated circular disc made out of .25mm thick aluminum sheet, which may be viewed in Figure
6.11.
The last item contained within the soil flux chamber is the equilibrate fan. This fan is 60mm in diameter
and mounted on the outer case wall between the end of the sub-chamber housing and the equilibrate door.
This door is actuated by a second linear motor. The door and fan will serve to equilibrate the soil flux
chamber with the ambient air, and their operation will be discussed later in the device operation section.
3.1.2 Second Level
The second level of the ATGTS is approximately 240mm in height and contains all four chemical and
sieve traps; the desiccant trap, chemical CO2 trap, and two molsiv traps for the N2O and CO2. The desiccant
trap removes moisture from the air before the sample air reaches the other traps. The trap consists of Nafion
tubing wrapped inside a desiccant filled PVC pipe with end caps. The Nafion tubing allows moisture to
be extracted out by the desiccant while not affecting the air content of the tube. The chemical CO2 trap
consists of a stainless steel tube filled with Carbosorb, and will extract CO2 from the sample air prior to its
arrival in the N2O trap. The two molsiv traps for N2O and CO2 collection will also be made of stainless
steel tubes, but filled with molecular sieve 5A. To prevent sample contamination during trap transport, two
manual shutoff valves are included at both ends of the traps. In addition, these traps will also have quick
connects on each end for easy removal.
The molsiv traps are curved into a horseshoe shape, allowing them to be of necessary length while still
10
Team 7: Automated Trace Gas Trapping System ECE 480
fitting in the second level. All traps are designed to be removed after one month by opening an access door.
The PVC door is 248mm in height and spans half the outer case’s circumference. The door is mounted
with small galvanized metal hinges and locked with two load rated draw latches. To prevent moisture from
entering the level, the door will be sealed with basic home weather-stripping.
3.1.3 Third Level
The third level is approximately 133mm in height and its contents are supported by two 6.35mm thick
PVC sheets. Controlling and powering the system is a Cypress PSoC microcontroller and a 14.8V lithium
battery. The microcontroller controls the fan and linear actuators located in level one, as well as the solenoid
valves and the pump located in level three. The specifics of the microcontroller timing to run all electro-
mechanical components will be discussed in section 3.3. Since packaging is a concern in this level, micro
inert solenoid valves were chosen for both 2-way and 3-way applications because they are relatively small,
33mm in length and 9mm in diameter. In addition, a micro diaphragm gas sampling pump was chosen due
its low power consumption, small size, and high flow rate of .3L/min. All plumbing connections in the device
use 1.59mm outer diameter PEEK tubing. PEEK tubing was chosen due to its excellent tensile strength,
90MPa, and because it is chemically inert.
3.1.4 Fourth Level
The fourth level contains the rainfall reservoir. This level consists of a funnel which spans the diameter
of the device to collect and drain rainwater onto the soil, thereby simulating the ambient environment.
Linking the rainfall reservoir and dispersal grate found in level one is a 6.35mm outer diameter Tygon
tubing regulated by a one way solenoid valve. This valve is open only at certain times in the device cycle,
during the equilibrate stage. Covering the rainfall reservoir is a cone shaped plastic screen which stops debris
from plugging the ambient environment rainfall simulator.
3.2 Hardware Implementation
Sub-chamber housing
Construction of the sub-chamber housing required a great deal of patience and care. The first step was
to assemble the inner N2O and CO2 sub-chambers. Due to an extensively long drying time for the glue to
attach the Viton seal to the PVC, assembly took longer than planned. This portion can be seen in the far
right of Figure 6.14. Next, the other components of Figure 6.14 were cut to size. The sliding aluminum
11
Team 7: Automated Trace Gas Trapping System ECE 480
door and rear vent were joined onto the existing portion. Finally, the outer door seals the space in the
bearing track from outer air. This seal is the green rectangle in the left side of 6.10. Figure 6.12 shows the
inner chamber seals of the completed sub-chamber. Figure 6.13 shows the completed rear vent, with spring
attached. During testing of this seal, it was found that the size of the aluminum sliding door was insufficient
to provide a strong seal. This test will be further discussed in Section 4. To correct this, a small aluminum
plate was added to the existing door.
Traps and Flow Path
The trap manifold was made out of 6.35mm thick PVC with two 2mm thick aluminum plates on each
side. A 250mm by 200mm piece of PVC was cut with a band-saw to make the trap manifold. Two 1 inch
holes were cut out of the PVC for the chemical CO2 trap, and four 12.7mm holes were cut of the PVC with
a push press for the NO2 and CO2 traps. The holes then were sanded down with a hand sander to make
a shape that resembles the flat nut on the quick connect stem. The stems for each of the traps were then
placed into their respective holes. Then, two 22.23mm holes and four 9.53mm holes were cut out of the two
aluminum plates. The aluminum plates were then place on both sides of the PVC plate. This was done to
hold the quick connect stems in their places.
Next, the chemical and molsiv traps were constructed. Calculations for the sizes of these traps can be
found in Tables 6.2 and 6.3. Both traps were made from 7.7mm inner diameter, 9.5 mm outer diameter, 304
stainless steel tubing. At the ends of each trap were manual valves, quick connects, and reducers purchased
from Swagelok. The quick connect body connects to the valve, and the stem connects to the tubing that
transfers the gas from the sub chamber. The body of the quick connect had a 6.35mm inch male connection
end and the stem end of the quick connect had a 6.35mm inch tube fitting end. The reducers fit into the
tube fitting end of the quick connect, which consists of a ferrule and a nut that are tightened to make an air
tight seal between the two parts. The reducers then connect to the PEEK tubing and are tightened with a
nut and ferrule. On the other side of the manual valves are unions with tub fittings and male ends on them.
The male end is inserted in the manual valve and the stainless steel tubing is placed into the tube fitting
to complete the traps. The CO2 molsiv trap was built in the exact same way as the N2O molsiv trap. The
complete trap manifold can be seen in Figure 6.19.
Finally, the desiccant trap was built. Calculations on its size can be found in Table 6.4. The base of this
trap is a 19.05mm circular pvp pipe. A 304.8mm section of Nafion tubing is curled up inside this pipe. The
remainder of the trap is filled with desiccant material.
12
Team 7: Automated Trace Gas Trapping System ECE 480
Main Body
The final assembly step is the construction of the main body. The top segment of the ATGTS, which
includes a rain catcher, is connected over top of the main body. The top of the rain catcher is shown in
Figure 6.16. The rain is held here until a solenoid on the other side is opened. Covering this rain catcher is
a screen, shown in Figure 6.17. This screen prevents debris from entering the system and causing damage
or corruption of results.
Solenoid Control & Actuation
Upon reception of the solenoid valves, testing revealed that they took a large amount of power when kept
open. Over the course of a month, the solenoids would use 10 amp-hours of power. To reduce this, Team 7
decided on a pulse width modulation scheme using the microcontroller and a transistor switch as shown in
Figure 6.4. The microcontroller sends a PWM signal to the input of a transistor, which causes the average
voltage across the solenoid to be reduced. After contacting the solenoid manufacturer, it was discovered that
only five volts were needed to keep the solenoids open, as opposed to the 12 volts they took during opening.
Because the supply voltage from the battery is higher than 12 volts, signals to the transistor switch are first
modulated with a duty cycle of 82%. After a second, this duty cycle is switched to 38%. This reduced the
power consumption of the solenoid valves by 60%, to 4 amp-hours.
Power Supply
After all components were finalized, a battery was selected to complete the power system. An initial
design for the ATGTS given to Team 7 by the sponsors had a 55 amp-hour budget. Reducing the power
draw was the major electrical challenge encountered by Team 7. Two primary battery options were discussed;
lithium ion and deep cycle lead-acid. Deep cycle batteries are cheaper, but are extremely heavy and bulky,
which would hamper the mobility of the ATGTS. In addition, they are complicated to charge. Instead lithium
ion was chosen due to its superior power density. In order for the lithium ion battery to be affordable and
provide a sufficient safety margin, the ATGTS would need to draw no more than 20 Amp hours.
With most components on our device running at 12 volts, we chose a 14.4 volt Lithium battery to use
in our design. In order to power the microcontroller and fan, which run at five volts, we purchased a buck
converter. To conserve component life, all devices that needed to run at 12 volts were also pulse width
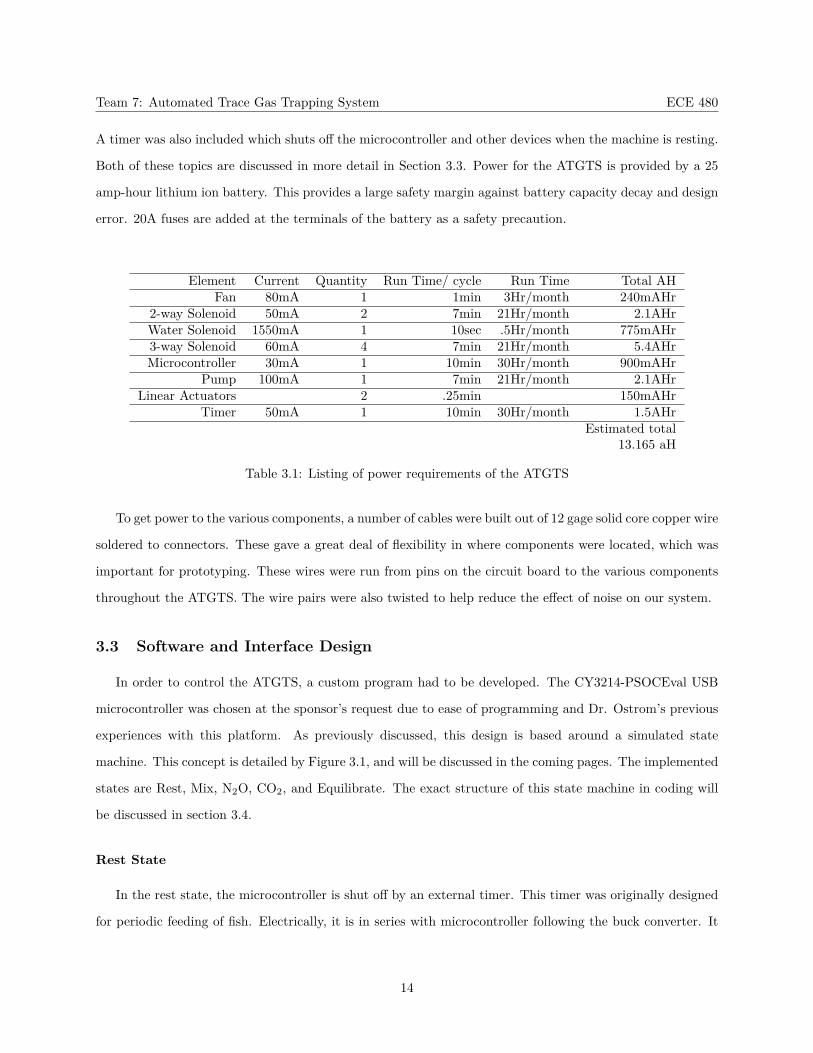
modulated in the same way as the solenoids. The power requirements of the system are listed in Table 3.1.
This table is based on a six hour cycle. For each cycle, only certain components run for given time periods.
13
Team 7: Automated Trace Gas Trapping System ECE 480
A timer was also included which shuts off the microcontroller and other devices when the machine is resting.
Both of these topics are discussed in more detail in Section 3.3. Power for the ATGTS is provided by a 25
amp-hour lithium ion battery. This provides a large safety margin against battery capacity decay and design
error. 20A fuses are added at the terminals of the battery as a safety precaution.
Element Current Quantity Run Time/ cycle Run Time Total AHFan 80mA 1 1min 3Hr/month 240mAHr
2-way Solenoid 50mA 2 7min 21Hr/month 2.1AHrWater Solenoid 1550mA 1 10sec .5Hr/month 775mAHr3-way Solenoid 60mA 4 7min 21Hr/month 5.4AHrMicrocontroller 30mA 1 10min 30Hr/month 900mAHr
Pump 100mA 1 7min 21Hr/month 2.1AHrLinear Actuators 2 .25min 150mAHr
Timer 50mA 1 10min 30Hr/month 1.5AHrEstimated total
13.165 aH
Table 3.1: Listing of power requirements of the ATGTS
To get power to the various components, a number of cables were built out of 12 gage solid core copper wire
soldered to connectors. These gave a great deal of flexibility in where components were located, which was
important for prototyping. These wires were run from pins on the circuit board to the various components
throughout the ATGTS. The wire pairs were also twisted to help reduce the effect of noise on our system.
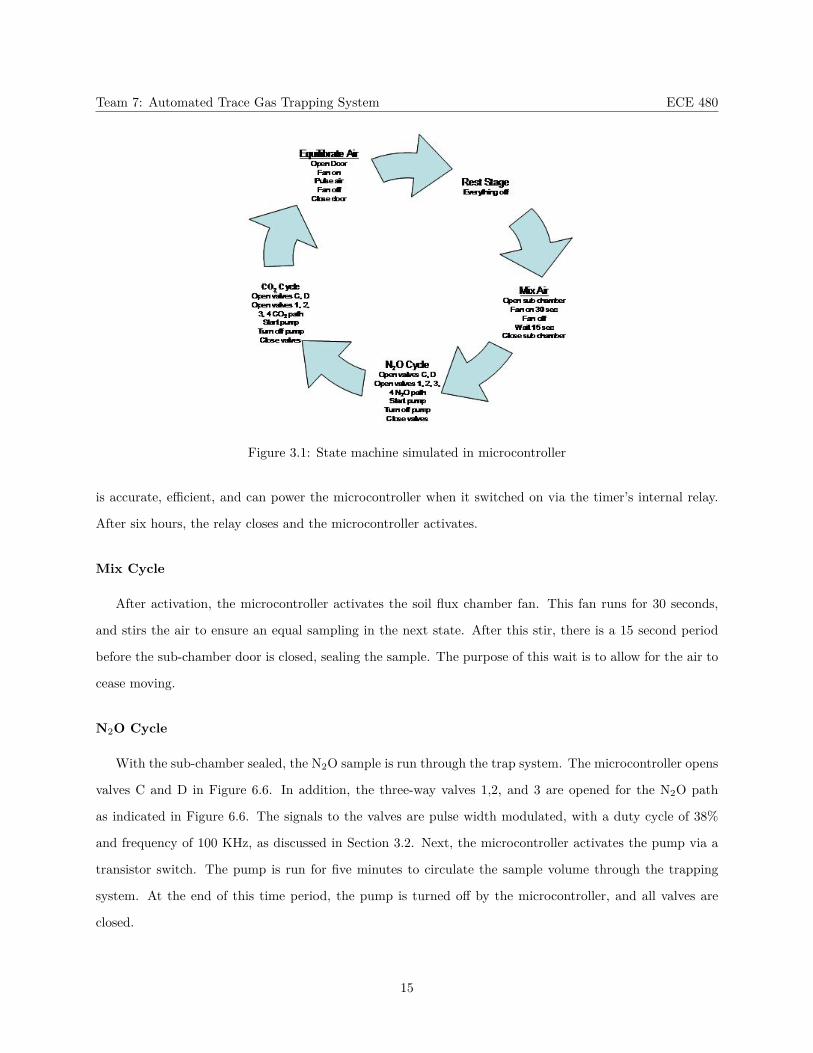
3.3 Software and Interface Design
In order to control the ATGTS, a custom program had to be developed. The CY3214-PSOCEval USB
microcontroller was chosen at the sponsor’s request due to ease of programming and Dr. Ostrom’s previous
experiences with this platform. As previously discussed, this design is based around a simulated state
machine. This concept is detailed by Figure 3.1, and will be discussed in the coming pages. The implemented
states are Rest, Mix, N2O, CO2, and Equilibrate. The exact structure of this state machine in coding will
be discussed in section 3.4.
Rest State
In the rest state, the microcontroller is shut off by an external timer. This timer was originally designed
for periodic feeding of fish. Electrically, it is in series with microcontroller following the buck converter. It
14
Team 7: Automated Trace Gas Trapping System ECE 480
Figure 3.1: State machine simulated in microcontroller
is accurate, efficient, and can power the microcontroller when it switched on via the timer’s internal relay.
After six hours, the relay closes and the microcontroller activates.
Mix Cycle
After activation, the microcontroller activates the soil flux chamber fan. This fan runs for 30 seconds,
and stirs the air to ensure an equal sampling in the next state. After this stir, there is a 15 second period
before the sub-chamber door is closed, sealing the sample. The purpose of this wait is to allow for the air to
cease moving.
N2O Cycle
With the sub-chamber sealed, the N2O sample is run through the trap system. The microcontroller opens
valves C and D in Figure 6.6. In addition, the three-way valves 1,2, and 3 are opened for the N2O path
as indicated in Figure 6.6. The signals to the valves are pulse width modulated, with a duty cycle of 38%
and frequency of 100 KHz, as discussed in Section 3.2. Next, the microcontroller activates the pump via a
transistor switch. The pump is run for five minutes to circulate the sample volume through the trapping
system. At the end of this time period, the pump is turned off by the microcontroller, and all valves are
closed.
15
Team 7: Automated Trace Gas Trapping System ECE 480
CO2 Cycle
The CO2 cycle is very similar to the N2O cycle. This time, valves A and B are opened in Figure 6.6, and
the three-way valves open for the CO2 path. Due to the smaller sample size of the CO2 chamber, the pump
is only run for 2 minutes. After this time, the valves and pump are deactivated.
Equilibrate Cycle
The final state of the device equilibrates the soil flux chamber and sub-chamber with the outer atmosphere.
The microcontroller opens the outer door and sub-chamber with linear motors. The soil flux chamber fan is
then pulsed on and off in 10 second cycles with a 5 second lag period for 5 minutes. This pulsing will match
the inner air with outer air. A pressure sensor is provided to ensure that the air is properly exchanged. If
the pressure measured by the sensor is outside constraints for operation, the microcontroller can make a log
entry and cease operation to preserve the validity of the existing sample. An LED attached to the exterior
of the ATGTS is also lit to alert the user. After the air is equilibrated, the microcontroller is deactivated by
the timer and enters the rest state.
In addition to the microcontroller, a USB data logger is also provided. This device monitors temperature,
humidity, and dew point every 5 minutes over the entire month long sampling period. This data is important
to researchers trying to determine the source and flux of the trace gas samples collected by the ATGTS. This
device is mounted on the interior of the soil flux chamber near the soil, and the data from these devices is
read each month and then returned. The IP67 waterproof rating ensures field robustness.
3.4 Software Implementation
The microcontroller was previously run using a direct state machine design which had five states. Com-
ponents were turned on during a particular state and off when the state was over. Extra counters were
needed because some components need to be on for 30 seconds which is one half the state duration of 1
minute. However, due to the limited number of counter blocks available, this path was abandoned. A new
programming strategy was developed to simulate a state machine. This new method utilizes a real time
clock that starts at zero every time the microcontroller is powered on. Figure 3.2 shows a graphical version
of this program. All of the system control variables are linked to this clock, making function of the ATGTS
very intuitive. For example, the first thing the ATGTS does when activated is turn on the fan to mix the air
in the sub chamber, the fan control uses a conditional if statement to activate the fan at 00:00:05 time and
then deactivate it at 00:00:35 time. This type of logic allows for a single timer to be used for the system.
16
Team 7: Automated Trace Gas Trapping System ECE 480
Figure 3.2: View from the PSOC programming environment of the simulated state machine.
The linear actuators are each controlled by two logic level output signals from the microcontroller. One
of these signals is used to extend the linear actuator and the other retracts it. The motor driver integrated
circuit supplies a positive or negative 12V depending on the state needed to run the linear actuators.
The solenoid valves and pump are run by pulse width modulation (PWM) signals to reduce their overall
power consumption. The solenoids need to be activated initially by 12V and then can be held open at 5V.
More specifically, the microcontroller outputs a 78% duty cycle PWM at 100 kHz to activate the solenoid
for 1 sec. After this 1 sec interval the PWM is reduce to a 38% duty cycle at 100 kHz to supply 5V and
keep the solenoids open. Another component which uses PWM is the pump which is activated using a 42%
duty cycle to supply the 6V needed for the pump to operate.
The liquid crystal display (LCD) is used to present useful system information. In the top left corner of
the LCD the current cycle of the system is shown. In the top right the timer of the system is shown. The
bottom line of the LCD displays the fan RPM and the system valve pressure. The LCD displays the state
by saving six predefined states; Mix Air, N2O, CO2, Equilibrate, and Stop. The LCD will change its state
at a predefined time interval ranging from approximately 30seconds to 5 minutes. The fan and pressure
sensor, speed and pressure values respectively, are displayed by connecting to the microcontroller and using
analog-to digital converters to send the information to the LCD. These valves are updated every clock cycle.
17
Team 7: Automated Trace Gas Trapping System ECE 480
The timer is as 0000 where the first two zeros display the minutes and last two zeros display the seconds.
The formula used was (Clock Min*100)+Clock Sec.
Error checking of the system involves integrating a pressure sensor and fan RPM feedback into the
microcontroller. Originally, it was planned to monitor the position of the linear actuators, this could not
be accomplished because the supplier was not able to supply the proper specifications. The pressure sensor
normally reads 95kPa under normal atmospheric pressure. Threshold pressures of 90kPa to 100kPa were
chosen, that when exceeded a warning LED will signal an error has occurred. To make sure a proper air
sample is being equilibrated with the ambient environment, a warning LED will signal if the fan drops below
500RPM. When an error occurs the system microcontroller will send a signal to a power shut off relay.
This will turn off all system function except the warning LED signal which will notify a passerby of needed
maintenance. Also, incorporating this fail safe into the design will make use of whatever data has been
collected so far prior to ATGTS shut off.
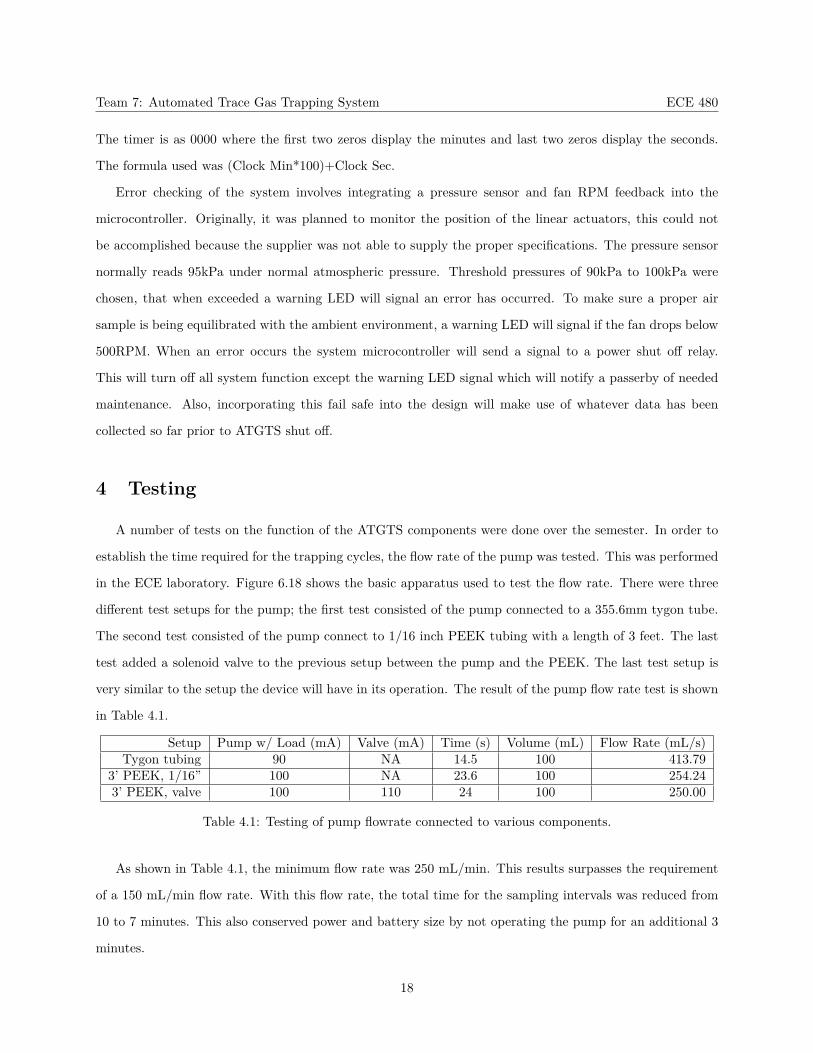
4 Testing
A number of tests on the function of the ATGTS components were done over the semester. In order to
establish the time required for the trapping cycles, the flow rate of the pump was tested. This was performed
in the ECE laboratory. Figure 6.18 shows the basic apparatus used to test the flow rate. There were three
different test setups for the pump; the first test consisted of the pump connected to a 355.6mm tygon tube.
The second test consisted of the pump connect to 1/16 inch PEEK tubing with a length of 3 feet. The last
test added a solenoid valve to the previous setup between the pump and the PEEK. The last test setup is
very similar to the setup the device will have in its operation. The result of the pump flow rate test is shown
in Table 4.1.
Setup Pump w/ Load (mA) Valve (mA) Time (s) Volume (mL) Flow Rate (mL/s)Tygon tubing 90 NA 14.5 100 413.79
3’ PEEK, 1/16” 100 NA 23.6 100 254.243’ PEEK, valve 100 110 24 100 250.00
Table 4.1: Testing of pump flowrate connected to various components.
As shown in Table 4.1, the minimum flow rate was 250 mL/min. This results surpasses the requirement
of a 150 mL/min flow rate. With this flow rate, the total time for the sampling intervals was reduced from
10 to 7 minutes. This also conserved power and battery size by not operating the pump for an additional 3
minutes.
18
Team 7: Automated Trace Gas Trapping System ECE 480
Testing the sub-chamber’s seals was preformed in the Mechanical Engineering Shop. After the sub-
chamber was built, the sealing for between the door and Viton foam was tested. The two inner chambers
were filled with water, then the door was slid into place where it would seal off the inner chambers. The
first attempt to seal the sub-chamber failed because there was not enough pressure on the Viton to achieve
sealing. A second test was run with additional metal sheets on the door, which caused more pressure on
the Viton. This test was successful in sealing the sub-chamber. After re-running the test several times to
validate the results, wearing of the Viton was seen. This is shown in Figure 6.20. This problem will lead to
a new design of the bearing track for the sub chamber, which will be talked about in Section 5.1.
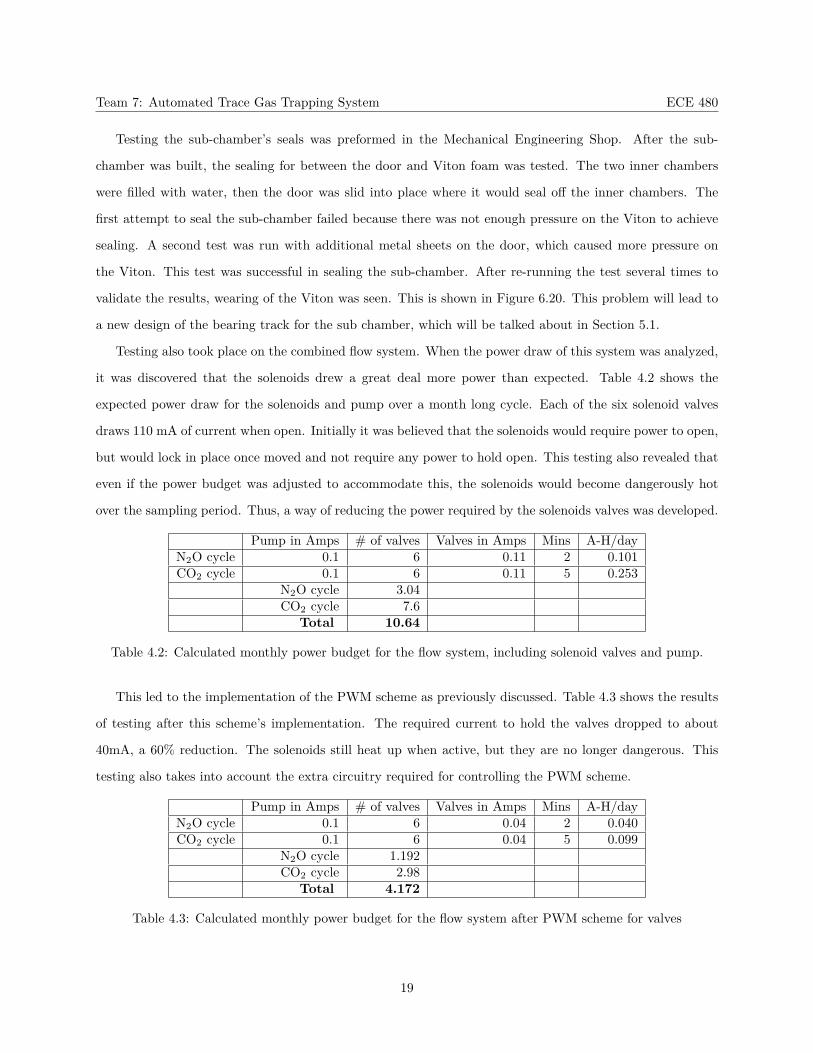
Testing also took place on the combined flow system. When the power draw of this system was analyzed,
it was discovered that the solenoids drew a great deal more power than expected. Table 4.2 shows the
expected power draw for the solenoids and pump over a month long cycle. Each of the six solenoid valves
draws 110 mA of current when open. Initially it was believed that the solenoids would require power to open,
but would lock in place once moved and not require any power to hold open. This testing also revealed that
even if the power budget was adjusted to accommodate this, the solenoids would become dangerously hot
over the sampling period. Thus, a way of reducing the power required by the solenoids valves was developed.
Pump in Amps # of valves Valves in Amps Mins A-H/dayN2O cycle 0.1 6 0.11 2 0.101CO2 cycle 0.1 6 0.11 5 0.253
N2O cycle 3.04CO2 cycle 7.6
Total 10.64
Table 4.2: Calculated monthly power budget for the flow system, including solenoid valves and pump.
This led to the implementation of the PWM scheme as previously discussed. Table 4.3 shows the results
of testing after this scheme’s implementation. The required current to hold the valves dropped to about
40mA, a 60% reduction. The solenoids still heat up when active, but they are no longer dangerous. This
testing also takes into account the extra circuitry required for controlling the PWM scheme.
Pump in Amps # of valves Valves in Amps Mins A-H/dayN2O cycle 0.1 6 0.04 2 0.040CO2 cycle 0.1 6 0.04 5 0.099
N2O cycle 1.192CO2 cycle 2.98
Total 4.172
Table 4.3: Calculated monthly power budget for the flow system after PWM scheme for valves
19
Team 7: Automated Trace Gas Trapping System ECE 480
5 Conclusion
5.1 Future Work
There are a number of future improvements that could be made to this first generation prototype. First,
the present sub-chamber design is not robust enough for long term actuation. The sliding door wears down
the Viton seal on the chamber door. This wear can be see in Figure 6.20. If left uncorrected, the seal could
go bad and all data regarding the flux rate of the trace gases would be compromised. As a result, in the
weeks to come a new sub-chamber housing will be designed, incorporating a sliding linear actuator that
indexes into the seal. In effect, the door will squeeze onto the Viton, as opposed to sliding across the Viton.
This will be accomplished by changing the shape of the sub-chamber bearing tracks.
A second improvement is in the solenoid valves. The existing valves do not lock in position when moved,
and take a great deal of power to keep open. Team 7 addressed this issue by using pulse width modulated
signals to reduce the power required by the solenoids. If locking solenoids could be found for a similar price
and size, many pieces of hardware could be removed, reducing the manufacturing cost of the device.
Another future improvement could be replacing the homemade electrical cables with a standard cable.
For large scale manufacturing, using homemade cables is not very economic. There are a variety of cables that
could be used instead. These would provide a higher degree of robustness. A final suggested improvement is
the inclusion of new sensors throughout the device. Adding flow sensors into the system could allow for easier
maintenance in the event of an error. It would also confirm that the device is always running as expected.
One failure of the group is that only limited testing has been done on the complete device. Given that
this device is designed to operate over a month long period, a full scale test would have been impossible.
Also, extracting data on the trapping of gases on the molsiv traps was also unfeasible for our time period.
Removing and analyzing the traps is an energy intensive process which takes a great deal of time. Testing
of the ATGTS is the most pressing piece of coming work that must be completed before the design can be
implemented in the field.
5.2 Closing Remarks
Team 7 has successfully designed a prototype device capable of providing continuous measurement of
N2O and CO2 over a month without outside interaction. This project was completed on time and within
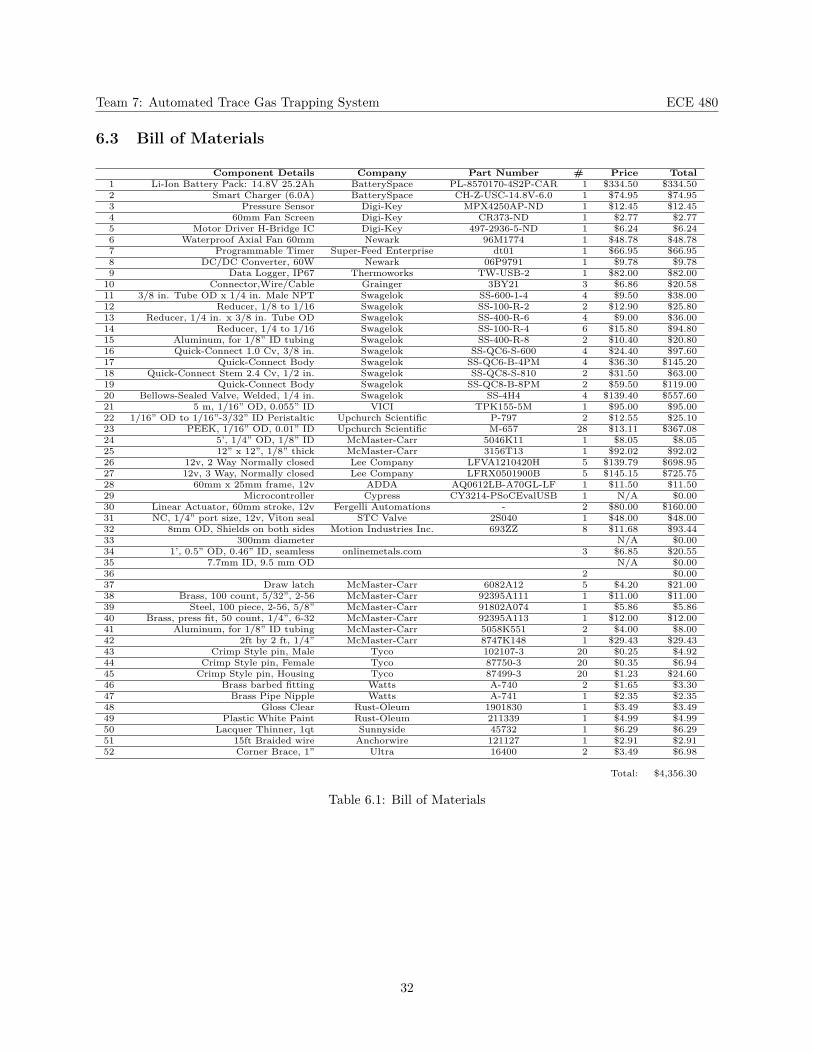
budget, as shown in the bill of materials, Table 6.1. The ATGTS maintains a very small ecological footprint
on its surroundings. Replication of ambient atmosphere conditions ensures that the data collected matches
20
Team 7: Automated Trace Gas Trapping System ECE 480
with what occurs in nature. The ATGTS is the first step toward implementing carbon credit systems as well
as understanding the release of N2O into the atmosphere. Both are important to the global effort to control
global warming and climate change. Existing micro meteorological techniques posses insufficient resolution
for use in carbon crediting systems, and no such techniques exist for N2O.
The ATGTS is also unique in that it is the only device currently available that is capable of long term
monitoring of CO2 and N2O emissions without isotopic fractioning. This is due to the use of molecular sieve,
which physically traps the CO2 and N2O molecules, and the implementation of sub-chambers to reduce the
volume of gas sampled. Stable isotope techniques can then be applied to the samples to determine the respi-
ratory sources of CO2 as well as the microbial pathways of N2O. Understanding respiratory microbiological
pathways provides researchers with the ability to redefine the impact of farming on the environment.
21

Team 7: Automated Trace Gas Trapping System ECE 480
6 Appendix
6.1 Technical Roles
Each member of Team 7 has provided a description of their technical work on the project.
Adam Grisdale
My main portion of the project was designing and building the trap manifold. The purpose
of a trap manifold is that our sponsors wanted all the traps to be together on one housing,
so the traps, are easy to get to and exchange with new traps. I first started by asking our
sponsors Dr. Ostrom and Dr. Smemo about trap sizes and the sizing of the tubing that will
be used to transfer the trace gas. With that information they also gave me constraints on the
flow rate, materials, and need for quick replacement. With my constraints and part supplier
lists I started calling companies and asking if they had parts that would satisfy my objective. After talking
with a few companies, I found a company called Swagelok that could supply all the parts that I would need.
With the data sheets from the parts I selected, I then started to draw all the parts in UN 6 (CAD program)
so I could design the actual trap manifold. With the CADmodels, I could also show our sponsors a visual
representation of my idea for the trap manifold and make sure that they like the idea before I actually built
the manifold. After they approved the model, I then started on building the trap manifold.
The components for the trap manifold came about four days after ordering them. After I received all of
my parts, I started building the manifold itself. The manifold is basically a rectangular PVC box that has six
holes in it. The six holes are for the stem part of the quick connects that is to be place in the manifold. Two
steel plates will go on either side so they can hold and support the quick connects that are in the manifold.
After the trap manifold was built, I tested the quick connect to make sure they properly work and also made
sure that they are easy to replace them too.
I worked with the other Mechanical Engineers in designing every component in the device. I helped with
the designing of the sub chamber. This component required the most design time because the sub chamber
is the most important part of our device. The most critical part of the sub chamber is its air tight seal. If
the seal was poorly designed, the sub chamber would not work correctly and the device would be a failure.
The sub chamber has many different design changes to, mainly for packaging reasons. We initially had a
cylinder shaped sub chamber but then later changed it to a rectangular box. Then our sponsor wanted us
to add another door on the sub chamber so there would be no dead volume (non-circulating air) in the sub
22
Team 7: Automated Trace Gas Trapping System ECE 480
chamber.
Alex Kerstein
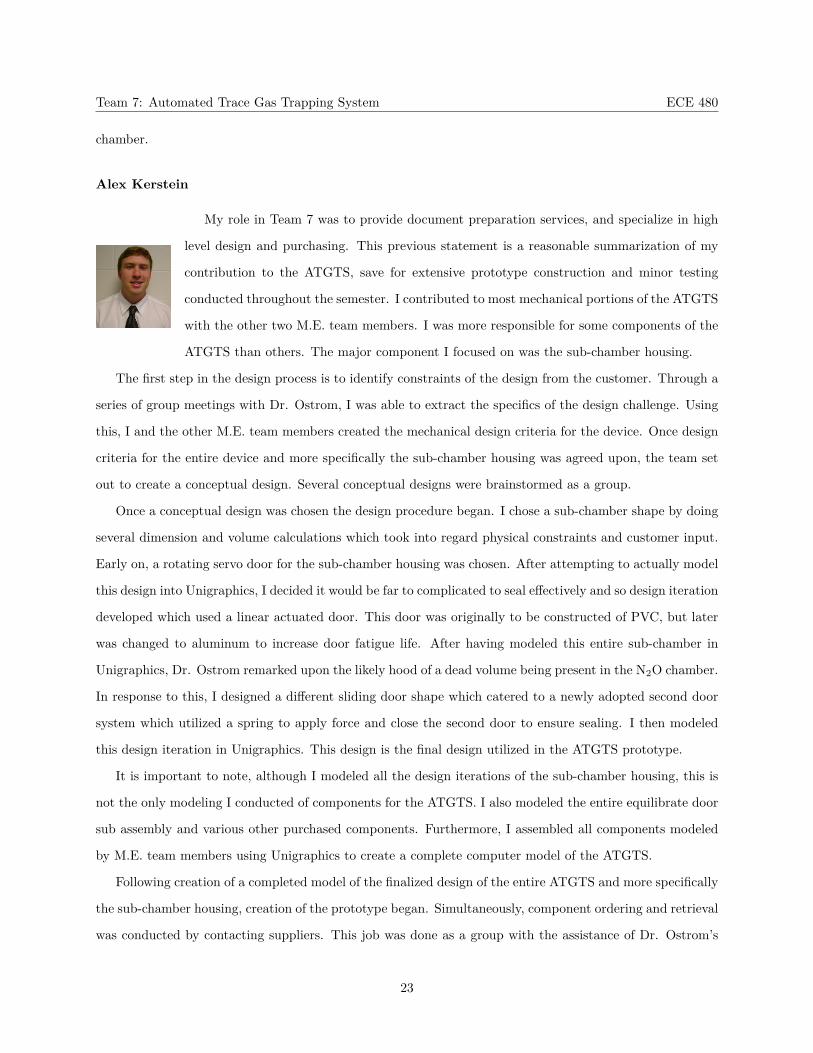
My role in Team 7 was to provide document preparation services, and specialize in high
level design and purchasing. This previous statement is a reasonable summarization of my
contribution to the ATGTS, save for extensive prototype construction and minor testing
conducted throughout the semester. I contributed to most mechanical portions of the ATGTS
with the other two M.E. team members. I was more responsible for some components of the
ATGTS than others. The major component I focused on was the sub-chamber housing.
The first step in the design process is to identify constraints of the design from the customer. Through a
series of group meetings with Dr. Ostrom, I was able to extract the specifics of the design challenge. Using
this, I and the other M.E. team members created the mechanical design criteria for the device. Once design
criteria for the entire device and more specifically the sub-chamber housing was agreed upon, the team set
out to create a conceptual design. Several conceptual designs were brainstormed as a group.
Once a conceptual design was chosen the design procedure began. I chose a sub-chamber shape by doing
several dimension and volume calculations which took into regard physical constraints and customer input.
Early on, a rotating servo door for the sub-chamber housing was chosen. After attempting to actually model
this design into Unigraphics, I decided it would be far to complicated to seal effectively and so design iteration
developed which used a linear actuated door. This door was originally to be constructed of PVC, but later
was changed to aluminum to increase door fatigue life. After having modeled this entire sub-chamber in
Unigraphics, Dr. Ostrom remarked upon the likely hood of a dead volume being present in the N2O chamber.
In response to this, I designed a different sliding door shape which catered to a newly adopted second door
system which utilized a spring to apply force and close the second door to ensure sealing. I then modeled
this design iteration in Unigraphics. This design is the final design utilized in the ATGTS prototype.
It is important to note, although I modeled all the design iterations of the sub-chamber housing, this is
not the only modeling I conducted of components for the ATGTS. I also modeled the entire equilibrate door
sub assembly and various other purchased components. Furthermore, I assembled all components modeled
by M.E. team members using Unigraphics to create a complete computer model of the ATGTS.
Following creation of a completed model of the finalized design of the entire ATGTS and more specifically
the sub-chamber housing, creation of the prototype began. Simultaneously, component ordering and retrieval
was conducted by contacting suppliers. This job was done as a group with the assistance of Dr. Ostrom’s
23
Team 7: Automated Trace Gas Trapping System ECE 480
office personal. The entire device, save for the circuitry, was built in the machine shop by the M.E. team
members over a period of approximately five weeks. I have aided in the construction of every component
of the device in some way using both hand tools and power tools. In reference to the sub-chamber housing
and outer door I cut several sections of PVC and Viton sealing material. In addition, I end-milled bearing
tracks for the sliding doors in both devices.
Following completion of certain components throughout the construction of the ATGTS prototype, var-
ious testing was conducted. Static testing included filling the sub-chamber with water to check sealing
condition and pumping water through a valve via a 900mm length of PEEK tubing to check the flow rate
was high enough.
Josh Kowalski
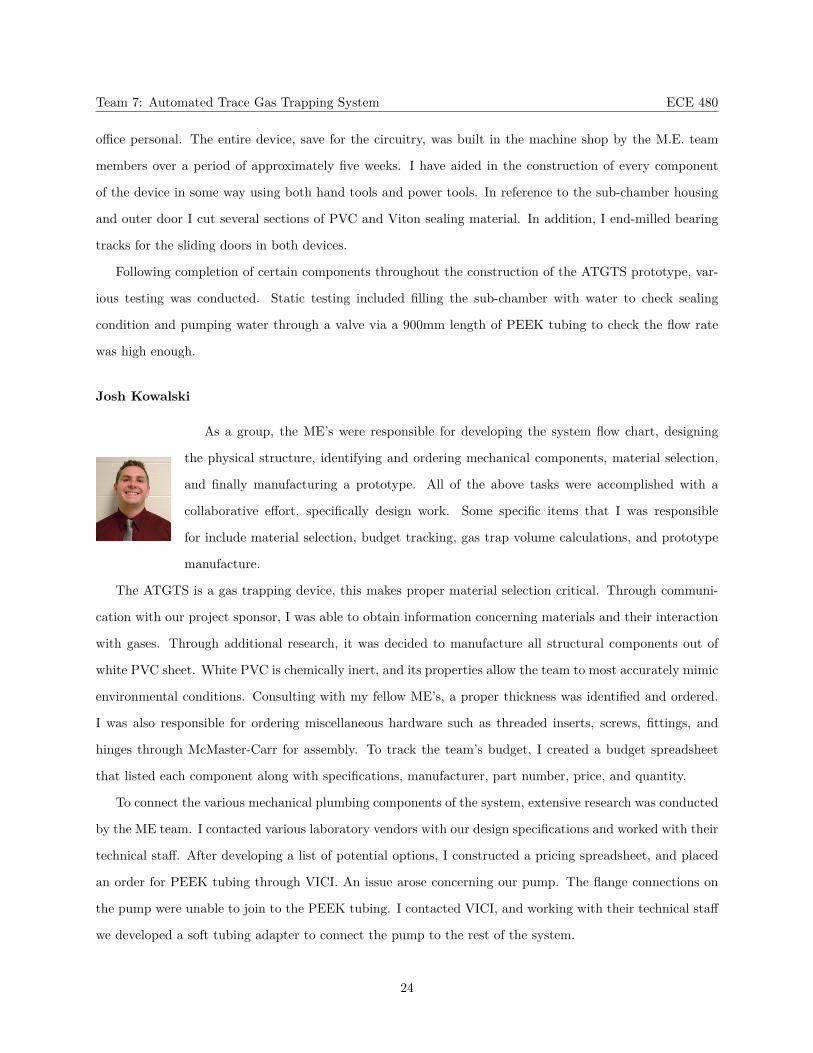
As a group, the ME’s were responsible for developing the system flow chart, designing
the physical structure, identifying and ordering mechanical components, material selection,
and finally manufacturing a prototype. All of the above tasks were accomplished with a
collaborative effort, specifically design work. Some specific items that I was responsible
for include material selection, budget tracking, gas trap volume calculations, and prototype
manufacture.
The ATGTS is a gas trapping device, this makes proper material selection critical. Through communi-
cation with our project sponsor, I was able to obtain information concerning materials and their interaction
with gases. Through additional research, it was decided to manufacture all structural components out of
white PVC sheet. White PVC is chemically inert, and its properties allow the team to most accurately mimic
environmental conditions. Consulting with my fellow ME’s, a proper thickness was identified and ordered.
I was also responsible for ordering miscellaneous hardware such as threaded inserts, screws, fittings, and
hinges through McMaster-Carr for assembly. To track the team’s budget, I created a budget spreadsheet
that listed each component along with specifications, manufacturer, part number, price, and quantity.
To connect the various mechanical plumbing components of the system, extensive research was conducted
by the ME team. I contacted various laboratory vendors with our design specifications and worked with their
technical staff. After developing a list of potential options, I constructed a pricing spreadsheet, and placed
an order for PEEK tubing through VICI. An issue arose concerning our pump. The flange connections on
the pump were unable to join to the PEEK tubing. I contacted VICI, and working with their technical staff
we developed a soft tubing adapter to connect the pump to the rest of the system.
24
Team 7: Automated Trace Gas Trapping System ECE 480
The gas traps of the ATGTS are used to remove CO2 and N2O from the air for measurement. The
extraction of these gases is done at a temperature of 350 C. Moreover, the carbosorb material used to trap
the gases is a strong base. Very few materials can handle these conditions, and it was decided to utilize
stainless steel. Through online research, I found a number of potential vendors. Through data provided by
our project sponsor and independent research, I obtained information to determine the volume of molecular
sieve needed to contain the amounts of gases that we anticipated over a one month time period. I then
developed a spreadsheet to calculate the volumes of our gas traps. From CAD drawings, I was able to
obtain the size restrictions of the housing compartment of the device, and match available sizes to our design
criteria. By modifying the spreadsheet, I was able to minimize trap size while still maintaining a safety
factor of 10.
Upon receiving the building materials, the ME group began manufacture in the engineering machine
shop. Each team member aided in the measurement, cutting, and shaping of each component. From CAD
drawings, I measured component dimensions from the raw PVC sheet material, and cut out these shapes
using the bandsaw. The sub-chamber and outer door of the ATGTS feature sliding door closure systems
comprised of aluminum doors. I milled the shape of the doors to be dimensionally accurate. To attach the
bearings that allow the doors to slide, I first created bearing axles using hardened steel compression pins. I
lathed the pins down to the appropriate outer diameter, and beveled the edges to start to fit the bearings.
Using a piece of scrap wood and a rubber mallet, I placed the bearings on top of the lathed pins, and tapped
the bearings into place. Finally, using a mill, I drilled into the sides of the doors to create the axle housings
and inserted the bearing assembly.
Dan Cashen
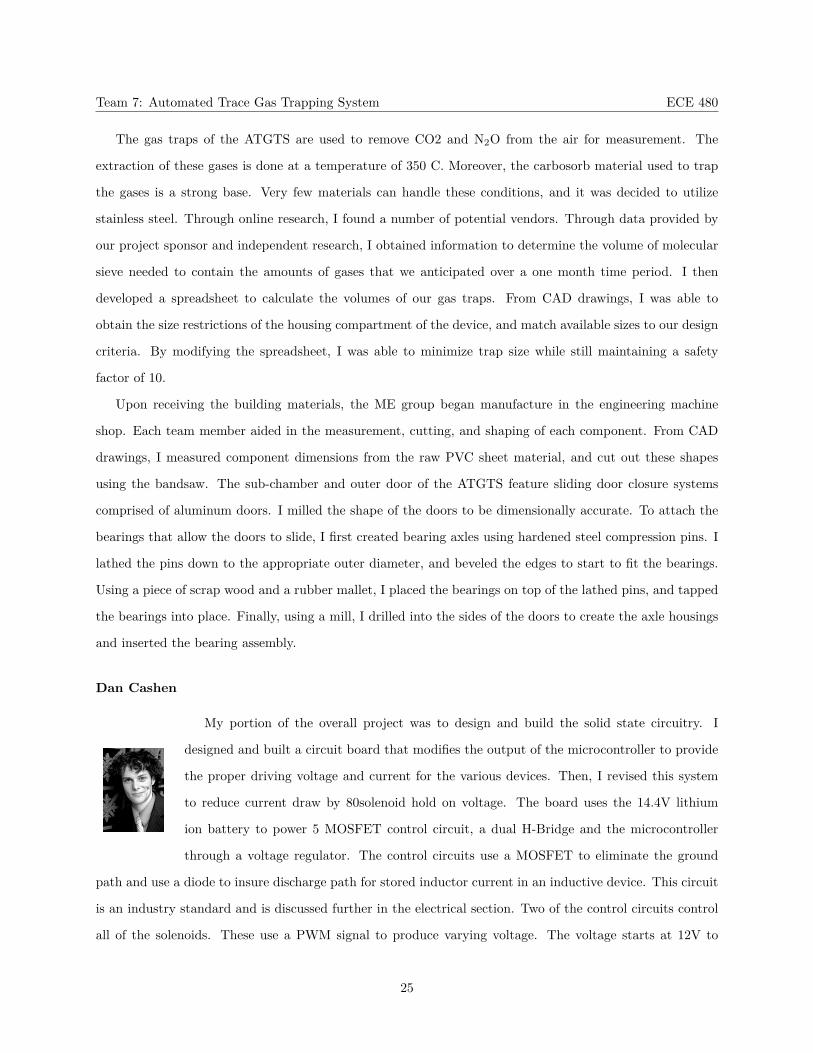
My portion of the overall project was to design and build the solid state circuitry. I
designed and built a circuit board that modifies the output of the microcontroller to provide
the proper driving voltage and current for the various devices. Then, I revised this system
to reduce current draw by 80solenoid hold on voltage. The board uses the 14.4V lithium
ion battery to power 5 MOSFET control circuit, a dual H-Bridge and the microcontroller
through a voltage regulator. The control circuits use a MOSFET to eliminate the ground
path and use a diode to insure discharge path for stored inductor current in an inductive device. This circuit
is an industry standard and is discussed further in the electrical section. Two of the control circuits control
all of the solenoids. These use a PWM signal to produce varying voltage. The voltage starts at 12V to
25
Team 7: Automated Trace Gas Trapping System ECE 480
open the solenoid and then drops to 3V to hold the solenoid open. This substantially reduced the power
consumption of the ATGTS system. The three other control circuits provide power to the fan, pump and
water solenoid as discussed in the electrical section. The microcontroller is driven from a standard voltage
regulator that is also located on this board. The H-bridge is used to reverse the polarity of the signal to the
linier actuators as well as provide enough current to power the linier actuators. I designed, tested and built
the solid state circuitry in this project and it works flawlessly.
I was the manager of the team and this lead me to spend ample time facilitating the completion of the
project. I spent quite some time acquiring missing parts, turning in assignments and scheduling meetings.
I have provided comments suggestions and assistance to virtually every part of this project to insure its
success.
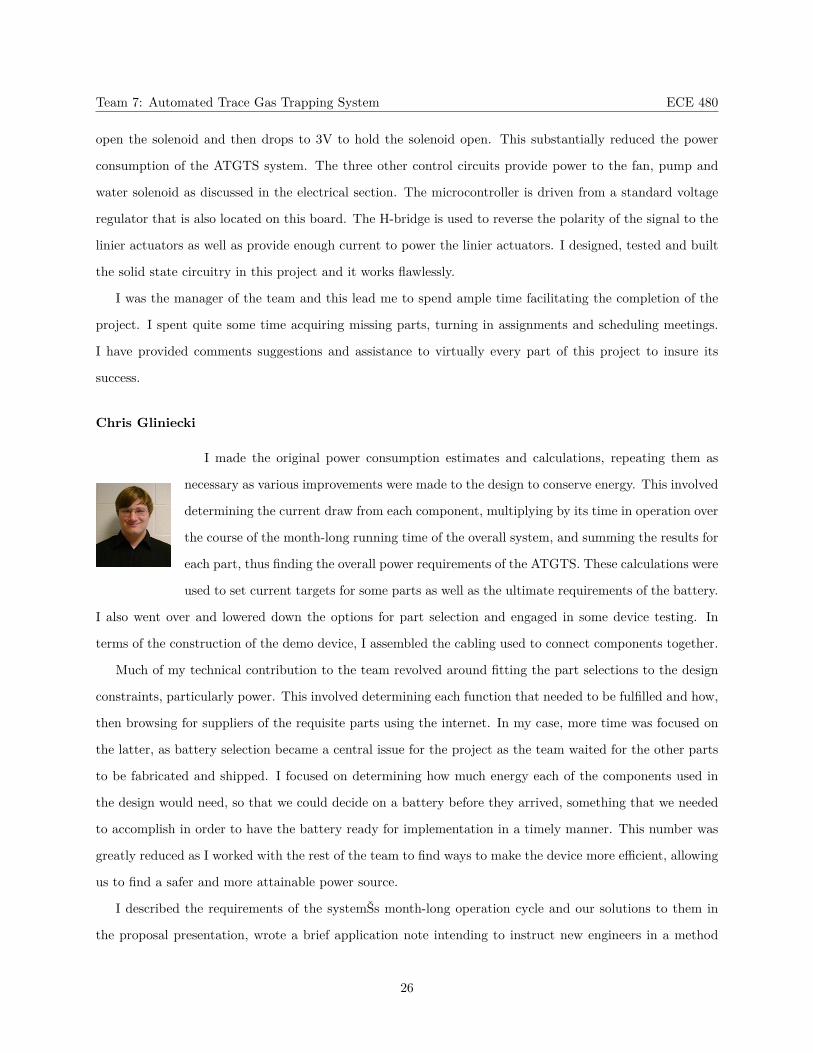
Chris Gliniecki
I made the original power consumption estimates and calculations, repeating them as
necessary as various improvements were made to the design to conserve energy. This involved
determining the current draw from each component, multiplying by its time in operation over
the course of the month-long running time of the overall system, and summing the results for
each part, thus finding the overall power requirements of the ATGTS. These calculations were
used to set current targets for some parts as well as the ultimate requirements of the battery.
I also went over and lowered down the options for part selection and engaged in some device testing. In
terms of the construction of the demo device, I assembled the cabling used to connect components together.
Much of my technical contribution to the team revolved around fitting the part selections to the design
constraints, particularly power. This involved determining each function that needed to be fulfilled and how,
then browsing for suppliers of the requisite parts using the internet. In my case, more time was focused on
the latter, as battery selection became a central issue for the project as the team waited for the other parts
to be fabricated and shipped. I focused on determining how much energy each of the components used in
the design would need, so that we could decide on a battery before they arrived, something that we needed
to accomplish in order to have the battery ready for implementation in a timely manner. This number was
greatly reduced as I worked with the rest of the team to find ways to make the device more efficient, allowing
us to find a safer and more attainable power source.
I described the requirements of the systemŠs month-long operation cycle and our solutions to them in
the proposal presentation, wrote a brief application note intending to instruct new engineers in a method
26
Team 7: Automated Trace Gas Trapping System ECE 480
of estimating the energy requirements of any proposed system similar to the ATGTS, and detailed our own
efforts to reduce power consumption in the design issues paper. It should be noted that each of the other
team members had a hand in all of this, and I occasionally helped others out with the technical components
on which they were focused; this was truly a team effort.
Thomas Hancasky
My portion of the overall project stated in the proposal was the microcontroller selection
and integration. However, over the course of the semester this role was expanded to include
things overlooked or miscalculated. Such things included researching components, making
power calculations, making part selections, and proto-boarding circuits.
The microcontroller was picked for its ease of programmability and ability to take a
design and program any PSoC with similar resources without redesigning a program. I have
exclusively done all the programming of the microcontroller. I researched Cypress forums and watched online
tutorials to gain the knowledge needed to program the PSoC. The program of the microcontroller consists
of a state machine of five states, which includes Mix-Air, CO2 cycle, N2O Cycle, Equilibrate Cycle, and the
Rest Cycle. During each state specific components have been programmed to cycle on and off along with
some error detection features. These features include a pressure sensor, fan RPM speed, and linear actuator
position. If one of these sensors indicates an error has occurred, an LED will flash to indicate to the operator
that an error has occurred.
Due to the fact things were over looked or miscalculated my technical role was expanded to include power
calculations and battery selection. My power calculations concluded that a suitable battery of 1.8kg 25.2AH
can be used as opposed to the 34kg 100AH deep-cycle battery previously proposed. Another contribution
was to research the external timer needed for the project. I provided three usable solutions and e-mailed
them to the group for review and we ended up selecting a 12V fish feeder timer I had researched.
Another technical contribution to the group was the researching and proto-boarding of the MOSFET
relay circuits used in the system to control the solenoid valves, fan, and linear actuators. These circuits
are a modified version from a past design team who used the same LeeCo valves and from research online
other components were added. Our design uses more readily available MOSFETs and incorporates a voltage
canceling diode. Also by using pulse width modulation from the microcontroller the power consumption of
the valves was decreased by roughly 50 percent.
A robust fan was needed for this project in order to operate in the harsh environmental conditions that
27
Team 7: Automated Trace Gas Trapping System ECE 480
the ATGTS would be placed in. I researched a water proof fan with an IP 55 rating and interfaced it with
the microcontroller to monitor its rotational speed to determine if a good sample would be taken. If the fan
RPMs drop, the microcontroller will turn on an LED to notify that an error with the fan has occurred. This
speed is also displayed on the LCD screen along with other relevant information.
Alex Esbrook
My work was primarily focused on bridging the gap between the mechanical and electrical
components of the project. Team 7’s project was unique from others in that from an electrical
standpoint, it was relatively simple. Transistor drive circuits were used to power and control
nearly all portions of the project. However, there was a lot of mechanical work that needed
to be done, from the construction of the sub-chamber to laying out the tubing for air to flow
through. I focused on translating electrical constraints to mechanical ones, and vise versa.
One prime area where this came up was with our solenoids. The mechanical team selected solenoids that
worked, but took a great deal of power to operate. I worked with the mechanical team as well as the other
members to develop a solution for the problem. I also directed our mechanical team members on the use
of a linear motor. Originally, the mechanical design used a rotating door, perfect for a servo. However, we
switched this to a sliding door, which would work well with a linear motor. My prime contribution to this
was in developing our plan for controlling the position of the motor. I also worked on selecting the battery
and choosing our dc/dc converter. I also contributed to the development of the state machine concept for
the microcontroller, as well as the flow diagram of the overall system.
6.2 Gantt Chart
The Gantt Chart is included in the following pages.
28
Team 7: Automated Trace Gas Trapping System ECE 480
Figu
re6.
1:Pa
ge1
ofth
eG
antt
Cha
rt.
29
Team 7: Automated Trace Gas Trapping System ECE 480
Figu
re6.
2:Pa
ge2
ofth
eG
antt
Cha
rt.
30
Team 7: Automated Trace Gas Trapping System ECE 480
Figure 6.3: Enlarged view of the Gantt Chart labels.
31
Team 7: Automated Trace Gas Trapping System ECE 480
6.3 Bill of Materials
Component Details Company Part Number # Price Total1 Li-Ion Battery Pack: 14.8V 25.2Ah BatterySpace PL-8570170-4S2P-CAR 1 $334.50 $334.502 Smart Charger (6.0A) BatterySpace CH-Z-USC-14.8V-6.0 1 $74.95 $74.953 Pressure Sensor Digi-Key MPX4250AP-ND 1 $12.45 $12.454 60mm Fan Screen Digi-Key CR373-ND 1 $2.77 $2.775 Motor Driver H-Bridge IC Digi-Key 497-2936-5-ND 1 $6.24 $6.246 Waterproof Axial Fan 60mm Newark 96M1774 1 $48.78 $48.787 Programmable Timer Super-Feed Enterprise dt01 1 $66.95 $66.958 DC/DC Converter, 60W Newark 06P9791 1 $9.78 $9.789 Data Logger, IP67 Thermoworks TW-USB-2 1 $82.00 $82.00
10 Connector,Wire/Cable Grainger 3BY21 3 $6.86 $20.5811 3/8 in. Tube OD x 1/4 in. Male NPT Swagelok SS-600-1-4 4 $9.50 $38.0012 Reducer, 1/8 to 1/16 Swagelok SS-100-R-2 2 $12.90 $25.8013 Reducer, 1/4 in. x 3/8 in. Tube OD Swagelok SS-400-R-6 4 $9.00 $36.0014 Reducer, 1/4 to 1/16 Swagelok SS-100-R-4 6 $15.80 $94.8015 Aluminum, for 1/8” ID tubing Swagelok SS-400-R-8 2 $10.40 $20.8016 Quick-Connect 1.0 Cv, 3/8 in. Swagelok SS-QC6-S-600 4 $24.40 $97.6017 Quick-Connect Body Swagelok SS-QC6-B-4PM 4 $36.30 $145.2018 Quick-Connect Stem 2.4 Cv, 1/2 in. Swagelok SS-QC8-S-810 2 $31.50 $63.0019 Quick-Connect Body Swagelok SS-QC8-B-8PM 2 $59.50 $119.0020 Bellows-Sealed Valve, Welded, 1/4 in. Swagelok SS-4H4 4 $139.40 $557.6021 5 m, 1/16” OD, 0.055” ID VICI TPK155-5M 1 $95.00 $95.0022 1/16” OD to 1/16”-3/32” ID Peristaltic Upchurch Scientific P-797 2 $12.55 $25.1023 PEEK, 1/16” OD, 0.01” ID Upchurch Scientific M-657 28 $13.11 $367.0824 5’, 1/4” OD, 1/8” ID McMaster-Carr 5046K11 1 $8.05 $8.0525 12” x 12”, 1/8” thick McMaster-Carr 3156T13 1 $92.02 $92.0226 12v, 2 Way Normally closed Lee Company LFVA1210420H 5 $139.79 $698.9527 12v, 3 Way, Normally closed Lee Company LFRX0501900B 5 $145.15 $725.7528 60mm x 25mm frame, 12v ADDA AQ0612LB-A70GL-LF 1 $11.50 $11.5029 Microcontroller Cypress CY3214-PSoCEvalUSB 1 N/A $0.0030 Linear Actuator, 60mm stroke, 12v Fergelli Automations - 2 $80.00 $160.0031 NC, 1/4” port size, 12v, Viton seal STC Valve 2S040 1 $48.00 $48.0032 8mm OD, Shields on both sides Motion Industries Inc. 693ZZ 8 $11.68 $93.4433 300mm diameter N/A $0.0034 1’, 0.5” OD, 0.46” ID, seamless onlinemetals.com 3 $6.85 $20.5535 7.7mm ID, 9.5 mm OD N/A $0.0036 2 $0.0037 Draw latch McMaster-Carr 6082A12 5 $4.20 $21.0038 Brass, 100 count, 5/32”, 2-56 McMaster-Carr 92395A111 1 $11.00 $11.0039 Steel, 100 piece, 2-56, 5/8” McMaster-Carr 91802A074 1 $5.86 $5.8640 Brass, press fit, 50 count, 1/4”, 6-32 McMaster-Carr 92395A113 1 $12.00 $12.0041 Aluminum, for 1/8” ID tubing McMaster-Carr 5058K551 2 $4.00 $8.0042 2ft by 2 ft, 1/4” McMaster-Carr 8747K148 1 $29.43 $29.4343 Crimp Style pin, Male Tyco 102107-3 20 $0.25 $4.9244 Crimp Style pin, Female Tyco 87750-3 20 $0.35 $6.9445 Crimp Style pin, Housing Tyco 87499-3 20 $1.23 $24.6046 Brass barbed fitting Watts A-740 2 $1.65 $3.3047 Brass Pipe Nipple Watts A-741 1 $2.35 $2.3548 Gloss Clear Rust-Oleum 1901830 1 $3.49 $3.4949 Plastic White Paint Rust-Oleum 211339 1 $4.99 $4.9950 Lacquer Thinner, 1qt Sunnyside 45732 1 $6.29 $6.2951 15ft Braided wire Anchorwire 121127 1 $2.91 $2.9152 Corner Brace, 1” Ultra 16400 2 $3.49 $6.98
Total: $4,356.30
Table 6.1: Bill of Materials
32
Team 7: Automated Trace Gas Trapping System ECE 480
6.4 Literature and website refrences
1. Braswell, B.H., D.S. Schimel, E. Linder and B. Moore, 1987: The response of global terrestrial ecosystems
to interannual temperature variability. Science, 278, 870-872.
2. K. A. Smemo, N. Ostrom, and G. P. Robertson 2008 unpublished
3. Halpert, M.S. and G.D. Bell, 1997: Climate assessment for 1996. Bull. Amer. Meteor. Soc., 78, 1-49.
4. Hengeveld, H. and P. Kertland 1995. An assessment of new developments relevant to the science of
climate change. Climate Change Newsletter (Australian Bureau of Resource Sciences, Canberra), 7, August,
24p
33
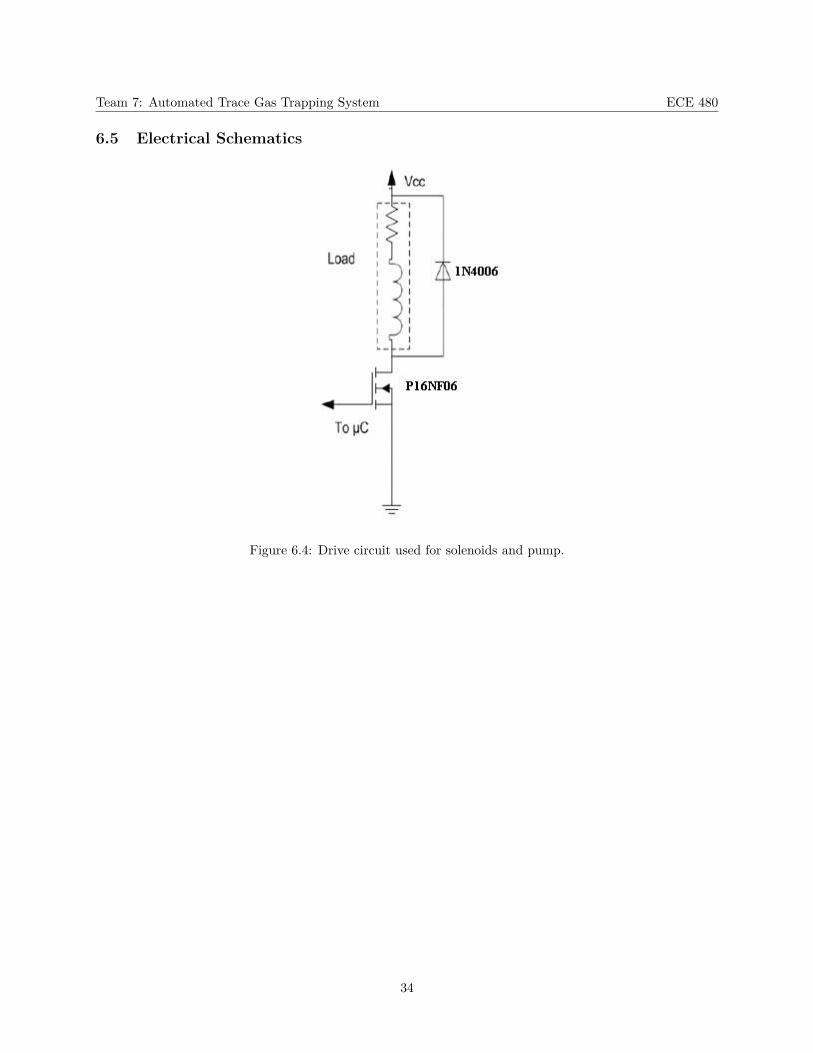
Team 7: Automated Trace Gas Trapping System ECE 480
6.5 Electrical Schematics
Figure 6.4: Drive circuit used for solenoids and pump.
34
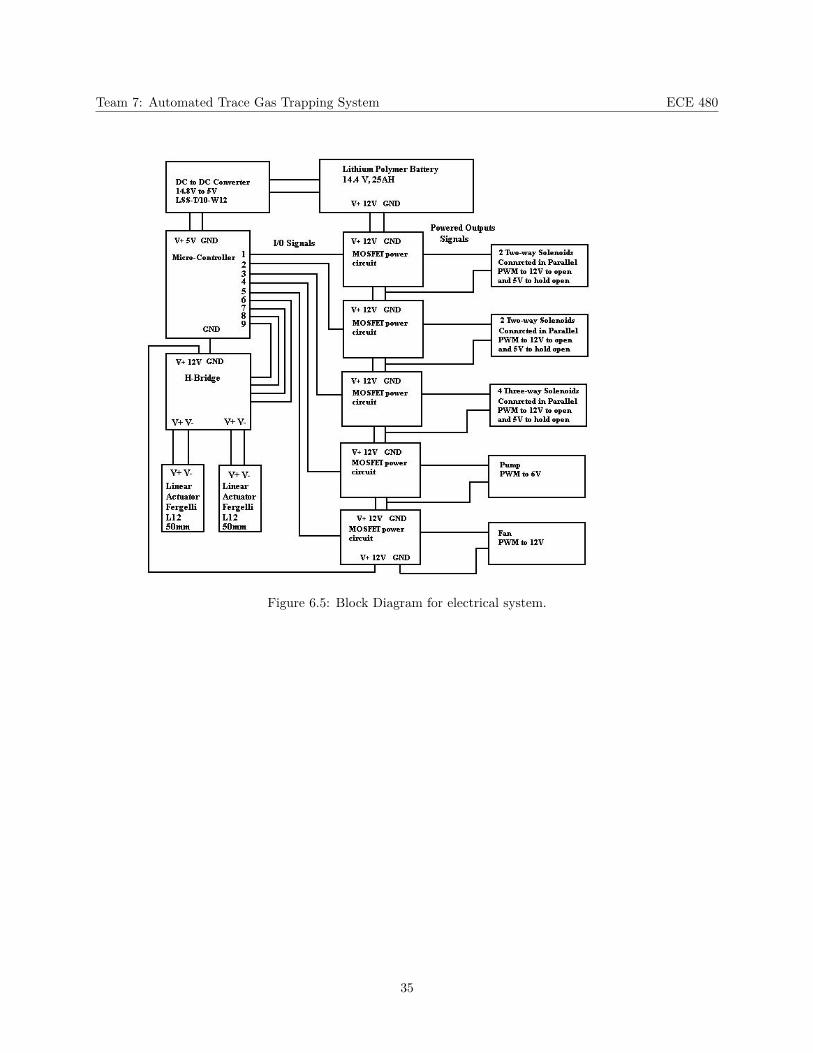
Team 7: Automated Trace Gas Trapping System ECE 480
Figure 6.5: Block Diagram for electrical system.
35

Team 7: Automated Trace Gas Trapping System ECE 480
6.6 Mechanical Calculations
CO2 Chemical Trap Volume CalculationCO2 concentration in air (L of CO2/ L of air) 0.01
N2O sub chamber volume (L) 0.15 InputsHours between cycle (hrs) 4
Cycles per month 186Volume of CO2 in sub chamber (L) 0.0015
CO2 density (g/L) 1.799Mass of CO2 in sub chamber (g) 0.0027
Mass of all CO2 extracted over 1 month period (g) 0.5019Mass of CO2 removed from 1g of Carbosorb (g) 0.4
Mass of Carbosorb needed for Chemical CO2 trap (g) 1.2548Mass of Carbosorb w/ safety factor of 2 (g) 2.5096
Volume of Carbosorb in 1g (L) 0.0015Volume of Carbosorb needed for chemical CO2 trap (L) 0.0038
Table 6.2: Calculation for the size of the CO2 chemical trap.
N2O Molecular Sieve Trap Volume CalculationN2O concentration in air (L of CO2/ L of air) 0.00002
N2O sub chamber volume (L) 0.15 InputsHours between cycle (hrs) 4
Cycles per month 186Volume of N2O in sub chamber (L) 0.000003
N2O density (g/L) 1.799Mass of N2O in sub chamber (g) 0.00001
Mass of all N2O extracted over 1 month period (g) 0.001004Mass of N2O removed from 1g of Sieve 5A (g) 0.4
Mass of Sieve 5A needed for Chemical N2O trap (g) 0.00251Mass of Sieve 5A w/ safety factor of 2 (g) 0.005019
Volume of Sieve 5A in 1g (L) 0.0015Volume of Sieve 5A needed for chemical CO2 trap (L) 7.53E-06 Output
Table 6.3: Caculation for the size of the Molecular Sieve trap
Volume of water collected in one monthFor 100% RH, 20řC, Mass of water in 1 liter of air per cycle (mg) 8.6
Mass of water in a 3 liter volume (mg) 25.8 InputDensity of water at 20řC (g/L) 1000
Time between each cycle (hours) 4Number of cycles per month 186
Mass of water in a 3 liter volume after one month of cycles (g) 4.7988Volume of water collected in one month (mL) 4.7988
Volume of water collected in one month considering a factor of safety of 2 (mL) 9.5976 Output
Table 6.4: Calculation for the size of the Desiccant trap
36
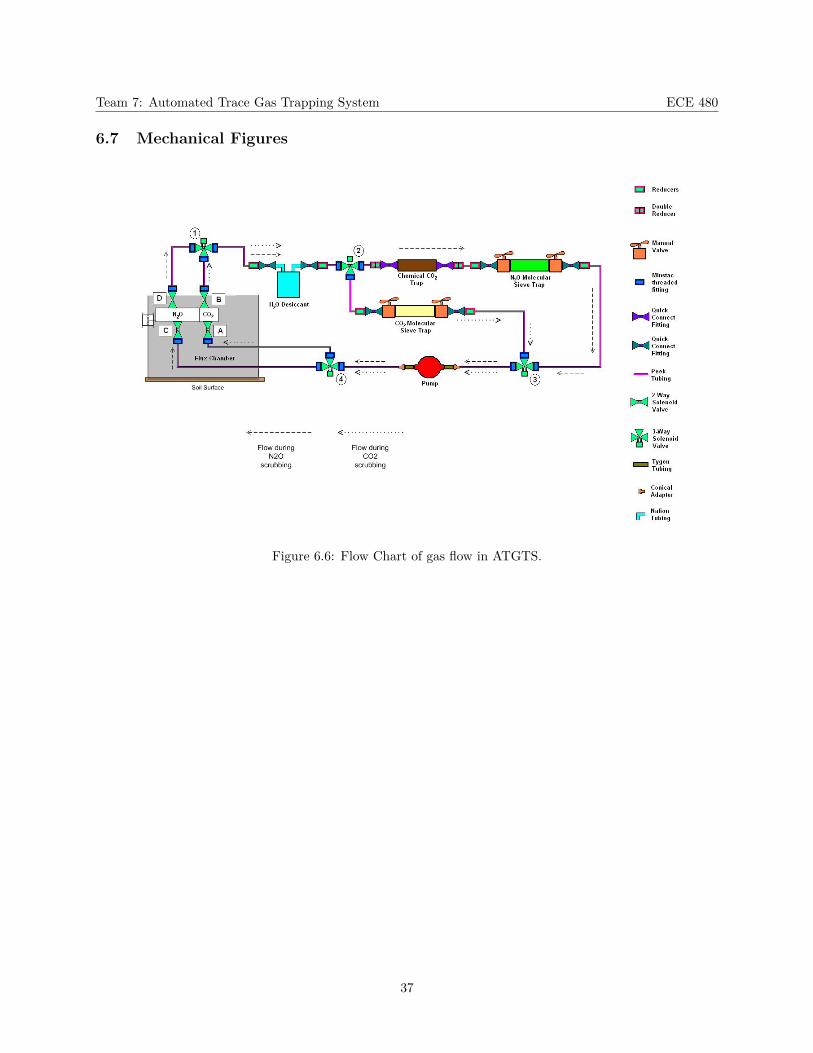
Team 7: Automated Trace Gas Trapping System ECE 480
6.7 Mechanical Figures
Figure 6.6: Flow Chart of gas flow in ATGTS.
37
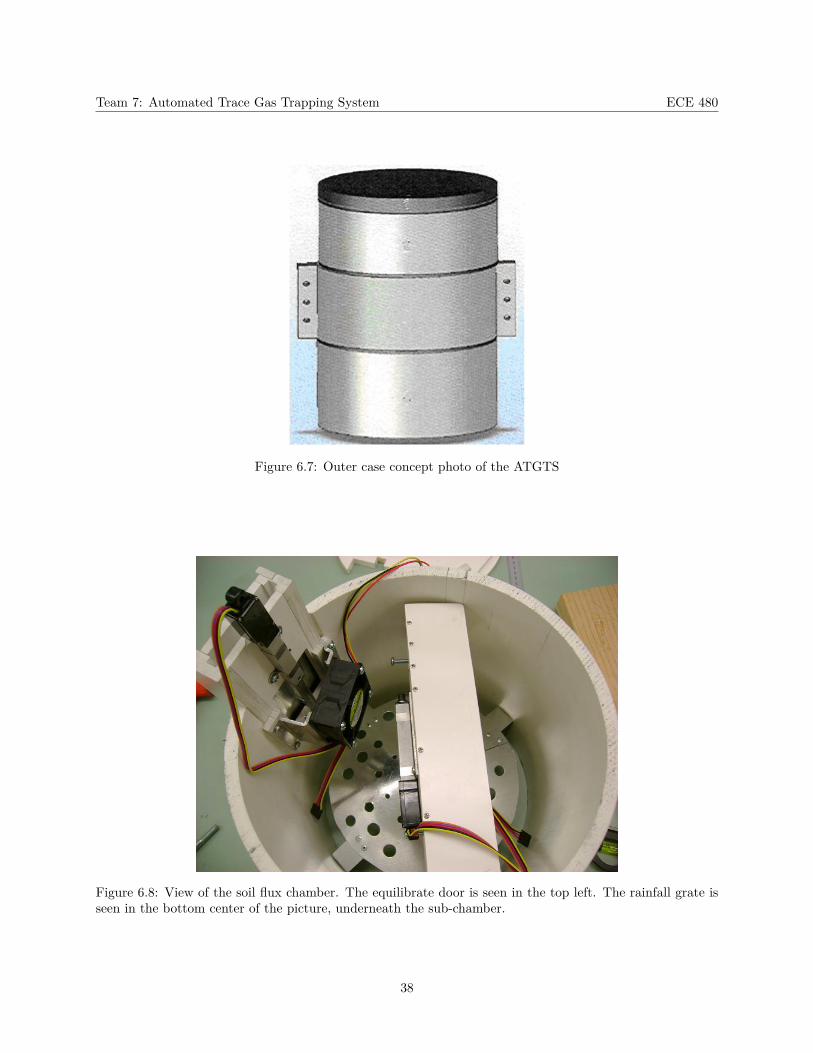
Team 7: Automated Trace Gas Trapping System ECE 480
Figure 6.7: Outer case concept photo of the ATGTS
Figure 6.8: View of the soil flux chamber. The equilibrate door is seen in the top left. The rainfall grate isseen in the bottom center of the picture, underneath the sub-chamber.
38
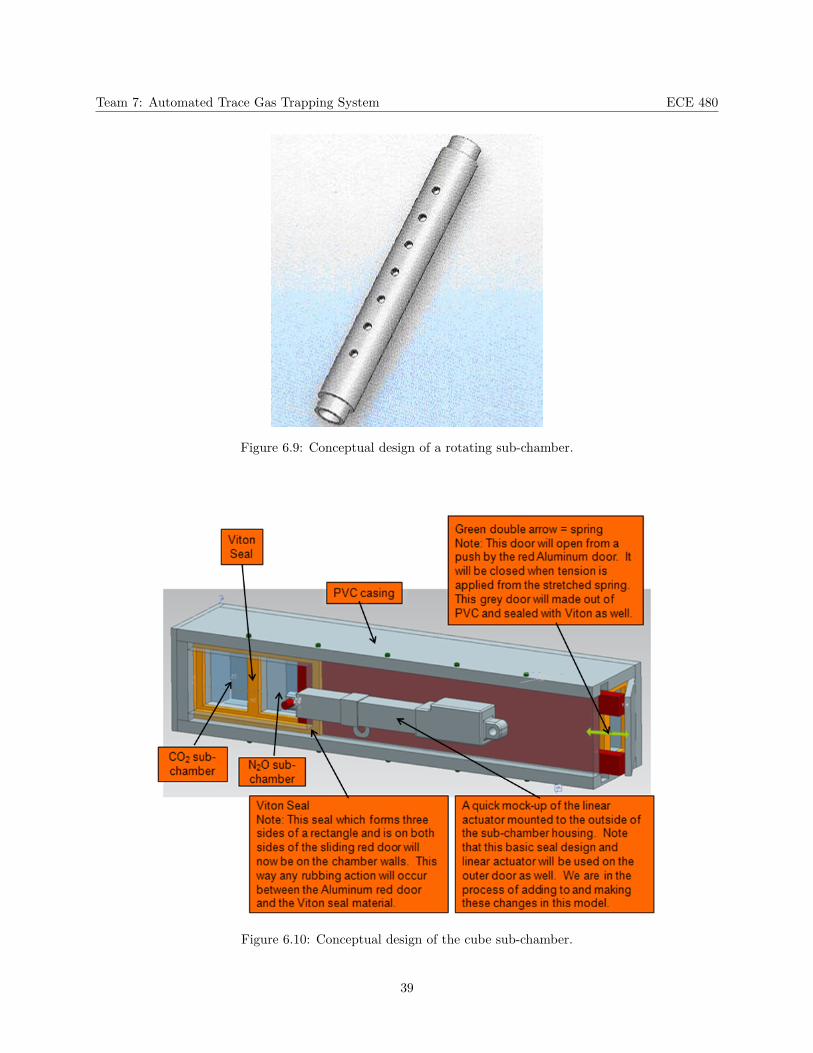
Team 7: Automated Trace Gas Trapping System ECE 480
Figure 6.9: Conceptual design of a rotating sub-chamber.
Figure 6.10: Conceptual design of the cube sub-chamber.
39
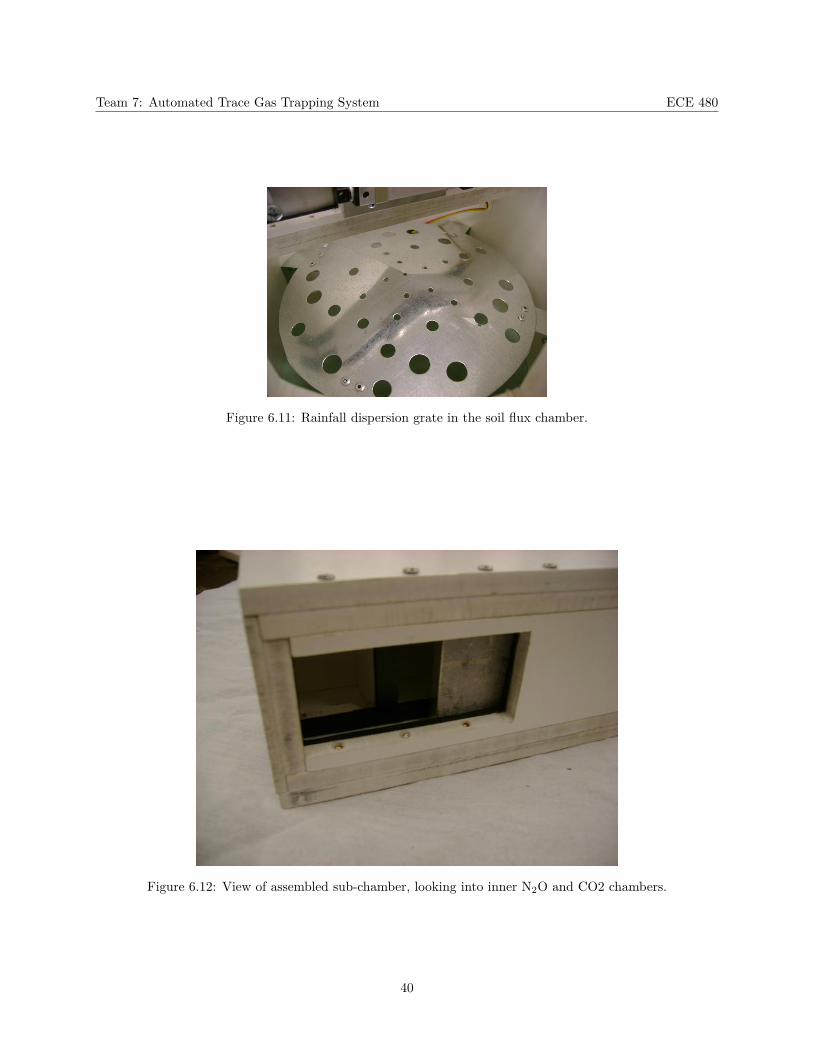
Team 7: Automated Trace Gas Trapping System ECE 480
Figure 6.11: Rainfall dispersion grate in the soil flux chamber.
Figure 6.12: View of assembled sub-chamber, looking into inner N2O and CO2 chambers.
40
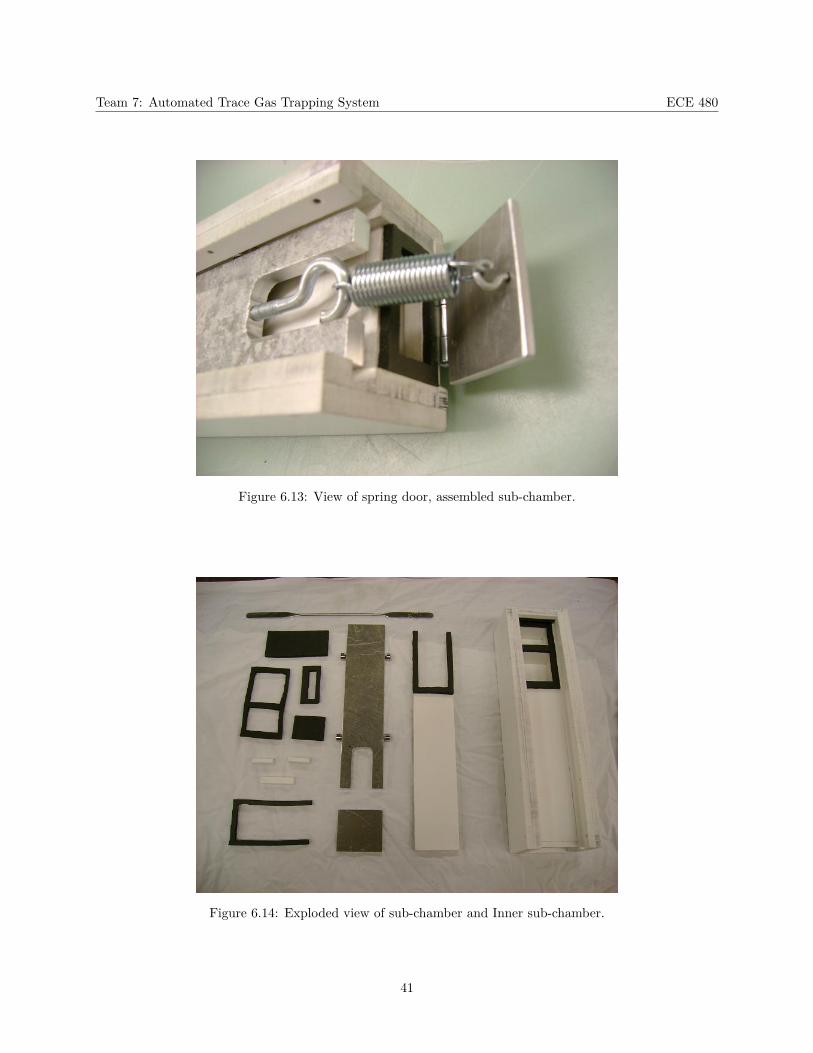
Team 7: Automated Trace Gas Trapping System ECE 480
Figure 6.13: View of spring door, assembled sub-chamber.
Figure 6.14: Exploded view of sub-chamber and Inner sub-chamber.
41
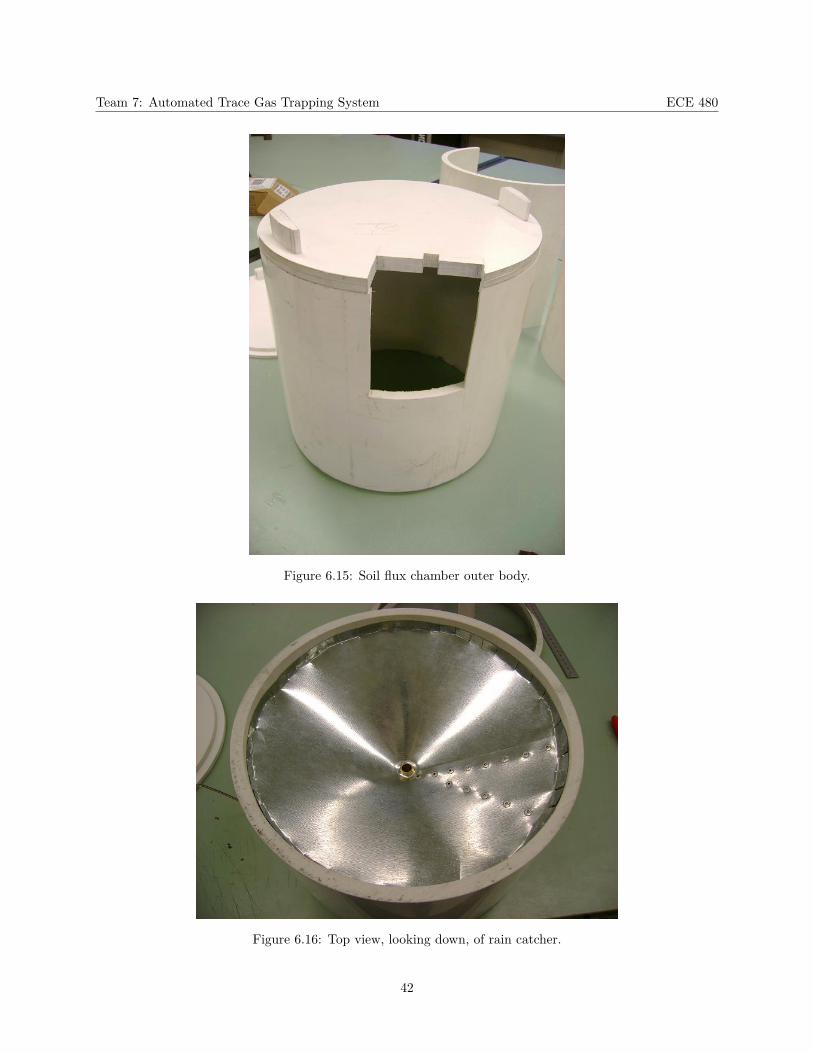
Team 7: Automated Trace Gas Trapping System ECE 480
Figure 6.15: Soil flux chamber outer body.
Figure 6.16: Top view, looking down, of rain catcher.
42
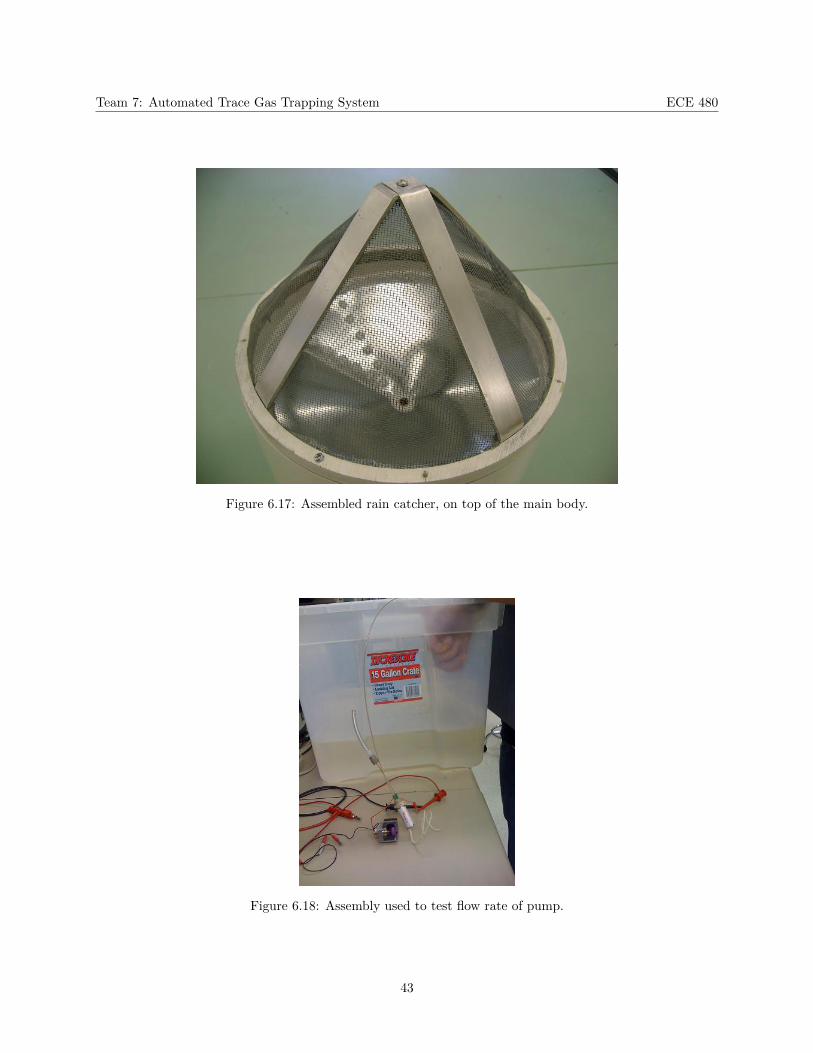
Team 7: Automated Trace Gas Trapping System ECE 480
Figure 6.17: Assembled rain catcher, on top of the main body.
Figure 6.18: Assembly used to test flow rate of pump.
43
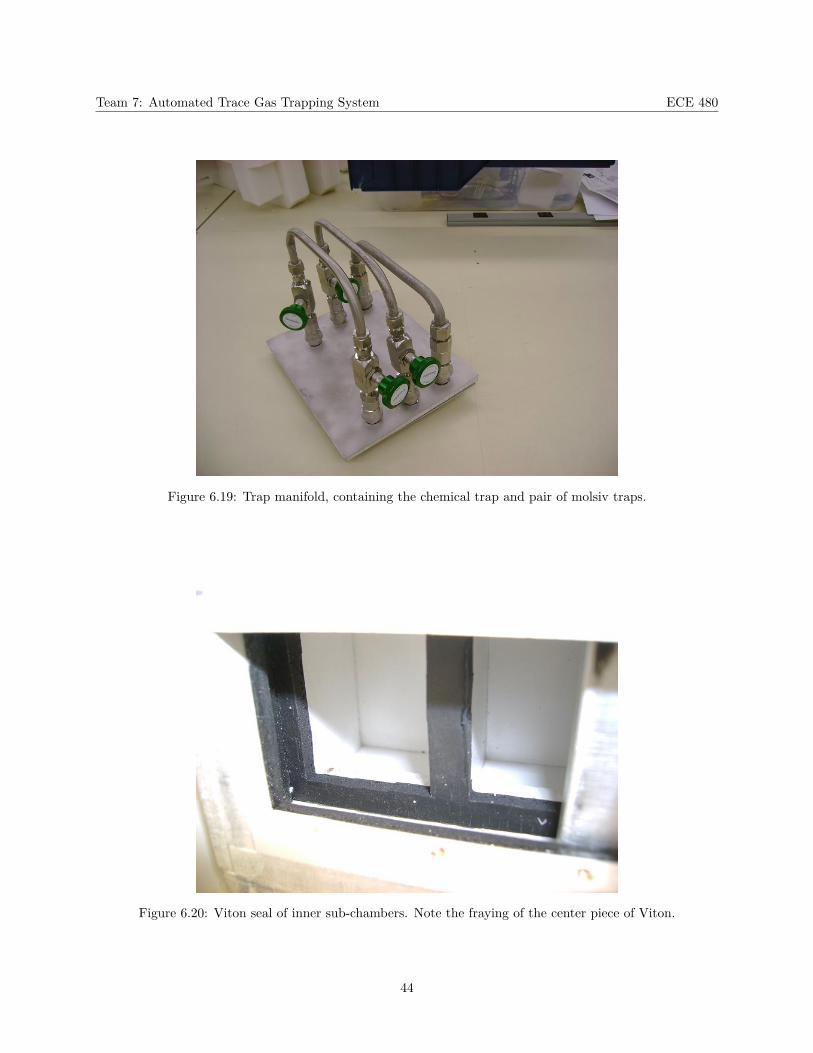
Team 7: Automated Trace Gas Trapping System ECE 480
Figure 6.19: Trap manifold, containing the chemical trap and pair of molsiv traps.
Figure 6.20: Viton seal of inner sub-chambers. Note the fraying of the center piece of Viton.
44