Embed Size (px)
Citation preview

International Journal on Electrical Engineering and Informatics ‐ Volume 4, Number 3, October 2012
Automated PRPD Pattern Analysis using Image Recognition
A. Müller, M. Beltle and S. Tenbohlen
Institute of Power Transmission and High Voltage Technology University of Stuttgart, Stuttgart, Germany
Abstract: This contribution describes an evaluation method for phase resolved patterns of partial discharges over time. Therefore, their specific shape characterizes patterns in question. The method searches for these characteristics within PRPD patterns by comparing characterization and PRPD using 2-dimensional cross-correlation. Cross-correlation represents a measure for the similarity between different PRPD patterns. A use case determines the usability of the method in practice. The result is the time dependent occurrence of specific patterns, respectively specific PD sources. Long-term monitoring data of an aged generator step-up transformer with several PD sources of varying activity is used as PD dataset. PDs are recorded by the use of the electro magnetic PD measurement method, also known as the UHF-method. Keywords: Partial discharge; long-term measurement; UHF method; monitoring; phase resolved patterns; cross-correlation;
1. Introduction Power transformers are essential equipment concerning the availability of electrical energy networks. Local failures of the insulation may lead to breakdowns and can cause high outage and penalty costs. To prevent destroying events, power transformers are tested. Common advanced diagnosis methods for transformers in service are given by dissolved gas analysis (DGA) [1], Frequency Response Analysis (FRA) [2], moisture measurement [3] and electrical partial discharges (PDs) measurements [4]. They are performed during routine tests of new transformers. Today, also PD measurements during service are a qualified method for particular transformers. Because common PD diagnostics are measurements performed within hours, it only provides snapshot information about transformers’ condition. In contrast, permanent online monitoring of PD is used to gain operational experiences and evaluate trending. In comparison to existing methods for transformer diagnosis, monitoring demands new methods and strategies for evaluation. The continuous data stream generated by monitoring devices has to be treated differently than single measurements performed for diagnostic purposes. Required are methods, which allow the determination of long-term measurement. For the analysis of large amounts of data the user needs assistance which can be realized e.g. by statistical evaluation and extraction of significant information. This can be done simultaneously during monitoring or for post-measurement evaluation. Considering these demands, this contribution presents a method for automated PRPD pattern analysis. Aim is to evaluate several PD sources independently. Therefore, sources have to be distinguished by its characteristic PRPD pattern. As an approach for the evaluation, 2-dimensional cross-correlation known from image recognition is introduced. It compares the characteristic of a source (its shape) with measured PRPD patterns. The resulting correlation coefficient is a measure for the similarity. Hence, a high correlation coefficient indicates the appearance of the source in the determined PRPD pattern. By performing cross-correlation over the entire database, the activity of sources can be traced and evaluation of the overall PD of the transformer and causing sources can be made. Received: February 29th, 2012. Accepted: October 30th, 2012
483
2. Measurement Setup of the Use case The need of assistance in data evaluation is illustrated by this use case: At a 50-year-old step-up transformer generator with a rated voltage of 110/10 kV and a rated power of 120 MVA an online PD measurement system records data [5]. Since the beginning of the monitoring process in the summer of 2009, the generator step-up transformer has been in service for 80 days. An electrical PD measurement with external high voltage coupling capacitors shows different PD sources on each phase with PD between 100 and 500 pC. Also, unsteady PD up to 1 nC was occasionally observed [6]. Electrical PD measurement according to IEC 60270 [4] shows certain drawbacks for permanent onsite, online measurements. Therefore, the so called “UHF PD measuring method” (UHF: Ultra High Frequency) is used. It is based on the fact that PD are fast electrical processes radiating electromagnetic waves with frequencies up to the ultrahigh range (UHF: 300 – 3000 MHz) in the surrounding oil. Due to the moderately attenuated propagation of UHF waves inside the transformer tank, the electromagnetic wave detection is very sensitive [7]. In addition, the transformer tank is grounded and represents a Faraday cage shielding external noise like corona. An UHF probe (Figure 1) is installed in an oil flange valve of the transformer [8], for the measurement of UHF PD. Compared to electrical PD measurements; the UHF method has to be treated differently. Unlike electrical PD measurements, UHF measurements cannot be calibrated in terms of apparent charge in Pico coulombs (pC) because the strength of the electromagnetic field is measured. However, like electrical measurements, it is possible to correlate PD to the phase angle of the applied voltage using the phase resolved PD (PRPD) pattern. The UHF PD monitoring of the transformer is done with a Double Lemke LDS-6/UHF measuring system. UHF PD signals are measured with approximately 35 dB amplification and a bandwidth of 9 MHz at a center frequency of 505 MHz Phase L1 is used for phase correlation and Matlab is used for data analysis. Like the electrical measurement, UHF also shows several active PD sources in the transformer and fast changes in both the shape of PD patterns and amplitude levels.
Figure 1. UHF Probe for the inside tank measurement of UHF PD [8]
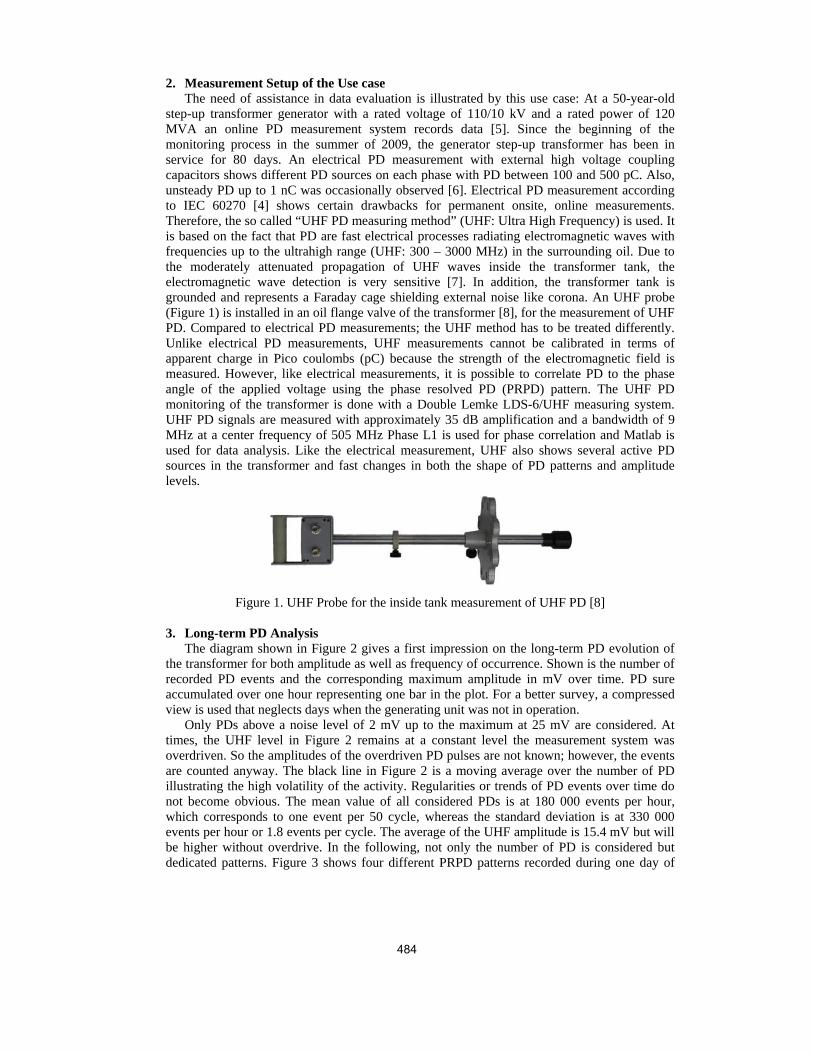
3. Long-term PD Analysis The diagram shown in Figure 2 gives a first impression on the long-term PD evolution of the transformer for both amplitude as well as frequency of occurrence. Shown is the number of recorded PD events and the corresponding maximum amplitude in mV over time. PD sure accumulated over one hour representing one bar in the plot. For a better survey, a compressed view is used that neglects days when the generating unit was not in operation. Only PDs above a noise level of 2 mV up to the maximum at 25 mV are considered. At times, the UHF level in Figure 2 remains at a constant level the measurement system was overdriven. So the amplitudes of the overdriven PD pulses are not known; however, the events are counted anyway. The black line in Figure 2 is a moving average over the number of PD illustrating the high volatility of the activity. Regularities or trends of PD events over time do not become obvious. The mean value of all considered PDs is at 180 000 events per hour, which corresponds to one event per 50 cycle, whereas the standard deviation is at 330 000 events per hour or 1.8 events per cycle. The average of the UHF amplitude is 15.4 mV but will be higher without overdrive. In the following, not only the number of PD is considered but dedicated patterns. Figure 3 shows four different PRPD patterns recorded during one day of
484
service. TTherefore
Figure 3
4. Norm Cross-images ardefined adefines thspeaking,correlatiodimensionimage at e
The variety mae, mathematica
Figure 2. En
. Four example
malized Cross-C-correlation is re alike, the higs search paramhe so called it is a measure
on factor of temnal result matreach position o
kes manual eval evaluation be
ntire PD event
es of different 120 MV
Correlation an algorithm
gher is the corrmeter, but one s
template. Teme for the similamplate and imarix, whose cooof the original i
valuation of sinecomes necessa
s per hour and
patterns measuVA generator s
for pattern recrelation. Typicasignificant detamplate and imarity between tage for each poordinates repreimage.
ngle patterns coary.
corresponding
ured by UHF-metup-up unit.
cognition withally, for applicail characterizi
mage are crossthe entries of twosition of the isent the correl
omplex and tim
g max. amplitu
monitoring at th
hin an image. cation not the eing the pattern s-correlated. Mwo matrices. Timage. It is prolation factor o
me-consuming.
ude
he considered
The more twoentire pattern isis extracted. It
MathematicallyThe result is theovided by a 2-f template and
.
o s t y e -d
485
A. Princi TempPRPD paValues inmeaning. both matrfor the sipossible ifor all cooccurrencsearched makes cointersectiooffset. Thmathematand (2) ncross-corrmatrix C and -1 det
Figurecorrelatiocorrelatio B. Examp A PRPaccumulahours, leapattern oc
F
iple of work late and image
attern. Its matrn between are
For cross-corrrices are multipimilarity betwintersections yombinations oce of the pattein a quantity o
orrelation factoon of templatehe result is dtical equationsnormalized 2-drelation for allcontains valuetects inversion
e 4. Mathemon (2) of imagon coefficient m
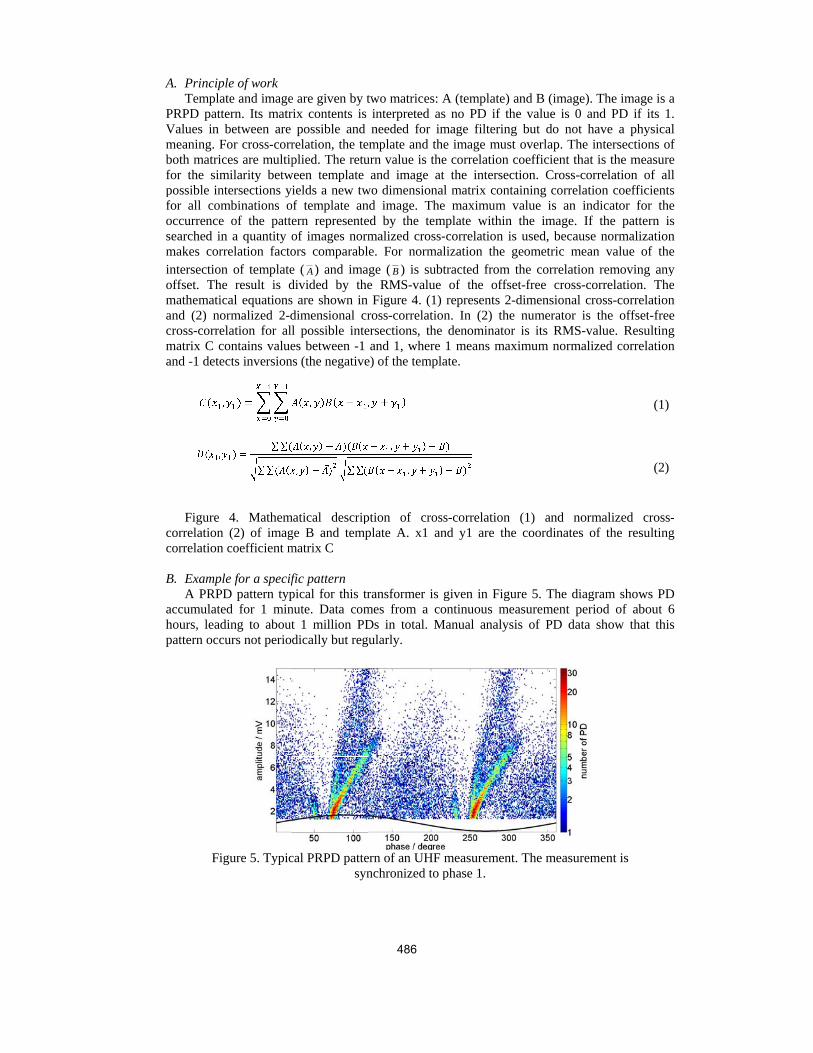
ple for a specifPD pattern typ
ated for 1 minading to aboutccurs not perio
Figure 5. Typic
e are given by trix contents is
possible and relation, the teplied. The retu
ween template ields a new tw
of template anern representeof images normors comparable (
__
A ) and imadivided by thes are shown indimensional crl possible intees between -1
ns (the negative
matical descripge B and tempmatrix C
fic pattern pical for this trnute. Data comt 1 million PDdically but reg
cal PRPD pattesyn
two matrices: Ainterpreted asneeded for im
emplate and theurn value is the
and image atwo dimensionalnd image. Theed by the temmalized cross-le. For normalage ( __
B ) is subte RMS-value Figure 4. (1)
ross-correlationersections, the and 1, where
e) of the templa
ption of crossplate A. x1 an
ransformer is gmes from a coDs in total. Mgularly.
ern of an UHF mnchronized to p
A (template) ans no PD if themage filtering e image must e correlation cot the intersectil matrix contai
e maximum vamplate within t-correlation is lization the getracted from thof the offsetrepresents 2-dn. In (2) the denominator 1 means maxiate.
s-correlation nd y1 are the
given in Figurontinuous mea
Manual analysis
measurement. phase 1.
nd B (image). e value is 0 an
but do not haoverlap. The inoefficient that ion. Cross-corining correlatioalue is an indthe image. If used, because
eometric meanhe correlation t-free cross-codimensional cronumerator is is its RMS-va
imum normaliz
(1) and normcoordinates o
re 5. The diagrasurement peris of PD data
The measurem
The image is and PD if its 1.ave a physicalntersections ofis the measure
rrelation of allon coefficientsdicator for thethe pattern isnormalization
n value of theremoving any
orrelation. Theoss-correlationthe offset-free
alue. Resultingzed correlation
(1)
(2)
malized cross-f the resulting
ram shows PDod of about 6show that this
ment is
a . l f e l s e s n e y e n e g n
-g
D 6 s
486
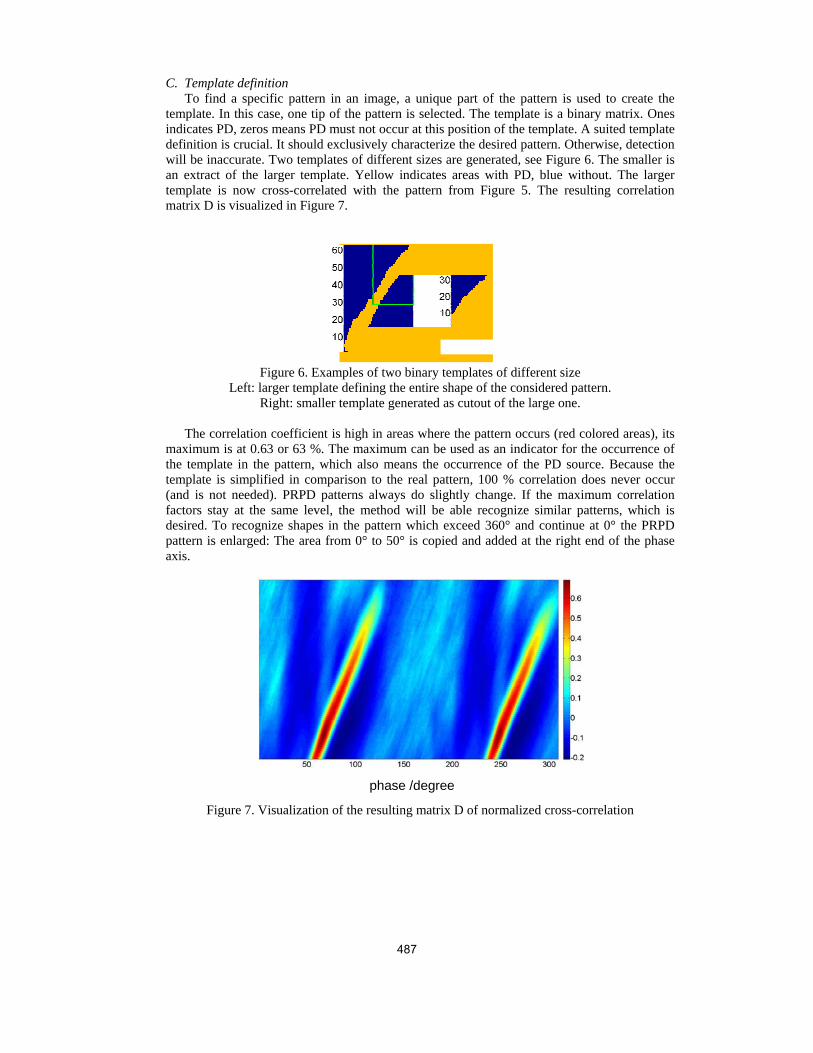
C. Template definition To find a specific pattern in an image, a unique part of the pattern is used to create the template. In this case, one tip of the pattern is selected. The template is a binary matrix. Ones indicates PD, zeros means PD must not occur at this position of the template. A suited template definition is crucial. It should exclusively characterize the desired pattern. Otherwise, detection will be inaccurate. Two templates of different sizes are generated, see Figure 6. The smaller is an extract of the larger template. Yellow indicates areas with PD, blue without. The larger template is now cross-correlated with the pattern from Figure 5. The resulting correlation matrix D is visualized in Figure 7.
Figure 6. Examples of two binary templates of different size
Left: larger template defining the entire shape of the considered pattern. Right: smaller template generated as cutout of the large one.
The correlation coefficient is high in areas where the pattern occurs (red colored areas), its maximum is at 0.63 or 63 %. The maximum can be used as an indicator for the occurrence of the template in the pattern, which also means the occurrence of the PD source. Because the template is simplified in comparison to the real pattern, 100 % correlation does never occur (and is not needed). PRPD patterns always do slightly change. If the maximum correlation factors stay at the same level, the method will be able recognize similar patterns, which is desired. To recognize shapes in the pattern which exceed 360° and continue at 0° the PRPD pattern is enlarged: The area from 0° to 50° is copied and added at the right end of the phase axis.
Figure 7. Visualization of the resulting matrix D of normalized cross-correlation
phase /degree
487

D. Image preprocessing Depending on the quality of the available PRPD patterns, image preprocessing can help to improve correlation results. If a pattern consists of few PD (e.g. if accumulation time is short) requirements of the template are not fulfilled in the pattern and hence, correlation coefficients are low. If only few PD events are available, the pattern has to be preprocessed. Single pixels by PD have to be transformed into areas being suited for cross-correlated. In this approach, averaging filters are used. The filter joins nearby small areas containing PD by blurring them together; Figure 8 illustrates the general process. The filter calculates the value (the number of PD) of a single pixel by building the mean value of its surrounding pixels. For this contribution, filters of sizes 3x3 and 5x5 were used and tested. As can be seen in Table 1, the larger filter did not improve correlation results.
Figure 8. Principle of 3x3 averaging filter. Left: original shape, right: blurred shape
E. Application For long-term evaluation, the available data is segmented into constant intervals. For each interval, e.g. one hour or one minute, the PRPD pattern is generated, can be preprocessed by filtering and is then cross-correlated with the template. The maximum correlation factor of resulting matrix C represents the correlation for this interval. The detection criteria are defined by a threshold value. If the maximum correlation factor is higher, the source characterized by the template is defined as active. 5. Parameter Study To determine the accuracy of cross-correlation different cases are tested. Two templates are used shown in Figure 6: the small 23x27 and the larger 63x52 template which includes more area of the pattern. Test conditions are: • PRPD patterns containing different patterns but not the specific one: Cross-correlation
should return low correlation. Herby, the quality of the template is tested. High correlation coefficients indicate a non suitable template.
• PRPD patterns containing both, different patterns and the specific pattern: Cross-correlation should return high correlation. Additional PD should not disturb the correlation.
• Third parameter for testing is the accumulation time used for the generation of a PRPD pattern.
Filtering is not used for this evaluation because focus lies on the quality of cross-correlation itself. Figure 9 shows correlation with the 23x27 template from a 6 hour data set containing all required test conditions. • From 23.00h to 2.00h, there are no patterns or patterns not characterized by the template. • After 2.00h, the specific pattern occurs regularly. Three accumulation times are used: • Cross-correlation on PRPD patterns generated using PD occurring during one hour
(dotted line), • For 15 minutes (dashed line) and
488
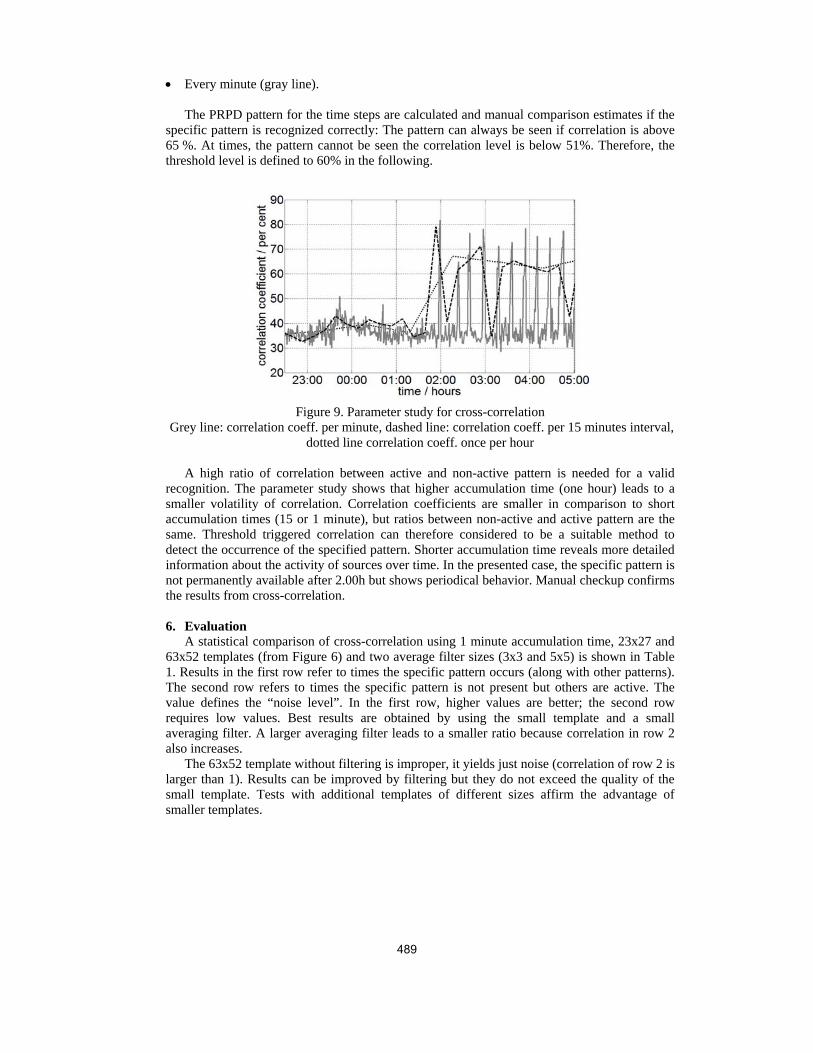
• Every minute (gray line).
The PRPD pattern for the time steps are calculated and manual comparison estimates if the specific pattern is recognized correctly: The pattern can always be seen if correlation is above 65 %. At times, the pattern cannot be seen the correlation level is below 51%. Therefore, the threshold level is defined to 60% in the following.
Figure 9. Parameter study for cross-correlation
Grey line: correlation coeff. per minute, dashed line: correlation coeff. per 15 minutes interval, dotted line correlation coeff. once per hour
A high ratio of correlation between active and non-active pattern is needed for a valid recognition. The parameter study shows that higher accumulation time (one hour) leads to a smaller volatility of correlation. Correlation coefficients are smaller in comparison to short accumulation times (15 or 1 minute), but ratios between non-active and active pattern are the same. Threshold triggered correlation can therefore considered to be a suitable method to detect the occurrence of the specified pattern. Shorter accumulation time reveals more detailed information about the activity of sources over time. In the presented case, the specific pattern is not permanently available after 2.00h but shows periodical behavior. Manual checkup confirms the results from cross-correlation. 6. Evaluation A statistical comparison of cross-correlation using 1 minute accumulation time, 23x27 and 63x52 templates (from Figure 6) and two average filter sizes (3x3 and 5x5) is shown in Table 1. Results in the first row refer to times the specific pattern occurs (along with other patterns). The second row refers to times the specific pattern is not present but others are active. The value defines the “noise level”. In the first row, higher values are better; the second row requires low values. Best results are obtained by using the small template and a small averaging filter. A larger averaging filter leads to a smaller ratio because correlation in row 2 also increases. The 63x52 template without filtering is improper, it yields just noise (correlation of row 2 is larger than 1). Results can be improved by filtering but they do not exceed the quality of the small template. Tests with additional templates of different sizes affirm the advantage of smaller templates.
489
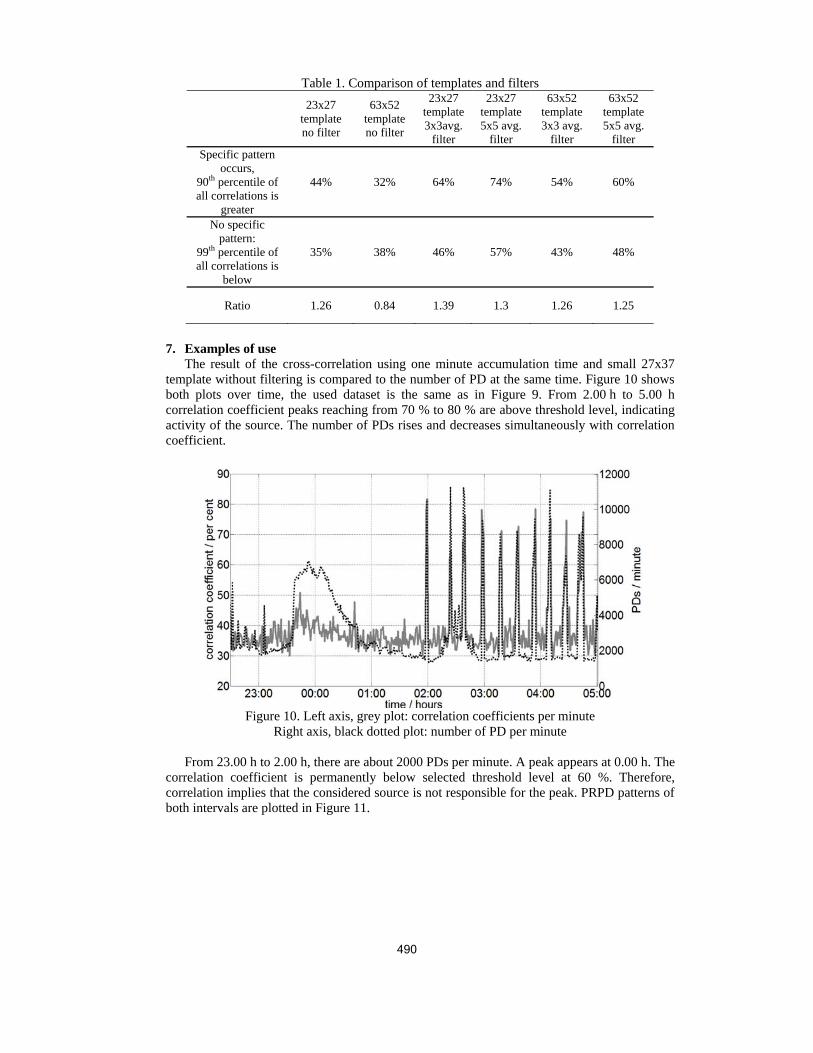
Table 1. Comparison of templates and filters
23x27
template no filter
63x52 template no filter
23x27 template 3x3avg.
filter
23x27 template 5x5 avg.
filter
63x52 template 3x3 avg.
filter
63x52 template 5x5 avg.
filter Specific pattern
occurs, 90th percentile of all correlations is
greater
44% 32% 64% 74% 54% 60%
No specific pattern:
99th percentile of all correlations is
below
35% 38% 46% 57% 43% 48%
Ratio 1.26 0.84 1.39 1.3 1.26 1.25
7. Examples of use The result of the cross-correlation using one minute accumulation time and small 27x37 template without filtering is compared to the number of PD at the same time. Figure 10 shows both plots over time, the used dataset is the same as in Figure 9. From 2.00 h to 5.00 h correlation coefficient peaks reaching from 70 % to 80 % are above threshold level, indicating activity of the source. The number of PDs rises and decreases simultaneously with correlation coefficient.
Figure 10. Left axis, grey plot: correlation coefficients per minute
Right axis, black dotted plot: number of PD per minute
From 23.00 h to 2.00 h, there are about 2000 PDs per minute. A peak appears at 0.00 h. The correlation coefficient is permanently below selected threshold level at 60 %. Therefore, correlation implies that the considered source is not responsible for the peak. PRPD patterns of both intervals are plotted in Figure 11.
490
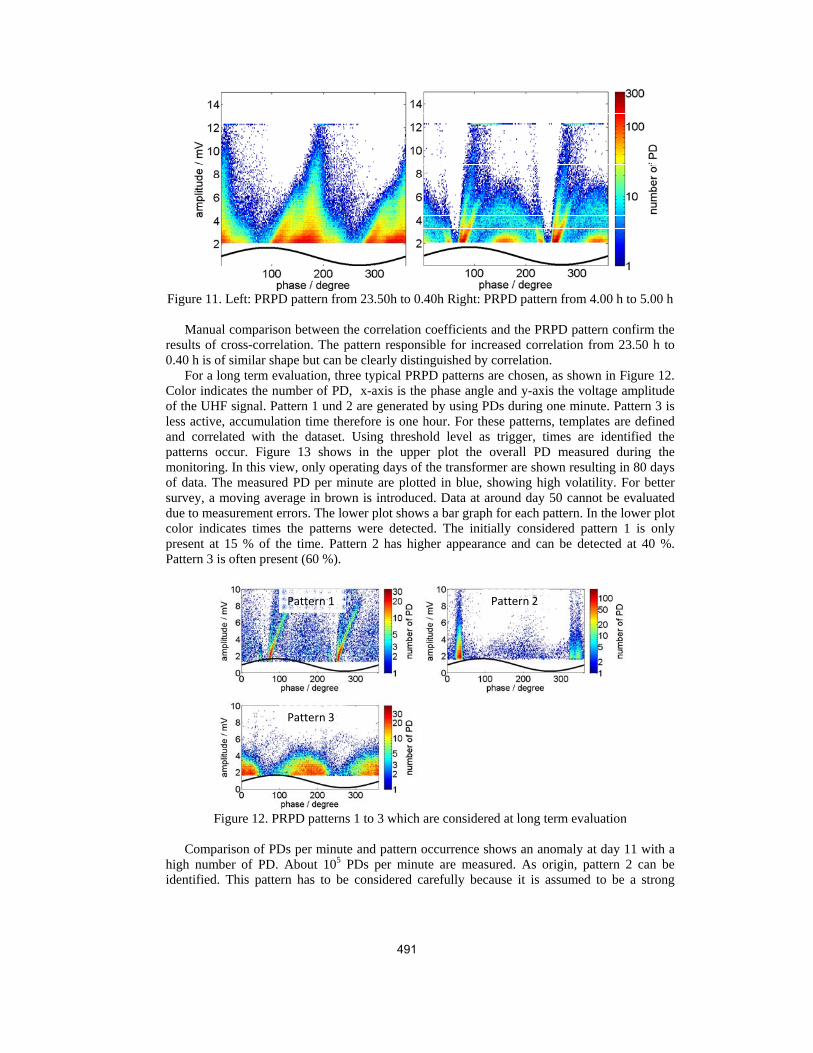
Figure 11. Left: PRPD pattern from 23.50h to 0.40h Right: PRPD pattern from 4.00 h to 5.00 h Manual comparison between the correlation coefficients and the PRPD pattern confirm the results of cross-correlation. The pattern responsible for increased correlation from 23.50 h to 0.40 h is of similar shape but can be clearly distinguished by correlation. For a long term evaluation, three typical PRPD patterns are chosen, as shown in Figure 12. Color indicates the number of PD, x-axis is the phase angle and y-axis the voltage amplitude of the UHF signal. Pattern 1 und 2 are generated by using PDs during one minute. Pattern 3 is less active, accumulation time therefore is one hour. For these patterns, templates are defined and correlated with the dataset. Using threshold level as trigger, times are identified the patterns occur. Figure 13 shows in the upper plot the overall PD measured during the monitoring. In this view, only operating days of the transformer are shown resulting in 80 days of data. The measured PD per minute are plotted in blue, showing high volatility. For better survey, a moving average in brown is introduced. Data at around day 50 cannot be evaluated due to measurement errors. The lower plot shows a bar graph for each pattern. In the lower plot color indicates times the patterns were detected. The initially considered pattern 1 is only present at 15 % of the time. Pattern 2 has higher appearance and can be detected at 40 %. Pattern 3 is often present (60 %).
Figure 12. PRPD patterns 1 to 3 which are considered at long term evaluation
Comparison of PDs per minute and pattern occurrence shows an anomaly at day 11 with a high number of PD. About 105 PDs per minute are measured. As origin, pattern 2 can be identified. This pattern has to be considered carefully because it is assumed to be a strong
Pattern 1 Pattern 2
Pattern 3
491

source responsible for high H2 gas levels [5]. Pattern evaluation generally indicates pattern 2 und 3 to be main sources for PD activity of this transformer. Pattern 1 does not lead to a general rise of PD activity considering long time data.
Figure 13. Upper image: overall PD per minute in blue, brown moving average
lower image: occurrence of patterns 1, 2 and 3 in the entire available dataset (~80 days)
8. Conclusion Cross-correlation can be used to determine monitoring data. The method allows finding specific PRPD patterns in PD datasets of any size. The quality of correlation depends on several parameters. Well chosen templates leads to high correlation if the pattern in question occurs and low correlation if no or other patterns are active and correlation works selectively. Smaller templates should be preferred. Filtering can improve correlation outcome; but again, results strongly depends on the chosen filter method and its parameterization. If preconditions are met, a threshold level can be defined acting as trigger. Cross-Correlation also leads to sufficient recognition rates if several patterns are active at once. Using threshold level specific patterns can be tracked; hence, the trend of the causing PD source can be determined in its long time behavior. Thus, their share to the overall PD activity can be rated. In addition, detailed information about the activity of PD sources can be determined using short accumulation times. 9. Outlook Additional preprocessing can be used to improve correlation furthermore like alternative filter methods, e.g. 2-dimensional low-pass image filtering. By defining standard templates for typical sources correlation can be used to classify detected sources in terms of their origin. A PD monitoring system could take track of all sources and create a timetable, which considers all sources at once. Additional benefit is provided by combination of information. E.g., the overall number of PD can be compared to single sources providing information about the contribution of a source to the PRPD pattern. Further tests are needed to prove the concept in practice. Then, it might be used as alarm parameter operating in stand-alone mode. Human interaction would be necessary if the system detects a forbidden condition, e.g. if an additional PD source occurs.
PD
> 2
mV
pe
r min
ute
Pattern 1
Pattern 2
Pattern 3
Recording days
492

Referenc[1] M.
Elec[2] R. W
of c15th
[3] M. Verl
[4] I. Emea
[5] A. MMeaSymp
[6] S. TMeaInter095.
[7] S. CMeaDiel
[8] S. CPD Proc
ces Duval, "A re
ctrical InsulatioWimmer, S. Teonnection and
h International Koch, Reliabllag Göttingen, E. Commissioasurements, 3. EMüller, M. B
asurement and posium on Hig
Tenbohlen, A. Pasurements, UHrnational Symp, San Diego, CCoenen, S. Tasurements in lectrics and Ele
Coenen, S. TenProbes and th
ceedings of 16t
Andrefrom tworkinTechndiagnoand lonPower
Michathe UnworkinTechntransfodischaparts. VDE-E
eview of faulon Magazine, Ienbohlen, K. F
grounding tecSymposium on
le Moisture DGermany, 200
on, IEC 6027Edition, Genev
Beltle, S. CoeVibration Dat
gh Voltage EninPfeffer, S. CoeHF PD Measuposium on Ele
California, USATenbohlen, S.
Power Transfectrical Insula
nbohlen, T. Strhe Radiation Bth ISH, South A
eas Müller, rethe Universityng at the Inology, Univer
ostics. His focung-term monit
r Engineering S
ael Beltle, receniversity of Stung at the Inology, Univerormer diagnostarges and invesHe is memberETG.
lts detectable IEEE, vol. Voleser, A. Kraetgchnique on then High Voltage
Determination 08. 70 High-voltava, Switzerlandenen, S. Tenbta for Power Tneering, Hannenen, "On-site urements and Aectrical InsulaA,, June 6-10, 2M. Markalouformers, No. 6tion, Vol. 15, 2ehl, S. MarkalBehaviour of Africa, 2009.
eceived the Dy of Stuttgart,nstitute of Prsity of Stuttus lies in the aptoring of partiaSociety VDE-E
eived the Dipl.uttgart, Germannstitute of Prsity of Stuttgtics and determstigates the mer of CIGRE an
by gas-in-oillume 18, no. Isge, M. Krüger,e repeatability e Engineering, in Power Tra
age test technd, 2000. bohlen, "CorreTransformer Mover, GermanyExperiences w
Acoustic PD Lation, Proceed2010.
us, T. Strehl, 6/2008, pp. 12008. lous, "FundamePD Sources i
Dipl.-Ing. degr, Germany, in
Power Transmgart in the fpplication of dal discharges. HETG.
-Ing. degree inny, in 2009. Afower Transm
gart. He operamines the long-echanical vibrand the German
l analysis in ssue: 3, pp. pp. , J. Christian, "of FRA-resultT7-522, South
ansformers, Stu
niques - Par
elation of DGMonitoring," iny, 2011. with Multi-TerLocalisation,"
dings of the ISE
"Sensitivity 553-1558," in
ental Charactein Power Tran
ree in electrican 2008. In 20
mission and Hfield of powedissolved gas aHe is member
n electrical engfter his gradua
mission and Hates in the fi-term developm
ations of transfon Power Engine
transformers,"8 - 17 , 2002.
"The influencets," in Proc. ofh Africa, 2009.uttgart: Sierke
rtial discharge
GA, UHF PDn International
rminal IEC PDin 2010 IEEE
SEI, Paper No.
of UHF PDn IEEE Tr. on
eristics of UHFnsformers," in
al engineering009 he startedHigh Voltageer transformeranalysis (DGA)of the German
gineering fromation he startedHigh Voltageield of powerment of partialformers’ activeeering Society
"
e f
e
e
D l
D E .
D n
F n
g d e r ) n
m d e r l e y
493
Stefan Tenbohlen (M’07) received his Diploma and Dr.-Ing. degrees from the Technical University of Aachen, Germany, in 1992 and 1997, respectively. In 1997 he joined AREVA Schorch Transformatoren GmbH, Monchengladbach, Germany, where he was responsible for basic research and product development and, with this function, he worked in the field of on-line monitoring of power transformers. From 2002 to 2004 he was the head of the electrical and mechanical design department. In 2004, he was appointed as the professor and head of the Institute of Power Transmission and High Voltage
Technology of the University of Stuttgart, Germany. In this position, his main research fields are diagnostic of equipment of electrical networks, development of high voltage measurement technique, behavior of gas insulated insulation systems and different aspects of electromagnetic compatibility (EMC). Prof. Tenbohlen holds several patents and published more than 130 papers. He is member of the German committees of CIGRE A2 (Power Transformers), D1 (Emerging Technologies), C4 (System Technical Performance) and several international working groups. Since 2008, he has been a member of the board of the German Power Engineering Society VDE-ETG.
494