Embed Size (px)
Citation preview

Malaysian Journal of Civil Engineering 19(1) : 1-16 (2007)
AUTOMATED PAVEMENT IMAGING PROGRAM (APIP) FOR
PAVEMENT CRACKS CLASSIFICATION AND QUANTIFICATION
Othman Che Puan1, Mushairry Mustaffar2, Tung-Chai Ling1,*1Department of Geotechnics and Transportation,Universiti Teknologi Malaysia, 81310
Skudai, Johor, Malysia 2Department of Environmental Engineering,Universiti Teknologi Malaysia, 81310 Skudai,
Johor, Malysia
*Corresponding Author: [email protected]
Abstract: This paper describes the development of an Automated Pavement Imaging Program (APIP) for evaluating pavement distress condition. The digital image processing program enables longitudinal, transverse, and alligator cracks to be classified. Subsequently, the program automatically predicts types of cracks and estimates the crack intensity which can be used to rate pavement distress severity. Results obtained by this technique are compared with the conventional manual method to check accuracy. The algorithm developed in this study is capable of identifying types of cracks and the severity level at about 90% accuracy, which is similar to the accuracy obtained by the manual method. Keywords: Pavement Distress; Crack; Classification; Quantification; Image Processing Abstrak: Kertas ini membincangkan pembangunan Aturcara Imej Pavemen Otomatis (APIP) untuk menilai keadaan kerosakan pavemen. Aturcara pemprosesan imej digital membolehkan retak jenis memanjang, lintang dan buaya diklasifikasikan. Aturcara seterusnya secara otomatis mengkelaskan jenis-jenis retak dan menganggar keamatan retak yang digunakan sebagai asas penilaian tahap kerosakan pavemen. Keputusan yang diperoleh dari teknik ini dibandingkan dengan kaedah manual konvensional bagi menilai kejituannya. Algoritma aturcara yang dibangunkan dalam kajian ini didapati mampu mengenal pasti jenis-jenis retak dan tahap kerosakannya dengan kejituan 90%, iaitu menyamai kejituan yang diperoleh melalui kaedah manual.
Katakunci: Kerosakan pavemen; Retak; Pengkelasan; Penilaian; Pemprosesan Imej
Malaysian Journal of Civil Engineering 19(1) : 1-16 (2007) 2
1.0 Introduction The evaluation of pavement condition is an important part in pavement management. Accurate evaluations would result in a better chance that resources will be effectively allocated, thus, yielding a better service condition (Kim, 1998). Pavement can be evaluated through different types of distress experienced, such as cracks, disintegration and surface deformation. At present, there are various methods of conducting distress surveys, recording and analysing distress survey data. For example, pavement engineers have long recognized the importance of distress information in quantifying the quality of pavements. This information has been used to document the present pavement condition, chart past performance, and predict future pavement performance.
Manual visual inspection of pavement surface is costly and time consuming. Visual observation of pavement distress is the most common method for monitoring pavement surface condition. This has been traditionally performed by trained engineers who work or drive along the road and counts the distresses (Oh, 1998). However, this method of field inspection poses several drawbacks, such as: (i) Slow, labour intensive and expensive, (ii) Subjective approach, thus generates inconsistencies and inaccuracies in determining the conditions of the pavement, (iii) Inflexible and does not provide an absolute measure of the surface, (iv) Has poor repeatability since the assessment of a given pavement section may be different from one survey to the next, and (v) Could expose a serious safety hazard to the surveyors due to high speed and high volume of traffic.
There is a need to minimise these drawbacks by replacing manual data collection system with automated systems that utilise imaging techniques. However, the size, shape, and variations of each distress type, as well as the variations of the texture and colour of the pavement surface, present a challenge to researchers (Li et al., 1991). Therefore the aim of this study is to develop an automated imaging program using existing software. Subsequently, the performance of the developed program is assessed and compared with the conventional manual method.
Cracks are fissures resulting from partial or complete fractures of pavement surface. Cracks of road pavement surface can happen in a wide variety of patterns, ranging from isolated single crack to an interconnected pattern extending over the entire pavement surface (JKR, 1992).
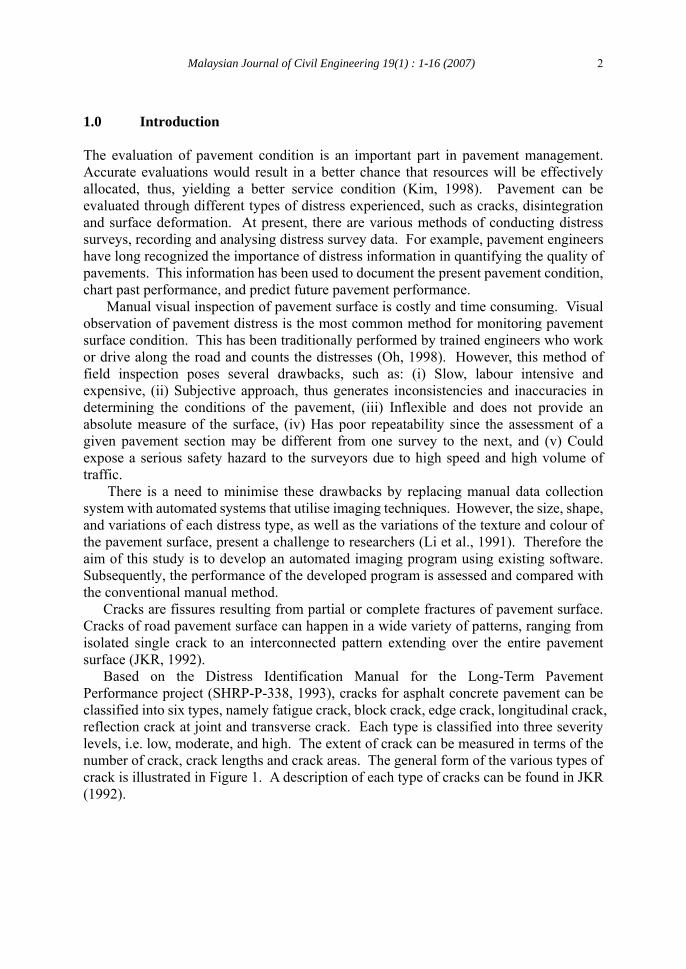
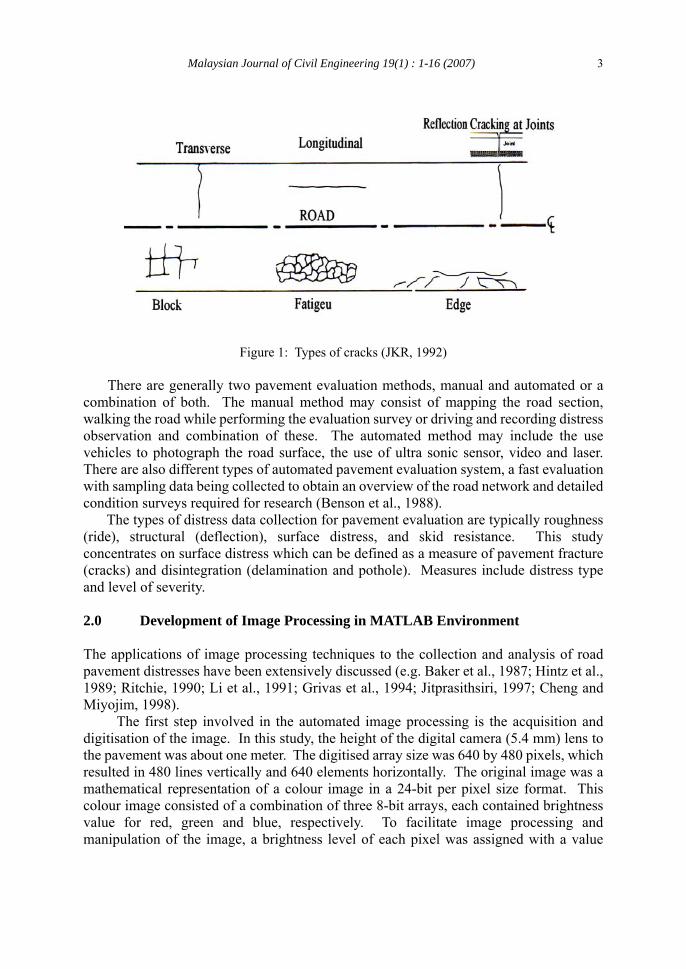
Based on the Distress Identification Manual for the Long-Term Pavement Performance project (SHRP-P-338, 1993), cracks for asphalt concrete pavement can be classified into six types, namely fatigue crack, block crack, edge crack, longitudinal crack, reflection crack at joint and transverse crack. Each type is classified into three severity levels, i.e. low, moderate, and high. The extent of crack can be measured in terms of the number of crack, crack lengths and crack areas. The general form of the various types of crack is illustrated in Figure 1. A description of each type of cracks can be found in JKR (1992).
Malaysian Journal of Civil Engineering 19(1) : 1-16 (2007) 3
Figure 1: Types of cracks (JKR, 1992)
There are generally two pavement evaluation methods, manual and automated or a
combination of both. The manual method may consist of mapping the road section, walking the road while performing the evaluation survey or driving and recording distress observation and combination of these. The automated method may include the use vehicles to photograph the road surface, the use of ultra sonic sensor, video and laser. There are also different types of automated pavement evaluation system, a fast evaluation with sampling data being collected to obtain an overview of the road network and detailed condition surveys required for research (Benson et al., 1988).
The types of distress data collection for pavement evaluation are typically roughness (ride), structural (deflection), surface distress, and skid resistance. This study concentrates on surface distress which can be defined as a measure of pavement fracture (cracks) and disintegration (delamination and pothole). Measures include distress type and level of severity. 2.0 Development of Image Processing in MATLAB Environment The applications of image processing techniques to the collection and analysis of road pavement distresses have been extensively discussed (e.g. Baker et al., 1987; Hintz et al., 1989; Ritchie, 1990; Li et al., 1991; Grivas et al., 1994; Jitprasithsiri, 1997; Cheng and Miyojim, 1998).
The first step involved in the automated image processing is the acquisition and digitisation of the image. In this study, the height of the digital camera (5.4 mm) lens to the pavement was about one meter. The digitised array size was 640 by 480 pixels, which resulted in 480 lines vertically and 640 elements horizontally. The original image was a mathematical representation of a colour image in a 24-bit per pixel size format. This colour image consisted of a combination of three 8-bit arrays, each contained brightness value for red, green and blue, respectively. To facilitate image processing and manipulation of the image, a brightness level of each pixel was assigned with a value

Malaysian Journal of Civil Engineering 19(1) : 1-16 (2007) 4
between 0 (black) and 255 (white) to convert the colour image into a grey scale image. Thus, the 24-bit per pixel format was converted to an 8-bit per pixel format, and this reduced the file space required for storage by two-thirds.
This study utilises full programming language software MATLAB 6.5.1 to enable a series of MATLAB statements to be written into a file and then execute them with a single command. The algorithm for this study, named as Automated Pavement Imaging Program (APIP), is developed in ordinary text file. Each of the image processing steps developed under the MATLAB environment is discussed in the following sub sections.
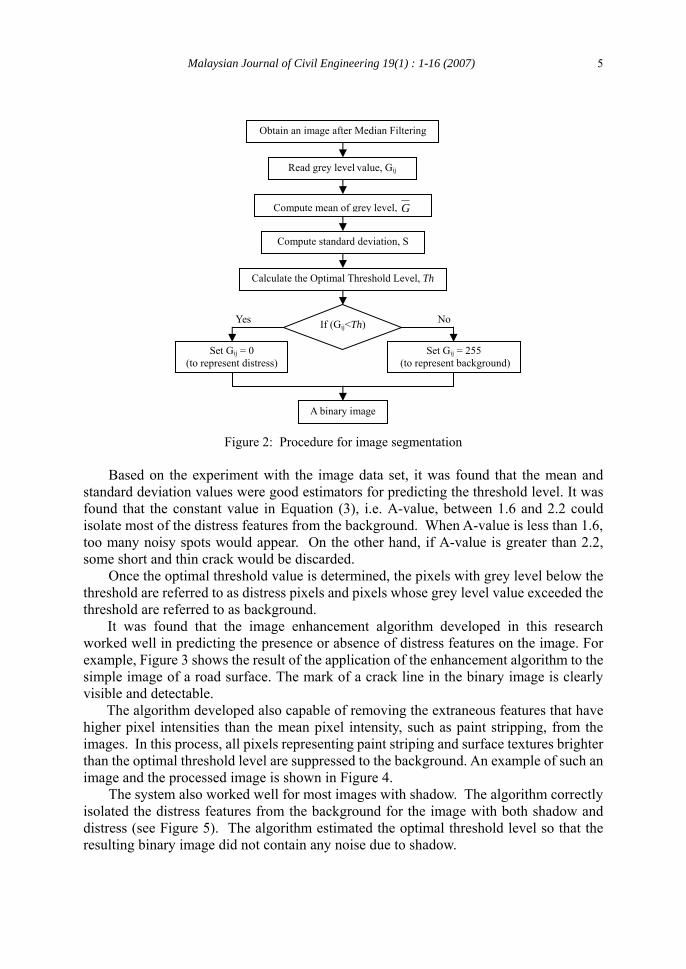
2.1 Image Enhancement Pavement images were enhanced using the median filtering technique to remove noise in the images as suggested by Jitprasithsiri (1997). In this research, the size of the neighbourhood used for filtering is 3-by-3. Each output pixel is set to an average of the pixel values in the neighbourhood of the corresponding input pixel. The value of an output pixel is determined by the median of the neighbourhood pixels. 2.2 Image Thresholding The spatial and light intensity information on the image is usually combined with a thresholding technique for the improved image segmentation. The segmentation relates mathematically the threshold for a given image to the mean and standard deviation values of the corresponding grey scale histogram. In this research, the mean and standard deviation values of the enhancement image are computed using Equations (1) and (2), respectively. The optimal threshold value is given by Equation (3). The procedure for image segmentation is depicted in Figure 2.
∑∑==
=yx l
jij
l
i
Gn
G11
1 , n = lx × ly (1)
( )2
1111 GG
nS ij
l
j
l
i
yx
−−
= ∑∑==
(2)
SAGTh ×−= , A = Constant Value (3) The Th value obtained from Equation (3) is then used to convert each pixel to either black or white based on the following conditions: If Gij < Th then Outij = 0 (Black) If Gij > Th then Outij = 255 (White) where Gij is the input grey scale intensity at position i, j and Outij is the output grey scale intensity at position i, j.
Malaysian Journal of Civil Engineering 19(1) : 1-16 (2007) 5
Obtain an image after Median Filtering
Figure 2: Procedure for image segmentation
Based on the experiment with the image data set, it was found that the mean and
standard deviation values were good estimators for predicting the threshold level. It was found that the constant value in Equation (3), i.e. A-value, between 1.6 and 2.2 could isolate most of the distress features from the background. When A-value is less than 1.6, too many noisy spots would appear. On the other hand, if A-value is greater than 2.2, some short and thin crack would be discarded.
Once the optimal threshold value is determined, the pixels with grey level below the threshold are referred to as distress pixels and pixels whose grey level value exceeded the threshold are referred to as background.
It was found that the image enhancement algorithm developed in this research worked well in predicting the presence or absence of distress features on the image. For example, Figure 3 shows the result of the application of the enhancement algorithm to the simple image of a road surface. The mark of a crack line in the binary image is clearly visible and detectable.
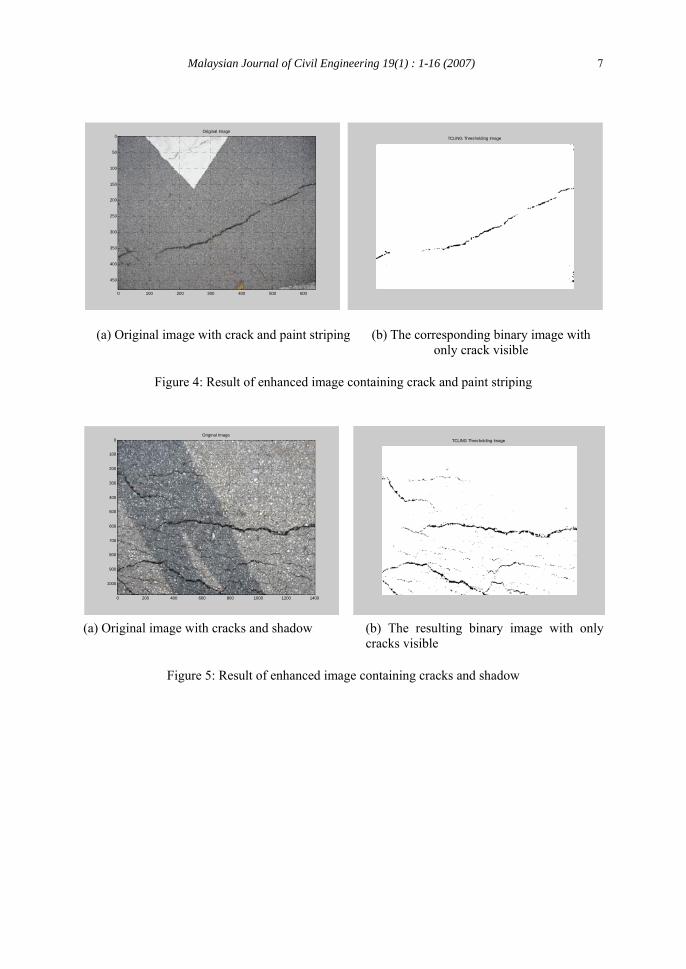
The algorithm developed also capable of removing the extraneous features that have higher pixel intensities than the mean pixel intensity, such as paint stripping, from the images. In this process, all pixels representing paint striping and surface textures brighter than the optimal threshold level are suppressed to the background. An example of such an image and the processed image is shown in Figure 4.
The system also worked well for most images with shadow. The algorithm correctly isolated the distress features from the background for the image with both shadow and distress (see Figure 5). The algorithm estimated the optimal threshold level so that the resulting binary image did not contain any noise due to shadow.
Calculate the Optimal Threshold Level, Th
Read grey level value, Gij
Compute mean of grey level, G
Compute standard deviation, S
A binary image
Set Gij = 0 (to represent distress)
If (Gij<Th)
Set Gij = 255 (to represent background)
Yes No

Malaysian Journal of Civil Engineering 19(1) : 1-16 (2007) 6
TCLING Thresholding Image
Original Image
0 100 200 300 400 500 600
0
50
100
150
200
250
300
350
400
450
(a) Original image with a mark of crack line (b) Original image with mark of crack l
Figure 3: An example image segmentation process for a simple image
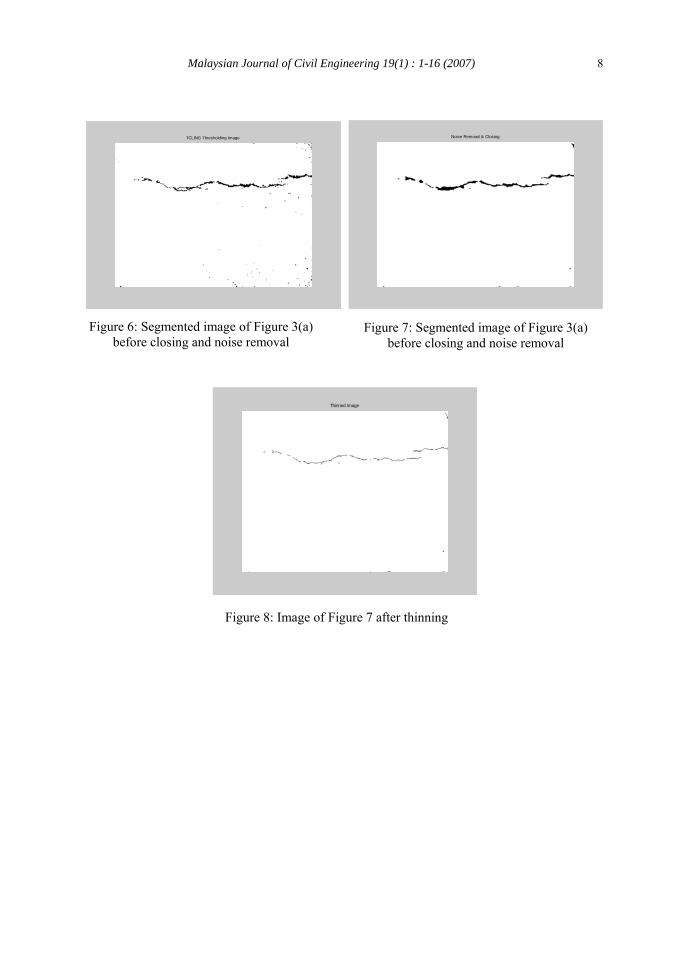
2.3 Morphological Closing Figure 6, which is the segmented image of Figure 3(a) shows how some noise cluster occupies open space corresponding to the background. Noise removal at the threshold of 10 pixels was applied, followed by performing morphological closing with structural element of size 5, than producing another binary image. The resulting aspect is shown in the sample of Figure 7, where it can be noticed that some of the noises have been removed and some holes being filled with object pixels. 2.4 Thinning The binary image with clusters was not useful enough and had to be further processed by thinning. The thinning made clusters in the binary image become one-pixel wider and took the form of polylines. A generic source image as shown in Figure 8 is produced after the thinning process. These are the skeletons that are beneficial to distress quantification. 2.5 Cracks Classification After segmentation, the types of cracks could be automatically detected by the developed computer program by comparing several parameters in x and y-array. The parameters ASGLX and ASGLY, which are the average values of summed grey level of distress zones in the x- and y-arrays respectively, are illustrated in Figures 9a and 9b.
Malaysian Journal of Civil Engineering 19(1) : 1-16 (2007) 7
Original Image
0 100 200 300 400 500 600
0
50
100
150
200
250
300
350
400
450
TCLING Thresholding Image
(a) Original image with crack and paint striping (b) The corresponding binary image with only crack visible
Figure 4: Result of enhanced image containing crack and paint striping
TCLING Thresholding ImageOriginal Image
0 200 400 600 800 1000 1200 1400
0
100
200
300
400
500
600
700
800
900
1000
(a) Original image with cracks and shadow (b) The resulting binary image with only
cracks visible
Figure 5: Result of enhanced image containing cracks and shadow
Malaysian Journal of Civil Engineering 19(1) : 1-16 (2007) 8
TCLING Thresholding Image
Noise Removal & Closing
Figure 6: Segmented image of Figure 3(a) before closing and noise removal
Figure 7: Segmented image of Figure 3(a) before closing and noise removal
Thinned Image
Figure 8: Image of Figure 7 after thinning

Malaysian Journal of Civil Engineering 19(1) : 1-16 (2007) 9
Suspected Distress Location ASGLX/ASGLY > 2
ASGLX ASGLY
y-array x-array
Figure 9a: Distress recognition concept of longitudinal crack at suspected distress zone
Suspected Distress Location 0.6 <AS GLX/ASGLY < 2
ASGLY ASGLX
y-array x-array
Figure 9b: Distress recognition concept of alligator crack at suspected distress zone
The image segmentation method adopted in APIP results in different summed array profiles for different types of distresses. For example, for an alligator crack, the distress zones in two arrays are relatively wide. For a longitudinal and transverse crack, the narrow and sharp peaks of summed grey level are always found in the x-array and y-array, respectively.
In crack classification process, the standard deviations of the two arrays are used as the intermediate background grey level (IBGL). If the IBGL values of any array are greater than 5, value of 5 will be assigned as the IBGL value of the array. Each summed grey level (columns and rows) that had values larger than IBGL are referred to as the distress zones. After eliminating the distress zones, the ratio of average values of the distress zones in x- and y-directions (ASGLX/ASGLY) is calculated for crack type identification. The summary of detecting rules based on this ASGLX/ASGLY ratio is shown in Figure 10.

Malaysian Journal of Civil Engineering 19(1) : 1-16 (2007) 10
Figure 10: Distress type identification rule 2.6 Cracks Quantification Another deterministic approach in APIP is to classify distress severity level based on the manual published by JKR (1992). Alligator crack is measured in square meters. Longitudinal and transverse cracks are measured in linear meters. The severity of each type of crack is classified into three levels, i.e. low, moderate and high. For example, a moderate level of severity of longitudinal crack is defined by “cracks with moderately severe spalling (JKR, 1992).

Malaysian Journal of Civil Engineering 19(1) : 1-16 (2007) 11
The standard crack density concept can be readily and logically implemented in
pavement image processing (Lee and Oshima, 1994). The standard crack density is determined by dividing the extent with the average crack width, i.e.
Crack Density (cm/cm2) = extent / (average crack width × 10) (4) where the extent is the total cracked within the total pavement area (expressed in percentage) and the average crack width is the mean crack opening width of set of cracks (expressed in mm).
The standard crack density concept is at an advantage for use in image processing analysis since it takes into consideration both extent and width of cracks simultaneously. A simple concept of determining length, area, average width and extent of crack is shown in Figure 11. The cracking area (A) of distress is calculated using Equation (5). Its length (l) is determined based on the polylines of one pixel wide and calculated using Equation (6). The average crack width (CW) is then determined using Equation (7).
Figure 11: Crack area with central polyline
A = number of pixels of distress area × pixel size (5) l = total pixel number of polylines × pixel size (6) Crack Width = A / l (7)
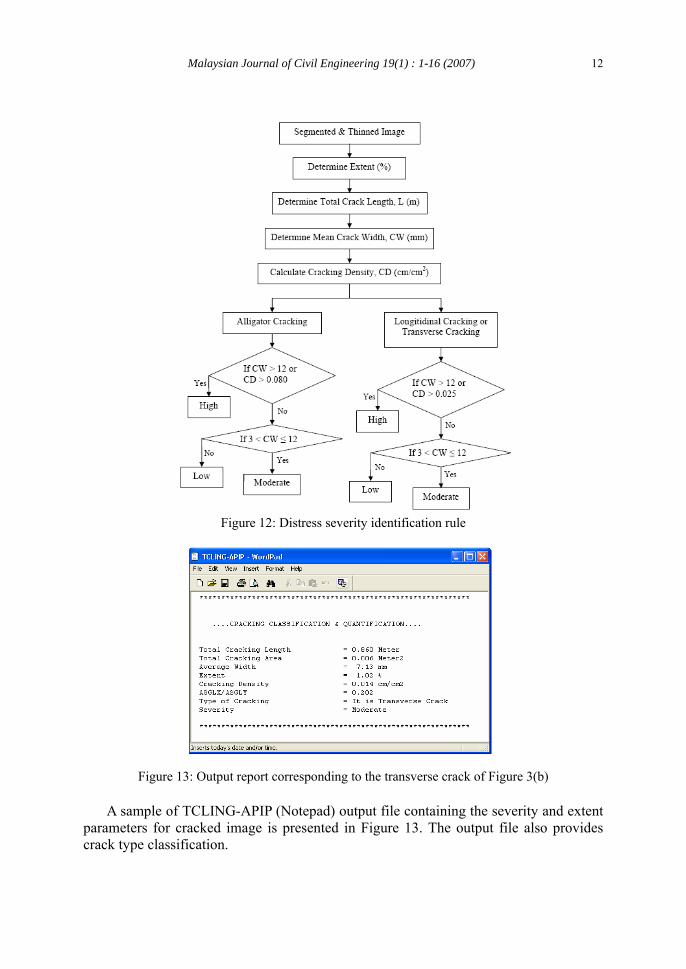
Figure 12 shows the procedure adopted in APIP to quantify and classify the levels of
severity of cracks. The severities of each type of crack are mainly referred to crack density and average width.
Malaysian Journal of Civil Engineering 19(1) : 1-16 (2007) 12
Figure 12: Distress severity identification rule
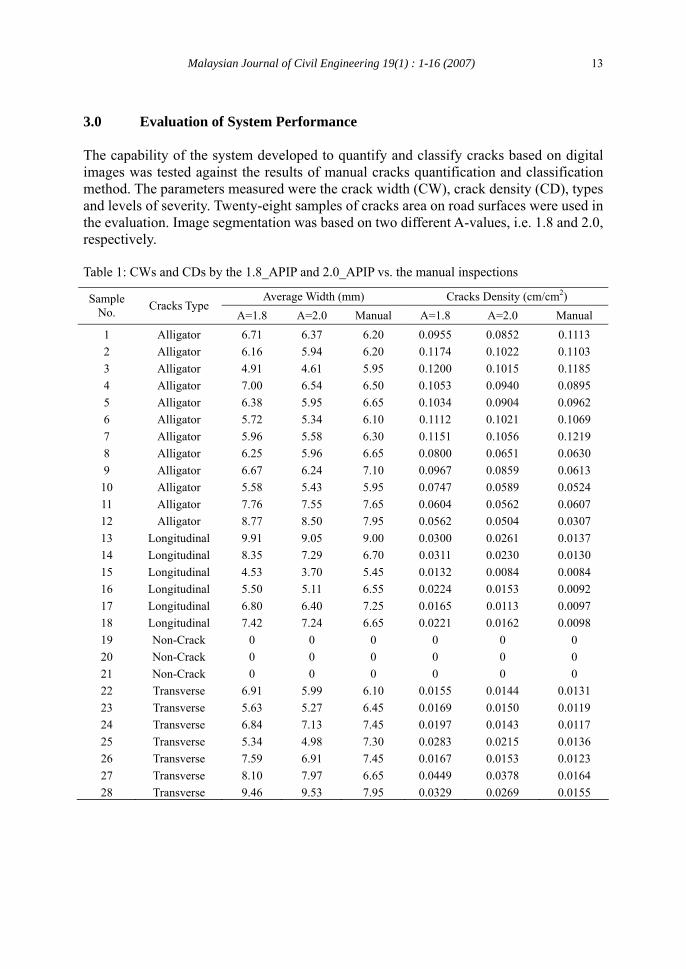
Figure 13: Output report corresponding to the transverse crack of Figure 3(b)
A sample of TCLING-APIP (Notepad) output file containing the severity and extent
parameters for cracked image is presented in Figure 13. The output file also provides crack type classification.
Malaysian Journal of Civil Engineering 19(1) : 1-16 (2007) 13
3.0 Evaluation of System Performance The capability of the system developed to quantify and classify cracks based on digital images was tested against the results of manual cracks quantification and classification method. The parameters measured were the crack width (CW), crack density (CD), types and levels of severity. Twenty-eight samples of cracks area on road surfaces were used in the evaluation. Image segmentation was based on two different A-values, i.e. 1.8 and 2.0, respectively. Table 1: CWs and CDs by the 1.8_APIP and 2.0_APIP vs. the manual inspections
Average Width (mm) Cracks Density (cm/cm2) Sample No. Cracks Type
A=1.8 A=2.0 Manual A=1.8 A=2.0 Manual 1 Alligator 6.71 6.37 6.20 0.0955 0.0852 0.1113 2 Alligator 6.16 5.94 6.20 0.1174 0.1022 0.1103 3 Alligator 4.91 4.61 5.95 0.1200 0.1015 0.1185 4 Alligator 7.00 6.54 6.50 0.1053 0.0940 0.0895 5 Alligator 6.38 5.95 6.65 0.1034 0.0904 0.0962 6 Alligator 5.72 5.34 6.10 0.1112 0.1021 0.1069 7 Alligator 5.96 5.58 6.30 0.1151 0.1056 0.1219 8 Alligator 6.25 5.96 6.65 0.0800 0.0651 0.0630 9 Alligator 6.67 6.24 7.10 0.0967 0.0859 0.0613 10 Alligator 5.58 5.43 5.95 0.0747 0.0589 0.0524 11 Alligator 7.76 7.55 7.65 0.0604 0.0562 0.0607 12 Alligator 8.77 8.50 7.95 0.0562 0.0504 0.0307 13 Longitudinal 9.91 9.05 9.00 0.0300 0.0261 0.0137 14 Longitudinal 8.35 7.29 6.70 0.0311 0.0230 0.0130 15 Longitudinal 4.53 3.70 5.45 0.0132 0.0084 0.0084 16 Longitudinal 5.50 5.11 6.55 0.0224 0.0153 0.0092 17 Longitudinal 6.80 6.40 7.25 0.0165 0.0113 0.0097 18 Longitudinal 7.42 7.24 6.65 0.0221 0.0162 0.0098 19 Non-Crack 0 0 0 0 0 0 20 Non-Crack 0 0 0 0 0 0 21 Non-Crack 0 0 0 0 0 0 22 Transverse 6.91 5.99 6.10 0.0155 0.0144 0.0131 23 Transverse 5.63 5.27 6.45 0.0169 0.0150 0.0119 24 Transverse 6.84 7.13 7.45 0.0197 0.0143 0.0117 25 Transverse 5.34 4.98 7.30 0.0283 0.0215 0.0136 26 Transverse 7.59 6.91 7.45 0.0167 0.0153 0.0123 27 Transverse 8.10 7.97 6.65 0.0449 0.0378 0.0164 28 Transverse 9.46 9.53 7.95 0.0329 0.0269 0.0155

Malaysian Journal of Civil Engineering 19(1) : 1-16 (2007) 14
3.1 Crack Width and Density The CW and CD values for the 28 samples are shown in Table 1. The types of crack stated in the table are based on manual classification method. A student t-test was used to compare the differences between the results of different methods of measurement. The results of the paired t-test for A-values equal to 1.8 and 2.0 are summarized in Table 2 and Table 3, respectively. The results of statistical analysis shown in Tables 2 and 3 imply that the crack width and crack density quantified by the system are not statistically different from the results obtained using the manual inspection technique at α = 0.20. 3.2 Cracks Type The APIP was then tested to determine whether it could distinguish between several types of cracks and images without crack. Using additional three actual pavement images without crack, the automated imaging algorithms correctly identified most of them. The results from the 1.8_APIP and 2.0_APIP for the 28 images are shown in Table 4. Table 2: Summary of 1.8_APIP and 2.0_APIP algorithms performance in cracks type prediction
Number of samples predicted by APIP
Alligator Longitudinal Transverse Non-Crack Accuracy (%) Actual
Distress Type
Number of
Samples A=1.8 A=2.0 A=1.8 A=2.0 A=1.8 A=2.0 A=1.8 A=2.0 A=1.8 A=2.0
Alligator 12 12 12 100 100
Longitudinal 6 1 5 6 83.33 100 Transverse 7 1 1 6 6 85.71 85.71
No Distress 3 3 3 100 100
Total 28 14 13 5 6 6 6 3 3 92.86 96.43
Table 2 indicates that APIP worked well in predicting the presence or absence of distress features on the image. Of the 25 images with distress features, the 1.8_APIP correctly predicted 23 images that had distress features while 2.0_APIP correctly predicted 24 images. Only 2 out of 25 images with distress features were incorrectly categorised by using 1.8_APIP. Of the three distress-free images, both 1.8_APIP and 2.0_APIP correctly categorised them all as non-crack distress. Therefore, the overall predictions were found to be 92.86% accurate in 1.8_APIP and 96.43% accurate in 2.0_APIP.
3.3 Severity Level Classification Table 3 shows the ability of APIP to predict the levels of severity of cracks in each sample of the images. In general, the results of the classification are 80% to 100% accurate. In a few cases, the levels of severity classified by the system were one level lower than the levels classified manually. The lower classifications of the severity indicate similar concerns that were present during any of the survey at fields, which resulted from different interpretations of the severity level among the evaluators.

Malaysian Journal of Civil Engineering 19(1) : 1-16 (2007) 15
Table 3: Summary of 1.8_APIP and 2.0_APIP algorithms performance in severity level prediction
Number of samples identified by the system
High Moderate Low Accuracy (%) Severity
Level
Number of
Samples A=1.8 A=2.0 A=1.8 A=2.0 A=1.8 A=2.0 A=1.8 A=2.0
High 16 13 13 3 3 81.25 81.25 Moderate 9 9 9 100 100
Low 0 100 100 Total 25 13 13 12 12 0 0 88.00 88.00
4.0 Conclusions In this study, an Automated Pavement Imaging Program (APIP) was developed to process images with both noise and contrast variation problems. The image processing method developed provides visual distress information and produces inspector quality interpretation. The present form of APIP is only focused on the quantification and classification of the extent and severity of the various types of cracks on road surfaces. The results obtained using APIP were not statistically different from the results obtained using the conventional method. Thus, the proposed program, which includes different image processing algorithms, produces a reliable computer-based classification. However, it is still necessary to integrate the various components of both image-processing and analysis systems before a goal of fully automated pavement distress analysis tool can be achieved. References Baker, J., Dahlstrom, B., Longenecker, K., and Buu, T. (1987) Video image distress analysis
technique for Idaho Transportation Dep. Pavement Management System. Transportation Research Record, 1117.
Benson, K., Elkins, G., Uddin, W. and Hudson, W. (1988) Comparison of methods and equipment to conduct pavement distress Survey. Transportation Research Record, 1196: 40-50.
Cheng, H. D., and Miyojim, M. (1998) Automatic pavement distress detection system. Journal of Information Sciences, 108: 219-240.
Grivas, D. A., Bhagvati, C., Skolnick, M. M., and Schultz, B. C. (1994) Feasibility of automating pavement distress assessment using mathematical morphology. Transportation Research Record, 1435: 52-58.
Hintz, R. J., Karakadas, C., and Kang, J. M. (1989) Analysis of pavement cracking and rutting using close-range photogrammetry. Photogrammetric Engineering and Remote Sensing, 55(2): 217-221.
Jitprasithsiri, S. (1997) Development of a New Digital Pavement Image Processing Algorithm for Unified Crack Index Computation. Ph.D. Dissertation, University of Utah.
JKR (1992) A Guide to Visual Assessment of Flexible Pavement Surface Conditions. Malaysia: Jabatan Kerja Raya Malaysia.
Kim, J. (1998) Development of a Low-Cost Video Imaging System for Pavement Evaluation. Ph.D. Thesis, Oregon State University:
Malaysian Journal of Civil Engineering 19(1) : 1-16 (2007) 16
Lee, H. (1990) Evaluation of Pavedex Computerized Pavement Image Processing System in Washington. Proceedings of the 1990 Automated Pavement Distress Seminar, Federal Highway Administration, 205-224.
Lee, H., and Oshima, H. (1994) New cracking imaging procedure using spatial autocolletion function. Journal of Transportation Engineering, ASCE. 120(2): 206-228.
Li, L., C han, P., and Lytton, R. L. (1991) Detection of thin cracks on noisy pavement images. Transportation Research Record 1311: 131-135.
Oh, H. (1998) Image Processing technique in Automated Pavement Evaluation System. Ph.D. Dissertation, University of Connecticut.
Ritchie, S. G. (1990) Digital imaging concepts and applications in pavement management. Journal Survey Engineering, ASCE. 116(3): 287-298.
SHRP-P-338 (1993) Distress Identification Manual for the Long-Term Pavement Performance project. Washington, D.C.: Strategic Highway Research Program.