Embed Size (px)
Citation preview
Ultrasound in Med. & Biol., Vol. 40, No. 3, pp. 637–642, 2014Copyright � 2014 World Federation for Ultrasound in Medicine & Biology
Printed in the USA. All rights reserved0301-5629/$ - see front matter
/j.ultrasmedbio.2013.10.026
http://dx.doi.org/10.1016d Original Contribution
AUTOMATED, OBJECTIVE AND EXPERT-INDEPENDENTASSESSMENT OF THEANALYZABILITY OF STRAIN AND STRAIN RATE IN TISSUE DOPPLER IMAGES
IN TERM NEONATES BYANALYSIS OF BEAT-TO-BEAT VARIATION
EIRIK NESTAAS,* DRUDE FUGELSETH,yz and ASBJØRN STØYLENx{
*Department of Pediatrics, Vestfold Hospital Trust, 3103 Tønsberg, Norway; y Institute of Clinical Medicine, Faculty ofMedicine, University of Oslo, Oslo, Norway; zDepartment of Neonatal Intensive Care, Oslo University Hospital, Oslo, Norway;xDepartment of Cardiology, St. Olav’s Hospital, Trondheim, Norway; and {Department of Circulation and Medical Imaging,
Faculty of Medicine, Norwegian University of Science and Technology, Trondheim, Norway
(Received 10 May 2013; revised 5 September 2013; in final form 30 October 2013)
Arics, Vehotmai
Abstract—The variation in longitudinal strain and strain rate (SR) between two consecutive heartbeats (beat-to-beat-variation, BBV) was used to evaluate the analyzability of longitudinal strain and SR in tissue Doppler imagesin term neonates. Strain and SR BBVanalysis and visual evaluation of analyzability were performed in 2394 seg-ments; 1739 segments (73%) were deemed to be analyzable by visual evaluation, with an intra-rater k score of0.87 and inter-rater k score of 0.61 (p, 0.001). Compared against visual evaluation, the k scores for identificationof analyzable segments were 0.57 based on SR BBVand 0.58 based on strain BBV (p, 0.001). The areas under thereceiver operating characteristic curves for identification of analyzable segments were 0.87 (0.85–0.88) for strainBBV and 0.87 (0.85–0.89) for SR BBV (p , 0.001). For both BBVs, the sensitivity for identification of analyzablesegments was 77% at a specificity of 80%. Analysis of BBV can be used for automated, objective and expert-independent assessment of analyzability. (E-mail: [email protected]) � 2014 World Federation for Ultra-sound in Medicine & Biology.
Key Words: Heart function, Deformation analysis, Cardiology, Infant, Myocardial function, Echocardiography,Automated analysis, Myocardial performance assessment.
INTRODUCTION
Echocardiography is widely used in neonates. Goodacoustic windows hold the potential for good image qual-ity. In neonates, fractional shortening has been foundto be less sensitive than atrioventricular plane systolic ve-locities (Matter et al. 2010) and deformation indices(Nestaas et al. 2011) for detection of reduced heart func-tion between asphyxiated and non-asphyxiated neonates.Strain and strain rate have the advantage over atrioven-tricular plane indices in that they are normalized forventricle size and, therefore, can be more readilycompared between hearts of different sizes.
Assessment of deformation by B-mode speckletracking is hampered by each vendor having its ownvariant of the technology, yielding different values inthe same images (Koopman et al. 2010). In neonates, afurther obstacle to the use of B-mode speckle tracking
ddress correspondence to: Eirik Nestaas, Department of Pediat-stfold Hospital Trust, 3103 Tønsberg, Norway. E-mail: [email protected]
637
is the low frame rate, resulting in a small number offrames per heartbeat, which may result in poor trackingas well as under-sampling, especially for assessment ofstrain rate.
The main challenge in deformation analysis by tis-sue Doppler in neonates is related to the signal-to-noiseratio and the size of the segments. Deformation indicesby tissue Doppler are based on assessment of differencein velocities along the strain length and, therefore, havea less favorable signal-to-noise ratio than atrioventricularplane indices, as the noise is the sum of the variation ofthe velocity measurements (Heimdal et al. 1998). TissueDoppler indices have been found to have lower reproduc-ibility than blood flow measurements both in adults(Thorstensen et al. 2010) and in neonates (Joshi et al.2010). Deformation indices have been found to havelower reproducibility than tissue velocity measurements(Joshi et al. 2010). In smaller segments, the signal-to-noise ratio is lower; although the amount of noise foreach velocity measurement within an image is indepen-dent of segment size, analysis of segments with fewerpixels (few velocity measurements) and with smaller

Fig. 1. Assessment of beat-to-beat variation (BBV) as depictedin examples from a strain curve (left) and a strain rate curve(right). The single-cycle curve is represented by the dottedline, and the area under the single-cycle curve is marked bythe square pattern. The two-cycle compound curve is repre-sented by the solid line, and the area under the compound curveis gray. To assess the BBV, the area between the single-cyclecurve and the two-cycle compound curve is divided by the
area under the compound curve (gray area).
Table 1. Characteristics of the neonates included in theanalyses
Number of neonates 48Female:male ratio 1:1Mean (range) gestational age, wk 41 (37–42)Mean (SD) birth weight, kg 3.68 (0.45)Median (range) 5-min Apgar score 9 (8–10)Mean (SD) age at examination, h
Day 1 (n 5 47) 12.2 (4.5)Day 2 (n 5 46) 36.1 (4.7)Day 3 (n 5 45) 58.6 (4.8)
SD 5 standard deviation.
638 Ultrasound in Medicine and Biology Volume 40, Number 3, 2014
velocity differences between the pixels (short strainlengths) will lower the signal-to-noise ratio. In imagesof low quality, more noise is present. Although there isno general agreement on what criteria should be usedfor deciding the analyzability of segments, clutter (inparticular, stationary reverberations) and random drop-outs are, in our experience, the main causes of low imagequality. Deformation analysis of segments with low im-age quality leads to erroneous measurements, and signif-icantly lower values have been obtained in such segmentsin neonates (Nestaas et al. 2009). This occurs because theautocorrelation algorithm for velocity assessment incor-porates information from stationary echoes. Visualassessment of the analyzability of tissue Doppler imagesis expert dependent. Difficulties in evaluation of analyz-ability might be a significant obstacle to the use of defor-mation analyses by tissue Doppler in neonates, as well asin other patient groups. An objective and expert-independent tool for evaluation of the analyzability istherefore desired.
Earlier we used the variation in strain and strain ratecurves between two consecutive heart cycles, the strainand strain rate beat-to-beat variations (BBVs) (Fig. 1),as measures of noise in deformation analyses by tissueDoppler (Nestaas et al. 2007, 2008). The BBV is thedifference between a curve from a single cycle and themean (compound) curve of two heart cycles, expressedas a fraction of the area under the compound cyclecurve. This is the sum of the true variation and thevariation caused by the noise in the analyses, from heartcycle to heart cycle.
This method quantifies random noise. The mainpoint of using a compound cycle for reference is thatthe averaging of two cycles, to a large extent, averagesout random noise; thus, the difference could be regardedbasically as a measure of the amount of random noise in asingle heart cycle. Clutter is mainly stationary echoes,which leads to reduced velocity estimates by the autocor-relation algorithm of color tissue Doppler. Alone, thiseffect would lead to reduced velocity and strain rate (ve-locity gradient) values, but not necessarily to increasedbeat-to-beat variation. However, the effect of the station-ary noise on the velocity estimate will also depend on therelative amplitude of the tissue signal versus the clutter.As this will vary from point to point, the effect willthus be increased variability from point to point, an effectthat is largely random (Sagberg et al. 2004). Thus, clutterwill result in a signal with, on average, reduced velocity,but increased variability. This effect is accentuated in thestrain rate calculation.
Probe type and frame rate (Nestaas et al. 2008) andsettings for region of interest (ROI)) size and strain length(Nestaas et al. 2007, 2008) have effects on the noise in theanalyses. We have suggested that settings with little
variation between heartbeats should be used, andsimilar settings for the off-line analyses were later sug-gested by others (Joshi et al. 2010). Recently, suggestionsfor ROI size and strain length for analysis of deformationhave been proposed based on quantification of noise byBBV also in premature neonates (Helfer et al. 2013).
The aim of this study was to assess the feasibility ofusing strain and strain rate BBVs as an automated, objec-tive and expert-independent tool for evaluating theanalyzability of longitudinal strain and strain rate in tis-sue Doppler images in neonates.
METHODS
PatientsForty-eight healthy term neonates from the mater-
nity ward at Oslo University Hospital, Ullev�al, Norway,were examined on the first, second and third days oflife (March–May 2005) (Table 1). Written parental con-sent was obtained, and the project was approved by theNorwegian South-East Regional Committee for MedicalResearch Ethics and by the Scientific Committee at OsloUniversity Hospital, Ullev�al.
Assessment of analyzability of strain and strain rate d E. NESTAAS et al. 639
Image acquisition and measurementsA phase array probe (5 S probe [2.4 MHz], Vivid
7 Dimension Version 4.0.1 built 1644, GE Vingmed,Horten, Norway) was used. Apical tissue Doppler imageswere recorded with the wall parallel to the ultrasoundbeams using a tissue velocity range of 616 cm/s anddefault settings for frame rate and for lateral (step 0 of4) and radial (step 3 of 3) averaging. Images were ob-tained from four left heart walls, two septum walls andthree right heart walls (Nestaas et al. 2009).
Two-segment strain and strain rate analyses wereperformed in 2394 segments using Echopac PC softwareVersion 4.0 (GE Vingmed) (Fig. 2). In all segments,analyzability was evaluated visually (analyzable/notanalyzable), and BBVs for both strain and strain ratecurves were estimated (Fig. 1); strain and strain ratecurves were extracted from each of two consecutive heartcycles. A two-cycle compound curve was averaged fromthe curves for the two cycles. The BBV was then
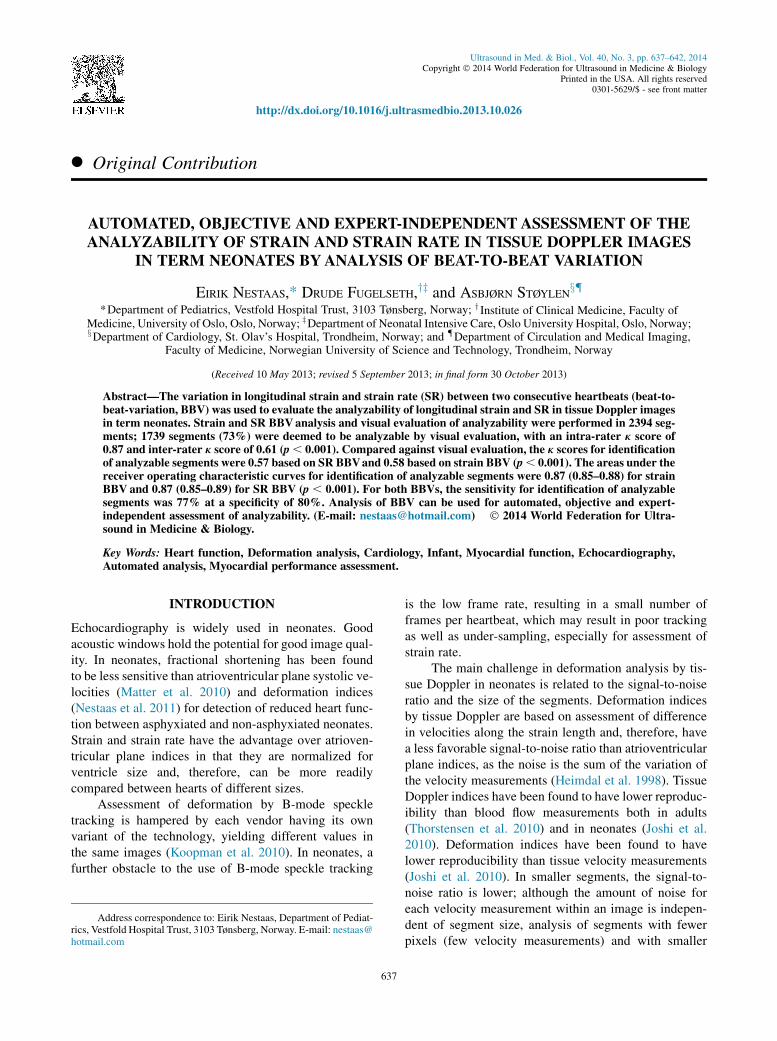
Fig. 2. In this gray-scale image of the septum wall from the api-cal four-chamber view, note the area from which the data for theapical and the basal segment deformation analyses are collected.The length of each sample area is 11 mm (the sum of the strainlength [10 mm] and the length of the region of interest [1 mm]).The width of each sample area is 3 mm (width of the region of
interest).
estimated by dividing the area between the last of the sin-gle cycle curves and the two-cycle compound curve bythe area under the curve for the compound cycle. TheBBVs were hence dimensionless parameters. A prospec-tive visual evaluation of analyzability was performed byassessment of the amount of stationary reverberationsand dropouts within each segment, and this was donebefore the strain and strain rate curves were extracted.Only small amounts of reverberations and dropoutswere accepted if the segment should be deemed analyz-able. A strain length of 10 mm, ROI length of 1 mmand ROI width of 3 mm were used. Forty millisecondsof Gaussian smoothing was employed, and linear driftcompensation was used for the Lagrangian strain curves.A semi-automatic tracking algorithm was used to keepthe ROI centered in the segment during the cardiac cycle.This tracking algorithm was part of the Echopac analysissoftware; the position of the ROI within the ultrasoundsector at specific times (usually at the end of systoleand the end of diastole) during the cardiac cycle was cho-sen manually, and the movement of the ROI during thecardiac cycle was then automatically estimated by theanalysis software, on the basis of these positions andthe electrocardiography signal. This semi-automated al-gorithmwas used to keep the ROI centered in the segmentduring the cardiac cycle and was not a part of the BBVanalyses.
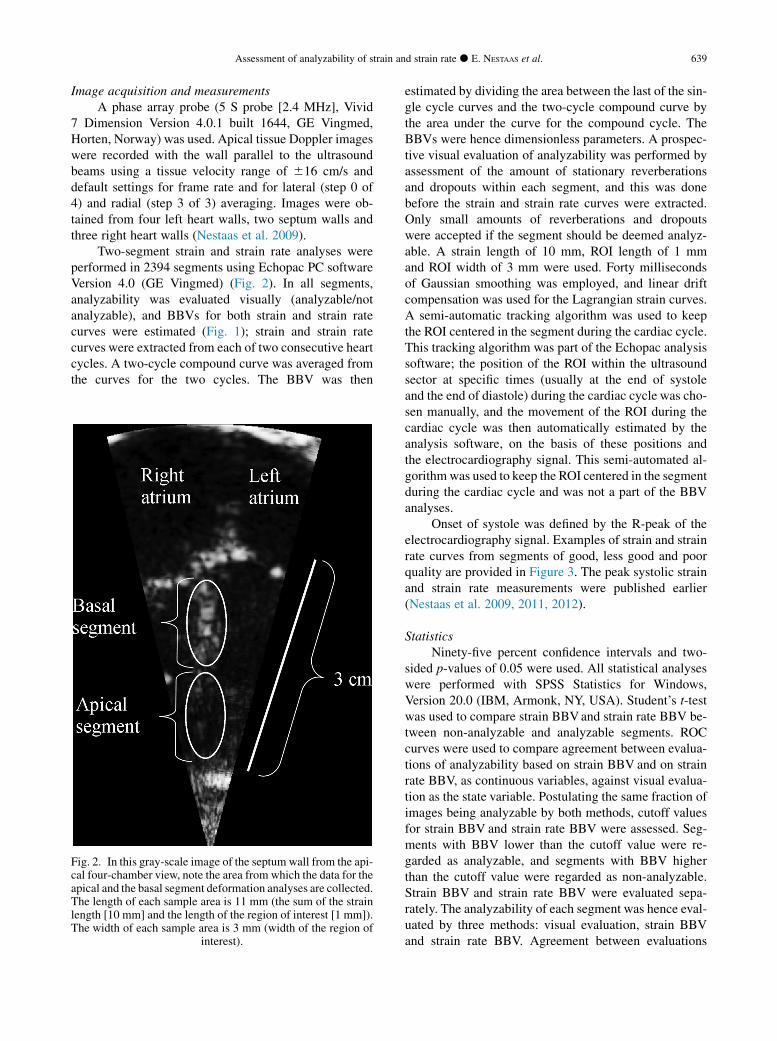
Onset of systole was defined by the R-peak of theelectrocardiography signal. Examples of strain and strainrate curves from segments of good, less good and poorquality are provided in Figure 3. The peak systolic strainand strain rate measurements were published earlier(Nestaas et al. 2009, 2011, 2012).
StatisticsNinety-five percent confidence intervals and two-
sided p-values of 0.05 were used. All statistical analyseswere performed with SPSS Statistics for Windows,Version 20.0 (IBM, Armonk, NY, USA). Student’s t-testwas used to compare strain BBVand strain rate BBV be-tween non-analyzable and analyzable segments. ROCcurves were used to compare agreement between evalua-tions of analyzability based on strain BBV and on strainrate BBV, as continuous variables, against visual evalua-tion as the state variable. Postulating the same fraction ofimages being analyzable by both methods, cutoff valuesfor strain BBV and strain rate BBV were assessed. Seg-ments with BBV lower than the cutoff value were re-garded as analyzable, and segments with BBV higherthan the cutoff value were regarded as non-analyzable.Strain BBV and strain rate BBV were evaluated sepa-rately. The analyzability of each segment was hence eval-uated by three methods: visual evaluation, strain BBVand strain rate BBV. Agreement between evaluations
Fig. 3. Two consecutive heart cycles from three segments: the left and middle panels from segments deemed analyzableby visual evaluation, and the right panel from a segment deemed non-analyzable. The symmetry between the heartbeats
decreases with decreasing quality of the images, for both strain rate (top) and strain (bottom).
640 Ultrasound in Medicine and Biology Volume 40, Number 3, 2014
of analyzability by strain BBV and strain rate BBVagainst visual evaluation were assessed with k scores.Intra- and inter-rater visual evaluation agreements wereextracted from earlier evaluations of 32 segments(Nestaas et al. 2009).
RESULTS
Of the 2394 segments included, 1739 (73%) weredeemed analyzable by visual evaluation. Details on theanalyzable and non-analyzable segments are providedin Table 2. Both strain BBV and strain rate BBV werehigher in non-analyzable than in analyzable segments.Strain BBV was significantly lower than strain rateBBV among analyzable segments (p , 0.001), whereasthere was no difference between strain BBV and strainrate BBV in non-analyzable segments.
The areas under the ROC curves for identification ofanalyzable segments were 0.87 (0.85–0.88, 95% confi-dence interval) for strain BBV and 0.87 (0.85–0.89) forstrain rate BBV (p , 0.001) (Fig. 4). At a specificity of80%, the sensitivity for identification of analyzable seg-ments was 77% for each of the BBVs, with a cutoff valueof 0.178 for strain BBVand 0.324 for strain rate BBV. Thek scores for agreement against visual evaluation and forinter- and intra-rater visual evaluation are listed inTable 3.
Table 2. Characteristics of segments deemed analyz
Analyzable segmen
Number (%) of segments 1739 (73%)Mean (95% CI) strain BBV 0.130 (0.126, 0.136Mean (95% CI) strain rate BBV 0.248 (0.243, 0.254Mean (SD) peak systolic strain,% –21.8 (7.4)Mean (SD) peak systolic strain rate, s21 –1.78 (0.74)
BBV 5 beat-to-beat variation; CI 5 confidence interval; SD 5 standard de
DISCUSSION AND SUMMARY
This study found that for deformation analysis bytissue Doppler in neonates, both strain and strain rateBBVs are lower in analyzable segments than in segmentswith inferior quality for analysis. Further, the study indi-cated that when used for evaluation of analyzability, bothBBVs had similar agreement against visual evaluation asinter-rater visual evaluation.
Strain BBV was significantly lower than strain rateBBV among analyzable segments probably because ofthe lower noise in strain analyses caused by the temporalsmoothing by the integration of the strain rate measure-ments. The reason for the similar BBVs for strain andstrain rate among non-analyzable segments could bethat both BBVs were profoundly affected by the noisein these segments and the time smoothing then had lessof an impact on the noise.
Because BBV is assessed as a fraction, both thenumerator (absolute area between the compound curveand the single-cycle curve) and the denominator (area un-der the compound curve) have effects on BBV.
The area between the single-cycle curve and thetwo-cycle compound curve (numerator) is the sum ofthe true variation between heart cycles and the noise inthe analyses. The true variation is probably smallcompared with the variation caused by random noiseand clutter, as indicated by the difference between
able and non-analyzable by visual evaluation
ts Non-analyzable segments p
655 (27%)) 0.602 (0.516, 0.689) ,0.001) 0.541 (0.519, 0.562) ,0.001
——
viation.
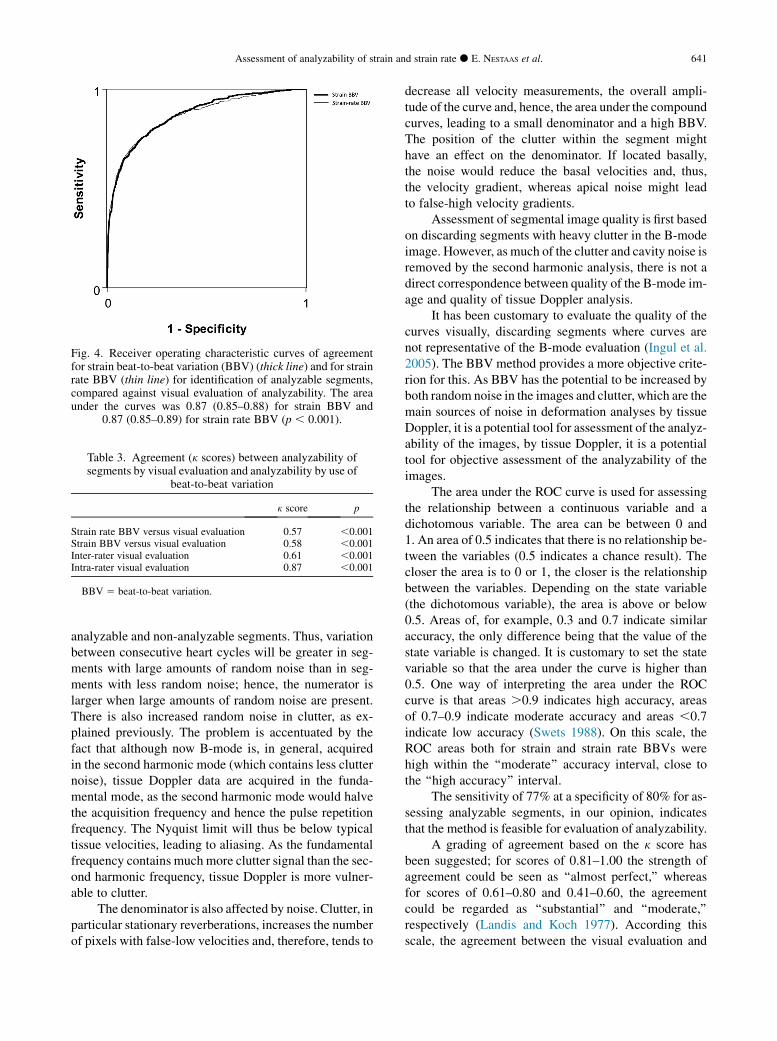
Fig. 4. Receiver operating characteristic curves of agreementfor strain beat-to-beat variation (BBV) (thick line) and for strainrate BBV (thin line) for identification of analyzable segments,compared against visual evaluation of analyzability. The areaunder the curves was 0.87 (0.85–0.88) for strain BBV and
0.87 (0.85–0.89) for strain rate BBV (p , 0.001).
Table 3. Agreement (k scores) between analyzability ofsegments by visual evaluation and analyzability by use of
beat-to-beat variation
k score p
Strain rate BBV versus visual evaluation 0.57 ,0.001Strain BBV versus visual evaluation 0.58 ,0.001Inter-rater visual evaluation 0.61 ,0.001Intra-rater visual evaluation 0.87 ,0.001
BBV 5 beat-to-beat variation.
Assessment of analyzability of strain and strain rate d E. NESTAAS et al. 641
analyzable and non-analyzable segments. Thus, variationbetween consecutive heart cycles will be greater in seg-ments with large amounts of random noise than in seg-ments with less random noise; hence, the numerator islarger when large amounts of random noise are present.There is also increased random noise in clutter, as ex-plained previously. The problem is accentuated by thefact that although now B-mode is, in general, acquiredin the second harmonic mode (which contains less clutternoise), tissue Doppler data are acquired in the funda-mental mode, as the second harmonic mode would halvethe acquisition frequency and hence the pulse repetitionfrequency. The Nyquist limit will thus be below typicaltissue velocities, leading to aliasing. As the fundamentalfrequency contains much more clutter signal than the sec-ond harmonic frequency, tissue Doppler is more vulner-able to clutter.
The denominator is also affected by noise. Clutter, inparticular stationary reverberations, increases the numberof pixels with false-low velocities and, therefore, tends to
decrease all velocity measurements, the overall ampli-tude of the curve and, hence, the area under the compoundcurves, leading to a small denominator and a high BBV.The position of the clutter within the segment mighthave an effect on the denominator. If located basally,the noise would reduce the basal velocities and, thus,the velocity gradient, whereas apical noise might leadto false-high velocity gradients.
Assessment of segmental image quality is first basedon discarding segments with heavy clutter in the B-modeimage. However, as much of the clutter and cavity noise isremoved by the second harmonic analysis, there is not adirect correspondence between quality of the B-mode im-age and quality of tissue Doppler analysis.
It has been customary to evaluate the quality of thecurves visually, discarding segments where curves arenot representative of the B-mode evaluation (Ingul et al.2005). The BBV method provides a more objective crite-rion for this. As BBV has the potential to be increased byboth random noise in the images and clutter, which are themain sources of noise in deformation analyses by tissueDoppler, it is a potential tool for assessment of the analyz-ability of the images, by tissue Doppler, it is a potentialtool for objective assessment of the analyzability of theimages.
The area under the ROC curve is used for assessingthe relationship between a continuous variable and adichotomous variable. The area can be between 0 and1. An area of 0.5 indicates that there is no relationship be-tween the variables (0.5 indicates a chance result). Thecloser the area is to 0 or 1, the closer is the relationshipbetween the variables. Depending on the state variable(the dichotomous variable), the area is above or below0.5. Areas of, for example, 0.3 and 0.7 indicate similaraccuracy, the only difference being that the value of thestate variable is changed. It is customary to set the statevariable so that the area under the curve is higher than0.5. One way of interpreting the area under the ROCcurve is that areas .0.9 indicates high accuracy, areasof 0.7–0.9 indicate moderate accuracy and areas ,0.7indicate low accuracy (Swets 1988). On this scale, theROC areas both for strain and strain rate BBVs werehigh within the ‘‘moderate’’ accuracy interval, close tothe ‘‘high accuracy’’ interval.
The sensitivity of 77% at a specificity of 80% for as-sessing analyzable segments, in our opinion, indicatesthat the method is feasible for evaluation of analyzability.
A grading of agreement based on the k score hasbeen suggested; for scores of 0.81–1.00 the strength ofagreement could be seen as ‘‘almost perfect,’’ whereasfor scores of 0.61–0.80 and 0.41–0.60, the agreementcould be regarded as ‘‘substantial’’ and ‘‘moderate,’’respectively (Landis and Koch 1977). According thisscale, the agreement between the visual evaluation and
642 Ultrasound in Medicine and Biology Volume 40, Number 3, 2014
evaluation based on each of the BBVs should be seen asmoderate. Even though the k scores based on both BBVsin our study were just below the cutoff between ‘‘substan-tial’’ and ‘‘moderate,’’ while the inter-rater k score wasjust above the same cutoff value, the k scores were verysimilar. In our opinion the agreement between evaluationbased on BBVs and visual evaluation should therefore beregarded as similar to the inter-rater visual evaluationagreement.
The angle between the velocity vector and the ultra-sound beam has an effect on measurement of tissueDoppler velocity, and for deformation indices by tissueDoppler, the relationship is complex (Heimdal 1999).Optimal alignment between the myocardial wall andthe ultrasound beam should be obtained duringacquisition.
The deeming of analyzability most likely varies be-tween studies. The fact that image quality could influencemeasurements (Nestaas et al. 2009) would be an obstacleto direct comparisons of deformation indices betweenstudies. It would be possible to use the BBVas an objec-tive tool for noise estimation to implement a similar cut-off between analyzable and non-analyzable segments andfacilitate comparisons of tissue Doppler-derived defor-mation indices between studies. It would be possible toimplement real-time evaluation of analyzability basedon BBV in the analysis software.
LimitationsThe use of BBV for evaluation of analyzability of
segments has so far been investigated only in neonates.Settings during acquisition and analysis most likelywill have effects on BBV and, hence, on the cutoff valuebetween analyzable and non-analyzable segments. Al-though we observed no significant effect of respirationon heart rate, variation in heart rate caused by respirationwould have an effect on BBV, an effect that might bemore significant in older children. Different probe typesand scanners could have effects on these cutoff values.The optimal acquisition settings may differ dependingon the type of probe and scanner. BBV values have notbeen assessed for segments set stationary in the ultra-sound sector. Noise positioned in the most apical partof the segments might increase BBV less than noise inother parts of the segment.
CONCLUSIONS
The variation in the curves for strain and strain ratebetween two consecutive heartbeats, assessed as strainand strain rate beat-to-beat variation, can be used forautomated, objective and expert-independent assessmentof the analyzability of tissue Doppler images in neonates,aiding non-experts in the evaluation of the analyzability
of the segments. The agreement between the automatedevaluations and the visual evaluation was similar to thatfor the inter-rater visual evaluation. The specificity andsensitivity for assessment of the analyzability of seg-ments by beat-to-beat variation were acceptable.
Acknowledgments—This project has been financially supported by theNorwegian Extra Foundation for Health and Rehabilitation throughEXTRA funds, by the Vestfold Hospital Trust and by the Ren�ee andBredo Grimsgaard’s Foundation. Leiv Sandvik advised on the statistics.We thank Andreas Heimdal for valuable technical comments.
REFERENCES
Heimdal A. Angle dependence of strain rate. In: Doppler based ultra-sound imaging methods for noninvasive assessment of viability.PhD dissertation. Trondheim: Norwegian University of Scienceand Technology, 1999:55–64.
Heimdal A, Stoylen A, Torp H, Skjaerpe T. Real-time strain rate imag-ing of the left ventricle by ultrasound. JAm Soc Echocardiogr 1998;11:1013–1019.
Helfer S, Schmitz L, Buhrer C, Czernik C. Reproducibility and optimi-zation of analysis parameters of tissue Doppler-derived strain andstrain rate measurements for very low birth weight infants. Echocar-diography 2013 June 6; http://dx.doi.org/10.1111/echo.12273.
Ingul CB, Torp H, Aase SA, Berg S, Stoylen A, Slordahl SA. Automatedanalysis of strain rate and strain: Feasibility and clinical implica-tions. J Am Soc Echocardiogr 2005;18:411–418.
Joshi S, Edwards JM, Wilson DG, Wong JK, Kotecha S, Fraser AG.Reproducibility of myocardial velocity and deformation imagingin term and preterm infants. Eur J Echocardiogr 2010;11:44–50.
Koopman LP, Slorach C, Hui W, Manlhiot C, McCrindle BW,FriedbergMK, Jaeggi ET, Mertens L. Comparison between differentspeckle tracking and color tissue Doppler techniques to measureglobal and regional myocardial deformation in children. J Am SocEchocardiogr 2010;23:919–928.
Landis JR, Koch GG. The measurement of observer agreement for cat-egorical data. Biometrics 1977;33:159–174.
Matter M, Abdel-Hady H, Attia G, Hafez M, Seliem W, Al-Arman M.Myocardial performance in asphyxiated full-term infants assessedby Doppler tissue imaging. Pediatr Cardiol 2010;31:634–642.
Nestaas E, Stoylen A, Brunvand L, Fugelseth D. Tissue Doppler derivedlongitudinal strain and strain rate during the first 3 days of life inhealthy term neonates. Pediatr Res 2009;65:357–360.
Nestaas E, Stoylen A, Brunvand L, Fugelseth D. Longitudinal strain andstrain rate by tissue Doppler are more sensitive indices than frac-tional shortening for assessing the reduced myocardial function inasphyxiated neonates. Cardiol Young 2011;21:1–7.
Nestaas E, Stoylen A, Fugelseth D. Optimal types of probe, and tissueDoppler frame rates, for use during tissue Doppler recording andoff-line analysis of strain and strain rate in neonates at term. CardiolYoung 2008;18:502–511.
Nestaas E, Stoylen A, Fugelseth D.Myocardial performance assessmentin neonates by one-segment strain and strain rate analysis by tissueDoppler—A quality improvement cohort study. BMJ Open 2012;2:e001636.
Nestaas E, Stoylen A, Sandvik L, Brunvand L, Fugelseth D. Feasibilityand reliability of strain and strain rate measurement in neonates byoptimizing the analysis parameters settings. Ultrasound Med Biol2007;33:270–278.
Sagberg E, Malm S, Ingul CB, Torp H, Stoylen A. Spatial velocity dis-tribution for visualising velocity gradients: Feasibility and prelimi-nary experience. Eur J Echocardiogr 2004;5(Suppl 1):S152.
Swets JA. Measuring the accuracy of diagnostic systems. Science 1988;240:1285–1293.
Thorstensen A, Dalen H, Amundsen BH, Aase SA, Stoylen A. Repro-ducibility in echocardiographic assessment of the left ventricularglobal and regional function: The HUNT study. Eur J Echocardiogr2010;11:149–156.