Embed Size (px)
Citation preview

Automated Instrumentation and Monitoring System (AIMS)
URL hhttp://science.nas.nasa.gov/Software/AIMS
Version 3.7
Languages ANSI C, Fortran 77
Platforms IBM SP with IBM MPI or MPICHSun, SGI, and HP workstations with MPICHSGI Power Challenge with SGI MPI

AIMS Components
• Source code instrumentors– xinstrument– batch_inst
• Monitoring library
• Analysis tools– View Kernel (VK)– tally statistics generator

xinstrument
• GUI allows user to select specific source code constructs to be instrumented
• Default is to instrument all communication routines
• Other possibilities
– All subroutines
– All I/O
– Enable by Type
– Point and click on particular constructs in Construct Tree diagrams

xinstrument (cont.)
• Regards source code as nested collection of constructs
– conditionals
– loops
– subroutines
– communication calls
• Instrumented construct is replaced or surrounded by calls to AIMS monitor routines
• Execution of instrumented construct generates time-stamped event

xinstrument display

Files Menu Selections
Selection Action
Load Modules Brings up dialog box for file selection.Specify language/platform beforeloading.File containing main program must beloaded.
Instrument AllModules
Instruments all files loaded
Exit

Options Menu Selections
Selection ActionAll Subroutines Instruments entry to
and exit from allsubroutines
All CommunicationConstructs
Instruments all sendsand receives
All I/O Instruments all I/Oactivities
Enable by Type Brings up dialog boxfor specifying whichconstructs toinstrument

Enable by Type dialog box

Advanced Options Menu Selections
Selection ActionInstrument Selected Modules Instruments constructs selected in
the Construct-Tree PaneEnable Selected Modules by Type An Enable by Type dialog box is
brought up and applied to filesselected in the Construct-Tree Pane
Remove Selected Modules Don’t instrument constructs selectedin the Construct-Tree Pane
Profile Load or Save profile
Monitor file Load or Save AIMS.monrc file
Set Preprocessor Options Brings up dialog box forpreprocessor options for the parser,such as –D and -I

Files created by xinstrument
• The following files are created by xinstrument and placed in ./inst or designated output directory
– Instrumented source code
– AIMS.monrc - parameters from Settings pane plus other options
– Application database
• default name is APPL_DB
• Stores information about static structure of application
• Used by analysis tools to relate traced events to Instrumented constructs
• Incorporated at beginning of trace file
– Profile
• Table of flags, one for each construct in The application database
• Can be edited to change instrumentation

batch_inst• Command-line instrumentor
batch_inst [-options] [filenames]
where options include:-output <pathname> directory for instrumented code-origin <pathname> root of source tree-enable <type> <type> = (all | procs | io |
default | reset)-pp_options <switches> preprocessor options-platform (f77-mpi | c-mpi) platform-verbose

Compiling and Running Instrumented Code
• Copy necessary files to inst directory– Makefile– Header files– Source files not instrumented– Input files

Example directory structure

Compiling and Running (cont.)
• Link with AIMS MPI monitor libraryMON_LIB = $(AIMS_DIR)/lib
app: $(F77) -o app_program $(APP_OBJS) $(MON_LIB)/mpilib.a
• Set $AIMS_TMP_DIR environment variable to location to store local trace files
•Make sure AIMS scripts and executables are in your path•Per-process trace files are automatically collected and merged at end of execution
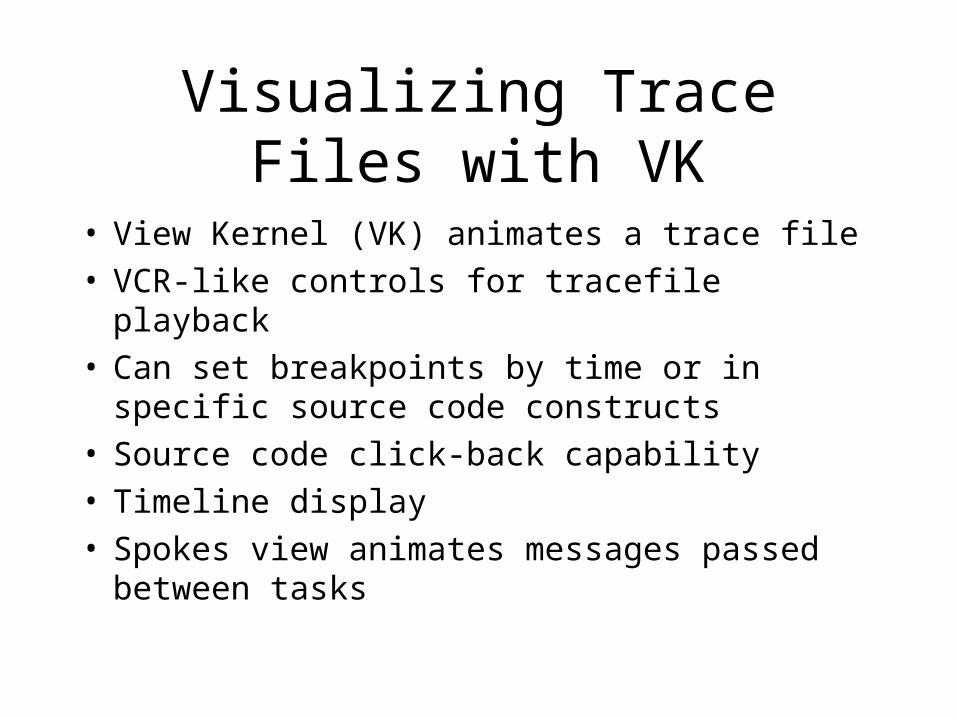
Visualizing Trace Files with VK
• View Kernel (VK) animates a trace file• VCR-like controls for tracefile playback• Can set breakpoints by time or in specific source
code constructs• Source code click-back capability• Timeline display• Spokes view animates messages passed between
tasks

Timeline Display
• Toggles between three different views
• OverVIEW– Horizontal bars represent tasks
– Colors represent different instrumented subroutines
– White space indicates task is blocked waiting to complete send or receive
– XX pattern indicates time spent writing AIMS trace files to disk
– Lines between bars represent messages transmitted between taSks
– Use keystroke and click combinations to get more information

AIMS OverVIEW with source code clickback

Click-back keystroke combinations
Informationdesired
OverVIEWobject
Mouse button Key
Routine name/causefor idle
subroutine bar middle
Construct tree ofroutine
subroutine bar middle control
Statistics aboutmessage
message line left
Construct tree ofsend task
message line left control
Source of send task message line left shift
Source of receivetask
message line right shift

Timeline Display (cont.)
• I/OverVIEW
– Colored bars indicate read, write, seek, etc.
– Height of bar represents size of message
• MsgVIEW
– Idle time shown with two colors, one for send idling and one for receive idling
– Time spent computing shown as white space
– Message lines
– Height of bar represents message size

AIMS MsgVIEW

AIMS I/OverVIEW

•blue - idle receive
•green - busy
•yellow - idle send
•hatched - flushing
Spokes View

Controlling Scale and Speed of Playback
• No scrolling or zooming capabilities
• Set jump factor between 0 and 1 to speed up animation
• Set pause times or breakpoints to slow down animation
• Set scale to view larger or smaller time interval (default is 100 milliseconds)

tally
• Processes trace file to produce resource utilization statistics on node-by-node and routine-by-routine basis
• tally output can be input to statistical drawing packages such as Excel or WingZ

tally [options] [sorted tracefile]
where options include:
-help Prints usage message
-proc[=Name] Print information for procedure(s)
-node[=Node] Print information for node(s)
-ncpu Print information aboutnormalized cpu usage
-msg Print information about messagesizes per node
-all Print all information(proc+node+ncpu+msg)

tally output - tally.summary
• Information for each procedure/function:– busy time: time spent performing useful work
– global blocking: time spent in global blocking operation
– send blocking: time spent in send operation
– receive blocking: time spent in receive operation
– life time: exclusive time
– percentage communication: percentage of total execution time spent in communication
– communication index: time spent in routine with respect to total time of program, as well as percentage of time spent in communication in this routine

tally.summary (cont.)
• Information for each node (and routine):– busy time– global blocking– send blocking– recv blocking– percentage communication

tally output - ncpu.summary
• NCPU for a given subroutine and a given k is the amount of CPU time used by that subroutine when k processors are busy, divided by k.
• Routine Concurrency - amount of time spent by each subroutine when k copies were executing simultaneously (indicates degree to which each routine was parallelized)

Graphs created by Excel 4.0 from tally output