Embed Size (px)
Citation preview

NISTIR 8029
Automated Guided Vehicle Bumper
Test Method Development
Richard Norcross
Roger Bostelman
Joe Falco
This publication is available free of charge from:
http://dx.doi.org/10.6028/NIST.IR.8029
NISTIR 8029
Automated Guided Vehicle Bumper
Test Method Development
Richard Norcross
Roger Bostelman
Joe Falco
Intelligent Systems Division
Engineering Laboratory
This publication is available free of charge from:
http://dx.doi.org/10.6028/NIST.IR.8029
May 2015
U.S. Department of Commerce Penny Pritzker, Secretary
National Institute of Standards and Technology
Willie May, Acting Under Secretary of Commerce for Standards and Technology and Acting Director
1
Abstract
The National Institute of Standards and Technology (NIST) is developing test methods for contact
bumpers used on Automated Guided Vehicles (AGVs) as a basis for safety standards. This paper
describes proposed test methods, force measurements for contact bumpers, and the associated impact
force theory. The results of this study are provided as reference to the AGV industry as a possible
resolution for currently non-existent AGV contact bumper test methods safety standards.
Key Words: test method, automated guided vehicle, ANSI/ITSDF B56.5 safety standard, bumper
force measurement, impact, clamp
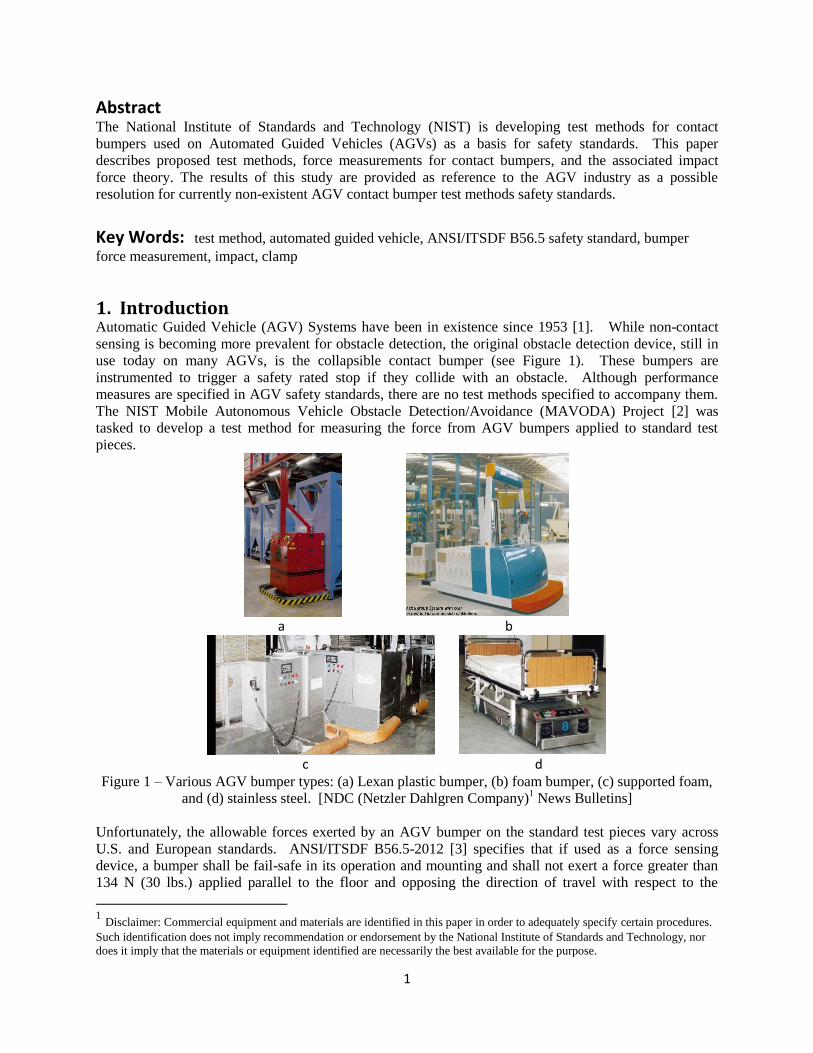
1. Introduction Automatic Guided Vehicle (AGV) Systems have been in existence since 1953 [1]. While non-contact
sensing is becoming more prevalent for obstacle detection, the original obstacle detection device, still in
use today on many AGVs, is the collapsible contact bumper (see Figure 1). These bumpers are
instrumented to trigger a safety rated stop if they collide with an obstacle. Although performance
measures are specified in AGV safety standards, there are no test methods specified to accompany them.
The NIST Mobile Autonomous Vehicle Obstacle Detection/Avoidance (MAVODA) Project [2] was
tasked to develop a test method for measuring the force from AGV bumpers applied to standard test
pieces.
a b
c d Figure 1 – Various AGV bumper types: (a) Lexan plastic bumper, (b) foam bumper, (c) supported foam,
and (d) stainless steel. [NDC (Netzler Dahlgren Company)1 News Bulletins]
Unfortunately, the allowable forces exerted by an AGV bumper on the standard test pieces vary across
U.S. and European standards. ANSI/ITSDF B56.5-2012 [3] specifies that if used as a force sensing
device, a bumper shall be fail-safe in its operation and mounting and shall not exert a force greater than
134 N (30 lbs.) applied parallel to the floor and opposing the direction of travel with respect to the
1 Disclaimer: Commercial equipment and materials are identified in this paper in order to adequately specify certain procedures.
Such identification does not imply recommendation or endorsement by the National Institute of Standards and Technology, nor
does it imply that the materials or equipment identified are necessarily the best available for the purpose.
2
bumper. Bumper activation shall cause a safety stop within the collapsible range of the bumper and
before the vehicle strikes an obstacle. Both B56.5 and British Standard EN1525 [4] specify using the
same size test pieces and EN1525 also specifies the associated maximum forces for each test piece as: 1)
a horizontal test piece with 200 mm diameter and 600 mm length lying in the AGV path, maximum
actuating force on the test piece of 750 N (169 lbs.) and 2) a test piece with 70 mm diameter and 400 mm
height positioned vertically along the cylinder axis in the AGV path, having maximum actuating force on
the test piece of 250 N (56 lbs.). EN1525 also specifies that the force when the bumper is compressed to
the position reached in a bumper stop from maximum speed and load shall not exceed 400 N (90 Lbs).
One can assume that the horizontal test piece described in [3] and [4] represent the human torso or upper
leg lying in the path of the AGV and the vertical test piece represents a vertical human’s lower leg in the
path of an AGV, although this is not explicitly stated within the standards. In addition, neither standard
provides an indication of the origins of the specified force values as the result of biomechanical research
and the absence of test guidance presents serious issues concerning the validity of using the standards to
test bumpers.
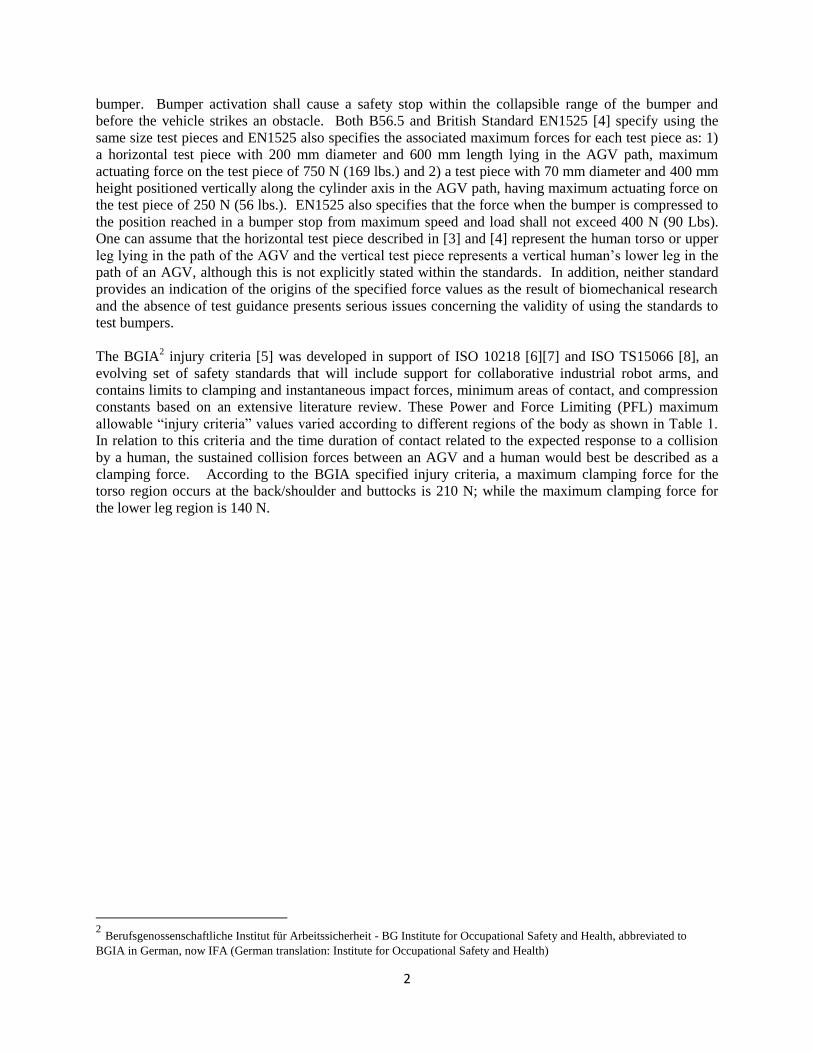
The BGIA2 injury criteria [5] was developed in support of ISO 10218 [6][7] and ISO TS15066 [8], an
evolving set of safety standards that will include support for collaborative industrial robot arms, and
contains limits to clamping and instantaneous impact forces, minimum areas of contact, and compression
constants based on an extensive literature review. These Power and Force Limiting (PFL) maximum
allowable “injury criteria” values varied according to different regions of the body as shown in Table 1.
In relation to this criteria and the time duration of contact related to the expected response to a collision
by a human, the sustained collision forces between an AGV and a human would best be described as a
clamping force. According to the BGIA specified injury criteria, a maximum clamping force for the
torso region occurs at the back/shoulder and buttocks is 210 N; while the maximum clamping force for
the lower leg region is 140 N.
2 Berufsgenossenschaftliche Institut für Arbeitssicherheit - BG Institute for Occupational Safety and Health, abbreviated to
BGIA in German, now IFA (German translation: Institute for Occupational Safety and Health)
3
Table 1: Injury criteria and body models from early drafts of ISO TS 15066. Clamping/squeezing force
(CSF) and impact force (IMF) values are provided for several regions of the body (a), with the
distinctions between the two being characterized by duration and magnitude (b).
The study is based on the premise to avoid injury severities exceeding category 1 of the Abbreviated
Injury Scale [9] or “surface injuries” as codified by ICD-10-GM 20062 [10]. Resultant study values are
considered by many to be overly conservative [11] because of the diversity of data used in the study and
the large safety factor applied to the final results. More recently, development of ISO TS 15066 has
included results based on a scientific study of pain thresholds at the Johannes Gutenberg University in
Mainz, Germany [12]. Using the same body regions as the injury criteria, the pain threshold study uses a
custom-built algometer to measure the forces and pressures incurred by applying ramped force behind a
plastic plunger pushing against the clamped body parts. The resulting values of both studies are expected
to be integrated into ISO TS 15066.
In order to test industrial robot operation in its ability to stay below documented criteria, NIST has
developed a force and displacement measurement device for measuring robot applied forces [13]. A
simultaneous study at Fraunhofer Institute for Factory Operation and Automation (IFF), Magdeburg,
Germany, is measuring robot impact forces based on instantaneous impacts of free and constrained body
regions [14]. That study is developing models in the form of transfer functions to relate direct clamping
force measurement to free body collisions.
2. Test Setup NIST used an industrial robot system to conduct controlled experiments during initial development of the
bumper force test apparatus. Three different bumper types were fixtured to the robot arm, a constant
velocity was applied to the bumpers, and collisions were applied to different test apparatus configurations.
In addition, the final apparatus design was calibrated using this robot test set-up. Bumper types,
apparatus design, and calibration are detailed in the following sections.
Body model
Main and individual regions with codification a
Maximum allowable Limit values of the
injury severity criteria (CSF, IMF, PSP)
and arranging factor (CC) b
(a)
Main body regions Individual body regions CSF IMF PSP CC
[N] [N] [N/cm²] [N/mm]
1. Head with
neck
1.1 Skull/Forehead 130 175 30 150
1.2 Face 65 90 20 75
1.3 Neck (sides/neck) 145 190 50 50
1.4 Neck (front/larynx) 35 35 10 10
2. Trunk 2.1 Back/Shoulders 210 250 70 35
2.2 Chest 140 210 45 25
2.3 Belly 110 160 35 10
2.4 Pelvis 180 250 75 25
2.5 Buttocks 210 250 80 15
(b)
3. Upper
extremities
3.1 Upper arm/Elbow joint 150 190 50 30
3.2 Lower arm/Hand joint 160 220 50 40
3.3 Hand/Finger 135 180 60 75
4. Lower
extremities
4.1 Thigh/Knee 220 250 80 50
4.2 Lower leg 140 170 45 60
4.3 Feet/Toes/Joint 125 160 45 75
a BR - Body region with codification
Regions - Name of the individual body region
b CSF - Clamping/Squeezing force
IMF - Impact force
PSP - Pressure/Surface pressing
CC - Compression constant
4
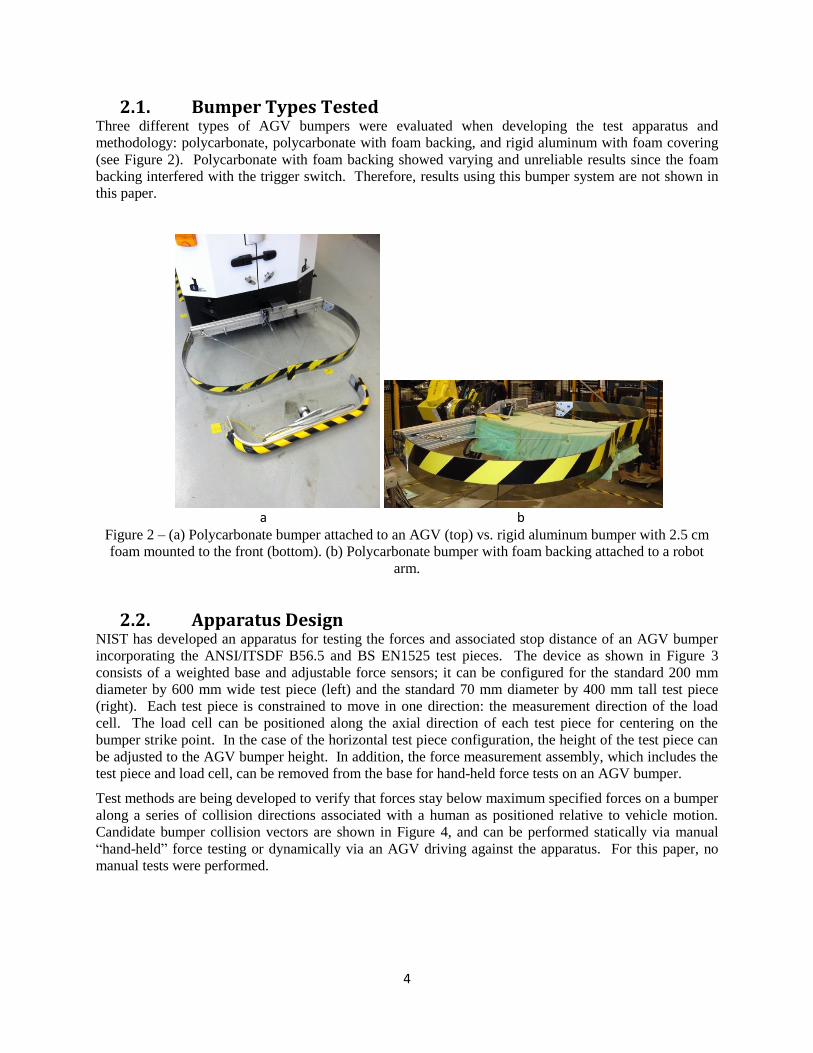
2.1. Bumper Types Tested Three different types of AGV bumpers were evaluated when developing the test apparatus and
methodology: polycarbonate, polycarbonate with foam backing, and rigid aluminum with foam covering
(see Figure 2). Polycarbonate with foam backing showed varying and unreliable results since the foam
backing interfered with the trigger switch. Therefore, results using this bumper system are not shown in
this paper.
a b
Figure 2 – (a) Polycarbonate bumper attached to an AGV (top) vs. rigid aluminum bumper with 2.5 cm
foam mounted to the front (bottom). (b) Polycarbonate bumper with foam backing attached to a robot
arm.
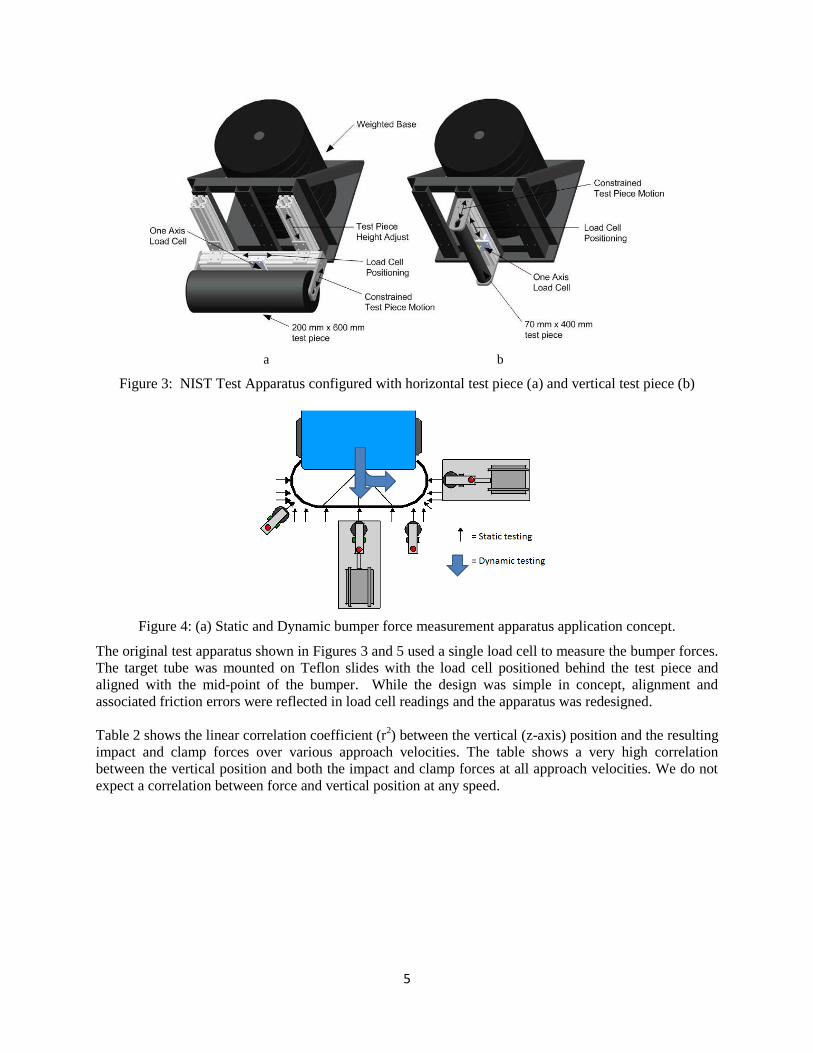
2.2. Apparatus Design NIST has developed an apparatus for testing the forces and associated stop distance of an AGV bumper
incorporating the ANSI/ITSDF B56.5 and BS EN1525 test pieces. The device as shown in Figure 3
consists of a weighted base and adjustable force sensors; it can be configured for the standard 200 mm
diameter by 600 mm wide test piece (left) and the standard 70 mm diameter by 400 mm tall test piece
(right). Each test piece is constrained to move in one direction: the measurement direction of the load
cell. The load cell can be positioned along the axial direction of each test piece for centering on the
bumper strike point. In the case of the horizontal test piece configuration, the height of the test piece can
be adjusted to the AGV bumper height. In addition, the force measurement assembly, which includes the
test piece and load cell, can be removed from the base for hand-held force tests on an AGV bumper.
Test methods are being developed to verify that forces stay below maximum specified forces on a bumper
along a series of collision directions associated with a human as positioned relative to vehicle motion.
Candidate bumper collision vectors are shown in Figure 4, and can be performed statically via manual
“hand-held” force testing or dynamically via an AGV driving against the apparatus. For this paper, no
manual tests were performed.
5
a b
Figure 3: NIST Test Apparatus configured with horizontal test piece (a) and vertical test piece (b)
Figure 4: (a) Static and Dynamic bumper force measurement apparatus application concept.
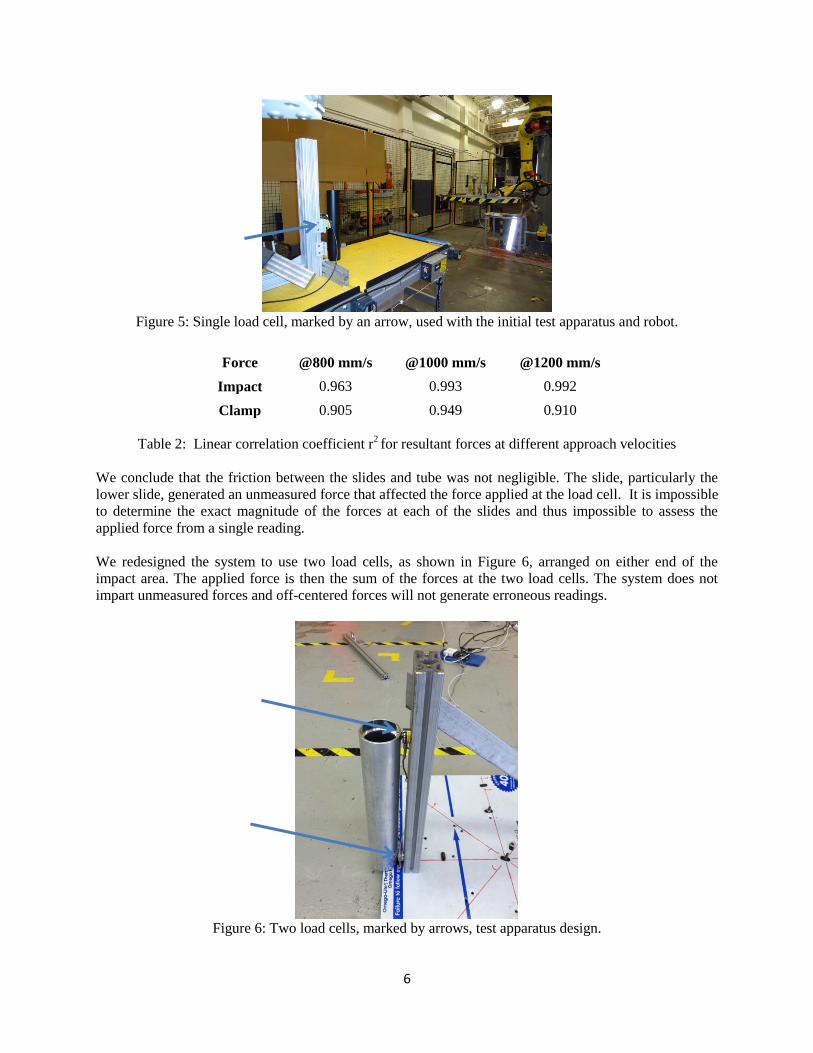
The original test apparatus shown in Figures 3 and 5 used a single load cell to measure the bumper forces.
The target tube was mounted on Teflon slides with the load cell positioned behind the test piece and
aligned with the mid-point of the bumper. While the design was simple in concept, alignment and
associated friction errors were reflected in load cell readings and the apparatus was redesigned.
Table 2 shows the linear correlation coefficient (r2) between the vertical (z-axis) position and the resulting
impact and clamp forces over various approach velocities. The table shows a very high correlation
between the vertical position and both the impact and clamp forces at all approach velocities. We do not
expect a correlation between force and vertical position at any speed.
6
Figure 5: Single load cell, marked by an arrow, used with the initial test apparatus and robot.
Force @800 mm/s @1000 mm/s @1200 mm/s
Impact 0.963 0.993 0.992
Clamp 0.905 0.949 0.910
Table 2: Linear correlation coefficient r2 for resultant forces at different approach velocities
We conclude that the friction between the slides and tube was not negligible. The slide, particularly the
lower slide, generated an unmeasured force that affected the force applied at the load cell. It is impossible
to determine the exact magnitude of the forces at each of the slides and thus impossible to assess the
applied force from a single reading.
We redesigned the system to use two load cells, as shown in Figure 6, arranged on either end of the
impact area. The applied force is then the sum of the forces at the two load cells. The system does not
impart unmeasured forces and off-centered forces will not generate erroneous readings.
Figure 6: Two load cells, marked by arrows, test apparatus design.
7
During initial testing of the apparatus it was observed that vertical and horizontal misalignments could
affect measurements. Care should be taken to ensure vertical and horizontal alignment of the test pieces.
We identified a correlation between the vertical offset and the clamp force that should not occur. We
suspected and verified that the correlation is caused by a slight vertical misalignment to the vertical test
piece. We used a steel coil spring as a bumper for the verification. Thus, the bumper has a well-defined
and consistent spring constant.
Two sets of bumper data using the spring were collected. Both sets included measurements at various
vertical offsets. One data set compressed the bumper 10 mm more than the other. From the data we
calculate the bumper’s spring constant at 14.54 N/mm.
We then used the spring bumper to calculate the tube tilt. The test rail that we used for tests and
verification included a force sensor. We slowly moved the spring against the target tube and recorded the
position at a predetermined force (30 N at 139.665 mm). We offset the spring bumper in the vertical
direction (200 mm) and recorded when the rail’s force sensor read the predetermined force (30 N at
138.641 mm). Thus the tube tilts at 0.00512 mm/mm.
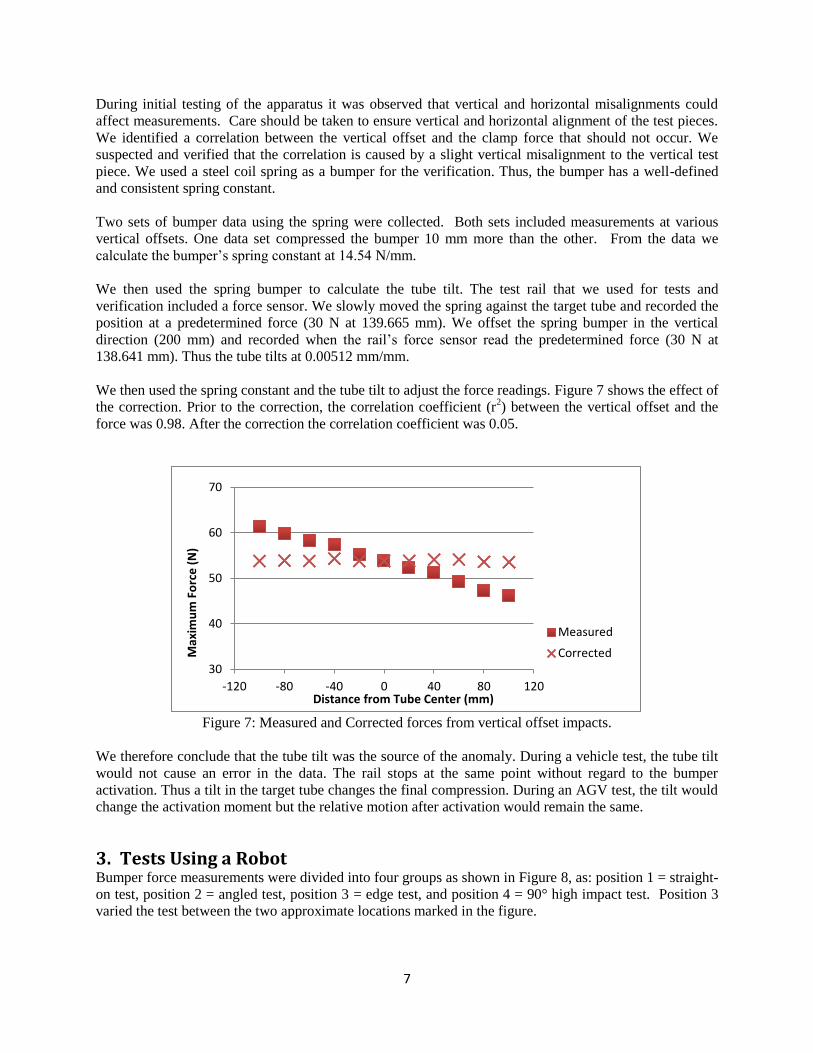
We then used the spring constant and the tube tilt to adjust the force readings. Figure 7 shows the effect of
the correction. Prior to the correction, the correlation coefficient (r2) between the vertical offset and the
force was 0.98. After the correction the correlation coefficient was 0.05.
Figure 7: Measured and Corrected forces from vertical offset impacts.
We therefore conclude that the tube tilt was the source of the anomaly. During a vehicle test, the tube tilt
would not cause an error in the data. The rail stops at the same point without regard to the bumper
activation. Thus a tilt in the target tube changes the final compression. During an AGV test, the tilt would
change the activation moment but the relative motion after activation would remain the same.
3. Tests Using a Robot Bumper force measurements were divided into four groups as shown in Figure 8, as: position 1 = straight-
on test, position 2 = angled test, position 3 = edge test, and position 4 = 90° high impact test. Position 3
varied the test between the two approximate locations marked in the figure.
30
40
50
60
70
-120 -80 -40 0 40 80 120
Max
imu
m F
orc
e (
N)
Distance from Tube Center (mm)
Measured
Corrected
8
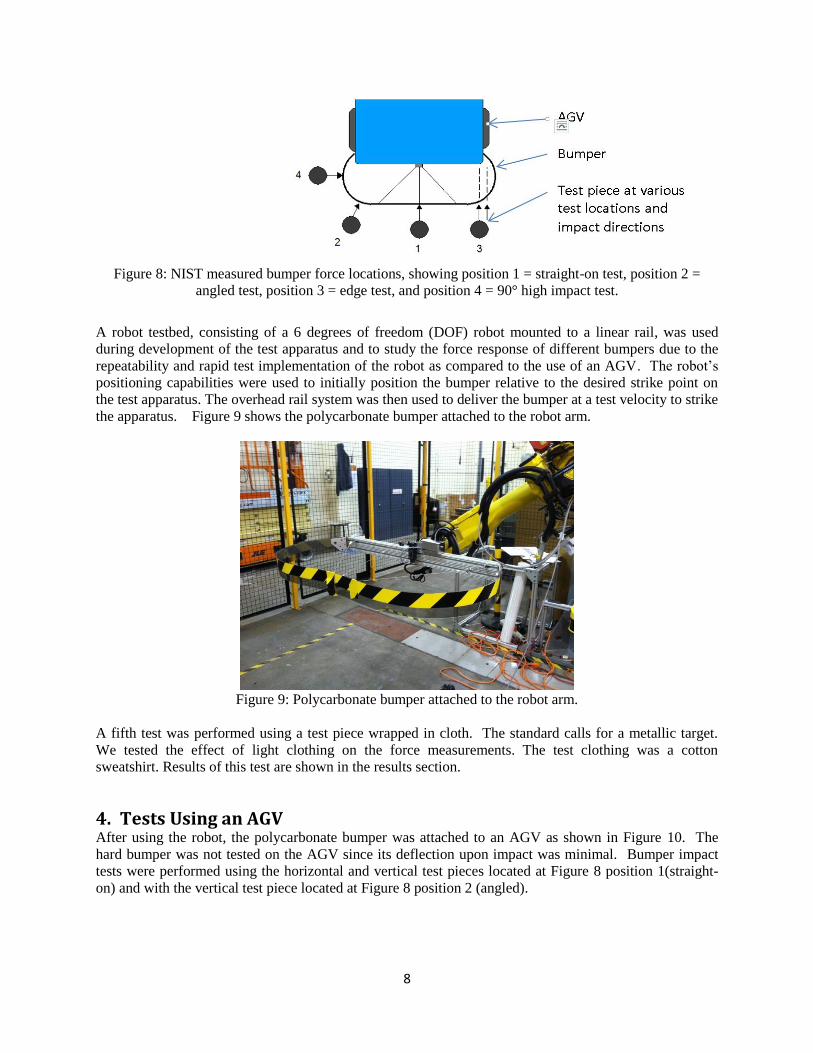
Figure 8: NIST measured bumper force locations, showing position 1 = straight-on test, position 2 =
angled test, position 3 = edge test, and position 4 = 90° high impact test.
A robot testbed, consisting of a 6 degrees of freedom (DOF) robot mounted to a linear rail, was used
during development of the test apparatus and to study the force response of different bumpers due to the
repeatability and rapid test implementation of the robot as compared to the use of an AGV. The robot’s
positioning capabilities were used to initially position the bumper relative to the desired strike point on
the test apparatus. The overhead rail system was then used to deliver the bumper at a test velocity to strike
the apparatus. Figure 9 shows the polycarbonate bumper attached to the robot arm.
Figure 9: Polycarbonate bumper attached to the robot arm.
A fifth test was performed using a test piece wrapped in cloth. The standard calls for a metallic target.
We tested the effect of light clothing on the force measurements. The test clothing was a cotton
sweatshirt. Results of this test are shown in the results section.
4. Tests Using an AGVAfter using the robot, the polycarbonate bumper was attached to an AGV as shown in Figure 10. The
hard bumper was not tested on the AGV since its deflection upon impact was minimal. Bumper impact
tests were performed using the horizontal and vertical test pieces located at Figure 8 position 1(straight-
on) and with the vertical test piece located at Figure 8 position 2 (angled).
12 3
AGV
Bumper
Test piece at various test locations and impact directions
9
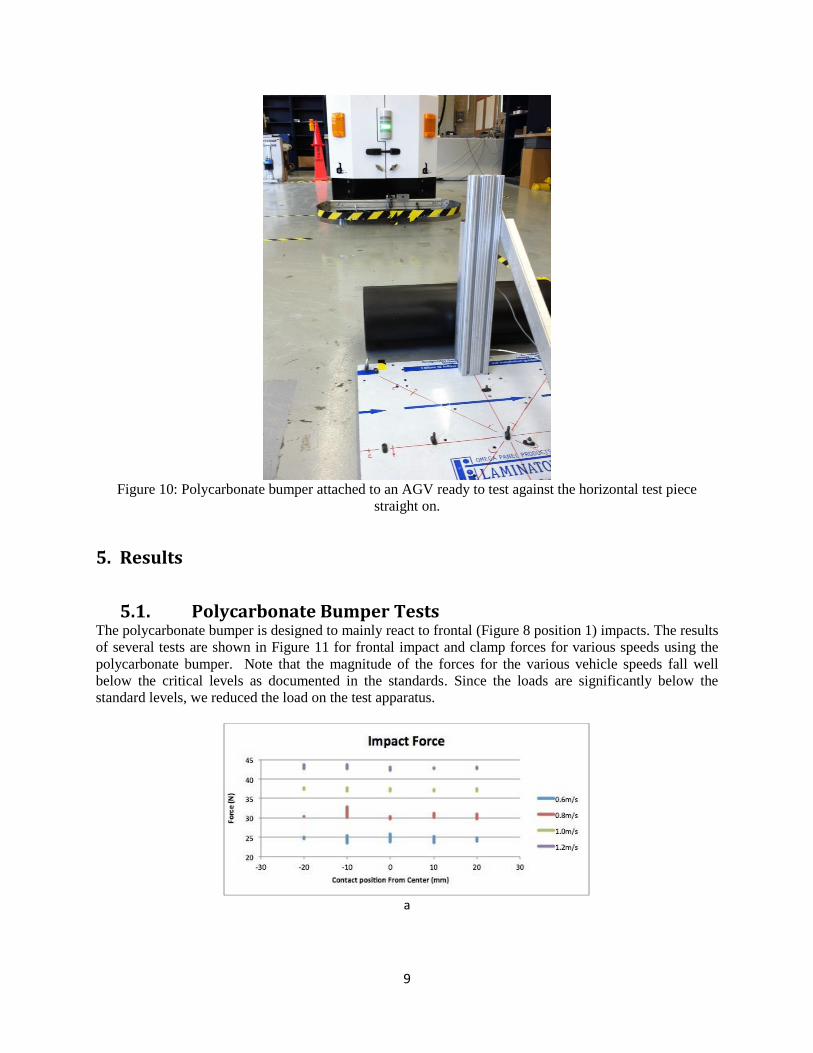
Figure 10: Polycarbonate bumper attached to an AGV ready to test against the horizontal test piece
straight on.
5. Results
5.1. Polycarbonate Bumper Tests The polycarbonate bumper is designed to mainly react to frontal (Figure 8 position 1) impacts. The results
of several tests are shown in Figure 11 for frontal impact and clamp forces for various speeds using the
polycarbonate bumper. Note that the magnitude of the forces for the various vehicle speeds fall well
below the critical levels as documented in the standards. Since the loads are significantly below the
standard levels, we reduced the load on the test apparatus.
a
10
b
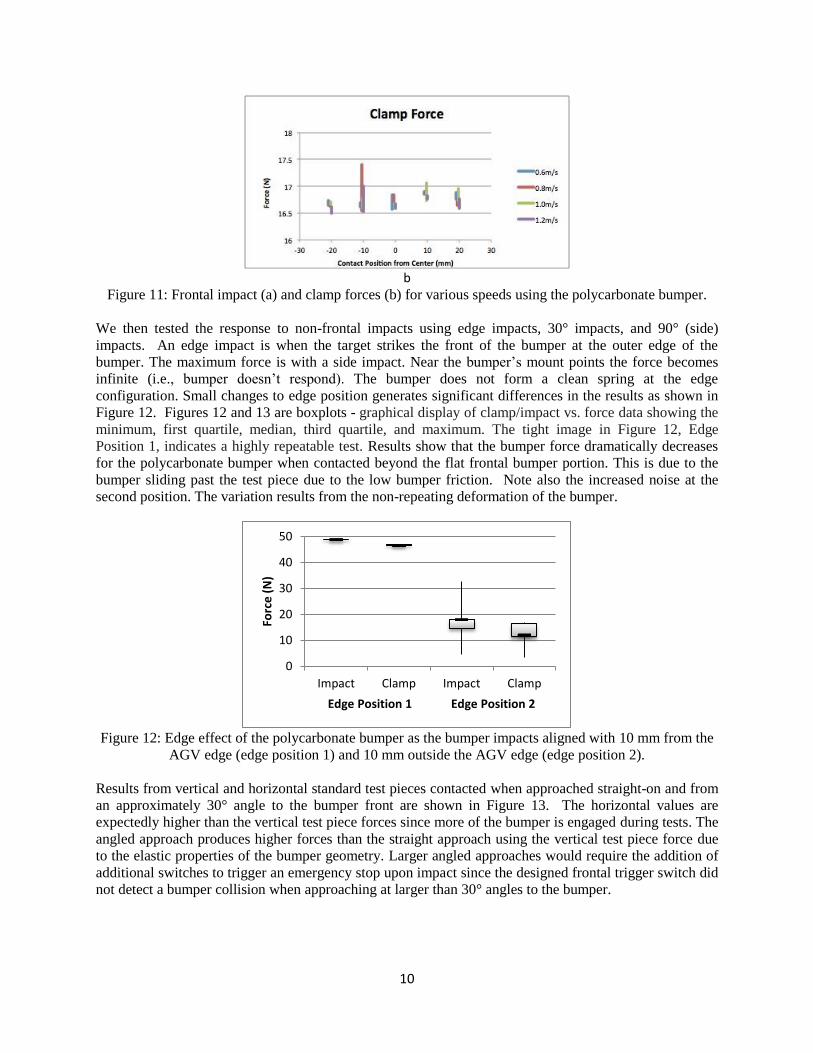
Figure 11: Frontal impact (a) and clamp forces (b) for various speeds using the polycarbonate bumper.
We then tested the response to non-frontal impacts using edge impacts, 30° impacts, and 90° (side)
impacts. An edge impact is when the target strikes the front of the bumper at the outer edge of the
bumper. The maximum force is with a side impact. Near the bumper’s mount points the force becomes
infinite (i.e., bumper doesn’t respond). The bumper does not form a clean spring at the edge
configuration. Small changes to edge position generates significant differences in the results as shown in
Figure 12. Figures 12 and 13 are boxplots - graphical display of clamp/impact vs. force data showing the
minimum, first quartile, median, third quartile, and maximum. The tight image in Figure 12, Edge
Position 1, indicates a highly repeatable test. Results show that the bumper force dramatically decreases
for the polycarbonate bumper when contacted beyond the flat frontal bumper portion. This is due to the
bumper sliding past the test piece due to the low bumper friction. Note also the increased noise at the
second position. The variation results from the non-repeating deformation of the bumper.
Figure 12: Edge effect of the polycarbonate bumper as the bumper impacts aligned with 10 mm from the
AGV edge (edge position 1) and 10 mm outside the AGV edge (edge position 2).
Results from vertical and horizontal standard test pieces contacted when approached straight-on and from
an approximately 30° angle to the bumper front are shown in Figure 13. The horizontal values are
expectedly higher than the vertical test piece forces since more of the bumper is engaged during tests. The
angled approach produces higher forces than the straight approach using the vertical test piece force due
to the elastic properties of the bumper geometry. Larger angled approaches would require the addition of
additional switches to trigger an emergency stop upon impact since the designed frontal trigger switch did
not detect a bumper collision when approaching at larger than 30° angles to the bumper.
0
10
20
30
40
50
Impact Clamp Impact Clamp
Forc
e (
N)
Edge Position 1 Edge Position 2
11
a b c
d
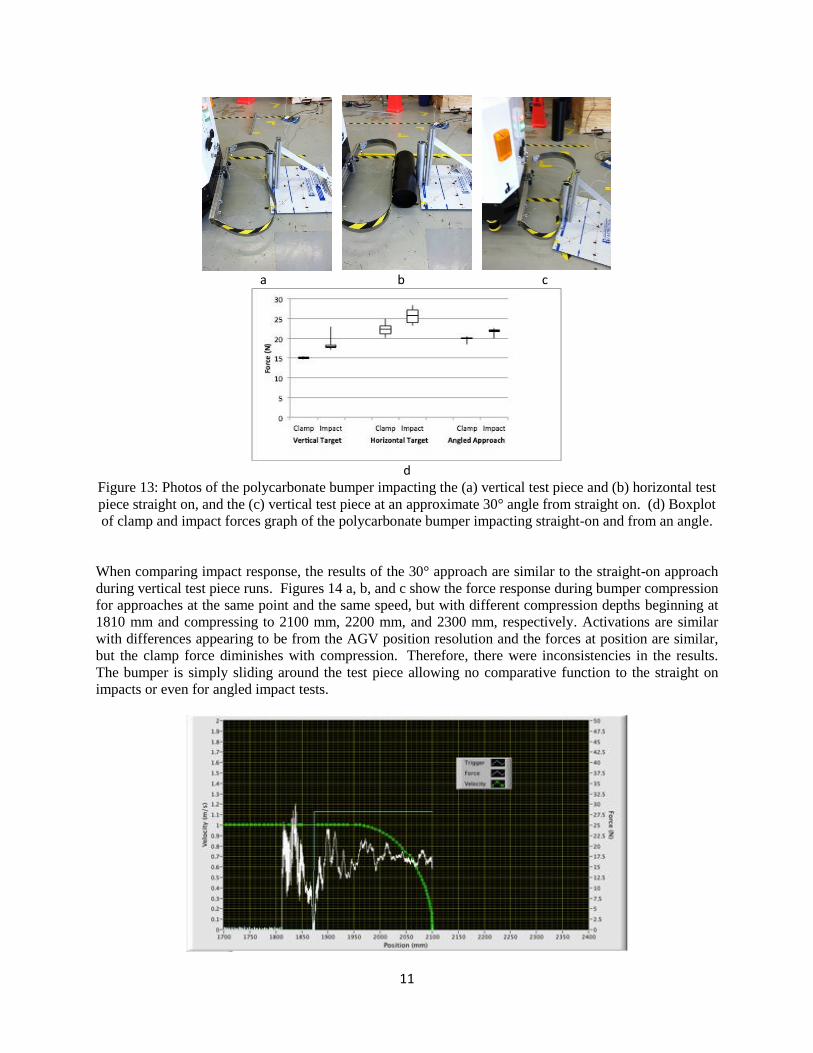
Figure 13: Photos of the polycarbonate bumper impacting the (a) vertical test piece and (b) horizontal test
piece straight on, and the (c) vertical test piece at an approximate 30° angle from straight on. (d) Boxplot
of clamp and impact forces graph of the polycarbonate bumper impacting straight-on and from an angle.
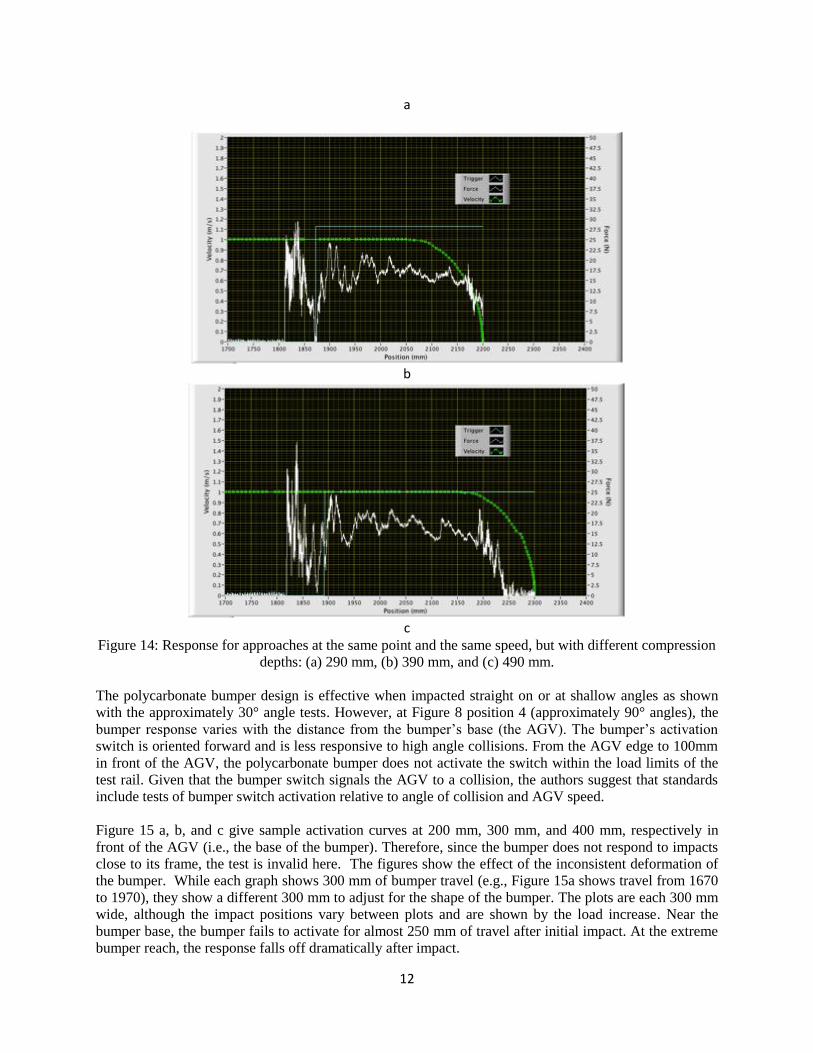
When comparing impact response, the results of the 30° approach are similar to the straight-on approach
during vertical test piece runs. Figures 14 a, b, and c show the force response during bumper compression
for approaches at the same point and the same speed, but with different compression depths beginning at
1810 mm and compressing to 2100 mm, 2200 mm, and 2300 mm, respectively. Activations are similar
with differences appearing to be from the AGV position resolution and the forces at position are similar,
but the clamp force diminishes with compression. Therefore, there were inconsistencies in the results.
The bumper is simply sliding around the test piece allowing no comparative function to the straight on
impacts or even for angled impact tests.
12
a
b
c
Figure 14: Response for approaches at the same point and the same speed, but with different compression
depths: (a) 290 mm, (b) 390 mm, and (c) 490 mm.
The polycarbonate bumper design is effective when impacted straight on or at shallow angles as shown
with the approximately 30° angle tests. However, at Figure 8 position 4 (approximately 90° angles), the
bumper response varies with the distance from the bumper’s base (the AGV). The bumper’s activation
switch is oriented forward and is less responsive to high angle collisions. From the AGV edge to 100mm
in front of the AGV, the polycarbonate bumper does not activate the switch within the load limits of the
test rail. Given that the bumper switch signals the AGV to a collision, the authors suggest that standards
include tests of bumper switch activation relative to angle of collision and AGV speed.
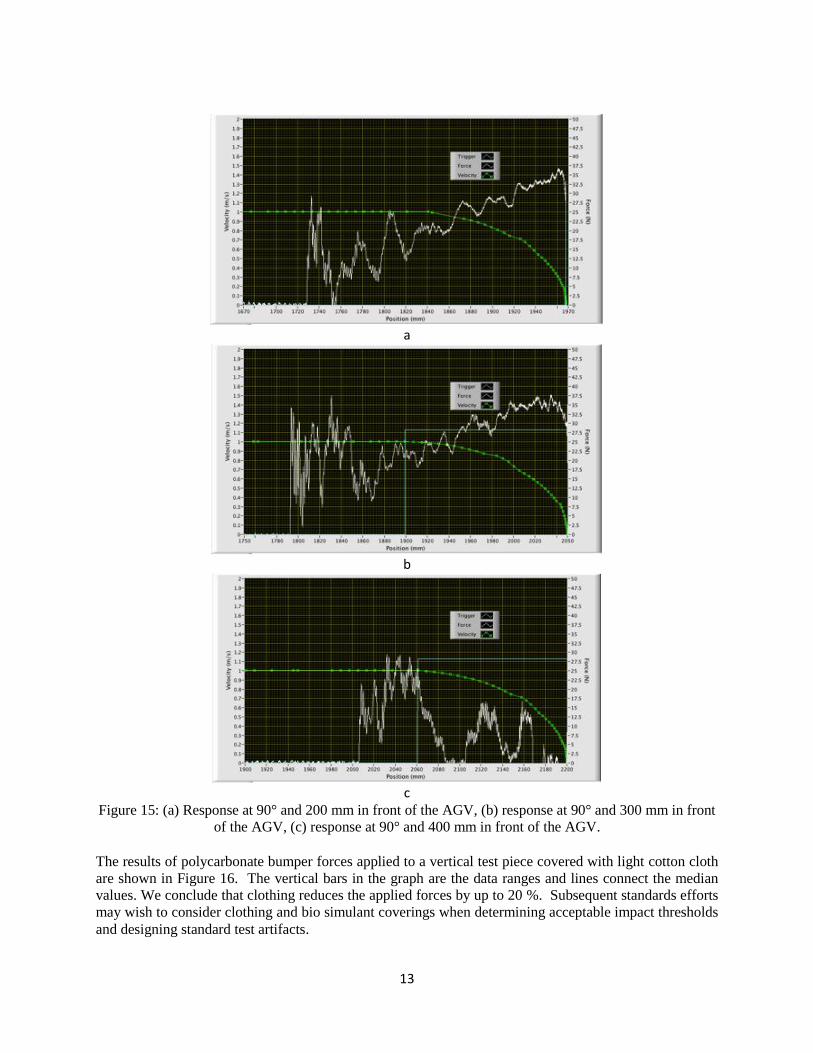
Figure 15 a, b, and c give sample activation curves at 200 mm, 300 mm, and 400 mm, respectively in
front of the AGV (i.e., the base of the bumper). Therefore, since the bumper does not respond to impacts
close to its frame, the test is invalid here. The figures show the effect of the inconsistent deformation of
the bumper. While each graph shows 300 mm of bumper travel (e.g., Figure 15a shows travel from 1670
to 1970), they show a different 300 mm to adjust for the shape of the bumper. The plots are each 300 mm
wide, although the impact positions vary between plots and are shown by the load increase. Near the
bumper base, the bumper fails to activate for almost 250 mm of travel after initial impact. At the extreme
bumper reach, the response falls off dramatically after impact.
13
a
b
c
Figure 15: (a) Response at 90° and 200 mm in front of the AGV, (b) response at 90° and 300 mm in front
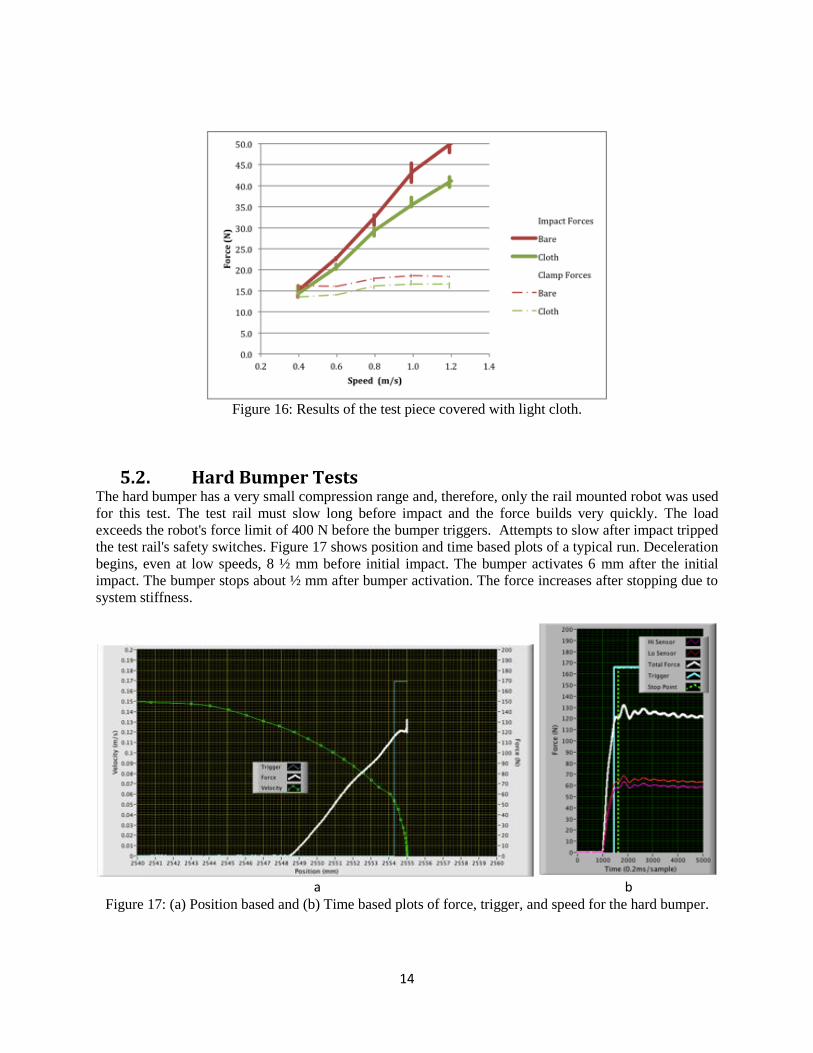
of the AGV, (c) response at 90° and 400 mm in front of the AGV. The results of polycarbonate bumper forces applied to a vertical test piece covered with light cotton cloth
are shown in Figure 16. The vertical bars in the graph are the data ranges and lines connect the median
values. We conclude that clothing reduces the applied forces by up to 20 %. Subsequent standards efforts
may wish to consider clothing and bio simulant coverings when determining acceptable impact thresholds
and designing standard test artifacts.
14
Figure 16: Results of the test piece covered with light cloth.
5.2. Hard Bumper Tests The hard bumper has a very small compression range and, therefore, only the rail mounted robot was used
for this test. The test rail must slow long before impact and the force builds very quickly. The load
exceeds the robot's force limit of 400 N before the bumper triggers. Attempts to slow after impact tripped
the test rail's safety switches. Figure 17 shows position and time based plots of a typical run. Deceleration
begins, even at low speeds, 8 ½ mm before initial impact. The bumper activates 6 mm after the initial
impact. The bumper stops about ½ mm after bumper activation. The force increases after stopping due to
system stiffness.
a b
Figure 17: (a) Position based and (b) Time based plots of force, trigger, and speed for the hard bumper.
15
With the largest force generated by the mechanical stiffness of the rail, we can draw few meaningful
conclusions. However, the force response after impact, with an apparent “impact bump” around 2552
mm and a clamp force after activation, indicates the basic test method is fundamentally applicable.
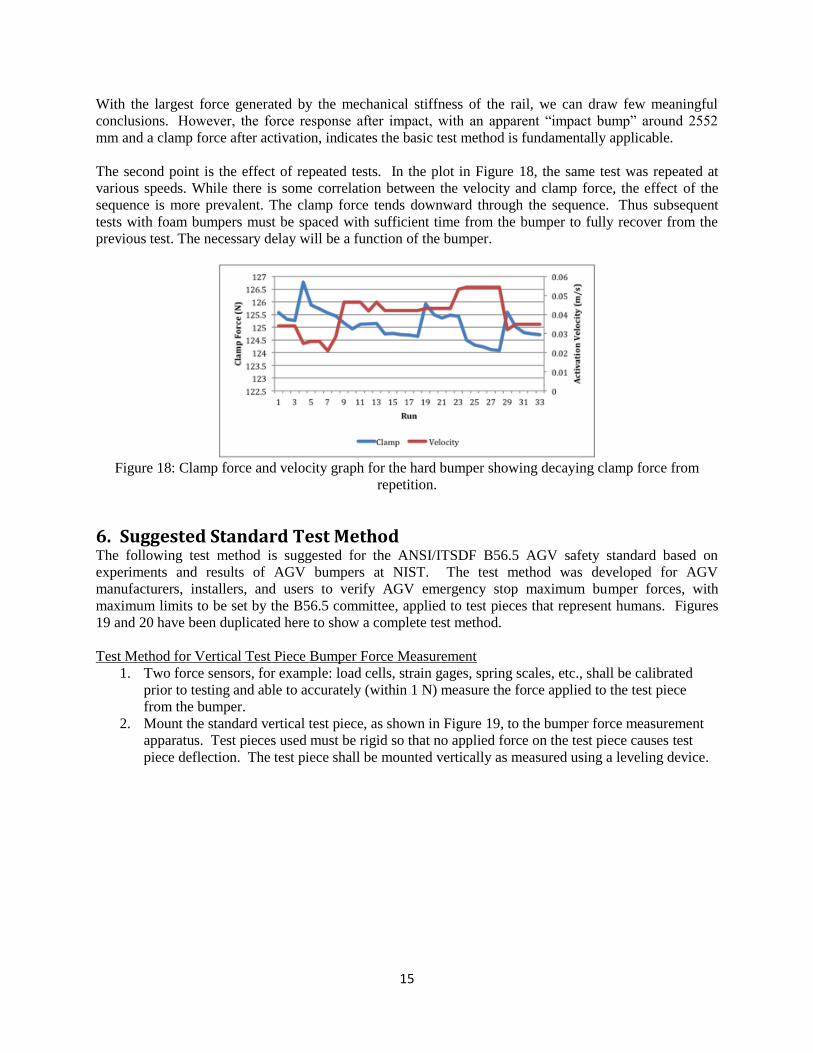
The second point is the effect of repeated tests. In the plot in Figure 18, the same test was repeated at
various speeds. While there is some correlation between the velocity and clamp force, the effect of the
sequence is more prevalent. The clamp force tends downward through the sequence. Thus subsequent
tests with foam bumpers must be spaced with sufficient time from the bumper to fully recover from the
previous test. The necessary delay will be a function of the bumper.
Figure 18: Clamp force and velocity graph for the hard bumper showing decaying clamp force from
repetition.
6. Suggested Standard Test Method The following test method is suggested for the ANSI/ITSDF B56.5 AGV safety standard based on
experiments and results of AGV bumpers at NIST. The test method was developed for AGV
manufacturers, installers, and users to verify AGV emergency stop maximum bumper forces, with
maximum limits to be set by the B56.5 committee, applied to test pieces that represent humans. Figures
19 and 20 have been duplicated here to show a complete test method.
Test Method for Vertical Test Piece Bumper Force Measurement
1. Two force sensors, for example: load cells, strain gages, spring scales, etc., shall be calibrated
prior to testing and able to accurately (within 1 N) measure the force applied to the test piece
from the bumper.
2. Mount the standard vertical test piece, as shown in Figure 19, to the bumper force measurement
apparatus. Test pieces used must be rigid so that no applied force on the test piece causes test
piece deflection. The test piece shall be mounted vertically as measured using a leveling device.
16
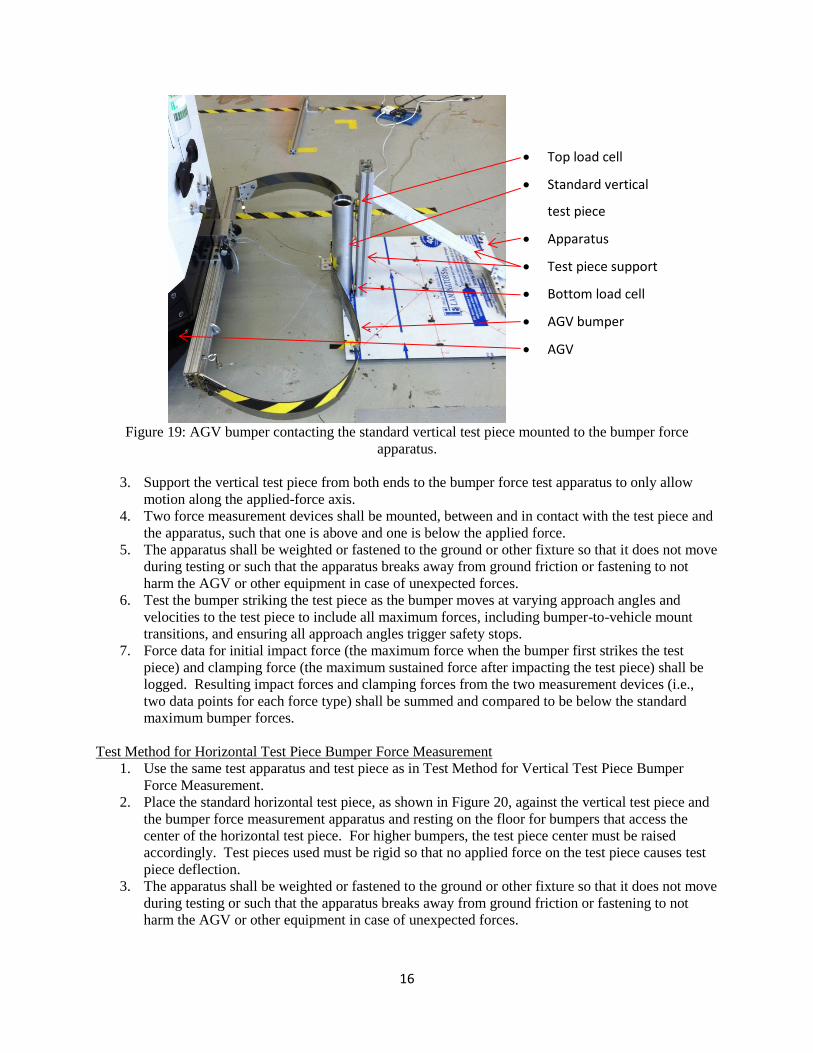
Figure 19: AGV bumper contacting the standard vertical test piece mounted to the bumper force
apparatus.
3. Support the vertical test piece from both ends to the bumper force test apparatus to only allow
motion along the applied-force axis.
4. Two force measurement devices shall be mounted, between and in contact with the test piece and
the apparatus, such that one is above and one is below the applied force.
5. The apparatus shall be weighted or fastened to the ground or other fixture so that it does not move
during testing or such that the apparatus breaks away from ground friction or fastening to not
harm the AGV or other equipment in case of unexpected forces.
6. Test the bumper striking the test piece as the bumper moves at varying approach angles and
velocities to the test piece to include all maximum forces, including bumper-to-vehicle mount
transitions, and ensuring all approach angles trigger safety stops.
7. Force data for initial impact force (the maximum force when the bumper first strikes the test
piece) and clamping force (the maximum sustained force after impacting the test piece) shall be
logged. Resulting impact forces and clamping forces from the two measurement devices (i.e.,
two data points for each force type) shall be summed and compared to be below the standard
maximum bumper forces.
Test Method for Horizontal Test Piece Bumper Force Measurement
1. Use the same test apparatus and test piece as in Test Method for Vertical Test Piece Bumper
Force Measurement.
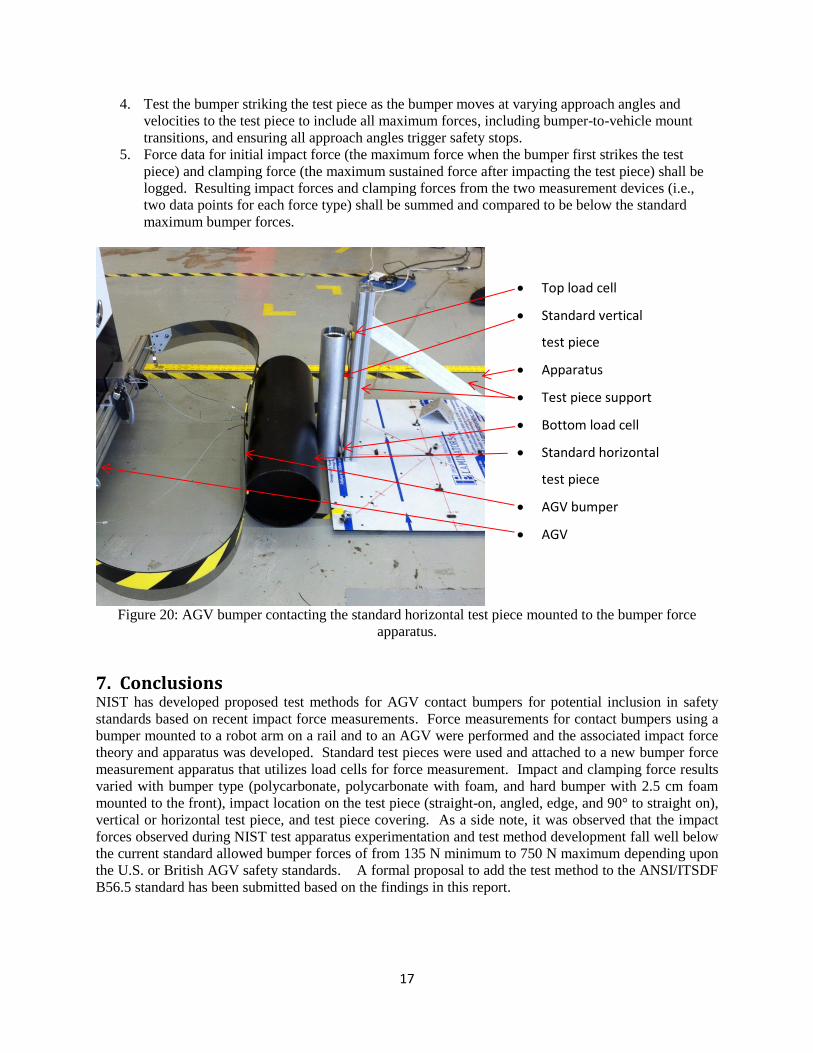
2. Place the standard horizontal test piece, as shown in Figure 20, against the vertical test piece and
the bumper force measurement apparatus and resting on the floor for bumpers that access the
center of the horizontal test piece. For higher bumpers, the test piece center must be raised
accordingly. Test pieces used must be rigid so that no applied force on the test piece causes test
piece deflection.
3. The apparatus shall be weighted or fastened to the ground or other fixture so that it does not move
during testing or such that the apparatus breaks away from ground friction or fastening to not
harm the AGV or other equipment in case of unexpected forces.
Top load cell
Standard vertical
test piece
Apparatus
Test piece support
Bottom load cell
AGV bumper
AGV
17
4. Test the bumper striking the test piece as the bumper moves at varying approach angles and
velocities to the test piece to include all maximum forces, including bumper-to-vehicle mount
transitions, and ensuring all approach angles trigger safety stops.
5. Force data for initial impact force (the maximum force when the bumper first strikes the test
piece) and clamping force (the maximum sustained force after impacting the test piece) shall be
logged. Resulting impact forces and clamping forces from the two measurement devices (i.e.,
two data points for each force type) shall be summed and compared to be below the standard
maximum bumper forces.
Figure 20: AGV bumper contacting the standard horizontal test piece mounted to the bumper force
apparatus.
7. Conclusions NIST has developed proposed test methods for AGV contact bumpers for potential inclusion in safety
standards based on recent impact force measurements. Force measurements for contact bumpers using a
bumper mounted to a robot arm on a rail and to an AGV were performed and the associated impact force
theory and apparatus was developed. Standard test pieces were used and attached to a new bumper force
measurement apparatus that utilizes load cells for force measurement. Impact and clamping force results
varied with bumper type (polycarbonate, polycarbonate with foam, and hard bumper with 2.5 cm foam
mounted to the front), impact location on the test piece (straight-on, angled, edge, and 90° to straight on),
vertical or horizontal test piece, and test piece covering. As a side note, it was observed that the impact
forces observed during NIST test apparatus experimentation and test method development fall well below
the current standard allowed bumper forces of from 135 N minimum to 750 N maximum depending upon
the U.S. or British AGV safety standards. A formal proposal to add the test method to the ANSI/ITSDF
B56.5 standard has been submitted based on the findings in this report.
Top load cell
Standard vertical
test piece
Apparatus
Test piece support
Bottom load cell
Standard horizontal
test piece
AGV bumper
AGV
18
8. References
[1] Savant Automation, The History of AGVS, http://www.agvsystems.com/history-agvs, 2012.
[2] NIST Mobile Autonomous Vehicle Obstacle Detection/Avoidance (MAVODA) Project,
http://www.nist.gov/el/isd/ps/mobautovehobstdetavoid.cfm, 2013.
[3] ANSI/ITSDF B56.5 -2012 “Safety Standard for Driverless, Automatic Guided Industrial Vehicles
and Automated Functions of Manned Industrial Vehicles.”
[4] British Standard EN 1525:1997 Driverless industrial trucks and their systems.
[5] BG/BGIA (Berufsgenossenschaftliche Institut für Arbeitssicherheit - BG Institute for Occupational
Safety and Health, abbreviated to BGIA in German, now IFA) Risk Assessment Recommendations
According to Machinery Directive: Design of Workplaces with Collaborative Robots, U 001/2009e
October 2009 ed, revised Feb. 2011.
[6] ISO TC 184/SC2/WG3, ISO 10218-1:2011 – Robots and robotic devices — Safety requirements —
Part 1: Industrial robots, 2011.
[7] ISO TC 184/SC2/WG3, ISO 10218-2:2011 – Robots and robotic devices — Safety requirements —
Part 2: Industrial robot system and integration, 2011.
[8] ISO TC 184/SC2/WG3, ISO/PDTS 15066 Robots and Robotic Devices – Industrial Safety Requirements Collaborative Industrial Robots, Draft Document, 2012.
[9] Association for the Advancement of Automotive Medicine (AAAM), Abbreviated Injury Scale.
[10] World Health Organization (WHO),International Classification of Diseases (ICD). [11] Health and Safety Executive. Collision and Injury Criteria When Working with Collaborative
Robots. HSE Research Report RR906. (2012)
[12] Research project No. FP-0317: Collaborative robots – Investigation of pain sensibility at the Man-
Machine-Interface. Institute for Occupational, Social and Environmental Medicine at the Johannes
Gutenberg University of Mainz, Germany. Interim report June 2013.
[13] Joe Falco, Jeremy Marvel, and Richard Norcross. “Collaborative Robotics: Measuring Blunt Force
Impacts on Humans.” Proceedings of the 7th International Conference on the Safety of Industrial
Automated Systems. 186-191, 2012.
[14] Huelke, M.; Ottersbach, H.J.: How to approve Collaborating Robots -The IFA force pressure
measurement system - SIAS 2012, 11-12 October 2012