Embed Size (px)
Citation preview

1
Automated Facial Age Estimation
Mei Ngan + Patrick Grother Information Technology Laboratory
National Institute of Standards and Technology (US), United States Department of Commerce
NTIA
Thursday, November 6, 2014

2
What is automated facial age estimation
How old are these people?
True Age: ?? True Age: 32 True Age: 32 Estimated Age: 46 Estimated Age: 26 Estimated Age: 16

3 Age Estimation Accuracy & Error
over Large Homogeneous Population of 6M
For the most accurate algorithm, 67% of estimates are accurate within 5 years with a Mean Absolute Error (MAE) of 4.3 years.
Mean Absolute Error (years)

4
Age Estimation Accuracy & Error by Age Group
Mean Absolute Error (years)

5
Age Estimation Accuracy & Error by Gender Mean Absolute Error (years)
Results: All algorithms estimate age more accurately on males than females.

6
Face Recognition Accuracy By Age Group
7
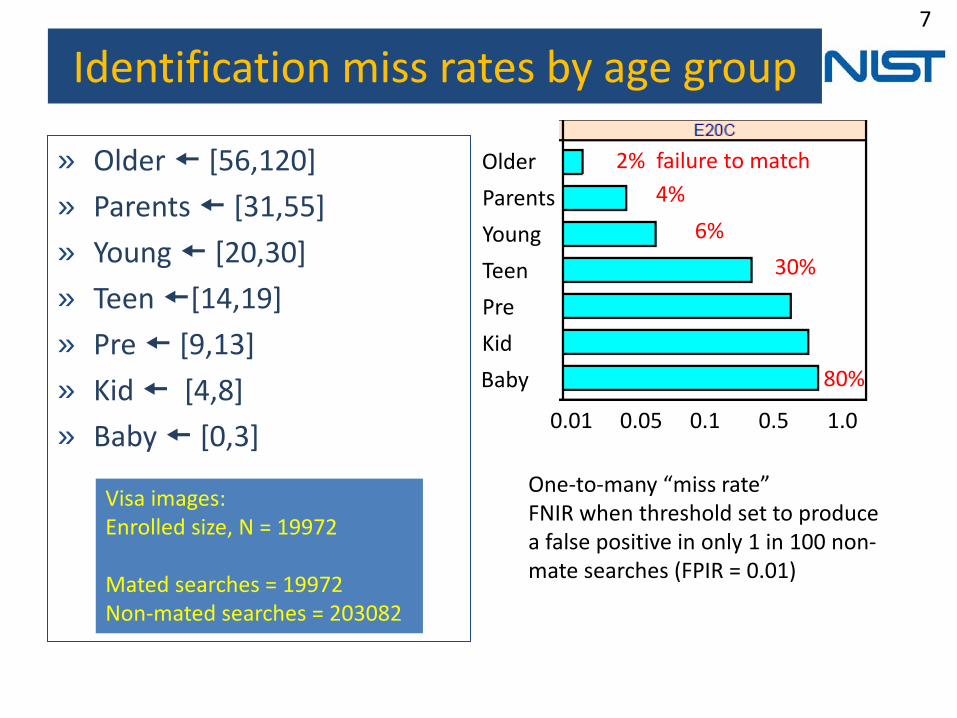
Identification miss rates by age group
» Older [56,120] » Parents [31,55] » Young [20,30] » Teen [14,19] » Pre [9,13] » Kid [4,8] » Baby [0,3]
Visa images: Enrolled size, N = 19972 Mated searches = 19972 Non-mated searches = 203082
0.01 0.05 0.1 0.5 1.0
Baby Kid Pre Teen Young Parents Older
One-to-many “miss rate” FNIR when threshold set to produce a false positive in only 1 in 100 non-mate searches (FPIR = 0.01)
2% failure to match
6% 30%
4%
80%
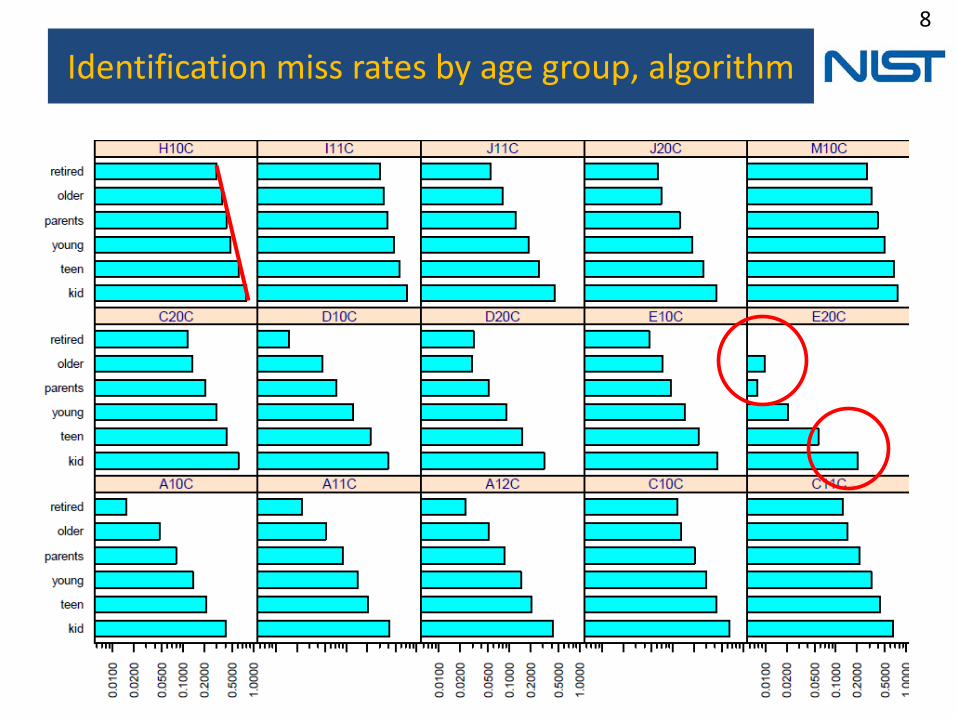
8
Identification miss rates by age group, algorithm

9
Accuracy = F(Age, Ageing)
» Baby [0,3] Mean time lapse = 1.6 » Kid [4,8] Mean time lapse = 3.0 » Pre [9,13] Mean time lapse = 3.9 » Teen [14,19] Mean time lapse = 2.7 » Young [20,30] Mean time lapse = 2.0 » Parents [31,55] Mean time lapse = 2.1 » Older [56,120] Mean time lapse = 2.2

10
Accuracy by age group :: Summary
» Using visa photographs, younger people, especially but not limited to children, are more difficult to recognize.
» Lifelong trend to be more easily recognized. This is a big effect, larger than other drivers in face recognition.
» Two effects: • Repeatability: Older people more easily recognized as themselves. • Distinguishability: Older people more easy to distinguish from others.
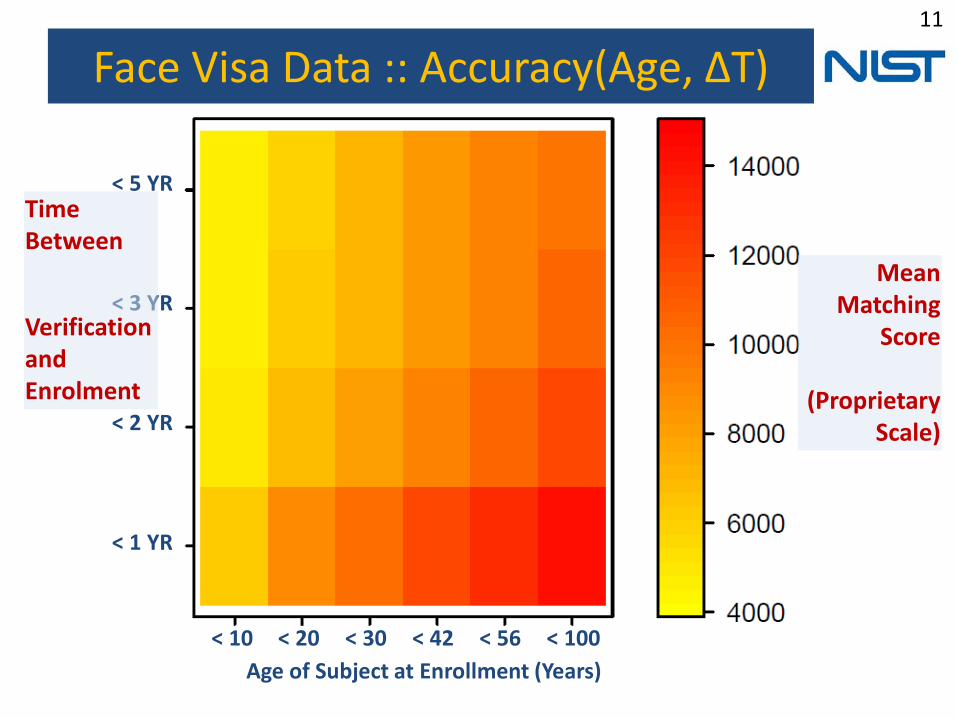
11
Face Visa Data :: Accuracy(Age, ΔT)
< 20 < 30 < 42 < 56 < 100 Age of Subject at Enrollment (Years)
Mean Matching
Score
(Proprietary Scale)
< 10
< 1 YR
< 2 YR
< 3 YR
< 5 YR Time Between
Verification and Enrolment

12
Face Visa Data :: Accuracy(Age, ΔT)
< 20 < 30 < 42 < 56 < 100 Age of Subject at Enrollment (Years)
Mean Matching
Score
(Proprietary Scale)
< 10
< 1 YR
< 2 YR
< 3 YR
< 5 YR Time Between
Verification and Enrolment
THRESHOLD
CONCEPTUAL ISSUANCE RE-ISSUANCE PLOT (DUMMY VALUES)

13
Face Ageing Quantification + Relevance
Patrick Grother + Mei Ngan Information Access Division
National Institute of Standards and Technology
NTIA Meeting, Washington, DC Thursday, November 6, 2014

14
Ageing: Permanent Appearance Change
0.647 0.599 0.601 0.579 ALGORITHM X
ALGORITHM Z 0.595 0.565 0.578 0.548
Green indicates successful 1:1 authentication at FMR = 0.001. Red indicates failure.
Dwight D Eisenhower
FACE AGEING → DECREASED SIMILARITY. IS THERE AN ANALOGOUS EFFECT FOR OTHER MODALITIES?

15
The Brown Sisters Photographed every year from 1975-2014
1975
2014
Photographs on exhibit at Museum of Modern Art, NYC See Susan Minot’s text in NY Times Magazine Sunday Oct 3 2014

16 Ageing Brown Sister #1
0.632 0.608 0.584 0.602 0.576 X
Y 3004 2755 2781
Z 0.622 0.426
2954 2845
0.616 0.613 0.517
T ~ 5 T ~ 10 T ~ 20 T ~ 30 T ~ 40 Years
THREE LEADING COMMERCIAL FR ALGORITHMS

17 Ageing Brown Sister #2
0.648 0.601 0.600 0.610 0.605
2863 2758 2824
0.617 0.593 0.531
2821 2752
0.506 0.533
X
Y
Z
T ~ 5 T ~ 10 T ~ 20 T ~ 30 T ~ 40 Years
FR ALGORITHM
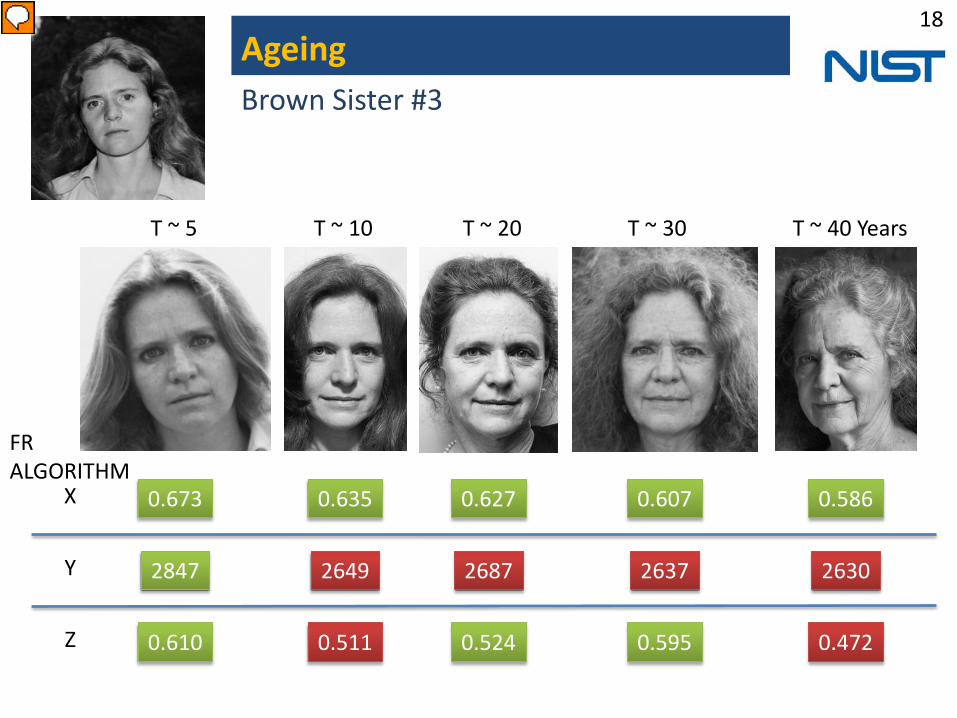
18 Ageing Brown Sister #3
0.673 0.635 0.627 0.607 0.586
2847 2687 2630
0.610
2649 2637
0.511 0.524 0.595 0.472
X
Y
Z
T ~ 5 T ~ 10 T ~ 20 T ~ 30 T ~ 40 Years
FR ALGORITHM

19 Ageing Brown Sister #4
0.652 0.654 0.603 0.591 0.578
3055 2743 2607
0.632
2795
0.475 0.516 0.524 0.432
2847
X
Y
Z
T ~ 5 T ~ 10 T ~ 20 T ~ 30 T ~ 40 Years
FR ALGORITHM

20 Verification over 40 years
Enrollment image Enrollment image
Enrollment image Enrollment image
40 years later 40 years later
40 years later 40 years later
21
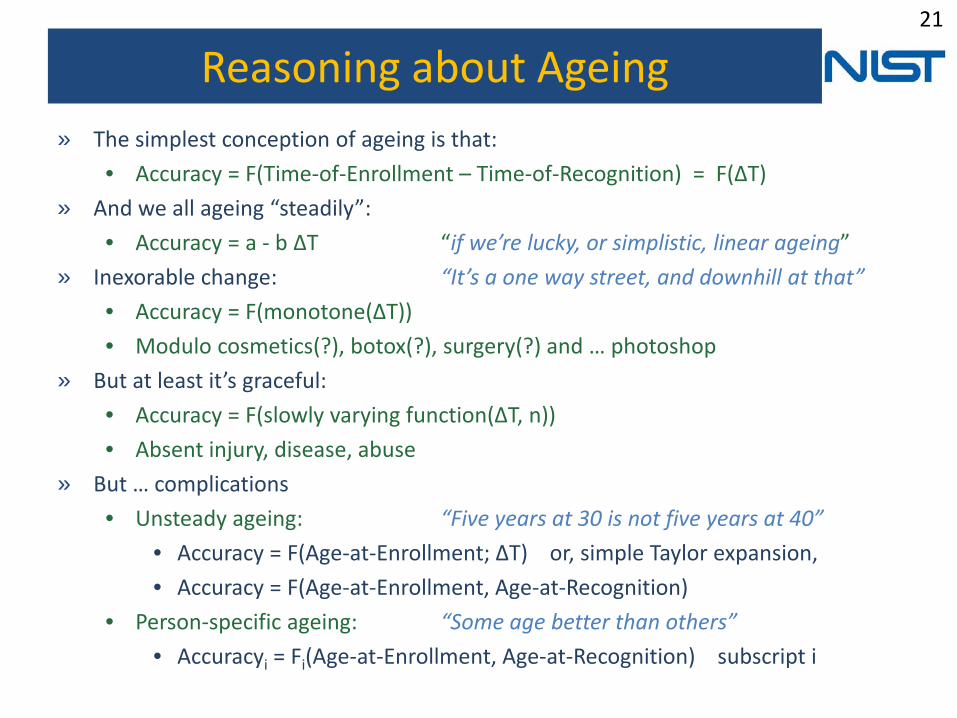
Reasoning about Ageing » The simplest conception of ageing is that:
• Accuracy = F(Time-of-Enrollment – Time-of-Recognition) = F(ΔT) » And we all ageing “steadily”:
• Accuracy = a - b ΔT “if we’re lucky, or simplistic, linear ageing” » Inexorable change: “It’s a one way street, and downhill at that”
• Accuracy = F(monotone(ΔT)) • Modulo cosmetics(?), botox(?), surgery(?) and … photoshop
» But at least it’s graceful: • Accuracy = F(slowly varying function(ΔT, n)) • Absent injury, disease, abuse
» But … complications • Unsteady ageing: “Five years at 30 is not five years at 40”
• Accuracy = F(Age-at-Enrollment; ΔT) or, simple Taylor expansion, • Accuracy = F(Age-at-Enrollment, Age-at-Recognition)
• Person-specific ageing: “Some age better than others” • Accuracyi = Fi(Age-at-Enrollment, Age-at-Recognition) subscript i

22
Longitudinal Analysis
Quantifying Permanence Using Data from a Large-Population Operational System

23 Ageing :: Longitudinal data Brad Wing
0.617 0.578 0.532 0.541
0.589 0.587 0.579 0.569
ALGORITHM E20A
ALGORITHM J20A
Green indicates successful 1:1 authentication at FMR = 0.001. Red indicates failure.
LONGITUDINAL ANALYSIS APPLIED TO ALGORITHM SCORE DATA

24 Quantify ageing :: Individual recognition scores over time
High values
Low values
Score
» Often, visually flat » Considerable
variance within subject
» Considerable variance between subjects
» Irregular sampling » Imbalanced
sampling » Mixed effects
models • Shared population
part • Individual part
TRAJECTORIES INDICATE HETEROGENEITY – INTERCEPTS (AND GRADIENTS) VARY WITH QUALITY OF THE ENROLLMENT IMAGE cf. DODDINGTON’s ZOO
Absolute Time

25
Quantifying permanence via mixed-effects regression
Time since enrollment
Model for the j-th score from the i-th eye
Intercept is sum of population average term, the fixed effect, and an eye-specific random effect
Ham
min
g Di
stan
ce
Slope is sum of population average term, the fixed effect, and an eye-specific random effect
Subject to assumptions: Permanence stated by the population wide rate at which scores are decreasing.
MIXED EFFECTS MODEL RESPECT IDENTITY INFORMATION. SIMPLE LINEAR REGRESSION, IN YELLOW, DOES NOT AND HAS OTHER PROBLEMS

26
Conclusions
» Brown sisters: existence proof that 1:1 face authentication is possible over thirty years • But scores become weaker. • Successful 1:N identification demands stronger scores
» No good long term face ageing studies. e-Passports and digital photography will change that… eventually. • And suitable longitudinal analysis methods are published (NIST, MSU)
» But, there’s a “so what” for some use cases: • Algorithms improve on a timescale shorter than ageing • Identity credentials are re-issued on a timescale shorter than ageing
• But possibility to recycle old photos • Law enforcement + counter terrorism functions have no such luxury

27

28
FR in Video :: Scope
» Comparative accuracy of algorithms » Absolute accuracy » Comparative computational cost » Iterative development with tech. providers » Threshold calibration » How to analyze + metrics → ISO/IEC 30137-2 » Failure analysis → ISO/IEC 30137-1
Out-of-scope
» Re-identification » Anomaly detection » Detection of un-coop, evasion » Other modalities + non-human
Goals

29
S2S – V2S – S2V – V2V :: Watchlist Surveillance
Challenges for FR » Pose
• Compound rotation of head to optical axis
» Resolution • Range to subject • Legacy camera • Adverse
compression for storage or transmission
• Motion blur

30
Off angle recognition: The problem for video
+30o
-30o
ISO standard tolerance for pristine imagery
-30o +30o 30° -30°

31
S2S – V2S – S2V – V2V Search = Mugshot Enrolled = Video corpus, e.g. Youtube
Example applications: 1. Media search 2. Asylum re-
identification
32
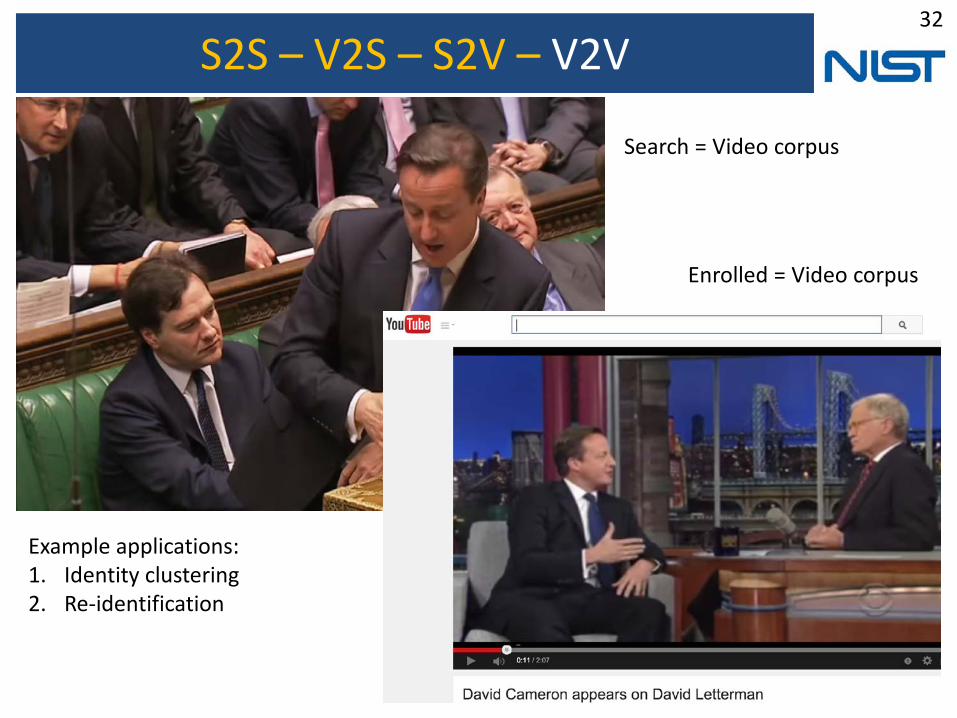
S2S – V2S – S2V – V2V
Example applications: 1. Identity clustering 2. Re-identification
Search = Video corpus
Enrolled = Video corpus

34
Time variation in three modalities
Iris » Healthy
• Blink occlusion • Gaze direction • Dilation varies
with mood, consumption, ambient light
» Cosmetic • Contact lenses • Glasses
» Ageing • Pupil constriction • Palpebral
aperture » Disease
Face
» Healthy • Facial expression • Mouth movement • Head motion, head
orientation • Facial hair
» Cosmetic • Makeup
» Ageing • Soft tissue folds • Stoop – pitch
forward
Fingerprint
» Healthy • Facial expression • Mouth movement • Head motion, head
orientation • Facial hair
» Cosmetic • Moisturizers
» Ageing • Arthritic fingers


![Automated measurement of children’s facial expressions ... · a fully automated system that analyzes facial expressions from video in real-time ([3] [4] [5] [15] [26]). The system](https://img.pdfslide.us/doc/110x75/5f357e0ee9b670719859e6a3/automated-measurement-of-childrenas-facial-expressions-a-fully-automated-system.jpg)