Embed Size (px)
Citation preview
Application Note
Environmental Analysis
AuthorsOliver Lerch, Jasmin Zboron, GERSTEL GmbH & Co. KG
Ken Brady, Juan-Luis Aybar,Agilent Technologies
AbstractHighly sensitive determination of around 100 contaminants at trace concentrations from low double-digit to low triple-digit pg/L was performed in surface water. Priority compounds from the EU water framework directive (EU-WFD) as well as substances from other legislations were included. A sequential stir bar sorptive extraction (SBSE) approach employing the GERSTEL Twister was used for analyte enrichment from 100 mL water samples. The Twister was thermally desorbed, compounds were separated via GC and detected by tandem mass spectrometry (MS/MS) utilizing the highly sensitive Agilent 7010 Mass Spectrometer with High Efficiency Source (HES).
The analysis method was comprehensively validated to meet the requirements of the EU-WFD for inland surface water. Repeat analysis of water samples spiked at concentrations close to the LOQs of the respective analytes demonstrated relative standard deviations between 1 and 15 % with an average of 6.9 %. (n=6) Trueness was mainly between 90 and 110 % with an average of X. The correct quantitation of particle-adsorbed compounds like PAHs was examined and confirmed using certified reference sediment.
Cypermethrin, heptachlor, heptachlorepoxide and also dicofol in other surface waters were the only compounds for which the required LOQs could not be reached. To date there is no technique known to the authors that reaches the required LOQs of 0.06 pg/L for heptachlor and heptachlorepoxide. The developed analysis method was successfully applied to real world water samples.
Automated determination of EU Water Framework Directive priority contaminants in surface water at pg/L detection limits using Stir Bar Sorptive Extraction (SBSE) GC/MS/MS
KeywordsPriority Pollutants, Environmental, GC/MS, Automation, Water Frame-work Directive, EQS
2
IntroductionRegulatory challenge
In 2000 the European Community issued a directive “to establish a framework for the protection of inland surface waters, transitional waters, coastal waters and groundwater”. This was amended and modified by further directives in 2008 and 2013 [1-3]. Goals are the reduction of surface and ground water pollution as well as to “protect and enhance the status of aquatic ecosystems” and “the protection of territorial and marine waters”. A continuous improvement of water quality shall be pursued to maintain “sufficient supply of good quality surface water and groundwater as needed for sustainable, balanced and equitable water use”.
To document the present state and to verify the achievements every EU member country is obliged amongst others to test for the “chemical status” of the surface water in each river basin district. The meaning of “chemical status” is substantiated with a list of so called “priority substances” which need to be monitored regularly. Maximum contaminant concentrations derived from toxicological considerations and aimed at implementation for every EU surface water in the long-run are defined as so called “environmental quality standards” (EQS). Annual average (AA-EQS) and maximum allowable concentrations (MAC-EQS) were established distinguishing between “inland surface waters” like rivers and lakes and “other surface waters” like coastal waters.
Analysis methods employed in the context of EU-WFD need to fulfill certain performance criteria [4]: “Member States shall ensure that the minimum performance criteria for all methods of analysis applied are based on an uncertainty of measurement of 50 % or below (k = 2) estimated at the level of relevant environmental quality standards and a limit of quantification equal or below a value of 30 % of the relevant environmental quality standards”. Where those criteria are not met for any matrix, Member States shall ensure that monitoring is carried out using best available techniques not entailing excessive costs”.
naphthalene 600 ng/L
chlorpyrifos-ethyl 9 ng/L
Required LOQs for inland surface water resulting from these specifications, calculated from AA-EQS are challenging for the majority of priority compounds: naphthalene 600 ng/L , chlorpyrifos-ethyl 9 ng/L, p,p´-DDT 3 ng/L, endosulfan 1.5 ng/L, dichlorvos 0.18 ng/L, benzo[a]pyrene 0.051 ng/L, cypermethrin 0.024 ng/L and heptachlor and heptachlorepoxide 0,00006 ng/L. “The water EQS […] are expressed as total concentrations in the whole water sample”, meaning that particle-adsorbed analytes must be quantified correctly as well.
Analytical methodologies for implementing regulatory requirements
Relevant analytes for the method described here were derived from the aforementioned EU-WFD, the Commission Implementing Decision (EU) 2015/495 (“watch list”) [5], the German Oberflächengewässerverordnung (OGewV, version July 2011) [6] and further sources. Only those compounds were included, which could be extracted by polydimethylsiloxane (PDMS) Twisters and separated via gas chromatography. Polar substances of the EU-WFD need to be analyzed by LC-MS/MS, e.g. isoproturon and diuron, volatile compounds like dichloromethane by headspace-GC/MS and metal ions like lead and mercury by inductively coupled plasma mass spectrometry (ICP-MS) or atomic absorption spectroscopy (AAS). The final list contained mainly persistent organic pollutants (POPs) like organochlorine pesticides, PAHs, PCBs and PBDEs as well as other pesticides and industrial pollutants.
Enrichment and detection of GC/MS amenable analytes
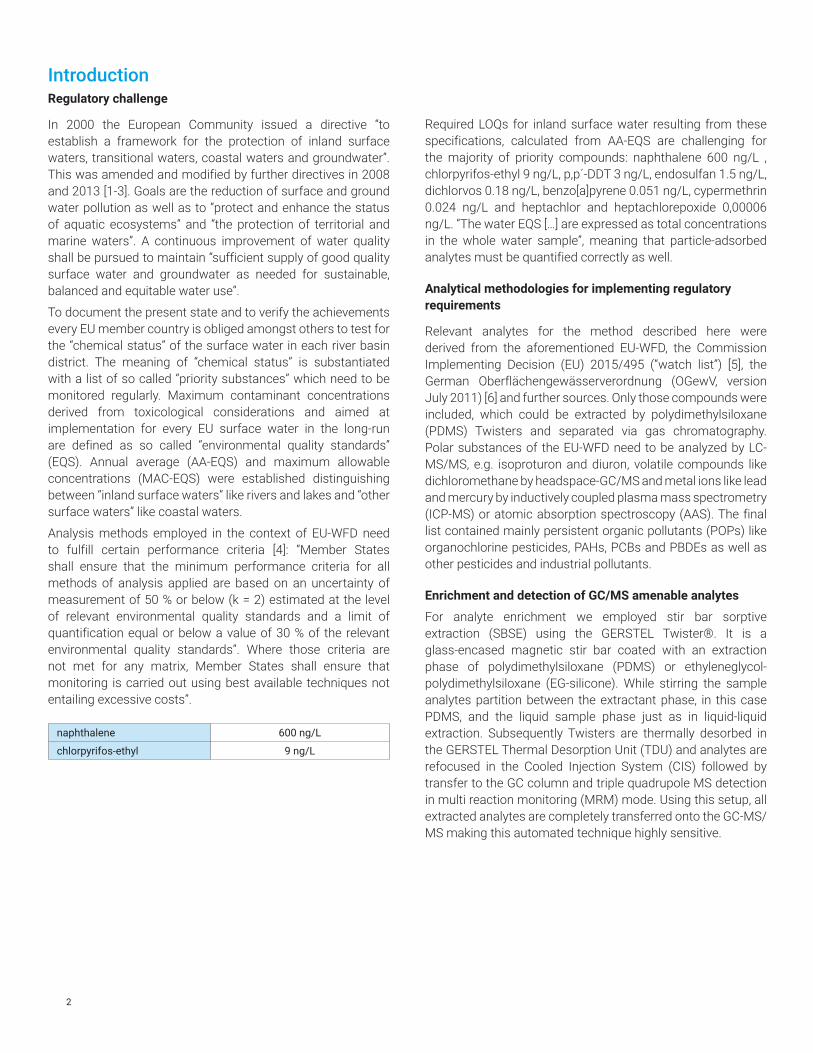
For analyte enrichment we employed stir bar sorptive extraction (SBSE) using the GERSTEL Twister®. It is a glass-encased magnetic stir bar coated with an extraction phase of polydimethylsiloxane (PDMS) or ethyleneglycol-polydimethylsiloxane (EG-silicone). While stirring the sample analytes partition between the extractant phase, in this case PDMS, and the liquid sample phase just as in liquid-liquid extraction. Subsequently Twisters are thermally desorbed in the GERSTEL Thermal Desorption Unit (TDU) and analytes are refocused in the Cooled Injection System (CIS) followed by transfer to the GC column and triple quadrupole MS detection in multi reaction monitoring (MRM) mode. Using this setup, all extracted analytes are completely transferred onto the GC-MS/MS making this automated technique highly sensitive.
3
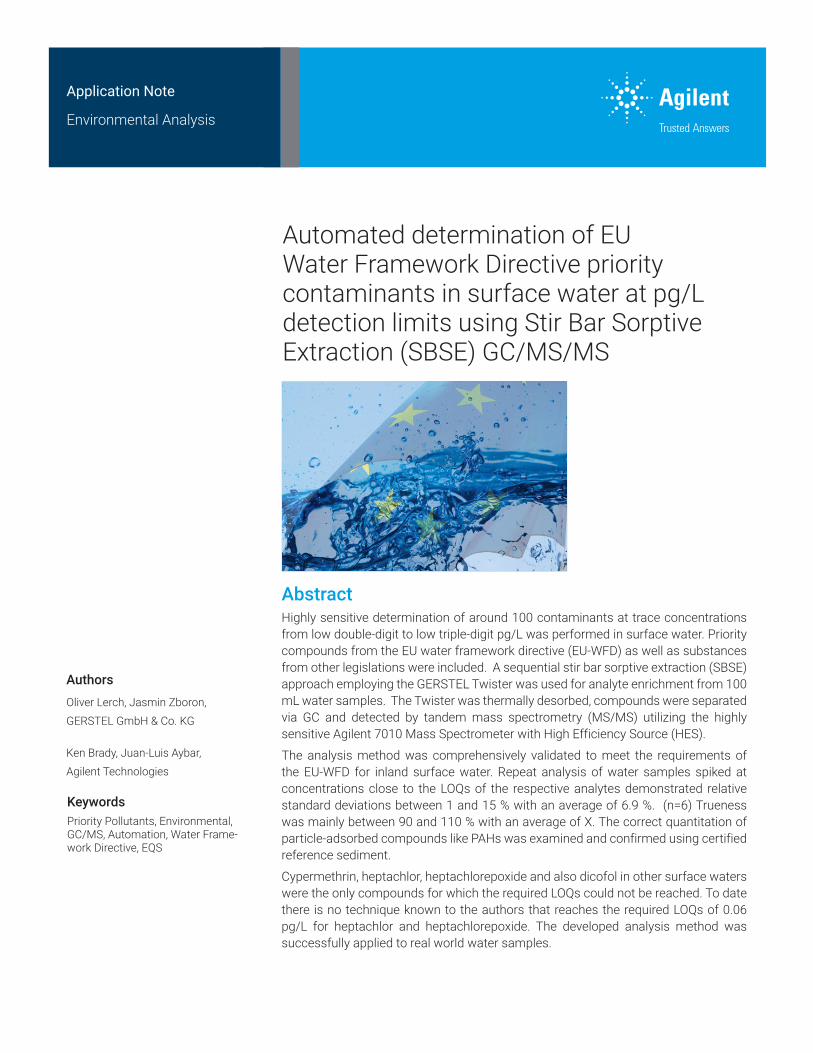
Figure 1. Twister PDMS stir bar, 1 cm length, 1 mm phase thickness.
Figure 2. Schematic drawing of the Thermal Desorption Unit (TDU and the Cooled Injection System (CIS) used for Twister desorption and analyte transfer to the GC.
Complete transfer of extracted analytes onto GC column
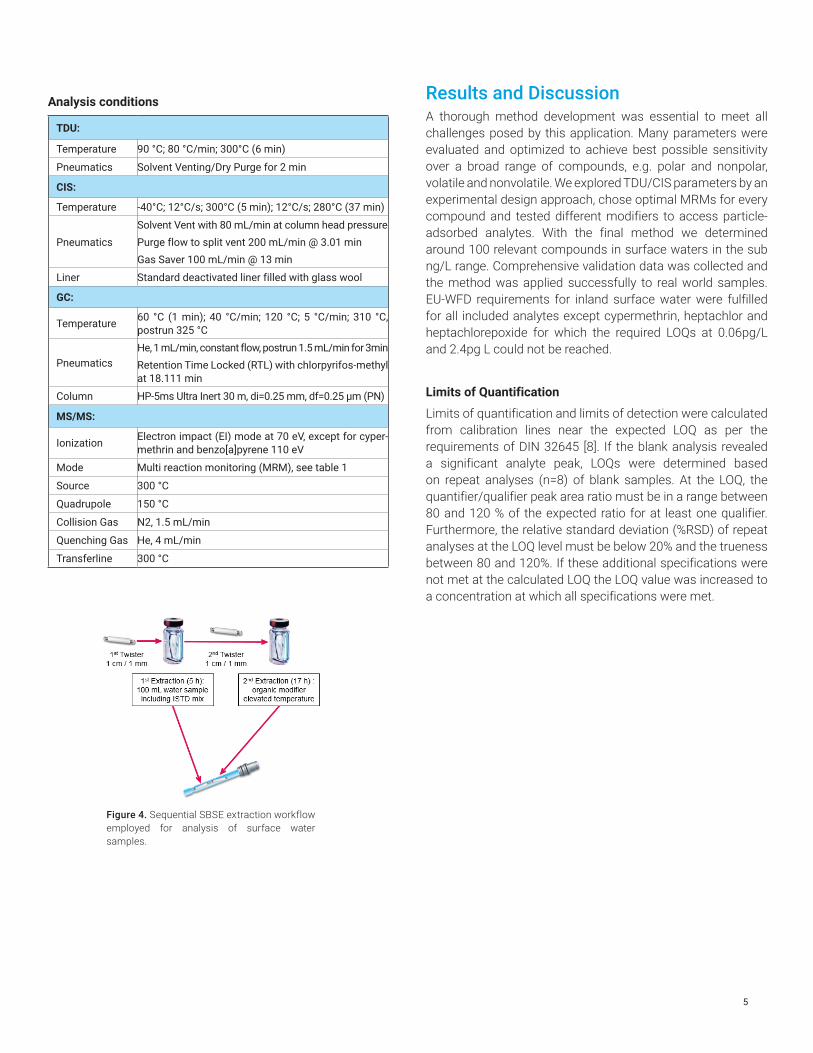
In order to access a wide variety of compounds and to ensure the extraction of particle-adsorbed compounds, the technique of sequential SBSE developed by Ochiai et. al. [7] was utilized. A single sample aliquot of 100ml is extracted sequentially by two Twisters under different conditions, for example, with or without salt or solvent addition. Subsequently, both Twisters are desorbed simultaneously resulting in a single chromatogram covering an extended range of analytes.
The aim of our method development was to achieve the determination of around 100 analytes by SBSE-TDU-GC-MS/MS in a single analytical run. The required LOQs for compounds listed in the EU-WFD should be reached while the sample preparation method should be as simple and straightforward as possible. Finally, the extraction and correct quantification of particle-adsorbed compounds should be ensured as required by the EU-WFD.
.ExperimentalMaterials and Solvents
For sample extraction 1 cm / 1 mm (length / phase thickness) PDMS Twisters were used (GERSTEL p/n 011333-001-00). The Twisters were conditioned at 280 °C under a nitrogen flow overnight using a GERSTEL® Tube Conditioner (TC 2) and stored in the original storage vial until use. Samples were filled into individual 100 mL vials (GERSTEL 093640-062-00), a Twister was added to each vial before closing it with a crimp cap (GERSTEL 011912-002-00). A heated stirring plate was utilized for Twister extraction (GERSTEL 049000-000-NS), along with a dedicated twister removal tool (GERSTEL 013820-001-00) and drying device (GERSTEL 049000-200-00). Organic modifier for the second extraction step was added by a multi dispenser (GERSTEL 049000-100-00) equipped with 50 mL pipette tips (GERSTEL 049000-101-00).
To reduce background contamination all glassware was heated at 300 °C in a laboratory oven overnight prior to use. In the same manner pipette tips were heated at 120 °C.
All solvents used were of analytical grade, purchased from different suppliers, including Merck, LGC Standards, Alfa Aesar and Carl Roth.
4
Preparation of samples and calibration standards
For calibration a multi-analyte standard in acetone was prepared from certified reference standards and solutions made up from individual neat compounds. Concentrations were adapted to the respective LOQ of each analyte. Three working solutions were diluted from this stock solution to be used for spiking calibration samples. A multi-component internal standard solution was prepared from deuterated or 13C labeled analyte analogues in acetone.
Calibration was run over the complete analysis method. To avoid external contamination a 100 g aliquot of pure water was weighed in directly from the primary bottle without using a pipette or similar device. Subsequently, different amounts of working solution and 30 µL of the internal standard solution were added. Background analyte peaks resulting from the water matrix and the laboratory surrounding should be small compared to the lowest calibration level. Additionally, the water used for calibration should be as similar as possible to the water of the real samples. Therefore, very clean groundwater, tap water or mineral water were found to be suitable for calibration whereas groundwater gave the best results regarding trueness of analysis values. Samples to be analyzed should have a pH between 5.5 and 7. If necessary the pH value can be adjusted by addition of 0.1 M hydrochloric acid or 0.1 M potassium hydroxide solution. Again 100 g aliquots were weighed in and 30 µL of internal standard solution added before extraction.
A 1 cm / 1 mm PDMS Twister was added to the vial, which was closed with a crimp cap and placed on a Twister stirring plate for extraction at 1000 rpm for 5 h. After that the Twister was briefly rinsed in HPLC water, transferred to a clean desorption tube and dried in a stream of nitrogen for around 10 s since it was found that, in this case, the standard drying procedure employing a lint free tissue was prone to contaminate the Twister. Desorption tubes were stored contamination free on the TDU rack of the MultiPurpose Sampler (MPS). To perform the second step in the sequential SBSE method, a 15 mL volume of an organic modifier was added to each sample vial for subsequent extraction with a second PDMS Twister at 1000 rpm and elevated temperature over a 17 h period. After rinsing in HPLC water the second Twister was combined with the Twister from the first extraction in the same desorption tube and dried as previously mentioned. Twisters placed in TDU tubes were stored in sealed TDU racks on the MPS until they underwent automated thermal desorption.
Instrumentation
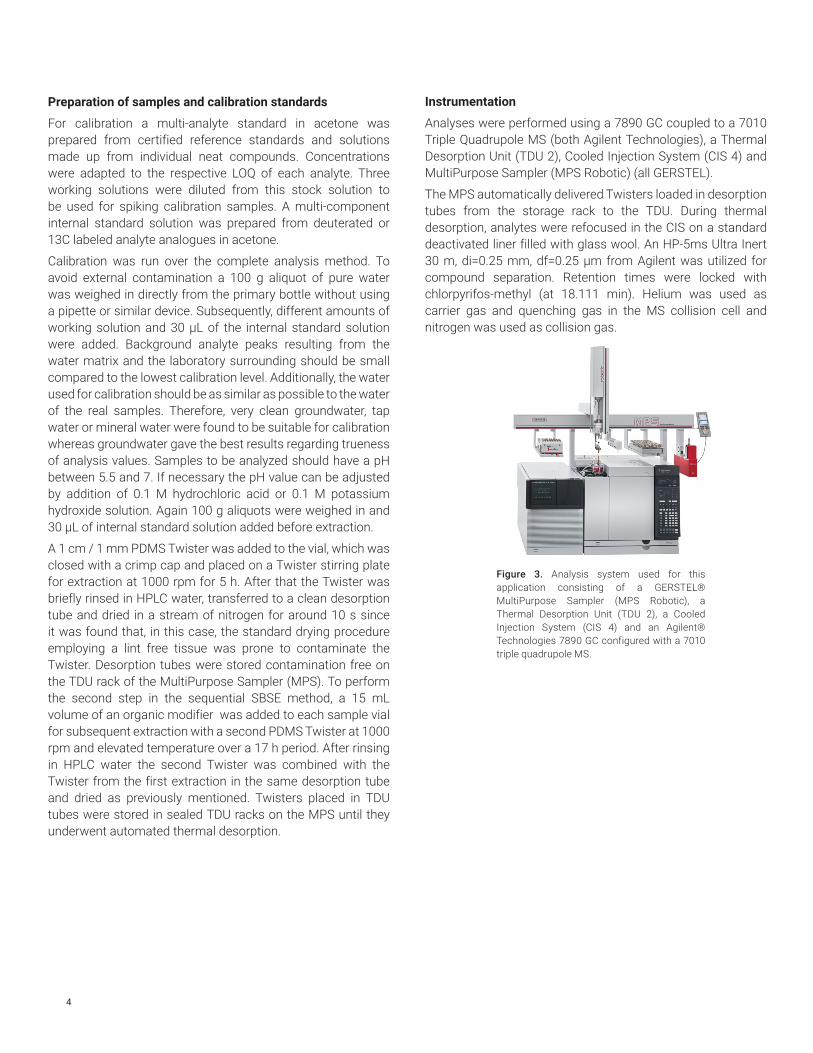
Analyses were performed using a 7890 GC coupled to a 7010 Triple Quadrupole MS (both Agilent Technologies), a Thermal Desorption Unit (TDU 2), Cooled Injection System (CIS 4) and MultiPurpose Sampler (MPS Robotic) (all GERSTEL).
The MPS automatically delivered Twisters loaded in desorption tubes from the storage rack to the TDU. During thermal desorption, analytes were refocused in the CIS on a standard deactivated liner filled with glass wool. An HP-5ms Ultra Inert 30 m, di=0.25 mm, df=0.25 µm from Agilent was utilized for compound separation. Retention times were locked with chlorpyrifos-methyl (at 18.111 min). Helium was used as carrier gas and quenching gas in the MS collision cell and nitrogen was used as collision gas.
Figure 3. Analysis system used for this application consisting of a GERSTEL® MultiPurpose Sampler (MPS Robotic), a Thermal Desorption Unit (TDU 2), a Cooled Injection System (CIS 4) and an Agilent® Technologies 7890 GC configured with a 7010 triple quadrupole MS.
5
Analysis conditions
TDU:
Temperature 90 °C; 80 °C/min; 300°C (6 min)
Pneumatics Solvent Venting/Dry Purge for 2 min
CIS:
Temperature -40°C; 12°C/s; 300°C (5 min); 12°C/s; 280°C (37 min)
Pneumatics Solvent Vent with 80 mL/min at column head pressurePurge flow to split vent 200 mL/min @ 3.01 minGas Saver 100 mL/min @ 13 min
Liner Standard deactivated liner filled with glass wool
GC:
Temperature 60 °C (1 min); 40 °C/min; 120 °C; 5 °C/min; 310 °C, postrun 325 °C
PneumaticsHe, 1 mL/min, constant flow, postrun 1.5 mL/min for 3minRetention Time Locked (RTL) with chlorpyrifos-methyl at 18.111 min
Column HP-5ms Ultra Inert 30 m, di=0.25 mm, df=0.25 µm (PN)
MS/MS:
Ionization Electron impact (EI) mode at 70 eV, except for cyper-methrin and benzo[a]pyrene 110 eV
Mode Multi reaction monitoring (MRM), see table 1
Source 300 °C
Quadrupole 150 °C
Collision Gas N2, 1.5 mL/min
Quenching Gas He, 4 mL/min
Transferline 300 °C
Figure 4. Sequential SBSE extraction workflow employed for analysis of surface water samples.
Results and DiscussionA thorough method development was essential to meet all challenges posed by this application. Many parameters were evaluated and optimized to achieve best possible sensitivity over a broad range of compounds, e.g. polar and nonpolar, volatile and nonvolatile. We explored TDU/CIS parameters by an experimental design approach, chose optimal MRMs for every compound and tested different modifiers to access particle-adsorbed analytes. With the final method we determined around 100 relevant compounds in surface waters in the sub ng/L range. Comprehensive validation data was collected and the method was applied successfully to real world samples. EU-WFD requirements for inland surface water were fulfilled for all included analytes except cypermethrin, heptachlor and heptachlorepoxide for which the required LOQs at 0.06pg/L and 2.4pg L could not be reached.
Limits of Quantification
Limits of quantification and limits of detection were calculated from calibration lines near the expected LOQ as per the requirements of DIN 32645 [8]. If the blank analysis revealed a significant analyte peak, LOQs were determined based on repeat analyses (n=8) of blank samples. At the LOQ, the quantifier/qualifier peak area ratio must be in a range between 80 and 120 % of the expected ratio for at least one qualifier. Furthermore, the relative standard deviation (%RSD) of repeat analyses at the LOQ level must be below 20% and the trueness between 80 and 120%. If these additional specifications were not met at the calculated LOQ the LOQ value was increased to a concentration at which all specifications were met.
6
If feasible, i.e. if the background concentration of an analyte was low, river water was used as matrix when establishing LOQ. For certain compounds like PAHs the background value of the available river water was too high. In these cases, either tap or mineral water were used as matrix for LOQ determination. Generally, all validation data strongly depend on the level of background contamination and its uniformity. Moreover, the background contamination of the laboratory and the analysts’ skill and experience will influence the quality of the validation data
The following table presents the determined LOQs for all analytes and their required LOQs from EU-WFD and other legislation. In cases where the EQS refers to a sum of multiple analytes the required LOQ was calculated separately for each of these analytes. This is a very strict interpretation assuming that only one of the respective analytes is present and all others are not.
<< See Table 2 Results in the Appendix>>
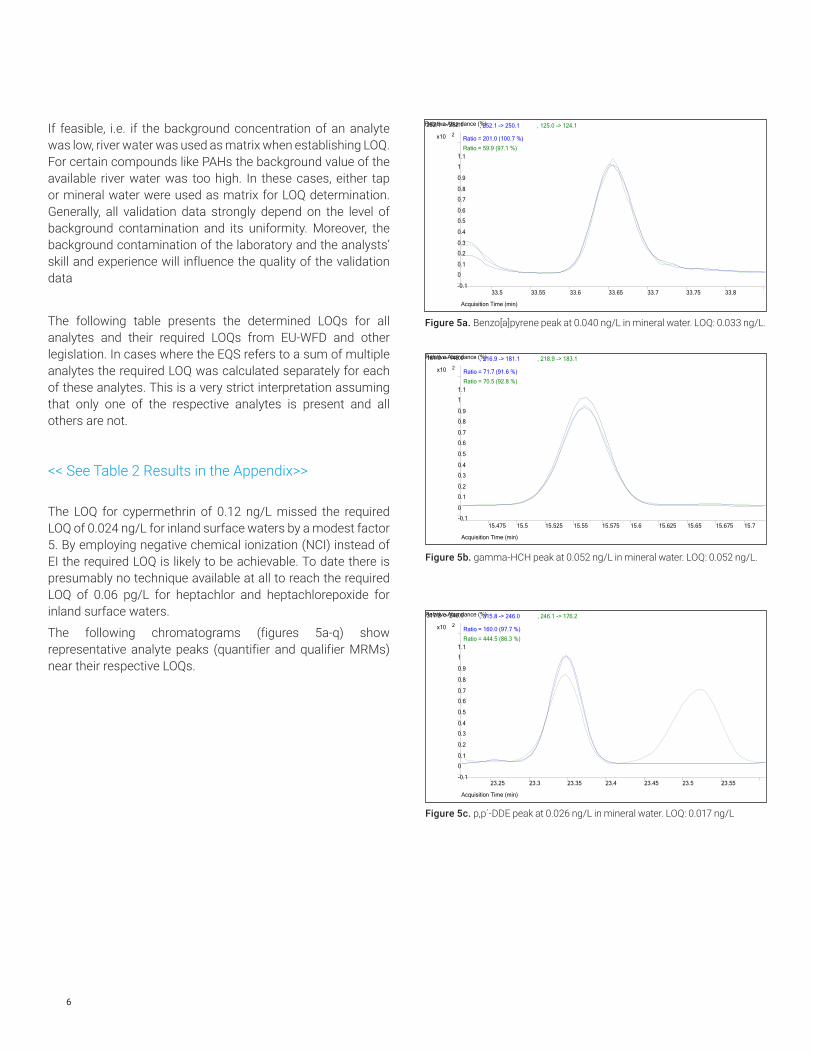
The LOQ for cypermethrin of 0.12 ng/L missed the required LOQ of 0.024 ng/L for inland surface waters by a modest factor 5. By employing negative chemical ionization (NCI) instead of EI the required LOQ is likely to be achievable. To date there is presumably no technique available at all to reach the required LOQ of 0.06 pg/L for heptachlor and heptachlorepoxide for inland surface waters.
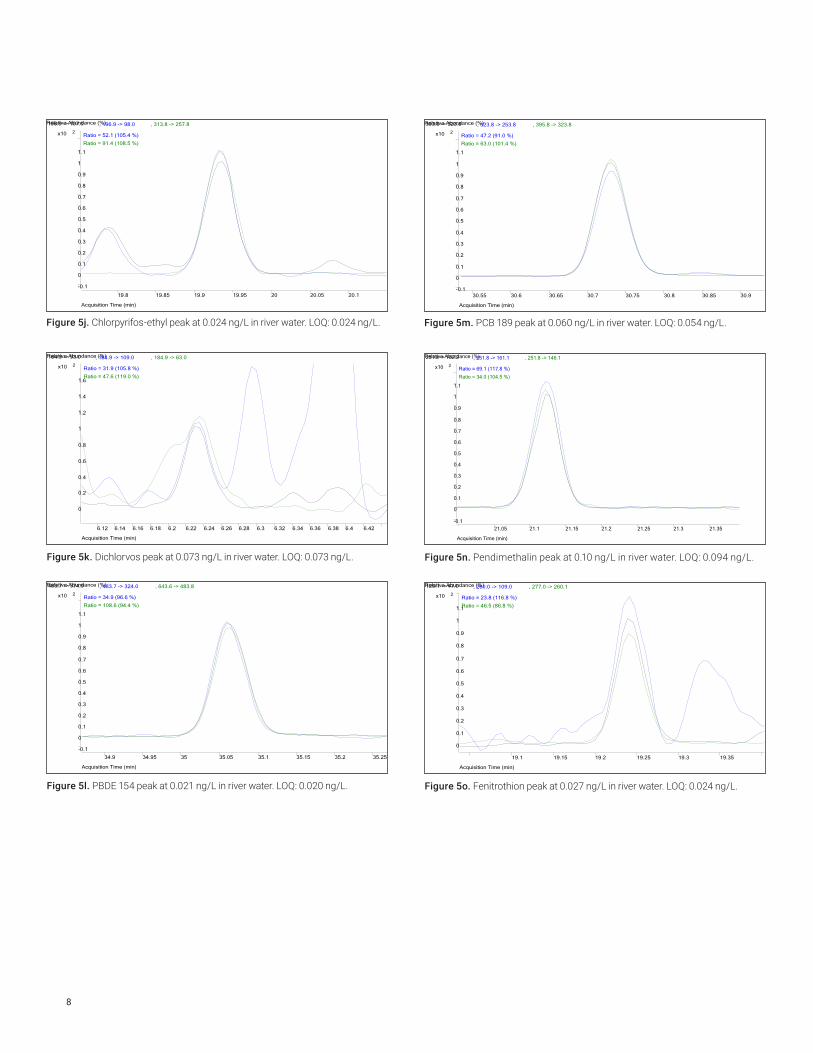
The following chromatograms (figures 5a-q) show representative analyte peaks (quantifier and qualifier MRMs) near their respective LOQs.
Acquisition Time (min)
33.5 33.55 33.6 33.65 33.7 33.75 33.8
Relative Abundance (%)
2x10
-0.1
0
0.1
0.2
0.3
0.4
0.5
0.6
0.7
0.8
0.9
1
1.1
252.1 -> 252.1 , 252.1 -> 250.1 , 125.0 -> 124.1
Ratio = 201.0 (100.7 %)
Ratio = 59.9 (97.1 %)
Figure 5a. Benzo[a]pyrene peak at 0.040 ng/L in mineral water. LOQ: 0.033 ng/L.
Acquisition Time (min)
15.475 15.5 15.525 15.55 15.575 15.6 15.625 15.65 15.675 15.7
Relative Abundance (%)
2x10
-0.1
0
0.1
0.2
0.3
0.4
0.5
0.6
0.7
0.8
0.9
1
1.1
181.0 -> 145.0 , 216.9 -> 181.1 , 218.9 -> 183.1
Ratio = 71.7 (91.6 %)
Ratio = 70.5 (92.8 %)
Figure 5b. gamma-HCH peak at 0.052 ng/L in mineral water. LOQ: 0.052 ng/L.
Acquisition Time (min)
23.25 23.3 23.35 23.4 23.45 23.5 23.55
Relative Abundance (%)
2x10
-0.1
0
0.1
0.2
0.3
0.4
0.5
0.6
0.7
0.8
0.9
1
1.1
317.8 -> 246.0 , 315.8 -> 246.0 , 246.1 -> 176.2
Ratio = 160.0 (97.7 %)
Ratio = 444.5 (86.3 %)
Figure 5c. p,p´-DDE peak at 0.026 ng/L in mineral water. LOQ: 0.017 ng/L
7
Acquisition Time (min)
18.1 18.15 18.2 18.25 18.3 18.35 18.4 18.45
Relative Abundance (%)
2x10
-0.1
0
0.1
0.2
0.3
0.4
0.5
0.6
0.7
0.8
0.9
1
1.1
336.8 -> 232.0 , 236.9 -> 142.9
Ratio = 263.8 (113.2 %)
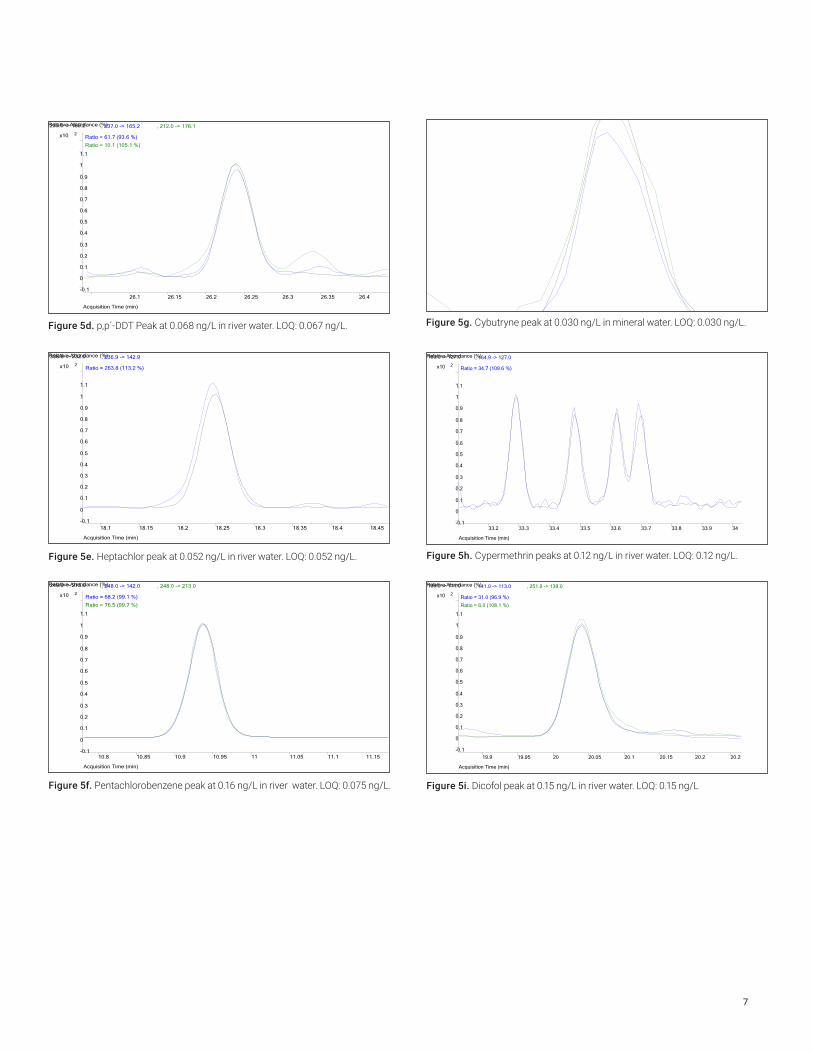
Figure 5e. Heptachlor peak at 0.052 ng/L in river water. LOQ: 0.052 ng/L.
Acquisition Time (min)
10.8 10.85 10.9 10.95 11 11.05 11.1 11.15
Relative Abundance (%)
2x10
-0.1
0
0.1
0.2
0.3
0.4
0.5
0.6
0.7
0.8
0.9
1
1.1
249.9 -> 215.0 , 248.0 -> 142.0 , 248.0 -> 213.0
Ratio = 68.2 (99.1 %)
Ratio = 76.5 (99.7 %)
Figure 5f. Pentachlorobenzene peak at 0.16 ng/L in river water. LOQ: 0.075 ng/L.
Acquisition Time (min)
21.3 21.35 21.4 21.45 21.5 21.55 21.6 21.65
Relative Abundance (%)
2x10
-0.1
0
0.1
0.2
0.3
0.4
0.5
0.6
0.7
0.8
0.9
1
1.1
182.2 -> 109.1 , 182.2 -> 140.1 , 238.2 -> 182.1
Ratio = 39.2 (86.3 %)
Ratio = 46.4 (101.5 %)
Figure 5g. Cybutryne peak at 0.030 ng/L in mineral water. LOQ: 0.030 ng/L.
Acquisition Time (min)
33.2 33.3 33.4 33.5 33.6 33.7 33.8 33.9 34
Relative Abundance (%)
2x10
-0.1
0
0.1
0.2
0.3
0.4
0.5
0.6
0.7
0.8
0.9
1
1.1
163.0 -> 127.0 , 164.9 -> 127.0
Ratio = 34.7 (109.6 %)
Figure 5h. Cypermethrin peaks at 0.12 ng/L in river water. LOQ: 0.12 ng/L.
Acquisition Time (min)
19.9 19.95 20 20.05 20.1 20.15 20.2 20.25
Relative Abundance (%)
2x10
-0.1
0
0.1
0.2
0.3
0.4
0.5
0.6
0.7
0.8
0.9
1
1.1
139.0 -> 111.0 , 141.0 -> 113.0 , 251.9 -> 139.0
Ratio = 31.0 (96.9 %)
Ratio = 6.0 (108.1 %)
Figure 5i. Dicofol peak at 0.15 ng/L in river water. LOQ: 0.15 ng/L
Acquisition Time (min)
26.1 26.15 26.2 26.25 26.3 26.35 26.4
Relative Abundance (%)
2x10
-0.1
0
0.1
0.2
0.3
0.4
0.5
0.6
0.7
0.8
0.9
1
1.1
235.0 -> 165.2 , 237.0 -> 165.2 , 212.0 -> 176.1
Ratio = 61.7 (93.6 %)
Ratio = 10.1 (105.1 %)
Figure 5d. p,p´-DDT Peak at 0.068 ng/L in river water. LOQ: 0.067 ng/L.
8
Acquisition Time (min)
19.8 19.85 19.9 19.95 20 20.05 20.1
Relative Abundance (%)
2x10
-0.1
0
0.1
0.2
0.3
0.4
0.5
0.6
0.7
0.8
0.9
1
1.1
196.9 -> 107.0 , 196.9 -> 98.0 , 313.8 -> 257.8
Ratio = 52.1 (105.4 %)
Ratio = 91.4 (108.5 %)
Figure 5j. Chlorpyrifos-ethyl peak at 0.024 ng/L in river water. LOQ: 0.024 ng/L.
Acquisition Time (min)
6.12 6.14 6.16 6.18 6.2 6.22 6.24 6.26 6.28 6.3 6.32 6.34 6.36 6.38 6.4 6.42
Relative Abundance (%)
2x10
0
0.2
0.4
0.6
0.8
1
1.2
1.4
1.6
184.9 -> 93.0 , 184.9 -> 109.0 , 184.9 -> 63.0
Ratio = 31.9 (105.8 %)
Ratio = 47.6 (119.0 %)
Figure 5k. Dichlorvos peak at 0.073 ng/L in river water. LOQ: 0.073 ng/L.
Acquisition Time (min)
34.9 34.95 35 35.05 35.1 35.15 35.2 35.25
Relative Abundance (%)
2x10
-0.1
0
0.1
0.2
0.3
0.4
0.5
0.6
0.7
0.8
0.9
1
1.1
483.7 -> 374.9 , 483.7 -> 324.0 , 643.6 -> 483.8
Ratio = 34.9 (96.6 %)
Ratio = 108.6 (94.4 %)
Figure 5l. PBDE 154 peak at 0.021 ng/L in river water. LOQ: 0.020 ng/L.
Acquisition Time (min)
30.55 30.6 30.65 30.7 30.75 30.8 30.85 30.9
Relative Abundance (%)
2x10
-0.1
0
0.1
0.2
0.3
0.4
0.5
0.6
0.7
0.8
0.9
1
1.1
393.8 -> 323.8 , 323.8 -> 253.8 , 395.8 -> 323.8
Ratio = 47.2 (91.0 %)
Ratio = 63.0 (101.4 %)
Figure 5m. PCB 189 peak at 0.060 ng/L in river water. LOQ: 0.054 ng/L.
Acquisition Time (min)
21.05 21.1 21.15 21.2 21.25 21.3 21.35
Relative Abundance (%)
2x10
-0.1
0
0.1
0.2
0.3
0.4
0.5
0.6
0.7
0.8
0.9
1
1.1
251.8 -> 162.2 , 251.8 -> 161.1 , 251.8 -> 146.1
Ratio = 69.1 (117.8 %)
Ratio = 34.0 (104.5 %)
Figure 5n. Pendimethalin peak at 0.10 ng/L in river water. LOQ: 0.094 ng/L.
Acquisition Time (min)
19.1 19.15 19.2 19.25 19.3 19.35
Relative Abundance (%)
2x10
0
0.1
0.2
0.3
0.4
0.5
0.6
0.7
0.8
0.9
1
1.1
125.1 -> 47.0 , 260.0 -> 109.0 , 277.0 -> 260.1
Ratio = 23.8 (116.8 %)
Ratio = 46.5 (86.8 %)
Figure 5o. Fenitrothion peak at 0.027 ng/L in river water. LOQ: 0.024 ng/L.
9
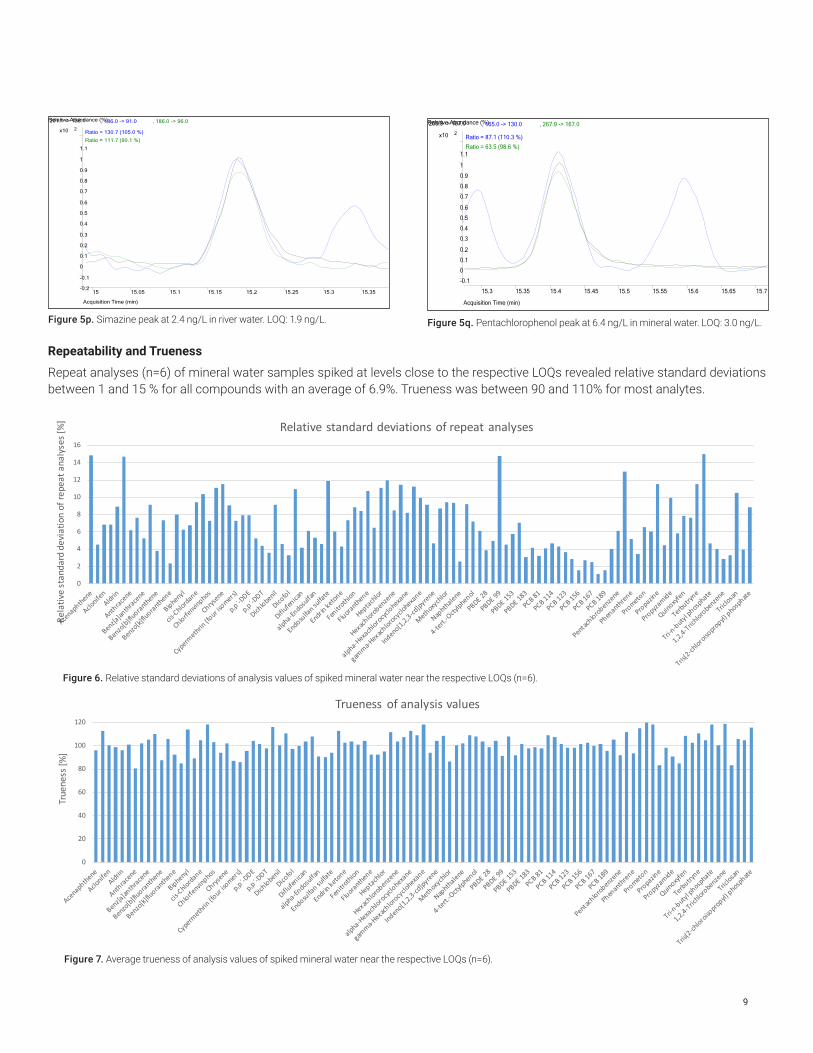
Repeatability and Trueness
Repeat analyses (n=6) of mineral water samples spiked at levels close to the respective LOQs revealed relative standard deviations between 1 and 15 % for all compounds with an average of 6.9%. Trueness was between 90 and 110% for most analytes.
Acquisition Time (min)
15 15.05 15.1 15.15 15.2 15.25 15.3 15.35
Relative Abundance (%)
2x10
-0.2
-0.1
0
0.1
0.2
0.3
0.4
0.5
0.6
0.7
0.8
0.9
1
1.1
201.1 -> 138.1 , 186.0 -> 91.0 , 186.0 -> 96.0
Ratio = 130.7 (105.0 %)
Ratio = 111.7 (90.1 %)
Figure 5p. Simazine peak at 2.4 ng/L in river water. LOQ: 1.9 ng/L.
Acquisition Time (min)
15.3 15.35 15.4 15.45 15.5 15.55 15.6 15.65 15.7
Relative Abundance (%)
2x10
-0.1
0
0.1
0.2
0.3
0.4
0.5
0.6
0.7
0.8
0.9
1
1.1
265.9 -> 167.0 , 165.0 -> 130.0 , 267.9 -> 167.0
Ratio = 87.1 (110.3 %)
Ratio = 63.5 (98.6 %)
Figure 5q. Pentachlorophenol peak at 6.4 ng/L in mineral water. LOQ: 3.0 ng/L.
0
20
40
60
80
100
120
True
ness
[%]
Trueness of analysis values
Figure 7. Average trueness of analysis values of spiked mineral water near the respective LOQs (n=6).
0
2
4
6
8
10
12
14
16
Rela
tive
stan
dard
dev
iatio
n of
repe
at a
naly
ses [
%] Relative standard deviations of repeat analyses
Figure 6. Relative standard deviations of analysis values of spiked mineral water near the respective LOQs (n=6).
10
Uncertainty of measurement
Relative uncertainty of measurement was calculated from six repeat analyses with the aid of an Excel sheet of the University Stuttgart, Germany (Freeware, © 2015 Dr. M. Koch, Institut für Siedlungswasserbau, Universität Stuttgart, www.aqsbw.de [9]). According to 2009/90/EC [4] the relative uncertainty of measurement at the respective EQS may not exceed 50% which is fulfilled for analytes from the EU-WFD.
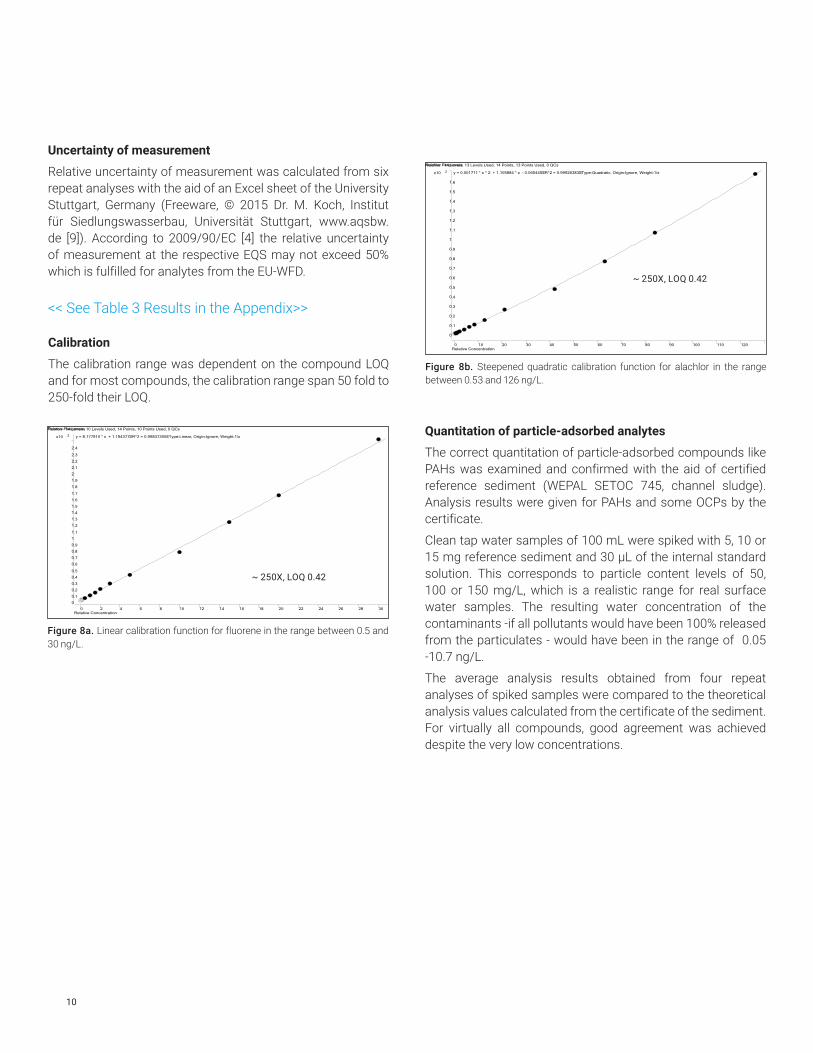
Calibration
The calibration range was dependent on the compound LOQ and for most compounds, the calibration range span 50 fold to 250-fold their LOQ.
Fluoren - 14 Levels, 10 Levels Used, 14 Points, 10 Points Used, 0 QCs
Relative Concentration0 2 4 6 8 10 12 14 16 18 20 22 24 26 28 30
Relative Responses
2x10
0
0.1
0.2
0.3
0.4
0.5
0.6
0.7
0.8
0.9
1
1.1
1.2
1.3
1.4
1.5
1.6
1.7
1.8
1.9
2
2.1
2.2
2.3
2.4
y = 8.177910 * x + 1.194377 R^2 = 0.99837305 Type:Linear, Origin:Ignore, Weight:1/x
Figure 8a. Linear calibration function for fluorene in the range between 0.5 and 30 ng/L.
<< See Table 3 Results in the Appendix>>
Alachlor - 14 Levels, 13 Levels Used, 14 Points, 13 Points Used, 0 QCs
Relative Concentration0 10 20 30 40 50 60 70 80 90 100 110 120
Relative Responses
2x10
0
0.1
0.2
0.3
0.4
0.5
0.6
0.7
0.8
0.9
1
1.1
1.2
1.3
1.4
1.5
1.6
y = 0.001711 * x ^ 2 + 1.105884 * x - 0.065445 R^2 = 0.99926383 Type:Quadratic, Origin:Ignore, Weight:1/x
Figure 8b. Steepened quadratic calibration function for alachlor in the range between 0.53 and 126 ng/L.
~ 250X, LOQ 0.42
~ 250X, LOQ 0.42
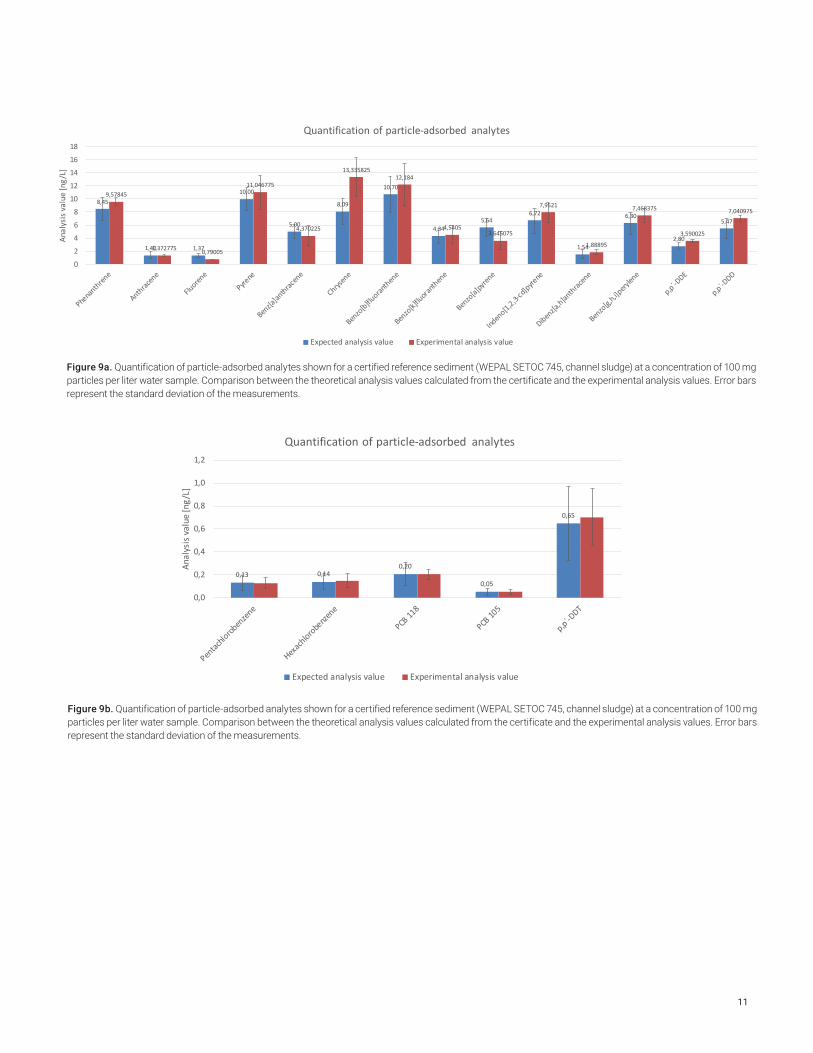
Quantitation of particle-adsorbed analytes
The correct quantitation of particle-adsorbed compounds like PAHs was examined and confirmed with the aid of certified reference sediment (WEPAL SETOC 745, channel sludge). Analysis results were given for PAHs and some OCPs by the certificate.
Clean tap water samples of 100 mL were spiked with 5, 10 or 15 mg reference sediment and 30 µL of the internal standard solution. This corresponds to particle content levels of 50, 100 or 150 mg/L, which is a realistic range for real surface water samples. The resulting water concentration of the contaminants -if all pollutants would have been 100% released from the particulates - would have been in the range of 0.05 -10.7 ng/L.
The average analysis results obtained from four repeat analyses of spiked samples were compared to the theoretical analysis values calculated from the certificate of the sediment. For virtually all compounds, good agreement was achieved despite the very low concentrations.
11
8,45
1,40 1,37
10,00
5,00
8,09
10,70
4,345,64
6,72
1,54
6,30
2,80
5,47
9,57845
1,372775 0,79005
11,046775
4,370225
13,33582512,184
4,54053,645075
7,9521
1,88895
7,468375
3,590025
7,040975
0
2
4
6
8
10
12
14
16
18
Anal
ysis
valu
e [n
g/L]
Quantification of particle-adsorbed analytes
Expected analysis value Experimental analysis value
Figure 9a. Quantification of particle-adsorbed analytes shown for a certified reference sediment (WEPAL SETOC 745, channel sludge) at a concentration of 100 mg particles per liter water sample. Comparison between the theoretical analysis values calculated from the certificate and the experimental analysis values. Error bars represent the standard deviation of the measurements.
0,13 0,140,20
0,05
0,65
0,0
0,2
0,4
0,6
0,8
1,0
1,2
Anal
ysis
valu
e [n
g/L]
Quantification of particle-adsorbed analytes
Expected analysis value Experimental analysis value
Figure 9b. Quantification of particle-adsorbed analytes shown for a certified reference sediment (WEPAL SETOC 745, channel sludge) at a concentration of 100 mg particles per liter water sample. Comparison between the theoretical analysis values calculated from the certificate and the experimental analysis values. Error bars represent the standard deviation of the measurements.
12
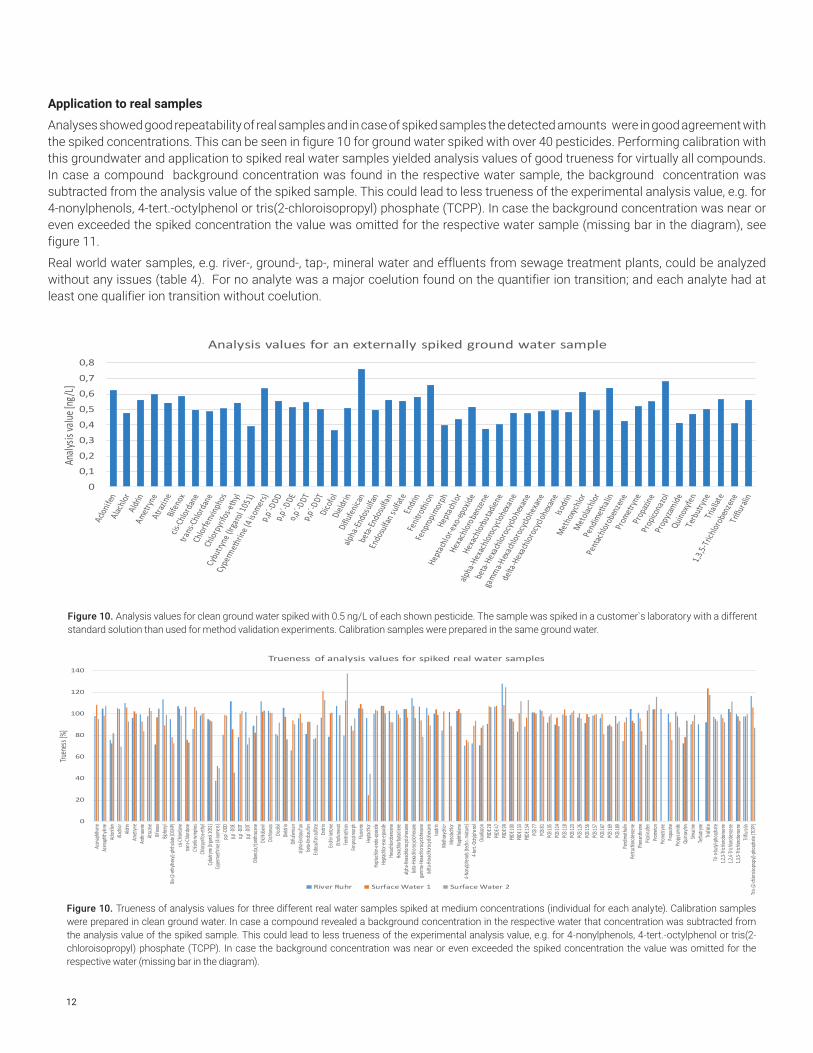
Application to real samples
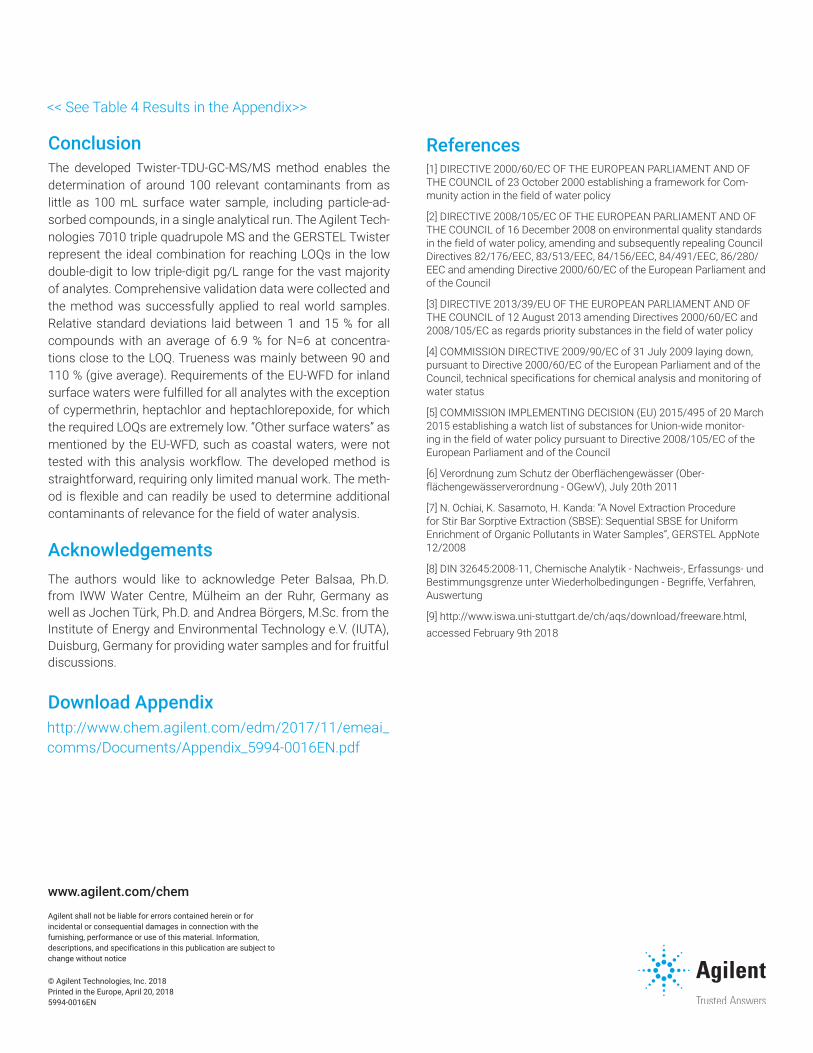
Analyses showed good repeatability of real samples and in case of spiked samples the detected amounts were in good agreement with the spiked concentrations. This can be seen in figure 10 for ground water spiked with over 40 pesticides. Performing calibration with this groundwater and application to spiked real water samples yielded analysis values of good trueness for virtually all compounds. In case a compound background concentration was found in the respective water sample, the background concentration was subtracted from the analysis value of the spiked sample. This could lead to less trueness of the experimental analysis value, e.g. for 4-nonylphenols, 4-tert.-octylphenol or tris(2-chloroisopropyl) phosphate (TCPP). In case the background concentration was near or even exceeded the spiked concentration the value was omitted for the respective water sample (missing bar in the diagram), see figure 11.
Real world water samples, e.g. river-, ground-, tap-, mineral water and effluents from sewage treatment plants, could be analyzed without any issues (table 4). For no analyte was a major coelution found on the quantifier ion transition; and each analyte had at least one qualifier ion transition without coelution.
0
0,1
0,2
0,3
0,4
0,5
0,6
0,7
0,8
Analy
sis va
lue [n
g/L]
Analysis values for an externally spiked ground water sample
Figure 10. Analysis values for clean ground water spiked with 0.5 ng/L of each shown pesticide. The sample was spiked in a customer`s laboratory with a different standard solution than used for method validation experiments. Calibration samples were prepared in the same ground water.
0
20
40
60
80
100
120
140
Acen
aphthe
neAc
enaph
thylen
eAc
lonife
nAla
chlor
Aldrin
Ametr
yne
Anthr
acene
Atrazi
neBif
enox
Biphe
nylBis
-(2-et
hylhe
xyl)-p
hthala
te (DE
HP)
cis-Ch
lorda
netra
ns-Ch
lordan
eCh
lorfen
vinph
osCh
lorpy
rifos-e
thyl
Cybu
tryne
(Irgar
ol 1051
)Cy
perme
thrine
(4 iso
mers)
p,p´-D
DDp,p
´-DDE
o,p´-D
DTp,p
´-DDT
Diben
z[a,h]
anthra
cene
Dichlo
benil
Dichlo
rvos
Dicofo
lDie
ldrin
Difluf
enican
alpha
-Endo
sulfan
beta-
Endo
sulfan
Endo
sulfan
sulfa
teEn
drin
Endri
n keto
neEth
ofume
satFen
itrothi
onFen
propim
orph
Fluore
neHe
ptachl
orHe
ptachl
or-en
do-ep
oxide
Hepta
chlor-
exo-ep
oxide
Hexac
hlorob
enzen
eHe
xachlo
rbutad
iene
alpha
-Hexac
hloroc
ycloh
exane
beta-
Hexac
hloroc
ycloh
exane
gamma
-Hexac
hloroc
ycloh
exane
delta
-Hexac
hloroc
ycloh
exane
Isodri
nMe
thoxyc
hlor
Metol
achlor
Naph
thalen
e4-N
onylp
heno
ls (tec
hn. m
ixture
)4-t
ert.-O
ctylph
enol
Oxadi
azon
PBDE
28PB
DE 47
PBDE
99PB
DE 10
0PB
DE 15
3PB
DE 15
4PC
B 77
PCB 8
1PC
B 105
PCB 1
14PC
B 118
PCB 1
23PC
B 126
PCB 1
56PC
B 157
PCB 1
67PC
B 169
PCB 1
89Pe
ndim
ethalin
Penta
chloro
benze
nePh
enan
thren
ePic
olina
fenPro
meton
Prome
tryne
Propa
zine
Propyz
amide
Quino
xyfen
Simazi
neTe
rbutry
neTri
allate
Tri-n-
butyl
-phosp
hate
1,2,3-
Trichl
orobe
nzene
1,2,4-
Trichl
orobe
nzene
1,3,5-
Trichl
orobe
nzene
Triflu
ralin
Tris-(
2-chlo
roisop
ropyl)
-phosp
hate
(TCPP
)
Truen
ess [
%]
Trueness of analysis values for spiked real water samples
River Ruhr Surface Water 1 Surface Water 2
Figure 10. Trueness of analysis values for three different real water samples spiked at medium concentrations (individual for each analyte). Calibration samples were prepared in clean ground water. In case a compound revealed a background concentration in the respective water that concentration was subtracted from the analysis value of the spiked sample. This could lead to less trueness of the experimental analysis value, e.g. for 4-nonylphenols, 4-tert.-octylphenol or tris(2-chloroisopropyl) phosphate (TCPP). In case the background concentration was near or even exceeded the spiked concentration the value was omitted for the respective water (missing bar in the diagram).
ConclusionThe developed Twister-TDU-GC-MS/MS method enables the determination of around 100 relevant contaminants from as little as 100 mL surface water sample, including particle-ad-sorbed compounds, in a single analytical run. The Agilent Tech-nologies 7010 triple quadrupole MS and the GERSTEL Twister represent the ideal combination for reaching LOQs in the low double-digit to low triple-digit pg/L range for the vast majority of analytes. Comprehensive validation data were collected and the method was successfully applied to real world samples. Relative standard deviations laid between 1 and 15 % for all compounds with an average of 6.9 % for N=6 at concentra-tions close to the LOQ. Trueness was mainly between 90 and 110 % (give average). Requirements of the EU-WFD for inland surface waters were fulfilled for all analytes with the exception of cypermethrin, heptachlor and heptachlorepoxide, for which the required LOQs are extremely low. “Other surface waters” as mentioned by the EU-WFD, such as coastal waters, were not tested with this analysis workflow. The developed method is straightforward, requiring only limited manual work. The meth-od is flexible and can readily be used to determine additional contaminants of relevance for the field of water analysis.
AcknowledgementsThe authors would like to acknowledge Peter Balsaa, Ph.D. from IWW Water Centre, Mülheim an der Ruhr, Germany as well as Jochen Türk, Ph.D. and Andrea Börgers, M.Sc. from the Institute of Energy and Environmental Technology e.V. (IUTA), Duisburg, Germany for providing water samples and for fruitful discussions.
<< See Table 4 Results in the Appendix>>
References[1] DIRECTIVE 2000/60/EC OF THE EUROPEAN PARLIAMENT AND OF THE COUNCIL of 23 October 2000 establishing a framework for Com-munity action in the field of water policy
[2] DIRECTIVE 2008/105/EC OF THE EUROPEAN PARLIAMENT AND OF THE COUNCIL of 16 December 2008 on environmental quality standards in the field of water policy, amending and subsequently repealing Council Directives 82/176/EEC, 83/513/EEC, 84/156/EEC, 84/491/EEC, 86/280/EEC and amending Directive 2000/60/EC of the European Parliament and of the Council
[3] DIRECTIVE 2013/39/EU OF THE EUROPEAN PARLIAMENT AND OF THE COUNCIL of 12 August 2013 amending Directives 2000/60/EC and 2008/105/EC as regards priority substances in the field of water policy
[4] COMMISSION DIRECTIVE 2009/90/EC of 31 July 2009 laying down, pursuant to Directive 2000/60/EC of the European Parliament and of the Council, technical specifications for chemical analysis and monitoring of water status
[5] COMMISSION IMPLEMENTING DECISION (EU) 2015/495 of 20 March 2015 establishing a watch list of substances for Union-wide monitor-ing in the field of water policy pursuant to Directive 2008/105/EC of the European Parliament and of the Council
[6] Verordnung zum Schutz der Oberflächengewässer (Ober-flächengewässerverordnung - OGewV), July 20th 2011
[7] N. Ochiai, K. Sasamoto, H. Kanda: “A Novel Extraction Procedure for Stir Bar Sorptive Extraction (SBSE): Sequential SBSE for Uniform Enrichment of Organic Pollutants in Water Samples”, GERSTEL AppNote 12/2008
[8] DIN 32645:2008-11, Chemische Analytik - Nachweis-, Erfassungs- und Bestimmungsgrenze unter Wiederholbedingungen - Begriffe, Verfahren, Auswertung
[9] http://www.iswa.uni-stuttgart.de/ch/aqs/download/freeware.html, accessed February 9th 2018
http://www.chem.agilent.com/edm/2017/11/emeai_comms/Documents/Appendix_5994-0016EN.pdf
www.agilent.com/chem
Agilent shall not be liable for errors contained herein or for incidental or consequential damages in connection with the furnishing, performance or use of this material. Information, descriptions, and specifications in this publication are subject to change without notice
© Agilent Technologies, Inc. 2018 Printed in the Europe, April 20, 2018 5994-0016EN
Download Appendix