Embed Size (px)
Citation preview
Automated detection of atrial fibrillation using long short-term memory network with RR interval signals
FAUST, Oliver <http://orcid.org/0000-0002-0352-6716>, SHENFIELD, Alex <http://orcid.org/0000-0002-2931-8077>, KAREEM, Murtadha, SAN, Tan Ru, FUJITA, Hamido and ACHARYA, U. Rajendra
Available from Sheffield Hallam University Research Archive (SHURA) at:
http://shura.shu.ac.uk/22042/
This document is the author deposited version. You are advised to consult the publisher's version if you wish to cite from it.
Published version
FAUST, Oliver, SHENFIELD, Alex, KAREEM, Murtadha, SAN, Tan Ru, FUJITA, Hamido and ACHARYA, U. Rajendra (2018). Automated detection of atrial fibrillation using long short-term memory network with RR interval signals. Computers in Biology and Medicine.
Copyright and re-use policy
See http://shura.shu.ac.uk/information.html
Sheffield Hallam University Research Archivehttp://shura.shu.ac.uk
Automated Detection Of Atrial Fibrillation Using Long Short-TermMemory Network With RR Interval Signals
Oliver Fausta,1,∗, Alex Shenfielda,1, Murtadha Kareema, Tan Ru Sanb, Hamido Fujitac,U Rajendra Acharyad,e,f
aDepartment of Engineering and Mathematics, Sheffield Hallam University, United KingdombNational Heart Centre Singapore, Singapore
cFac. of Software and Information Science, Iwate Prefectural University, Iwate, JapandDepartment of Electronic & Computer Engineering, Ngee Ann Polytechnic, Singapore
eDepartment of Biomedical Engineering, School of Science and Technology, SUSS, SingaporefSchool of Medicine, Faculty of Health and Medical Sciences, Taylor’s University, 47500 Subang Jaya, Malaysia
Abstract
Atrial Fibrillation (AF), either permanent or intermittent (paroxysnal AF), increases the risk ofcardioembolic stroke. Accurate diagnosis of AF is obligatory for initiation of effective treatmentto prevent stroke. Long term cardiac monitoring improves the likelihood of diagnosing paroxys-mal AF. We used a deep learning system to detect AF beats in Heart Rate (HR) signals. Thedata was partitioned with a sliding window of 100 beats. The resulting signal blocks were directlyfed into a deep Recurrent Neural Network (RNN) with Long Short-Term Memory (LSTM). Thesystem was validated and tested with data from the MIT-BIH Atrial Fibrillation Database. Itachieved 98.51% accuracy with 10-fold cross-validation (20 subjects) and 99.77% with blindfoldvalidation (3 subjects). The proposed system structure is straight forward, because there is noneed for information reduction through feature extraction. All the complexity resides in thedeep learning system, which gets the entire information from a signal block. This setup leadsto the robust performance for unknown data, as measured with the blind fold validation. Theproposed Computer-Aided Diagnosis (CAD) system can be used for long-term monitoring ofthe human heart. To the best of our knowledge, the proposed system is the first to incorporatedeep learning for AF beat detection.
Keywords: Deep learning, Recurrent Neural Network, Heart Rate, Atrial Fibrillation
1. Introduction
Atrial Fibrillation (AF) is the most common sustained cardiac rhythm disorder in adults[1]. The disease affects around 0.4% of the adult population and it gets more prevalent withage. Less than 1% of the population under the age of 60 is affected, and over 6% of those overthe age of 80 years are affected [2]. It is predicted that the incidence of AF increases, becauseof the aging population. The disease is associated with inefficiencies in blood flow dynamicswhich substantially increase the risk of stroke and systemic thromboembolism, resulting inhigh mortality and morbidity [3, 4]. Some patients with AF are asymptomatic, but othershave accompanying symptoms, such as fainting, palpitations, chest pain, fatigue, and heartfailure, which seriously diminish the quality of life for the patients [5]. The link between AF andincreased stroke risk was established in the Framingham study, which revealed that nonrheumaticAF is an independent stroke risk predictor among 5,070 participants [6]. AF is characterized
∗Corresponding author1These authors contributed equally to this work.
Preprint submitted to Computers in Biology and Medicine July 4, 2018
by highly variable ventricular beat intervals [7]. The distribution of RR intervals during AFdiffers from the distribution during normal sinus rhythm [8]. In clinical practice, these beat-to-beat variations are detected manually [9]. The sensitivity of this method is above 90% andits specificity is above 70% [10]. Antithrombotic prophylaxis can then be used to reduce thestroke risk from AF [11]. However, a prerequisite for antithrombotic medication is an accuratediagnosis. Unfortunately, antithrombotic medication is associated with bleeding risk and themanual method is neither sensitive nor specific enough to meet the demand for diagnosis, andmedication initiation. Furthermore, intra- and inter-observer variability diminish the reliabilityof manual diagnosis. Automation can potentially improve the sensitivity and specificity [12].
In some patients, the episodes of AF occur paroxysmally, with normal sinus rhythm inbetween. The timing of occurrence of paroxysmal AF is unpredictable. Both permanent andparoxysmal AF can predispose to increased stroke risk [13]. The challenge for Computer-AidedDiagnosis (CAD) is twofold: How to diagnose AF accurately as well as to detect these AF periodsreliably with non-invasive methods that can be used at any time even outside the hospital [14].Electrical phenomena of the heart muscle is measured by placing passive electrodes on the skin.The electrical activity of the heart activates phasic heart muscle contraction that in turn givesrise to rhythmic cardiac pulse. Electrocardiography is a noninvasive method for measuring thatelectrical activity [15, 16, 17]. Electrocardiogram (ECG) measurements can be performed at asingle seating, or be recorded over an extended period of time, for instance over 24 hours (Holtermonitoring). Unfortunately, it has been shown that after catheter ablation procedure for AF,the rate of recurrence of AF episodes is underestimated, and the success rate of catheter ablationis highly overestimated, when determined from 24-h Holter ECG recordings [18]. This issue canbe addressed by considerably extending the monitoring period so that the likelihood of detectingAF episodes increases. However, existing techniques for continuous long-term monitoring reducethe patients’ quality of life though inconvenient data acquisition methods. The inconvenience canlead to a premature termination of the data acquisition, which adversely affects diagnostic quality[19]. For example, state of the art Holter systems use multiple electrodes, which must be placedby trained technologists. In contrast, beat to beat intervals, which establishes the Heart Rate(HR), once stripped of the morphological component of the ECG signal, can be measured witha single sensor that may be placed by the patient himself. AF detection algorithms are effectivefor short duration beat interval recordings, offering the prospect of simple and rapid diagnostictests based on beat intervals alone [20]. CAD systems are mandatory for long-term monitoring,because manual data interpretation of the huge amount data readout is impracticable [21]. Forcomputer based systems, detecting AF periods solely based on HR signals is difficult, becausethe data is noisy, and the capability of traditional machine learning algorithms is limited [22].State of the art CAD systems tackle these problems with information reduction through featureextraction, ensuring that the machine learning algorithm is not overwhelmed. The resultingsystems under-perform for unknown data and large datasets [23].
We aim to reduce workload of the clinicians and to enable long-term monitoring by providinga robust diagnosis support system for AF. The proposed system structure is minimalist: there isjust data partitioning and automated decision support with a deep learning system. That impliesthe space for design errors is also minimal. Furthermore, the decision-making system gets all theinformation within the selected data block. There is no information reduction through featureextraction. Consequently, the proposed system is robust and accurate. The AF detection systemscored 98.51% accuracy with 10-fold cross-validation. A 99.77% blind fold accuracy indicatesa good robustness. These performance figures make us confident that the system will performwell for unknown data in a practical environment, such as AF long-term monitoring. Our workopens up a viable path to extend the monitoring period for diagnosis, treatment monitoringand drug efficacy tests. Furthermore, the results justify our choice to use deep learning for AFdetection.
2
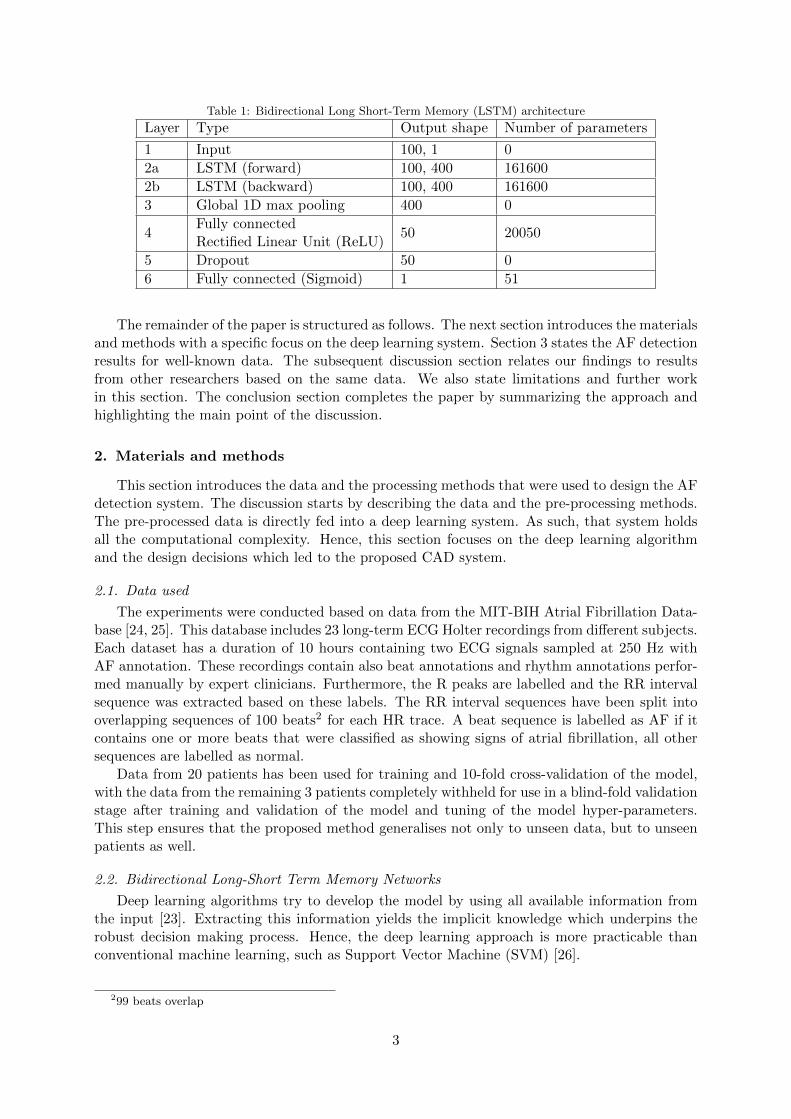
Table 1: Bidirectional Long Short-Term Memory (LSTM) architecture
Layer Type Output shape Number of parameters
1 Input 100, 1 0
2a LSTM (forward) 100, 400 161600
2b LSTM (backward) 100, 400 161600
3 Global 1D max pooling 400 0
4Fully connectedRectified Linear Unit (ReLU)
50 20050
5 Dropout 50 0
6 Fully connected (Sigmoid) 1 51
The remainder of the paper is structured as follows. The next section introduces the materialsand methods with a specific focus on the deep learning system. Section 3 states the AF detectionresults for well-known data. The subsequent discussion section relates our findings to resultsfrom other researchers based on the same data. We also state limitations and further workin this section. The conclusion section completes the paper by summarizing the approach andhighlighting the main point of the discussion.
2. Materials and methods
This section introduces the data and the processing methods that were used to design the AFdetection system. The discussion starts by describing the data and the pre-processing methods.The pre-processed data is directly fed into a deep learning system. As such, that system holdsall the computational complexity. Hence, this section focuses on the deep learning algorithmand the design decisions which led to the proposed CAD system.
2.1. Data used
The experiments were conducted based on data from the MIT-BIH Atrial Fibrillation Data-base [24, 25]. This database includes 23 long-term ECG Holter recordings from different subjects.Each dataset has a duration of 10 hours containing two ECG signals sampled at 250 Hz withAF annotation. These recordings contain also beat annotations and rhythm annotations perfor-med manually by expert clinicians. Furthermore, the R peaks are labelled and the RR intervalsequence was extracted based on these labels. The RR interval sequences have been split intooverlapping sequences of 100 beats2 for each HR trace. A beat sequence is labelled as AF if itcontains one or more beats that were classified as showing signs of atrial fibrillation, all othersequences are labelled as normal.
Data from 20 patients has been used for training and 10-fold cross-validation of the model,with the data from the remaining 3 patients completely withheld for use in a blind-fold validationstage after training and validation of the model and tuning of the model hyper-parameters.This step ensures that the proposed method generalises not only to unseen data, but to unseenpatients as well.
2.2. Bidirectional Long-Short Term Memory Networks
Deep learning algorithms try to develop the model by using all available information fromthe input [23]. Extracting this information yields the implicit knowledge which underpins therobust decision making process. Hence, the deep learning approach is more practicable thanconventional machine learning, such as Support Vector Machine (SVM) [26].
299 beats overlap
3
Recurrent Neural Network (RNN) models have gained increasing popularity in recent years,because they overcome one of the key limitations of using standard machine learning algorithms– the assumption that inputs and outputs to a model are independent of each other [27]. Inmany problems, such as natural language processing, this assumption is false – for example, toclassify sentiment within a sentence it is important to be able to put the individual words of thesentence into context.
RNNs do this by allowing the network to retain and utilise state information (i.e. informationabout what has happened in previous time steps / inputs). This provides RNNs with a “memory”which captures information about all elements of the input. However, Bengio et al. showedthat, whilst standard RNNs can theoretically handle input dependencies over long-intervals,in practice training such networks with gradient descent becomes more inefficient when thetemporal span of the input sequence dependencies increases [28]. This results in RNNs becomingdifficult to train successfully.
LSTM architecture improves upon standard RNN models by incorporating a gating mecha-nism which improves the handling of time step information from long-interval input sequences[29]. That mechanism controls the amount of information, from previous time steps, that contri-butes to the current output. The LSTM gating mechanism implements three layers: 1) input-,2) forget- and 3) output-layer. The training algorithm determines which information is remem-bered and indeed which information is forgotten [30]. Much of the current success of RNNs hasbeen achieved using LSTM architecture based models [31, 32].
Schuster and Paliwal proposed the use of bidirectional RNNs for problems where the en-tire input sequence is available [33]. Bidirectional RNNs utilise past and future data froman input sequence to train both a forward state RNN (operating in the positive time dimen-sion – t0, t1, ..., tn) and a backward state RNN (operating in the negative time dimension –tn, tn−1, ..., t0). This allows the network to make more accurate predictions due to the increasedcontext provided. In recent years, bidirectional LSTM models have shown great promise infields such as speech recognition, with Graves and Schmidhuber showing that such bidirectionalnetworks can be significantly more effective than unidirectional LSTM architectures [34].
2.3. Proposed system architecture
The details of the proposed bidirectional LSTM model are shown in both Table 1 and Figure1. The number of LSTM cells in each of the forward and backward layers was set to twice theinput sequence length (empirically this has been shown to perform well on a range of naturallanguage and time series classification tasks studied by the authors), with two fully connectedlayers used as the top model to produce the final classification. Global max pooling in onedimension was used between the bidirectional LSTM layers and the fully connected layers tocompress the features of the output sequences produced by the bidirectional LSTM layers.
Effectively the bidirectional LSTM layers act to learn and extract the features from theinput HR data sequences, before passing these features to the fully connected top model forclassification as to whether signs of AF are present or not. The model proposed in this paperwas implemented using Keras and Tensorflow [35, 36, 37].
2.4. Model training
Xavier initialisation [38] was used to initialise all the weights of the model, and gradientdescent backpropagation, using the Adam optimiser [39], was used to update the weights. Theinitial learning rate of the Adam optimiser was set to 1e-3 and the binary cross-entropy functionwas used to evaluate the loss of the network. A minibatch size of 1024 input sequences was usedduring this training process – providing a good trade-off between available Graphics ProcessingUnit (GPU) memory and speed of training.
Recurrent dropout [40] was applied (with a probability of 0.1) during training to both theinputs and hidden states of the LSTM cells and standard dropout [41] was applied between the
4
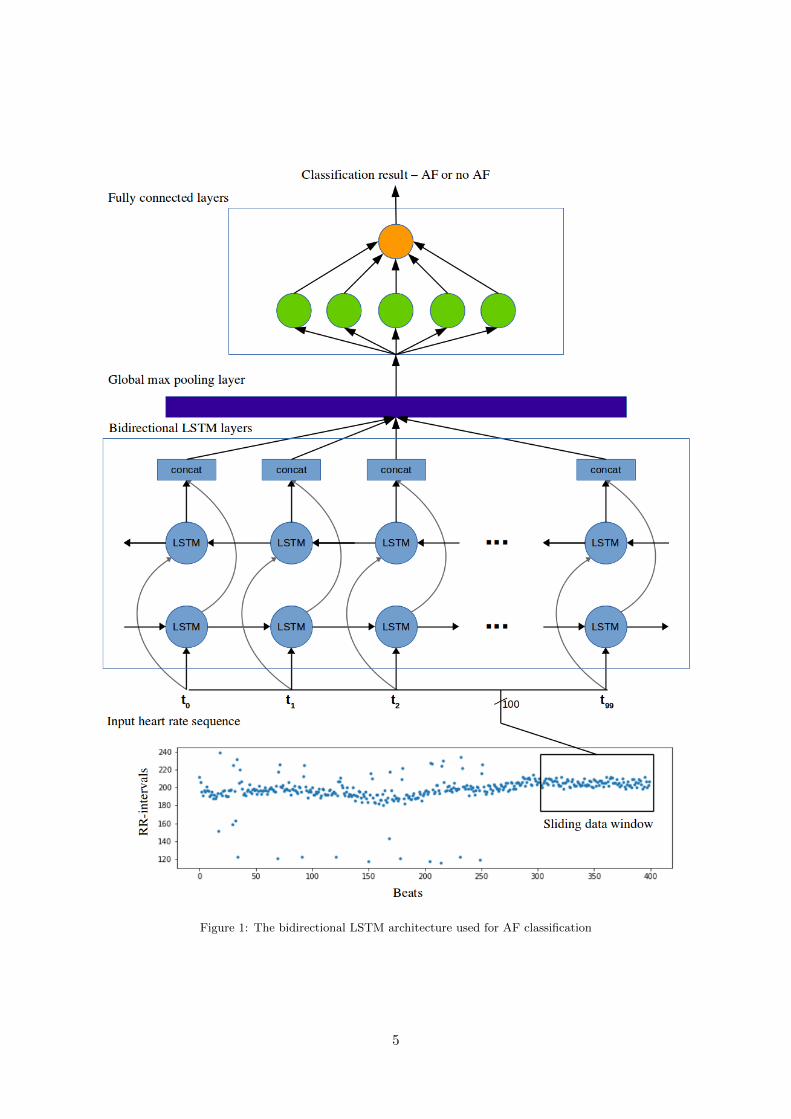
Figure 1: The bidirectional LSTM architecture used for AF classification
5
fully connected layers (again, with a probability of 0.1) to reduce overfitting of the model andimprove model generalisation. Furthermore, the training performance of the proposed modelwas evaluated using the binary cross-entropy function as this provides a better understanding ofthe model performance across a range of operating conditions (as opposed to the classificationaccuracy which only describes the performance of a model at a single point). The binary cross-entropy function compares two probability distributions (that of the true distribution and thepredicted distribution) to provide more information about the nature of the search landscape.
A stratified 10-fold cross-validation strategy was used to evaluate the model performanceand to tune both the model architecture and the hyperparameters (although minimal tuningwas used to obtain the results shown in in the next section). Stratified cross-validation wasnecessary to ensure that each fold was representative of the balance of the full data set. Resultsfrom this stratified 10-fold cross-validation are shown in Section 3.1.
3. Results
This section introduces the 10-fold cross-validation results for training and testing as well asthe blind-fold validation results. The bi-directional LSTM model, proposed in this paper, wastrained using an nVidia Quadro M5000 GPU with 8GB of GDDR5 graphics RAM. The averagetime needed to train a single epoch of this model was approximately 215 s. Initial experimentsshowed that the model converges after between 60 – 80 epochs of training, so 80 epochs wereused in this study to ensure full convergence of the model and limit opportunities for overfitting.
3.1. 10-fold cross-validation results
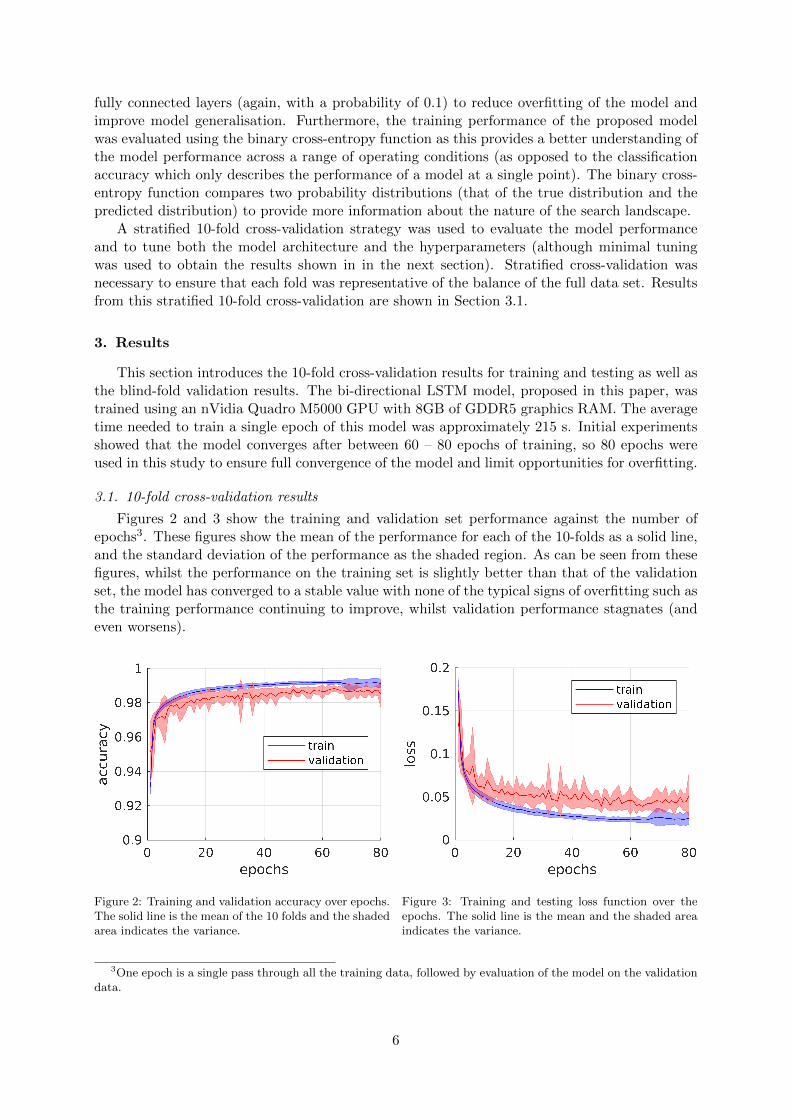
Figures 2 and 3 show the training and validation set performance against the number ofepochs3. These figures show the mean of the performance for each of the 10-folds as a solid line,and the standard deviation of the performance as the shaded region. As can be seen from thesefigures, whilst the performance on the training set is slightly better than that of the validationset, the model has converged to a stable value with none of the typical signs of overfitting such asthe training performance continuing to improve, whilst validation performance stagnates (andeven worsens).
Figure 2: Training and validation accuracy over epochs.The solid line is the mean of the 10 folds and the shadedarea indicates the variance.
Figure 3: Training and testing loss function over theepochs. The solid line is the mean and the shaded areaindicates the variance.
3One epoch is a single pass through all the training data, followed by evaluation of the model on the validationdata.
6
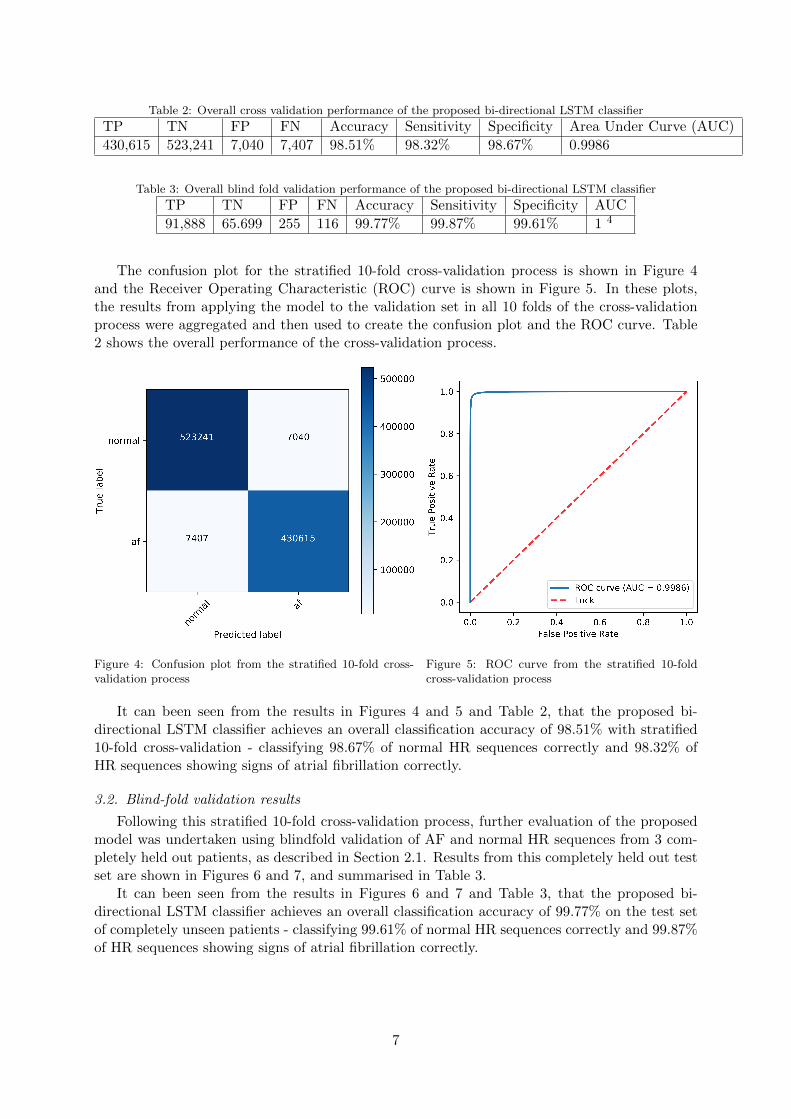
Table 2: Overall cross validation performance of the proposed bi-directional LSTM classifier
TP TN FP FN Accuracy Sensitivity Specificity Area Under Curve (AUC)
430,615 523,241 7,040 7,407 98.51% 98.32% 98.67% 0.9986
Table 3: Overall blind fold validation performance of the proposed bi-directional LSTM classifier
TP TN FP FN Accuracy Sensitivity Specificity AUC
91,888 65.699 255 116 99.77% 99.87% 99.61% 1 4
The confusion plot for the stratified 10-fold cross-validation process is shown in Figure 4and the Receiver Operating Characteristic (ROC) curve is shown in Figure 5. In these plots,the results from applying the model to the validation set in all 10 folds of the cross-validationprocess were aggregated and then used to create the confusion plot and the ROC curve. Table2 shows the overall performance of the cross-validation process.
Figure 4: Confusion plot from the stratified 10-fold cross-validation process
Figure 5: ROC curve from the stratified 10-foldcross-validation process
It can been seen from the results in Figures 4 and 5 and Table 2, that the proposed bi-directional LSTM classifier achieves an overall classification accuracy of 98.51% with stratified10-fold cross-validation - classifying 98.67% of normal HR sequences correctly and 98.32% ofHR sequences showing signs of atrial fibrillation correctly.
3.2. Blind-fold validation results
Following this stratified 10-fold cross-validation process, further evaluation of the proposedmodel was undertaken using blindfold validation of AF and normal HR sequences from 3 com-pletely held out patients, as described in Section 2.1. Results from this completely held out testset are shown in Figures 6 and 7, and summarised in Table 3.
It can been seen from the results in Figures 6 and 7 and Table 3, that the proposed bi-directional LSTM classifier achieves an overall classification accuracy of 99.77% on the test setof completely unseen patients - classifying 99.61% of normal HR sequences correctly and 99.87%of HR sequences showing signs of atrial fibrillation correctly.
7
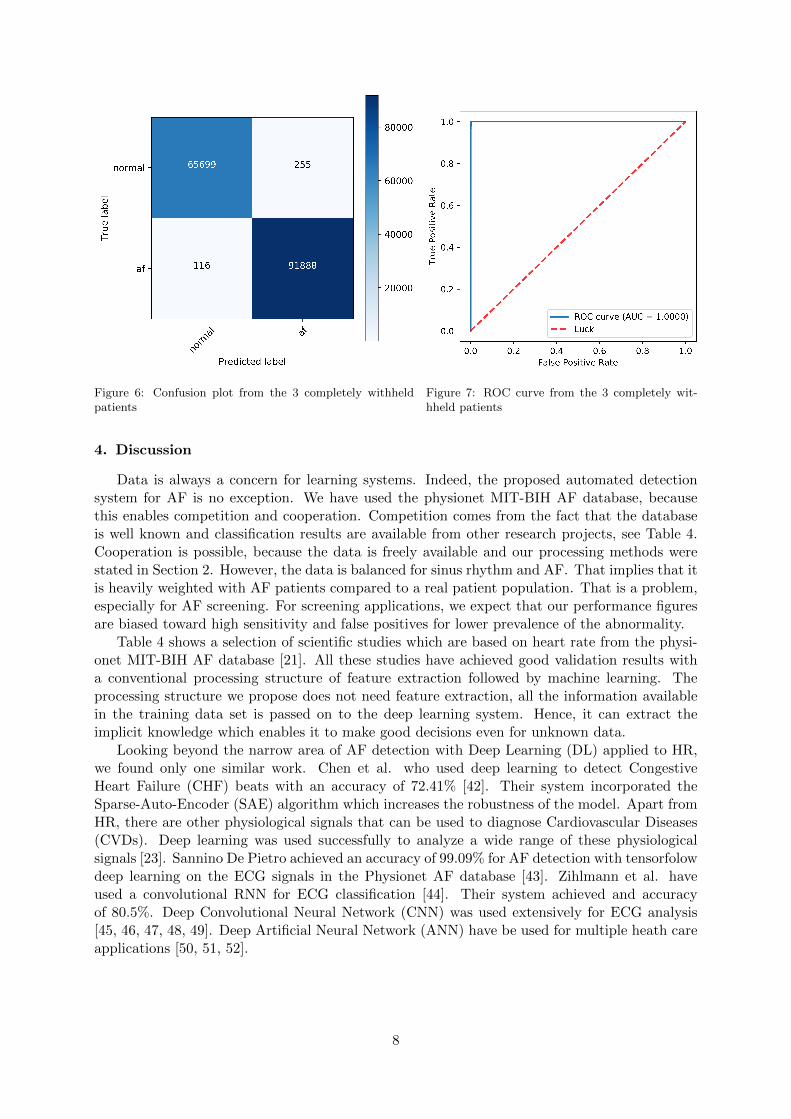
Figure 6: Confusion plot from the 3 completely withheldpatients
Figure 7: ROC curve from the 3 completely wit-hheld patients
4. Discussion
Data is always a concern for learning systems. Indeed, the proposed automated detectionsystem for AF is no exception. We have used the physionet MIT-BIH AF database, becausethis enables competition and cooperation. Competition comes from the fact that the databaseis well known and classification results are available from other research projects, see Table 4.Cooperation is possible, because the data is freely available and our processing methods werestated in Section 2. However, the data is balanced for sinus rhythm and AF. That implies that itis heavily weighted with AF patients compared to a real patient population. That is a problem,especially for AF screening. For screening applications, we expect that our performance figuresare biased toward high sensitivity and false positives for lower prevalence of the abnormality.
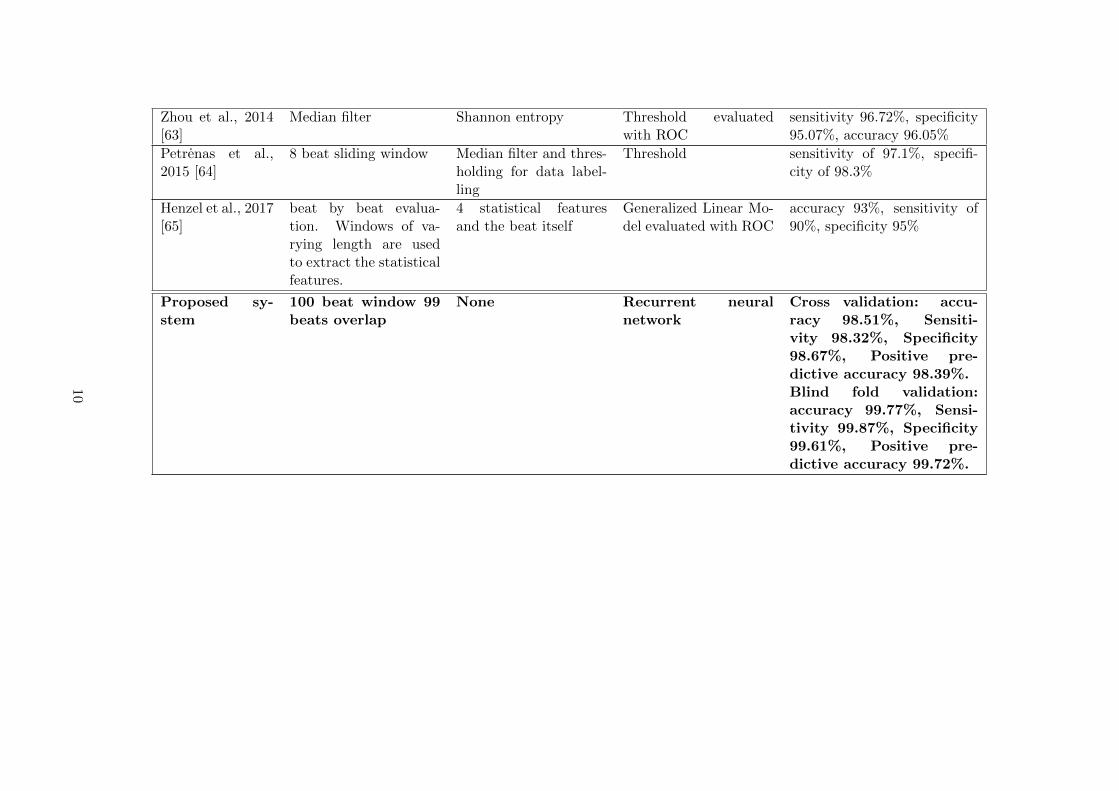
Table 4 shows a selection of scientific studies which are based on heart rate from the physi-onet MIT-BIH AF database [21]. All these studies have achieved good validation results witha conventional processing structure of feature extraction followed by machine learning. Theprocessing structure we propose does not need feature extraction, all the information availablein the training data set is passed on to the deep learning system. Hence, it can extract theimplicit knowledge which enables it to make good decisions even for unknown data.
Looking beyond the narrow area of AF detection with Deep Learning (DL) applied to HR,we found only one similar work. Chen et al. who used deep learning to detect CongestiveHeart Failure (CHF) beats with an accuracy of 72.41% [42]. Their system incorporated theSparse-Auto-Encoder (SAE) algorithm which increases the robustness of the model. Apart fromHR, there are other physiological signals that can be used to diagnose Cardiovascular Diseases(CVDs). Deep learning was used successfully to analyze a wide range of these physiologicalsignals [23]. Sannino De Pietro achieved an accuracy of 99.09% for AF detection with tensorfolowdeep learning on the ECG signals in the Physionet AF database [43]. Zihlmann et al. haveused a convolutional RNN for ECG classification [44]. Their system achieved and accuracyof 80.5%. Deep Convolutional Neural Network (CNN) was used extensively for ECG analysis[45, 46, 47, 48, 49]. Deep Artificial Neural Network (ANN) have be used for multiple heath careapplications [50, 51, 52].
8
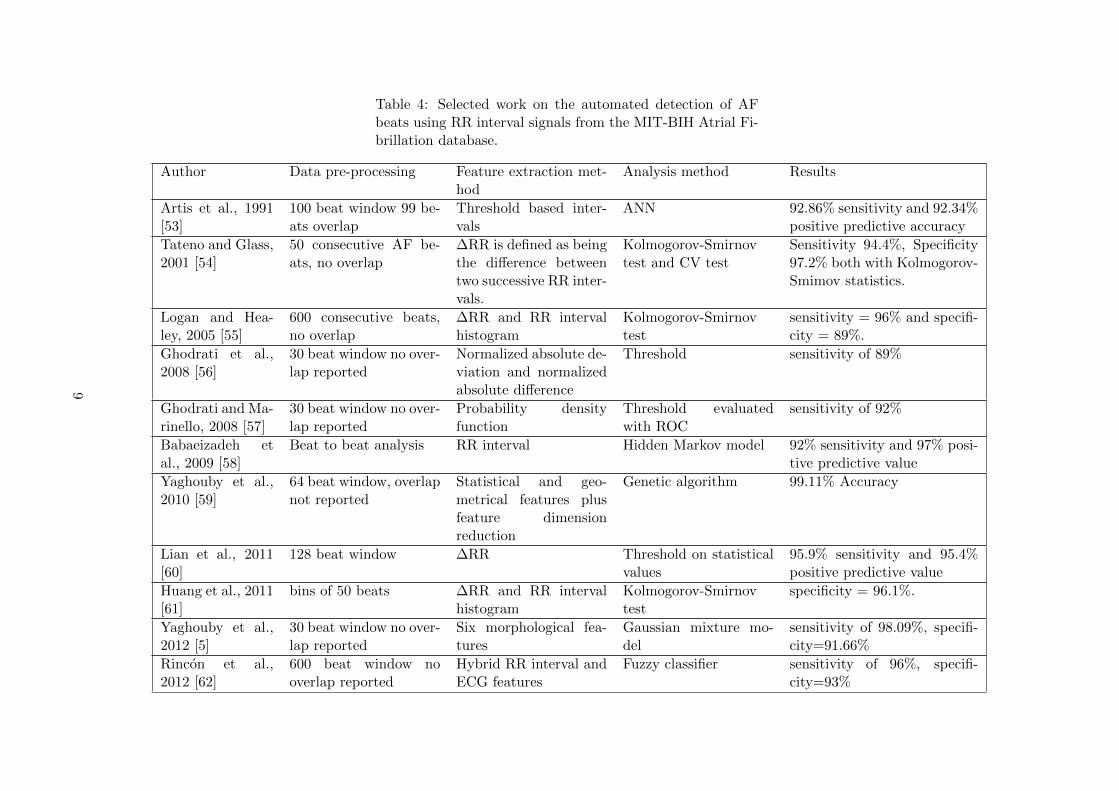
Table 4: Selected work on the automated detection of AFbeats using RR interval signals from the MIT-BIH Atrial Fi-brillation database.
Author Data pre-processing Feature extraction met-hod
Analysis method Results
Artis et al., 1991[53]
100 beat window 99 be-ats overlap
Threshold based inter-vals
ANN 92.86% sensitivity and 92.34%positive predictive accuracy
Tateno and Glass,2001 [54]
50 consecutive AF be-ats, no overlap
∆RR is defined as beingthe difference betweentwo successive RR inter-vals.
Kolmogorov-Smirnovtest and CV test
Sensitivity 94.4%, Specificity97.2% both with Kolmogorov-Smimov statistics.
Logan and Hea-ley, 2005 [55]
600 consecutive beats,no overlap
∆RR and RR intervalhistogram
Kolmogorov-Smirnovtest
sensitivity = 96% and specifi-city = 89%.
Ghodrati et al.,2008 [56]
30 beat window no over-lap reported
Normalized absolute de-viation and normalizedabsolute difference
Threshold sensitivity of 89%
Ghodrati and Ma-rinello, 2008 [57]
30 beat window no over-lap reported
Probability densityfunction
Threshold evaluatedwith ROC
sensitivity of 92%
Babaeizadeh etal., 2009 [58]
Beat to beat analysis RR interval Hidden Markov model 92% sensitivity and 97% posi-tive predictive value
Yaghouby et al.,2010 [59]
64 beat window, overlapnot reported
Statistical and geo-metrical features plusfeature dimensionreduction
Genetic algorithm 99.11% Accuracy
Lian et al., 2011[60]
128 beat window ∆RR Threshold on statisticalvalues
95.9% sensitivity and 95.4%positive predictive value
Huang et al., 2011[61]
bins of 50 beats ∆RR and RR intervalhistogram
Kolmogorov-Smirnovtest
specificity = 96.1%.
Yaghouby et al.,2012 [5]
30 beat window no over-lap reported
Six morphological fea-tures
Gaussian mixture mo-del
sensitivity of 98.09%, specifi-city=91.66%
Rincon et al.,2012 [62]
600 beat window nooverlap reported
Hybrid RR interval andECG features
Fuzzy classifier sensitivity of 96%, specifi-city=93%
9
Zhou et al., 2014[63]
Median filter Shannon entropy Threshold evaluatedwith ROC
sensitivity 96.72%, specificity95.07%, accuracy 96.05%
Petrenas et al.,2015 [64]
8 beat sliding window Median filter and thres-holding for data label-ling
Threshold sensitivity of 97.1%, specifi-city of 98.3%
Henzel et al., 2017[65]
beat by beat evalua-tion. Windows of va-rying length are usedto extract the statisticalfeatures.
4 statistical featuresand the beat itself
Generalized Linear Mo-del evaluated with ROC
accuracy 93%, sensitivity of90%, specificity 95%
Proposed sy-stem
100 beat window 99beats overlap
None Recurrent neuralnetwork
Cross validation: accu-racy 98.51%, Sensiti-vity 98.32%, Specificity98.67%, Positive pre-dictive accuracy 98.39%.Blind fold validation:accuracy 99.77%, Sensi-tivity 99.87%, Specificity99.61%, Positive pre-dictive accuracy 99.72%.
10
4.1. Limitations
A limitation of our study comes from the fact that we have used data blocks with 100 RRintervals. These short segments might not capture all the nonlinear properties of the signaladequately and therefore the deep learning system does not get all the information. However,the choice of a 100 beat window was made with regard to a practical real-time diagnosis system.This 100 beat window would allow for minimal latency in any automated alert of AF detectionvia heart rate monitoring. Another shortcoming is the limited number of subjects. More datafrom a larger subject range would lead to the extraction of more implicit knowledge. In turnthat might result in a model that is even more robust. A problem we encountered was the factthat it takes design time to train the model. During the design phase, training speed is majorlimitation, because it prevented us to explore all possible network parameters. Even massivelyparallel5 GPU processors could not speed up the processing sufficiently.
Another limitation of our study comes from instrumentation. We have used RR intervalsthat were extracted from ECG signals. However, to realize the advantages of HR the signalhas to be measured directly, i.e. not being extracted from ECG. Appropriate instrumentationhas to ensure that these measurements reflect the RR intervals in the same way as if they wereextracted from ECG. In future, we plan to investigate the impact of the heart rate sensor.
4.2. Future work
The future work is centered on the long-term monitoring of the human heart [66]. Internet ofThings (IoT) technology is needed to facilitate data transfer and disseminate control messages[67]. Apart from the technology aspects, there is also much scope to acquire more depth andbreadth through academic research. More depth is achieved by detecting different AF types andpredict the onset of AF. Having cost effective long-term monitoring systems allows us to extendthe breath of research by investigating a range of different heart diseases, such as CHF [68].Apart from addressing these medical engineering aspects, further work is planned to conducta full ablation study to investigate the importance of individual architectural and algorithmiccomponents of the proposed model (such as the number of LSTM cells, optimisers, learningrates, and fully connected classification layer sizes).
5. Conclusion
Our approach to AF detection in HR signals is straight forward: we partition the datawith a sliding window and feed the resulting blocks into a deep learning system. There isno need for information reduction through feature extraction. During the training phase, thelearning algorithm can extract all the available information to create the implicit knowledgewhich underpins the subsequent decision-making processes. As a consequence, the proposeddecision support system delivers accurate and robust results. To be specific, the system achievedan accuracy of 98.51% with 10-fold cross-validation. The 99.77% blind fold accuracy indicatesa good robustness. These results are similar to performance measures that were reported forECG based CAD systems. However, HR measurements are more convenient for the patient andthey can be carried out for longer.
Having an accurate and robust AF detection system using RR intervals is a prerequisite forlong-term monitoring. The goal for such long-term monitoring is to produce more data whichholds more information about the patient health. Deep learning can help us to make sense ofthat data and thereby reduce the workload of clinicians. Furthermore, such computer aideddiagnosis reduces the risk of inter- and intra-observer variability. Computer based systems donot suffer from fatigue and the results are reproducible. Furthermore, the learning algorithm
5The term ‘massively parallel’ refers to the use of a large number of processors
11
model can be updated, such that the decision support system improves over time. These systemshave the potential to benefit patients by delivering an accurate diagnosis as well as unintrusiveand uninterrupted treatment monitoring. We hope that this work is the first in a series ofscientific studies on deep learning for AF detection.
Acknowledgements
Funding: We gratefully acknowledge the support of NVIDIA Corporation with the donationof the Quadro M5000 GPU used in this research. No external funding sources supported thisstudy.
Competing interests: The authors declare that they have no conflict of interest.Statements of ethical approval: All the data for this study comes from the well known MIT-
BIH Atrial Fibrillation Database. The authors did not undertake measurements that involvedhuman or animal participants.
Acronyms
AF Atrial FibrillationANN Artificial Neural NetworkAUC Area Under CurveCAD Computer-Aided DiagnosisCHF Congestive Heart FailureCNN Convolutional Neural NetworkCVD Cardiovascular DiseaseDL Deep LearningECG ElectrocardiogramGPU Graphics Processing UnitHR Heart RateIoT Internet of ThingsLSTM Long Short-Term MemoryReLU Rectified Linear UnitRNN Recurrent Neural NetworkROC Receiver Operating CharacteristicSAE Sparse-Auto-EncoderSVM Support Vector Machine
References
[1] S. T. Mathew, J. Patel, S. Joseph, Atrial fibrillation: mechanistic insights and treatmentoptions, European journal of internal medicine 20 (2009) 672–681.
[2] S. Petrutiu, J. Ng, G. M. Nijm, H. Al-Angari, S. Swiryn, A. V. Sahakian, Atrial fibrillationand waveform characterization, IEEE engineering in medicine and biology magazine 25(2006) 24–30.
[3] E. J. Benjamin, P. A. Wolf, R. B. D’Agostino, H. Silbershatz, W. B. Kannel, D. Levy,Impact of atrial fibrillation on the risk of death: the framingham heart study, Circulation98 (1998) 946–952.
[4] G. Y. Lip, R. Nieuwlaat, R. Pisters, D. A. Lane, H. J. Crijns, Refining clinical risk stra-tification for predicting stroke and thromboembolism in atrial fibrillation using a novelrisk factor-based approach: the euro heart survey on atrial fibrillation, Chest 137 (2010)263–272.
12
[5] F. Yaghouby, A. Ayatollahi, R. Bahramali, M. Yaghouby, Robust genetic programming-based detection of atrial fibrillation using rr intervals, Expert Systems 29 (2012) 183–199.
[6] P. A. Wolf, R. D. Abbott, W. B. Kannel, Atrial fibrillation as an independent risk factorfor stroke: the framingham study., Stroke 22 (1991) 983–988.
[7] P.-S. Yang, S. Ryu, D. Kim, E. Jang, H. T. Yu, T.-H. Kim, J. Hwang, B. Joung, G. Y.Lip, Variations of prevalence and incidence of atrial fibrillation and oral anticoagulationrate according to different analysis approaches, Scientific Reports 8 (2018) 6856.
[8] T. Hennig, P. Maass, J. Hayano, S. Heinrichs, Exponential distribution of long heart beatintervals during atrial fibrillation and their relevance for white noise behaviour in powerspectrum, Journal of biological physics 32 (2006) 383–392.
[9] S. Somerville, J. Somerville, P. Croft, M. Lewis, Atrial fibrillation: a comparison of methodsto identify cases in general practice., Br J Gen Pract 50 (2000) 727–729.
[10] N. Lowres, L. Neubeck, J. Redfern, S. B. Freedman, Screening to identify unknown atrialfibrillation, Thrombosis and haemostasis 110 (2013) 213–222.
[11] R. G. Hart, L. A. Pearce, M. I. Aguilar, Meta-analysis: antithrombotic therapy to preventstroke in patients who have nonvalvular atrial fibrillation, Annals of internal medicine 146(2007) 857–867.
[12] O. Faust, U. R. Acharya, T. Tamura, Formal design methods for reliable computer-aideddiagnosis: a review, IEEE reviews in biomedical engineering 5 (2012) 15–28.
[13] O. Faust, R. Acharya, S. Krishnan, L. C. Min, Analysis of cardiac signals using spatialfilling index and time-frequency domain, BioMedical Engineering OnLine 3 (2004) 30.
[14] R. J. Martis, U. R. Acharya, H. Adeli, H. Prasad, J. H. Tan, K. C. Chua, C. L. Too,S. W. J. Yeo, L. Tong, Computer aided diagnosis of atrial arrhythmia using dimensionalityreduction methods on transform domain representation, Biomedical signal processing andcontrol 13 (2014) 295–305.
[15] R. J. Martis, U. R. Acharya, L. C. Min, Ecg beat classification using pca, lda, ica anddiscrete wavelet transform, Biomedical Signal Processing and Control 8 (2013) 437–448.
[16] M. Kumar, R. B. Pachori, U. R. Acharya, Automated diagnosis of atrial fibrillation ecgsignals using entropy features extracted from flexible analytic wavelet transform, Biocyber-netics and Biomedical Engineering (2018) 1–10.
[17] J. Rodenas, M. Garcıa, R. Alcaraz, J. J. Rieta, Wavelet entropy automatically detectsepisodes of atrial fibrillation from single-lead electrocardiograms, Entropy 17 (2015) 6179–6199.
[18] T. Hanke, E. I. Charitos, U. Stierle, A. Karluss, E. Kraatz, B. Graf, A. Hagemann, M. Mi-sfeld, H. H. Sievers, Twenty-four–hour holter monitor follow-up does not provide accurateheart rhythm status after surgical atrial fibrillation ablation therapy: up to 12 months ex-perience with a novel permanently implantable heart rhythm monitor device, Circulation120 (2009) S177–S184.
[19] A. F. Members, V. Fuster, L. E. Ryden, D. S. Cannom, H. J. Crijns, A. B. Curtis, K. A.Ellenbogen, J. L. Halperin, J.-Y. Le Heuzey, G. N. Kay, et al., Acc/aha/esc 2006 guidelinesfor the management of patients with atrial fibrillation–executive summary: A report of the
13
american college of cardiology/american heart association task force on practice guidelinesand the european society of cardiology committee for practice guidelines (writing committeeto revise the 2001 guidelines for the management of patients with atrial fibrillation) deve-loped in collaboration with the european heart rhythm association and the heart rhythmsociety, European Heart Journal 27 (2006) 1979–2030.
[20] P. Langley, M. Dewhurst, L. Di Marco, P. Adams, F. Dewhurst, J. Mwita, R. Walker,A. Murray, Accuracy of algorithms for detection of atrial fibrillation from short durationbeat interval recordings, Medical Engineering and Physics 34 (2012) 1441–1447.
[21] N. Larburu, T. Lopetegi, I. Romero, Comparative study of algorithms for atrial fibrillationdetection, in: Computing in Cardiology, 2011, IEEE, pp. 265–268.
[22] K. Tateno, L. Glass, A method for detection of atrial fibrillation using rr intervals, in:Computers in Cardiology 2000, IEEE, pp. 391–394.
[23] O. Faust, Y. Hagiwara, T. J. Hong, O. S. Lih, U. R. Acharya, Deep learning for healthcareapplications based on physiological signals: a review, Computer Methods and Programs inBiomedicine 161 (2018) 1–13.
[24] G. Moody, A new method for detecting atrial fibrillation using rr intervals, Computers inCardiology (1983) 227–230.
[25] A. L. Goldberger, L. A. Amaral, L. Glass, J. M. Hausdorff, P. C. Ivanov, R. G. Mark, J. E.Mietus, G. B. Moody, C.-K. Peng, H. E. Stanley, Physiobank, physiotoolkit, and physionet,Circulation 101 (2000) e215–e220.
[26] O. Faust, Documenting and predicting topic changes in computers in biology and medicine:A bibliometric keyword analysis from 1990 to 2017, Informatics in Medicine Unlocked 11(2018) 15–27.
[27] J. Schmidhuber, Deep learning in neural networks: An overview, Neural networks 61 (2015)85–117.
[28] Y. Bengio, P. Simard, P. Frasconi, Learning long-term dependencies with gradient descentis difficult, IEEE transactions on neural networks 5 (1994) 157–166.
[29] S. Hochreiter, J. Schmidhuber, Long short-term memory, Neural computation 9 (1997)1735–1780.
[30] J. H. Tan, Y. Hagiwara, W. Pang, I. Lim, S. L. Oh, M. Adam, R. San Tan, M. Chen, U. R.Acharya, Application of stacked convolutional and long short-term memory network foraccurate identification of cad ecg signals, Computers in Biology and Medicine (2018).
[31] R. Pascanu, C. Gulcehre, K. Cho, Y. Bengio, How to construct deep recurrent neuralnetworks, arXiv preprint arXiv:1312.6026 (2013).
[32] B. A. Pearlmutter, Learning state space trajectories in recurrent neural networks, NeuralComputation 1 (1989) 263–269.
[33] M. Schuster, K. K. Paliwal, Bidirectional recurrent neural networks, IEEE Transactionson Signal Processing 45 (1997) 2673–2681.
[34] A. Graves, J. Schmidhuber, Framewise phoneme classification with bidirectional lstm andother neural network architectures, Neural Networks 18 (2005) 602–610.
14
[35] F. Chollet, et al., Keras: Deep learning library for theano and tensorflow, URL:https://keras. io/k 7 (2015) 8.
[36] A. Gulli, S. Pal, Deep Learning with Keras, Packt Publishing Ltd, 2017.
[37] M. Abadi, P. Barham, J. Chen, Z. Chen, A. Davis, J. Dean, M. Devin, S. Ghemawat,G. Irving, M. Isard, et al., Tensorflow: A system for large-scale machine learning., in:OSDI, volume 16, pp. 265–283.
[38] X. Glorot, Y. Bengio, Understanding the difficulty of training deep feedforward neuralnetworks, in: Proceedings of the thirteenth international conference on artificial intelligenceand statistics, pp. 249–256.
[39] A. Radford, L. Metz, S. Chintala, Unsupervised representation learning with deep convo-lutional generative adversarial networks, arXiv preprint arXiv:1511.06434 (2015).
[40] Y. Gal, Z. Ghahramani, Bayesian convolutional neural networks with bernoulli approximatevariational inference, arXiv preprint arXiv:1506.02158 (2015).
[41] N. Srivastava, G. Hinton, A. Krizhevsky, I. Sutskever, R. Salakhutdinov, Dropout: Asimple way to prevent neural networks from overfitting, The Journal of Machine LearningResearch 15 (2014) 1929–1958.
[42] W. Chen, G. Liu, S. Su, Q. Jiang, H. Nguyen, A chf detection method based on deeplearning with rr intervals, in: Engineering in Medicine and Biology Society (EMBC), 201739th Annual International Conference of the IEEE, IEEE, pp. 3369–3372.
[43] G. Sannino, G. De Pietro, A deep learning approach for ecg-based heartbeat classificationfor arrhythmia detection, Future Generation Computer Systems (2018) Article in press.
[44] M. Zihlmann, D. Perekrestenko, M. Tschannen, Convolutional recurrent neural networksfor electrocardiogram classification, arXiv preprint arXiv:1710.06122 (2017).
[45] U. R. Acharya, S. L. Oh, Y. Hagiwara, J. H. Tan, M. Adam, A. Gertych, R. San Tan, Adeep convolutional neural network model to classify heartbeats, Computers in biology andmedicine 89 (2017) 389–396.
[46] U. R. Acharya, H. Fujita, S. L. Oh, Y. Hagiwara, J. H. Tan, M. Adam, Application ofdeep convolutional neural network for automated detection of myocardial infarction usingecg signals, Information Sciences 415 (2017) 190–198.
[47] U. R. Acharya, H. Fujita, O. S. Lih, Y. Hagiwara, J. H. Tan, M. Adam, Automated detectionof arrhythmias using different intervals of tachycardia ecg segments with convolutionalneural network, Information sciences 405 (2017) 81–90.
[48] U. R. Acharya, H. Fujita, O. S. Lih, M. Adam, J. H. Tan, C. K. Chua, Automated detectionof coronary artery disease using different durations of ecg segments with convolutionalneural network, Knowledge-Based Systems 132 (2017) 62–71.
[49] U. R. Acharya, H. Fujita, S. L. Oh, Y. Hagiwara, J. H. Tan, M. Adam, R. S. Tan, Deepconvolutional neural network for the automated diagnosis of congestive heart failure usingecg signals, Applied Intelligence (2018) 1–12.
[50] A. Shenfield, S. Rostami, Multi-objective evolution of artificial neural networks in multi-class medical diagnosis problems with class imbalance, in: Computational Intelligence inBioinformatics and Computational Biology (CIBCB), 2017 IEEE Conference on, IEEE, pp.1–8.
15
[51] A. Shenfield, M. Rodrigues, H. Nooreldeen, J. Moreno-Cuesta, A novel hybrid differentialevolution strategy applied to classifier design for mortality prediction in adult critical careadmissions, in: Computational Intelligence in Bioinformatics and Computational Biology(CIBCB), 2017 IEEE Conference on, IEEE, pp. 1–7.
[52] A. Shenfield, S. Rostami, A multi objective approach to evolving artificial neural networksfor coronary heart disease classification, in: Computational Intelligence in Bioinformaticsand Computational Biology (CIBCB), 2015 IEEE Conference on, IEEE, pp. 1–8.
[53] S. G. Artis, R. Mark, G. Moody, Detection of atrial fibrillation using artificial neuralnetworks, in: Computers in Cardiology 1991, Proceedings., IEEE, pp. 173–176.
[54] K. Tateno, L. Glass, Automatic detection of atrial fibrillation using the coefficient ofvariation and density histograms of rr and δrr intervals, Medical and Biological Engineeringand Computing 39 (2001) 664–671.
[55] B. Logan, J. Healey, Robust detection of atrial fibrillation for a long term telemonitoringsystem, in: Computers in Cardiology, 2005, IEEE, pp. 619–622.
[56] A. Ghodrati, B. Murray, S. Marinello, Rr interval analysis for detection of atrial fibrillationin ecg monitors., in: Conference proceedings:... Annual International Conference of theIEEE Engineering in Medicine and Biology Society. IEEE Engineering in Medicine andBiology Society. Annual Conference, volume 2008, p. 601.
[57] A. Ghodrati, S. Marinello, Statistical analysis of rr interval irregularities for detection ofatrial fibrillation, in: Computers in Cardiology, 2008, IEEE, pp. 1057–1060.
[58] S. Babaeizadeh, R. E. Gregg, E. D. Helfenbein, J. M. Lindauer, S. H. Zhou, Improvementsin atrial fibrillation detection for real-time monitoring, Journal of electrocardiology 42(2009) 522–526.
[59] F. Yaghouby, A. Ayatollahi, R. Bahramali, M. Yaghouby, A. H. Alavi, Towards automaticdetection of atrial fibrillation: A hybrid computational approach, Computers in Biologyand Medicine 40 (2010) 919–930.
[60] J. Lian, L. Wang, D. Muessig, A simple method to detect atrial fibrillation using rr intervals,American journal of cardiology 107 (2011) 1494–1497.
[61] C. Huang, S. Ye, H. Chen, D. Li, F. He, Y. Tu, A novel method for detection of thetransition between atrial fibrillation and sinus rhythm, IEEE Transactions on BiomedicalEngineering 58 (2011) 1113–1119.
[62] F. Rincon, P. R. Grassi, N. Khaled, D. Atienza, D. Sciuto, Automated real-time atrialfibrillation detection on a wearable wireless sensor platform, in: Engineering in Medicineand Biology Society (EMBC), 2012 Annual International Conference of the IEEE, IEEE,pp. 2472–2475.
[63] X. Zhou, H. Ding, B. Ung, E. Pickwell-MacPherson, Y. Zhang, Automatic online detectionof atrial fibrillation based on symbolic dynamics and shannon entropy, Biomedical engi-neering online 13 (2014) 18.
[64] A. Petrenas, V. Marozas, L. Sornmo, Low-complexity detection of atrial fibrillation incontinuous long-term monitoring, Computers in biology and medicine 65 (2015) 184–191.
16

[65] N. Henzel, J. Wrobel, K. Horoba, Atrial fibrillation episodes detection based on classificationof heart rate derived features, in: Mixed Design of Integrated Circuits and Systems, 2017MIXDES-24th International Conference, IEEE, pp. 571–576.
[66] U. R. Acharya, O. Faust, D. N. Ghista, S. V. Sree, A. P. C. Alvin, S. Chattopadhyay, T.-C.Lim, E. Y.-K. Ng, W. Yu, A systems approach to cardiac health diagnosis, Journal ofMedical Imaging and Health Informatics 3 (2013) 261–267.
[67] M. S. Hossain, G. Muhammad, Cloud-assisted industrial internet of things (iiot)–enabledframework for health monitoring, Computer Networks 101 (2016) 192–202.
[68] U. R. Acharya, O. Faust, V. Sree, G. Swapna, R. J. Martis, N. A. Kadri, J. S. Suri, Linearand nonlinear analysis of normal and cad-affected heart rate signals, Computer methodsand programs in biomedicine 113 (2014) 55–68.
17