Embed Size (px)
Citation preview

Automated Capacity Planning and Support for Enterprise Applications
Dharmesh ThakkarSchool of Computing, Queen’s University, Canada

Performance Activitiesin The Waterfall SDLC
Requirements
Design
Implementation
Verification
MaintenanceVerification: Performance test need to be conducted to verify that the required performance objectives are met
2

Performance Activitiesin SDLC
Requirements
Design
Implementation
Verification
Maintenance
Maintenance: Continuous monitoring, capacity planning and tuning need to be done to ensure that the system continues to meet the performance objectives
3
Requirements
Design
Implementation
Verification
Maintenance
Requirements
Design
Implementation
Verification Phase Performance Activities
Maintenance Phase Performance Activities
PerformanceAnalyst
Execution Logs
Customer Engagement Repository
Customer
CustomerSupportAnalyst
PerformanceModel
PerformanceTests
LoadTests
StressTests
Deployment
Performance Issues!
1
2
3
3
4
4
5
6
6 7
8
9
9
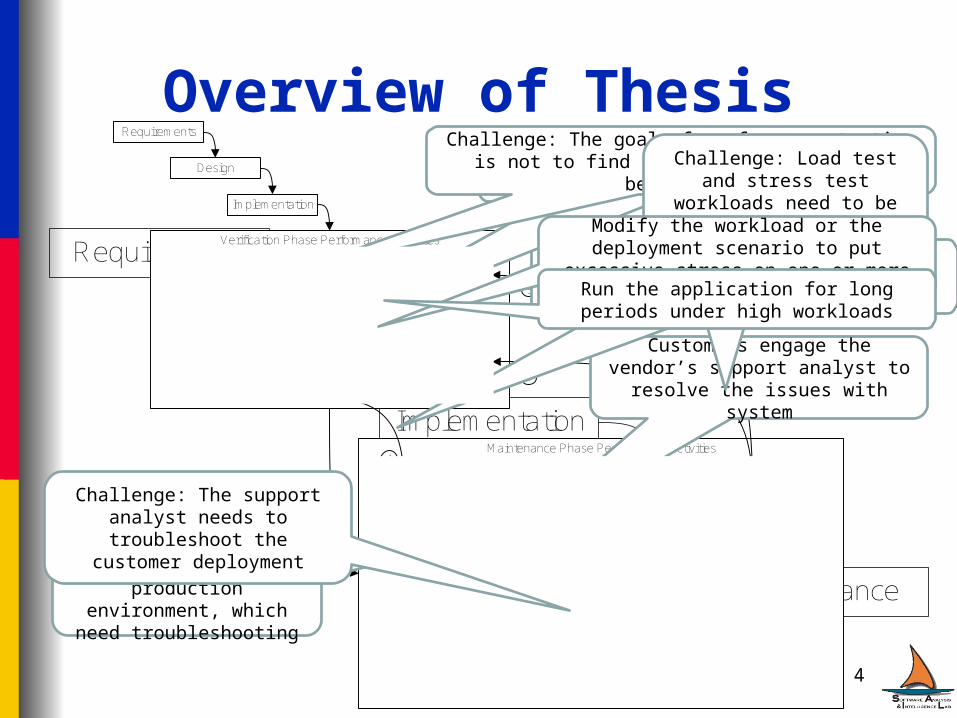
Overview of Thesis
Customers engage the vendor’s support analyst to resolve the issues
with system
Performance issues arise in customers’ production
environment, which need troubleshooting
The capacity calculator helps customer determine required hardware resources to
support the anticipated workload
Build a capacity calculator based on the performance model
Challenge: The goal of performance testing is not to find bugs, but to establish benchmarks
4
Challenge: The support analyst needs to troubleshoot the
customer deployment
Challenge: Load test and stress test workloads need to
be compared against the customer workloadsModify the workload or the deployment
scenario to put excessive stress on one or more system resourcesRun the application for long periods under
high workloads

Overview of Thesis:Our ContributionsRequirements
Design
Implementation
Verification Phase Performance Activities
Maintenance Phase Performance Activities
PerformanceAnalyst
Execution Logs
Customer Engagement Repository
Customer
CustomerSupportAnalyst
PerformanceModel
PerformanceTests
LoadTests
StressTests
Deployment
Performance Issues!
1
2
3
3
4
4
5
6
6 7
8
9
9
Process Carrying Our Contribution
Regular Process
Requirements
Design
Implementation
Verification Phase Performance Activities
Maintenance Phase Performance Activities
PerformanceAnalyst
Execution Logs
Customer Engagement Repository
Customer
CustomerSupportAnalyst
PerformanceModel
PerformanceTests
LoadTests
StressTests
Deployment
Performance Issues!
1
2
3
3
4
4
5
6
6 7
8
9
9
Process Carrying Our Contribution
Regular Process
A technique for helping troubleshoot performance issues by retrieving relevant report from a customer engagement repository
Presented at the International Conference on Software Maintenance (ICSM 2008) Beijing, China.Acceptance rate: 26%
5
A framework for building performance model based capacity calculator
Presented at the Workshop on Software and Performance (WoSP 2008) Princeton, NJ.Acceptance rate: 38%

Verification Phase:An Example of A Capacity Calculator
6
Frequency (transactions per hour)
20 40 60 80
Concurrency 250
Creating Customer Profile T111 T112 T113 T114Customer Login T121 T122 T123 T124Search Title T131 T132 T133 T134Purchase Title T141 T142 T143 T144
Concurrency 500
Creating Customer Profile T211 T212 T213 T214Customer Login T221 T222 T223 T224Search Title T231 T232 T233 T234Purchase Title T241 T242 T243 T244
Concurrency 1000
Creating Customer Profile T311 T312 T313 T314Customer Login T321 T322 T323 T324Search Title T331 T332 T333 T334Purchase Title T341 T342 T343 T344
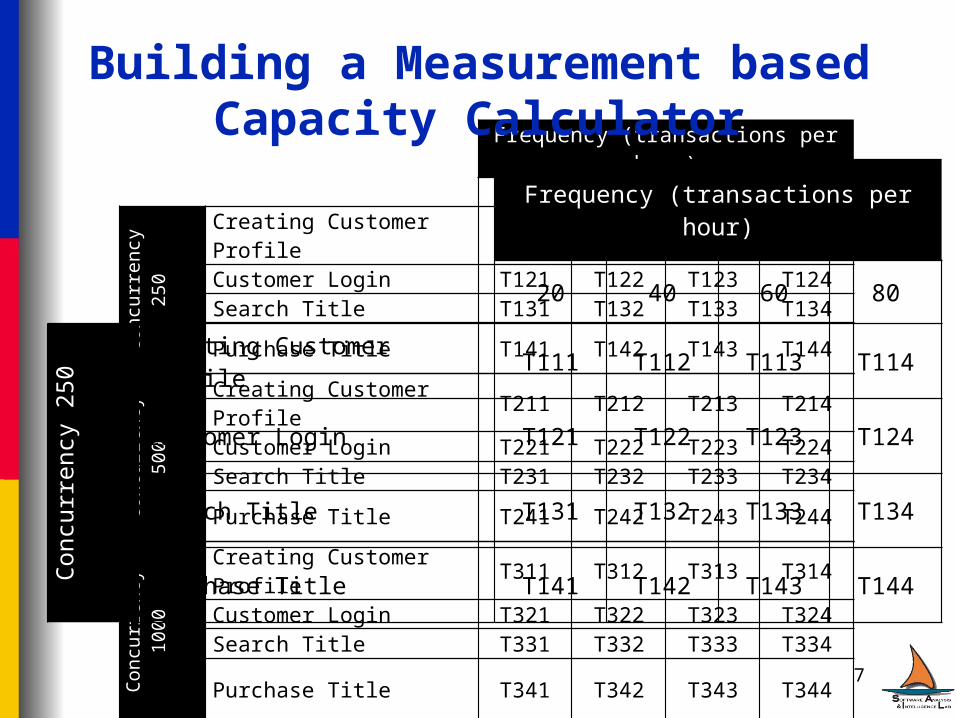
Concurrency 1500
Creating Customer Profile T411 T412 T413 T414Customer Login T421 T422 T423 T424Search Title T431 T432 T433 T434Purchase Title T441 T442 T443 T444
Building a Measurement based Capacity Calculator
Frequency (transactions per hour)
20 40 60 80
Concurrency 250
Creating Customer Profile T111 T112 T113 T114
Customer Login T121 T122 T123 T124
Search Title T131 T132 T133 T134
Purchase Title T141 T142 T143 T144
7

Performance Modeling Challenges
■ Large number of tests to be executed■ Limited time for performance
modeling■ Manual process of setup, execution
and analysis■ Risk of error and repeating the full
modeling process
8

Addressing the Challenges of Performance Modeling
■We created the framework to:–Automate the process–Speed up the process–Focus research on specific
areas
9

Framework for Building Model based Capacity Calculator
Test Enumeration
Test Reduction
EnvironmentSetup
TestAnalysis
Test Execution
Test Transition
Control Flow Data Flow
PerformanceData
PerformanceModel
Model Building
■ Case Studies:– Dell DVD Store– A large enterprise application
10

Customization Cost
Test Enumeration
Test Reduction
EnvironmentSetup
TestAnalysis
Test Execution
Test Transition
PerformanceModel
Model Building
Minimal Minimal Minimal Minimal Minimal Minimal Minimal AnotherBuild
Extensive Reasonable Extensive Extensive Reasonable Reasonable Minimal Another Application
11

Maintenance Phase:Customer Support
ApplicationSupportAnalyst
SymptomsIdentified Problems
SolutionsExecution
Logs
Customer Engagement
Report
Customer Engagement Repository
Create Store
Contains
Attempted Workarounds
12

Retrieving Relevant Reports
■ State of Practice:– No systematic techniques to retrieve and use
information for future engagements– Keyword searching is limited:
• depends on the search skills and experience of the analyst and peculiarity of the problem
13

Customer SupportProblem Statement
■ We want to find customers with similar operational and problem profiles
■ We can reuse prior solutions and knowledge
Heavy Email, Light Web, Light calendar Light Email, Light Web, Light calendar Light Email, Heavy Web, Light calendar Heavy Email, Heavy Web, No calendar Light Email, Light Web, Heavy calendar
Other Customers
CompareNew
Customer Engagement
14

Using Logs forCustomer Support
■ Execution logs are readily available and contain – Operational Profile: usage patterns (heavy
users of email from device, or to device, or light users of calendar, etc.)
– Signature Profile: specific error line patterns (connection timeout, database limits, messages queued up, etc.)
■ Find the most similar profile
15

Execution Logs
■ Contain time-stamped sequence ofevents at runtime
■ Readily available representatives of both feature executions and problems
<time> Queuing new mail msgid=ABC threadid=XYZ<time> Instant message. Sending packet to client msgid=ABC threadid=XYZ<time> New meeting request msgid=ABC threadid=XYZ<time> Client established IMAP session emailid=ABC threadid=XYZ<time> Client disconnected. Cannot deliver msgid=ABC threadid=XYZ<time> New contact in address book emailid=ABC threadid=XYZ<time> User initiated appointment deletion emailid=ABC threadid=XYZ
16
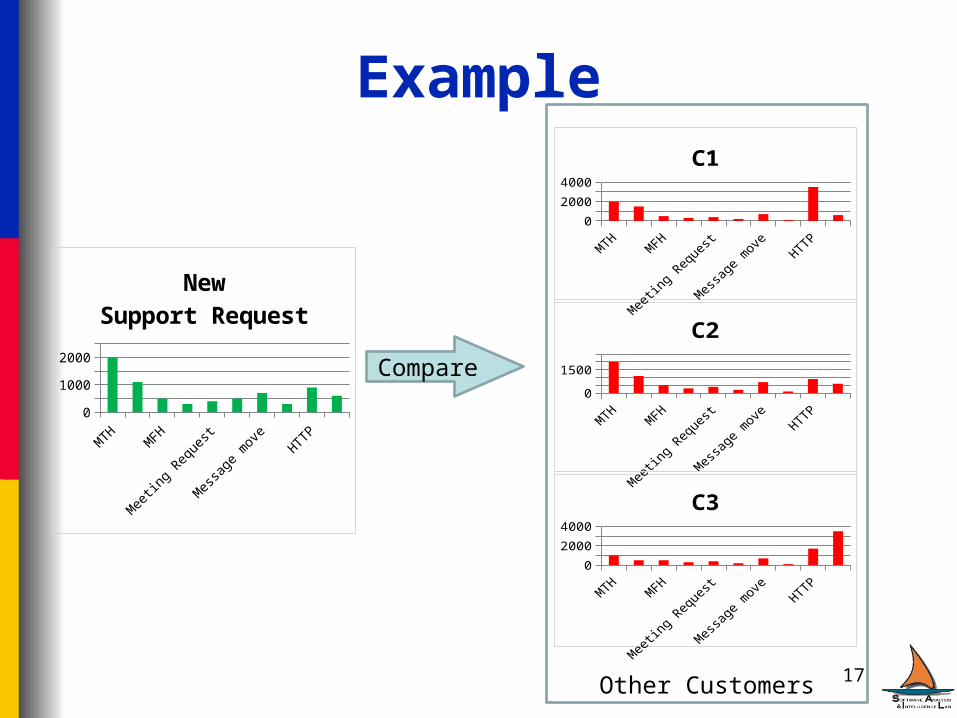
Example
010002000
C2
0
2000
4000
C1
0
2000
4000
C3
MTH
MTH m
ore
requ
ests
MFH
View C
alend
ar
Mee
ting
Reque
st
Appoin
tmen
t syn
c
Mes
sage
mov
e
Conta
cts
HTTPM
DS
0500
1000150020002500
NewSupport Request
Other Customers
Compare
17

Technique to Retrieve Relevant Engagement Reports
CustomerExecution
LogsConvert Log
Lines to Events
Compare Event
Distributions
Customer Engagement Repository
Compare Event
Distributions
Identify Signature
Events
Signature Event Distribution
OUTPUT RESULT SET
Closest Customer Engagement Reports
wrtSignature Profile
Closest Customer Engagement Reports
wrtOperational Profile
Event Distribution
18

Case Studies
■ Case Study I– Dell DVD Store open source application– Code instrumentation done for event logging– Built the execution log repository by applying
synthetic workloads, changing the workload parameters each time
■ Case Study II– Globally deployed commercial application– More than 500 unique execution events
19

Case Study Results■ Dell DVD Store
– 100% precision and recall on both operational profile based and signature profile based retrieval
■ Commercial Application– 100% precision and recall for signature profile based
retrieval– Results for operational profile based retrieval:
ExperimentCount of Log Files
K-L Distance Cosine Distance
Precision Recall Precision Recall
Single Feature Group 28 67.71% 90.28% 67.71% 90.28%Multiple Feature Groups 28 60.71% 80.95% 75.00% 100.00%All Feature Groups 12 72.92% 97.22% 62.50% 83.33%Real World Log Files 12 54.17% 72.22% 68.75% 91.67%All the Log Files 80 59.93% 79.90% 56.72% 75.62%
20

Sources of Errors
■ Events that do not correspond directly to a particular operational feature, such as idle time events, server health check events, startup and shutdown events
■ Imbalance in the event logging
21
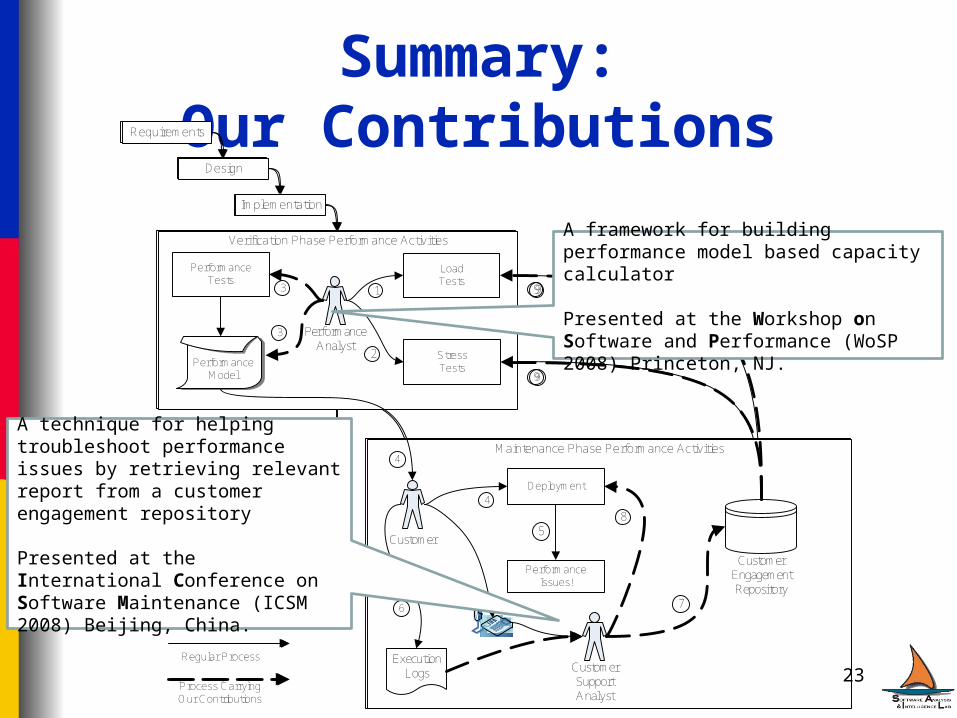
Summary:Our ContributionsRequirements
Design
Implementation
Verification Phase Performance Activities
Maintenance Phase Performance Activities
PerformanceAnalyst
Execution Logs
Customer Engagement Repository
Customer
CustomerSupportAnalyst
PerformanceModel
PerformanceTests
LoadTests
StressTests
Deployment
Performance Issues!
1
2
3
3
4
4
5
6
6 7
8
9
9
Process Carrying Our Contribution
Regular Process
Requirements
Design
Implementation
Verification Phase Performance Activities
Maintenance Phase Performance Activities
PerformanceAnalyst
Execution Logs
Customer Engagement Repository
Customer
CustomerSupportAnalyst
PerformanceModel
PerformanceTests
LoadTests
StressTests
Deployment
Performance Issues!
1
2
3
3
4
4
5
6
6 7
8
9
9
Process Carrying Our Contributions
Regular Process
A framework for building performance model based capacity calculator
Presented at the Workshop on Software and Performance (WoSP 2008) Princeton, NJ.
A technique for helping troubleshoot performance issues by retrieving relevant report from a customer engagement repository
Presented at the International Conference on Software Maintenance (ICSM 2008) Beijing, China.
23

![[XLS] · Web viewMANJUNATH NINGE GOWDA BHASKAR MANEKLAL TRIVEDI PARAGBHAI THAKKAR 13GJN4440010181 HARDIKBHAI BHARATBHAI THAKKAR 13GJN4440010182 SANJAYKUMAR RASIKLAL THAKKAR 13GJN4440010183](https://img.pdfslide.us/doc/110x75/5aa857b27f8b9a86188b6f40/xls-viewmanjunath-ninge-gowda-bhaskar-maneklal-trivedi-paragbhai-thakkar-13gjn4440010181.jpg)