Embed Size (px)
Citation preview

© 2008 Universitair Ziekenhuis Gent 1
Automated blood cell count
Veronique Stove
Clinical biologist Core lab
20 oktober 2013

© 2008 Universitair Ziekenhuis Gent 2
Quantitative
laboratory
hematology
Automation in Hematology
J. LEHNER, B. GREVE, U. CASSENS
Transfus Med Hemother 2007; 34:328-339
The CBC at the Turn of the Millenium: An Overview
P. WARD
Clin Chem 2000; 46:1215-1220

3 3 © 2008 Universitair Ziekenhuis Gent
First half of the 20th century
Blood cell counts (red cells, white cells, platelets): appropriately diluted blood samples and a ruled counting chamber (hemocytometer).
Hemoglobin concentration: colorimetrically by the cyanomethemoglobin method.
The hematocrit (packed cell volume): high speed centrifugation of a column of blood, either in a specially designed tube (the Wintrobe tube), or in sealed microcapillary tubes (ie, the "spun" hematocrit, often obtained by fingerstick blood collection).
Microscopic reticulocyte counting: based on supravital staining of cytoplasmic ribosomal RNA
The white blood cell differential: by examining and enumerating by class (eg, granulocytes, lymphocytes, monocytes) 100 to 200 individual white blood cells on a suitably stained blood smear.
Exclusively manual techniques

4 4 © 2008 Universitair Ziekenhuis Gent
First half of the 20th century
Calculated indices
MCV (fL) = ____________________ HCT (%) x 10
RBC (millions/µL)
MCH (pg/RBC) = ____________________ HGB (g/dL) x 10
RBC (millions/µL)
MCHC (g/dL) = ____________________ HGB (g/dL) x 100
HCT (%)
Maxwell Wintrobe
(1932)

5 5 © 2008 Universitair Ziekenhuis Gent
Disadvantages of manual cell counting
Laborious
Imprecise (hemocytometer)
Errors in leukocyte differential count:
Distributional error
Error due to inter-observer variability
Statistical error
Total number of cells counted
Differential 100 200 500 1000 10 000
3 0-9 1-7 1-5 2-5 2.7-3.3
6 2-13 3-11 4-9 4-8 5.5-6.5
15 8-24 10-21 12-19 12-18 14.6-15.4
40 30-51 33-48 35-45 36-44 39.5-40.5

6 6 © 2008 Universitair Ziekenhuis Gent
Wallace COULTER

7 7 © 2008 Universitair Ziekenhuis Gent
1956: Coulter impedance measurement

8 8 © 2008 Universitair Ziekenhuis Gent
1960s: Multichannel instruments
Anticoagulated whole blood samples were
aspirated into the apparatus
automatically aliquoted and diluted into RBC and WBC counting chambers (baths) for cell counting and sizing with impedance apertures
into a spectrophotometric cuvette for hemoglobin determination using the cyanmethemoglobin method.
calculations of red cell indices were automatically performed.
Towards high throughput, low cost and fast TAT with the
ability to produce immediate (STAT) results.

9 9 © 2008 Universitair Ziekenhuis Gent

10 10 © 2008 Universitair Ziekenhuis Gent
1970s: Automated platelet counting
improvement of the cell counting apertures
More accurate cell sizing
Reliable and accurate platelet counts.
Coincidence -> Hydrodynamic focussing

11 11 © 2008 Universitair Ziekenhuis Gent
1970s: Cell counting by light scattering
Hydrodynamic
focussing
(Sysmex)
Diluted blood sample
Pulse amplitude ~ Cell volume
Flow cell

12 12 © 2008 Universitair Ziekenhuis Gent
1980s: Three-part differential

13 13 © 2008 Universitair Ziekenhuis Gent
Early 1990s: Five-part differentials
PREPARATION
Selective lysis of red cells and counting of white cells
Special stains
DETECTION
Impedance technology
Direct current (DC): pulse height ~ cell volume
Radiofrequency current (RF): pulse height ~ nuclear size and density
Optical system
Scattered laser light
Fluorescence light

14 14 © 2008 Universitair Ziekenhuis Gent

15 15 © 2008 Universitair Ziekenhuis Gent
Lysis of RBC and PLT
Perforation of WBC
RNA/DNA staining
Lysis of RBC, PLT and WBC
EXCEPT Basophils
WBC
WBC

16 16 © 2008 Universitair Ziekenhuis Gent
Perforation of RBC and WBC
RNA/DNA staining
Optical PLT
Impedance PLT Immuno PLT

17 17 © 2008 Universitair Ziekenhuis Gent
Advantages of automated cell counters
Excellent analytical performance
Closed-tube analysis
No inter-observer variability
No slide distribution error
Eliminate statistical variations
Potential of reflex testing
Availability of extra parameters e.g. MCV, RDW, Ret-He, …
More efficient (> 100 analyses/hour) and cost effective than
manual method

18 18 © 2008 Universitair Ziekenhuis Gent
Analysers
Cell Dyn® (Abbott)
Coulter® LH 780 and other (Beckman Coulter)
ADVIA® 2120 and other(Siemens Diagnostics)
X-Class Hematology Systems (Sysmex)

19 19 © 2008 Universitair Ziekenhuis Gent
Cell counters Smear-stainer Tube sorter ESR analyser
Trend:
Integrated ‘lavender top’ automation system

20 20 © 2008 Universitair Ziekenhuis Gent
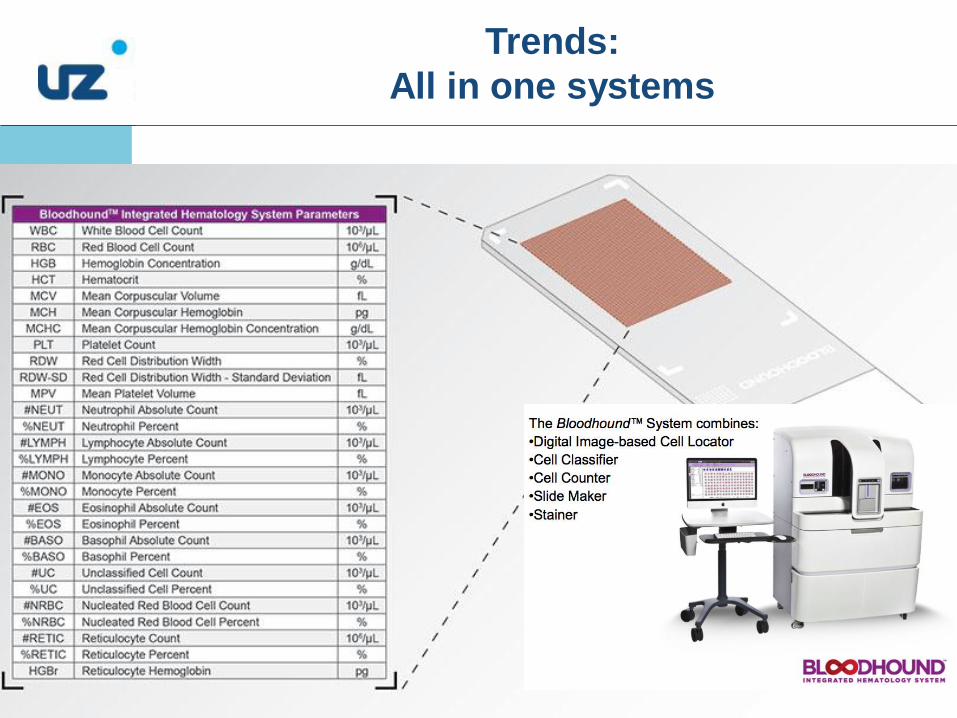
Trends:
All in one systems
Microscope Smear-stainer Analysers
21 21 © 2008 Universitair Ziekenhuis Gent
Trends:
All in one systems

© 2008 Universitair Ziekenhuis Gent 22
Key to successful use of automation

23 23 © 2008 Universitair Ziekenhuis Gent
Detection of spurious cell counts
Every hematology analyser is affected !
Operators must be aware of the characteristics of their analyser + be able to recognize and circumvent anomalous results
Specific condition of patient
Sampling
conditions
Technical problems
Total
testing
process All suspected spurious cell
counts / morphologies
should be validated with
microscopic examination of
slides
24 24 © 2008 Universitair Ziekenhuis Gent
Spurious counts and spurious results on haematology analysers: a review. Part I: platelets
M. ZANDECKI, F. GENEVIEVE, J. GERARD, A. GODON
Volume 29, Issue 1, pages 4–20, February 2007
Spurious counts and spurious results on haematology analysers: a review. Part II: white blood cells, red
blood cells, haemoglobin, red cell indices and reticulocytes
M. ZANDECKI, F. GENEVIEVE, J. GERARD, A. GODON
Volume 29, Issue 1, pages 21–41, February 2007

25 25 © 2008 Universitair Ziekenhuis Gent
Expert flagging system
Flags to signal poor reliability of quantitative results
(e.g. turbidity/Hb interference, WBC abnormal
scattergram, PLT clumps, RBC agglutination, …)
Morfology flags (blasts, IG, atypical lymph, RBC
fragments, …)
Limit check
Delta check

26 26 © 2008 Universitair Ziekenhuis Gent
http://www.islh.org/web/consensus_rules.php

27 27 © 2008 Universitair Ziekenhuis Gent
Flowchart
DM96 (CellaVision)

© 2008 Universitair Ziekenhuis Gent 28
Examples of spurious results

29 29 © 2008 Universitair Ziekenhuis Gent
Parameter Run 1 Run 2
30 min
37°C
Run 3
Plasma
exchange
WBC 5.02 5.25 6.70 10 3/uL
RBC 0.71 0.90 3.44 10 6/uL
HGB 11.9 11.9 11.6 g/dL
HCT 8.6 10.9 36.9 %
MCV 121.1 121.1 107.3 fL
MCH 167.6 132.2 33.7 pg
MCHC 138.4 109.2 31.4 g/dL
PLT 195 196 205 10 3/uL
Spurious increase in MCHC (>36g/dL)
MCHC = HGB x 100 / HCT (%) normal range: 31.9 - 34.9 g/dL
Cold agglutinins RBC aggr
MCV =
HCT / RBC x 10
MCH =
HGB / RBC x 10

30 30 © 2008 Universitair Ziekenhuis Gent
Spurious increase in MCHC (>36g/dL)
Parameter Run 1 Run 2
Plasma
exchange
WBC 12.07 13.28 10 3/uL
RBC 2.47 2.62 10 6/uL
HGB 15.9 8.8 g/dL
HCT 23.4 24.9 %
MCV 94,7 95.0 fL
MCH 64.4 33.6 pg
MCHC 67.9 35.3 g/dL
PLT 519 192 10 3/uL
Hypertriglyceridemia (>2000 mg/dL)
MCHC = HGB x 100 / HCT (%)

31 31 © 2008 Universitair Ziekenhuis Gent
Spurious PLT counts
HEMATOLOGY
Screening
Red blood cells 4.78 10E6/µL 3.79 - 5.23
Hemoglobin 14.7 g/dL 11.7 - 15.7
Hematocrit 43.7 % 34.9 - 46.9
MCV 91.4 fL 80.5 - 99.7
MCH 30.8 pg/cel 26.6 - 33.8
MCHC 33.6 g/dL RBC 33 - 36
Red cell distribution width 12.6 % 11.1 - 14.2
Platelets - 54 10E3/µL 170 - 394
Thrombocytes - citrate 198 10E3/µL
Screening thrombocytes Thrombocyte aggregates
EDTA-dependent pseudothrombocytopenia

32 32 © 2008 Universitair Ziekenhuis Gent
Spurious leukocyte counts
Lipids
(Parental nutrition)
Lysis resistant RBC
(HbC, HbS) Nucleated red
blood cells
(Neonates, Path.
circumstances)
Normal

© 2008 Universitair Ziekenhuis Gent 33
Opportunities
of automated hematology

34 34 © 2008 Universitair Ziekenhuis Gent
MCV Delta check
| Current – Previous result |
Average
Change in MCV indicates
Transfusion
Sample mishandling
Sample mix-up
Parameter TAT
(p50 percentile)
Chemistry 44 min
Coagulation 39 min
Hematology 15 min
> 5%
Example
(93 – 87) / 93 = 7%

35 35 © 2008 Universitair Ziekenhuis Gent
Extended parameters
Extended differential count
Immature granulocytes (infections, neonatal sepsis, cancer, …)
Nucleated red blood cells (neonates / numerous conditions in adults)
Hematopoietic progenitor cells (time to harvest)
RBC and Reticulocyte parameters
Immature reticulocyte fraction (IRF) - early index of erythropoeisis
Reticulocyte Hemoglobin content (Ret-He) – iron status
Hypochromic RBC
Microcytic RBC
Platelet parameters
Immature platelet fraction (IPF) – early index of thrombopoiesis

36 36 © 2008 Universitair Ziekenhuis Gent
Screening formulas
Thalassemia
Hereditary spherocytosis
Iron status – Iron therapy
Index Formula TT
England and Fraser index (1973) MCV – RBC – 5 x Hb – K (3,4) < 0
Mentzer index (1973) MCV / RBC < 13
Srivastava index (1973) MCH / RBC < 3,8
Shine and Lal index (1977) MCV ² x MCH x 0.01 < 1530
RDW index (1987) MCV x RDW / RBC < 220
Ricerca index (1987) RDW / RBC < 3,3
Green and King index (1988) MCV ² x RDW / (100 x Hb) <72
Ehsani index (2005) MCV – 10 x RBC < 15
Sirdah et al.’s index (2007) MCV – RBC – 3 x Hb < 27

37 37 © 2008 Universitair Ziekenhuis Gent
Screening formulas
Thalassemia
Hereditary spherocytosis
Mullier et al., Annals of hematology (2011); 90:759-768.
Persijn et al., Annals of hematology (2011)

38 38 © 2008 Universitair Ziekenhuis Gent
Conclusion
Essential role of automation in the modern hematology laboratory
Microscopic control of pathologic samples remains indispensable
Of major importance for correct interpretation of results: Knowledge of the limits of your specific analyser