Embed Size (px)
Citation preview

nature medicine VOLUME 17 | NUMBER 4 | APRIL 2011 495
l e t t e r s
In multiple sclerosis, a common inflammatory disease of the central nervous system, immune-mediated axon damage is responsible for permanent neurological deficits1,2. How axon damage is initiated is not known. Here we use in vivo imaging to identify a previously undescribed variant of axon damage in a mouse model of multiple sclerosis. This process, termed ‘focal axonal degeneration’ (FAD), is characterized by sequential stages, beginning with focal swellings and progressing to axon fragmentation. Notably, most swollen axons persist unchanged for several days, and some recover spontaneously. Early stages of FAD can be observed in axons with intact myelin sheaths. Thus, contrary to the classical view2–6, demyelination—a hallmark of multiple sclerosis—is not a prerequisite for axon damage. Instead, focal intra-axonal mitochondrial pathology is the earliest ultrastructural sign of damage, and it precedes changes in axon morphology. Molecular imaging and pharmacological experiments show that macrophage-derived reactive oxygen and nitrogen species (ROS and RNS) can trigger mitochondrial pathology and initiate FAD. Indeed, neutralization of ROS and RNS rescues axons that have already entered the degenerative process. Finally, axonal changes consistent with FAD can be detected in acute human multiple sclerosis lesions. In summary, our data suggest that inflammatory axon damage might be spontaneously reversible and thus a potential target for therapy.
In multiple sclerosis, axons are damaged after the invasion of immune cells. Many different mechanisms for immune-mediated axon injury have been proposed on the basis of in vitro and post-mortem observations2–13, but how axons are permanently damaged in vivo remains unknown.
To address this question, we used in vivo imaging14–17 to study axonal pathology in spinal experimental autoimmune encephalomyelitis (EAE) lesions, induced by immunizing mice with myelin oligodendro-cyte glycoprotein (MOG). These lesions showed the pathological hall-marks of multiple sclerosis, including inflammation and demyelination (Supplementary Fig. 1). Axons in these lesions showed a spectrum of
morphologies: normal appearance (stage 0), focal swellings (stage 1) or fragmentation (stage 2; Fig. 1a–c). To determine whether these mor-phological alterations represent sequential stages of axon damage, we continuously monitored single axons in Thy1-GFP-S and Thy1-CFP-S (GFP and cyan fluorescent protein (CFP) under control of the Thy1 promoter, respectively) transgenic mice in which a subset of medium-to-large caliber axons is fluorescently labeled14,18. When imaged on the second or third day after EAE onset, the majority of stage 1 axons did not change over imaging periods of several hours (45 of 50 axons imaged over 1.5–8 h). In five instances, however, we could directly visu-alize changes associated with axon damage and identified the following characteristics (Fig. 1d and Supplementary Video 1). First, prior to disruption, swellings occur along the axon at one or more discrete sites. Second, the initial disruption of the axon often (three of five cases) occurs at putative nodes of Ranvier. Axonal disruption can start almost synchronously at several sites along the axon (four of five cases). Last, from the sites of disruption, axon fragmentation spreads slowly (3.5 ± 0.9 µm min−1) in both directions. Once fragmentation halts, terminal bulbs form on the proximal and distal axon stumps (average extent of axon loss: 248.9 ± 80.5 µm, n = 8 axon ends). Taken together, these characteristics define FAD, a new variant of axon loss that is initiated at spatially restricted axonal swellings inside inflammatory foci.
FAD is characterized by the existence of relatively stable focal swellings of axons (stage 1). We investigated whether swollen axons invariably progress to fragmentation by repetitively imaging individ-ual stage 1 axons every 24 h over 3 d starting 2 d after EAE onset. Our results show that during this time period, stage 1 axons can degener-ate, persist or even recover (Fig. 1e). We determined the conversion rates between the FAD stages by imaging a large population of axons in Thy1-YFP-16 (yellow fluorescent protein (YFP) under control of the Thy1 promoter) transgenic mice, with a dense labeling pattern (Supplementary Methods; Supplementary Videos 2 and 3). In 13 mice, during 1,084 ‘axon hours’ (n = 230 axons, imaged on average for ~4.7 h), we observed 15 instances of progression (five stage 0→1 and ten stage 1→2 conversions), as well as three instances of recovery (stage 1→0 conversions; Fig. 1f and Supplementary Video 4). All progressive events followed the characteristic sequence of FAD,
1Research Unit Therapy Development, Institute of Clinical Neuroimmunology, Ludwig-Maximilians-Universität München, Munich, Germany. 2Institute of Neuropathology, Georg-August University, Göttingen, Germany. 3Division of Clinical Pathology, Geneva University Hospital and Department of Pathology and Immunology, University of Geneva, Switzerland. 4Department of Physiology, Indiana University School of Medicine-Muncie, Muncie, Indiana, USA. 5Chair for Biomolecular Sensors, Center for Integrated Protein Sciences (Munich) at the Institute of Neuroscience, Technische Universität München, Munich, Germany. 6Institute for Advanced Study, Technische Universität München, Munich, Germany. 7These authors contributed equally to this work. Correspondence should be addressed to M. Kerschensteiner ([email protected]) or T.M. ([email protected]).
Received 27 July 2010; accepted 7 February 2011; published online 27 March 2011; doi:10.1038/nm.2324
A reversible form of axon damage in experimental autoimmune encephalomyelitis and multiple sclerosisIvana Nikić1, Doron Merkler2,3, Catherine Sorbara1, Mary Brinkoetter4, Mario Kreutzfeldt2,3, Florence M Bareyre1, Wolfgang Brück2, Derron Bishop4, Thomas Misgeld5–7 & Martin Kerschensteiner1,7
© 2
011
Nat
ure
Am
eric
a, In
c. A
ll ri
gh
ts r
eser
ved
.

l e t t e r s
496 VOLUME 17 | NUMBER 4 | APRIL 2011 nature medicine
with local swellings preceding fragmentation. The susceptibility of an axon to FAD depends both on intrinsic axonal properties and the extrinsic milieu. For example, axon diameter influences susceptibil-ity. Large-caliber axons (diameter > 1.5 µm) show FAD progression
as well as recovery (transition probability: 0.4% per h, stage 0→1; 2.6% per h, stage 1→2; 1.3% per h stage 1→0). In contrast, thin axons (<1.5 µm) showed higher rates of progression (2.4% per h, stage 0→1; 7.4% per h, stage 1→2). In addition, the age of lesions, and hence likely inflammatory activity, matters. Degeneration outweighs recovery at the peak of clinical symptoms (onset + 2 d; 8.1% per h, stage 1→2; 0% per h, stage 1→0), whereas this relation is reversed 1 d later (onset + 3 d; 0.6% per h, stage 1→2; 1.8% per h, stage 1→ 0; data not shown).
To identify subcellular changes that underlie axonal degeneration and recovery, we reconstructed stage 1 axons by serial-section transmission electron microscopy (ssTEM) after in vivo imaging
a b
c
0
0
1
1
0:55
1:18
1:37
1:58
2
2
012Axon stagesin EAE lesions
Axo
ns (
%)
Axo
ns (
%)
100
50
0N 0 d
0 d
1 d
2 d
3 d
2 d 8 d 30 d
e fd 100 2:00
4:00
5:30
3:00
50
0
0
1
2
Figure 1 In vivo imaging of FAD. (a) Confocal projection showing axons (white), activated macrophages/microglia (magenta) and T cells (cyan) in an acute spinal EAE lesion. Some axons appear normal (stage 0), whereas others are swollen (1) or fragmented (2). (b) Pseudocolored axons isolated from those shown in a: normal appearing (0, green), swollen (1, yellow), and fragmented (2, red). (c) Frequency (in % ± s.e.m.) of axon stages in normal spinal cord (N) and in EAE lesions (0–30 d after EAE onset; differences at all EAE time points compared to control are significant, P < 0.001 to 0.05, one-tailed t test). (d) Multiphoton time-lapse images of a stage 1 axon (white) in EAE and activated macrophages/microglia (magenta). Time is shown as h:min; meningeal second harmonics (a scattering process) signal is green). The axon first breaks (red arrowhead) near a small swelling (yellow arrowhead) at a putative node of Ranvier before fragmenting (gray arrowheads). (e) Fate of stage 1 axons imaged 1–3 d after the peak of EAE (significant progression from 1–3 d, P < 0.05, chi-square test for trend). (f) Time-lapse images of recovering stage 1 axon (time is as shown in d). Scale bar in a,b, 10 µm; scale bar in d, 25 µm; scale bar in f, 10 µm.
ab
c
d
b
e
g
j
h i
f
c d
Fully demyelinatedPartially demyelinated
100
50
0Weight loss
Stage of EAE
Mitochondrial shapeShortened
MyelinatedDemyelinated
44< 2< 1.5 2.5
EAE
Control
DisruptedUltrastructure Potential
Intact Low Normal50 100
50
0
0
50
Mito
chon
dria
(%
)
Mito
chon
dria
(%
)
03.5 > 6 > 8
SF
5
4
3
≤2
Mean shape factorShape factorShape factor
0
0
0
6.0 ± 0.6
3.4 ± 0.2
1 2.9 ± 0.3
2 1.2 ± 0.1
1
2
Axo
n st
age
N
0
1
2
Elongated
2 d1 2 0 1 2
Axo
ns (
%)
0
Myelinated
6≤
Figure 2 Early FAD stages show mitochondrial alterations but no demyelination. (a–d) Electron micrograph of a stage 1 axon with a paranodal swelling and preserved myelin (pseudocolored orange-brown; paranodal loops magnified and marked by arrows in b). The axon contains intact looking (green, example magnified in c) and swollen (red, magnified in d) mitochondria. (e) Top, confocal image of a myelinated stage 1 axon (white; FluoroMyelin, orange, arrows; nuclei, magenta). Bottom, magnified view of myelinated stage 1 axon (nuclear staining omitted). (f) Light microscopic quantification of axon myelination (stage 0–2 axons) at the onset of weight loss (n = 74 axons) and 2 d after clinical EAE onset (first clinical sign of EAE, minimum score of 0.5) (n = 111 axons). (g) Shape factor histograms of mitochondria from electron microscopy images of control (top) and stage 1 EAE axons (bottom; n = 149 and 138 mitochondria, respectively). Green indicates proportion of mitochondria with normal ultrastructure; red represents disrupted mitochondria. (h) Mitochondrial shape versus mitochondrial membrane potential in EAE lesions (green, normal; red, low (< mean – 2 s.d. of control), n = 235 mitochondria in four mice). (i) Confocal quantification of mean mitochondrial shape factor in axons from EAE and normal control (N) mice (n = 23–138 mitochondria per axon in stage 0 (green; myelination status was scored in additional stage 0 axons) and 1 (yellow); in stage 2 (red) all mitochondria were scored). (j) Left, confocal image of axons (gray) and their mitochondria (cyan) in EAE (nuclei, magenta). Right, shape of mitochondria (color coded, see scale at right) in axons at different stages of FAD selected from left panel. Stage and mean mitochondrial shape factor (SF ± s.e.m.) of the axon segment are indicated above each axon. Scale bar in a, 2 µm; scale bars in b–d, 0.5 µm; scale bar in e (top), 10 µm; scale bar in e (bottom), 5 µm; scale bar in j (left and right images), 10 µm.
© 2
011
Nat
ure
Am
eric
a, In
c. A
ll ri
gh
ts r
eser
ved
.

l e t t e r s
nature medicine VOLUME 17 | NUMBER 4 | APRIL 2011 497
(Fig. 2a–d and Supplementary Video 5). Unexpectedly, we found that stage 1 axons were still ensheathed by myelin (Fig. 2b). Confocal microscopy confirmed that a substantial proportion of axons in all stages of FAD retain myelin in acute lesions (Fig. 2e,f). Further, at the earliest stage of EAE (at the onset of weight loss; about 10–13 days post-immunization), before demyelination starts, axons in all stages of FAD are present (Fig. 2f).
A key ultrastructural characteristic of FAD stage 1 axons was the presence of dysmorphic, swollen mitochondria (Fig. 2a,d,g), which were absent in control axons (Fig. 2g and Supplementary Fig. 2). To relate the onset of mitochondrial alterations to axonal morphology, we induced EAE in double-transgenic mice with CFP-labeled axonal mitochondria19 and YFP-labeled axoplasm (Thy1-MitoCFP × Thy1-YFP-16). We first confirmed that mito-chondrial swelling is indeed a sign of mitochondrial dysfunction by simultaneous in vivo imaging of mitochondrial shape and mito-chondrial membrane potential (Fig. 2h). Further analysis in fixed samples showed that mitochondrial swellings were absent in spinal axons from healthy control mice (mean shape factor or length/width ratio of ≥ 4; Fig. 2i), mice immunized with pertussis toxin alone and preclinical (6 days after immunization) EAE mice (data not
shown). In contrast, in inflammatory lesions, already a proportion of normally shaped (stage 0) axons with intact myelin showed mitochondrial swelling (Fig. 2i,j).
To determine the spatial distribution of damaged mitochondria within individual axons, we reconstructed long segments of fluores-cently labeled axons that traversed EAE lesions. Mitochondrial pathol-ogy was restricted to areas of immune infiltration (Fig. 3a,b). The notion that immune cells promote FAD was further supported by a correlation between FAD progression and local infiltration density (Fig. 3c,d). To investigate which immune cells might be responsible for inducing FAD, we followed the behavior of T cells and acti-vated macrophages/microglia (labeled with GFP in Cd2-GFP20 and Cx3cr1GFP/+ mice21, respectively) in apposition to axons (sparsely labeled with CFP in Thy1-CFP-S mice). In acute EAE lesions, primarily macrophages/microglia show prolonged periods of apposition to axons (Supplementary Fig. 3 and Supplementary Videos 6 and 7).
Axon segments in EAE lesions can thus be exposed continuously to harmful mediators secreted by activated macrophages/microglia. To induce FAD, such mediators need to be able to diffuse through the myelin sheath and damage mitochondria. ROS and RNS fulfill these requirements and have been implicated in axon degeneration9,22–24.
bOutside Inside
g Inset
1:22
2:02
2:45
OutsideInsideSF
4
≥6
Axo
n
0 4 8 12Shape factor
1234
≤2
e N 2 d
0Amplex
8
h100 ***
00 1 2Time after addition of H2O2 (h)
3 42
1
0 4
2
0
Axo
ns (
%)
50
c
Nuc
lei p
er s
egm
ent 6 ***
******
***
0
Axon stages
3
N 0 1 2
d
Nuc
lei p
er s
egm
ent
Recov
er
Persis
t
4
0
2
f10
*
**
5
0
Am
plex
sig
nal (
AU
)
8 dN
Pre 2 d
0 d
j
Axo
ns (
%)
1000 2 d 0 2 d
50
0
***
ROS/RNS scavengertreatment in EAE
+–
0
1
2
iIn stage
Axo
ns (
%)
ROS/RNS scavenger treatment in EAE
0100
50
0
30
1 2
15
0
10
5
0–
**
– + – +
**
+
*
a
(
(
Mean shape factor
Figure 3 Activated macrophage/microglia-derived reactive species induce FAD. (a) Confocal reconstruction of an axon that courses through an EAE lesion (nuclei, magenta) in a mouse with sparse axon labeling (white) and dense labeling of axonal mitochondria (cyan). Enlarged areas below show color-coded (scale on right) shape of mitochondria in the labeled axon outside (left) and inside (right) the lesion. (b) Quantification of mitochondrial shape in different segments of longitudinally reconstructed axons (segments of each axon connected with dashed line, n = 4 axons) outside (green) and inside (red) of EAE lesions. Each triangle represents a mitochondrion, and circles indicate mean mitochondrial shape factor for the axon segment (± s.e.m.; mitochondria are significantly shorter inside versus outside; P < 0.05, paired t test). (c) Infiltration density (± s.e.m.) around control (N, gray) and EAE stage 0 (green), 1 (yellow) and 2 (red) axon segments (n = 13–83 segments; infiltration density is significantly increased in stage 0 vs. control axons, stage 1 vs. stage 0 axons and stage 2 vs. stage 1 axons; t test). (d) Cell density (± s.e.m.) around stage 1 axon segments that either recovered (green) or persisted in a swollen state (yellow) during in vivo imaging and were fixed afterward for analysis of cellular infiltration (n = 60 segments; density is significantly lower around recovered axons; t test). (e) In vivo measurement of H2O2 concentration (detected with Amplex) in the dorsal spinal cord of healthy (N, left) and EAE (2 d after onset) mice. (f) Quantification of H2O2 concentration (± s.e.m; n = 3–5 mice per time point; levels are significantly increased at 0 d and 2 d after EAE onset; t test). N, control; Pre, preclinical mice; d, days after EAE onset. (g) In vivo two-photon time-lapse of spinal axons (gray) and their mitochondria (cyan) after H2O2 application (330 mM) (time, h:min). Right, magnification of small cluster of mitochondria that swell over time (arrows). (h) Frequency of stage 0 (green), 1 (yellow) and 2 (red) axons before and up to 5 h after in vivo H2O2 application (100 mM; n = 53 axons). Superimposed is the change over time in mean mitochondrial shape (± s.e.m., n = 15 axons; t test). (i) Percentage (± s.e.m.) of EAE axons in different stages of FAD after ROS and RNS scavenger or vehicle treatment (starting at weight loss, analyzed by t test). (j) Fate of stage 1 axons after 2 d of ROS and RNS scavenger or vehicle treatment (started 2–3 d after EAE onset, n = 22–26 axons; chi-square test). Scale bar in a, 50 µm; scale bar in e, 250 µm (calibration bar); scale bar in g, 10 µm. *P < 0.05; **P < 0.01; ***P < 0.001.
© 2
011
Nat
ure
Am
eric
a, In
c. A
ll ri
gh
ts r
eser
ved
.
l e t t e r s
498 VOLUME 17 | NUMBER 4 | APRIL 2011 nature medicine
In vivo imaging of hydrogen peroxide (H2O2) and nitric oxide (NO) indicators revealed increased ROS and RNS concentrations in acute EAE lesions (Fig. 3e,f and Supplementary Fig. 4). We then applied H2O2 (10–330 mM) or the NO donor spermine NONOate (10 mM) to the lumbar spinal cord of healthy Thy1-MitoCFP × Thy1-YFP-16 mice (some of which were counterstained with a lipophilic dye, BODIPY). In vivo imaging revealed that application of either H2O2 (> 10 mM) or the NO donor is sufficient to induce the char-acteristic mitochondrial and axonal changes of FAD (Fig. 3g,h, Supplementary Fig. 4 and Supplementary Video 8) in the absence of demyelination (data not shown). We then treated EAE mice with scavengers that reduced spinal ROS and RNS levels by 75% (± 6%) in vivo (data not shown). This treatment limited FAD progression (Fig. 3i) but did not affect the density of T cells or macrophages/microglia in acute EAE lesions (data not shown). To explore whether these scavengers promote recovery of axons in stage 1 of FAD, we imaged mice at the peak of EAE in vivo and identified axons with focal swellings (stage 1)(Fig. 3j). Repetitive in vivo imaging revealed that neutralization of ROS and RNS induced recovery in nearly 80% of treated axons (Fig. 3j).
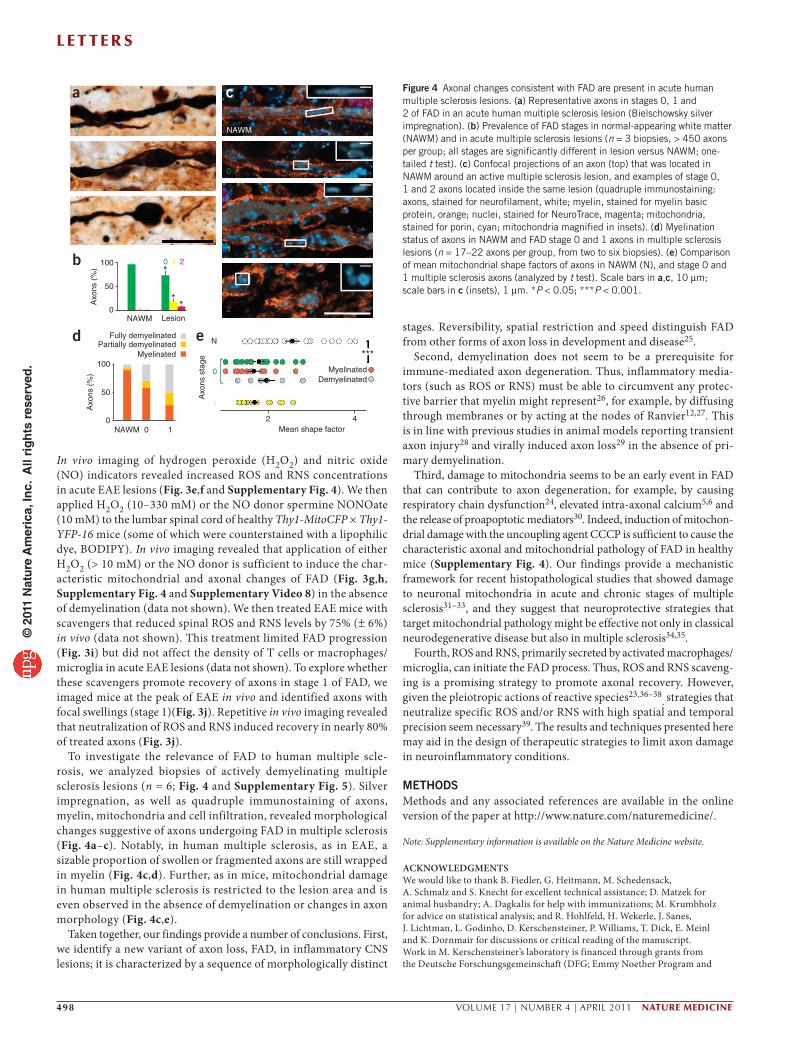
To investigate the relevance of FAD to human multiple scle-rosis, we analyzed biopsies of actively demyelinating multiple sclerosis lesions (n = 6; Fig. 4 and Supplementary Fig. 5). Silver impregnation, as well as quadruple immunostaining of axons, myelin, mitochondria and cell infiltration, revealed morphological changes suggestive of axons undergoing FAD in multiple sclerosis (Fig. 4a–c). Notably, in human multiple sclerosis, as in EAE, a sizable proportion of swollen or fragmented axons are still wrapped in myelin (Fig. 4c,d). Further, as in mice, mitochondrial damage in human multiple sclerosis is restricted to the lesion area and is even observed in the absence of demyelination or changes in axon morphology (Fig. 4c,e).
Taken together, our findings provide a number of conclusions. First, we identify a new variant of axon loss, FAD, in inflammatory CNS lesions; it is characterized by a sequence of morphologically distinct
stages. Reversibility, spatial restriction and speed distinguish FAD from other forms of axon loss in development and disease25.
Second, demyelination does not seem to be a prerequisite for immune-mediated axon degeneration. Thus, inflammatory media-tors (such as ROS or RNS) must be able to circumvent any protec-tive barrier that myelin might represent26, for example, by diffusing through membranes or by acting at the nodes of Ranvier12,27. This is in line with previous studies in animal models reporting transient axon injury28 and virally induced axon loss29 in the absence of pri-mary demyelination.
Third, damage to mitochondria seems to be an early event in FAD that can contribute to axon degeneration, for example, by causing respiratory chain dysfunction24, elevated intra-axonal calcium5,6 and the release of proapoptotic mediators30. Indeed, induction of mitochon-drial damage with the uncoupling agent CCCP is sufficient to cause the characteristic axonal and mitochondrial pathology of FAD in healthy mice (Supplementary Fig. 4). Our findings provide a mechanistic framework for recent histopathological studies that showed damage to neuronal mitochondria in acute and chronic stages of multiple sclerosis31–33, and they suggest that neuroprotective strategies that target mitochondrial pathology might be effective not only in classical neurodegenerative disease but also in multiple sclerosis34,35.
Fourth, ROS and RNS, primarily secreted by activated macrophages/microglia, can initiate the FAD process. Thus, ROS and RNS scaveng-ing is a promising strategy to promote axonal recovery. However, given the pleiotropic actions of reactive species23,36–38
, strategies that neutralize specific ROS and/or RNS with high spatial and temporal precision seem necessary39. The results and techniques presented here may aid in the design of therapeutic strategies to limit axon damage in neuroinflammatory conditions.
METHODSMethods and any associated references are available in the online version of the paper at http://www.nature.com/naturemedicine/.
Note: Supplementary information is available on the Nature Medicine website.
ACKNoWleDgMeNTSWe would like to thank B. Fiedler, G. Heitmann, M. Schedensack, A. Schmalz and S. Knecht for excellent technical assistance; D. Matzek for animal husbandry; A. Dagkalis for help with immunizations; M. Krumbholz for advice on statistical analysis; and R. Hohlfeld, H. Wekerle, J. Sanes, J. Lichtman, L. Godinho, D. Kerschensteiner, P. Williams, T. Dick, E. Meinl and K. Dornmair for discussions or critical reading of the manuscript. Work in M. Kerschensteiner’s laboratory is financed through grants from the Deutsche Forschungsgemeinschaft (DFG; Emmy Noether Program and
a
b
d
0
1
2
100*
**
0 1 2
Axo
ns (
%)
50
NAWM
Fully demyelinated
Lesion0
e
100
Axo
ns (
%)
Axo
ns s
tage
N
0
2Mean shape factor
Myelinated
4
1
***
50
NAWM 0 10
0
1
2
NAWM
c
Partially demyelinatedMyelinated
Demyelinated
Figure 4 Axonal changes consistent with FAD are present in acute human multiple sclerosis lesions. (a) Representative axons in stages 0, 1 and 2 of FAD in an acute human multiple sclerosis lesion (Bielschowsky silver impregnation). (b) Prevalence of FAD stages in normal-appearing white matter (NAWM) and in acute multiple sclerosis lesions (n = 3 biopsies, > 450 axons per group; all stages are significantly different in lesion versus NAWM; one-tailed t test). (c) Confocal projections of an axon (top) that was located in NAWM around an active multiple sclerosis lesion, and examples of stage 0, 1 and 2 axons located inside the same lesion (quadruple immunostaining: axons, stained for neurofilament, white; myelin, stained for myelin basic protein, orange; nuclei, stained for NeuroTrace, magenta; mitochondria, stained for porin, cyan; mitochondria magnified in insets). (d) Myelination status of axons in NAWM and FAD stage 0 and 1 axons in multiple sclerosis lesions (n = 17–22 axons per group, from two to six biopsies). (e) Comparison of mean mitochondrial shape factors of axons in NAWM (N), and stage 0 and 1 multiple sclerosis axons (analyzed by t test). Scale bars in a,c, 10 µm; scale bars in c (insets), 1 µm. *P < 0.05; ***P < 0.001.
© 2
011
Nat
ure
Am
eric
a, In
c. A
ll ri
gh
ts r
eser
ved
.

l e t t e r s
nature medicine VOLUME 17 | NUMBER 4 | APRIL 2011 499
Sonderforschungsbereich 571) and the ‘Verein Therapieforschung für MS-Kranke e.V’. M. Kerschensteiner and W.B. are supported by a grant from the German Federal Ministry of Education and Research (Competence Network Multiple Sclerosis). T.M. is supported by the Institute for Advanced Study, Technische Universität München, by the Alexander von Humboldt Foundation and by the Center for Integrated Protein Science (Munich). D.M. and W.B. are supported by grants from the DFG (Sonderforschungsbereich Transregio 43). D.M. is supported by the Swiss National Science Foundation (PP00P3 128372). D.B. is supported by the US National Institutes of Health. This project was further financed by grants to M. Kerschensteiner and T.M. from the Dana Foundation and the Hertie Foundation, and by a grant from the Christopher and Dana Reeve Foundation to T.M. and D.B.
AUTHoR CoNTRIBUTIoNSM. Kerschensteiner, T.M., D.B., D.M. and I.N. conceived the experiments. I.N. and C.S. did the imaging experiments. I.N., C.S., T.M. and M. Kerschensteiner did image analysis. M.B. and D.B. did and evaluated serial electron microscopy. I.N. and F.M.B. did therapy experiments. D.M., M. Kreutzfeldt and W.B. did histopathological evaluations of EAE and multiple sclerosis tissue. I.N., M. Kerschensteiner and T.M. wrote the paper.
CoMPeTINg FINANCIAl INTeReSTSThe authors declare no competing financial interests.
Published online at http://www.nature.com/naturemedicine/. Reprints and permissions information is available online at http://npg.nature.com/reprintsandpermissions/.
1. Hauser, S.L. & Oksenberg, J.R. The neurobiology of multiple sclerosis: genes, inflammation, and neurodegeneration. Neuron 52, 61–76 (2006).
2. Trapp, B.D. & Nave, K.A. Multiple sclerosis: an immune or neurodegenerative disorder? Annu. Rev. Neurosci. 31, 247–269 (2008).
3. Trapp, B.D. et al. Axonal transection in the lesions of multiple sclerosis. N. Engl. J. Med. 338, 278–285 (1998).
4. Lucchinetti, C. et al. Heterogeneity of multiple sclerosis lesions: implications for the pathogenesis of demyelination. Ann. Neurol. 47, 707–17 (2000).
5. Trapp, B.D. & Stys, P.K. Virtual hypoxia and chronic necrosis of demyelinated axons in multiple sclerosis. Lancet Neurol. 8, 280–291 (2009).
6. Waxman, S.G. Axonal conduction and injury in multiple sclerosis: the role of sodium channels. Nat. Rev. Neurosci. 7, 932–941 (2006).
7. Pitt, D., Werner, P. & Raine, C.S. Glutamate excitotoxicity in a model of multiple sclerosis. Nat. Med. 6, 67–70 (2000).
8. Medana, I., Martinic, M.A., Wekerle, H. & Neumann, H. Transection of major histocompatibility complex class I-induced neurites by cytotoxic T lymphocytes. Am. J. Pathol. 159, 809–815 (2001).
9. Smith, K.J., Kapoor, R., Hall, S.M. & Davies, M. Electrically active axons degenerate when exposed to nitric oxide. Ann. Neurol. 49, 470–476 (2001).
10. Lo, A.C., Saab, C.J., Black, J.A. & Waxman, S.G. Phenytoin protects spinal cord axons and preserves axonal conduction and neurological function in a model of neuroinflammation in vivo. J. Neurophysiol. 90, 3566–3571 (2003).
11. Friese, M.A. et al. Acid-sensing ion channel-1 contributes to axonal degeneration in autoimmune inflammation of the central nervous system. Nat. Med. 13, 1483–1489 (2007).
12. Mathey, E.K. et al. Neurofascin as a novel target for autoantibody-mediated axonal injury. J. Exp. Med. 204, 2363–2372 (2007).
13. Bittner, S. et al. TASK1 modulates inflammation and neurodegeneration in autoimmune inflammation of the central nervous system. Brain 132, 2501–2516 (2009).
14. Kerschensteiner, M., Schwab, M.E., Lichtman, J.W. & Misgeld, T. In vivo imaging of axonal degeneration and regeneration in the injured spinal cord. Nat. Med. 11, 572–577 (2005).
15. Misgeld, T. & Kerschensteiner, M. In vivo imaging of the diseased nervous system. Nat. Rev. Neurosci. 7, 449–463 (2006).
16. Bartholomäus, I. et al. Effector T cell interactions with meningeal vascular structure in nascent autoimmune CNS lesions. Nature 462, 94–98 (2009).
17. Siffrin, V. et al. In vivo imaging of partially reversible TH17 cell–induced neuronal dysfunction in the course of encephalomyelitis. Immunity 33, 424–436 (2010).
18. Feng, G. et al. Imaging neuronal subsets in transgenic mice expressing multiple spectral variants of GFP. Neuron 28, 41–51 (2000).
19. Misgeld, T., Kerschensteiner, M., Bareyre, F.M., Burgess, R.W. & Lichtman, J.W. Imaging axonal transport of mitochondria in vivo. Nat. Methods 4, 559–561 (2007).
20. Singbartl, K. et al. A CD2-green fluorescence protein–transgenic mouse reveals very late antigen-4–dependent CD8+ lymphocyte rolling in inflamed venules. J. Immunol. 166, 7520–7526 (2001).
21. Jung, S. et al. Analysis of fractalkine receptor CX3CR1 function by targeted deletion and green fluorescent protein reporter gene insertion. Mol. Cell. Biol. 20, 4106–4114 (2000).
22. Kapoor, R., Davies, M., Blaker, P.A., Hall, S.M. & Smith, K.J. Blockers of sodium and calcium entry protect axons from nitric oxide-mediated degeneration. Ann. Neurol. 53, 174–180 (2003).
23. Smith, K.J. & Lassmann, H. The role of nitric oxide in multiple sclerosis. Lancet Neurol. 1, 232–241 (2002).
24. Lin, M.T. & Beal, M.F. Mitochondrial dysfunction and oxidative stress in neurodegenerative diseases. Nature 443, 787–795 (2006).
25. Coleman, M. Axon degeneration mechanisms: commonality amid diversity. Nat. Rev. Neurosci. 6, 889–898 (2005).
26. Franklin, R.J. & Ffrench-Constant, C. Remyelination in the CNS: from biology to therapy. Nat. Rev. Neurosci. 9, 839–855 (2008).
27. Coman, I. et al. Nodal, paranodal and juxtaparanodal axonal proteins during demyelination and remyelination in multiple sclerosis. Brain 129, 3186–3195 (2006).
28. Aboul-Enein, F., Weiser, P., Höftberger, R., Lassmann, H. & Bradl, M. Transient axonal injury in the absence of demyelination: a correlate of clinical disease in acute experimental autoimmune encephalomyelitis. Acta Neuropathol. 111, 539–547 (2006).
29. Das Sarma, J., Kenyon, L.C., Hingley, S.T. & Shindler, K.S. Mechanisms of primary axonal damage in a viral model of multiple sclerosis. J. Neurosci. 29, 10272–10280 (2009).
30. Kroemer, G., Galluzzi, L. & Brenner, C. Mitochondrial membrane permeabilization in cell death. Physiol. Rev. 87, 99–163 (2007).
31. Dutta, R. et al. Mitochondrial dysfunction as a cause of axonal degeneration in multiple sclerosis patients. Ann. Neurol. 59, 478–489 (2006).
32. Mahad, D., Ziabreva, I., Lassmann, H. & Turnbull, D. Mitochondrial defects in acute multiple sclerosis lesions. Brain 131, 1722–1735 (2008).
33. Mahad, D.J. et al. Mitochondrial changes within axons in multiple sclerosis. Brain 132, 1161–1174 (2009).
34. Forte, M. et al. Cyclophilin D inactivation protects axons in experimental autoimmune encephalomyelitis, an animal model of multiple sclerosis. Proc. Natl. Acad. Sci. USA 104, 7558–7563 (2007).
35. Du, H. et al. Cyclophilin D deficiency attenuates mitochondrial and neuronal perturbation and ameliorates learning and memory in Alzheimer′s disease. Nat. Med. 14, 1097–1105 (2008).
36. D’Autréaux, B. & Toledano, M.B. ROS as signalling molecules: mechanisms that generate specificity in ROS homeostasis. Nat. Rev. Mol. Cell Biol. 8, 813–824 (2007).
37. Hooper, D.C. et al. Uric acid, a peroxynitrite scavenger, inhibits CNS inflammation, blood-CNS barrier permeability changes and tissue damage in a mouse model of multiple sclerosis. FASEB J. 14, 691–698 (2000).
38. Kizelsztein, P., Ovadia, H., Garbuzenko, O., Sigal, A. & Barenholz, Y. Pegylated nanoliposomes remote-loaded with the antioxidant tempamibe ameliorate experimental autoimmune encephalomyelitis. J. Neuroimmunol. 213, 20–25 (2009).
39. Lipton, S.A. Pathologically activated therapeutics for neuroprotection. Nat. Rev. Neurosci. 8, 803–808 (2007).
© 2
011
Nat
ure
Am
eric
a, In
c. A
ll ri
gh
ts r
eser
ved
.

nature medicine doi:10.1038/nm.2324
ONLINE METHODSMice. We used transgenic and knock-in male and female mice to label cellular interaction partners with distinct spectral variants of GFP. For a detailed descrip-tion of the mouse strains, see the Supplementary Methods.
Induction of experimental autoimmune encephalomyelitis. We induced EAE in adult mice (about 6 –12 weeks old) according to a standard protocol40. Briefly, we immunized mice with 200–250 µl of an emulsion containing 100–375 µg of purified recombinant myelin oligodendrocyte glycoprotein (MOG, N1-125, expressed in E. coli) in complete Freund’s adjuvant (Sigma) with 500–625 µg of mycobacterium tuberculosis H37 Ra (Difco). At day 0 and day 2 after immunization, we injected 250–400 ng of pertussis toxin (Sigma) intraperitoneally. We weighed mice daily and scored their neurological deficits according to a standard EAE scoring scale as follows: 0, no detectable clinical signs; 0.5, partial tail weakness; 1, tail paralysis; 1.5, gait instability or impaired righting ability; 2, hind limb paresis; 2.5, hind limb paresis with partial dragging; 3, hind limb paralysis; 3.5, hind limb paralysis and forelimb paresis; 4, hind limb and forelimb paralysis; 5, moribund. All animal work conformed to institutional guidelines and was approved by the Animal Study Committee of the Regierung von Oberbayern.
Immunohistochemistry. After transcardial perfusion of mice with 4% (wt/vol) paraformaldehyde in PBS, we post-fixed spinal cords for 12–24 h. We isolated the lumbar spinal cord and cut sections (50–150 µm) with a vibratome, or we cryo-protected the tissue by incubation in 30% (wt/vol) sucrose (Sigma) in PBS and cut cryosections (30–50 µm) in a cryostat. For immunohistochemistry, we first blocked the sections with 10% (vol/vol) goat serum in 0.5% (vol/vol) Triton X-100 (Sigma) in PBS and then incubated them with primary antibodies against ionized calcium binding adaptor 1 (Iba1) (rabbit IgG, 1 in 250, Wako Pure Chemical Industries, cat. no. 016-20001) or myelin basic protein (rabbit Ig fraction, 1 in 100, DAKO, cat. no. A0623) and counterstained them with the Nissl-like nucleic acid stain, NeuroTrace 640/660 (1 in 500, Invitrogen) and/or FluoroMyelin red fluorescent myelin stain (1 in 150–250, Invitrogen) in 0.5% Triton X-100 in PBS. For Iba1 immunohistochemistry, we used microwave treatment in citrate buffer (0.1 M, pH 6.0, Merck) for antigen retrieval. Sections were mounted in Vectashield (Vector Laboratories) and imaged by confocal microscopy.
Histopathological analysis. For histopathological analysis of EAE tissue, we embedded paraformaldehyde-fixed spinal cord or brain tissue in paraffin and cut either longitudinal sections or cross-sections of lumbar and thoracic spinal cord. For histopathological analysis of multiple sclerosis tissue, we obtained human brain biopsies of male and female individuals with multiple sclerosis from the collection of the Department of Neuropathology at the Georg August University, Göttingen, Germany. The people gave informed consent and the use of the brain biopsies for scientific purposes was in accordance with the guidelines of the Ethics Committee of the Georg-August-University of Göttingen, Germany. For further details, see the Supplementary Methods.
In vivo imaging. To image cellular interactions in the lumbar spinal cord, we adapted our previously established in vivo imaging approach for visualizing
axons in the cervical spinal cord14. We performed in vivo time-lapse imaging on two imaging setups: a wide-field setup on an Olympus BX51 microscope, and multiphoton microscopes using Olympus FV300 and FV1000 scanners equipped with femtosecond-pulsed Ti:Sapphire lasers (Mai Tai HP, Newport/Spectra-Physics). To measure the release of ROS, we used the Amplex UltraRed reagent (Invitrogen), which is a fluorogenic substrate that indicates H2O2 concentra-tions. We visualized nitric oxide with DAF-FM diacetate sensor dye (Invitrogen). Further details of image acquisition, processing and quantitative analysis are described in the Supplementary Methods.
Confocal microscopy. We obtained confocal images of fixed tissue on a FV1000 confocal system mounted on an upright BX61 microscope (Olympus) equipped with ×20/0.85 and ×60/1.42 oil-immersion objectives. To quantify axonal and mitochondrial morphology in EAE lesions, we recorded stacks of 12-bit images (spatial sampling approximately 100 nm in x–y and 300 nm in z). For large-scale longitudinal reconstructions, we documented individual fluorescently labeled axons by scanning overlapping stacks with an automated stage (Prior). Further details of image processing and quantitative analysis are described in the Supplementary Methods.
Correlated serial electron microscopy reconstruction. We identified swollen (stage 1) axons in vivo in EAE mice (or control axons in healthy mice) with multi-photon imaging (as described above) of fluorescently labeled axons in Thy1-GFP-S (× Thy1-MitoCFP-P) mice. We then fixed the tissue for ultrastructural analysis and obtained correlated serial electron microscopy reconstruction of the imaged axons as described in the Supplementary Methods.
ROS and RNS application and scavenging. To investigate the effects of ROS and RNS application on axonal and mitochondrial morphology in vivo, we applied either H2O2 (10, 100 and 330 mM, Sigma) or the NO donor spermine NONOate (10 mM, Alexis Biochemicals), to the exposed spinal cords of healthy Thy1-YFP-16 × Thy1-MitoCFP-P mice and imaged axonal and mitochondrial changes over time. To scavenge ROS and/or RNS in EAE lesions, we used a cocktail containing FeTTPS (5,10,15,20-Tetrakis(4-sulfonatophenyl)porphyrinato Iron (III), Chloride; Calbiochem), PBN (N-tert-butyl-α-phenylnitrone; Sigma) and EUK134 (Cayman Chemicals). Details of the experiments are provided in the Supplementary Methods.
Statistical analyses. Results are given as mean ± s.e.m. unless indicated other-wise. Statistical significance was determined with GraphPad Prism (GraphPad Software), Excel (Microsoft) and SPSS Statistics 17 (SPSS). Unpaired t tests (one-tailed for treatment experiment, two-tailed otherwise) were used unless stated otherwise.
Additional methods. Detailed methodology is described in the Supplementary Methods.
40. Abdul-Majid, K.B. et al. Screening of several H-2 congenic mouse strains identified H-2(q) mice as highly susceptible to MOG-induced EAE with minimal adjuvant requirement. J. Neuroimmunol. 111, 23–33 (2000).
© 2
011
Nat
ure
Am
eric
a, In
c. A
ll ri
gh
ts r
eser
ved
.