Embed Size (px)
Citation preview
Autocorrelation and Autocorrelation and Linkage Cause Bias in Linkage Cause Bias in
Evaluation of Relational Evaluation of Relational LearnersLearners
David Jensen and Jennifer David Jensen and Jennifer NevilleNeville
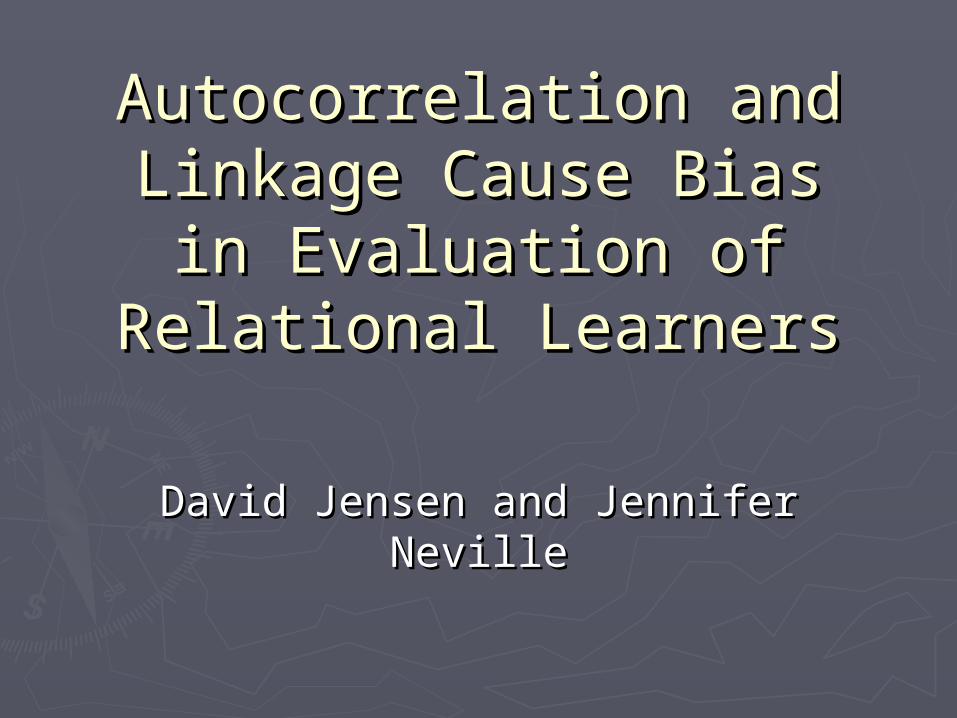
Relational vs. Traditional Relational vs. Traditional Independent Data SetsIndependent Data Sets
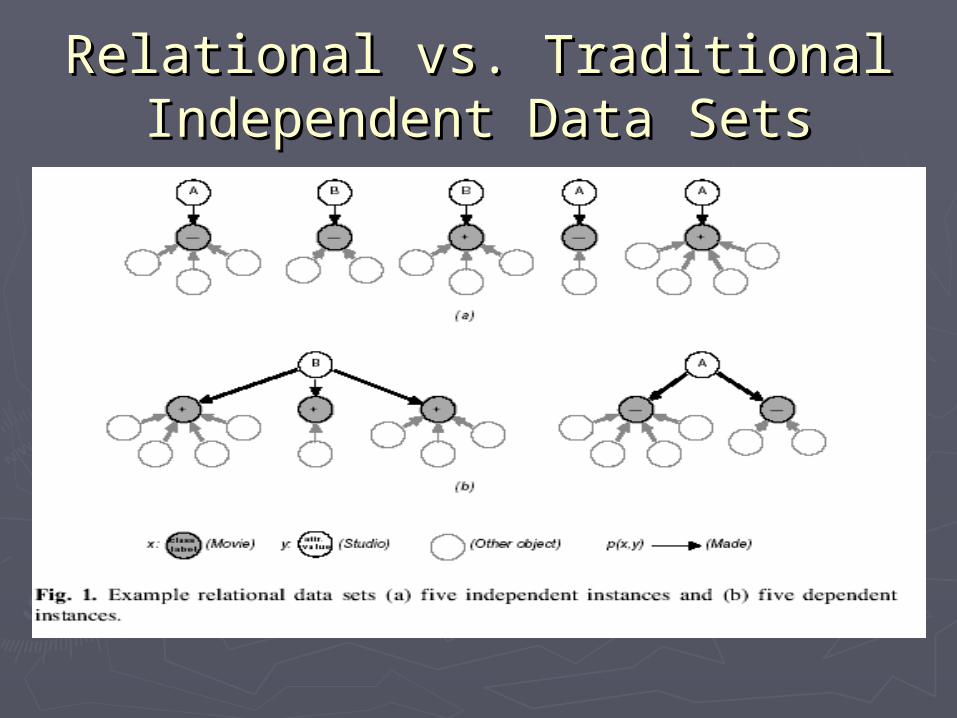
Simple Random Partitioning Simple Random Partitioning ExampleExample
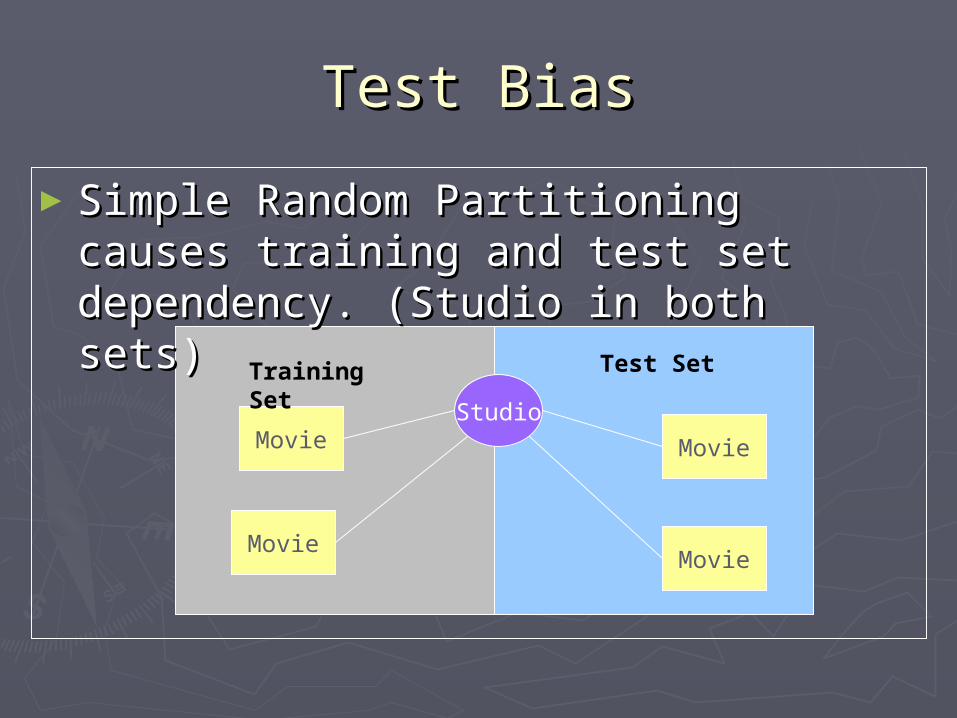
►Divide Movies into two subsets, Training & Divide Movies into two subsets, Training & Test set, by randomly selecting a movie Test set, by randomly selecting a movie without replacement and adding it to without replacement and adding it to subsetsubset
►A movie may only appear in A movie may only appear in one one subsetsubset►A movie may only appear once in a subsetA movie may only appear once in a subset►For each movie add the corresponding For each movie add the corresponding
Studio to the subset.Studio to the subset.►A studio may appear in both subsets.A studio may appear in both subsets.
Test BiasTest Bias
►Simple Random Partitioning causes Simple Random Partitioning causes training and test set dependency. training and test set dependency. (Studio in both sets)(Studio in both sets)
StudioMovie
MovieMovie
Movie
Training Set
Test Set
Data SetData Set
►Data set drawn from Internet Movie Data set drawn from Internet Movie Database (Database (www.imdb.comwww.imdb.com))
►Contains Movies, Actors, Directors, Contains Movies, Actors, Directors, Producers, and StudiosProducers, and Studios
►Selected Movies released between 1996 Selected Movies released between 1996 and 2001and 2001 1382 movies, 40000 objects, and 70000 1382 movies, 40000 objects, and 70000
linkslinks►Used various features to predict Used various features to predict
opening weekend box office receiptsopening weekend box office receipts
Calculating Test BiasCalculating Test Bias
►Discretized movie receipts with a Discretized movie receipts with a positive value indicating more than $2 positive value indicating more than $2 million. (prob(+)=.55)million. (prob(+)=.55)
►Added random attributes to studiosAdded random attributes to studios►Created models with the random Created models with the random
attributes.attributes.►Bias = random model accuracy – Bias = random model accuracy –
default error of .55default error of .55
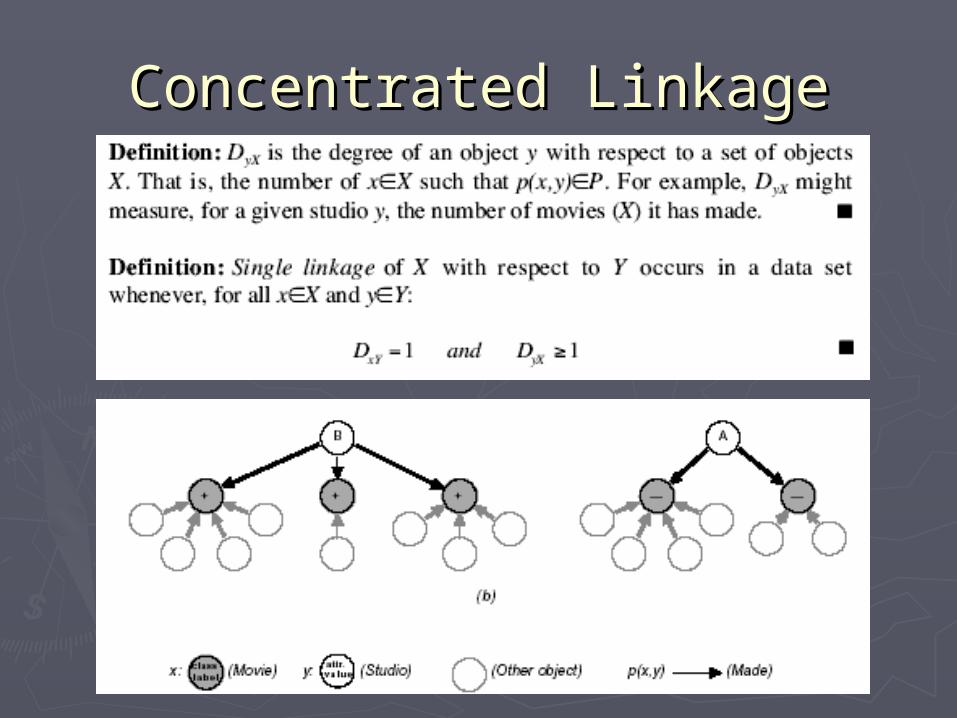
Concentrated LinkageConcentrated Linkage
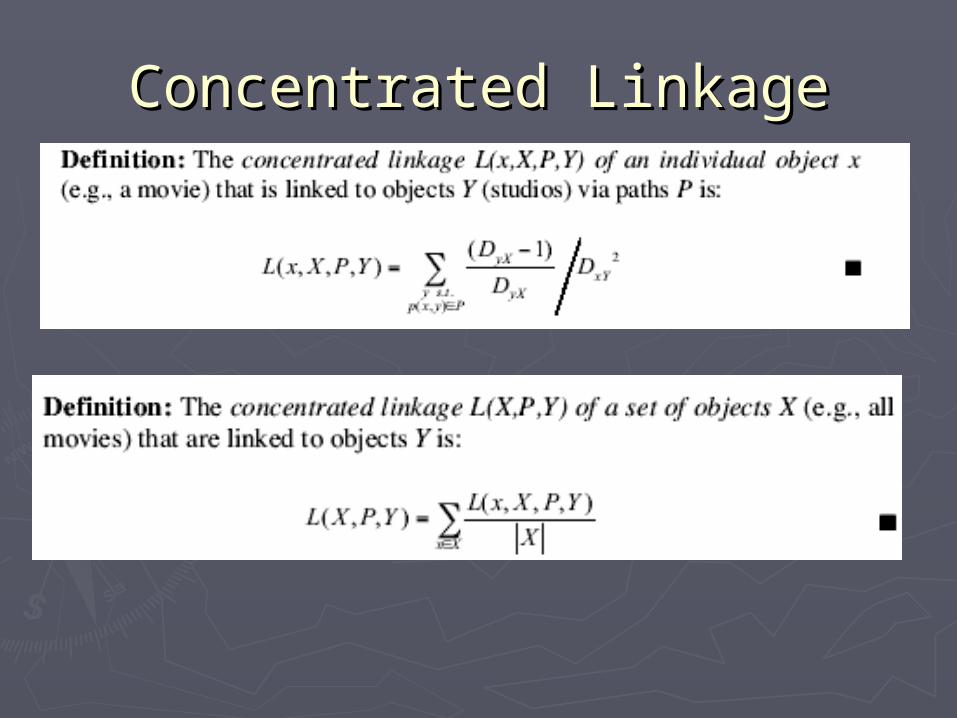
Concentrated LinkageConcentrated Linkage
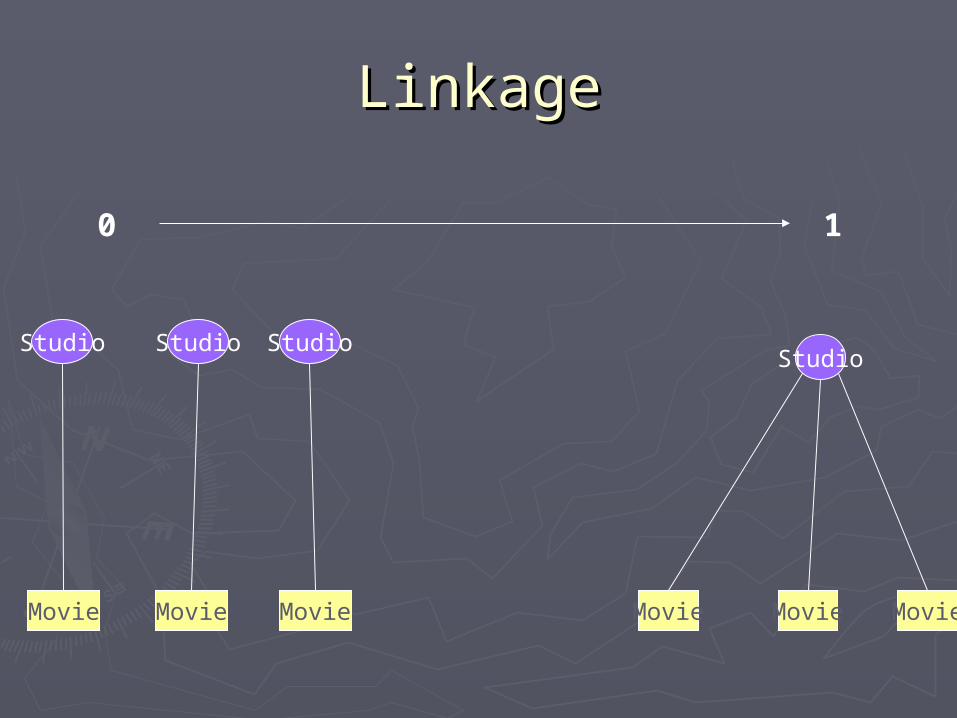
LinkageLinkage
0 1
Studio
Movie MovieMovie
Studio
Movie
Studio
Movie
Studio
Movie
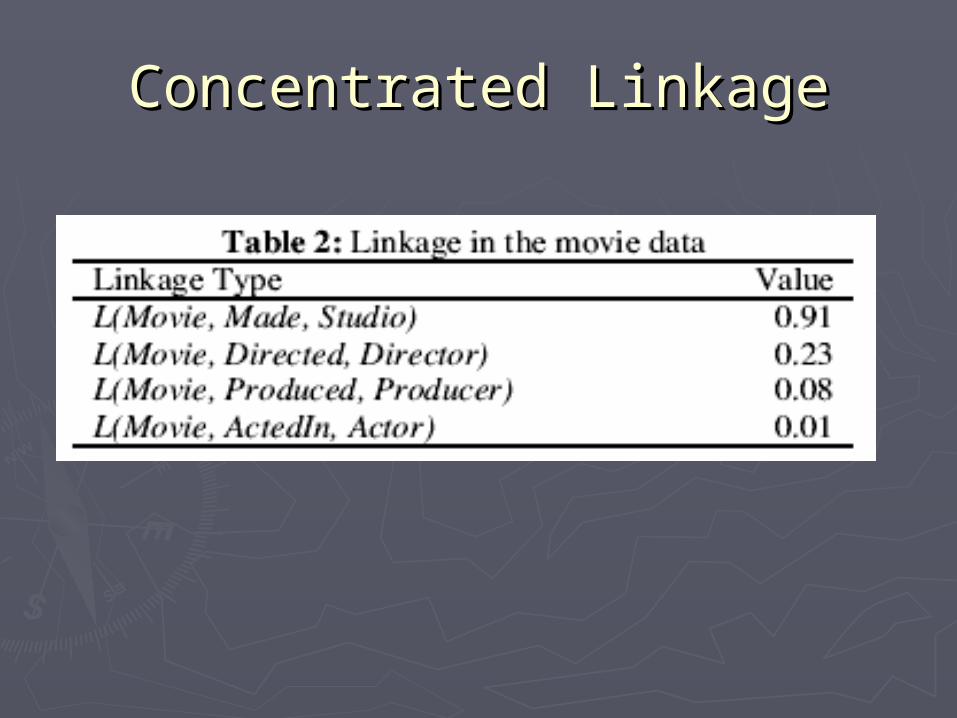
Concentrated LinkageConcentrated Linkage
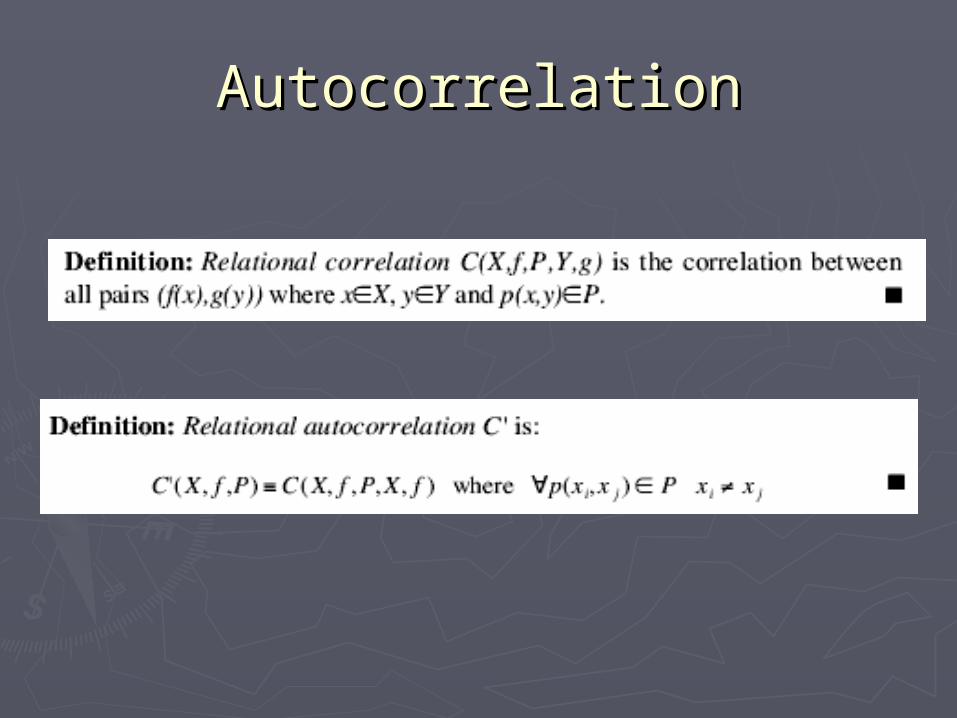
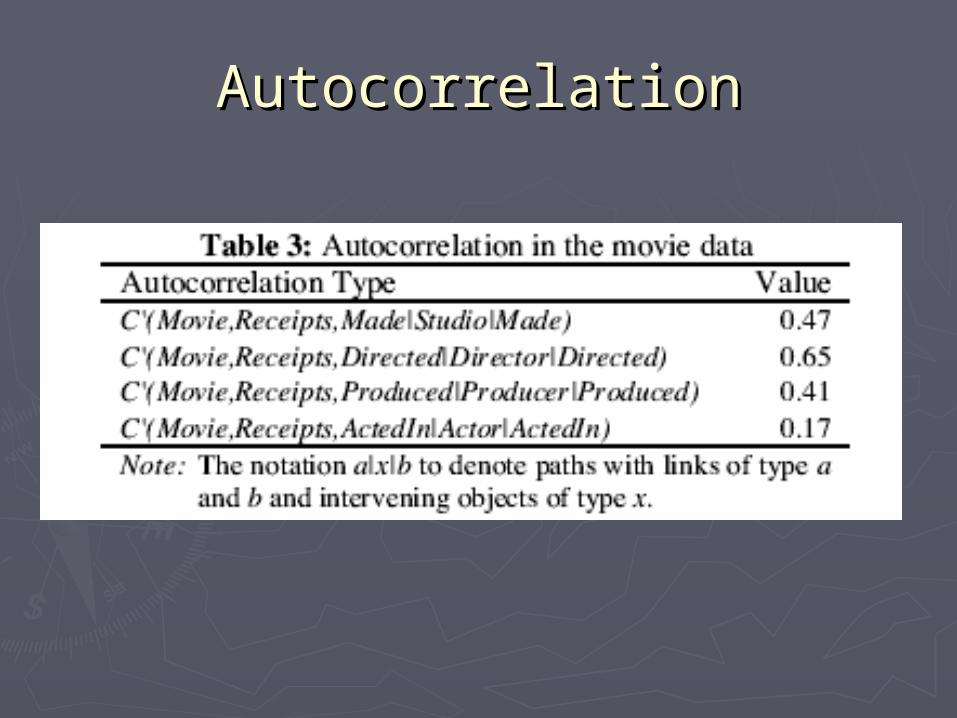
AutocorrelationAutocorrelation
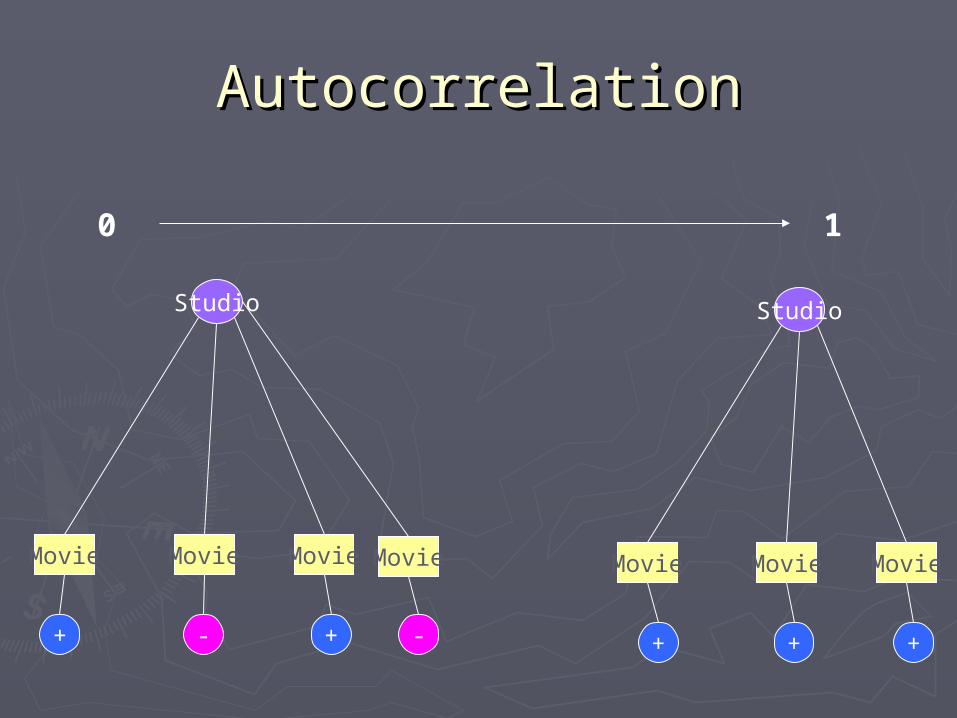
AutocorrelationAutocorrelation
0 1
Studio
Movie MovieMovie
Studio
Movie MovieMovie
+
Movie
- + - + + +
AutocorrelationAutocorrelation
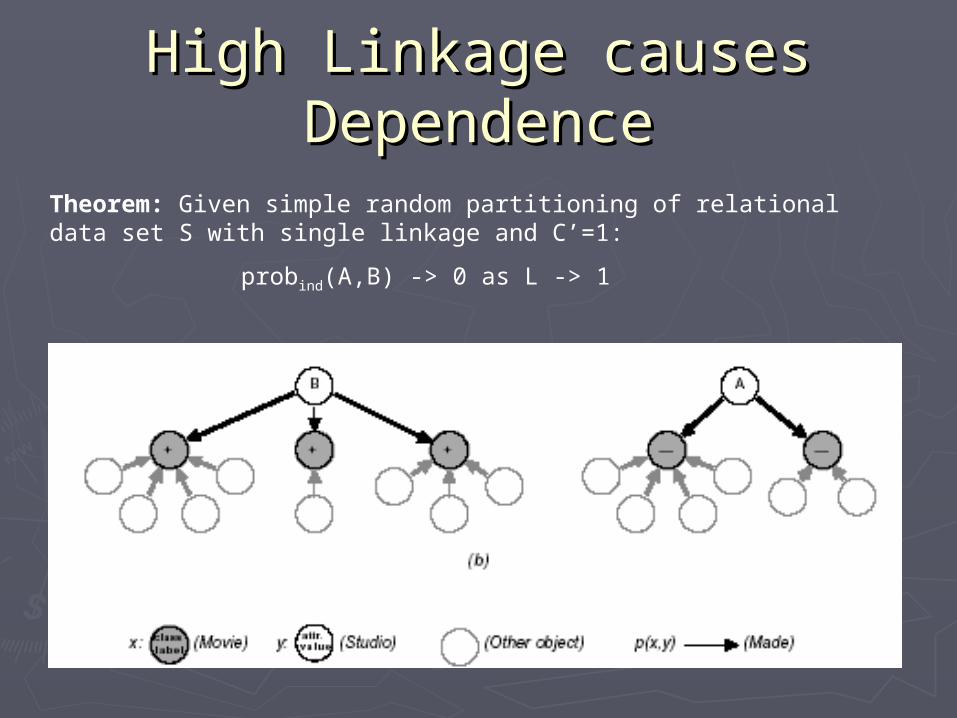
High Linkage causes High Linkage causes DependenceDependence
Theorem: Given simple random partitioning of relational data set S with single linkage and C’=1:
probind(A,B) -> 0 as L -> 1
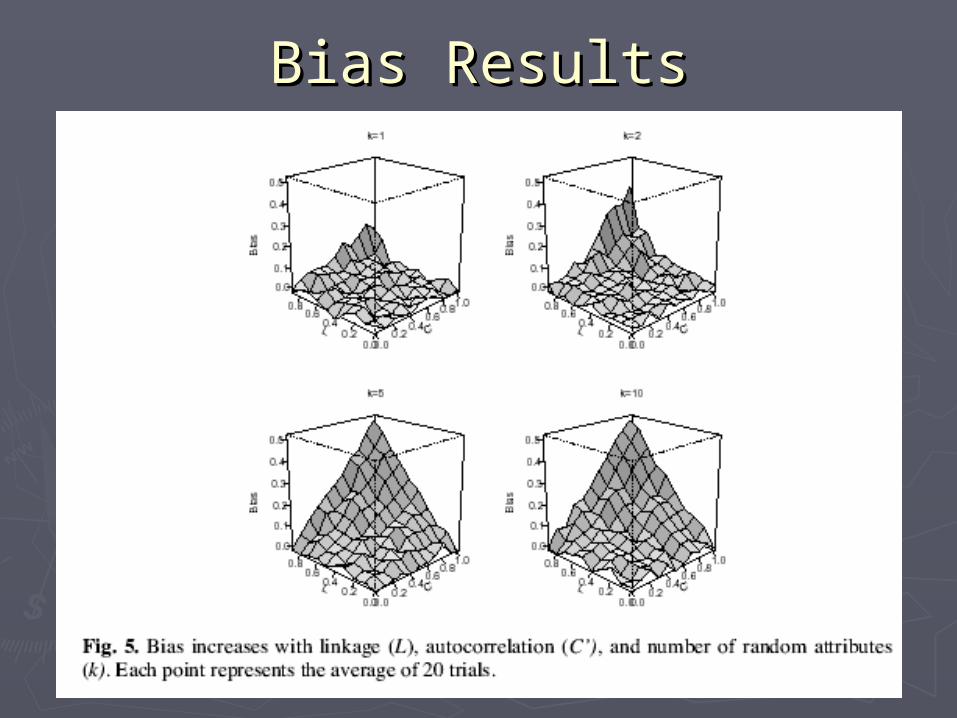
Bias ResultsBias Results
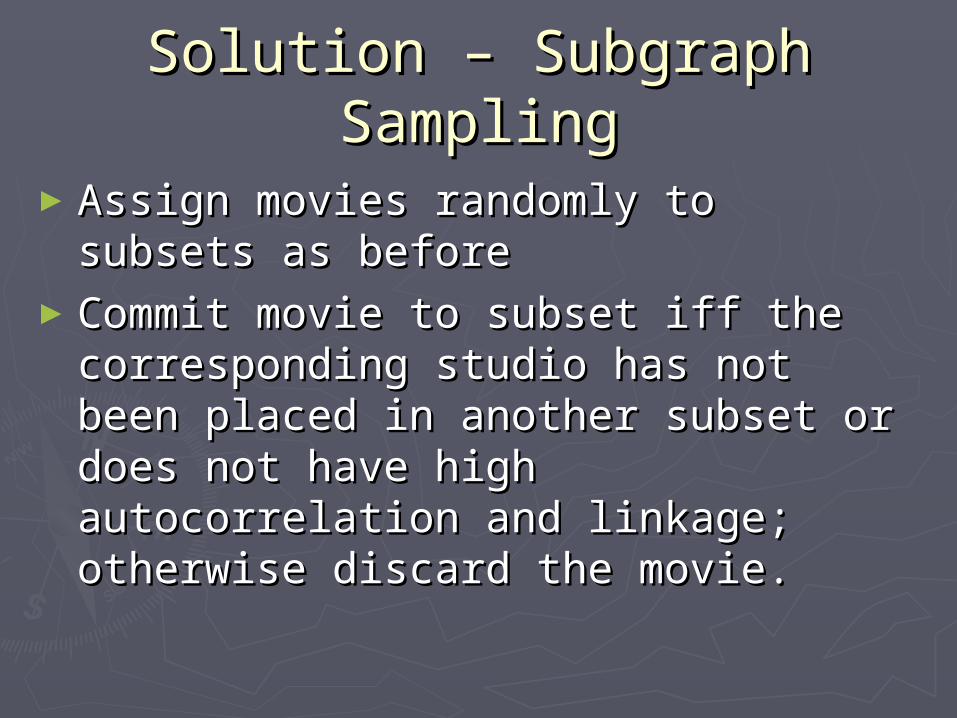
Solution – Subgraph Solution – Subgraph SamplingSampling
►Assign movies randomly to subsets as Assign movies randomly to subsets as beforebefore
►Commit movie to subset iff the Commit movie to subset iff the corresponding studio has not been corresponding studio has not been placed in another subset or does not placed in another subset or does not have high autocorrelation and linkage; have high autocorrelation and linkage; otherwise discard the movie.otherwise discard the movie.
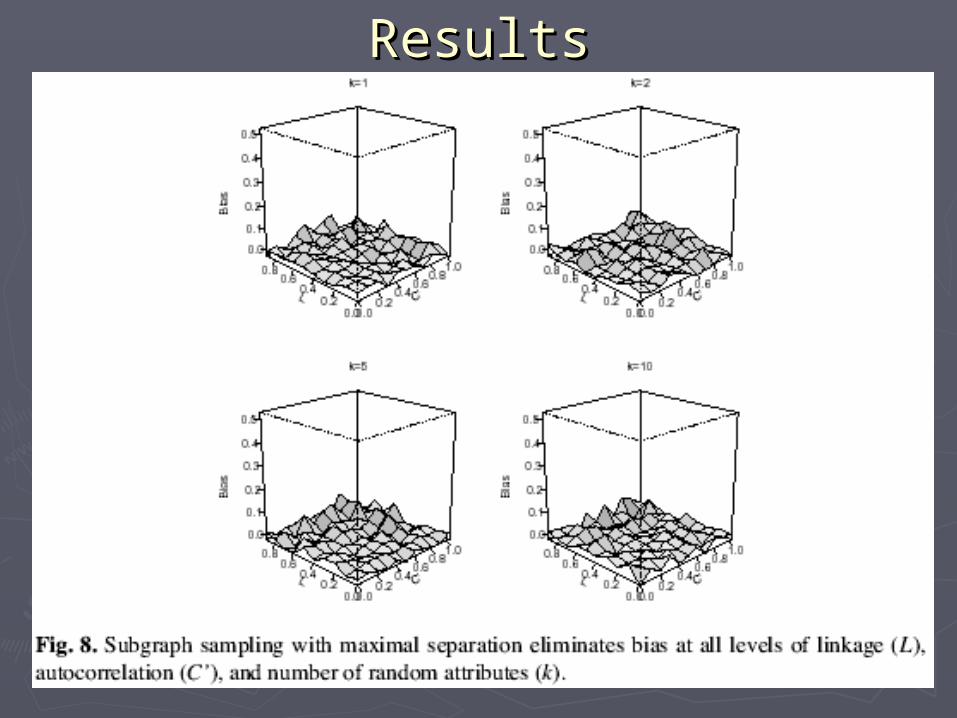
ResultsResults
ConclusionConclusion
►Using subgraphing combined with Using subgraphing combined with Linkage and Autocorrelation increases Linkage and Autocorrelation increases the evaluation accuracy of relational the evaluation accuracy of relational learners.learners.
Linkage and Autocorrelation Linkage and Autocorrelation Cause Feature Selection Bias in Cause Feature Selection Bias in
Relational LearningRelational Learning
David Jensen and Jennifer David Jensen and Jennifer NevilleNeville
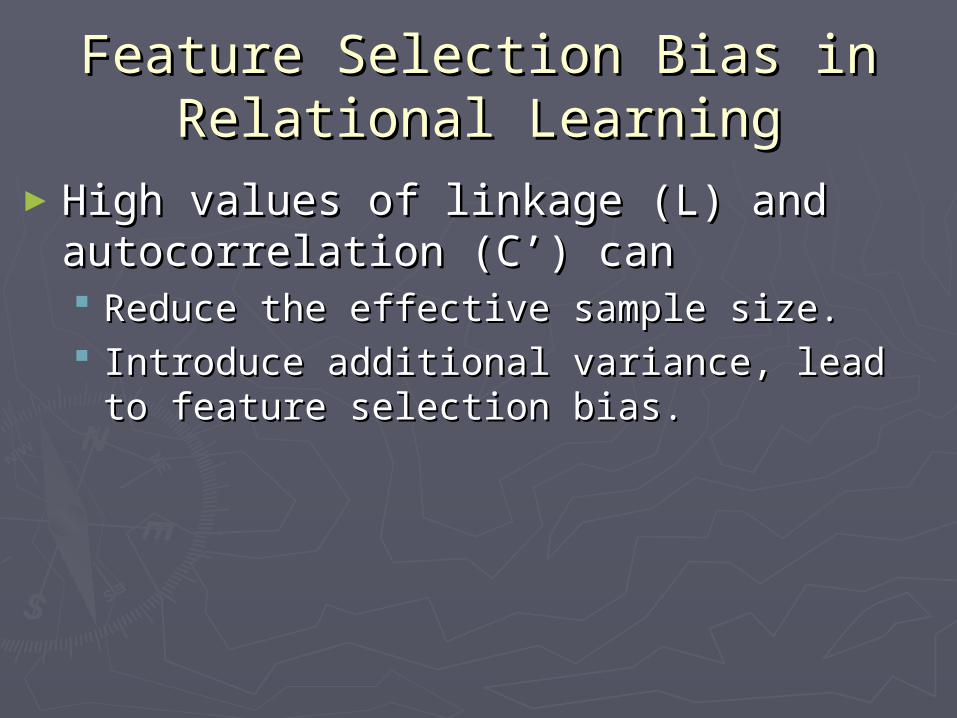
Feature Selection Bias in Feature Selection Bias in Relational LearningRelational Learning
►High values of linkage (L) and High values of linkage (L) and autocorrelation (C’) canautocorrelation (C’) can Reduce the effective sample size.Reduce the effective sample size. Introduce additional variance, lead to Introduce additional variance, lead to
feature selection bias.feature selection bias.
Feature SelectionFeature Selection
►Feature is a mapping between raw Feature is a mapping between raw data and a low-level inference.data and a low-level inference.
►Feature selection is a process of Feature selection is a process of choosing among features (e.g. choosing among features (e.g. identifying the best feature, choosing identifying the best feature, choosing features based on certain conditions).features based on certain conditions).
Relational Feature SelectionRelational Feature Selection
►Relational features are used for Relational features are used for predicting the value of an attribute on predicting the value of an attribute on one type of objects based on attributes one type of objects based on attributes of related objects.of related objects.
►Relational features increase predictive Relational features increase predictive power of inference procedures.power of inference procedures.
►But they can cause bias in selection But they can cause bias in selection process and lead to incorrect process and lead to incorrect estimation.estimation.
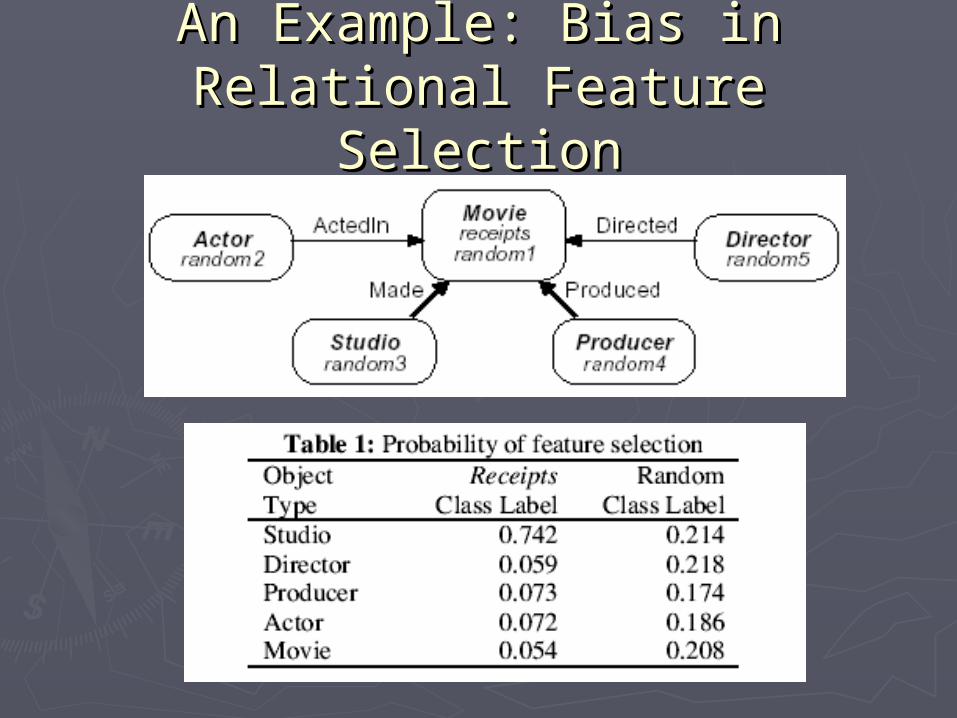
An Example: Bias in Relational An Example: Bias in Relational Feature SelectionFeature Selection
Effects of Linkage and Effects of Linkage and AutocorrelationAutocorrelation
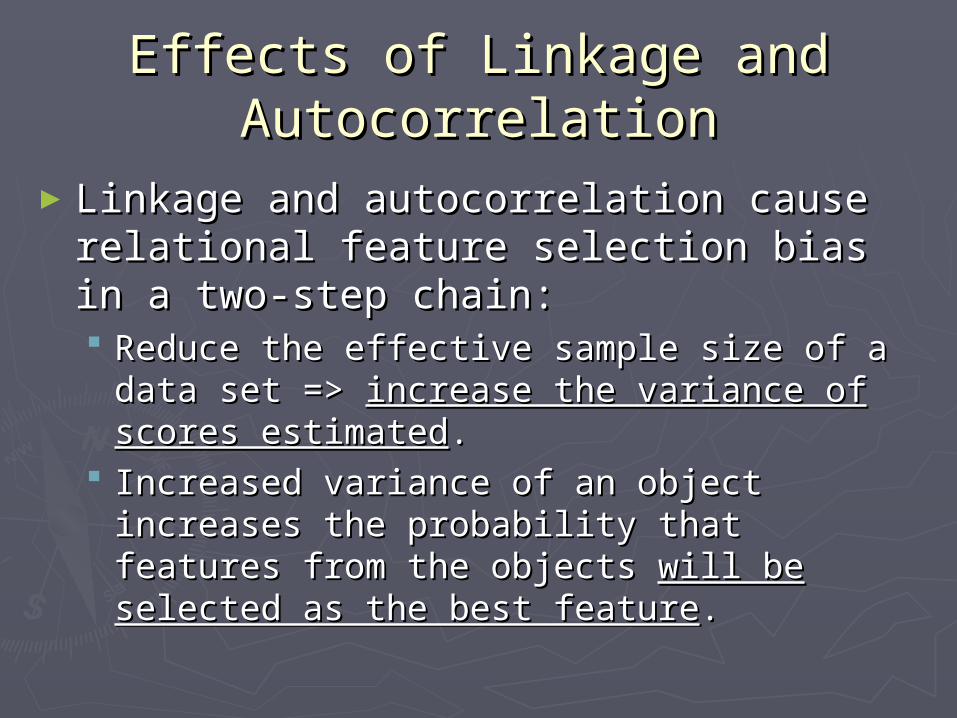
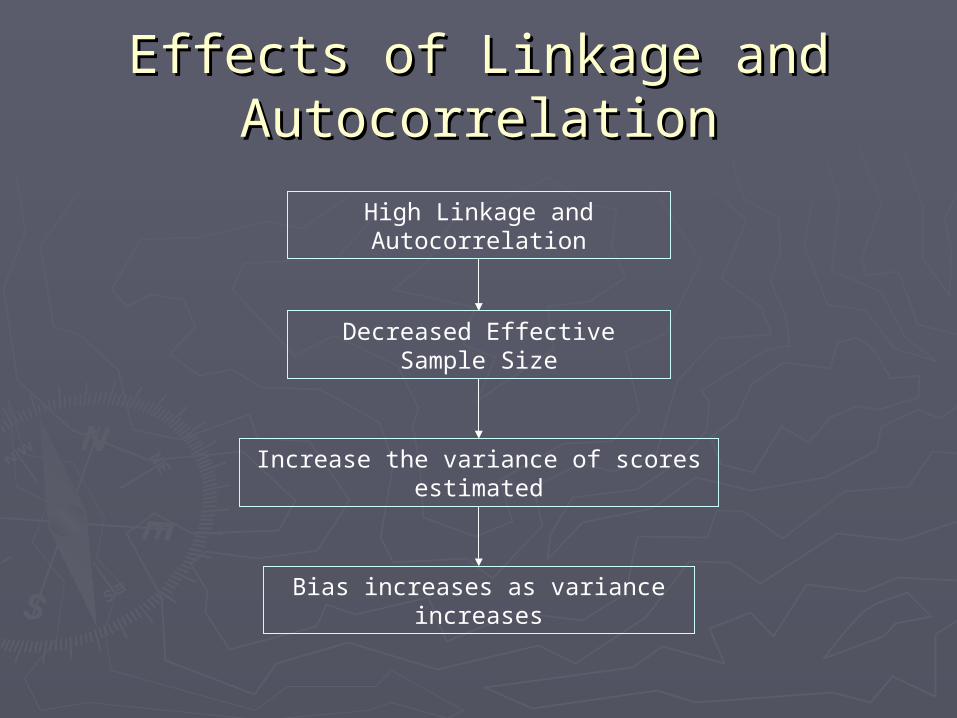
►Linkage and autocorrelation cause Linkage and autocorrelation cause relational feature selection bias in a relational feature selection bias in a two-step chain:two-step chain: Reduce the effective sample size of a data Reduce the effective sample size of a data
set => set => increase the variance of scores increase the variance of scores estimatedestimated..
Increased variance of an object increases Increased variance of an object increases the probability that features from the the probability that features from the objects objects will be selected as the best featurewill be selected as the best feature..
Decreased Effective Sample Decreased Effective Sample SizeSize
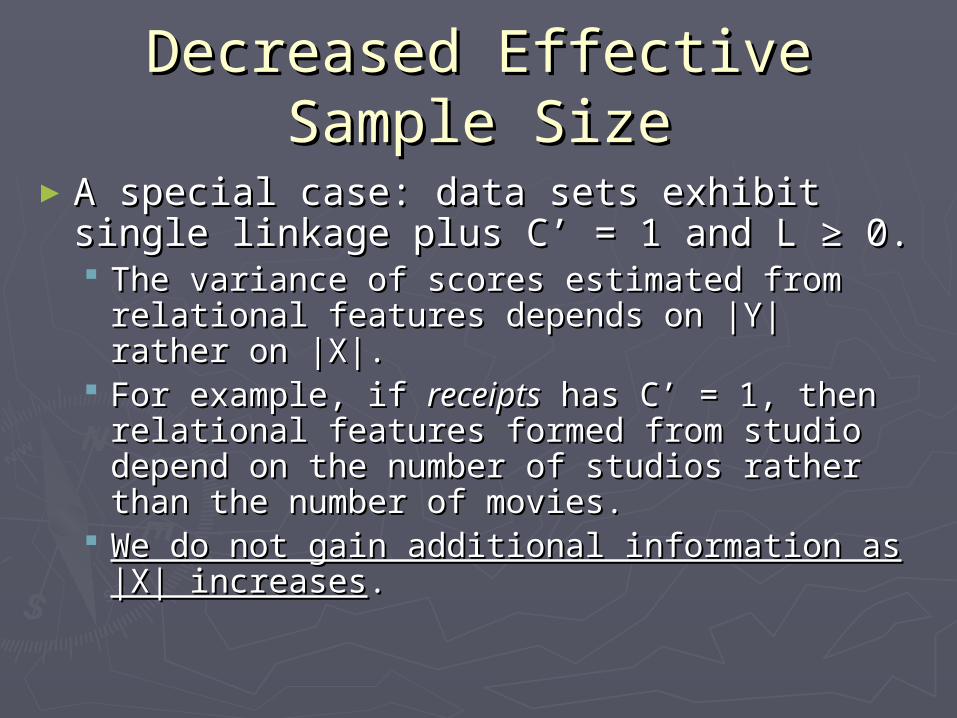
►A special case: data sets exhibit single A special case: data sets exhibit single linkage plus C’ = 1 and L ≥ 0.linkage plus C’ = 1 and L ≥ 0. The variance of scores estimated from The variance of scores estimated from
relational features depends on |Y| rather on relational features depends on |Y| rather on |X|.|X|.
For example, if For example, if receiptsreceipts has C’ = 1, then has C’ = 1, then relational features formed from studio relational features formed from studio depend on the number of studios rather depend on the number of studios rather than the number of movies.than the number of movies.
We do not gain additional information as |We do not gain additional information as |X| increasesX| increases..
Effective Sample Size (cont.)Effective Sample Size (cont.)
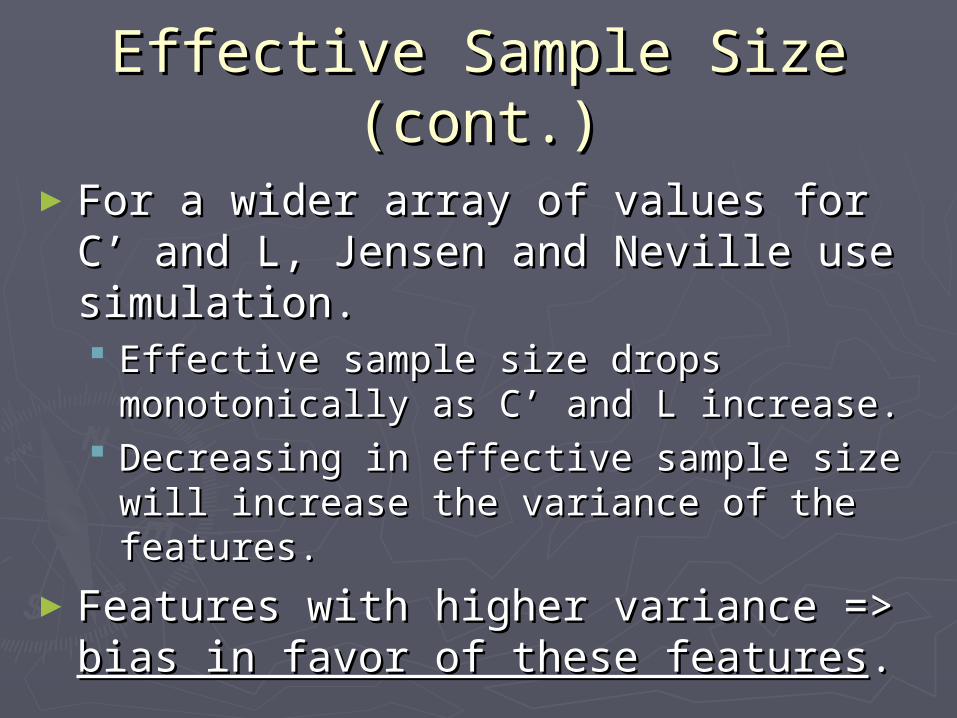
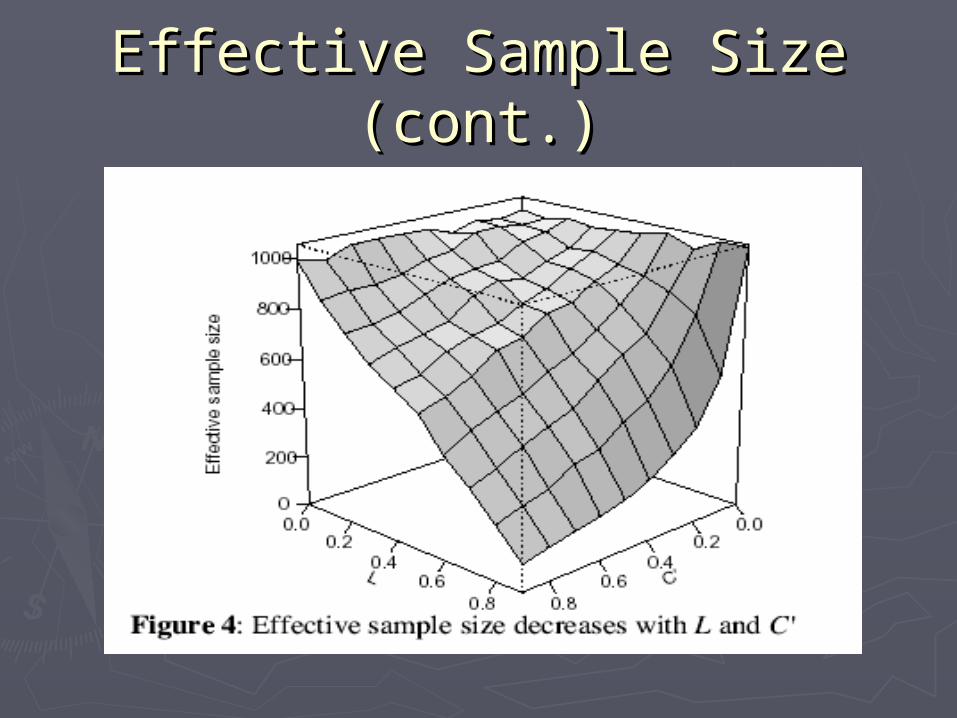
►For a wider array of values for C’ and For a wider array of values for C’ and L, Jensen and Neville use simulation.L, Jensen and Neville use simulation. Effective sample size drops monotonically Effective sample size drops monotonically
as C’ and L increase.as C’ and L increase. Decreasing in effective sample size will Decreasing in effective sample size will
increase the variance of the features.increase the variance of the features.
►Features with higher variance => Features with higher variance => bias bias in favor of these featuresin favor of these features..
Effective Sample Size (cont.)Effective Sample Size (cont.)
How Can Feature Selection How Can Feature Selection Bias?Bias?
►Why do features with higher variance Why do features with higher variance lead to a bias?lead to a bias?
►Features are usually formed by a local Features are usually formed by a local search over possible parameters of the search over possible parameters of the feature.feature.
►This local search is usually done prior to This local search is usually done prior to feature selection, so only the best feature selection, so only the best feature from each feature “family” is feature from each feature “family” is compared.compared.
Feature Selection BiasFeature Selection Bias
►Bias increases as the variance of the Bias increases as the variance of the score distributions increase.score distributions increase.
►Thus, the estimated score of features Thus, the estimated score of features formed from objects with high C’ and L formed from objects with high C’ and L will be more biased.will be more biased.
►For example, the studios have the For example, the studios have the highest variance that allow them to highest variance that allow them to exceed the scores of weakly useful exceed the scores of weakly useful features on other objects.features on other objects.
Effects of Linkage and Effects of Linkage and AutocorrelationAutocorrelation
High Linkage and Autocorrelation
Decreased Effective Sample Size
Increase the variance of scores estimated
Bias increases as variance increases
Estimating Score VarianceEstimating Score Variance
►Correcting for high variance is to Correcting for high variance is to obtain accurate estimates of variance obtain accurate estimates of variance for each feature.for each feature.
►Approach: bootstrap resampling.Approach: bootstrap resampling.
Bootstrap ResamplingBootstrap Resampling
► A technique for estimating characteristics of A technique for estimating characteristics of the sampling distribution of a given the sampling distribution of a given parameter:parameter: Generate multiple samples (Generate multiple samples (pseudosamplespseudosamples) by ) by
drawing, with replacement, from the original data. drawing, with replacement, from the original data. PseudosamplesPseudosamples have the same size as the original have the same size as the original
training set.training set. Estimate the variance of a parameter by estimating Estimate the variance of a parameter by estimating
the parameter on pseudosamples, and then finding the parameter on pseudosamples, and then finding the variance of the resulting distribution of scores.the variance of the resulting distribution of scores.
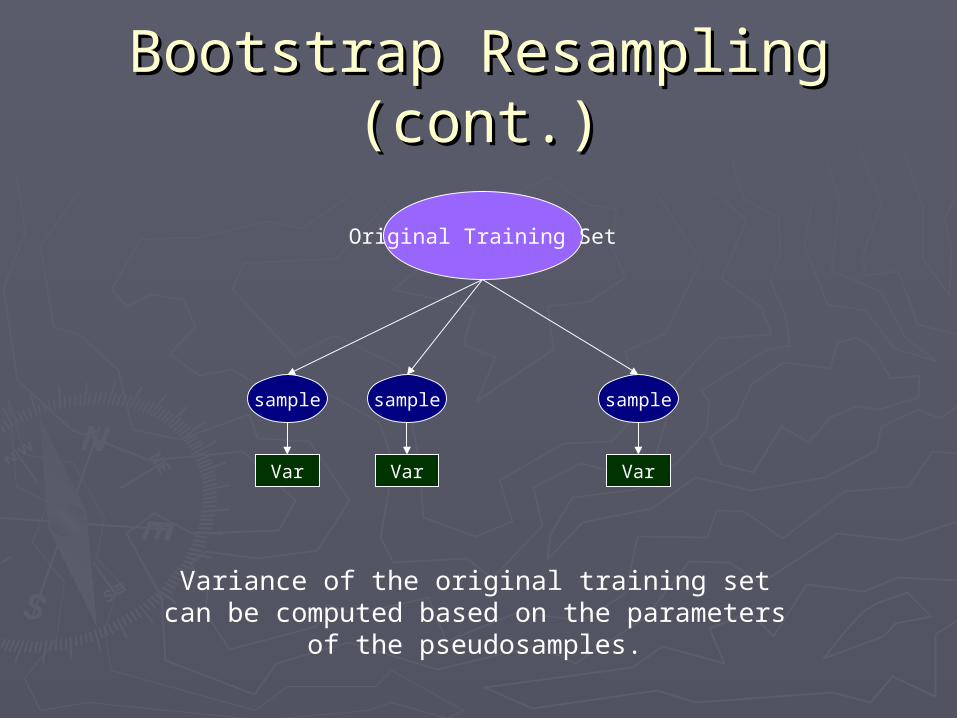
Bootstrap Resampling (cont.)Bootstrap Resampling (cont.)
Original Training Set
sample
Var
sample
Var
sample
Var
Variance of the original training set can be computed based on the parameters of the
pseudosamples.
Using Resampled EstimatesUsing Resampled Estimates
►Resampling can be used to estimate Resampling can be used to estimate the variance of scores for particular the variance of scores for particular features.features.
►The use of resampled estimates The use of resampled estimates remains an open problem. For example: remains an open problem. For example: In feature selection, how to compare In feature selection, how to compare variance estimates of different variance estimates of different features.features.
►A Research topicA Research topic!!
ConclusionConclusion
►High linkage and autocorrelation can High linkage and autocorrelation can cause bias for relational learning cause bias for relational learning algorithms.algorithms.
►Research ideas:Research ideas: How to use the variance estimates of various How to use the variance estimates of various
features to avoid feature selection bias.features to avoid feature selection bias. Avoiding feature selection bias by Avoiding feature selection bias by
considering additional informationconsidering additional information such as such as prior estimates of the true score.prior estimates of the true score.