Embed Size (px)
Citation preview

AUTO PARTS Research Brief
Sustainable Industry Classification System™ (SICS™) # TR0102
Research Briefing Prepared by the
Sustainability Accounting Standards Board®
www.sasb.org Copyright 2014 SEPTEMBER 2014
AUTO PARTS Research Brief SASB’s Industry Brief provides evidence for the material sustainability issues in the Auto Parts industry. The brief
opens with a summary of the industry, including relevant legislative and regulatory trends and sustainability risks
and opportunities. Following this, evidence for each material sustainability issue (in the categories of Environment,
Social Capital, Human Capital, Business Model and Innovation, and Leadership and Governance) is presented.
SASB’s Industry Brief can be used to understand the data underlying SASB Sustainability Accounting Standards.
For accounting metrics and disclosure guidance, please see SASB’s Sustainability Accounting Standards. For
information about the legal basis for SASB and SASB’s standards development process, please see the Conceptual
Framework.
SASB identifies the minimum set of sustainability issues likely to be material for companies within a given industry.
However, the final determination of materiality is the onus of the company. Related Documents • Auto Parts Sustainability Accounting Standards
• Industry Working Group Participants
• SASB Conceptual Framework
INDUSTRY LEAD Nashat Moin CONTRIBUTORS Andrew Collins Henrik Cotran Anton Gorodniuk Jerome Lavigne-Delville Himani Phadke Arturo Rodriguez Jean Rogers Gabriella Vozza SASB, Sustainability Accounting Standards Board, the SASB logo, SICS, Sustainable Industry Classification System,
Accounting for a Sustainable Future, and Materiality Map are trademarks and service marks of the Sustainability
Accounting Standards Board.
I N D U S T R Y B R I E F | A U T O P A R T S
INTRODUCTION
The automobile has become one of the most
popular solutions for personal mobility worldwide.
Vehicle ownership is a source of personal
independence and social status. Developed countries
such as the United States, Australia, New Zealand,
and Luxembourg have high rates of vehicle
ownership; over 700 motor vehicles per 1,000
people.1 The rate of vehicle ownership is much lower
in countries with developing economies, but is
growing with GDP, creating significant new markets
for auto makers. The Auto Parts industry supplies a
wide range of products used almost exclusively for
motor vehicle production. As an extension of the
Automobiles industry, the Auto Parts industry
depends on consumer demand for new vehicles in
order to succeed.
Emissions from personal vehicles are one of the main
contributors from the Transportation sector to global
greenhouse gases (GHGs), and therefore to climate
change. Additionally, the safety of drivers and
passengers is a paramount goal of automobile
manufacturers. With customer demand and
regulatory pressure for more fuel-efficient and safer
vehicles, the Auto Parts industry plays a crucial role
in driving innovation and reducing environmental
and social externalities of automobiles. Through
auto parts innovation, companies in the industry are
able to improve fuel efficiency and reduce emissions
of automobiles as well as ensure the safety of
vehicle drivers and passengers. As production has
shifted to emerging markets in order to lower costs,
and with the rising environmental and social
sensitivities in such markets, there is a potential for
increased regulatory scrutiny and public pressure for
improved environmental management of auto parts
manufacturing operations.
Management (or mismanagement) of material
sustainability issues, therefore, has the potential to
affect company valuation through impacts on
profits, assets, liabilities, and cost of capital.
Investors would obtain a more holistic and
comparable view of performance with Auto Parts
companies reporting metrics on the material
sustainability risks and opportunities that could
affect value in the near and long term in their
regulatory filings. This would include both positive
and negative externalities and the non-financial
forms of capital that the industry relies on for value
creation.
Specifically, performance on the following
sustainability issues will drive competitiveness within
the Auto Parts industry:
• Reducing energy use in the manufacturing
process;
• Improving resource efficiency through waste
management practices;
• Ensuring the highest standards of quality and
safety of auto parts;
• Managing environmental and social
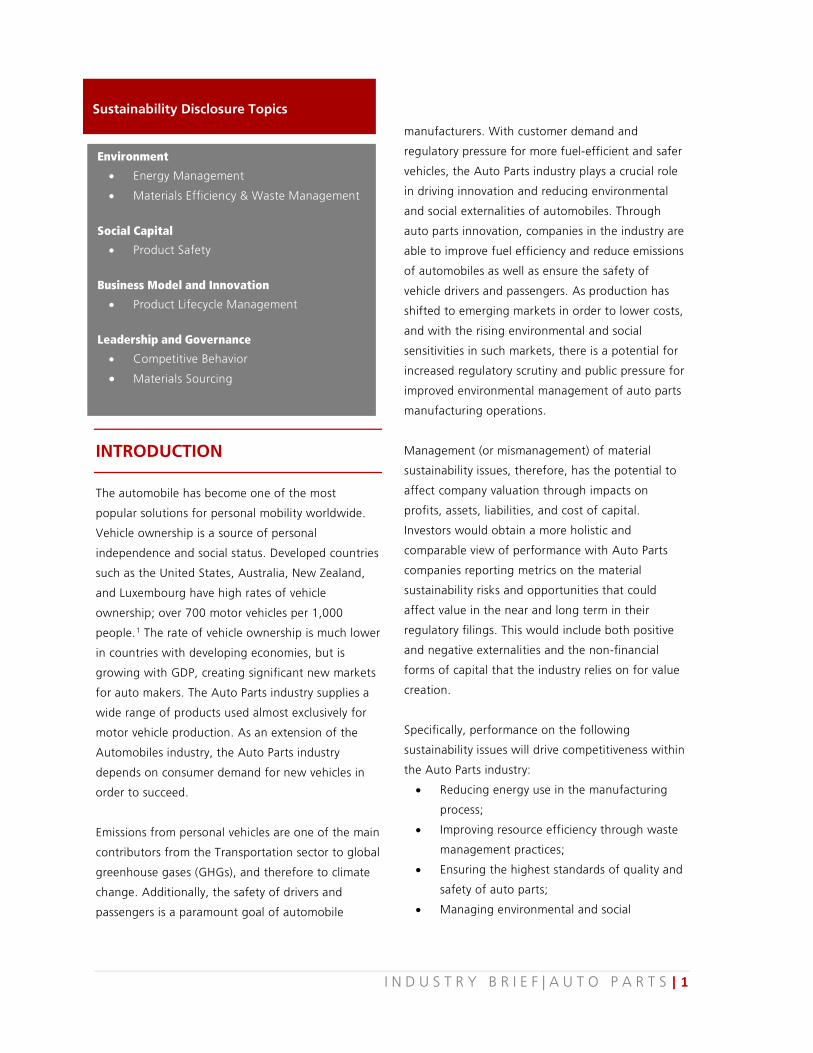
Sustainability Disclosure Topics
Environment
• Energy Management
• Materials Efficiency & Waste Management
Social Capital
• Product Safety
Business Model and Innovation
• Product Lifecycle Management
Leadership and Governance
• Competitive Behavior
• Materials Sourcing
I N D U S T R Y B R I E F | A U T O P A R T S | 1
externalities through product lifecycle
management;
• Ensuring competitive behavior through fair
pricing; and
• Ensuring strategies for supply chain
management and sourcing of key inputs that
reduce externalities while lowering risks to
company value.
INDUSTRY SUMMARY
The Auto Parts industry mostly supplies parts to
companies in the Automobiles industry, also known
as original equipment manufacturers (OEM). The
Auto Parts industry includes companies that
manufacture and assemble a wide variety of motor
vehicle parts and accessories, including engine
exhaust, alternative drivetrain and hybrid systems as
well as catalytic converters, aluminum wheels (rims),
tires, rearview mirrors, and onboard electrical and
electronic equipment.I
The automobile manufacturing value chain business
has a complex, highly fragmented supply chain that
includes procuring raw materials (such as steel,
aluminum, plastics, and glass), forming and
producing parts, and assembling parts into finished
products. The larger automotive industry includes
several tiers of suppliers that provide parts and raw
materials that are used to assemble a motor vehicle.
Tier 1 suppliers are those that supply parts directly to
I Industry composition is based on the mapping of the Sustainable Industry Classification System (SICSTM) to the Bloomberg Industry Classification System (BICS). A list of representative companies appears in Appendix I.
OEMs, and are the only suppliers included in SASB’s
Auto Parts industry. Tier 2 suppliers are those that
provide inputs for Tier 1 suppliers; Tier 3 provides
inputs to Tier 2 and so on. A number of Tier 1
suppliers, such as engine and stamping facilities, are
owned and operated by OEMs, and are also known
as captive suppliers. Some of the largest
independent Tier 1 suppliers were previously captive
plants, e.g., Delphi Automotive, Denso Corporation,
and Visteon Corporation.
The global auto parts manufacturing market is
valued at approximately $1.1 trillion, with no more
than 15 percent reported as coming from a specific
auto parts product. Tire manufacturing is the largest
single segment of the Auto Parts industry, with
$165.6 billion in global revenues, followed by
seating and trim manufacturing with $116.3 billion,
and drivetrain components manufacturing with
$112.1 billion.2 Companies listed on U.S. exchanges
generate $166 billion from the industry. In 2013, the
median operating margin for those companies was
6.9 percent while the median net income margin
was 3.2 percent, which has been relatively flat over
the last four years.3
The number of vehicles in use, in addition to the
number of newly manufactured vehicles, is the main
driver of demand in the Auto Parts industry. Periods
of economic downturn are characterized by longer
vehicle lifespans, and therefore a greater demand
for replacement parts. In times of economic
expansion, however, more vehicles are being
manufactured and sold, which results in a higher
demand for auto parts from OEMs.4 In the U.S., auto
parts suppliers generate only between four and
I N D U S T R Y B R I E F | A U T O P A R T S | 2
seven percent of their revenue from aftermarket
sales, which cover replacement parts, while the
majority of parts are sold to vehicle manufacturers.
However, sales to OEMs generate a much lower
profit margin than sales of aftermarket parts.5
Globally, this picture is different, with only 49.1
percent of sales revenues coming from OEMs, 27.3
percent from aftermarket sales, and 23.6 percent
from exports.6
The industry’s capital intensity is very high and
companies achieve competitive advantage by
investing in capital equipment. Cost of purchases,
including raw materials, semi-finished products, and
completed parts, accounts for approximately 65
percent of the industry’s revenue. Therefore, volatile
prices of commodities such as steel have a strong
impact on profit margins. Wages are the second
highest portion of operating expenses for auto parts
manufacturers and account for 10 percent of
revenue.7
The 2008 financial crisis was especially difficult for
American auto makers and consequently for their
auto parts suppliers. Since many large auto parts
manufacturers were in Chapter 11 bankruptcy filings
or had recently emerged from Chapter 11, several
companies were able to negotiate with unions to
lower wages and cut back or lower benefits.
Between March and December of 2009, some of the
largest auto parts companies, including Delphi,
Visteon, and Dana, eliminated or reduced healthcare
benefits for current and future workers and
retirees.8
At any given time, an OEM may have contracts with
several suppliers that provide different components.
While the total number of companies in the Auto
Parts industry is large, there may be a limited
number of suppliers for any specific component,
giving some companies market dominance in
specific segments. For some parts, OEMs may have
only one or a limited number or suppliers, whose
replacement could be difficult. Automobile
manufacturing companies have both long-standing
relationships and short-term contracts with
suppliers. While switching costs are high, short-term
contracts can help maintain a level of competition
among suppliers.9
Major industry players, including TRW Automotive,
Delphi Automotive, Bridgestone, and Tenneco,
operate plants across the Americas, Europe, and
Asia and typically supply parts to several large auto
makers. As auto manufacturers compete for market
share, auto parts suppliers face intense pressure
from OEMs to reduce prices. Thus, lower labor costs
and increasing automobile sales in emerging
economies are driving parts production to these
markets. For example, the Asia-Pacific region
accounted for 48 percent of global automobile sales
in 2013, up from 34 percent in 2007.10 In North
America, South America, Europe, Southern Africa,
and Asia, regional parts producers tend to supply
auto makers that produce vehicles for the regional
markets. Even though auto parts are more heavily
traded than assembled vehicles, parts that are more
bulky, heavy, and model-specific, such as engines,
transmissions, and seats, are produced close to final
assembly plants, while lighter generic parts, such as
tires and batteries, are produced where companies
can take advantage of economies of scale and lower
I N D U S T R Y B R I E F | A U T O P A R T S | 3
labor costs.11
As regulators are tightening GHG emissions
standards, the demand for more advanced, lighter,
fuel-efficient auto parts is expected to grow. As the
market is shifting from developed economies to
emerging economies and the demand for more fuel-
efficient cars is growing, demand for different auto
parts will adjust accordingly. For example, in the
long run the popularity of electric cars may
challenge the demand for auto parts used in
traditional vehicles while boosting production of
products used in zero-emission vehicles (ZEVs) or
hybrids. The demand for emissions-reducing devices
is growing in conjunction with the growth in sales of
clean diesel powertrain offerings. Both auto parts
suppliers and OEMs can drive this type of
innovation. Innovative suppliers that address
regulatory pressures or customer preferences are
able to achieve greater sales. In other cases, OEMs
and suppliers collaborate closely to push products to
the next level.
LEGISLATIVE AND REGULATORY TRENDS IN THE AUTO PARTS INDUSTRY
The following section provides a brief summary of
key regulations and legislative efforts related to the
Auto Parts industry.II The Automobiles industry is
regulated by standards on safety, fuel economy,
emissions control, noise control, vehicle recycling,
II This section does not purport to contain a comprehensive review of all regulations related to this industry, but is intended to highlight some ways in which regulatory trends are impacting the industry.
use of substances of concern, vehicle damage, and
theft prevention. In addition to regulations related
to use and disposal of vehicles, the industry must
also comply with local regulations regarding the
environmental, social, and governance aspects of
their operations. Many of these regulations,
especially those pertaining to the environment and
social factors, are becoming more stringent. Auto
parts manufacturers are, in turn, affected by the
regulations governing the Automobiles industry.
Auto parts manufacturers can leverage these
changing demands on OEMs and supply them with
components that enable them to address these
regulations.
Across the world, regulations around fuel efficiency
of engines and emissions from vehicle use are
growing more stringent. In the U.S., a sales-
weighted average fuel economy of 45 miles per
gallon (mpg) is mandated by the 2021 model year.
Vehicle efficiency is also regulated at the state level.
In California, for example, 4.5 percent of
manufacturers’ state sales in 2018 must be ZEVs or a
mixture of ZEV and plug-in hybrid.12 In contrast, E.U.
regulations are more rigorous and based on tailpipe
emissions. By 2020, vehicles sold in the region will
be allowed to emit no more than 95 grams of
carbon dioxide per kilometer (g CO2/km), using a
sliding scale based on vehicle weight. III Non-E.U.
countries, such as Canada, Mexico, and many
countries in the Asia-Pacific region, are adopting
fuel economy standards with specific regulations
around disclosure of vehicle fuel economy at points
of sale. As a result of these regulations, auto parts
III 95 g/km is approximately equivalent to 57 mpg.
I N D U S T R Y B R I E F | A U T O P A R T S | 4
manufacturers are likely to see an increasing
demand from OEMs for products aimed at improving
fuel efficiency and reducing vehicle emissions.
Standards for motor vehicle safety vary across
regions. In the U.S., motor vehicle safety is regulated
by the U.S. National Traffic and Motor Vehicle Safety
Act of 1966. For auto parts manufacturers, meeting
safety standards can conflict with emissions and fuel
economy standards because additional safety
measures can add weight to a vehicle and reduce its
fuel economy. But innovation in the use of
lightweight, high-strength materials may help auto
parts makers overcome this trade-off. The U.S.
Department of Transportation’s National Highway
Traffic Safety Administration (NHTSA) has the
authority to order the recall of automotive products,
including tires that have safety-related defects.
Vehicles must be recalled if any safety standard is
not met. The Transportation Recall Enhancement,
Accountability, and Documentation Act, or TREAD
Act, enacted on November 1, 2000, imposes
numerous requirements on OEMs and auto parts
manufacturers with respect to early-warning
reporting of warranty claims, property damage
claims, and bodily injury and fatality claims.13 Other
countries, such as those in the E.U., also have safety
regulations that are likely to become more stringent
in the future. The E.U. puts an emphasis on active
features such as stability control and automatic
brake assistance.
The E.U. Directive on End-of-life Vehicles is built on
the concept of extended producer responsibility. It is
designed to encourage auto manufacturers to “limit
the use of hazardous substances in their new
vehicles; design and produce vehicles which facilitate
re-use and recycling; [and] develop the integration
of recycled materials.”14 According to the directive,
95 percent of the vehicle by weight must be
recoverable and 85 percent recyclable by 2015.
Since July 2003, the E.U. has banned the use of
mercury, hexavalent chromium, cadmium, and lead
in the components of vehicles placed on the
market.15 This directive indirectly puts pressure on
auto parts suppliers to modify parts in order to
facilitate the process of recycling and reuse, in
addition to pressure to limit the use of hazardous
substances in their products. Moreover, the Auto
Parts industry generates significant amounts of
hazardous and non-hazardous waste. The E.U.
Waste Framework Directive and the U.S. Resource
Conservation and Recovery Act (RCRA) provide
frameworks for the collection, transport, recovery,
and disposal of waste from manufacturing
facilities.16
Finally, with the increasing computerization of cars
and auto parts, companies in this industry are
subject to the conflict minerals disclosure rule of the
Dodd-Frank Act of 2010 and subsequent rules
adopted by the U.S. Securities and Exchange
Commission (SEC). Auto parts companies are
required to publicly disclose their use of “conflict
minerals” if they are “necessary to the functionality
or production of a product” that the company
manufactures or contracts to be manufactured.
These minerals include tantalum, tin, gold, or
tungsten, originating in the Democratic Republic of
the Congo (DRC) or adjoining countries.17
I N D U S T R Y B R I E F | A U T O P A R T S | 5
SUSTAINABILITY-RELATED RISKS AND OPPORTUNITIES
Industry drivers and recent regulations suggest that
traditional value drivers will continue to impact
financial performance. However, intangible assets
such as social, human, and environmental capitals,
company leadership and governance, and the
company’s ability to innovate to address these issues
are likely to increasingly contribute to financial and
business value.
Broad industry trends and characteristics are driving
the importance of sustainability performance in the
Auto Parts industry:
• Lifecycle impacts: The most significant
environmental and social impacts of auto
parts lifecycles occur at the use phase of the
automobile rather than during assembly.
While OEMs face increasingly stringent
regulations that require constant innovation
in the manufacturing process and design of
vehicles, these are passed onto auto parts
suppliers who must also innovate to address
the regulations. The design of auto parts can
reduce the significant environmental impacts
associated with use-phase and end-of-life
disposal of automobiles.
• Resource scarcity: Auto parts manufacturing
is a material-intensive process that is
impacted by growing resource scarcity and
the increasing prices of critical materials.
As described above, the regulatory and legislative
environment surrounding the Auto Parts industry
emphasizes the importance of sustainability
management and performance. Specifically, recent
trends suggest a regulatory emphasis on reduction
of environmental impacts and high safety standards,
which will serve to align the interests of society with
those of investors.
The following section provides a brief description of
each sustainability issue that is likely to have
material implications for companies in the Auto Parts
industry. This includes an explanation of how the
issue could impact valuation and evidence of actual
financial impact. Further information on the nature
of the value impact, based on SASB’s research and
analysis, is provided in Appendix IIA and IIB.
Appendix IIA also provides a summary of the
evidence of investor interest in the issues. This is
based on a systematic analysis of companies’ 10-K
and 20-F filings, shareholder resolutions, and other
public documents. It also based on the results of
consultation with experts participating in an industry
working group convened by SASB.
A summary of the recommended disclosure
framework and accounting metrics appears in
Appendix III. The complete SASB standards for the
industry, including technical protocols, can be
downloaded from www.sasb.org. Finally, Appendix
IV provides an analysis of the quality of current
disclosure on these issues in SEC filings by the
leading companies in the industry.
I N D U S T R Y B R I E F | A U T O P A R T S | 6
ENVIRONMENT
The environmental dimension of sustainability
includes corporate impacts on the environment. This
could be through the use of natural resources as
inputs to the factors of production (e.g., water,
minerals, ecosystems, and biodiversity) or
environmental externalities and harmful releases in
the environment, such as air and water pollution,
waste disposal, and GHG emissions.
Similar to other manufacturing industries, auto parts
companies use significant amounts of materials and
generate hazardous and non-hazardous waste in
their operations. This can create environmental
externalities that may affect the value of an auto
parts manufacturer. As resources become limited or
exhibit price volatility, and legislation seeks to
address externalities, companies need to manage
these risks and innovate to reduce the
environmental impacts of their operations in order
to protect shareholder value.
Energy Management Most of the energy consumption in the vehicle
manufacturing process happens in the supply chain.
Auto parts manufacturers’ use of electricity and
fossil fuels in their production processes results in
direct and indirect emissions of GHGs. Purchased
electricity represents a major share of the energy
sources used in the Auto Parts industry. Major uses
of electricity in the industry vary depending on the
type of component being manufactured. From
extruding rubber and metals, die cutting, melting
lead, and flash drying to cutting fabric, the various
automated and manual processes all require energy.
Therefore, by improving efficiency of the
manufacturing process, companies can reduce their
indirect GHG impact as well as reducing their
operating expenses.
Fossil fuel-based energy production and
consumption contribute to significant environmental
impacts, including climate change and pollution,
which have the potential to indirectly yet materially
impact the results of operation of auto parts
companies. Sustainability factors, such as GHG
emissions pricing, incentives for energy efficiency
and renewable energy, and risks associated with
nuclear energy and its increasingly limited license to
operate are leading to an increase in the cost of
conventional energy sources while making
alternative sources cost-competitive. Therefore, it is
becoming increasingly material for companies in
energy-intensive industries to manage their overall
energy efficiency, their reliance on different types of
energy and the associated risks, and their access to
alternative energy sources.
Company performance in this area can be analyzed
internally and externally through the following direct
or indirect performance metrics (see Appendix III for
metrics with their full detail):
• Total energy consumed, percentage grid
electricity, percentage renewable.
Evidence The energy consumed in the production of an
automobile is concentrated in the supply chain of
auto makers. Only 12 percent of the total energy
I N D U S T R Y B R I E F | A U T O P A R T S | 7
required in vehicle production is utilized by OEMs
that assemble the final product. The remaining 88
percent is consumed by the supply chain, for
activities ranging from metal mining and casting to
parts production.18 As part of this supply chain, the
Auto Parts industry can have a significant impact on
lifecycle energy consumption through its own
operations.
Manufacturing processes in the Auto Parts industry
require significant energy consumption. According
to 2011 data from the Annual Survey of
Manufacturers, conducted by the U.S. Census
Bureau, the “motor vehicle parts manufacturing”
(NAICS code 3363) and “tire manufacturing” (NAICS
code 32621) industries purchased 25.8 billion kWh
of electricity for heat and power, which represented
3.1 percent of the total energy consumption of the
manufacturing sector. Electricity purchases
accounted for $1.7 billion of operating expenses, or
3.3 percent of the electricity purchases of the
manufacturing sector. The Auto Parts industry
(which includes NAICS codes 3363 and 32621
industries) reported electricity purchases that were
2.6 times that of the “motor vehicle manufacturing
industry” (NAICS code 3361) in absolute amount of
kWh and 3.5 times that of the “motor vehicle
manufacturing industry” in terms of operating
expenses.19 As the Auto Parts industry has relatively
thin net income margins of 3.2 percent, initiatives
aimed at reducing energy consumption may have a
positive impact on operational efficiency.
Due to the energy intensity of their operations,
energy costs can be significant for auto parts
manufacturers. In 2012, TRW Automotive, an active
and passive safety auto parts manufacturer, spent
more than $202 million in worldwide utility
purchases. This highlights the company’s reliance on
electricity and the significance of its Scope 2
emissions. While expenditure on utility purchases
represented less than two percent of TRW’s revenue
in absolute terms, the monetary cost is significant.20
According to 2013 CDP data, auto parts
manufacturers consistently reported having
significantly higher Scope 2 emissions than Scope 1
emissions. For example, for the fiscal year ended
December 31, 2012, Delphi Automotive reported
Scope 2 emissions of 592,662 metric tons of CO2e,
or over eight times their Scope 1 emissions.
Likewise, for the fiscal year ended September 30,
2012, Johnson Controls reported 1,465,658 metric
tons of CO2e, nearly twice as much as their Scope 1
emissions.2122 This indicates the importance of
managing electricity use as a means of reducing
exposure to rising or volatile energy prices that may
include indirect carbon prices.
As an additional benefit to saving energy costs,
decreasing energy consumption reduces direct and
indirect GHG emissions. Many auto parts suppliers
have stated targets for reduction of both Scope 1
and Scope 2 GHG emissions in their corporate social
responsibility (CSR) reports. Goodyear, a tire
manufacturer, states in its 2012 CSR report that, in
2011, all of its German plants signed a contract to
purchase electricity from only renewable sources.
The company has a target of reducing energy use by
15 percent by 2015 from 2010 levels.23 Denso
Corporation, a Japanese diversified automotive parts
supplier, has a similar emissions-reduction target,
aiming to generate lower emissions than 1991
levels.24
I N D U S T R Y B R I E F | A U T O P A R T S | 8
With electricity costs increasing, companies in the
industry are trying to lower their reliance on grid
electricity by investing in alternative sources of
energy. For example, Delphi Automotive is trying to
minimize environmental impacts at its Mexican
facilities by using energy from renewable sources.
According to the company, 11 of its plants across
Mexico get 30 percent of their electric energy from
renewable resources. The company recognizes
material impacts associated with energy
management in the following statement: "The cost
of electric power has significant impact on the
operations of Delphi Mexico. The energy market
environment, generally with an upward trend, also
impacts our operations' competitiveness. That is why
the global operations group in Mexico has been
looking for lower cost, sustainable energy
alternatives with reduced environmental impact." As
a result of the investment, Delphi reduced its
electricity costs by three to five percent.25
Value Impact Energy management is likely to have a chronic
impact on value though operational costs. Auto
parts manufacturers that invest in process innovation
aimed at reducing electricity consumption as well as
research and development of alternative sources of
energy are likely to improve their operational
efficiency in the medium to long term. Lower
reliance on traditional sources of energy and greater
share of purchased or self-generated electricity from
renewable sources indicates a firm’s ability to
mitigate its environmental footprint and its exposure
to energy cost increases driven by sustainability
impacts.
Materials Efficiency & Waste Management
The auto parts manufacturing process involves the
use of significant amounts of materials (including
steel, iron, aluminum, and plastics, among others).
Types of waste generated in the Auto Parts industry
include machine lubricants and coolants, aqueous
and solvent cleaning systems, paint, and scrap
metals and plastics.26 As stated above, the cost of
materials represents a significant portion of auto
parts manufacturers’ revenue. Due to constrained
resources, material prices are likely to increase in the
future. Therefore, companies that are able to
manage their inputs through reducing and recycling
manufacturing waste are likely to be better
protected from price volatility. Moreover, auto parts
manufacturers can achieve substantial savings,
reduce energy intensity, and improve their
operational efficiency by increasing the amount of
waste that is recycled. Improvement of waste
management can reduce environmental impacts,
which would result in lower remediation costs as
well as reduced risk of litigations and regulatory
penalties.
Company performance in this area can be analyzed
in a cost-beneficial way internally and externally
through the following direct or indirect performance
metrics (see Appendix III for metrics with their full
detail):
• Amount of total waste from manufacturing,
percentage hazardous, percentage recycled.
I N D U S T R Y B R I E F | A U T O P A R T S | 9
Evidence Motor vehicle parts manufacturing (NAICS code
3363) ranked 25th in terms of the fifty largest
quantities of RCRA hazardous waste generated in
2011 in the U.S. In 2011, auto parts manufacturing
facilities in the U.S. generated 38,188 tons of
hazardous waste.27 Motor vehicle parts
manufacturing facilities spent around $220 million
on pollution-abatement operating costs. The
industry’s pollution-abatement capital expenditures
accounted for 1.7 percent of pollution-abatement
capital expenditures by all U.S. manufacturing
industries, at around $102 million, according to EPA
data for 2005 (the latest available data).28 Auto parts
companies disclose capital expenditures related to
mitigation of pollution in their SEC filings. For
example, Goodyear Tire states: “We expect capital
expenditures for pollution control facilities and
occupational safety and health projects to be
approximately $42 million and $74 million during
2014 and 2015, respectively.”29
Further analysis of the 10-K filings of the largest
auto parts companies shows that processing and
disposal of hazardous and non-hazardous waste is
likely to be a material issue for manufacturers. One
reason for this is the regulatory liabilities that
companies could face for remediation following
inadequate treatment of waste. For example,
Johnson Controls states that “the Company is
responding to allegations that it is responsible for
performing environmental remediation, or for the
repayment of costs spent by governmental entities
or others performing remediation, at approximately
38 sites in the United States,” including many
landfills used by the company. Johnson Controls’
reserves for environmental liabilities totaled
$25 million and $30 million as of September 30,
2012 and 2011, respectively.30 As of December 31,
2013 and 2012, TRW Automotive’s reserves for
environmental matters were $68 million and $67
million, respectively.31 Annually, TRW spends $8 to
$10 million for remediation activities and has
reserves of approximately $70 million for ongoing
and future remediation activities.32 According to the
10-K filings of auto parts makers Visteon
Corporation, Borgwarner, and Federal Mogul,
corporate environmental liabilities ranged from
$1 million to $15 million as of December 31, 2012.
Manufacturers also state that actual liabilities may
exceed the reserves in cases that include additional
violations, and the results of operations could be
materially affected.
Waste treatment and disposal regulations can
increase the risk of litigation, which may result in
large compensation payments or settlements.
Vehicle parts manufacturer East Side agreed to settle
waste-related class action lawsuits for a total of $7.2
million. The lawsuits allege that the company failed
for more than 15 years to adequately investigate
and clean up contaminants, including the human
carcinogen tetrachloroethylene (PCE), that have
seeped into the ground water, contaminated the
soil, and whose vapors have entered the houses
neighboring the company’s facilities.33
As mentioned in the industry description, cost of
materials accounts for about 65 percent of revenue
for auto parts manufacturers. Waste reduction
initiatives can save expenditures on energy, water,
and raw materials. JPMorgan estimates that
I N D U S T R Y B R I E F | A U T O P A R T S | 10

throughout the period from 2013 to 2015, Pirelli,
Italian tire manufacturer, is likely to achieve around
36 percent of cumulative cost savings from raw
materials, driven by waste reduction, the use of
alternative raw materials, and sourcing cost
rationalization. The report further states, “[u]sing
Pirelli's strategic and operational targets for 2013,
we calculate that Pirelli can achieve between €20m–
€35m in savings from more efficient use of raw
materials.”34
Innovation in manufacturing processes may not only
reduce production costs and increase materials
utilization but also reduce the amount of scrap
metal generated. For example, in its Form 20-F,
China Zenix Auto International, a vehicle wheel
manufacturer, stated that its more cost-effective
steel cutting technique helped the company to
maximize the number of rounded plates that can be
stamped from a steel plate. This resulted in a higher
raw material utilization rate, reduced the amount of
scrap steel, and lowered the total production costs.
Furthermore, by using the spinning and pressing
method instead of the traditional pressing method
for shaping the wheel discs, the company reduced
the amount of steel used per wheel. The method
helped to reduce the weight of the wheel without
lessening the strength and durability of the wheel
disc.35
The auto parts manufacturing plants of Robert Bosch
GmbH, a multinational engineering and electronics
company, use a remanufacturing initiative that
includes an “intelligent return system” for old
components that no longer work. The company
remanufactures about 2.5 million parts each year,
making the initiative a significant revenue source.
For just one of the company’s facilities in Germany,
the total volume of reused materials includes 240
tons of copper, 440 tons of aluminum, and 2,200
tons of steel annually. The system helped the
company to reduce its waste by 5.4 percent from
2007 to 2011.36 According to Denso’s 2012 CSR
report, the company is “working to expand its parts
rebuilding business by practicing recycling with the
following priorities (…): product reconditioning
(rebuilding) > parts reuse > material recycling.”37
At one of TRW’s facilities in Reynosa del Norte,
Mexico, which manufactures plastic fasteners and
components, the company reduced the amount of
plastic scrap disposed by more than 600 tons per
year and reduced electricity consumption by more
than 1.2 million kWh per year. The improvements
helped the company to save $129,000 per year in
energy and waste-disposal costs. Similar initiatives
aimed at minimizing raw materials consumption
were taken at the TRW’s Pruszkow facility in Poland.
TRW reduced its process-related costs at the facility
by more than $ 50,000 per year.38
Value Impact Materials efficiency is likely to have a chronic impact
on value through operational costs while waste
management can result in acute impacts on value as
a result of regulatory noncompliance. Cost of raw
materials is a substantial part of the cost of goods
sold. Companies that are able to re-use waste from
scrap metals and plastic can achieve significant cost
savings, improve profitability, and be better
positioned to mitigate the impact of scarcity and
price increases of raw materials.
I N D U S T R Y B R I E F | A U T O P A R T S | 11
Waste management and prevention of
environmental externalities is driven by regulatory
pressure. As the evidence shows, violation of
environmental regulations around waste can lead to
substantial fines and can require capital expenditures
for pollution-control facilities and occupational
safety and health projects. In their SEC filings,
companies recognize that laws and regulations
governing environmental safety and health are likely
to become stricter over time, which could increase
materiality of the issue in the future. Similarly,
certain key resources for the industry are likely to
become increasingly scarce in the future. The total
amount of waste and percentage that is hazardous
indicate the magnitude of potential financial impact
from waste generation. Percentage recycled
indicates the degree of mitigation of those risks, as
well as the maximization of materials efficiency.
SOCIAL CAPITAL
Social capital relates to the perceived role of
business in society, or the expectation of business
contribution to society in return for its license to
operate. It addresses the management of
relationships with key outside stakeholders, such as
customers, local communities, the public, and the
government.
In the Auto Parts industry, social capital issues
revolve around the safety of automotive parts
directly as well as the vehicles in which the parts are
used, and the social externalities that may result
from a failure to ensure driver and passenger safety.
The ability of companies to manage product quality
and safety is critical to protecting their reputation
and license to operate, and therefore their brand
value.
Product Safety
The Center for Disease Control and Prevention
(CDC) cites motor vehicle crashes as one of the
leading causes of death in the U.S. According to the
World Health Organization, traffic injuries are the
leading cause of death worldwide for people
between the ages 10 and 24. The total number of
road traffic deaths is 1.24 million per year globally.
Thus, safety features in automobiles that improve
both occupant and pedestrian safety are crucial in
reducing traffic injuries.
Product safety pertains to technological
advancements that enhance the safety of vehicles.
Vehicles sold in the U.S. must meet safety
requirements set forth in regulations. If any
component of a vehicle fails to meet standards, the
vehicle must be recalled and the feature repaired or
replaced at no cost to the customer. Auto parts
companies are, in turn, impacted when a faulty part
leads to a recall. Financial impact may go beyond
acute costs associated with recalling defective parts,
as companies could open themselves to risks
involving lawsuits leading to significant
compensations. Failure to improve safety of auto
parts may result in a lower demand and loss of
contracts with OEMs.
Company performance in this area can be analyzed
in a cost-beneficial way internally and externally
I N D U S T R Y B R I E F | A U T O P A R T S | 12

through the following direct or indirect performance
metrics (see Appendix III for metrics with their full
detail):
• Number of recalls and total units recalled.
Evidence Safe auto parts are critical to ensuring safe vehicles.
Responding in a timely manner when defects are
identified can protect companies from regulatory
action or customer lawsuits, which can affect
company profitability through one-time costs and
contingent liabilities. Through effective management
of the issue, companies can enhance reputation and
brand value and drive higher sales over the long
term.
Product recalls represent a significant cost for
companies and have a negative impact on brand
value. From 1990 through September 2013 there
were 3,303 recalls in the U.S., which affected nearly
385 million vehicles. Fuel system and service brakes
were the most common reasons for the recalls,
accounting for 290 and 315 recalls, respectively,
followed by airbags and seatbelts at 267 and 252
recalls, respectively. According to Automotive News
analysis of data from the NHTSA, the number of
light-vehicle recalls has doubled from two decades
ago, and in the period from 2012 to 2013, there
was an average of one recall every two to three
days. The vast majority, or 78 percent, of the 3,303
recalls were initiated by OEMs or auto parts
manufacturers.39
While the primary impact of a recall is on the OEM,
there are material impacts for the responsible auto
parts company as well, either legally (by contract or
associated liability) or by loss of customers. Several
auto parts companies mention product recalls in
their SEC filings as a factor that could materially and
adversely impact the results of their operations. For
example, Dana Holdings reports in its 2012 Form 10-
K that “(t)here is no assurance that the costs of
complying with current laws and regulations (…)
that relate to health, safety and product liability
matters will not adversely impact us. There is also a
risk of warranty and product liability claims, as well
as product recalls, if our products fail to perform to
specifications or cause property damage, injury or
death, including a risk that asbestos related product
liability claims could result in increased liabilities.”40
To reduce the costs associated with recalls,
automobile manufacturers share liabilities for safety
recalls with their suppliers. In 2013, GM adopted a
new purchasing contract under which suppliers can
be held responsible if auto parts manufactured by
the supplier pose safety risks to consumers.41 New
terms could better align the goals of auto parts
manufacturers with that of OEMs to ensure
passenger safety and quality of vehicles.
Costs associated with recalls have substantial
impacts on companies’ value and often result in
lower earnings for the period of a recall. In April
2013, Honda, Nissan, Mazda, and Toyota recalled
3.3 million vehicles worldwide because the
passenger-side airbag could deploy with excessive
force.42 BMW recalled 220,000 of its 3 series cars for
a related airbag issue.43 Takata Corporation,
manufacturer of the airbags that caused the recall,
reported that it would have an annual loss of
$307 million in 2013 as a result of the recalls.44 Auto
I N D U S T R Y B R I E F | A U T O P A R T S | 13

parts manufacturers that are able to recognize safety
issues in a timely manner and initiate voluntary
recalls may minimize costs by avoiding regulatory
intervention and potential penalties and contingent
liabilities for failure to promptly address safety
issues.
Recalls can involve any auto part; in the past
defective tires have triggered recalls. In April 2011,
Hyundai recalled 63,588 vehicles because they used
Kumho Tires that were made with more recycled
rubber than was allowed.45 In 2006, Cooper Tire &
Rubber Co. recalled about 288,000 replacement
tires due to concerns about slow leaks and cracking
tires.46 More recently, in 2012 Cooper Tire
voluntarily recalled 10,236 tires due to tread
separation issues.47
While safety problems can negatively impact auto
parts companies, good performance in this area can
also enhance their competitive position and
positively impact financial performance. Tenneco, an
auto parts company, summarizes in its 2012 Form
10-K how companies can benefit by making
technological advancements in safety: “To serve the
needs of their customers and meet government
mandates, OEMs are seeking parts suppliers that
invest in new technologies, capabilities and products
that advance vehicle safety, such as roll-over
protection systems, computerized electronic
suspension, and safer, more durable materials.
Those suppliers able to offer such innovative
products and technologies have a distinct
competitive advantage.”48 As an example of
innovations in product safety, Autoliv introduced the
first pedestrian protection airbag in cooperation with
Volvo in 2012.49
Value Impact Inherent safety and safety features of auto parts is a
major driver of market share and revenue growth for
auto parts companies, as vehicle safety is central to
OEMs’ competitiveness. Additionally, auto parts
manufacturers are likely to share in the liabilities
that OEMs face as a result of recalls or safety
incidents. Automobile companies may reclaim part
of their lost profits or cost of business interruption
due to recalls or safety incidents if those incidents
can be attributed to a supplier’s product. This can
impact auto parts companies’ revenue and costs,
and can create contingent liabilities. In the extreme,
safety concerns may also lead automobile
manufacturers to discontinue their relationship with
their suppliers, resulting in revenue loss. The total
number of recalls is a proxy for how well companies
manage product safety, and provides an
understanding of the probability and magnitude of
the impact of recalls. The percentage of recalls
voluntarily issued indicates a company’s proactive
approach to managing the safety of its products.
BUSINESS MODEL AND INNOVATION
This dimension of sustainability is concerned with
the impact of environmental and social factors on
innovation and business models. It addresses the
integration of environmental and social factors in
the value creation process of companies, including
I N D U S T R Y B R I E F | A U T O P A R T S | 14
resource efficiency and other innovation in the
production process. It also includes product
innovation and efficiency and responsibility in the
design, use phase, and disposal of products. It
includes management of environmental and social
impacts on tangible and financial assets—either a
company’s own or those it manages as the fiduciary
for others.
In the Auto Parts industry, advances in business
models and innovation can serve to reduce the
lifecycle environmental impacts of automobiles.
From an economic standpoint, such innovation
directly impacts the total cost of vehicle ownership,
which takes into account the purchase price as well
as taxes, insurance, operating costs (such as fuel,
maintenance, and repair), and resale value. Fuel
efficiency and use of alternative energy may reduce
owners’ operating costs. The longevity of a vehicle
can also reduce costs by delaying purchase of
replacement vehicles, lowering maintenance costs,
and improving resale value. Such innovation
therefore becomes attractive to auto companies’
consumers while lowering the industry’s lifecycle
environmental impacts.
Emerging environmental and social trends in the
Auto Parts industry, including changing customer
preferences, higher regulatory requirements, and
heightened regulatory scrutiny, are creating new
innovation and business opportunities for
companies. Those companies that are able to
harness intellectual capital to address significant
environmental and social challenges will therefore
also be able to improve operational and financial
performance.
Product Lifecycle Management
The product lifecycle management issue, for the
purposes of this brief, focuses on innovations in the
Auto Parts industry that drive fuel efficiency and
improve end-of-life management of vehicles.
Transportation accounts for a significant share of
global GHG emissions. Motor vehicles’ combustion
of petroleum-based fuels cumulatively generates
significant direct GHG emissions and contributes to
global climate change. While these impacts are
further downstream from auto parts companies
(resulting from the use of vehicles rather than their
manufacture), regulations are focusing on auto
manufacturers to address some of these issues; for
example, by imposing fuel economy standards. Aside
from the regulations, there is also customer demand
for vehicles with lower environmental impacts and
lower total cost of ownership. Together, these
factors are driving auto manufacturers to lower use-
phase emissions, which in turn increases OEMs
demand for auto parts that improve fuel efficiency
and reduce vehicle emissions.
In addition, millions of vehicles worldwide reach the
end of their useful lives every year. At the same
time, the rate of vehicle ownership is expanding
globally, and leading to higher numbers of end-of-
life vehicles (ELV).50 Recycling rates and amounts
recovered per vehicle vary by country. In the U.S.,
about 95 percent of vehicles that reached the end-
of-life stage were disassembled for recycling.51 In
order to reduce the lifecycle impacts of vehicles and
mitigate the strain on natural resources from the
production of new vehicles, it is crucial for OEM
I N D U S T R Y B R I E F | A U T O P A R T S | 15
companies to take into consideration re-usage,
modularity, and/or recycling principles. The role of
auto parts manufacturers is therefore critical in the
process. Auto parts manufacturers can lower the
lifecycle impact of disposing their products at the
end of their productive life by designing them to be
easily recyclable and reusable and by applying
modularity principles into their product designs.
They can also create take-back programs to ensure
safe disposal and reuse of the product. Take-back
programs are usually geared toward parts like tires
and batteries, which are replaced during the life of a
vehicle, and so are disposed separately from the rest
of the vehicle. Proper management of the issue
enables reduction of negative environmental impacts
from automobiles’ value chain. Moreover, the
emergence of several laws regarding vehicles’ end-
of-life phase have recently heightened the
importance of the issue. These regulations include
the E.U.’s Directive on End-of-life Vehicles, Japan’s
2002 End-of-life Recycling Law, South Korea’s 2007
Act for Resources Recycling of Electrical and
Electronic Equipment and Vehicles, and the U.S.’s
programs for safe removal of mercury from disposed
vehicles and tire recycling and reuse.
Auto parts manufacturers that are able to improve
vehicle fuel efficiency and reduce emissions at the
use phase through product innovation will be able
to satisfy growing demand from OEMs, pressured by
stricter environmental regulations and customer
preferences. Moreover, with input price volatility and
resource constraints, automakers and auto parts
companies that are able to develop take-back and
recycling systems are likely to improve their long-
term operational efficiency and strengthen their risk
profile.
Company performance in this area can be analyzed
in a cost-beneficial way internally and externally
through the following direct or indirect performance
metrics (see Appendix III for metrics with their full
detail):
• Total addressable market and share of market
for products aimed at improved fuel efficiency
and/or reduced emissions;
• Percentage of products sold that are
recyclable or reusable; and
• Weight of products and materials recycled or
remanufactured.
Evidence Transportation activities, which include “movement
of people and goods by cars, trucks, trains, ships,
airplanes, and other vehicles,” is a significant source
of GHGs, accounting for 28 percent of U.S.
emissions in 2011.52 According to the International
Energy Agency, global transportation emitted 6.8
million metric tons of carbon dioxide (CO2) or 22
percent of global CO2 emissions from fuel
combustion in 2010. IV Road transport alone
accounted for 74 percent of transport emissions.53
Furthermore, in 2013, researchers at the
Massachusetts Institute of Technology found that air
pollution causes about 200,000 early deaths in the
U.S. each year. Road transportation, the most
IV Transportation covers emissions from all transport activity (in mobile engines), regardless of the economic sector to which it is contributing. Road includes the emissions arising from fuel use in road vehicles, including the use of agricultural vehicles on highways.
I N D U S T R Y B R I E F | A U T O P A R T S | 16
significant contributor, caused 53,000 premature
deaths, with California being the most affected
state.54 This highlights the magnitude of the impact
of air emissions from the use phase of automobiles,
which is prompting regulators around the world to
take action.
In order to reduce emissions from automobiles,
several countries have set emissions and fuel-
efficiency targets for vehicles sold within their
borders. They are also providing incentives to
consumers to buy low-emission vehicles, often
subsidizing the purchase cost.V These actions are
affecting both the demand for and supply of
automobiles, with an impact on automobile
company revenues and costs. This explains the
relative success of electric vehicles for commercial
and industrial uses, with sales that were expected to
exceed $30 billion in 2013, compared to $28 billion
in the consumer segment.55 The improvement of a
vehicle’s fuel efficiency starts at the auto parts level,
therefore, the industry has an opportunity to capture
this growing market.
Improving fuel efficiency and reducing air pollution
from automobiles are key trends impacting the Auto
Parts industry. Top companies in the industry cite the
importance of producing products that help improve
vehicle performance, fuel efficiency, and air quality
in their Form 10-K filings. For example, Lear
Corporation, an American automotive interior
systems manufacturer, cites the following in its 2012
Form 10-K as a key trend affecting its business:
V Refer to the Legislative and Regulatory Trends section for specific targets.
“stricter fuel economy and emission standards,
which will require more efficient engines, lighter
weight materials and alternative energy powertrains,
driving growth in high-power electrical distribution
systems and lighter weight seating components.”56
Other companies recognize and report on this trend
in their SEC filings. TRW Automotive, for example,
states in its 2012 Form 10-K that “[t]he desire to
lessen environmental impacts and reduce oil
dependence is spurring interest in green
technologies and alternative fuels. As such, there is
an increased focus on production of advanced
powertrain, direct injection and start/stop
technologies and hybrid and electric vehicles
because of their fuel efficiency, and developing
ethanol, hydrogen, natural gas and other clean
burning fuel sources for vehicles.”
Similarly, Federal Mogul, manufacturer of
powertrain components and vehicle safety products,
identifies “focus on fuel economy, reduced
emissions and alternative energy sources” and a
“focus on vehicle safety” among “significant trends
that are impacting the OE market.”57
There are several ways in which auto parts
companies are innovating to increase fuel efficiency
or decrease emissions from vehicles. In September
2013, Tenneco announced that it was actively
developing technology to convert waste heat in
vehicles into electrical energy that could power
electrical systems within the vehicle.58 Goodyear
won the 2012 Breakthrough Award for its Air
Maintenance Technology, which maintains optimum
tire pressure, leading to fuel savings.59
I N D U S T R Y B R I E F | A U T O P A R T S | 17
TRW developed electrically assisted steering systems
that reduce emissions by eliminating the need for
hydraulic fluid to power the system. The systems
also improve the fuel efficiency of vehicles, as they
are decoupled from the engine and do not cause
paralytic loss, and enable fuel savings by shutting
down an engine when not in use. Moreover, fully
electric power steering (EPS) systems provide
significant fuel savings and earn more attention
from OEMs. Belt Drive EPS may save up to 0.4
liter/100 km of fuel use and reduce CO2 emissions
by approximately 8 g/km compared with hydraulic
power steering.60 Friction in combustion engines is
one of the factors influencing carbon emissions.
TRW’s Global Engine Components group reduced
the friction between a tappet and a cam by using
specially coated tappets which led to lower fuel
consumption and a reduction of carbon emissions by
up to 3g/km.61
Reducing the weight of automobiles can lead to
direct fuel savings, and as the following examples
show, auto parts companies have an important role
to play in this. In 2013, BMW introduced i3 electric
cars in Europe. These cars are partly constructed of
carbon-fiber-reinforced plastic. The material is 50
percent lighter than steel and 30 percent lighter
than aluminum.62 Autoliv’s new “green” airbag
inflator weighs 20 percent less than traditional
airbags.63 The Delphi Aluminum Cable is 48 percent
lighter than a copper core cable, which results in
weight reduction of about 1.8 kg per vehicle,
increases fuel economy, and reduces emissions.64
Some companies are incorporating environmental
considerations in their strategic decisions about
product design. Faurecia, a European auto parts
producer, includes reducing the weight and volume
of components along with lowering GHG emissions
as three of its six main considerations for product
design.65
Tire manufacturers can also help in improving the
fuel efficiency of vehicles. For example, the use of
husk-derived silica in tire manufacturing helped
Pirelli to contribute to lower automobile fuel
consumption, as it reduces heating of tire rubber
when in contact with the road. Pirelli’s CinturatoTM
P7TM Blue tires provide 23 percent less rolling
resistance and are able to reduce fuel consumption
of a sedan by 5.1 percent and save 123.5 kilograms
of CO2 over 15,000 km driven in a year.66 The
NHTSA is currently working on the “Tire Fuel
Efficiency Consumer Information Program,” which
would inform consumers about the opportunity to
improve fuel efficiency, safety, and durability of a
vehicle by choosing proper tires. The program would
implement a “national tire fuel efficiency rating
system for replacement tires.” The information
would be provided to consumers at the point of sale
and online.67 In its Form 10-K, Goodyear recognizes
the impacts related to the NHTSA initiative: “When
the related rule-making process is completed, certain
tires sold in the United States will be required to be
rated for rolling resistance, traction and tread wear.
While the Federal law will preempt state tire fuel
efficiency laws adopted after January 1, 2006, we
may become subject to additional tire fuel efficiency
legislation, either in the United States or other
countries.”68
In addition to improving the fuel economy of
vehicles, managing environmental impacts at the
I N D U S T R Y B R I E F | A U T O P A R T S | 18
end-of-life phase of vehicles, including reuse or
recycling of auto parts, also can have a material
effect on auto makers and auto parts manufacturers.
According to the U.S. EPA, each year, nearly 27
million cars worldwide reach the end of their useful
lives, and most are recovered for recycling.
Nevertheless, the EPA reports that five million tons
of auto shredder residue (ASR) are disposed of in
landfills every year.69 If diverted from landfills, much
of the material from vehicles can be recycled or
repurposed for use, enabling cost savings and
opportunities for revenue generation. At the same
time, new regulations related to vehicle end-of-life
in some markets could create regulatory compliance
costs or lead to penalties for OEM companies.
The U.S. Department of Commerce estimates that
the global remanufactured automotive parts industry
is an $85–100 billion industry, presenting a
significant opportunity for auto parts companies.
Remanufactured products are reconstructed from
used products by replacing the worn or damaged
components. It is less costly to produce a
remanufactured product than it is to produce a new
product, and the process also requires less energy
and generates less waste, contributing to the
sustainability of the manufacturing process. For
example, the Department of Commerce estimates
that remanufactured automotive alternators require
only 12 to 14 percent of the energy that it would
normally take to manufacture a new alternator.70
Managing tires and batteries at the end of their
useful lives can be particularly challenging, but can
also present opportunities for auto parts
manufacturers. As of 2006, over 85 percent of end-
of-life tires in the U.S., Europe, and Japan were
recycled. However, elsewhere in the world, recycling
rates are less favorable. According to the World
Business Council for Sustainable Development, one
billion tires are disposed of annually and an
estimated four billion used tires are in landfills and
stockpiles worldwide.71 Tires are banned from
landfills in the E.U. In the U.S., 11 states have placed
a total ban, and an additional 31 states have
restrictions. Bridgestone opened a new tire recycling
plant in Osaka, Japan, that makes retreads or
remolds new tires from disposed tires. Since they
require less raw material, the retreads can be sold at
competitive prices.72 Industry leaders recognize the
challenges and opportunities associated with
managing and reducing lifecycle impacts of tires.
The Tire Industry Project is an industry initiative to
address the potential health and environmental
impacts of the chemicals commonly used in tire
making. The project includes 11 companies,
representing more than 70 percent of the world’s
tire manufacturing capacity.73
According to the U.S. EPA, 96 percent of all lead-
acid batteries are recycled and most retailers that sell
them also collect used batteries, as required by most
states.74 Johnson Controls’ Florence Recycling Center
in South Carolina has the capacity to recycle more
than 14 million automotive batteries.75 In addition,
the company cites “increasing global environmental
and safety regulations related to the manufacturing
and recycling of lead-acid batteries, and
transportation of battery materials”, as well as the
company’s ability to secure sufficient tolling capacity
to recycle batteries” as material risks to operations
I N D U S T R Y B R I E F | A U T O P A R T S | 19
in its 2012 Form 10-K.76 Despite high recycling rates
in the U.S., rates may be lower in emerging markets.
For example, in China, the biggest producer,
consumer, and exporter of lead-acid storage
batteries in the world, less than 30 percent of
batteries are processed under official standards.
Lead leaks pose significant environmental and health
threats. Currently, the Chinese government is
striving to increase the recycling rates of disposed
acid-lead batteries. In March 2013, five ministries
issued a document that said the rate of standardized
recycling of waste lead-acid storage batteries would
reach 90 percent by 2015.77 As production processes
in the Auto Parts industry move to developing
countries and environmental regulations become
more stringent in those countries, auto parts
manufacturers may be exposed to significant
liabilities for noncompliance.
Several states have regulations requiring battery
recycling. In 1996, the Congress passed the
Mercury-Containing and Rechargeable Battery Act,
which simplifies the process of collection and
recycling of rechargeable batteries. The act requires
regulated batteries to be easily removable from
consumer products and to be properly labeled. It
also establishes uniform standards for collection,
storage, and transportation of certain batteries and
restricts the use of certain mercury-containing
batteries.78 To ensure maximum recoverability and
recyclability of auto parts, companies may need to
establish relationships with third parties and develop
processes to enable efficient collection and
recycling. For example, Johnson Controls developed
the LHT Distributor Network in Mexico, which
helped the company to collect and recycle nearly
100 percent of car batteries.79
Value Impact As stricter environmental regulations put pressure on
automobile manufacturers to improve fuel efficiency
and reduce emissions of vehicles, the demand for
auto parts aimed at reducing environmental
externalities will increase. While this lead to
additional research and development (R&D) expenses
in the short-term, innovative products that help fuel
efficiency and emission reductions will drive
competitiveness and revenue growth in the medium-
term. Total addressable market and share of market
for products aimed at improved fuel efficiency
and/or reduced emissions provide a sense of how
well companies are addressing this new market
opportunity.
Stricter regulations around end-of-life management
require higher recyclability and recycling rates of
both manufactured vehicles and specific auto parts
such as batteries and tires. These regulations can
affect demand and increase compliance costs for
auto parts companies. Noncompliance with
regulations may lead to civil penalties and
extraordinary expenses. Recovery and recycling of
ELV materials can help auto parts manufacturers
achieve significant costs savings and insulate them
from the risk of rising prices or unavailability of key
materials. The percentage of recyclable products
indicates how companies are positioned to respond
to increased demand from OEMs for these products.
I N D U S T R Y B R I E F | A U T O P A R T S | 20
Weight of products and materials recycled or
remanufactured indicates the company’s
performance in operational and resource efficiency.
LEADERSHIP AND GOVERNANCE
As applied to sustainability, governance involves the
management of issues that are inherent to the
business model or common practice in the industry
and are in potential conflict with the interest of
broader stakeholder groups (government,
community, customers, and employees). They
therefore create a potential liability, or worse, a
limitation or removal of license to operate. This
includes regulatory compliance, lobbying, and
political contributions. It also includes risk
management, safety management, supply chain and
resource management, conflict of interest, anti-
competitive behavior, and corruption and bribery.
High concentration within certain segments of the
Auto Parts industry makes it prone to anti-
competitive behavior such as collusion and price-
fixing. These activities ultimately result in costs
passed to consumer through higher prices of
vehicles. Moreover, auto parts companies rely on
increasingly complex and geographically diverse
supply chains for critical material inputs, magnifying
the risks of supply disruptions. Effective materials
sourcing that is able to mitigate supply risks will play
an increasingly important role in shareholder value in
the industry, as the supply chain and regulatory
environments are constantly shifting.
Competitive Behavior
Authorities in several countries are currently
investigating suspected anti-competitive behavior
among global auto parts suppliers.80 While industry
concentration is low, suppliers provide a wide range
of parts, and competition for business within each
category of parts may not be as robust. Thus,
leaders in producing any specific auto part may have
a lot of market power in that segment, creating
antitrust concerns. In recent cases discussed in the
Evidence section, companies were found in violation
of antitrust laws. Antitrust regulators are also likely
to focus in the future on industries that have been
investigated or litigated in the past.81
In the U.S., the Sherman Antitrust Act, Clayton Act,
and Federal Trade Commission Act are the three
major federal antitrust laws governing this and other
industries. Antitrust laws, also known as anti-
monopoly, competition, and trade practices laws,
are not unique to the U.S. Companies can be
charged for violating local antitrust laws in their
markets of operations.
Antitrust regulations like the Sherman Act seek to
maintain a competitive environment in order to
provide consumers with the “benefit of lower prices,
high quality products and services, more choices,
and greater innovation.”82 As discussed above, SASB
considers leadership and governance issues that are
in potential conflict with the interest of broader
stakeholder groups, such as customers, which can
create a potential liability or remove a company’s
license to operate. In the case of competitive
behavior issues in the auto parts industry, there is
I N D U S T R Y B R I E F | A U T O P A R T S | 21
potential for conflict of business interests with the
interests of customers and governments; for
example, through possibly higher prices when a
company dominates a market segment, as compared
to a competitive environment. The most common
forms of antitrust violations include price-fixing, bid-
rigging, territorial allocations, and mergers and
acquisitions.83 By colluding to fix prices, companies
can act like a cartel, which is a violation of U.S.
antitrust laws. Collusive behavior, such as that found
among auto parts makers, may be criminally
prosecuted, and corporations and individuals may be
fined.
Relatively high concentration within some segments
of the Auto Parts industry increases the risk that
companies may be involved in price-fixing and bid-
rigging activities. Such activities, in turn, could affect
prices of cars for end users. If involvement in such
activities is discovered and proved, the imposed
penalties may have acute impacts on a company’s
valuation.
Company performance in this area can be analyzed
in a cost-beneficial way internally and externally
through the following direct or indirect performance
metrics (see Appendix III for metrics with their full
detail):
• Amount of legal and regulatory fines and
settlements associated with anti-competitive
practices.
Evidence As mentioned above, the concentration of
companies manufacturing any specific auto parts
product can be very high in the industry. For
instance, globally, there are only three publicly
traded companies manufacturing automobile glass.84
A small number of key market players in an industry
may increase the propensity for collusion and price-
fixing.85 In 2008, the European Commission (EC)
fined four glass producers, Asahi, Pilkington, Saint-
Gobain, and Soliver, for illegal market sharing. The
total imposed fines were approximately €1.4 billion.
The companies were allegedly exchanging
commercially sensitive information regarding
deliveries of car glass in the European Economic
Area (EEA), in violation of bans on cartels and
restrictive business practices by both the EC Treaty
and the EEA Agreement. These companies controlled
about 90 percent of the €2 billion market for
automobile glass in the EEA.86
In the U.S., for offences committed after June 22,
2004, the maximum fines and jail terms have been
increased to $100 million for corporations and $1
million or a 10-year jail sentence (or both) for
individuals.87
Collusion and price-fixing by auto parts
manufacturers ultimately leads to the costs being
passed on to consumers through higher prices on
vehicles. This conclusion was reached by the FBI’s
Criminal Investigation Division during the
investigation of multiple conspiracies by Japan-based
auto parts manufacturers that were selling products
to U.S. car makers. The conspiracies affected more
than $5 billion in auto parts and more than 25
million cars sold to U.S. consumers.88 By February
2014, 25 auto parts manufacturers pleaded guilty or
agreed to plead guilty and were charged by the
Antitrust Division of the Department of Justice (DOJ)
I N D U S T R Y B R I E F | A U T O P A R T S | 22
with price-fixing and bid-rigging. The companies
have agreed to pay a total of more than $1.8 billion
in fines.89 Twelve individuals have been sentenced to
pay criminal fines and to serve jail sentences ranging
from a year and a day to two years each.90
According to the plea agreements, the companies
have agreed to assist the U.S. DOJ with current
investigations. The European Commission and
authorities in other jurisdictions are also looking into
antitrust violations related to the DOJ investigations.
There are several more recent high-profile cases of
market manipulation by auto parts companies.
Aisan, a Japanese auto parts maker, was charged a
maximum penalty of $100 million for price-fixing in
violation of the Sherman Act.91 Following a price-
fixing fine of $28 million in October 2011,
Bridgestone agreed to pay an additional $425
million criminal fine in February 2014. At the time it
pleaded guilty and paid the first penalty in 2011, the
company had failed to disclose the fact that it was
also involved in an anti-vibration rubber parts
conspiracy, which was a decisive factor in
determining the $425 million fine.92 According to its
2012 annual report, Autoliv entered into a plea
agreement with the DOJ and paid $14.5 million in
fines for two counts of violations of antitrust laws
involving a Japanese subsidiary. As a result, the
company is also being investigated by
representatives of the European antitrust authority,
the Competition Bureau of Canada and the Korean
Fair Trade Commission for antitrust behavior among
suppliers of occupant safety systems.93 Similarly, in
2012, TRW Automotive Holdings agreed to plead
guilty to one count of conspiracy in restraint of trade
involving sales of occupant safety products and to
pay $5.1 million to settle antitrust violations with the
DOJ.94
In October 2012, Japanese auto parts maker Tokai
Rika Co. agreed to plead guilty and pay
$17.7 million in fines for its involvement in price-
fixing. Another large auto parts supplier, Denso, also
agreed to plead guilty in the DOJ’s ongoing
investigation into price-fixing and bid-rigging.95
Denso has agreed to pay a criminal fine of
$78 million for violations of antitrust laws in
connection with sales of certain automotive
components. Another Japanese supplier, Yazaki, will
pay $470 million for violation of the Sherman Act.96
In addition, four Yazaki executives will serve prison
time for their involvement in the violations. In
November 2001, Furukawa Electric pleaded guilty
and was fined $200 million for its role in price-fixing
and bid-rigging.97
The sheer number of investigations into and
confirmed cases of violations of antitrust laws by
auto parts suppliers indicate the chronic nature of
this problem. In February 2010, E.U. antitrust
regulators investigated Lear Corporation, Leoni AG,
and their competitors for suspected price-fixing.
These cases have alerted not only antitrust
authorities around the world, but also auto parts
customers. In July 2013, Ford sued Fujikara for
setting artificially high prices on wire harnesses
supplied to them from 2000 to 2010.98
Value Impact As the evidence shows, failure to comply with
antitrust regulations may lead to significant fines
and penalties, and potentially criminal prosecution
I N D U S T R Y B R I E F | A U T O P A R T S | 23
of a company’s executives. This can impose
significant extraordinary expense and create
contingent liabilities. Price-fixing and other market
manipulation practices can also damage a
company’s reputation with customers, resulting in
lower market share and revenue. Market
manipulation can lead to increased scrutiny from
antitrust authorities and can impact companies’
ability to raise prices, with impact on revenue.
Increased regulatory oversight increases the risk of
legal liabilities and a restrictive operating
environment, raising the risk profile of companies
and their cost of capital. Ongoing legal and
regulatory fines indicate how well companies
manage this issue, and provide an understanding of
the probability and magnitude of the financial
impact.
Materials Sourcing
Auto Parts companies are exposed to the risk of
supply chain disruptions, input price increases or
volatility, and damage to brand reputation,
particularly when rare earth or “conflict” minerals
and metals are used in their products. The use of
minerals that originate from certain zones of conflict
also exposes auto parts companies to regulatory
risks associated with the Dodd-Frank Act.
Rare earth metals, also known as rare earth
elements (REEs), and other critical materials play a
crucial role in clean energy technologies. Electric and
hybrid vehicles use substantial amounts of critical
materials. With global regulations aiming to reduce
emissions and increase fuel efficiency of vehicles, the
share of hybrids and ZEVs produced by the
Automobiles industry is likely to continue to increase
in the future. Furthermore, more electronic
components are being used in automobiles, and
these also can contain critical materials. Therefore,
OEMs are likely to demand more auto parts that
could contain critical and conflict minerals. These
factors make the sourcing of REEs important to the
Auto Parts industry.
Despite the name, some rare earth elements are
actually abundant. However, they are difficult to
extract and refine because they tend to be lumped
together in rocks along with radioactive thorium and
uranium.99 There are material sourcing risks related
to rare earth minerals and metals due to a low
substitution ratio, the concentration of deposits in
only a few countries, and geopolitical
considerations. Auto parts companies also face
competition due to increasing global demand for
these minerals from other sectors, including
Technology, Renewable Energy, and Infrastructure,
which, along with supply constraints, can result in
significant price increase and supply chain risks.
The industry also faces supply chain challenges in
the use of conflict minerals. Companies face
pressure from legislation, actions by non-
governmental organizations (NGOs), input price
risks, and leadership from peers to track and
eliminate the use of minerals responsible for conflict
in the DRC. To the extent that an auto manufacturer
uses these minerals in their production processes,
the company is required to provide disclosures
around the origin of the minerals in accordance with
the Conflict Minerals provision of the Dodd-Frank
I N D U S T R Y B R I E F | A U T O P A R T S | 24
Act (see the Regulatory Trends section above). This
requires an active monitoring of the supply chain.
Auto parts companies with strong supply chain
standards and the ability to adapt to increasing
resource scarcity will be better positioned to protect
shareholder value. Innovations at the design phase
to reduce dependence on some of these materials
also contributes to lower risk. Companies that are
able to limit the use of critical and conflict materials,
as well as secure their supply of the materials they
do use, will not only minimize environmental and
social externalities related to extraction but also
protect themselves from supply disruptions and
volatile input prices. Conflict minerals also represent
reputational risks, therefore auto parts
manufacturers need to ensure that their supply
chain is “conflict-free.”
Company performance in this area can be analyzed
in a cost-beneficial way internally and externally
through the following direct or indirect performance
metrics (see Appendix III for metrics with their full
detail):
• Percentage of products by revenue that
contain critical materials;
• Percentage of tungsten, tin, tantalum, and
gold smelters and refiners within the supply
chain that are verified conflict-free; and
• Discussion of the management of risks
associated with the use of critical materials
and conflict minerals.
Evidence According to the U.S. Department of Energy (DOE),
electric vehicle (EV) technology is one of the
technologies that are most dependent on the
availability of rare earth metals. Such materials as
lanthanum, cerium, praseodymium, neodymium,
nickel, manganese, cobalt, and lithium are used in
the manufacturing of EV batteries. A current-
generation hybrid vehicle battery contains several
kilograms of rare earth elements. The DOE study
concluded that, over the short and medium term (by
2025), dysprosium and neodymium were the
elements with the highest importance to clean
energy and the highest supply risk.100
Additionally, critical materials such as magnesium
are increasingly used in light weighting of
automobile components. Reducing weight by 22.5
kg is estimated to improve fuel economy by about
one percent. Magnesium is used by auto parts
manufacturers in engine blocks, cylinders, steering
systems, wheel rims, clutches, and transmission
cases.101
Auto parts companies may face shortages of critical
materials used in the expanding EV segment of the
industry and in automobile electronics, not just due
to physical constraints of recovering the materials,
but also due to the concentration of deposits in only
a few countries and the low substitution ratio of the
materials. Shortages of critical materials can also
result in price spikes. In 2011, China was producing
97 percent of the world’s supply of REEs as a by-
product of the country’s iron-ore mining activities.
Furthermore, the British Geological Survey estimates
that China is the top producer of 27 out of 52
critical minerals and metals.102 In 2010, China
restricted the export of rare earth elements,
supposedly due to environmental concerns; this led
I N D U S T R Y B R I E F | A U T O P A R T S | 25
to a five-fold increase in the price of such materials
while Chinese companies were able to obtain the
same materials at lower cost.103 As China increases
development of its own clean energy technologies,
the country could significantly limit exports of critical
materials in the future.104
Deposits in some other countries also create supply
risks. Lithium is one such material for which there
may be supply shortages, as more than half of the
global reserves of lithium are found in Bolivia alone.
The country’s reserves of lithium amount to 73
million metric tons, and President Evo Morales claims
the reserves are going to be nationalized. The
political situation in the country further exacerbates
the risk of sourcing the metal from Bolivia.105
The U.S. government recognizes supply risks and
price increases of REEs, and in 2011 announced that
it would allocate $30 million in grants toward the
development of alternatives that do not depend on
the environmentally hazardous and increasingly
costly minerals.106
A 2011 study conducted by
PriceWaterhouseCoopers (PWC) demonstrated the
materiality of mineral and metal scarcity for the Auto
Parts industry. The survey was completed by 69
senior executives from different sectors, including 11
companies in the automotive sector, and found that
73 percent of respondents in the automotive sector
perceived minerals and metal scarcity as a pressing
issue for their company. Moreover, among
automotive sector respondents, 73 percent thought
that their company could experience an unstable
supply of these inputs within the next five years,
with 55 percent of respondents rating the severity of
the supply instability as “high” or “very high.” The
level of engagement and concern for the issue in the
automotive industry is further reflected by the fact
that 64 percent of respondents indicated that their
company was well-prepared to mitigate the impact
of scarce minerals and metals.107 This issue is key for
auto parts suppliers, since they are the key link
between OEMs and metal producers.
In certain regions of the world, such as the DRC, the
mining and sale of conflict minerals such as
tantalum, tin, tungsten, and gold (3TG), provide
funding for armed conflicts and their mining is
carried out under conditions that do not respect
human rights. Electronic components used in
modern automobiles use a substantial amount of tin,
tantalum, and tungsten, exposing automobile
companies not only to regulatory risk associated
with the Conflict Minerals rule of the Dodd-Frank
Act but also to input price volatility and reputational
risks.
The DRC accounts for 6 to 8 percent of global tin
production, 15 to 20 percent (or 8.6 percent in
2009, according to the U.S. Geological Survey) of
tantalum, and 2 to 4 percent of global tungsten
supply. Global input prices of 3TG have shown high
volatility, sometimes related to the conflict in the
DRC. A 31 percent increase in tin prices in 2008
coincided with a rebel offensive against the DRC’s
primary tin-trading center. 108 The price per kilogram
of tantalum, which is a rare metal and a conflict
mineral that is used in the production of automotive,
medical, and aircraft equipment as well as
semiconductors,109 rose from $110 in 2011 to nearly
I N D U S T R Y B R I E F | A U T O P A R T S | 26
$300 in 2012 due to supply constraints and rising
demand.110 As the use of electronic components
becomes more prevalent in automobiles, the Auto
Parts industry may become more exposed to risks
related to conflict minerals.
There is mounting evidence of interest from
companies and investors in the issue of using
conflict-free minerals. Major players in the industry,
such as Johnson Controls, TRW, Delphi, Autoliv,
Tenneco, and Federal Mogul, already provide
disclosure on this issue to investors in their latest 10-
K filings. For example, Johnson Controls states that
“there may be only a limited number of suppliers
offering ‘conflict free’ minerals, we cannot be sure
that we will be able to obtain necessary conflict
minerals from such suppliers in sufficient quantities
or at competitive prices. Also, we may face
reputational challenges if we determine that certain
of our products contain minerals not determined to
be conflict free or if we are unable to sufficiently
verify the origins for all conflict minerals used in our
products through the procedures we may
implement.”111
Compliance with the Conflict Minerals provision of
the Dodd-Frank Act is likely to be costly. The SEC
estimates that it will cost affected companies a total
of $3 to $4 billion in the first year and at least $200
million each year afterward to comply. This cost will
be spread across roughly 6,000 companies, including
companies in the aerospace and automotive
industries.112
Among automobile and auto parts manufacturers,
there appears to be consensus around the necessity
of eliminating the use of conflict minerals in the
production of auto parts and automobiles.
According to a statement released by the
Automotive Industry Action Group (AIAG), an
industry group of major auto manufacturers, “(t)he
Automotive Industry fully supports this direction and
is investigating ways to ensure that the parts and
assemblies in our vehicles and products, regardless
of where they are assembled or sold, do not contain
Conflict Minerals, which have contributed to the
armed conflict in Central Africa.”
Value Impact Failure to effectively manage the sourcing of key
materials can result in higher input costs and lost
revenue due to production disruptions. Companies
may also face regulatory compliance costs associated
with the sourcing of conflict minerals if they do not
verify or avoid the use of conflict minerals. The
increasing scarcity or unavailability of certain key
materials used by auto parts companies, as well as
the price volatility of such materials, can increase
companies’ risk profile and cost of capital if these
companies rely heavily on such materials and are
unable to source them effectively. Investment (R&D)
in alternatives to critical materials and conflict
minerals can mitigate such price increases and
supply constraints.
I N D U S T R Y B R I E F | A U T O P A R T S | 27

The percentage of a company’s products that
contain critical materials indicates a company’s
exposure to the risk of supply disruption and price
volatility for key components. The percentage of
tungsten, tin, tantalum, and gold smelters within the
supply chain that are verified conflict-free indicates
the extent of a company’s exposure to conflict
minerals, in terms of both supply and regulatory risk.
I N D U S T R Y B R I E F | A U T O P A R T S | 28
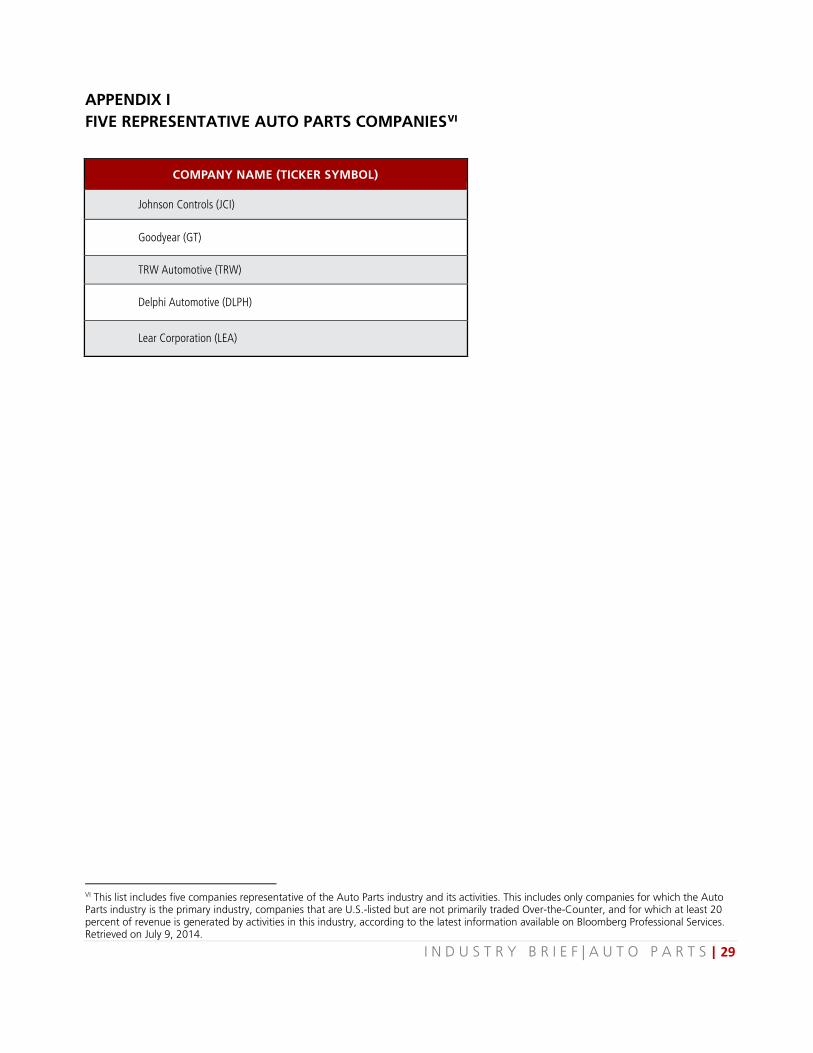
APPENDIX I FIVE REPRESENTATIVE AUTO PARTS COMPANIESVI
VI This list includes five companies representative of the Auto Parts industry and its activities. This includes only companies for which the Auto Parts industry is the primary industry, companies that are U.S.-listed but are not primarily traded Over-the-Counter, and for which at least 20 percent of revenue is generated by activities in this industry, according to the latest information available on Bloomberg Professional Services. Retrieved on July 9, 2014.
COMPANY NAME (TICKER SYMBOL)
Johnson Controls (JCI)
Goodyear (GT)
TRW Automotive (TRW)
Delphi Automotive (DLPH)
Lear Corporation (LEA)
I N D U S T R Y B R I E F | A U T O P A R T S | 29
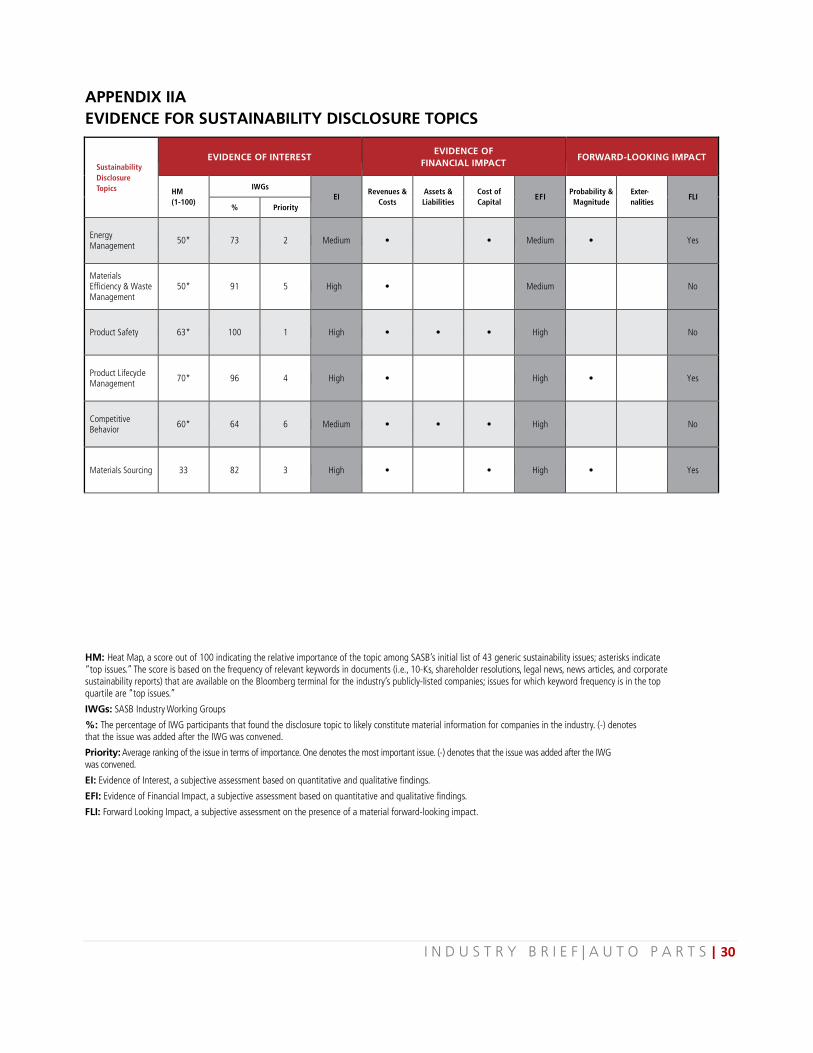
APPENDIX IIA EVIDENCE FOR SUSTAINABILITY DISCLOSURE TOPICS
HM: Heat Map, a score out of 100 indicating the relative importance of the topic among SASB’s initial list of 43 generic sustainability issues; asterisks indicate “top issues.” The score is based on the frequency of relevant keywords in documents (i.e., 10-Ks, shareholder resolutions, legal news, news articles, and corporate sustainability reports) that are available on the Bloomberg terminal for the industry’s publicly-listed companies; issues for which keyword frequency is in the top quartile are “top issues.”
IWGs: SASB Industry Working Groups
%: The percentage of IWG participants that found the disclosure topic to likely constitute material information for companies in the industry. (-) denotes that the issue was added after the IWG was convened.
Priority: Average ranking of the issue in terms of importance. One denotes the most important issue. (-) denotes that the issue was added after the IWG was convened.
EI: Evidence of Interest, a subjective assessment based on quantitative and qualitative findings.
EFI: Evidence of Financial Impact, a subjective assessment based on quantitative and qualitative findings.
FLI: Forward Looking Impact, a subjective assessment on the presence of a material forward-looking impact.
Sustainability Disclosure Topics
EVIDENCE OF INTEREST
EVIDENCE OF
FINANCIAL IMPACT
FORWARD-LOOKING IMPACT
HM (1-100)
IWGs EI
Revenues &
Costs
Assets & Liabilities
Cost of Capital
EFI
Probability & Magnitude
Exter- nalities
FLI
% Priority
Energy Management
50* 73 2 Medium • • Medium • Yes
Materials Efficiency & Waste Management
50* 91 5 High • Medium No
Product Safety 63* 100 1 High • • • High No
Product Lifecycle Management 70* 96 4 High • High • Yes
Competitive Behavior 60* 64 6 Medium • • • High No
Materials Sourcing 33 82 3 High • • High • Yes
I N D U S T R Y B R I E F | A U T O P A R T S | 30
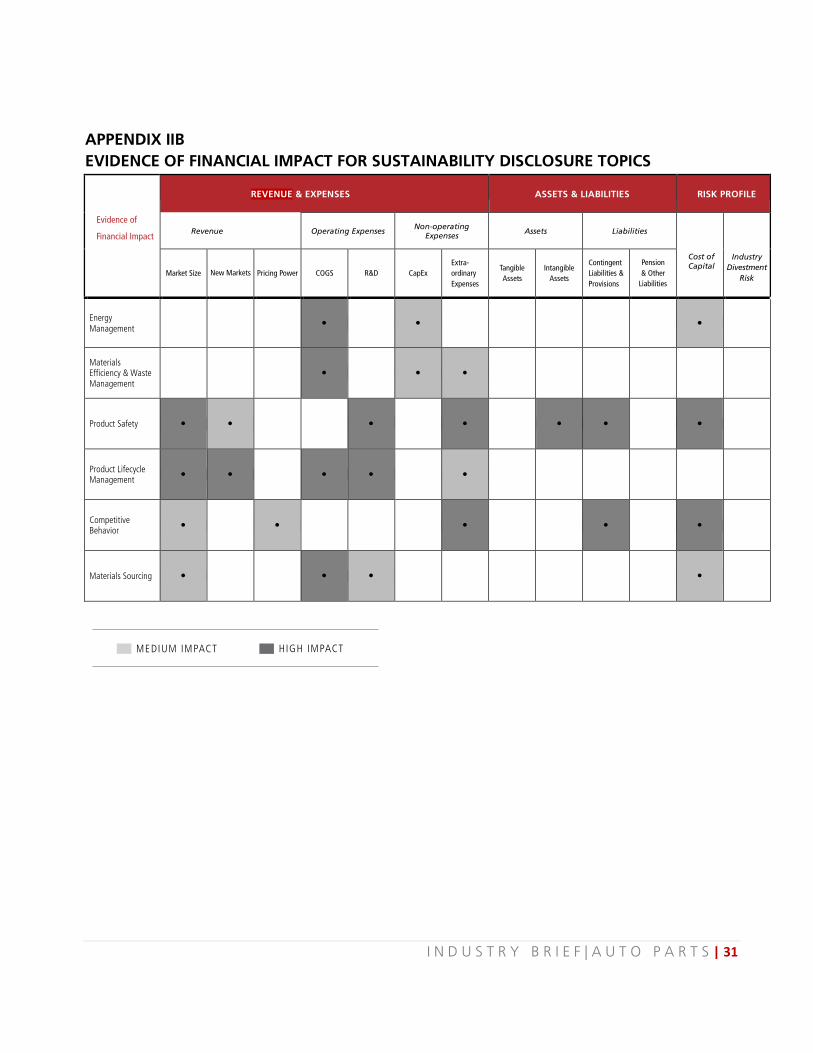
APPENDIX IIB EVIDENCE OF FINANCIAL IMPACT FOR SUSTAINABILITY DISCLOSURE TOPICS
MEDIUM IMPACT H IGH IMPACT
Evidence of
Financial Impact
REVENUE & EXPENSES
ASSETS & LIABILITIES
RISK PROFILE
Revenue
Operating Expenses
Non-operating
Expenses
Assets
Liabilities
Cost of Capital
Industry Divestment
Risk
Market Size
New Markets Pricing Power
COGS
R&D
CapEx
Extra- ordinary Expenses
Tangible Assets
Intangible
Assets
Contingent Liabilities & Provisions
Pension & Other
Liabilities
Energy Management
• • •
Materials Efficiency & Waste Management
• • •
Product Safety • • • • • • •
Product Lifecycle Management • • • • •
Competitive Behavior • • • • •
Materials Sourcing • • • •
I N D U S T R Y B R I E F | A U T O P A R T S | 31
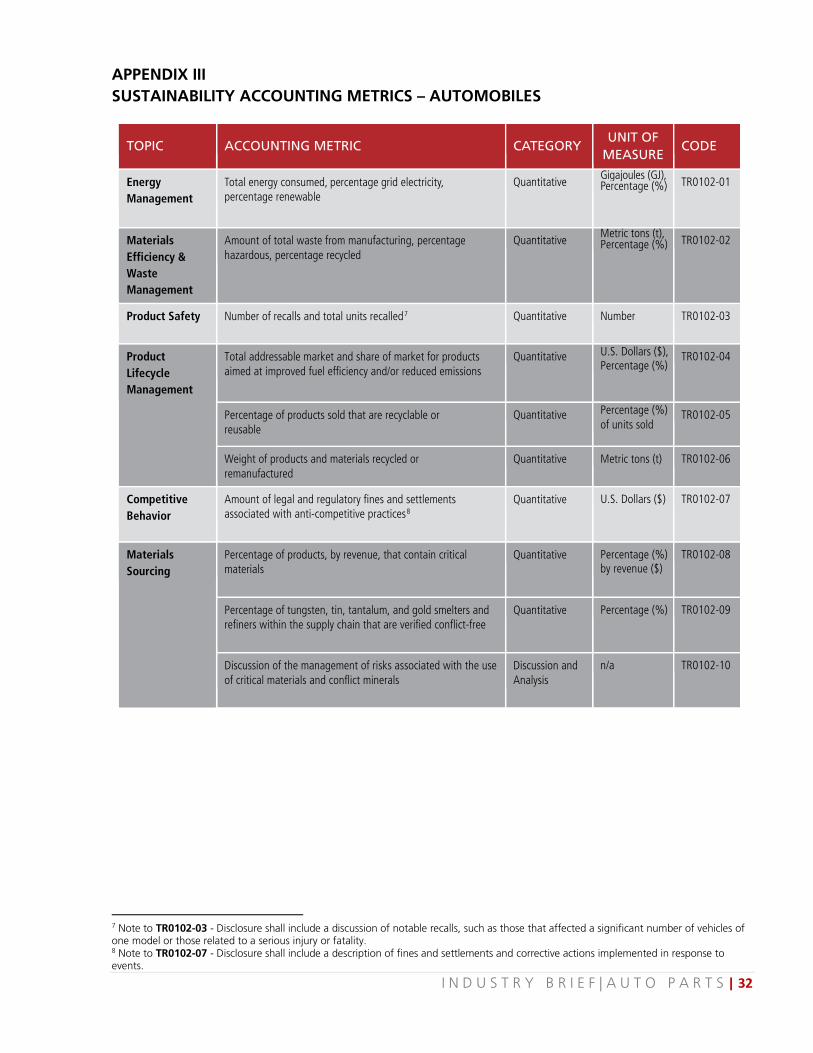
APPENDIX III SUSTAINABILITY ACCOUNTING METRICS – AUTOMOBILES
TOPIC
ACCOUNTING METRIC
CATEGORY
UNIT OF MEASURE
CODE
Energy Management
Total energy consumed, percentage grid electricity, percentage renewable
Quantitative Gigajoules (GJ), Percentage (%) TR0102-01
Materials Efficiency & Waste Management
Amount of total waste from manufacturing, percentage hazardous, percentage recycled
Quantitative Metric tons (t), Percentage (%) TR0102-02
Product Safety Number of recalls and total units recalled7
Quantitative Number TR0102-03
Product Lifecycle Management
Total addressable market and share of market for products aimed at improved fuel efficiency and/or reduced emissions
Quantitative U.S. Dollars ($), Percentage (%)
TR0102-04
Percentage of products sold that are recyclable or reusable
Quantitative Percentage (%) of units sold
TR0102-05
Weight of products and materials recycled or remanufactured
Quantitative Metric tons (t) TR0102-06
Competitive Behavior
Amount of legal and regulatory fines and settlements associated with anti-competitive practices8
Quantitative U.S. Dollars ($) TR0102-07
Materials Sourcing
Percentage of products, by revenue, that contain critical materials
Quantitative Percentage (%) by revenue ($)
TR0102-08
Percentage of tungsten, tin, tantalum, and gold smelters and refiners within the supply chain that are verified conflict-free
Quantitative Percentage (%) TR0102-09
Discussion of the management of risks associated with the use of critical materials and conflict minerals
Discussion and Analysis
n/a TR0102-10
7 Note to TR0102-03 - Disclosure shall include a discussion of notable recalls, such as those that affected a significant number of vehicles of one model or those related to a serious injury or fatality. 8 Note to TR0102-07 - Disclosure shall include a description of fines and settlements and corrective actions implemented in response to events.
I N D U S T R Y B R I E F | A U T O P A R T S | 32
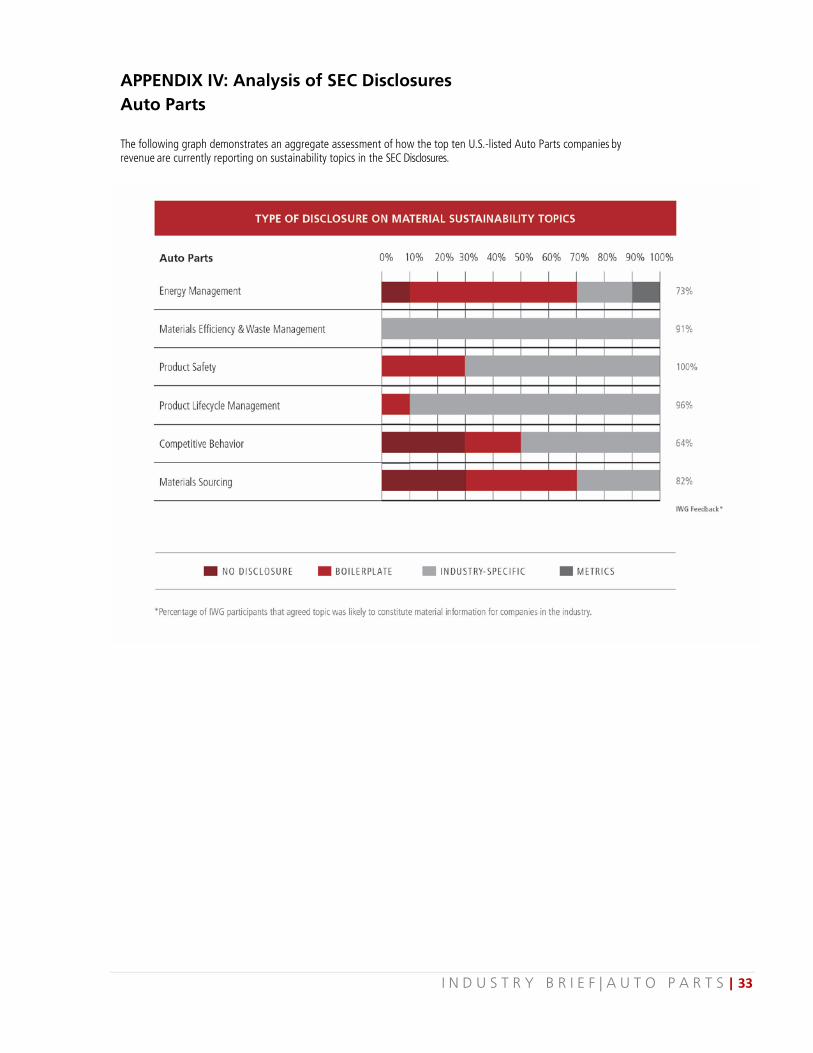
APPENDIX IV: Analysis of SEC Disclosures Auto Parts
The following graph demonstrates an aggregate assessment of how the top ten U.S.-listed Auto Parts companies by revenue are currently reporting on sustainability topics in the SEC Disclosures.
I N D U S T R Y B R I E F | A U T O P A R T S | 33
References
1 “Motor Vehicles (per 1,000 People),” The World Bank. Accessed
September 2, 2014.
http://data.worldbank.org/indicator/IS.VEH.NVEH.P3.
2 Bloomberg Professional service, accessed July 10, 2014, using the BICS
<GO> command. The data represents global revenues of companies
listed on global exchanges and traded over-the-counter (OTC) from the
Automobiles industry, using Levels 3 and 4 of the Bloomberg Industry
Classification System.
3 Author’s calculation based on data from Bloomberg Professional
service, accessed September 3, 2014 using Equity Screen (EQS) for
companies listed U.S. exchanges that generate at least 20 percent of
revenue from their Auto Parts segment.
4 Brandon Ruiz, “IBISWorld Industry Report: Global Auto Parts &
Accessories Manufacturing,” IBISWorld, May 2014. Accessed September
3, 2014.
5 Brandon Ruiz, “IBISWorld Industry Report 33639: Auto Parts
Manufacturing in the US,” IBISWorld, May 2013. Accessed September
14, 2014.
6 Ruiz, “IBISWorld Industry Report: Global Auto Parts & Accessories
Manufacturing.”
7 Ibid.
8 “On the Road: U.S. Automotive Parts Industry Annual Assessment,”
Office of Transportation and Machinery, U.S. Department of Commerce,
2011.
9 Ford Motor Company, FY2013 Form 10-K for the Fiscal Year Ending
December 31, 2013 (filed February 18, 2014); Toyota Motor
Corporation, FY2013 Form 20-F for the Fiscal Year Ending March 31,
2014 (filed June 24, 2014).
10 Auto Parts, Global (BI AUTPG) Industry Primer, Bloomberg. Accessed
September 15, 2014.
11 Timothy J. Sturgeon and Johannes Van Biesebroeck, “Effects of the
Crisis on the Automotive Industry in Developing Countries,” The World
Bank, June 2010.
12 “California Zero-Emission Vehicle Mandate is Now in Effect,” U.S.
Department of Energy Vehicle Technologies Office, March 18, 2013.
Accessed September 11, 2014.
https://www1.eere.energy.gov/vehiclesandfuels/facts/2013_fotw771.htm
l.
13 “Implementation of the TREAD Act,” National Highway Traffic Safety
Administration. Accessed September 15, 2014.
http://www.nhtsa.gov/nhtsa/announce/testimony/tread.html.
14 “End-of-life vehicles,” Europa: Summaries of EU legislation, September
26, 2011. Accessed September 16, 2013.
http://europa.eu/legislation_summaries/environment/waste_managemen
t/l21225_en.htm.
15 “Restriction of the use of certain hazardous substances (RoHS),”
European Commission, April 22, 2014. Accessed September 12, 2014.
http://ec.europa.eu/enterprise/policies/european-standards/harmonised-
standards/restriction-of-hazardous-substances/index_en.htm.
16 “Directive 2008/98/EC on waste (Waste Framework Directive),”
European Commission, last updated August 22, 2014, accessed
September 15, 2014,
http://ec.europa.eu/environment/waste/framework/; “RCRA Online,” U.S.
Environmental Protection Agency. Accessed September 15, 2014.
http://www.epa.gov/epawaste/inforesources/online/index.htm.
17 “SEC Adopts Rule for Disclosing Use of Conflict Minerals,” U.S.
Securities and Exchange Commission, 2012. Accessed April 8, 2013.
http://www.sec.gov/news/press/2012/2012-163.htm.
18 UN Global Compact and Accenture, Sustainable Energy for All: Opportunities for the Automobile Industry, 2012.
19 Author’s calculation based on data from “Annual Survey of
Manufactures: General Statistics: Statistics for Industry Groups and
Industries: 2011,” U.S. Census Bureau, released December 17, 2013.
Accessed September 19, 2014.
20 TRW Automotive, Annual Report for Health, Safety, Environment and Sustainability, 2012, p. 37.
21 “CDP 2013 Supply Chain Investor Information Request: Delphi
Automotive Plc.” CDP, P. 8. Accessed September 20, 2014.
https://www.cdp.net/sites/2013/07/4407/Investor%20CDP%202013/Pa
ges/DisclosureView.aspx.
22 “CDP 2013 Supply Chain Investor Information Request: Johnson
Controls,” CDP, P. 8. Accessed September 20, 2014.
https://www.cdp.net/sites/2013/31/9831/CDP%20Supply%20Chain%20
2013/Pages/DisclosureView.aspx.
23 “2012 Corporate Responsibility Website,” Goodyear. Accessed
September 20, 2014.
http://www.goodyear.com/responsibility/pdf/crr12.pdf.
24 Denso Corporation, CSR Report 2012. Accessed September 20, 2014.
http://www.globaldenso.com/en/csr/report/2012/index.html.
25 Delphi, Code of Ethical Business Conduct”. Accessed September 19,
2014. http://delphi.com/pdf/Delphi-Code-Of-Conduct.pdf.
26 Australian Industry Group, Managing waste in the automotive (components) manufacturing industry. Accessed September 15, 2014.
http://pdf.aigroup.asn.au/environment/16_Automotive_Manufacturing_
Waste_Reduction_Factsheet.pdf.
27 U.S. Environmental Protection Agency, National Biennial RCRA Hazardous Waste Report: Based on 2011 Data, 2011. Accessed
September 15, 2014, Exhibit 1.9,
http://www.epa.gov/wastes/inforesources/data/br11/national11.pdf.
I N D U S T R Y B R I E F | A U T O P A R T S | 34
28 Calculated based on data obtained from “Pollution Abatement Costs
and Expenditures: 2005 Survey,” U.S. Environmental Protection Agency, National Center for Environmental Economics. Accessed September 15,
2014. http://yosemite.epa.gov/ee/epa/eed.nsf/pages/pace2005.html.
29 Goodyear Tire, FY2013 Form 10-K for the Fiscal Year Ending December
31, 2013 (filed February 13, 2014).
30 Johnson Controls, FY2012 Form 10-K for the Fiscal Year Ending
September 30, 2012 (filed November 19, 2012).
31 TRW Automotive, FY2013 Form 10-K for the Fiscal Year Ending
December 31, 2013 (filed February 14, 2014).
32 TRW Automotive, Annual Report for Health, Safety, Environment and Sustainability, 2012, p. 47. Accessed September 14, 2014.
http://hses.trw.com/pdf/CostDetermination.pdf.
33 Ed Treleven, “Madison-Kipp and neighbors agree to $7.2 million in
settlements in pollution dispute,” Wisconsin State Journal, July 17, 2013.
Accessed September 17, 2014.
http://host.madison.com/news/local/environment/madison-kipp-and-
neighbors-agree-to-million-in-settlements-in/article_d0f6fedf-ae79-
5190-a8e9-f67b30c416f2.html#ixzz2gPceABly.
34 Jose M Asumendi,.Pirelli & C. SpA, J.P. Morgan Cazenove Europe
Equity Research, July 18, 2013.
35 China Zenix Auto International, FY2014 Form 20-F for the Fiscal Year
Ending December 31, 2014 (filed April 28, 2014).
36 William Atkinson, “Bosch Reduces Waste through Collaboration and
Competition,” Sustainable Planet, December 6, 2012. Accessed
September 16, 2014. http://www.sustainableplant.com/2012/12/bosch-
reduces-waste-through-collaboration-and-competition/.
37 Denso, CSR Report 2012, Accessed September 15, 2014.
38 TRW, 2013 TRW Automotive Annual Report for Health, Safety, Environment and Sustainability, accessed September 3, 2014; TRW, 2012 TRW Automotive Annual Report for Health, Safety, Environment and Sustainability. Accessed September 3, 2014.
39 Gabe Nelson and Ryan Beene, “Despite quality improvements, costly
safety issues continue to dog automakers,” Automotive News, October
28, 2013. Accessed August 28, 2014.
www.autonews.com/article/20131028/OEM11/310289981/despite-
quality-improvements-costly-safety-issues-continue-to-dog.
40 Dana Holdings, FY2012 Form 10-K for the Fiscal Year Ending
December 31, 2012 (filed February 21, 2013).
41 David Sedgwick, “GM presses suppliers for future recall costs,”
Automotive News, August 5, 2013. Accessed September 3, 2014.
http://www.autonews.com/article/20130805/OEM10/308059934/gm-
presses-suppliers-for-future-recall-costs.
42 Christopher Jensen, “Japanese Automakers Recall 3.3 Million
Vehicles,” The New York Times, April 12, 2013.
43 “BMW recalled 1,500 cars over airbag fear,” Daily Mail, May 9, 2013.
44 “Takata Posts 21.1b Yen FY Net Loss After Toyota, Nissan Recalls,”
Bloomberg First Word, May 10, 2013.
45 “Hyundai China Venture to Recall 63,588 Vehicles, Government Says,”
Bloomberg News, April 11, 2011.
46 “Cooper Tire recalling about 288,000 tires.” NBCnews.com, February
13, 2006. Accessed September 11, 2014.
http://www.nbcnews.com/id/11328815/ns/business-autos/t/cooper-tire-
recalling-about-tires/.
47 Sean Phillips, “Contaminated Rubber Causes 10,000 Tire Recall,”
About.com, June 29, 2012. Accessed September 15, 2014.
http://tires.about.com/b/2012/06/29/contaminated-rubber-causes-
10000-tire-recall.htm.
48 Tenneco Inc., FY2012 Form 10-K for the Fiscal Year Ending December
31, 2012 (filed February 28, 2013).
49 Autoliv, Annual Report 2012: Making Driving Safer.
50 “An international comparative study of end-of-life vehicle (ELV)
recycling systems,” Journal of Material Cycles and Waste Management. February 20, 2013. Accessed September 14, 2014.
http://link.springer.com/article/10.1007%2Fs10163-013-0173-2#page-
2.
51 Five Winds International, Product Stewardship Opportunities within the Automotive Industry, Minnesota Office of Environmental Assistance,
August 2003, p. 29.
52 “Inventory of U.S. Greenhouse Gas Emissions and Sinks: 1990 -
2011,” U.S. Environmental Protection Agency, last updated September 9,
2013. Accessed September 17, 2013.
http://www.epa.gov/climatechange/ghgemissions/usinventoryreport.html.
53 Author’s calculations based on 2010 data from International Energy
Agency via “CO2 emissions statistics,” International Energy Agency.
Accessed September 17, 2013.
http://www.iea.org/statistics/topics/CO2emissions/.
54 “Air pollution causes 200,000 early deaths each year in the U.S,”
Laboratory for Aviation and the Environment, Massachusetts Institute of
Technology, August 29, 2013. Accessed September 26, 2013.
http://lae.mit.edu/?p=2821.
55 “Commercial EV Sales Outstrip Consumer EVs,” Environmental Leader, September 12, 2013.
http://www.environmentalleader.com/2013/09/12/commercial-ev-sales-
outstrip-consumer-evs/.
56 Lear Corporation, FY2012 Form 10-K for the Fiscal Year Ending
December 31, 2012 (filed February 12, 2012).
57 TRW Automotive, FY2012 Form 10-K for the Fiscal Year Ending
December 31, 2012 (filed February 15, 2013).
58 “Tenneco debuts solution for waste heat recovery,” Tenneco Inc. News
Release, September 11, 2013.
I N D U S T R Y B R I E F | A U T O P A R T S | 35
59 “Goodyear’s Air Maintenance Technology wins 2012 award,”
American Recyclers News, Inc., November 2012. Accessed September 15,
2014. http://www.americanrecycler.com/1112/1859goodyear.shtml
60 TRW, 2010 TRW Annual Report for Sustainability, April 2011.
Accessed September 4, 2014.
https://www.aiag.org/staticcontent/committees/download_files/2010-
TRW-Annual-Report-for-Sustainability.pdf.
61 “Engine Components,” TRW. Accessed September 4, 2014,
http://www.trw-ec.com/en/news/did-you-know/.
62 “Will Carbon Fiber ‘Lego Bricks’ Build Airplanes of the Future?”
Environmental Leader, August 22, 2013. Accessed September 14, 2014.
http://www.environmentalleader.com/2013/08/22/will-carbon-fiber-lego-
bricks-build-airplanes-of-the-future/.
63 Autoliv, Annual Report 2012: Making Driving Safer. Accessed
September 14, 2014.
64 “Working Towards a Greener Planet,” Delphi media release. Accessed
September 4, 2014. http://delphi.com/about/news/media/tool-
kit/featureStories/fs_2013_05_14_001/.
65 Faurecia, A global automotive player: Registration document 2011,
April 28, 2011, Accessed September 12, 2014.
http://www.faurecia.com/files/media/site_com_corporate/document/ANG
LAIS%20internet/AMF%20REGULATED%20INFORMATION/Annual%20f
inancial%20reports/FININCIAL%20REPORT%202010.pdf.
66 Pirelli, Sustainability Report 2013. Accessed September 4, 2014.
http://annual-sustainability-report-
2013.pirelli.it/sites/pirelli2013csr/files/basket/eng/1310_f3_vol_03_mess
agegroup_eng.pdf.
67 “Tires. Rules, 49 CFR Part 575,” National Highway Traffic Safety
Administration. Accessed September 16, 2014.
http://www.nhtsa.gov/Laws+&+Regulations/Tires.
68 Goodyear Tire, FY2013 Form 10-K for the Fiscal Year Ending December
31, 2013 (filed February 13, 2014).
69 “Wastes - Resource Conservation - Common Wastes & Materials.
Automotive Parts,” U.S. Environmental Protection Agency, last updated
November 19, 2012. Accessed September 9, 2013,
http://www.epa.gov/osw/conserve/materials/auto.htm.
70 Office of Transportation and Machinery, U.S. Department of
Commerce, On the Road: U.S. Automotive Parts Industry Annual Assessment, 2011.
71 World Business Council for Sustainable Development, Managing End-of-Life Tires, November 2008.
72 “Bridgestone Opens Large Tire Recycling Plant In Osaka,” Nikkei English News, July 16, 2013.
73 “Tire Industry Project,” World Business Council for Sustainable
Development. Accessed September 18, 2014.
http://www.wbcsd.org/work-program/sector-projects/tires/overview.aspx.
74 “Batteries,” U.S. Environmental Protection Agency, November 19,
2013. Accessed September 15, 2014.
http://www.epa.gov/osw/conserve/materials/battery.htm.
75 “Johnson Controls opens automotive battery recycling facility,”
Industrial Org., September 18, 2012. Accessed September 12, 2014.
76 Johnson Controls, FY2012 Form 10-K for the Fiscal Year Ending
September 30, 2012 (filed November 19, 2012),
77 Wu Wencong, “Poor lead battery recycling raises fears,” China Daily,
December 12, 2013. Accessed September 16, 2014.
http://usa.chinadaily.com.cn/china/2013-12/12/content_17168678.htm.
78 “Wastes - Resource Conservation - Common Wastes & Materials:
Batteries,” U.S. Environmental Protection Agency. Accessed September
16, 2014. http://www.epa.gov/osw/conserve/materials/battery.htm.
79 Johnson Controls, 2012 Business and Sustainability Report. Accessed
September 4, 2014.
http://www.johnsoncontrols.com/content/dam/WWW/jci/corporate/sustai
nability/BSR%202012/english_BSR_2012.pdf.
80 Autoliv, Annual Report 2012: Making Driving Safer. Accessed
September 12, 2014.
81 “Guide to Antitrust Laws,” Washington State Office of the Attorney
General. Accessed September 8, 2014.
http://www.atg.wa.gov/antitrustguide.aspx.
82 “Guide to Antitrust Laws,” Federal Trade Commission. Accessed
September 8, 2014. http://www.ftc.gov/tips-advice/competition-
guidance/guide-antitrust-laws.
83 “Price Fixing, Bid Rigging and Market Allocation Schemes,” U.S.
Department of Justice. Accessed September 8, 2014.
http://www.justice.gov/atr/public/guidelines/211578.htm.
84 Data from Bloomberg Professional service, accessed on September 4,
2014, using the BICS <GO> command.
85 “Price Fixing, Bid Rigging and Market Allocation Schemes,” U.S.
Department of Justice. Accessed September 8, 2014.
http://www.justice.gov/atr/public/guidelines/211578.htm.
86 “Antitrust: Commission fines car glass producers over €1.3 billion for
market sharing cartel,” European Commission press release, November
12, 2008. Accessed September 4, 2014. http://europa.eu/rapid/press-
release_IP-08-1685_en.htm?locale=en.
87 “Price Fixing, Bid Rigging and Market Allocation Schemes,” U.S.
Department of Justice. Accessed September 8, 2014.
http://www.justice.gov/atr/public/guidelines/211578.htm.
88 “Guilty Pleas Show High Cost of Price-Fixing in Auto Industry,” The
Federal Bureau of Investigation, September 26, 2013. Accessed
September 4, 2014.
http://www.fbi.gov/news/stories/2013/september/guilty-pleas-show-
high-cost-of-price-fixing-in-auto-industry/guilty-pleas-show-high-cost-of-
price-fixing-in-auto-industry.
I N D U S T R Y B R I E F | A U T O P A R T S | 36
89 “Aisan Industry Co. Ltd. Agrees to Plead Guilty to Price Fixing on
Automobile Parts Installed in U.S. Cars,” The Federal Bureau of
Investigation, February 3, 2014. Accessed September 4, 2014.
http://www.fbi.gov/sanfrancisco/press-releases/2014/aisan-industry-co.-
ltd.-agrees-to-plead-guilty-to-price-fixing-on-automobile-parts-installed-
in-u.s.-cars.
90 “Two Denso Corporation Executives Agree to Plead Guilty for Price
Fixing and Bid Rigging on Auto Parts Installed in U.S. Cars,” U.S.
Department of Justice press release, May 21, 2013. Accessed September
12, 2014. http://www.justice.gov/opa/pr/2013/May/13-at-587.html.
91 “Aisan Industry Co. Ltd. Agrees to Plead Guilty to Price Fixing on
Automobile Parts Installed in U.S. Cars,” The Federal Bureau of
Investigation, February 3, 2014. Accessed September 4, 2014.
http://www.fbi.gov/sanfrancisco/press-releases/2014/aisan-industry-co.-
ltd.-agrees-to-plead-guilty-to-price-fixing-on-automobile-parts-installed-
in-u.s.-cars.
92 “Bridgestone Corp. Agrees to Plead Guilty to Price Fixing on
Automobile Parts Installed in U.S. Cars,” The U.S. Department of Justice,
February 13, 2014. Accessed September 4, 2014.
http://www.justice.gov/opa/pr/2014/February/14-at-157.html.
93 Autoliv, Annual Report 2012: Making Driving Safer. Accessed
September 12, 2014.
94 “TRW auto supplier unit to pay $5.1 million antitrust fine,” USA Today, July 31, 2012. Accessed September 25, 2013.
http://content.usatoday.com/communities/driveon/post/2012/07/trw-
auto-supplier-unit-to-pay-51-million-antitrust-fine/1#.UkMqkIafhoN.
95 “Tokai Rika fined $17.7 million for auto parts price fixing in U.S,”
Kyodo News International, October 30, 2012.
96 “JAPAN: Denso pays US$78m as DoJ imposes massive cartel fines,”
Industrial Org., January 31, 2012. Accessed September 12, 2014.
97 “Yazaki Corp., Denso Corp. and Four Yazaki executives agree to plead
guilty to automobile parts price-fixing and bid-rigging conspiracies,” U.S.
Department of Justice press release, January 30, 2012. Accessed
September 12, 2014.
http://www.justice.gov/atr/public/press_releases/2012/279734.htm.
98 “How the auto parts industry's price-fixing scandal has unfolded,”
Automotive News, September 26, 2013. Accessed September 18, 2014.
http://www.autonews.com/article/20130926/OEM10/130929916/timelin
e:-how-the-auto-parts-industrys-price-fixing-scandal-has#axzz2j2KnvtvJ.
99 “Critical Materials Strategy,” U.S. Department of Energy, December
2011. Accessed August 28, 2014.
http://energy.gov/sites/prod/files/DOE_CMS2011_FINAL_Full.pdf.
100 Ibid.
101 “Critical Materials Strategy,” U.S. Department of Energy, December
2011. Accessed August 28, 2014.
http://energy.gov/sites/prod/files/DOE_CMS2011_FINAL_Full.pdf.
102 “Metals, Mines and Mobiles - A risky business,” British Geological
Survey press release, September 12, 2011, p. 2. Accessed September 11,
2014.
http://www.bgs.ac.uk/news/DIARY/Mines%20metals%20and%20mobile
s%20press%20release.pdf.
103 M. Drajem, M. and G. Ratnam, “Rare Earth Prices Soar Even as China
Pledges Supply,” Bloomberg News, October 20, 2010. Accessed
September 11, 2014. http://www.bloomberg.com/news/2010-10-
20/china-pledges-to-maintain-rare-earth-sales-official-says-exports-may-
rise.html.
104 “The Difference Engine: Nikola's revenge,” The Economist, April 1,
2011. Accessed August 28, 2014.
http://www.economist.com/blogs/babbage/2011/04/induction_motors.
105 Jean Friedman-Rudovsky “For Lithium Car Batteries, Bolivia Is in the
Driver's Seat,” TIME, January 22, 2009. Accessed September 11, 2014.
http://content.time.com/time/world/article/0,8599,1872561,00.html;
“Lithium trial gets off ground in Bolivia,” The Japan Time News, February
25, 2013. Accessed September 11, 2014.
http://www.japantimes.co.jp/news/2013/02/25/national/lithium-trial-
gets-off-ground-in-bolivia/#.VBI3hGMqS3Q.
106 Zach McDonald, “Rare Earth Elements Aren't as Vital to Hybrids and
EVs as You Might Think,” PluginCars, May 17, 2011. Accessed August
29, 2014. http://www.plugincars.com/rare-earth-elements-arent-actually-
necessary-evs-or-hybrids-107194.html.
107 “Minerals and Metals Scarcity in Manufacturing: The Ticking Time
Bomb,” PwC, December 2011. Accessed September 11, 2014.
http://www.pwc.com/en_GX/gx/sustainability/research-
insights/assets/impact-of-minerals-metals-scarcity-on-business.pdf.
108 “Conflict Minerals and the Democratic Republic of Congo:
Responsible Action in Supply Chains, Government Engagement and
Capacity Building,” BSR, May 2010. Accessed September 11, 2014.
109 “Conflict Mineral Statement, Proposal October 13, 2011,”
Automotive Industry Action Group, October 13, 2011. Accessed
September 11, 2014.
http://www.aiag.org/staticcontent/committees/download_files/download.
cfm?fname=SEC%20Conflict%20Mineral%20Filing%20Requirements%
20Statement%20Proposal%2020111013.pdf.
110 Chelsea Craven, “Why US Tantalum Imports—And Prices—Are
Skyrocketing,” Metal Miner, April 2013. Accessed September 13, 2014.
http://agmetalminer.com/2013/04/03/why-us-tantalum-imports-and-
prices-are-skyrocketing/.
111 Johnson Controls, FY2012 Form 10-K for the Fiscal Year Ending
September 30, 2012 (filed November 19, 2012).
112 Jim Low, “Dodd-Frank and the Conflict Minerals Rule,” KPMG, 2012.
Accessed September 12, 2014.
http://www.kpmg.com/US/en/IssuesAndInsights/ArticlesPublications/dod
d-frank-series/Documents/dodd-frank-and-conflict-minerals-rule-q4.pdf.
I N D U S T R Y B R I E F | A U T O P A R T S | 37
ISBN#: 978-1-940504-28-5 The information, text, and graphics in this publication (the ‘‘Content’’) is owned by Sustainability Accounting Standards Board. All rights reserved. You may use the Content only for non-commercial and scholarly use, provided that you keep intact all copyright and other proprietary notices related to the Content, and that you make no modifications to the Content. The Content may not be otherwise disseminated, distributed, republished, reproduced, or modified without the prior written permission of Sustainability Accounting Standards Board. To request permission, please contact us at [email protected]
SUSTAINABILITY ACCOUNTING STANDARDS BOARD®
75 Broadway, Suite 202
San Francisco, CA 94111
415.830.9220
www.sasb.org