Embed Size (px)
Citation preview

Marquette University Marquette University
e-Publications@Marquette e-Publications@Marquette
Master's Theses (2009 -) Dissertations, Theses, and Professional Projects
Auto-Grading OCT Images Diagnostic Tool for Retinal Disease Auto-Grading OCT Images Diagnostic Tool for Retinal Disease
Classification Classification
Shiyu Tian Marquette University
Follow this and additional works at: https://epublications.marquette.edu/theses_open
Part of the Computer Sciences Commons
Recommended Citation Recommended Citation Tian, Shiyu, "Auto-Grading OCT Images Diagnostic Tool for Retinal Disease Classification" (2021). Master's Theses (2009 -). 642. https://epublications.marquette.edu/theses_open/642

AUTO-GRADING OCT IMAGES DIAGNOSTIC TOOL FOR RETINAL
DISEASE CLASSIFICATION
by
Shiyu Tian
A Thesis submitted to the Faculty of the Graduate School,
Marquette University,
in Partial Fulfillment of the Requirements for
the Degree of Master of Science
Milwaukee, Wisconsin
May 2021

ABSTRACT
AUTO-GRADING OCT IMAGES DIAGNOSTIC TOOL FOR RETINAL
DISEASE CLASSIFICATION
Shiyu Tian
Marquette University, 2021
Retinal eye disease is the most common reason for visual deterioration. Long-
term management and follow-up are critical to detect the changes in symptoms. Optical
Coherence Tomography (OCT) is a non-invasive diagnostic tool for diagnosing and
managing various retinal eye diseases. With the increasing desire for OCT image, the
clinicians are suffered from the burden of time on diagnoses and treatment. This thesis
proposes an auto-grading diagnostic tool to divide the OCT image for retinal disease
classification. In the tool, the classification model implements convolutional neural
networks (CNNs), and the model training is based on denoised OCT images. The tool can
detect the uploaded OCT image and automatically generate a result of classification in
the categories of Choroidal neovascularization (CNV), Diabetic macular edema (DME),
Multiple drusen, and Normal. The system will definitely improve the performance of
retinal eye disease diagnosis and alleviate the burden on the medical system.

i
ACKNOWLEDGMENTS
Shiyu Tian
First and foremost, I would like to express my gratitude to all those who helped
me during the writing of this thesis. My deepest gratitude goes first and foremost to my
adviser Dr. Sheikh Iqbal Ahamed, for his constant encouragement and guidance.
I would like to express my gratitude to the Ubicomp Lab and the lab members for
supporting and inspiring me to complete this long journey.
Heartfelt gratitude would go to my committee members Dr. Abdur Sikder and Dr.
Anik Iqbal. I would also like to thank the Graduate School and all of the Marquette
University administration.

ii
TABLE OF CONTENTS
AUTO-GRADING OCT IMAGES DIAGNOSTIC TOOL FOR RETINAL DISEASE
CLASSIFICATION ............................................................................................................ 1
ABSTRACT ........................................................................................................................ 2
AUTO-GRADING OCT IMAGES DIAGNOSTIC TOOL FOR RETINAL DISEASE
CLASSIFICATION ............................................................................................................ 2
ACKNOWLEDGMENTS ................................................................................................... i
CHAPTER 1. INTRODUCTION ....................................................................................... 1
1.1 Diagnostic Markers for AMD and DME ............................................................................ 2
1.1.2 Choroidal Neovascularization ....................................................................................................... 2
1.1.3 Diabetic Macular Edema............................................................................................................... 3
1.1.4 Drusen ........................................................................................................................................... 3
1.1.5 Optical Coherence Tomography ................................................................................................... 3
1.2 Data Mining and Medical Imaging ........................................................................................ 4
1.3 Technology in Assisting Eye Disease Diagnosis ................................................................... 4
1.4 The Proposed Tool and Web Portal ....................................................................................... 5
CHAPTER 2: RELATED WORK FROM IMAGING SEGMENTATION TOWARDS
CONVOLUTIONAL NEURAL NETWORK .................................................................... 6
2.1 Image segmentation ............................................................................................................... 6
2.2 CNN ...................................................................................................................................... 8
CHAPTER 3: MATERIALS AND METHODOLOGY FOR OCT IMAGE
CLASSIFICATION TOOL .............................................................................................. 14
3.1 Dataset .............................................................................................................................. 14

iii
3.2 Model architecture ............................................................................................................ 15
3.3 Performance ...................................................................................................................... 17
3.4 Sensitivity, and specificity ................................................................................................ 18
3.5 Other test dataset .............................................................................................................. 19
3.6 Comparison ....................................................................................................................... 19
3.7 Implementation through web portal..................................................................................... 20
3.8 Upload Image ................................................................................................................... 21
3.9 Predict Image .................................................................................................................... 22
CHAPTER 4: CONCLUSION AND FUTURE WORK .................................................. 23
4.1 Contribution ...................................................................................................................... 23
4.2 Impact ............................................................................................................................... 23
4.3 Conclusion ........................................................................................................................ 23
4.4 Future Work ...................................................................................................................... 24
REFERENCES ................................................................................................................. 26
APPENDIX A ................................................................................................................... 32

iv
LIST OF FIGURES
Figure 2.1 Flowchart of the method used in [18]............................................................... 7
Figure 2.2 CNN-GS algorithm [39] ................................................................................... 9
Figure 2.3 The flowchart of the method [20] ..................................................................... 9
Figure 2.4 Inception V3 architecture [42]........................................................................ 10
Figure 2.5 Inception module [42] .................................................................................... 11
Figure 2.6 OCT-NET model architecture [43] ................................................................ 11
Figure 2.7 Images with different quality [21] ................................................................ 122
Figure 2.8 Capsule network architecture [22].................................................................. 13
Figure 3.1 Workflow ......................................................................................................... 14
Figure 3.2 Representative OCT images [19] .................................................................... 15
Figure 3.3 Dataset structure .............................................................................................. 15
Figure 3.4 Model structure ............................................................................................... 16
Figure 3.5 Train Performance .......................................................................................... 17
Figure 3.6 Confusion Matrix............................................................................................. 18
Figure 3.7 Main interface ................................................................................................. 21
Figure 3.8 Upload image .................................................................................................. 21
Figure 3.9 Image uploaded .............................................................................................. 22
Figure 3.10 Result prediction ........................................................................................... 22
Figure 4.1 EMR Demo ..................................................................................................... 25

1
CHAPTER 1. INTRODUCTION
Vision is an essential sensor for individuals. Activities such as reading, writing,
and driving require good vision, but retinal diseases can cause irreversible destruction of
vision. Age-related macular degeneration (AMD) is the most common cause of blindness
in Americans over 60 years old, and diabetic macular edema (DME) is the leading cause
of blindness in patients with diabetes [1, 2, 3, 9, 10, 11].
A vast number of people suffer from retinal diseases like AMD and DME every
year. From 2000 to 2010, the number of AMD patients in the U.S. grew from 1.75 million
to 2.07 million, and the number is expected to grow to more than 5 million by 2050 [26,
27, 28, 30]. An ophthalmology study showed that 75,000 patients in the United States are
affected by diabetic macular edema each year [31].
Lack of awareness and treatment of DME and AMD among those that suffer from
it can exacerbate its severity. One study demonstrated that AMD patients were often
undertreated: about half of patients missed clinic appointments, and over 20% of patients
had more than 100 days between appointments [24]. A study in 2012 indicated that 73%
of diabetic retinopathy patients and 84% of AMD patients did not even know about their
condition [25].
Financial expenditures on AMD and DME are enormous. It is estimated that the
global cost of visual impairment caused by age-related macular degeneration is $343
billion, including $255 billion in direct medical expenses [28]. Of the total annual
medical costs of $245 billion related to diabetes in the US, $176 billion is attributable to
direct medical expenses, and $69 billion is attributable to reduced productivity.

2
1.1 Diagnostic Markers for AMD and DME
Between 2010 to 2050, the estimated number of people suffering from age-related
macular degeneration (AMD) is expected to increase from 2.07 million to 5.44 million in
the U.S., more than doubling. Another study estimates that the number of individuals who
have diabetes mellitus (DM) will increase to 592 million by 2035, and approximately
20% of DM patients suffer from diabetic macular edema (DME). Three main conditions,
related to these diseases and identifiable by imaging, are the main target for analysis –
Choroidal Neovascularization, Diabetic Macular Edema, and Drusen.
1.1.2 Choroidal Neovascularization
Choroidal neovascularization (CNV) is a result of age-related macular
degeneration represented by the abnormal growth of vessels extending above the Bruch’s
membrane [1, 2, 3]. AMD is the most common reason for the irreversible destruction of
vision in the elderly [4]. Among AMD cases, 85–90% of them are atrophic AMD, and
10–15% of cases are neovascular AMD. CNV occurs mainly as the result of neovascular
(exudative or wet) AMD [6]. CNV results from the new abnormal blood vessels in the
choroid, which is a vascular layer of the retina. With accumulated vascular endothelial
growth factor (VEGF) in AMD patients, new blood vessels proliferate from the choroid
and invade the retina, forming CNV [5, 45]. Due to the immaturity of the resultant
vessels, leakage occurs and causes macular edema, leading to neovascular AMD [7][8].
Generally, CNV is a characteristic manifestation of neovascular AMD.

3
1.1.3 Diabetic Macular Edema
Diabetic macular edema (DME) is the primary cause of visual deterioration in
diabetics [9]. High blood glucose levels affect retinal microcirculation, resulting in
Diabetic retinopathy (DR) performing as retinal vascular hyperpermeability and other
retinal alterations [10, 11]. Patients in any period of DR are susceptible to DME. The
damage of inner blood-retinal barrier is the leading pathogenesis of DME. Because of the
severe structural retinal changes, DME is one of the most frequent causes of blindness.
1.1.4 Drusen
Clinically, drusen are yellowish focal deposits deep to the retina [13, 16]. Based
on the evaluation of its characteristics such as distribution, number, size, and shape,
drusen can be distinguished as physiological or pathological [15]. Soft drusen are
considered as a clinical hallmark of early non-neovascular AMD, although small drusen
can represent normal aging and are not equivalent to a potential progression of advanced
AMD [13, 14].
1.1.5 Optical Coherence Tomography
Optical coherence tomography (OCT) is a non-invasive, non-contact imaging technology
[17]. OCT images are important medical data for retinopathy diagnosis. It takes high-
resolution cross-section retina images using light waves instead of ultrasound. The
ophthalmologist, assisted by OCT, can observe the tissues in each retina layer and
diagnose and manage various eye diseases. For example, it is used to monitor macular
edema's response to treatment to follow the progression or regression and make
adjustments accordingly [32]. By using OCT, clinicians can identify and evaluate the
existence, characteristics, and severity of CNV, DME and drusen.

4
1.2 Data Mining and Medical Imaging
As informatization continues to deepen, the importance of data mining, analysis,
and application has become increasingly prominent in the medical industry. In terms of
quantity, more than 80% of medical data comes from medical imaging data [38]. The
medical imaging data complies with the 4V rule (the volume, variety, velocity, and
veracity). For a vast volume of medical imaging data, the process leading up to diagnosis
requires significant medical resources. The number of experts is limited, and most
medical big data is not well structured, which makes it all but useless. Storage of data can
become a burden to medical organizations.
1.3 Technology in Assisting Eye Disease Diagnosis
In recent years, the integration of artificial intelligence technology and the medical
field has continued to deepen. In the field of artificial intelligence, voice interaction,
computer vision, and cognitive computing have gradually matured. Therefore, the
application scenarios of artificial intelligence have become more abundant. Artificial
intelligence technology has gradually become an important factor affecting the
development of the medical industry and improving the level of medical services.
With the accumulation of high-quality big data, high performance computing
environment, and optimized deep learning methods, the accuracy of the neural network
model is increasing. However, with the increasing requirement of OCT image diagnoses,
an auto-grading system is needed to assuage the burden on the clinicians. This thesis
proposes an OCT image auto-grading system to benefit clinicians to diagnose and manage
eye diseases. The application uses the Convolutional Neural Network (CNN) algorithm to
classify the OCT images into four categories: Choroidal neovascularization (CNV),

5
Diabetic macular edema (DME), Multiple drusen, and Normal. Our auto-grading tool,
implementing the CNN model, can quickly interpret the characteristics of the disease in
the image. It assists the doctor in the analysis of the disease and improves the efficiency
and accuracy of diagnoses and treatment.
1.4 The Proposed Tool and Web Portal
With the increasing requirement of OCT image diagnoses for retinal diseases, the
auto-grading OCT image classification system is a competent tool to enhance the
efficiency of medical systems. Since the number of individuals who have AMD/DME is
increasing due to the rapid aging of the US population, the auto-grading tool can
potentially save medical resources in multiple areas including disease prediction,
intelligent decision-making, individualized treatment plan, and chronic disease
management.
Embedded with the CNN classification model, our web portal provides a usable
user interface for clinicians to interact and generate OCT test results. This system can
improve diagnostic capabilities and help rapid decision-making. By providing rapid
preliminary diagnoses for ophthalmologists within seconds, the auto-grading OCT image
classification tool can alleviate the burden on the clinicians, reduce the waiting time of
patients, decrease repeated consultations, and improve the efficiency of diagnoses and
treatment.

6
CHAPTER 2: RELATED WORK FROM IMAGING SEGMENTATION
TOWARDS CONVOLUTIONAL NEURAL NETWORK
The implementation of auto-grading system algorithms for optical coherence
tomography images has undergone a long development. With the development of the
neural network, researchers have explored the diagnostic tool with different methods. The
application of an auto-grading system has also experienced a long development. Earlier
algorithms began with an image segmentation model. Similar to the approach that human
experts use, the segmentation algorithms detected the edge of the features and made
diagnoses by a binary classification algorithm [18]. As the convolutional neural network
(CNN) came to maturity, it was gradually implemented in the classification model. One
study attempted to use CNN to recognize the features and make classifications [19]. In
recent years, some CNN models have been customized to achieve higher accuracy [21,
22].
Since the beginning of the 21st century, OCT technology is more frequently used
in detecting the features of AMD and DME [35, 36, 37]. With the increasing desire for
OCT image auto-grading, many organizations have put forth resources in this field to
attempt to achieve more accurate models. In this chapter, some acknowledged tasks and
models are introduced.
2.1 Image segmentation
Development of automated image classification/grading systems started with an
automated segmentation algorithm [18]. In 2014, [18] proposed an automated
classification tool to recognize AMD and DME. They used image segmentation to detect
the specific feature (RNFL and drusen) of AME and DME and made it the identifier of

7
the classification. Similar to a manual diagnosis method that ophthalmologists used, this
paper implemented disease classification by the conditions in the retinal nerve fiber layer
(RNFL), photoreceptor inner/outer segment (IS/OS), and retinal pigment epithelium
(RPE). The algorithm extracted normality of RPE layer, bubble upper RPE layer, and
bubble and in IS/OS layer as features and used binary classification algorithm to make the
diagnoses result.
The image segmentation was achieved by threshold algorithm. This algorithm was
a great start for the development of an auto-grading tool, but it required high quality
images. The algorithm was sensitive to noise, and didn't work well if the gray levels of
the image were not obvious or the gray levels contained overlapping parts.
Figure 2.1 Flowchart of the method used in [18]

8
2.2 CNN
Convolutional neural network is a subclass of deep neural network. The neurons
composed of convolution kernel can respond to surrounding units in the coverage area,
performing excellent for image processing. Generally, it includes convolutional layer,
pooling layer, and fully connected layer. Convolutional layers are implemented for
feature extraction. Then after passing through a convolutional layer, images are slid
across the convolution kernel and multiplied with the kernel matrix. Neurons have
connections to some of the neurons of the prior layers to extract the local feature. Pooling
layers calculate the average or max value of clusters of neurons at the previous layer.
Compared with convolutional layers, pooling layers are more efficient in data
dimensionality reduction. It reduces the requirement of the amount of computation and
avoids overfitting. Fully connected layers are similar to regular artificial neural networks.
The input of each neuron is connected to all activations in the previous layer to achieve
classification. With satisfying performance, the convolutional neural network became the
mainstream in the OCT image classification model.
In 2017, [39] presented an automatic segmentation framework based on
convolutional neural networks and graph search methods (CNN-GS). They segmented the
OCT images of non-exudative AMD patients to detect nine retinal layer boundaries. The
algorithm first generated probability maps by the convolutional neural network. Then
they used the CNN probability map to achieve layer segmentation. This was a novel use
of convolutional neural network that customized the CNN and integrated with a
segmentation algorithm.

9
Figure 2.2 CNN-GS algorithm [39]
[20] proposed surrogate-assisted retinal OCT image classification based on CNN
for AMD and DME. The flowchart of the approach is presented in Figure 2.3. They kept
the feature extraction process by generating surrogate images to emphasize the features of
the data and reduce complexity. The surrogate images were composed of four regions
with different pixel intensities. The authors built CNN models for the classification of
surrogate images. The architecture of the model contained 4 convolutional layers and a
fully connected layer, achieving 0.9783 in AUC of the local database and 0.9856 in AUC
of the public database. This manually feature extraction process could cause the loss of
features in the images because the mask extraction is sensitive to noise.
Figure 2.3 The flowchart of the method [20]

10
In 2018, Kermany et al. [19] collected and processed a vast number of OCT
images and built a CNN model based on the denoised images. The dataset they processed
has been published, which is also the training and testing dataset of the model described
in this thesis.
Their structure employed Inception V3 architecture, which is presented in Figure
2.4 [42]. This model had 3 inception modules, presented in Figure 2.5. The a, b, c in
Figure 2.5 is the figure 5, 6, 7 in Figure 2.4. Convolution kernels were split into multiple
small convolutional layers. It expended the depth of the network and increased the
nonlinear fitting ability of the neural network. Their model achieved an accuracy of
96.6%, with 97.8% for sensitivity and 97.4% for specificity. This model achieved a great
accuracy, but its network is deep, which requires large computational complexity.
Figure 2.4 Inception V3 architecture [42]
11
Figure 2.5 Inception module [42]
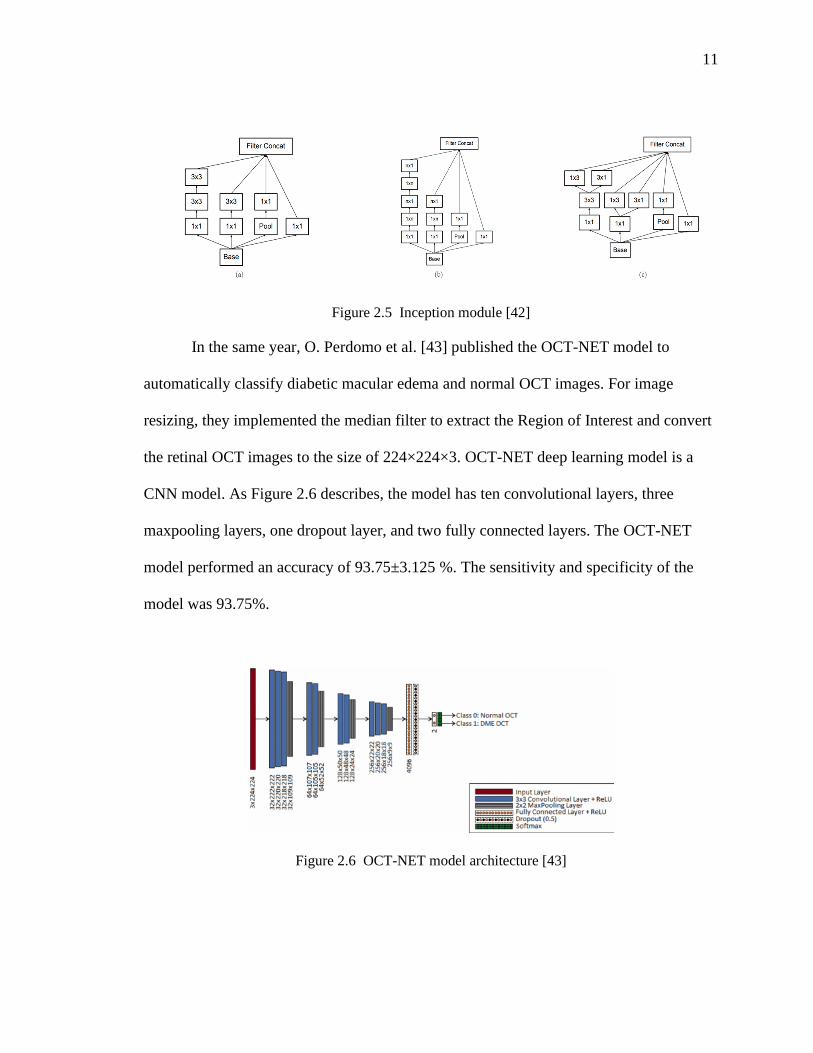
In the same year, O. Perdomo et al. [43] published the OCT-NET model to
automatically classify diabetic macular edema and normal OCT images. For image
resizing, they implemented the median filter to extract the Region of Interest and convert
the retinal OCT images to the size of 224×224×3. OCT-NET deep learning model is a
CNN model. As Figure 2.6 describes, the model has ten convolutional layers, three
maxpooling layers, one dropout layer, and two fully connected layers. The OCT-NET
model performed an accuracy of 93.75±3.125 %. The sensitivity and specificity of the
model was 93.75%.
Figure 2.6 OCT-NET model architecture [43]

12
In [21], the researchers proposed a CNN architecture to classify the quality of
OCT images and compared 4 CNN architectures (VGG-16, Inception-V3, ResNet-18, and
ResNet-50) for OCT image classification and found ResNet-50 performed best with an
overall accuracy of 96.25%. This system performed well for retinopathy detection and
contributed to the design of a computer-aided diagnostic system (CADS). One innovative
aspect of this research is that they created a quality classification network for OCT
images. They evaluated the quality of the retinal OCT images into four categories:
‘good,’ ‘off-center,’ ‘signal-shielded,’ and ‘other.’ By this method, poor retinal OCT
images can be filtered out. The images with good features could improve the accuracy of
the CNN model.
Figure 2.7 Images with different quality [21]
In 2020, [22] built a CNN model for the classification of retinal OCT images. The
authors designed a capsule network. The network architecture was composed of five
convolution layers and primary caps (this was the sixth convolution layer with 32 × 8
filters and 5 × 5 convolutional kernels) and constructed capsules in the following layer.
This architecture improved the accuracy of the CNN model and achieved high accuracy

13
of 99.6%. Capsules network work well on detecting the exist and position of the feature,
but it loses the translation invariance of the model, which is useful for image
classification.
Figure 2.8 Capsule network architecture [22]

14
CHAPTER 3: MATERIALS AND METHODOLOGY FOR OCT IMAGE
CLASSIFICATION TOOL
The workflow of the project is presented in Figure 5.1. This chapter describes the
materials and methods implemented in the auto-grading tool.
Figure 3.1 Workflow
3.1 Dataset
We used the OCT image dataset published by Kermany et al. for image-based
medical deep learning study [9]. This dataset is available on the Kaggle website
(https://www.kaggle.com/paultimothymooney/kermany2018, accessed on Dec 12, 2020),
and includes 84495 OCT images (JPEG) comprised of 4 categories (NORMAL, CNV,
DME, and DRUSEN). The training dataset includes 37205 images labeled CNV, 11348
labeled DME, 8616 labeled drusen, and 26315 normal images. The test dataset contains
250 images for each category. In model training, the training dataset is split into 90%
training set and 10% validation set.

15
Figure 3.2 Representative OCT images [19]
Figure 3.3 Dataset structure
3.2 Model architecture
In the classification model, we started with the images resize process to modify
the image size to 32 × 32, which was 512 × 512 originally, to dramatically reduce the
computing capability requirements. In the OCT image resizing process, we used a high-
quality Lanczos filter to keep as much original signal as possible [23]. We implemented
this through the LANCZOS algorithm in Pillow package. This process has two leading
advantages. The first one is universality. All images require this process to interact with

16
the model, and undesired frequencies are filtered to make the model useable for OCT
images from different sources. Another benefit is to emphasize the character of the OCT
images. The augmentation of factors can promote the capability of the classification
model and improve accuracy.
Figure 3.4 Model structure
Figure 3.4 presents the structure of the model. Evolved from VGG-16 architecture
[40], our model architecture utilizes small convolution filters of dimensions 3 × 3 and
three fully connected layers. The structure is composed of three convolutional layers. The
first convolution layer contains 32 filters with 3 × 3 convolution kernels and a stride of 1
pixel. The second and third convolution layer have the same convolution kernels and the
numbers of their channels are 64 and 128. Among the layers, 4 dropout layers are
distributed in the model. In dropout layers, some of the neuron nodes are randomly

17
ignored to prevent the neural networks from overfitting [41]. The three fully connected
layers are used for dimensional transformation. They change the high-dimensional data to
low-dimensional ones and retain the useful features. Then, SoftMax layer, as the last layer
of the model, receives the nodes and accomplishes the classification.
All convolution and fully connected layers in the model apply Rectified Linear
Unit (ReLU) as the activation function. Compared with sigmoid function, ReLU function
is a non-saturating activation function that can avoid the vanishing gradient problem.
With easily calculated derivatives, ReLU can also accelerate network training.
3.3 Performance
We trained the model for 200 epochs using Adam optimizer. The accuracy and
cross-entropy loss are presented in Figure 3.5. Then, we assessed the trained model by the
test dataset and achieved an accuracy of 99.59%.
Figure 3.5 Train Performance
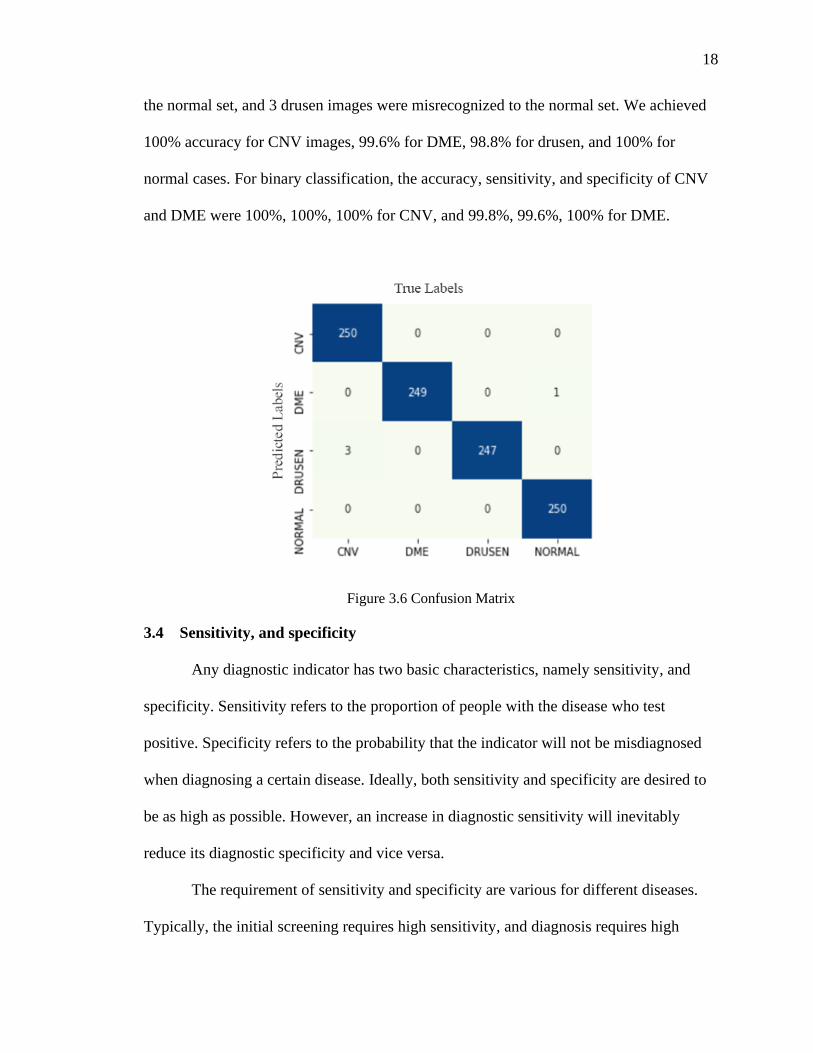
The model was evaluated with 1000 OCT images. Figure 5.6 presents the
confusion matrix. Among the 1000 testing images, 1 DME image was misrecognized to
18
the normal set, and 3 drusen images were misrecognized to the normal set. We achieved
100% accuracy for CNV images, 99.6% for DME, 98.8% for drusen, and 100% for
normal cases. For binary classification, the accuracy, sensitivity, and specificity of CNV
and DME were 100%, 100%, 100% for CNV, and 99.8%, 99.6%, 100% for DME.
Figure 3.6 Confusion Matrix
3.4 Sensitivity, and specificity
Any diagnostic indicator has two basic characteristics, namely sensitivity, and
specificity. Sensitivity refers to the proportion of people with the disease who test
positive. Specificity refers to the probability that the indicator will not be misdiagnosed
when diagnosing a certain disease. Ideally, both sensitivity and specificity are desired to
be as high as possible. However, an increase in diagnostic sensitivity will inevitably
reduce its diagnostic specificity and vice versa.
The requirement of sensitivity and specificity are various for different diseases.
Typically, the initial screening requires high sensitivity, and diagnosis requires high

19
specificity. Our model achieved 100% for specificity, which indicates the high accuracy
of positive results. The sensitivity and specificity of the model performed well when
compared with manual diagnoses from human experts [19].
3.5 Other test dataset
We tested the model using a dataset from another source, Scholars Portal
Dataverse [43]. The categories of the dataset were different from the categories in our
training data. Therefore, the dataset involved in the extra test is the NORMAL category in
Scholars Portal Dataverse dataset, since it is the only shared category between the two
datasets. This dataset contained 206 OCT images of adult healthy retinas. After the
classification was processed, the number of correct answers was 204. It achieved high
accuracy of 99.5%. The test result indicates the high specificity of the model. Although
more datasets are needed to evaluate the sensitivity, the model presented great generality.
3.6 Comparison
Compared with models by other researchers that used the same dataset, the our
model achieved the highest accuracy in all but one category.
TABLE I. ACCURACY COMPARISON
Kermany et al.
[19]
T. Tsuji et al. [22] This thesis
CNV 98.4% 99.6% 100%
DME 94.4% 100% 99.6%
DRUSEN 96.8% 99.6% 98.8%
NORMAL 94.8% 100% 100%

20
Kermany et al. [19] (the initial source of the dataset) proposed a CNN model to
classify the OCT images and achieved an accuracy of 98.4% for CNV, 94.4% for DME,
96.8% for drusen, and 94.8% for normal. Compared with the Inception V3 architecture
CNN model in the research, our model achieved relatively higher accuracy.
[21] proposed a model with five convolution layers and a Primary Caps layer
(32 × 8 filters, 5 × 5 convolutional kernels with a stride of 2 pixels) and achieved 99.6%
for CNV, 100% for DME, 99.6% for drusen, and 100% for normal. It presents a similarly
high accuracy as our model.
Moreover, compared with other networks, the computing complexity and training
time of our algorithm was lower. Before training, the OCT images were resized to smaller
images, while maintaining the maximum features by using the LANCZOS algorithm. Our
methodology reduced the requirement of computing capability for training while
maintaining high accuracy with fewer layers in the model.
3.7 Implementation through web portal
For implementation, we built a web portal for convenient use. This chapter
describes the features of the tool. Figure 6.1 presents the main interface of the tool. Users
can upload the OCT image and receive a result based on the model.
21
Figure 3.7 Main interface
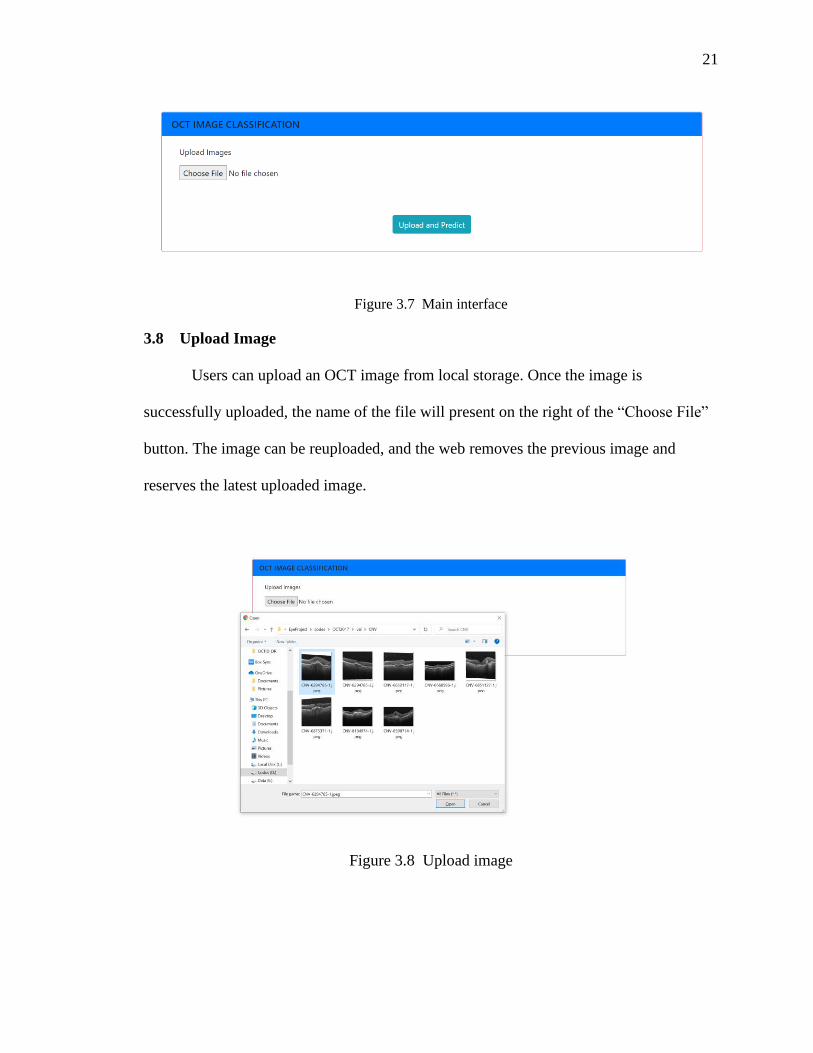
3.8 Upload Image
Users can upload an OCT image from local storage. Once the image is
successfully uploaded, the name of the file will present on the right of the “Choose File”
button. The image can be reuploaded, and the web removes the previous image and
reserves the latest uploaded image.
Figure 3.8 Upload image
22
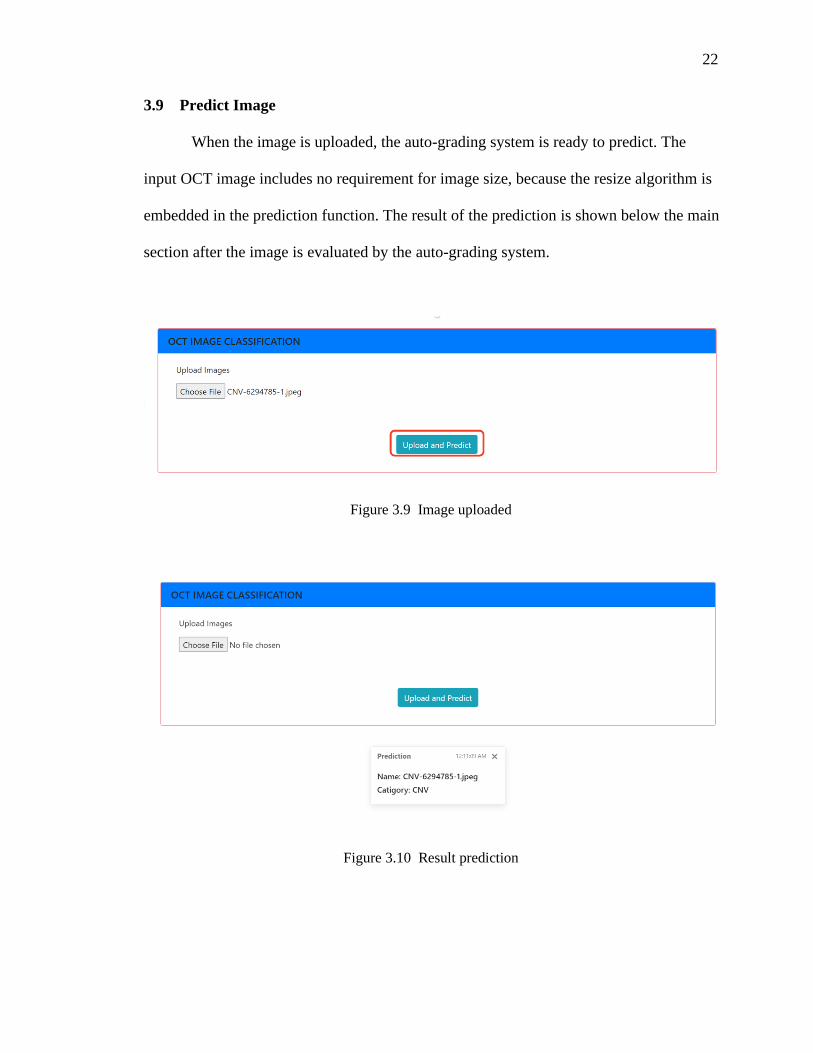
3.9 Predict Image
When the image is uploaded, the auto-grading system is ready to predict. The
input OCT image includes no requirement for image size, because the resize algorithm is
embedded in the prediction function. The result of the prediction is shown below the main
section after the image is evaluated by the auto-grading system.
Figure 3.9 Image uploaded
Figure 3.10 Result prediction

23
CHAPTER 4: CONCLUSION AND FUTURE WORK
4.1 Contribution
This thesis aims at developing an auto-grading OCT image classification tool for
the diagnose of retinopathy (CNV, DME, drusen). The tool, performed as a web portal, is
based on a convolutional neural network model, which is trained by resized OCT images.
This tool achieved high accuracy and is universal enough to recognize data from different
sources.
4.2 Impact
Between 2010 to 2050, the estimated number of people suffering from AMD is
expected to increase from 2.07 million to 5.44 million in the U.S., more than doubling.
Another study estimates that the number of individuals who have DM will increase to 592
million by 2035, and approximately 20% of DM patients suffer from DME. With the
increasing requirement of OCT image diagnoses for retinal diseases, the auto-grading
OCT image classification system is a competent tool to enhance the efficiency of medical
systems. Since the number of individuals who have AMD/DME is increasing due to the
rapid aging of the US population, the auto-grading tool can potentially save medical
resources in multiple areas including disease prediction, intelligent decision-making,
individualized treatment plan, and chronic disease management.
4.3 Conclusion
The model of auto-grading OCT image classification tool achieved high accuracy
for the OCT dataset from both the Kaggle and other sources. A web portal classification
tool is built based on the model. Although the process of resizing images takes risk of

24
feature loss, the CNN model performs excellent results. It indicates the possibility of a
more efficient model training process.
Embedded with the CNN classification model, the web portal provides a usable
user interface for clinicians to interact and generate OCT test results. This system can
improve diagnostic capabilities and help with rapid decision-making. By providing rapid
preliminary diagnoses for ophthalmologists within seconds, the auto-grading OCT image
classification tool can alleviate the burden on the clinicians, reduce the waiting time of
patients, decrease repeated consultations, and improve the efficiency of diagnoses and
treatment.
4.4 Future Work
An electronic medical record (EMR) is a system composed of the patient's
medical treatment files such as the records of text, symbols, charts, images, and slices
data. The impressive data in the EMR system is obtained, sorted, and analyzed by
medical staff through outpatient, physical examination, auxiliary examination, diagnoses,
treatment, nursing, and other medical activities. It provides the most practical and
abundant data for health management, medical diagnoses, treatment, and scientific
research. EMR significantly improved medical quality, management level, and academic
ability [33]. Besides, it is a cost-saving approach not only for paper and folders but also
for labor and storage space.
25
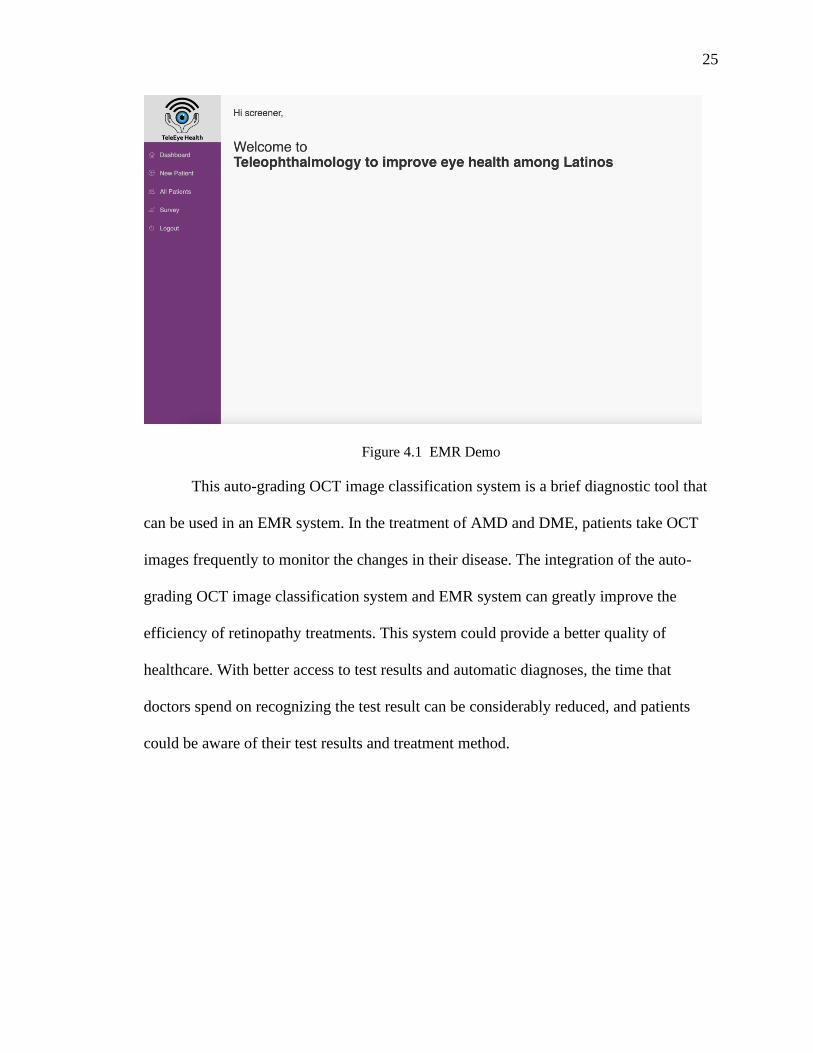
Figure 4.1 EMR Demo
This auto-grading OCT image classification system is a brief diagnostic tool that
can be used in an EMR system. In the treatment of AMD and DME, patients take OCT
images frequently to monitor the changes in their disease. The integration of the auto-
grading OCT image classification system and EMR system can greatly improve the
efficiency of retinopathy treatments. This system could provide a better quality of
healthcare. With better access to test results and automatic diagnoses, the time that
doctors spend on recognizing the test result can be considerably reduced, and patients
could be aware of their test results and treatment method.

26
REFERENCES
[1] M. R. Kesen and S. W. Cousins, “Choroidal Neovascularization,” in Encyclopedia
of the Eye, Elsevier, 2010, pp. 257–265.
[2] A. Oishi, “Choroidal neovascularization secondary to diseases other than age-
related macular degeneration,” in Choroidal Disorders, Elsevier, 2017, pp. 117–
138.
[3] F. Y. Chau et al., “Osteogenesis Imperfecta and the Eye,” in Osteogenesis
Imperfecta, Elsevier, 2014, pp. 289–303.
[4] K. M. Gehrs, D. H. Anderson, L. V. Johnson, and G. S. Hageman, “Age-related
macular degeneration--emerging pathogenetic and therapeutic concepts,” Ann.
Med., vol. 38, no. 7, pp. 450–471, 2006.
[5] I. Bhutto and G. Lutty, “Understanding age-related macular degeneration (AMD):
relationships between the photoreceptor/retinal pigment epithelium/Bruch’s
membrane/choriocapillaris complex,” Mol. Aspects Med., vol. 33, no. 4, pp. 295–
317, 2012.
[6] C. S. Tan and S. R. Sadda, “Neovascular (wet) age-related macular degeneration,”
in Choroidal Disorders, Elsevier, 2017, pp. 89–116.
[7] H. E. Grossniklaus and W. R. Green, “Choroidal neovascularization,” Am. J.
Ophthalmol., vol. 137, no. 3, pp. 496–503, 2004.
[8] P. A. Campochiaro, “Retinal and choroidal neovascularization,” J. Cell. Physiol.,
vol. 184, no. 3, pp. 301–310, 2000.

27
[9] N. Bhagat, R. A. Grigorian, A. Tutela, and M. A. Zarbin, “Diabetic macular
edema: pathogenesis and treatment,” Surv. Ophthalmol., vol. 54, no. 1, pp. 1–32,
2009.
[10] N. K. Waheed, “Diabetic Macular Edema,” in Atlas of Retinal OCT: Optical
Coherence Tomography, Elsevier, 2018, pp. 84–85.
[11] H. E. Wiley and F. L. Ferris III, “Nonproliferative Diabetic Retinopathy and
Diabetic Macular Edema,” in Retina, Elsevier, 2013, pp. 940–968.
[12] P. Massin, M. Paques, and J.-A. Pournaras, “Diabetic macular edema,” in Ocular
Disease, Elsevier, 2010, pp. 519–526.
[13] I. N. Despotovic and D. Ferrara, “Drusen,” in Atlas of Retinal OCT: Optical
Coherence Tomography, Elsevier, 2018, pp. 16–23.
[14] M. Yanoff and J. W. Sassani, “Neural (Sensory) Retina,” in Ocular Pathology,
Elsevier, 2020, pp. 407-480.e12.
[15] Susan B. Bressler, Neil M. Bressler, “Chapter 65 - Age-Related Macular
Degeneration: Non-neovascular Early AMD, Intermediate AMD, and Geographic
Atrophy,” in Retina (Fifth Edition), 2013, pp. 1150-1182.
[16] C. A. de Amorim Garcia Filho, Z. Yehoshua, G. Gregori, C. A. Puliafito, and P. J.
Rosenfeld, “Optical coherence tomography,” in Retina, Elsevier, 2013, pp. 82–
110.
[17] S. D. Izatt, R. W. Redline, and J. A. Izatt, “Optical coherence tomography (OCT):
A non-invasive method to measure neonatal skin thickness † 1028,” Pediatr. Res.,
vol. 43, pp. 177–177, 1998.

28
[18] J. Sugmk, S. Kiattisin, and A. Leelasantitham, “Automated classification between
age-related macular degeneration and Diabetic macular edema in OCT image
using image segmentation,” in The 7th 2014 Biomedical Engineering International
Conference, 2014.
[19] D. S. Kermany et al., “Identifying medical diagnoses and treatable diseases by
image-based deep learning,” Cell, vol. 172, no. 5, pp. 1122-1131.e9, 2018.
[20] Y. Rong et al., “Surrogate-assisted retinal OCT image classification based on
convolutional neural networks,” IEEE J. Biomed. Health Inform., vol. 23, no. 1,
pp. 253–263, 2019.
[21] J. Wang et al., “Deep learning for quality assessment of retinal OCT
images,” Biomed. Opt. Express, vol. 10, no. 12, pp. 6057–6072, 2019.
[22] T. Tsuji et al., “Classification of optical coherence tomography images using a
capsule network,” BMC Ophthalmol., vol. 20, no. 1, p. 114, 2020.
[23] Pillow 8.0.1 Documentation.
https://pillow.readthedocs.io/en/stable/handbook/concepts.html#concept-filters.
[Accessed: 31-Dec-2020].
[24] C. R. Baumal, “Wet age-related macular degeneration: treatment advances to
reduce the injection burden,” Am. J. Manag. Care, vol. 26, no. 5 Suppl, pp. S103–
S111, 2020.
[25] D. M. Gibson, “Diabetic retinopathy and age-related macular degeneration in the
U.S,” Am. J. Prev. Med., vol. 43, no. 1, pp. 48–54, 2012.
[26] Age-Related Macular Degeneration (AMD) Data and Statistics, National Eye
Institute, https://www.nei.nih.gov/learn-about-eye-health/resources-for-health-

29
educators/eye-health-data-and-statistics/age-related-macular-degeneration-amd-
data-and-statistics
[27] D. S. Friedman et al., “Prevalence of age-related macular degeneration in the
United States,” Arch. Ophthalmol., vol. 122, no. 4, pp. 564–572, 2004.
[28] Age-Related Macular Degeneration: Facts & Figures, Brightfocus Foundation,
https://www.brightfocus.org/macular/article/age-related-macular-facts-figures.
[Accessed: 31-Dec-2020].
[29] N. M. Holekamp, “Overview of diabetic macular edema,” Am. J. Manag. Care,
vol. 22, no. 10 Suppl, pp. s284–s291, 2016.
[30] AMD, DED most common retinal conditions in the United States,
Modernretina.com. [Online]. Available:
https://www.modernretina.com/view/amd-ded-most-common-retinal-conditions-
in-us. [Accessed: 31-Dec-2020].
[31] S. R. Cohen and T. W. Gardner, “Diabetic retinopathy and diabetic macular
edema,” Dev. Ophthalmol., vol. 55, pp. 137–146, 2016.
[32] M. R. Hee et al., “Topography of diabetic macular edema with optical coherence
tomography,” Ophthalmology, vol. 105, no. 2, pp. 360–370, 1998.
[33] N. Menachemi and Collum, “Benefits and drawbacks of electronic health record
systems,” Risk Manag. Healthc. Policy, p. 47, 2011.
[34] Lakshminarayanan, Vasudevan; Roy, Priyanka; Gholami, Peyman, 2018, Normal
Retinal OCT images, https://doi.org/10.5683/SP/WLW4ZT, Scholars Portal
Dataverse, V1

30
[35] S. W. Kang, C. Y. Park, and D.-I. Ham, “The correlation between fluorescein
angiographic and optical coherence tomographic features in clinically significant
diabetic macular edema,” Am. J. Ophthalmol., vol. 137, no. 2, pp. 313–322, 2004
[36] M. R. Hee et al., “Optical coherence tomography of age-related macular
degeneration and choroidal neovascularization,” Ophthalmology, vol. 103, no. 8,
pp. 1260–1270, 1996.
[37] A. H. Rogers, A. Martidis, P. B. Greenberg, and C. A. Puliafito, “Optical
coherence tomography findings following photodynamic therapy of choroidal
neovascularization,” Am. J. Ophthalmol., vol. 134, no. 4, pp. 566–576, 2002.
[38] H.-J. Kong, “Managing unstructured big data in healthcare system,” Healthc.
Inform. Res., vol. 25, no. 1, pp. 1–2, 2019.
[39] L. Fang, D. Cunefare, C. Wang, R. H. Guymer, S. Li, and S. Farsiu, “Automatic
segmentation of nine retinal layer boundaries in OCT images of non-exudative
AMD patients using deep learning and graph search,” Biomed. Opt. Express, vol.
8, no. 5, pp. 2732–2744, 2017.
[40] K. Simonyan and A. Zisserman, “Very deep convolutional networks for large-scale
image recognition,” arXiv [cs.CV], 2014.
[41] Srivastava, Nitish, Hinton, Geoffrey, Krizhevsky, Alex, Sutskever, Ilya, and
Salakhutdinov, Ruslan. Dropout: A simple way to prevent neural networks from
overfitting. J. Mach. Learn. Res., 15(1):1929–1958, January 2014.
[42] C. Szegedy, V. Vanhoucke, S. Ioffe, J. Shlens, and Z. Wojna, “Rethinking the
inception architecture for computer vision,” in 2016 IEEE Conference on
Computer Vision and Pattern Recognition (CVPR), 2016.

31
[42] Lakshminarayanan, Vasudevan; Roy, Priyanka; Gholami, Peyman, 2018, "Normal
Retinal OCT images", https://doi.org/10.5683/SP/WLW4ZT, Scholars Portal
Dataverse, V1
[43] O. Perdomo, S. Otalora, F. A. Gonzalez, F. Meriaudeau, and H. Muller, “OCT-
NET: A convolutional network for automatic classification of normal and diabetic
macular edema using sd-oct volumes,” in 2018 IEEE 15th International
Symposium on Biomedical Imaging (ISBI 2018), 2018.
[44] H. Raja et al., “Extraction of retinal layers through convolution neural network
(CNN) in an OCT image for glaucoma diagnosis,” J. Digit. Imaging, vol. 33, no. 6,
pp. 1428–1442, 2020.
[45] K. Spilsbury, K. L. Garrett, W. Y. Shen, I. J. Constable, and P. E. Rakoczy,
“Overexpression of vascular endothelial growth factor (VEGF) in the retinal
pigment epithelium leads to the development of choroidal neovascularization,” Am.
J. Pathol., vol. 157, no. 1, pp. 135–144, 2000.

32
APPENDIX A
A.1 Tools and Technology
Listed below are the tools and technologies used to develop the auto-grading oct images
diagnostic tool described in this thesis:
• Language
- Python
- HTML
- JavaScript
- CSS
- Bash
• Frameworks
- Django
- TensorFlow
- Karas
- Numpy
- Pillow
• Tools
- Git
- Jupyter Notebook
- Linux