Embed Size (px)
Citation preview

Auto-fuel Price Monitoring Analysis 2020
21 May 2020

Table of Contents
1. Background2. Methodology3. Brent Crude Oil Price Trend from 2013 to 2020 Q14. Hong Kong Auto-fuel Price Trend from 2013 to 2020 Q15. Analysis on Price Adjustment Practices – Timing and Magnitude6. Market Competition7. Conclusion and Recommendations
2
Background
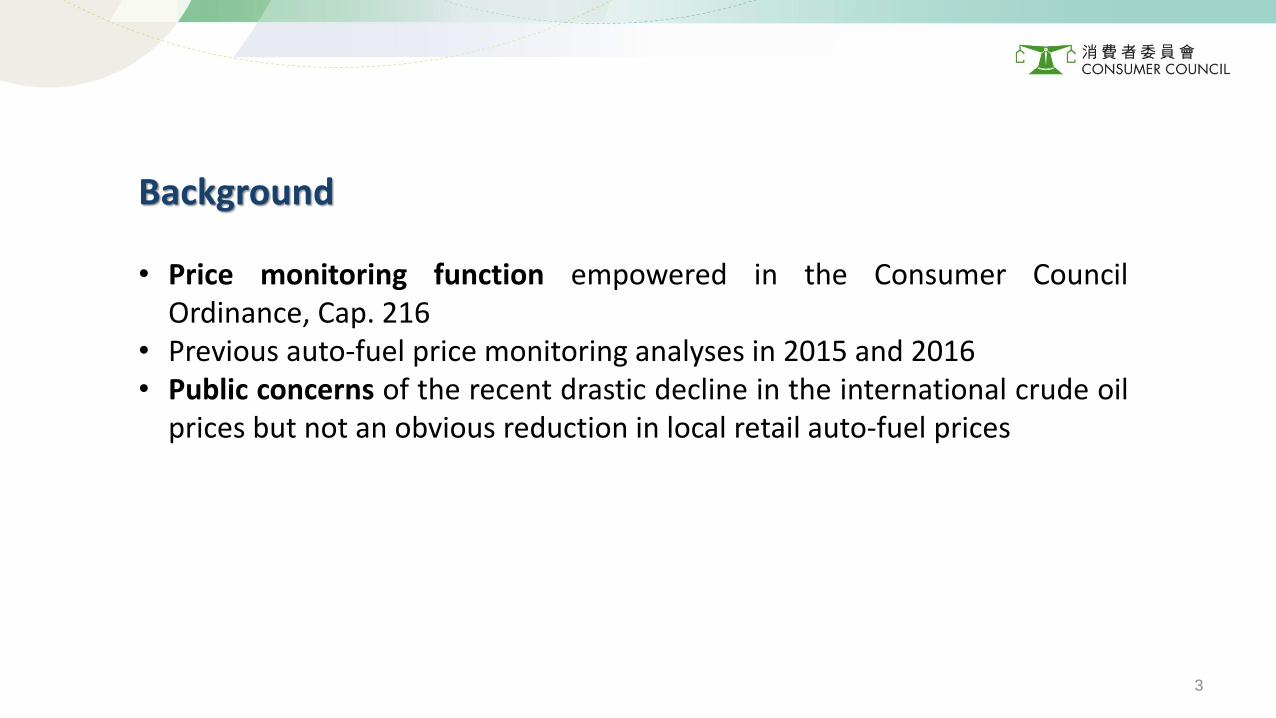
• Price monitoring function empowered in the Consumer CouncilOrdinance, Cap. 216
• Previous auto-fuel price monitoring analyses in 2015 and 2016• Public concerns of the recent drastic decline in the international crude oil
prices but not an obvious reduction in local retail auto-fuel prices
3

Methodology and Limitations of the Analysis
• Data• Daily pump price and discount information of standard petrol in the Council’s Oil Price
Database (web:www.consumer.org.hk/pricewatch/oilwatch/index.php and apps)
• Daily Brent crude oil price collected from the newspapers• Monthly import price data of local unleaded motor gasoline from the Census and Statistics
Department and the statistical month is two-month lagged• No access to the Singapore MOPS price data and its use is legally bound
• Analysis• Average approach to pump price and discount levels of oil companies*• Price gap is calculated as the gap between Brent crude oil price, import price and standard
petrol pump price for the time period from 2013 to 2020 Q1• Based on standard petrol price since the correlation coefficient between standard petrol
price and premium petrol price is significantly related• Days of significant daily % change in the Brent crude oil price are defined as days that the
accumulated value is larger than or equal to 2% in at least 3 consecutive days
* Caltex, Esso, PetroChina, Shell and Sinopec 4

5
0.00
1.00
2.00
3.00
4.00
5.00
6.00
7.00H
KD
/Litre
Brent Crude Oil Price Trend from 2013 to 2020 Q1– Major Incidents*Feb – Apr 2013• Global demand for oil weakened• Deceleration in world economic growth
Jul 2014 – Jan 2015OVERSUPPLY due to• Rapid growth of shale oil
production in USA• Iraq and Libya resumed oil
exports• Russia located a potential
crude-producing area in the Kara Sea region
• Organization of the Petroleum Exporting Countries (OPEC) opted to keep their production target
May 2015 – Jan 2016 • Chinese stock market turbulence• Iran nuclear deal (JCPOA) was sealed in
which Iran could export oil in Jan 2016 • OPEC decided to increase its oil
production• USA lifted its crude oil export ban
Jul – Sep 2013 • Geopolitical tensions in Libya and Syria
Dec 2016• OPEC reached the 1st agreement to
lower production since 2008• OPEC and non-OPEC reached the 1st
deal to cut oil output jointly since 2001
Jul 2017 – Oct 2018• More effective execution of oil
reduction• Saudi Arabian purge• USA withdrawal from JCPOA that
would impose sanctions on countries trading with Iran
Oct 2018 – Dec 2018OVERSUPPLY due to:• Other countries increased its production to
offset for the losses of Iranian volume• USA granted sanctions waivers to 8
countries from importing Iranian oil• Unexpectedly strong rise of USA shale oil
production• Oil production has been at or near record
highs in USA, Saudi Arabia and Russia
2019• Production cut from OPEC
and non-OPEC• USA no longer granted
sanctions waivers
Jan 2020 – Mar 2020• Outbreak of Covid-19• Russia–Saudi Arabia oil
price war• Oil market out of storage
space
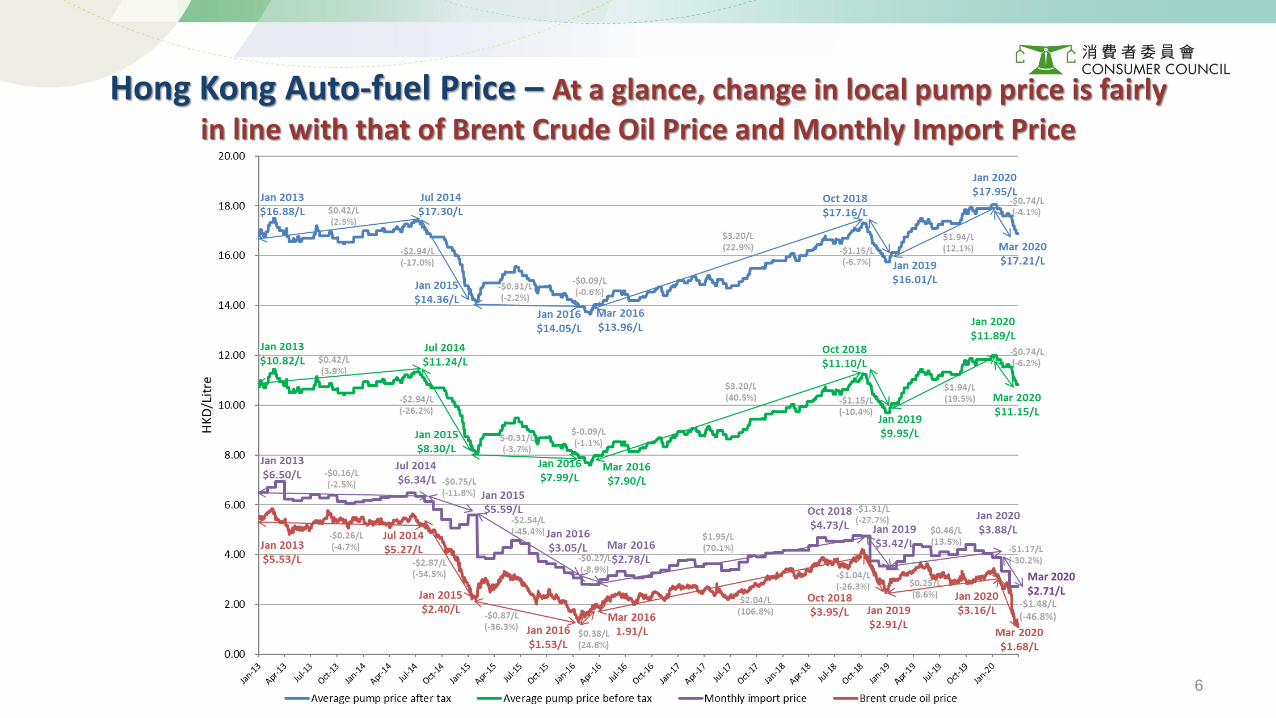
Hong Kong Auto-fuel Price – At a glance, change in local pump price is fairly in line with that of Brent Crude Oil Price and Monthly Import Price
Mar 2020$2.71/L
-$1.48/L(-46.8%)
6

• Over the years, sales for local consumption* is stable, ranging from 132.6 to 163.4 millionlitres every quarter
• But quantity of net imports varies over time
*Sales for local consumption of unleaded motor gasoline of 2020 Q1 is not available at the time when preparing this analysis.
No Significant Change of Local Sales of Unleaded Motor Gasoline
7

• Overall trend is when import price increases, the quantity of import decreases; or vice versa,signifying that oil companies are also striving to procure oil when the price is lower
Quantity of Net Imports Have an Inverse Relationship with Import Price
*The coefficient value = -2.92, p value <0.058

Analysis on Price Adjustment Practices – Timing And Magnitude
9

* Fluctuation index equals to the coefficient of variation (standard deviation divided by the average)^ The significance of number of changes in pump price and fluctuation index of the Brent crude oil price (p value) <0.05
Timing - Frequency of Price Adjustment from 2013 to 2020 Q1
10
• The frequency of pump price adjustment in general is related^ to the frequency with which Brent crude oil price varies• From 2013 to 2016 H1, when pump price adjusted more frequent, a higher fluctuation index of the Brent crude oil price
in general is recorded; however, such pattern was not observed from 2016 H2 onwards
In 2018 H2, there was an occasion that 3 companies increased pump price from
$16.99 to $17.19, then decreased back from $17.19
to $16.99 within 6 days
In 2020 Q1, 3 companies decreased pump price from
$17.59 to $17.34 directly, while 2 companies decreased their price in 2 times - from $17.59 to $17.49 first, then
further decreased from $17.49 to $17.34 within 2 days.

• Price adjustment pattern of the five oil companies is similar
Frequency of Price Adjustment from 2013 to 2020 Q1 (by Company)
8
6
8
0
7
4
8
10
5
8 87
12
7
1
9
5 5
15
6
16
8
6
8
2
4
15
4 4
8
10
67
0
7
3
89
5
78
7
12
8
1
11
5 5
15
5
13
9
4
8
0
4
15
45
9
8
6
8
0
8
3
78
5
78
6
12
7
1
9
5 5
14
6
12
7
3
8
1
4
12
4 4
8
9
78
0
7
2
8 8
5
78
7
12
7
1
10
5 5
16
5
12
7
3
8
0
4
13
4 4
8
9
6
8
0
7
3
78
5
78
6
12
7
1
10
65
16
5
14
6
4
8
0
4
12
4 4
9
20
15
10
5
0
5
10
15
2013 H1 2013 H2 2014 H1 2014 H2 2015 H1 2015 H2 2016 H1 2016 H2 2017 H1 2017 H2 2018 H1 2018 H2 2019 H1 2019 H2 2020 Q1
Num
ber o
f pum
p pr
ice
chan
ges
(inc
reas
e/de
crea
se)
Number of pump price change in standard petrol by company (2013 - 2020 Q1)
A
B
D
G
F
11

• Time Lag effect: Analysis on responsiveness of the daily pump price to changes in the Brent crude oil price
• Increase: Significant relationship between the rise in the Brent crude oil price and the subsequent rise in pump price in 2015 H1 (7 days), 2019 H1 (5 days) and 2019 H2 (1-2/7-8 days)
• Decrease: Significant relationship between the fall in the Brent crude oil price and the subsequent fall in pump price in 2014 H2 (8 days), 2015 H2 (1/7days) and 2016 H2 (9 days)
• Seems no sign of “quick going up, slow coming down” in recent years
Period Days interval between change in the Brent crude oil price and average pump price*
Increase Decrease
2013 H1 NIL
2013 H2 NIL
2014 H1 NIL
2014 H2 N/A 8 days
2015 H1 7 days NIL
2015 H2 NIL 1/7 days
2016 H1 NIL
2016 H2 NIL 9 days
2017 H1 NIL
2017 H2 NIL
2018 H1 NIL
2018 H2 NIL
2019 H1 5 days NIL
2019 H2 1-2/7-8 days NIL
2020 Q1 NILRemarks: * Results of the current analysis in certain periods might not be the same as the results in 2015 and 2016 because the current analysis covers the period from 2013 to 2020 Q1 and the data relationship might be changed over a longer period of time and with a larger data set. NIL denotes an absence of any statistical significance in the lag effect. N/A denotes no increase in pump price of regular gasoline.
Sign of Quick Going Up, Slow Coming Down?
12

• The price gap between pump price and Brent crude oil price raised from $5.12/L to $9.48/L (+ 85.2%)• The price gap between pump price and import price is recorded from $4.06/L to $8.44/L (+ 107.9%) • The highest gaps ($9.48/L, $8.44/L) are both recorded in March 2020
As reported previously, 2015 Q1 is an outlier because an exceptionally high import price was recorded in Dec 2014 – Jan 2015, leading to a sharp decline in price gap between pump price and import price. As remarked by the Census and Statistics Department: “Figures for the statistical months of Dec 2014 and Jan 2015 include also declarations of earlier months ... Given the volatility of international oil prices since mid-2014, the higher oil prices (import prices) in earlier months had larger impact on figures for the statistical months of Dec 2014 and Jan 2015.”
Magnitude – Increasing Price Gaps from 2013 to 2020 Q1
13

Price Gaps between Import Price and Pump Price are Widened• Before 2016 H2, when there was a relatively stable Brent crude oil price, the spread was also stable; when there
was a significant increase/decrease in Brent crude oil price, the spread widened• After 2016 H2, even when there was a relatively stable Brent crude oil price, the spread still continued to widen
14

Brent Crude Oil Price, Import Price and Average Pump Price Before Tax At Different Periods
• Although the Brent crude oil price in “March 2020” returned to almost the same price level in the period of “January/March 2016”, so as the import price, the average pump price before tax in March 2020 is
higher than that in January/March 2016
HK$/L Jan-2013 Jul-2014 Jan-2015 Jan-2016 Mar-2016 Oct-2018 Jan-2019 Jan-2020 Mar-2020
Brent crude oil price
$5.53 $5.27 $2.40 $1.53 $1.91 $3.95 $2.91 $3.16 $1.68
Import price $6.50 $6.34 $5.59 $3.05 $2.78 $4.73 $3.42 $3.88 $2.71
Average pump price (before tax at HK$6.06/L)
$10.82 $11.24 $8.30 $7.99 $7.90 $11.10 $9.95 $11.89 $11.15
$3 more
Tax not changed, what are the key factors attributed for the extra $3/L?
$3
15

Sign of More Going Up, Less Coming Down?• While the daily cumulative changes of Brent crude oil price and import price dropped by -$4.3/L and -$3.68/L,
that of pump price raised by $0.1/L. • Except 2014, all years demonstrated a clear sign of “more going up, less coming down”.
20132014
:2020 Q1
Brent crude oil price change (HKD/L)Import oil price change
(HKD/L)Pump price change (HKD/L)
Daily cumulative change - 4.3 - 3.68 0.1
Pump price change vs Brent crude oil price change Pump price change vs Import price change16
+ 0.48
+ 1.3
- 1.3
+ 0.55
+ 0.27
- 0.5
+ 1.79
- 0.18
~ $3.78
+ 0.2
- 0.5- 0.31
- 0.1
+ 0.25
- 0.62
+ 1.64
- 0.97
~ $4.4
Pump price
Brent crude oilprice
Import price
HKD/LHKD/L

Market Competition
17

Change in Market Share by No. of Petrol Filling Station (PFS) Sites
Changes in number of PFS sites by each oil company from 1998 to 2020 H2
Caltex Esso** Petrochina Shell Sinopec Others*** Overall
1998 50 56 - 61 - 13 180
2004 47 59 2 50 3 12 173
2016 39 50 10 42 38 - 179
2020 H1 34 43 12 40 40 - 169
2020 H2* 34 43 17 43 40 - 177
*In 2020 H2, 3 news Shell stations and 5 new Petrochina stations are expected to start operation** Including Feoso stations*** Including Concord and CRC stations
• Market share of 3 oil companies (Caltex, Esso and Shell) dropped from 93% in 1998 to 67% in 2020 H2
18

• The number of days the 5 oil companies having identical pump prices was reduced in 2015 and 2016• However, the level of conformity in pump price increased since then, and in 2020 Q1 the highest 92.3% was recorded• Among them, generally CompanyB and CompanyD were being the first one to adjust the pump price
Conformity in Pump Prices Stills
2013 2014 2015* 2016** 2017 2018 2019 2020 Q1
% of days that all the 5 oil companies having the same
pump price
83.8 85.8 79.2 66.3 79.2 72.3 86.8 92.3
*In February 2015, the Council released its findings of Auto-fuel Price Monitoring Analysis** In June 2016, the Council released a report of Auto-fuel Price Monitoring Analysis 2016*** Based on the information collected by the Council and published on “Oil Price Calculator”
OilCompany
The Percentage Share of Being the First One to Adjust Pump Price***
2018 H1 2018 H2 2019 H1 2019 H2 2020 Q1
A 25% - 43% 6.7% 42% 25% 25% 16.7% - 11%
B 75% 50% 57% 20% 33% 25% 50% 16.7% - 22%
D - 50% - 46.6% 25% 50% 25% 66.6% 100% 67%
G - - - - - - - -
F - - - 26.7% - - - -
19

OilCompany
Period Average Pump Price(per Litre)
Average Walk-in Discount (per Litre)
Average Price that Consumers paid (per Litre)
A 2020 Q1 $17.60 $1.12 $16.48
2018 $16.47 $0.94 $15.53
2016 $14.34 $0.9 $13.44
B 2020 Q1 $17.60 $1.15 $16.45
2018 $16.46 $1 $15.46
2016 $14.33 $0.95 $13.38
D 2020 Q1 $17.61 $1.76 $15.85
2018 $16.44 $1.48 $14.96
2016 $14.32 $1.06 $13.26
G 2020 Q1 $17.60 $1.5 $16.10
2018 $16.45 $0.9 $15.55
2016 $14.31 $0.8 $13.51
F 2020 Q1 $17.60 $2.39 $15.21
2018 $16.43 $2.01 $14.42
2016 $14.31 $1.6 $12.71
• From 2016 to 2020 Q1, the average amounts of walk-in discounts of the 5 oil companies were increasing• However, in absolute dollar, consumers still had to pay more to purchase every litre of standard petrol
Increase in Walk-in Discounts Doesn’t Mean a Lower Price
20

Complexity of Multitudinous Discount Types
21
• Difficulties encountered by consumers• To get aware of all the discount and promotional on offer, particularly time-limited or “flash” offers• To identify the best cost-saving among the various discount and promotional offers• To know the combination of discounts which varies by different oil companies• To understand the complicated terms and conditions

Company X Company Y
Fuel up $300 of regular gasoline Fuel up $400 of regular gasoline
Discount type Discount OfferActual Paid Price
(per Litre)Discount Offer
Actual Paid Price (per Litre)
Walk-in discount - $1.5/L$16.09
($17.59 - $1.5)- -
Walk-in discount with membership /
discount card
Spending $300 (Discounted) or above
will enjoy - $3.2/L
$14.39($17.59 - $3.2)
- $0.9/L$16.69
($17.59 - $0.9)
Credit card 8%$16.18
($17.59 x (1-0.08))- $0.9/L
$16.69($17.59 - $0.9)
Petrol couponSpending $300 or
above will have free $60
$14.66($300 / $360 x $17.59)
Spending $400 or above will have free
$50
$15.64($400 / $450 x $17.59 )
Assuming regular gasoline pump price is $17.59/L and choosing one discount out of the different offers
Examples
Complexity of Multitudinous Discount Types (Cont’d)
Most cost-saving option
Most cost-saving option 22

Case 1 – Complications of terms and conditions
• Complainant purchased petrol coupon which was claimed “Deduction of $300 when fueling up$400 of petrol”
• When the complainant used the petrol coupon, oil company staff explained that the petrol couponreferred to “pay $300 and get $400 of petrol” and the customer can’t enjoy walk-in discountsimultaneously
• The complainant only got $100 discount by using the petrol coupon• The actual payment of same volume petrol by using petrol coupon was more expensive than using
walk-in discount
Case 2 – Confusion about different explanations given at different stations
• Complainant called the oil company staff in different oil stations about the special discount at$2.5/L on a certain of the week, one said the special discount was not valid anymore and anotherdiscount would be offered after 10 pm; one said the special discount was still valid at its oil station
• Then the complainant refilled his car at the second oil station• When he received the payment slip after fueling up, the actual discount was $0.9/L• The complainant was confused about the different explanation at different oil stations and thought
he was misled by the staff
Consumer Complaint Cases
23

• Hong Kong is a stable market in sales of auto-fuel for local consumption.• Import statistics suggest that oil companies procure oil when the prices are lower.• In general, the frequency of local pump price adjustments is related to the
frequency of international oil price adjustments, and the adjustment pattern of alloil companies is similar.
• No obvious sign of “quick going up, slow coming down” but a clear sign of “moregoing up, less coming down”.
• The pump price gap with Brent crude oil price and import price widened byalmost one fold in 7 years, even after 2016 when the Brent crude oil price wasrelatively stable. Question: What caused the significant increase in pump price?
• A high level of conformity of pump prices despite new entrants entered themarket since mid-2000.
• The multitudinous discount types offered by the oil companies are complicatedand highly confusing. In absolute dollar, consumers still have to pay more topurchase every litre of auto-fuel.
Conclusion
24

Recommendations
25
Objective: To enhance transparency in market information to allow greater public scrutiny ofauto-fuel price fluctuations and the ultimate impact on consumers.
Consumers• On-going comparison on price and different offers in order to capture and enjoy the most
economical one
Oil Companies• Direct reduction of the pump price to make it more straightforward, simple and beneficial to
consumers• Increase transparency by disclosing more cost and sales information
Government• Conduct regulatory review and enhance oversight of the market*• Disclose more frequent and more detailed import oil price information• Consider empowering the Competition Commission to investigate the market
* In the Council’s 2014 Report on Study of Hong Kong Electricity Market, the Council saw the necessary formation of a full-fledged energysector regulator to meet the future challenge of competing objectives of the Hong Kong Government’s energy policy.