Embed Size (px)
Citation preview
Autism Spectrum Disorder Traits and Parental Stress: The Moderating Role of
Parental Self-Efficacy
Reina S. Factor
Thesis submitted to the faculty of the Virginia Polytechnic Institute and State University in partial fulfillment of the requirements for the degree of
Master of Science In
Psychology
Angela Scarpa-Friedman, Chair Julie C. Dunsmore
Thomas H. Ollendick
November 10, 2016 Blacksburg, Virginia
Keywords: parenting; autism spectrum disorder; stress reactivity, heart rate, heart rate variability
Autism Spectrum Disorder Traits and Parental Stress: The Moderating Role of
Parental Self-Efficacy
Reina S. Factor
ABSTRACT
Previous research has established that caregivers of children with Autism Spectrum
Disorder (ASD) experience greater levels of parenting stress as a result of unique parenting
demands and child problem behavior (Davis & Carter, 2008; Estes et al., 2013). Positive self-
concepts, specifically parental self-efficacy (PSE), have been implicated as a buffer to stress in a
number of contexts (Cieslak, Benight, & Lehman, 2008). While many studies examine parenting
stress in relation to ASD, they often use parent self-report rather than objective measures in a
laboratory setting. The present study aimed to further explore the role of PSE in the relationship
of parental stress and ASD traits through a biological measure of stress, as well as a parent self-
report within a controlled laboratory environment.
Forty-two mother and child dyads participated in a validated parent-child interaction task
designed to elicit a stressful experience. Mother’s heart rate (HR) and heart rate variability
(HRV) were monitored as the physiological measure of stress reactivity. Mothers also self-
reported on ASD traits, perceived stress-reactivity, and PSE. Results demonstrated a significant
positive main effect for ASD traits on HRV reactivity, and an interaction such that the
relationship between ASD traits and HRV reactivity (i.e., more emotional flexibility) was
stronger in those with lower PSE. Given the low sample size and subsequent low power, results
should be viewed with caution. Considerations of the context of HRV as well as implications for
treatment targets and studying parental stress are explored.
Autism Spectrum Disorder Traits and Parental Stress: The Moderating Role of
Parental Self-Efficacy
Reina S. Factor
GENERAL AUDIENCE ABSTRACT
Previous research has found that caregivers of children with Autism Spectrum Disorder
(ASD) experience greater levels of parenting stress as a result of parenting demands and child
problem behavior (Davis & Carter, 2008; Estes et al., 2013). Positive self-concepts, specifically
parental self-efficacy (PSE), have been suggested to protect the individual against stress
(Cieslak, Benight, & Lehman, 2008). While many studies examine parenting stress in relation to
ASD, they often use parent self-report rather than more objective measures (i.e., physiological
measures). The present study aimed to further explore the role of PSE in the relationship of
parental stress and ASD traits through a biological measure of stress, as well as a parent self-
report within a controlled laboratory environment.
Forty-two mothers and children participated in a parent-child interaction task designed to
create a stressful experience. Mother’s heart rate (HR) and heart rate variability (HRV) were
monitored as the physiological measure of stress reactivity. Mothers also self-reported on ASD
traits, perceived stress-reactivity, and PSE. Results demonstrated a significant relationship for
ASD traits on HRV reactivity, and an interaction such that the relationship between ASD traits
and HRV reactivity (i.e., more emotional flexibility) was stronger in those with lower PSE.
Given the low sample size, results should be viewed with caution. Considerations of the context
of HRV as well as implications for treatment and studying parental stress are explored.
iv
Table of Contents
Introduction ..................................................................................................................................... 1
Parenting Stress and Autism Spectrum Disorder .. ………………………….........….........1
Physiological Measures of Stress ........................................................................................ 2
Additional Measures of Stress ............................................................................................. 4
Parental Self-Efficacy .......................................................................................................... 4
Broad Autism Phenotype ..................................................................................................... 5
Parental Self-Efficacy, Stress, and ASD ............................................................................. 5
Hypotheses .......................................................................................................................... 8
Method ............................................................................................................................................. 9
Participants .......................................................................................................................... 9
Power ................................................................................................................................. 12
Background information .................................................................................................... 12
Parental Self-Report Stress Measures ............................................................................... 12
ASD Trait Measures .......................................................................................................... 14
Parental Self-Efficacy Measures ....................................................................................... 16
Physiological Stress Reactivity Measurement………………. .......................................... 17
Behavioral Measures…………………….. ....................................................................... 19
Procedure…………………. .............................................................................................. 20
Analytic Plan ................................................................................................................................. 22
Results ........................................................................................................................................... 24
Preliminary Analyses ......................................................................................................... 24
Correlations of Self-Report with Observation Measures .................................................. 25
Correlations of ASD Measures and Self-report Stress Measures ...................................... 26
Hypothesis Testing ............................................................................................................ 26
Discussion ...................................................................................................................................... 30
v
Limitations ......................................................................................................................... 37
Future Directions ............................................................................................................... 38
References ..................................................................................................................................... 40
Appendices .................................................................................................................................... 61
vi
Tables and Figures
Table 1 Descriptive Statistics for Continuous Variables of Interest ............................................. 49
Table 2 Descriptive Statistics for Categorical Variables of Interest ............................................ 50
Table 3 Correlations Among HR Variables and Possible Covariates .......................................... 51
Table 4 Pearson Correlations for All Variables of Interest .......................................................... 52
Table 5 Autism Traits and Self-Report Stress, Moderated by Parental Self-Efficacy (PSOC) ....................................................................................................................................................... 54
Table 6 Autism Traits and Self-Report Stress, Moderated by Parental Self-Efficacy (PSEMAS) 55
Table 7 Autism Traits and Physiological Stress (HR), Moderated by Parental Self-Efficacy
(PSOC) .......................................................................................................................................... 56
Table 8 Autism Traits and Physiological Stress (HRV), Moderated by Parental Self-Efficacy
(PSOC) ......................................................................................................................................... 57
Table 9 Autism Traits and Physiological Stress (HR), Moderated by Parental Self-Efficacy
(PSEMAS) ..................................................................................................................................... 58
Table 10 Autism Traits and Physiological Stress (HRV), Moderated by Parental Self-Efficacy (PSEMAS)
....................................................................................................................................................... 59
Figure 1 Graphical Representation of Interaction of HRV and ASD Traits moderated by PSE
(PSEMAS) ...................................................................................................................................... 60
vii
Appendices
Appendix A Demographics Questionnaire .................................................................................... 61
Appendix B Medical History Questionnaire ................................................................................. 63
Appendix C Perceived Stress Reactivity Scale ............................................................................ 66
Appendix D The Autism Spectrum Quotient – Children’s Version .............................................. 69
Appendix E Social Responsiveness Scale .................................................................................... 73
Appendix F Broad Autism Phenotype Questionnaire .................................................................. 75
Appendix G Parent Sense of Competence Scale .......................................................................... 78
Appendix H Parental Self-Efficacy in the Management of Asperger Syndrome ......................... 80
Appendix I Parenting Stress Index, Fourth Edition Short Form .................................................. 81
Appendix J Informed Consent and Parent Permission Form ....................................................... 84
Appendix K Verbal Child Assent Form ........................................................................................ 86
1
Introduction
The relationship between parenting stress and child behavior is a complex and bi-
directional process (Baker et al., 2003). That is, this circular system involves child
problem behaviors which increase parental stress, and this increase in stress manifests in
decreased interaction or irritable mood from parents that in turn can exacerbate and
perpetuate the behavior (Rezendes & Scarpa, 2011). The distress experienced by parents
can be conceptualized as involving the external demands of parenting (i.e., providing
basic necessities such as food and shelter), quality of the parent child relationship (i.e.,
synchrony) and emotional and social well-being of parent and child independently.
Parenting distress has been shown to contribute to strained parent-child relationships as
well as the development of adult and child psychopathology (Deater-Deckard, 1998).
Therefore, it is important to study parent stress in the context of the parent-child
relationship.
Parenting Stress and Autism Spectrum Disorder
Previous research has established that caregivers of children with Autism Spectrum
Disorder (ASD) experience greater levels of parenting stress (Davis & Carter, 2008; Estes et al.,
2013). Distress related to ASD usually begins before a formal diagnosis, as early concerns about
development, social behavior, and communication are typically present in the early life of a child
(Karst & Van Hecke, 2012). These concerns are reported by the majority of parents when their
child is around 18 months of age (Bolton et al., 2012). Therefore, the parent is faced with a
number of stressors early in the child’s life, in addition to general parental concerns. The nature
of this stress and factors contributing to it has been explored in numerous reports. For example,
previous research has indicated that the amount of parental involvement with one’s child has
2
been correlated with parenting stress, such that greater involvement may lead to greater stress
(Tehee, Honan, & Hevey, 2008). Others expand upon these findings, showing that increased
parental stress is not simply a function of cognitive deficits or level of ASD impairment, but
appears to be accounted for by other factors (Davis & Carter, 2008; Rao & Beidel, 2009). For
example, social support for parents can partially mediate the relationship between the child’s
symptom severity and parenting stress (Ingersoll & Hambrick, 2011). Many parents of children
with ASD often feel isolated and do not have a secure social support system in dealing with their
child, as they are faced with unique challenges in comparison to parents of typically developing
children (Karst & Van Hecke, 2012). In addition, these increased levels of stress in parents of
children with ASD have been found to be highly correlated with child problem behavior (Davis
& Carter, 2008), such that one study found that behavior problems were associated with stress
ratings by both parents and teachers above adaptive functioning deficits (Lecavelier, Leone, &
Wiltz, 2006). Other results revealed that delays and deficits in social skills as well as behavior
problems were the most salient predictors of parenting stress (Davis & Carter, 2008).
Interestingly, in this study there were differences between mothers and fathers in the behavioral
domains, such that the greatest predictor of stress in mothers was deficits in self-regulation,
while for fathers externalizing behaviors were the greatest predictor.
Physiological Measures of Stress
Although self-report measures of stress are informative, physiological measures of stress
provide objective information in studying stress reactivity. Multiple automatic physiological
reactions to social stressors have been studied to assess emotional response, such as heart rate
(HR; Kudielka, Buske-Kirschbaum, Hellhammer, & Kirschbaum, 2004), heart rate variability
(HRV; Appelhans & Luecken, 2006), blood pressure (Smith & Allred, 1989), and cortisol levels
3
(Kirschbaum, Pirke, & Helhammer, 1993). In particular, cardiovascular measures such as HR
and HRV are often used to index emotional responding as well as specific individual differences
in these patterns of responding (Appelhans & Luecken, 2006).
While HR is a function of both sympathetic and parasympathetic influences of the
autonomic nervous system on the heart, high-frequency HRV is a more specific way to examine
autonomic functioning, as it is only mediated by parasympathetic nervous system activity
(Berntson, Cacioppo, Quigley, & Fabro, 1994). HRV has been used to indicate emotional
responding and flexibility, as well as psychopathological features and processes in a number of
studies (Thayer & Lane, 2000; Kreibig, 2010). Specifically, higher HRV may reflect a greater
capacity for regulated emotional responses. For example, higher baseline levels of respiratory
sinus arrhythmia (RSA), one measurement of HRV, are associated with flexible emotional
responding (Porges, 2001). However, in examining changes in RSA from baseline, the context
may alter the interpretation of the response. For instance, in stressful situations, decreases in
RSA from baseline might reflect effective coping strategies; however, in nonthreatening
situations, increases in RSA may demonstrate successful emotion regulation (Huffman et al.,
1998; Hastings et al., 2008).
Fabes and Eisenberg (1997) found that lower RSA indicated a greater negative emotional
arousal in response to stress. Therefore, this interfered with one’s ability to implement adaptive
coping strategies. While some research has looked at HRV in children in response to parental
behavior in clinical populations (Allen, Kuppens, & Sheeber, 2012), to date, no research (to our
knowledge) has examined parental HRV in response to child ASD traits. Using both HR and
HRV as measures of stress may give unique insights into stress responses and coping in parents
related to ASD traits.
4
Additional Measures of Stress
In addition to the physiological measures of stress previously mentioned, there are other
methods and mechanisms for assessing parental stress. For example, parent self-report allows
parents to report on their own level of stress as they perceive it. Different measures tap into
specific aspects of stress. The Parenting Stress Index (Abidin, 2012) measures the amount of
stress parents experience related to their role as a parent. Additionally, the Perceived Stress
Reactivity Scale (Schlotz, Yim, Zoccola, Jansen, & Schulz, 2011) addresses an individual’s
perception of their intensity of response for a number of daily stressful situations.
Behavioral observations of parental stress allow for another method of measurement.
Coding systems exist examining parental-child relationships, such as the Marschak Interaction
Method (Theraplay Institute, 2005). Though there have been a number of studies employing one
of these methods of measuring stress, to our knowledge, there have not been other studies to use
a multimethod approach to stress measurement.
Parental Self-Efficacy
In considering the complex nature of parental stress, positive self-concepts have been
implicated as a buffer to stress in a number of contexts (Cieslak, Benight, & Lehman, 2008).
Parental self-efficacy (PSE) is a notion that has begun to be researched in examining parental
stress. Defined as a caregiver’s belief in their ability to parent their child (Karst & Van Hecke,
2012), PSE was found to predict the level of parenting competence, such that higher PSE led to
more effective parenting, even when dealing with challenging behavior, in a sample of typically
developing children and their parents (Jones & Prinz, 2005). Further, low levels of PSE may lead
to poor persistence, depression, and less satisfaction as a parent (Johnston & Mash, 1989). This
is an especially important concept to examine in parents of children with ASD or high ASD
5
traits, since children often do not receive a diagnosis until later in their development (4-5 years
of age), even though ASD can be diagnosed as early as 2 years old (CDC, 2014). This could
mean that parents have been employing ineffective parenting techniques for a number of years,
which may have made them feel both inept and frustrated as parents (Karst & Van Hecke, 2012).
Further, due to the lack of reciprocal social communication, they may feel less able to meet the
emotional needs of their children and may also feel more of a lifelong burden since their children
may never live independently (Karst & Van Hecke, 2012). This may decrease optimism about
their future and the future of their child, thus lowering PSE.
Broad Autism Phenotype
Another factor to examine in the parent-child relationship when considering ASD is the
presence of Broad Autism Phenotype (BAP) in parents. BAP is defined as a subclinical set of
features found in relatives of individuals with ASD, which presents evidence for a genetic
component in ASD (Piven, Palmer, Jacobi, Childress, & Arndt, 1997). With the presence of
these characteristics, parents might lack confidence in helping their child and may in fact
experience some difficulties themselves, such as social anxiety and communication issues (Karst
& Van Hecke, 2012). Parents who demonstrate these characteristics have been found to be more
likely to utilize ineffective coping strategies for stress and as a result, may face decreases in PSE
(Ingersoll & Hambrick, 2011). Both child symptom severity and parent BAP were found to be
positively correlated with elevated stress and depression in parents of children with ASD
(Ingersoll & Hambrick, 2011). As such, BAP characteristics may need to be accounted for when
examining ASD-related parental stress.
Parental Self-Efficacy, Stress, and ASD
Previous research has indicated that PSE, parenting stress, and ASD are related in a
6
complex and transactional nature. In one study, parenting stress was found to mediate the
relationship between child behavior problems and decreased PSE in a sample of parents of
children with ASD (Rezendes & Scarpa, 2011). Further, lower PSE also partially mediated
parenting stress and increased depression and anxiety in parents (Rezendes & Scarpa, 2011).
This suggests both the importance of PSE on parent pathology as well as the role that child
behavior problems, as related to ASD traits, have on parental stress. Similarly, Hastings and
Brown (2002) revealed that PSE mediated the relationship between child problem behaviors and
maternal anxiety and depression, and that stress was associated with decreased PSE. Thus, more
positive self-efficacy was associated with psychological well-being and less psychological
distress (Hastings & Brown, 2002). Notably, there were differences in the relationship between
these variables seen in fathers. Paternal PSE was found to moderate the effect of child behavior
problems on anxiety; however, in children with low levels of behavior problems, the father’s
self-efficacy had no effect on their anxiety (Hastings & Brown, 2002). This suggests that PSE
might serve as a protective factor for fathers, only activated in situations of high levels of stress,
but is more of a compensatory or coping mechanism for mothers, directly impacting depression
and anxiety (Hastings & Brown, 2002). Finally, Kuhn and Carter (2006) found that PSE served
as a mediator for misbehavior and maternal anxiety and depression, and that decreased agency
and increased guilt in parents were correlated with lower PSE. This highlights the complex and
multifaceted nature of PSE, as well as other factors that contribute to the interplay between PSE,
behaviors related to ASD, and parental stress.
Parental coping in response to their child’s ASD diagnosis has also been studied, such
that parents with better adjustment had higher PSE (Pakenham, Sofronoff, & Samios, 2004).
There is evidence that coping in parents of children with ASD is different from parents of other
7
developmental disabilities (Hastings et al., 2005), which may impact the stress and PSE parents
experience. Four main coping strategies were identified for parents of preschoolers with ASD,
which included active avoidance coping, problem-focused coping, positive coping, and
religious/denial coping (Hastings et al., 2005). Active avoidance coping was related to more
stress and mental health problems in both mothers and fathers, while positive reframing of
stressful events may be an especially beneficial coping strategy for parents of children with ASD
(Hastings et al., 2005). Hastings and Taunt (2002) suggest that positive perceptions of children
with disabilities may serve as an adaptive mechanism to help cope with high stress levels.
Interventions targeting PSE have proven to have success in both increasing PSE and
decreasing child behavior problems. Sofronoff and Farbotko (2002) examined the importance of
targeting PSE in parents of children with ASD in Parent Management Training (PMT). Results
indicated increased PSE in comparison to control groups, and these parents also reported fewer
child problem behaviors post intervention. Therefore, increasing PSE may have an impact not
only directly on the parent, but also on the child. Further, in another study, mothers with higher
PSE reported being more active in their children’s development, which may indicate more
involvement and benefits for their child (Hastings et al., 2005).
Currently, many treatment programs for children with ASD focus on the child and often
require the parent to perform time intensive protocols. In turn, this may add increased stress in
the family system, which often affects family relationships, psychological well-being, and the
child’s treatment success (Gulsrud, Jaromi, & Kasari, 2010). While child outcomes are important
focuses of interventions, parent and family outcomes play a large role in maintenance and
generalization of gains made by the child. These factors not only include parent stress, but also
family functioning, parent child relationships, and PSE (Karst & Van Hecke, 2012). Ignoring the
8
parent component can have deleterious effects (e.g., poor mental health), which outweigh any
gains made by the child during a treatment program.
Although parental stress has been widely studied, there is a paucity in the literature
related to PSE, and especially in examining the relationship between PSE, parental stress, and
ASD traits; even though it has been determined to be an important factor in examining parent-
child relationships. While many studies examine the relationship between stress and independent
variables, they often utilize solely parent self-report, which is subject to reporter bias. Therefore,
this study adds to the literature by including physiological measures of responsivity to stress as
well as self-report measures. Further, by including an in-lab task, this enhances the current
methodology in this area of research and examines stress in a quantifiable way, which has not
been done before. Overall, parents of children with ASD have repeatedly reported increased
levels of parenting stress. Since this can impact physical health, this is an important inclusion. By
measuring ASD trait levels and examining how these traits are associated with PSE and stress,
this study provides important information that can influence treatment options. Therefore, careful
analysis to the contributions and maintenance factors through the combination of biological
markers of stress in addition to self-report can provide rich information that may help guide
future interventions for parents of children with ASD. The present study aimed to further explore
the role of PSE in the relationship of parental stress and child ASD traits. By utilizing both a
biological level of stress, as well as self-report within a controlled laboratory environment, this
allowed for the examination of more robust outcomes in studying the converging patterns of
physiological and perceived stress to truly capture the experiences of parents.
Hypotheses
In considering the relationship between ASD traits, parental stress, and PSE described
9
above, there is a need to further explore these interactions with mothers and their children, as
previously discussed. Employing both objective and subjective measures of stress in the context
of a controlled lab experiment will allow for further analysis of these relationships and the role
that PSE plays in this relationship. Based on this, it was hypothesized that PSE would act as a
moderator between child ASD traits and parental stress, such that higher levels of PSE would
buffer the relationship between ASD traits and parental stress. This would be indicated by lower
endorsement of stress on self-reports and, since the physiological measures of stress are change
scores, buffering would be indicated by attenuated reactivity in HR (less of an increase from
baseline to response after interaction task) and HRV (less of a decrease from the baseline to the
post-interaction task). Specifically, during a mildly stressful parent-child interaction task, it was
predicted that there would be a main effect between ASD traits and parental stress, such that
more ASD traits would be related to higher parental stress levels (both self-reported and change
in HR/HRV). There would also be a main effect of PSE on stress, such that parents with higher
PSE would have lower stress levels on self-reports and lower HR/HRV stress reactivity. Finally,
there would be an interaction between PSE and parental stress, such that the positive relationship
between ASD traits and stress reactivity would be attenuated by higher PSE. Further, BAPQ
characteristics would serve as a covariate to control for its potential effects on maternal stress.
Method
Participants
Participants included 42 mother-child dyads who were recruited as part of a larger
study on parent-child interactions. Mothers were between the ages of 31 and 51 (M =
39.59, SD = 5.26). Mothers were chosen as the parent of interest because previous
research suggests that fathers vary significantly more than mothers in their interaction
10
style with their son and/or daughter (McBride, Schoppe, & Rane, 2002). Therefore, in
order to keep a more homogeneous sample, only mothers were used for this study.
Further inclusionary criteria for mothers involved English speaking and no history of
cardiovascular disease. The sample of mothers was 76.42% Caucasian and 14.3% Asian
American/Asian origin (9.5% did not report race). For children, they were required to be
between the ages of 7-12 (M = 8.87, SD = 1.47) and both males and females were
recruited (64.3% male). This age range was selected due to the fact that Hudson and
Rapee (2001) validated the parent-child interaction task with this population age range.
The sample of children consisted of 66.7% Caucasian, 16.7% Asian American/Asian
origin, 2.4% African American, and 2.4% Latino/Hispanic (11.9% did not report race).
Both typically developing children and children with clinical diagnoses were included,
such that individuals with an ASD diagnosis were not excluded, as the study focused on
ASD traits. As previously defined, we aimed to recruit at least one quarter of the sample
with high ASD trait scores. The current sample consisted of 35.7% of children with a
previous ASD diagnosis, and 61.9% without a diagnosis. Children were also not excluded
based on IQ, but IQ (as determined by the Wechsler Abbreviated Scale of Intelligence;
WASI-II; Wechsler, 2011) was measured and examined as a potential covariate in
analyses to ensure that the parent’s response to task performance was not a function of
the child’s intellectual ability.
Reactivity to a social conflict stress response was measured via HR in mothers.
Complete data were collected from 32 mothers. Ten participants were excluded because
the psychophysiology equipment malfunctioned or event markers were not properly
obtained. Analyses indicated that the individuals with and without HR data did not
11
significantly differ on demographic, ASD, parental stress, or IQ variables (t-values
ranged from -.788 to .803). Five other participants did not complete all of the measures
used for the moderation analyses. Therefore, the final analyses for HR and HRV
reactivity will be based on the 27 mothers for whom physiological data were collected as
well as completed all measures. Additionally, behavioral information was recorded to
reflect any incidents reported that would affect the physiological data, such as excessive
movement by the mother or issues with the equipment. This information was used in
examining outliers and removing data that were invalid.
The Social Responsiveness Scale, 2nd Edition (SRS-2; Constantino & Gruber, 2012) and
WASI-II (Wechsler, 2011) were used to characterize the sample for the current study. The
overall sample experienced a mild degree of social deficits, which is between 60 and 65 (M =
60.64, SD = 14.433), based on mean SRS-2 scores. These scores differed depending upon ASD
diagnosis. SRS-2 scores indicated no social difficulties in those without ASD (M = 53.00, SD =
10.144) and moderate social difficulties in the ASD group (M = 75.45, SD = 9.802).
Regarding the WASI-II, mean IQ scores for the overall sample fell in the average IQ
range (M = 108.46, SD = 15.711). Of note, some children (n = 2) were unable to complete the
WASI-II due to behavioral issues, while others (n = 10) did not have a cognitive assessment
completed due to time constraints or other variables (i.e., administration errors, protocol
changes). The children who did and did not complete IQ assessments were compared on all
demographic, IQ, ASD, parental stress, and physiological data and did not significantly differ (t-
values ranged from -1.317 to 1.479). IQ scores were also calculated for the non-ASD group (M =
111.55, SD = 14.770) and the ASD group (M = 100.75, SD = 16.272). These scores did not
significantly differ between the ASD and non-ASD groups (t(26) = 1.700, p =.101).
12
Power
A moderation analysis was proposed using multiple regression analyses with two
predictor variables and an interaction term (Cohen, Cohen, West, & Aiken, 2003). Power
analyses were conducted to determine the sample size needed to detect small (Cohens f2 =.02),
medium (Cohens f2 = .15), or large (Cohens f2 = .35) effects, with a power of .8 and alpha of .10.
Based on this analysis, a sample size of n = 444 would be required to detect a small effect, n = 62
to detect a medium effect, and n = 29 to detect a large effect. Given this information and
recruitment considerations, researchers initially aimed to collect information from 62 mother-
child dyads; however, due to difficulties with recruitment, 42 families were included in the
current sample (32 for the HR and HRV data), which was sufficient to detect a large effect. Thus,
it is noted that this sample size is underpowered to detect small effects, which are typical of
interactions; however, this study will focus on main effects for primary analyses, and the
moderation analysis will examine trends in the predicted direction.
Background information
Demographic Form (Appendix A): This questionnaire involved questions about
the participants’ background including age, race, ASD diagnosis, and socioeconomic
status. Only mothers with a child between the ages of 7 and 12 were included in the
current study.
Medical History Questionnaire (Appendix B): This self-report questionnaire was
used to identify potential confounds to the measurement of HR/HRV, such as alcohol and
caffeine consumption, exercise, and medication use.
Parental Self-Report Stress Measures
13
Perceived Stress Reactivity Scale (PSRS; Appendix C): The PSRS (Schlotz,
Yim, Zoccola, Jansen, & Schulz, 2011) is a 23 question self-report adapted from the
German validated Stress Reactivity Scale (SRS; Schulz, Jansen, & Schlotz, 2005). This
measure aims to address an individual’s perception of their intensity of response for a
number of daily stressful situations. Each question contains a statement that describes a
potentially stressful situation and three choices describing potential responses. The PSRS
produces a composite score for overall stress reactivity as well as five subscales (i.e.,
Reactivity to Work Overload, Reactivity to Social Conflicts, Reactivity to Social
Evaluation, Reactivity to Failure, and Prolonged Reactivity). Good internal consistency
across scales was found in the original study (.71 to .91), and the English-version also
demonstrated good internal consistency for total score (α = .87) and moderate internal
consistency for the subscales (.62 to .87). The subscale score for reactivity to social
conflicts, becoming emotionally affected or upset in response to social conflict or
criticism, was compared to the autonomic responses of stress reactivity in the current
study. Therefore, it will be used as the measure of parent-reported stress. In the current
study, the Cronbach’s alpha for the social conflict subscale was .69 and .90 for total stress
reactivity. The remaining subscales ranged from .68 to .77.
Parenting Stress Index (PSI-4-SF; Appendix I): The PSI-4-SF (Abidin, 2012) is
a 36 item self-report checklist, abbreviated from the full 120 item checklist, that measures
the amount of stress parents experience related to their role as a parent. The scale leads to
a total stress score and three separate domain scores that reflect the amount of stress
attributable to child characteristics (Difficult Child), parent characteristics (Parental
Distress), and the dyadic relationship (Parent-Child Dysfunctional Interaction). Internal
14
consistency was found to be satisfactory for each scale, with alphas all above .90. The
total score was used as another way to check the validity of the PSRS-RSC scale as a
measure of parental self-reported stress. In the current study, the Cronbach’s alpha for the
total score was .89.
ASD Trait Measures
The Autism Spectrum Quotient – Children’s Version (AQ-Child; Appendix D)
The AQ-Child (Auyeung, Baron-Cohen, Wheelwright, & Allison, 2007) consists of 50
statements, each with the rating of "definitely agree," "slightly agree," "slightly disagree,"
or "definitely disagree." The questions cover five different domains associated with the
autism spectrum: social skills, communication skills, imagination, attention to detail, and
attention switching/tolerance of change. This parent-report questionnaire quantifies ASD
traits in children 4-11 years old. Due to the fact that the original sample was 7-10 year
olds and there were only two 12 year olds in the current sample, we used this version for
all participants. Scores range from 0-150. A score of 76 was determined as the cut-off for
ASD traits (Auyeung et al., 2007). The measure has high internal consistency, with
Cronbach’s alpha for the five scales ranging from .83 to .93. The total score was used for
the analyses as the independent variable of ASD traits. In the current study, the
Cronbach’s alpha for the total score was .92. The subscales ranged from .75 to .90.
Social Responsiveness Scale, 2nd Edition (SRS-2; Appendix E): The SRS-2
(Constantino & Gruber, 2012) is a 65 item questionnaire that provides a measure of traits
and symptoms that distinguish behavior indicative of ASD from other variations in
behavior. This quantitative measure of the severity of ASD traits gives a rating from
normal to autistic disorder. Each question is rated from 1 to 4, with 1 meaning “not true”
15
and 4 indicating “almost always true.” Scores go up to 195 and the questions focus on the
child’s behavior in the last 6 months. The original measure was designed for 4-18 year
olds, but it has been extended into adulthood. One recent study conducting exploratory
and confirmatory factor analysis examining how the SRS-2 maps onto the two main
domains in the DSM-5, social communicative impairment and restricted repetitive
behaviors, found a number of subdomains that do not clearly map onto these two areas
(Frazier et al., 2013). These include emotion recognition, social avoidance, interpersonal
relatedness, insistence on sameness, and repetitive mannerisms (Frazier et al., 2013).
Validity has been shown to be good for the SRS (which is the same as SRS-2).
Internal consistency was calculated separately for males and females and was found to be
.93 and .94, respectively. For the current study, total scores were used to determine the
severity of social deficits in this sample of children as a way to characterize the sample
and also to check the validity of the AQ. For this sample, the Cronbach’s alpha for the
total score is .97. The subscales ranged from .86 to .93.
Broad Autism Phenotype Questionnaire (BAPQ; Appendix F): The BAPQ (Hurley,
Losh, Parlier, Reznick, & Piven, 2006) is a 36 item questionnaire designed to measure BAP
characteristics in relatives of individuals with ASD. The subscales include pragmatic language,
aloofness, and rigidity, which map onto the three core features of the BAP. Each question is
rated on a 6 point scale, ranging from 1 (i.e., very rarely) to 6 (i.e., very often) as to how often
the individual experiences each item. Summary scores for each subscale are computed by reverse
scoring appropriate items, averaging across 12 items of each subscale. Therefore, summary
scores range from 1 to 6 on subscales. A composite diagnosis of BAP was defined as the
presence of at least two of three directly assessed BAP characteristics and composite scores were
16
computed by the sum of the dichotomized scores for each of the three main characteristics. The
total score is calculated by averaging all 36 items. Previous research has indicated that there is
internal consistency for the total BAPQ score and subscales. Cronbach’s alpha ranged from .94 -
.86 for each subscale (aloof, rigid, pragmatic language), and the overall alpha was .95 across all
36 items (Ingersoll & Hambrick, 2011). Validity has also been indicated, especially face validity
in measuring the BAP, from previous research. Mothers’ total scores on the BAPQ were used in
the present study to determine maternal BAP characteristics that need to be controlled in
analyses. In the current study, the Cronbach’s alpha for the total score was .93. Subscale scores
ranged from .79 to .92.
Parental Self-Efficacy Measures
Parental Sense of Competence Scale (PSOC; Appendix G): Parental self-
efficacy was measured by the PSOC Scale (Johnston & Mash, 1989). This test includes
two subscales, efficacy and satisfaction, which have been found to measure two different
components of PSE (Ohan, Leung, & Johnston, 2000). Reliability has been established
from previous studies, with a Cronbach’s alpha of .70, test-retest for the scales on the
PSOC ranging from .46 to .82, and the internal reliability of .72 (Johnston & Mash,
1989). Validity has also been established from these studies (Johnston & Mash, 1989).
This scale was used to determine each mother’s PSE and as such, the total score was
applied to capture this construct for the current study. In the current study, the
Cronbach’s alpha for the total PSOC score was .87.
Parental Self-Efficacy in the Management of Asperger Syndrome (PSEMAS;
Appendix H): The PSEMAS scale (Sofronoff &Farbotko, 2002) is a 15 item questionnaire that
was developed to assess parental self-efficacy in a study of PMT with children with Asperger
17
Syndrome. This questionnaire assesses the behaviors children display and the extent to which
parents feel they can handle them. The total self-efficacy score is determined by the total
confidence score for behaviors that do occur divided by the total number of behaviors. The
measure was only used in the original study and reliability and validity were not determined. The
total score was used as another measure of PSE in the various moderation models herein. This
second measure of PSE was chosen because it is specific to efficacy in parents of children with
ASD. In the current study, the Cronbach’s alpha for the total score was .923.
Physiological Stress Reactivity Measurement
HR and HRV were used to determine physiological reactivity to a stress-inducing task,
using the Polar Heart Rate Monitors, Model RS800sd (i.e., Polar monitors; Polar Electro, USA).
This monitor provides wireless, continuous, and valid recordings of HR and R-R variability (i.e.,
HRV), similar to an electrocardiogram during both stationary tasks and physical exercise
(Gamelin, Berthoin, & Bosquet, 2006; Goodie, Larkin, & Schauss, 2000). The Polar monitor
uses a combined sensor and transmitter that was strapped across the participants’ chests and the
receivers were worn on the non-dominant wrist. Cardiac electrical impulses were measured by
the monitor, which were then transmitted to the receivers. From this information, the receiver
calculated the interbeat interval (IBI), which was converted into a HR recording. This was then
displayed on the receiver and the data were stored and uploaded to a computer using the Polar
computer interface unit and Polar HR Analysis Software (Polar Electro, USA). R-R intervals
were detected with a resolution of 1 millisecond and converted into HR (measured in beats per
minute; bpm) and HRV (measured in root mean squared successive differences; RMSSD).
Since both the sympathetic and parasympathetic branches influence HR, it was necessary
to include HRV to clarify the parasympathetic influences. In the present study, the mean baseline
18
HR (bpm) was calculated while viewing a 3-minute neutral video. In order to control for the
individual differences of mothers’ HR response at baseline, we calculated individual change
scores for HR by subtracting the average resting HR value in bpm during the 3 minutes of
baseline from the average HR values recorded during the entire task. This method has been used
in previous research to determine HR reactivity (e.g. Matthews, Manuck, & Saab, 1986; Larson,
Ader & Moynihan, 2001). In order to account for any floor or ceiling effects, which would
indicate biased measures of stress, the Law of Initial Values will be employed. This was
calculated by following the procedures specified by Geenan and Van de Vijver (1993), who
stated that if the Law of Initial Values applies, then a correction was implemented to the change
scores. Specific analyses include taking the logarithmic value of the fraction of variance of
average HR from baseline over variance of HR from task period.
To get these measurements, the mother’s HR was measured and assessed over the
3-minute baseline video (M = 70.827, SD = 8.359) and 5-minute mother-child interaction
task (M = 75.376, SD = 9.932). For HRV, baseline values were also assessed during the
3-minute video (M = 41.702, SD = 18.166) and task HRV was determined from the
interaction task (M = 33.994, SD = 15.607). The data were analyzed in sequential 30-
second epochs, then averaged to determine baseline and task epochs. Task minus baseline
HR/HRV was used as the measure of stress reactivity. Increased stress was indicated by
increases in HR (i.e., bpm) from baseline to task (i.e., positive change scores), and
decreases in HRV (i.e., RMSSD) from baseline to task (i.e., negative change scores). This
determination of stress response is consistent with previous literature on HR reactivity
(e.g. Matthews, Manuck, & Saab, 1986; Larson, Ader & Moynihan, 2001). The SD of
average baseline HR was compared to SD of average task HR in a paired-sample t test to
19
test for Law of Initial Values; results demonstrated that the standard deviations were not
statistically different from one another (p = .191), suggesting that a change score in
averages of HR could be used as an unbiased predictor.
Behavioral Measures
Wechsler Abbreviated Scale of Intelligence (WASI-II): The WASI-II (Wechsler,
2011) measures verbal and nonverbal IQ with two verbal (vocabulary and similarities)
and two nonverbal (block design and matrices) subtests. This has been proven to have
good reliability for children and adults, and has been validated against other tests of
intelligence, such as the Wechsler Intelligence Scale for Children (WISC). Internal
consistency scores on subtests ranged from .87 to .91, showing good internal consistency
(Ryan & Brown, 2005). Test-retest reliability was found to range from .70 to .90 for
subtests and from .87 to .95 for composite scores (Ryan & Brown, 2005). Both internal
and concurrent validity have also been established based on previous research. The
child’s score was used to determine their overall intelligence and characterize the sample,
as well as a potential covariate in the data analyses to account for the effect of child
intellectual ability.
Parent-Child Interaction: The 5 minute parent-child interaction task was
designed to present the child with difficult tasks while interacting with their parent, thus
increasing the frequency of problem behavior (Hudson & Rapee, 2001), and is used as an
ecologically valid laboratory task that may elicit parental stress. The task involved a set
of difficult puzzles, or tangrams, designed so the child was unable to complete them in
the allotted 5 minutes. The mother remained in the room with the child and she was
supplied with the solutions to the puzzles. She was also instructed to let the child work on
20
the puzzle; however, she could help if she thought it is necessary. The interaction tasks
were videotaped and any behavioral issues were recorded.
As part of this task in the present study, the mother completed a short
questionnaire rating four domains as a manipulation check to the task: her level of stress,
sense of controllability, sense of helplessness, and sense of pleasantness in being with her
child. Each question was on an 8 point Likert scale from 1 being the lowest level of the
construct to 8 being significant experience of the construct. She completed this before the
interaction task as a baseline, as well as afterwards in reference to how she was feeling
during the task.
Procedure
Participants were recruited through widespread email, flyers, and word of mouth
solicitation to multiple locations for distribution to anyone who might be interested, such as the
Montgomery County Parent Resource Center, NRV Community Services, Virginia Tech Center
for Autism Research, Virginia Tech Autism Clinic, Virginia Tech Child Study Center, Virginia
Tech Daily News, Psychological Services Center, and other local service agencies, public
posting locations (e.g., grocery stores, recreational centers), and school/community groups.
Interested mothers were contacted by a research assistant who conducted a phone screen,
provided information about the study, answered any initial questions, and scheduled an
appointment. Initially, a packet with a demographics form, medical history form, the SRS-2 and
the AQ-Child was mailed home for the mother to complete and she would complete the rest upon
her visit to the lab. However, for the majority of the participants, REDCap (Research Electronic
Data Capture; Harris, Taylor, Thielke, Payne, Gonzalez, & Conde, 2009), a secure, web-based
application designed to support data capture for research studies, was used to allow the mother to
21
complete the assessments online at her leisure. Prior to the visit, the research assistant instructed
mothers to abstain from smoking, drinking caffeinated beverages, and strenuous exercising for 4
hours before the visit, as these activities may impact the physiological measurements of HR and
HRV (Allen, Chambers, & Towers, 2007). These behaviors were also assessed when the mother
came into the lab.
Mother-child dyads were scheduled to meet a trained research assistant at one of three
locations: Virginia Tech Autism Clinic (Blacksburg, VA; n = 35), Higher Education Center
(Roanoke, VA; n = 2), and Children’s Hospital (Boston, MA; n = 5). Participants were told that
they were to participate in a study examining parent and child interactions based on an in-lab
task. A script was prepared to obtain verbal assent from the child and the mother completed the
consent and permission forms. After obtaining informed consent, parent permission, and assent
from the child, the research assistant administered the WASI-II to the child. At the same time,
the mother completed the additional measures, which varied based on whether or not she had
completed the measures prior. These measures often included the PSOC, PSEMAS, the BAPQ,
the PSRS, and the PSI-4-SF. The mother also completed paper versions of a demographics and
medical history form.
After the assessment with the child was completed, the research assistant instructed the
mother on procedures for attaching the HR monitor. The mother was asked to attach the monitor
while the research assistant stepped out of the room. Once the device was in place and checked
for proper functioning, the mother watched a 3-minute baseline video, National Geographic’s
Animal Holiday, to achieve a “vanilla” baseline (Jennings, Kamarck, Stewart, Eddy, & Johnson,
1992). Previous research has indicated this provides a more robust baseline for measuring
autonomic activity than simply sitting still (Jennings et al., 1992). Mothers were then instructed
22
to rate their current level of stress, sense of controllability, sense of helplessness, and sense of
pleasantness in being with their child. After this, the child joined the mother in a testing room to
engage in a 5-minute parent-child interaction task (Hudson & Rapee, 2001).
According to the original task from Hudson and Rapee (2001), the research assistant
administered the following instructions:
“This is a test of your child’s ability. We want to see how good he/she is at
thinking. Mom, you are going to sit there for support and you will have the answers for
interest. Most kids can do it but some find it a bit hard to get going. You can help if you
think he/she really needs it (p. 1416).”
Based on the age of the sample, we used the set of tangrams for 7-12 year olds
(Hudson & Rapee, 2001). We did not include the scrabble section, which is also a
component of the task developed by Hudson and Rapee, due to varying reading levels at
this age. After the task, the mother was asked to again rate her level of perceived stress,
helplessness, controllability, and pleasantness in reference to her experience during the
interaction task.
The mother then watched a post-task video, while the child was free to play with the
research assistant and select their prize for participation. Finally, the research assistant debriefed
the mother and child and answered any questions. The mother was asked to remove the HR
monitor and the participants were thanked for their time and efforts with $10 compensation.
Analytic Plan
Preliminary Analyses
Data were first analyzed to determine that the necessary assumptions of normality,
linearity, and homoscedasticity were met before proceeding. Next, descriptive statistics including
23
the means, standard deviations, and ranges were determined for the variables of interest (Table
1). Further, Pearson correlations between all variables were explored to determine if there were
covariates to include, other than BAPQ which has been identified previously as a covariate of
consideration. Some possible additional covariates were IQ, race, health concerns, maternal age,
and age of child. Also, correlations were calculated among change scores in HR/HRV, average
HR/HRV scores at baseline and during the task, maternal health behavior (i.e., caffeine intake,
alcohol consumption, exercise), and maternal physical characteristics (i.e., height and weight),
and any correlations were used as covariates in the analyses. In addition, correlations between
methods of data collection (i.e., self-report and physiological measures of stress) were examined.
Hypothesis Testing
To test the hypotheses outlined regarding the main effects and moderating effect of PSE
on the relationship between ASD traits and parental stress, multiple regression analyses were
conducted (with appropriate covariates as noted above). These regressions included
combinations of using the self-report stress measure or physiological stress measures as an
outcome and PSE as the moderator. Since we had two measures of PSE (i.e., the PSOC and the
PSEMAS), stress measures were first examined using the PSOC in the moderation analyses, and
then repeated using the PSEMAS. Main effects as well as interaction effects were determined.
The first set of analyses tested the relationship between ASD traits and self-reported
stress as moderated by PSE. Two regressions were conducted, once using the PSOC and once
using the PSEMAS as the measure of PSE. For the first regression, therefore, the independent
variables were ASD traits (via total AQ score), PSE (via total PSOC score), and their interaction
term, and the dependent variable was parent self-reported stress reactivity (via PSRS-RSC
24
score). The second regression included the same independent variables and dependent variable,
and PSEMAS as the measure of PSE.
The second set of analyses tested the relationship between ASD traits and physiological
stress (i.e., HR reactivity or HRV reactivity) as moderated by PSE. Four regressions were
conducted in total. Two regressions were conducted for HR reactivity and HRV reactivity using
PSOC score as the measure of PSE. An additional two regressions were then conducted for HR
reactivity and HRV reactivity using the PSEMAS as the measure of PSE. In all cases, continuous
predictors were mean-centered.
The first two hypotheses examined the main effects of ASD traits and PSE on parental
stress as the primary analyses of this study, while the third hypothesis examined the effect of the
interaction term as the secondary analysis. If the interaction effect is significant, post-hoc
probing analyses were conducted to further test the interaction and determine the direction of
effects. Effect sizes were calculated for main effect and interactions. Since the analyses included
regressions, the unstandardized coefficient was used to determine the effect size and the cutoffs
laid out by Cohen were used (i.e., small =.1, medium = .3, and large = .5; Cohen, 1988, 1992).
The procedures used for interaction testing followed the guidelines specified by Aiken and West
(1991) in mean centering variables and screening variables for normality, linearity, homogeneity
and multicollinearity.
Results
Preliminary Analyses
Covariates. After examining the correlations among the variables (Tables 3 and 4),
different covariates emerged for the dependent variables. Self-report of stress, as measured by
PSRS total score, was significantly correlated with the previously determined covariate, BAPQ
25
scores. Specifically, the correlation suggested that higher levels of parent stress were positively
correlated with higher BAPQ scores (r = .408, p = .028). BAPQ was also significantly positively
correlated with AQ scores (r = .381, p = .038), which indicates that more ASD traits in a child is
correlated with a higher BAPQ score in the parent. Additionally, child age was significantly
negatively correlated with PSRS-RSC score (r = -.460, p = .005), such that having a child who is
older was correlated with lower parental stress levels. As such, these were the only covariates
used in self-report analyses.
For the physiological data, maternal height was significantly negatively correlated with
HRV change (r = -.372, p = .039) and HRV mean baseline scores (r = -.461, p = .009).
Additionally, caffeine intake the day of the lab visit was significantly positively associated with
HR change (r = .391, p = .033). These variables were used as covariates in the respective
models.
Manipulation Test of In-Lab Stressful Task. Approximately the same number of
mothers reported elevated stress levels (n = 16) versus no change (n = 20) after the task, and a
small proportion (n = 3) indicated reduced stress levels. A within-subject paired-sample t-test
indicated that there was a significant difference in stress rating before (M = 2.243, SD = 2.712)
and after the interaction task (M = 2.946, SD = 2.549; t(36) = -2.594, p = .014), such that there
was a significant increase in reported stress overall in the current sample. In addition, t-tests from
pre to post task were conducted on the three manipulation check scales (i.e., controllability,
helplessness, pleasure). There were no significant changes from pre to post on the controllability
(t(31) = -1.063, p = .295), helplessness (t(31) = -1.000, p = .325), and pleasure (t(31) = -1.094, p
= .282) domains.
Correlations of Self-Report with Observation Measures
26
See Table 3 and Table 4 for a full list of correlations among all continuous variables of
interest. Several correlations are of note considering the constructs of interest. Neither baseline
HR nor change in HR was correlated to self-report levels of stress (r = .064, p = .736; r = -.279,
p = .142) as measured by the PSRS-RSC. Similarly, there were no significant correlations for
baseline HRV nor change in HRV (r = .112, p = .555; r = -.021, p = .910) with self-reported
stress on the PSRC-RSC. In sum, results yielded no significant correlations between self-report
and lab measures of similar constructs.
Correlations of ASD Measures and Self-report Stress Measures
In cross-validating the ASD trait measure (i.e., AQ score), a correlation was conducted
with SRS-2 scores. This correlation was significant (r = .785, p = .000). Additionally, an
independent samples t-test between AQ score and ASD diagnosis indicated a significant
difference (t(27) = -11.518, p = .000) in AQ score between those with ASD (M = 33.36, SD =
6.990) and those without ASD (M = 17.72, SD = 8.956), which is to be expected, and confirms
that it is a valid measure of ASD symptomology.
To cross-validate the PSRS-RSC, a correlation was conducted with the PSI-4-SF score.
The two were significantly correlated (r = .431, p = .008), validating the measurement of parent
stress. Measures of PSE were also correlated. Results indicated a correlation between the PSOC
overall score and the PSEMAS total score and (r = .479, p = .005). In sum, these correlations
validate the use of these measures to capture ASD traits and parental stress, respectively.
Hypothesis Testing
Examination of the Relationships between ASD traits and Self-reported Stress as
moderated by PSE.
Autism Traits and Self-Report Stress, Moderated by Parental Self-Efficacy (PSOC).
27
The first regression tested the hypothesis of ASD traits (AQ), PSE (PSOC) and their
interaction with the dependent variable of self-reported parental stress (PSRS-RSC). BAPQ and
child age were the only identified covariates. The full model accounted for 14.2% of the variance
in PSRS-RSC scores. As shown in Table 5, child age was significantly and negatively related to
PSRS-RSC in Step 1, Step 2, and Step 3 (β = -.506, p = .009; β = -.531, p = .010; β = -.533, p =
.016). In all instances an older child was associated with decreased parent stress. These effect
sizes were all large. Additionally, no significant main effects emerged for AQ score (β = -.195, p
= .387) or parenting efficacy (β = .023, p = .922). The interaction effect was also non-significant
(β = -.006, p = .979).
Autism Traits and Self-Report Stress, Moderated by Parental Self-Efficacy (PSEMAS).
A secondary regression was conducted using the PSEMAS scale as the moderator in the
relationship between ASD traits (AQ) and self-reported parental stress (PSRS-RSC). Again,
BAPQ and child age were used as covariates, as previously identified. The full model accounted
for 27.6% of variance in PSRS-RSC scores. Child age was significantly and negatively related to
PSRS-RSC in Step 1, Step 2, and Step 3 (β = -.500, p = .012; β = -.506, p = .010; β = -.499, p =
.011). These were all large effect sizes. As shown in Table 6, no significant main effects emerged
for AQ scores (β = -.182, p = .410) or PSEMAS score (β = -.338, p = .077). The interaction term
was also not significant (β = -.186, p = .308). The main effect size for PSEMAS was medium, in
the direction of lower PSE associated with greater self-reported stress. Additionally, the
interaction effect size was small.
Examination of the Relationship between ASD Traits and Physiological Stress as
Moderated by PSE
Autism Traits and Physiological Stress, Moderated by Parental Self-Efficacy (PSOC).
28
The second set of analyses tested the relationship of ASD traits (AQ), PSE (PSOC) and
their interaction with physiological outcome measures of stress, measured by HR reactivity and
HRV reactivity to the task. In these models caffeine intake was used as a covariate for HR
reactivity, mother height was a covariate for HRV reactivity, and BAPQ scores were used as
covariates in both.
For the dependent variable of HR reactivity, the full model accounted for 47.4% of the
variance. BAPQ was negatively related to HR reactivity in Step 1 (β = -.561, p = .009) and
caffeine intake was positively related to HR reactivity in Step 1 (β = .405 p = .048). These effect
sizes were both large. As shown in Table 7, there was no significant main effect for AQ score (β
= -.271, p = .392) nor for PSOC score (β = -.123, p = .646) for the dependent variable of HR
reactivity. The interaction effect was also non-significant (β = .009, p = .973). There were small
effect sizes for the main effect of AQ on HR change and PSOC on HR reactivity.
For the dependent variable of HRV reactivity, the full model accounted for 47.7% of the
variance. In Step 2, there was a unique and significant negative relation between BAPQ and
HRV (β = -.615, p = .017). There was a large effect size for this correlation. Additionally, there
was a significant main effect for AQ on HRV change score (β = .687, p =.011), suggesting that
higher ASD traits were associated with larger increases in HRV from baseline in the mother.
There was no significant main effect for PSOC on HRV change (β = .058, p = .803). The
interaction effect was also non-significant (β = -.178, p = .473). There was a large effect size for
the main effect of AQ on HRV change and a small interaction effect.
Autism Traits and Physiological Stress, Moderated by Parental Self-Efficacy
(PSEMAS). Secondary analyses tested the prediction of ASD traits (AQ), PSE (PSEMAS) and
their interaction with a physiological stress measure, measured by HR reactivity and HRV
29
reactivity. In these models caffeine intake was used as a covariate for HR reactivity, mother
height was a covariate for HRV reactivity, and BAPQ score was used as a covariate in both.
In looking at HR change score, the full model accounted for 53.8% of the variance.
BAPQ was significantly negatively related to HR reactivity in Step 1 (β = -.572, p = .010), which
is considered it be a large effect size. As shown in Table 9, HR reactivity was not significantly
related to AQ score (β = -.083, p = .755) nor was it significantly related to PSEMAS score (β =
.163, p = .457). The interaction effect was also non-significant for this model (β = .254, p =
.243). There was a small effect size for the main effect of PSEMAS on HR change, in the
direction of lower self-efficacy related to decreased maternal HR reactivity from baseline. There
was also a small interaction effect size.
In looking at HRV change score, the full model accounted for 67.20% of variance. As
shown in Table 10, BAPQ was significantly and negatively related to HRV change score in Step
2 and Step 3 (β = -.619, p = .018; β = -.603, p = .009), such that higher BAPQ scores were
associated with lower HRV reactivity. Both of these correlations suggest large effect sizes.
Further, HRV reactivity was significantly positively related to AQ score (β = .549, p = .017), but
no significant main effect emerged for PSE (β = -.254, p = .153). The significant main effect for
AQ on HRV change score suggested that higher ASD traits were associated with larger increases
in HRV from baseline in the mother. The main effect of ASD traits remained significant with the
inclusion of the interaction term, which was also significant (β = -.405, p = .0275). In looking at
the direction of the interaction, results indicated that there was a significant relationship between
heightened ASD traits and increased HRV reactivity for those with low PSE (β = 1.05, p = .002),
but not high PSE (β = .1309, p = .670). There was a large effect size for the main effect of AQ on
HRV change, and a medium effect size for the main effect of parental efficacy on HRV change.
30
The medium effect size for PSE was in the direction of lower self-efficacy associated with
greater increases in maternal HRV from baseline.
Discussion
This study adds to the growing literature on parental stress unique to parents of children
with ASD. As such, the results shed light on potential targets of treatment, as well as the utility
of using physiological measures of stress. The current study utilized a methodology that
examined both physiological and self-report measures of stress, which approaches this topic
from a nascent perspective. Though some findings are consistent with previous literature, others
are slightly different than hypothesized, and the implications as well as future directions are
discussed here. The primary findings indicated that PSE may act as a moderator between ASD
traits and parental stress when using a physiological measure of parental stress, specifically
HRV. This conclusion is qualified by the fact that the finding held for one measure of PSE, the
PSEMAS. This interaction suggested that with lower PSE scores, there is a positive relationship
between ASD and HRV reactivity. A significant positive main effect also indicated that ASD
traits were related to increased HRV reactivity. Notably, there were no significant results found
with HR reactivity or with parent self-report. These results were found after controlling for
covariates for the specified models (i.e., child age, BAPQ score, mother height, and caffeine
intake). It should be restated that this study was underpowered to detect small or medium effects.
This is evident in that some of the regression coefficients were medium or large; however, they
were not significant. Therefore, all results need to be further explored with a larger sample size,
and medium to large effect sizes will be discussed with due caution herein.
In the first set of analyses using PSOC scores and self-reported stress, there were no
significant interactions or main effects, and all effect sizes were negligible. This is somewhat
31
contrary to previous literature that has found that caregivers of children with ASD experience
greater levels of parenting stress (Davis & Carter, 2008; Estes et al., 2013), due to the additional
demands of parenting a child with special needs. One possible explanation is that parents often
employ positive appraisal of a situation as a coping strategy (Holroyd & Ladaruz, 1982).
Therefore, parents might perceive that they are experiencing less stress as a means to help
themselves handle difficult situations, though that might not actually be the case. One study
found that locus of control, similar to PSE, did not moderate the relationship between stressors
and negative outcomes, and in fact coping styles and strategies were more predictive of the
outcome than parental confidence or even social support (Dunn, Burbine, Bowers, & Tanlteff-
Dunn, 2001). Therefore, the results in this study might further support the notion that coping
strategies, such as cognitive appraisal, might be accounting for the self-report results.
Similar results were found with the other set of analyses using self-reported stress and a
different measure of PSE (PSEMAS), namely there were no significant main effects nor a
significant interaction. This provides evidence of not only consistency in the results across self-
report measures, but also intimates that both measures of PSE are capturing a similar construct of
PSE. This consistency across measures was also supported by the significant correlation between
the two measures of PSE. Despite statistical non-significance, however, the effect size of the
PSEMAS main effect was medium, indicating that lower PSE may be associated with greater
self-reported stress. This result should be interpreted very cautiously, due to the low power;
however, the direction of this finding is consistent with what was hypothesized.
In the models using physiological data, HRV stress reactivity was found to have a
relationship with ASD traits. Here, results revealed that higher ASD traits were positively related
to HRV change. A positive change reveals higher HRV in the task relative to baseline. Since
32
HRV has been used to indicate emotional responding and flexibility, as well as
psychopathological features and processes in a number of studies (Thayer & Lane, 2000;
Kreibig, 2010), there are a few possible interpretations of the present finding. If context is not
considered, however, a potential interpretation is that parents of children with higher ASD traits
have developed more flexible and adept regulation skills in stressful situations. Specifically,
higher HRV may reflect a greater capacity for regulated emotional responses. These results may
illustrate the fact that parents whose children have more severe ASD traits might have developed
more adaptive coping mechanisms. To date, there are no studies to our knowledge looking
specifically at HRV in parents of children with ASD. However, research on general stress and
other clinical populations, such as individuals with PTSD, indicate that decreased HRV may
indicate lack of the ability to respond flexibly to stressful situations even if they are not exposed
to a stressful reminder during a task, and may also reveal more rigidity and more vulnerability to
psychological distress (Cohen et al., 1998).
Additionally, previous research has suggested the importance of considering HRV
reactivity in the context of the situation. Hastings et al. (2008) indicated that RSA (another index
of HRV) changes depending on the situation. More specifically, it was found that lower RSA in
threatening situations might reflect effective coping strategies, whereas increased RSA in non-
threatening situations might reflect emotion regulation. If this finding is applied to the current
study, this suggests that an increase in HRV during the parent-child stressor actually may reflect
poorer coping. Therefore, the positive relationship between ASD traits and HRV reactivity may
indicate that higher ASD traits are related to an atypical coping response during a stressful
situation. This is consistent with previous literature indicating greater stress levels for parents of
children with ASD. Since manipulation checks found that the task was stressful, the pattern of
33
responding might highlight effective coping that parents of children with less severe ASD traits
might possess in comparison to those with more severe deficits. Further, HRV is a more specific
way to examine autonomic functioning, as it is only mediated by parasympathetic nervous
system activity (Berntson, Cacioppo, Quigley, & Fabro, 1994). Therefore, it seems HRV might
be a better index of parental stress than HR, as it isolates the parasympathetic nervous system
activity and provides a measure of emotional responding and flexibility.
The analysis using PSEMAS was the only overall model that was significant for the
interaction, such that mothers with low PSE demonstrated a stronger relationship between ASD
traits and increased HRV change. Interpreting this finding without consideration of context, this
is contrary to the initial hypothesis. However, this is in line with research indicating more
flexible coping in parents of children with more severe ASD traits. Though most research is on
the positive effects of self-efficacy, recently there has been research exploring negative effects of
self-efficacy (Vancouver, Thompson, Tischner, & Putka, 2002). While some researchers looked
at the effect of self-efficacy in longitudinal data on performance, other work has found that
higher self-efficacy can lead to overconfidence in one’s abilities and this resulted in the
individual being less active in completing a given task (Stone, 1994). Based on this information,
an alternate possible explanation for the findings from the present study may be that with higher
self-efficacy, these parents might be overconfident in their abilities, and therefore display greater
stress when they feel they cannot handle a situation or should have more control. Therefore, with
lower self-efficacy, parents might not be as invested or as concerned with their performance.
Instead, they are reacting to the situation, rather than considering their own ability to influence
the situation. As found in the Dunn et al. article (2001), coping strategies were determined to be
the greatest predictor of parental response. Thus, coping strategies beyond PSE may be
34
employed by parents, accounting for the results in the present study. Specifically, researchers
indicate that escape-avoidance coping corresponds to increased depression and other negative
outcomes, while distancing (i.e., making light of a situation) can also lead to negative results;
however, some degree of distancing was found to be positive (Dunn et al, 2011).
In considering this in the context of the situation, this finding suggests that mothers with
lower PSE are less adept at responding to stress (Huffman et al., 1998; Hastings et al., 2008).
Therefore, mothers with lower PSE could have more difficulty coping with stressful tasks,
whereas parents with higher PSE might rise to the challenge. This finding is consistent with
previous work highlighting the protective nature of PSE, especially in parents of children with
ASD. Further, lower PSE has been found to be related to stress (Hastings & Brown, 2002), to
partially mediate parenting stress and increase depression and anxiety in parents (Rezendes &
Scarpa, 2011), and mediate the relationship between child problem behaviors and maternal
anxiety and depression (Hastings & Brown, 2002). Therefore, mothers with lower PSE might be
responding inappropriately and have less strategies for coping with a stressful situation. For
them, there is no buffer to their child’s ASD symptoms, as their low PSE might lead them to feel
more stress and they are left without useful coping strategies. It is important to note again that
the study was underpowered to detect interactions as well as medium or small effect sizes.
Therefore, the results should be interpreted with caution and this could be another reason why
the results are not in the direction that was hypothesized.
Looking at the various methods of report, the results provide support for using
physiological data, especially HRV, in looking at stress. Additionally, it seems that maternal
report of stress and HRV were not related, which indicates physiological measures might tap into
the stress mothers are experiencing beyond what is reported on a survey or paper measure.
35
Further, the fact that the PSEMAS was the only self-report measure that moderated the model
may be due to the fact that this measure is designed specifically for parents of children with
ASD, and this sample included a high number of individuals with this diagnosis. Therefore, this
measure might have measured PSE in a way more specific to the parents in the current sample
than the PSOC does. Future studies can work to validate this measure, as a specific measure of
PSE in parents of children with ASD may be useful in answering a number of research questions.
Additionally, the BAPQ was a significant covariate in a number of the analyses and
likely accounted for a significant amount of the variance. As previously mentioned, BAP traits
have been linked to social anxiety and communication problems in parents (Karst & Van Hecke,
2012), which might impact their interaction with their child. Research has also found that parents
with BAP characteristics employ ineffective coping strategies for stress as well as show elevated
stress levels and rates of depression (Ingersoll & Hambrick, 2011). Therefore, the presence of
BAP features may dictate the amount and type of stress a parent experiences in interacting with
their child. The nature of the relationship of BAP traits to stress was not explicitly studied and
therefore, future studies should examine this in more detail and explore these moderation models
of parental stress without BAPQ score.
The results of this study have potential implications for treatment. There has been a push
to include parents in treatments for children with ASD and a number of different treatment
models currently exist. These manualized parent-implemented interventions can be complex and
require extensive training, expertise, and high fidelity (Rogers et al., 2012). Interventions
targeting PSE have proven to be successful in both increasing PSE and decreasing child behavior
problems. The results of the present study, indicating lower PSE might lead to poorer coping
with stress, suggests that targeting PSE in interventions might be beneficial. This was also
36
underscored by the finding that lower PSE was related to heightened self-reported stress. Though
this was not a significant finding, the effect size was medium, and this effect might have been
significant with greater power. Therefore, it may be that low PSE is related to increased self-
reported stress and an unusual physiological stress response, and low PSE moderates the
relationship between ASD traits and poor coping (as reflected in increased HRV during the
stressor task). Regarding PSE in the context of PMT, Sofronoff and Farbotko (2002) found
increased PSE in comparison to control groups, and these parents also reported fewer child
problem behaviors post intervention. Therefore, increasing PSE may impact parental stress;
however, as the results show, there might be the need to teach other coping strategies as well.
Parent training programs may teach parents how to employ strategies for dealing with
disruptive behavior, and these interventions have been found to enhance psychopharmacological
treatment as well as foster improvements in child behavior (Bearss, Johnson, Handen, Smith, &
Schaill, 2012). Based on the current results, teaching specific strategies for managing a child’s
behavior or eliciting certain skills might be even more beneficial than just focusing on PSE.
Finally, psychoeducation outlines core information regarding ASD without giving specific
strategies and hands on training. All of these have been found to be efficacious; however, often
the parent mediated interventions as well as parent training lead to the most salient results. This
outcome might emerge due to the fact that increasing skills increases PSE and as a result could
also decrease stress levels.
Considering parent stress in treatment design as well as outcomes should also be
considered (Luiselli, 2000). One finding indicates that parental stress decreases with low-
intensity treatment (Brookman-Frazee & Koegel, 2004) and may also lead to decreased child
outcomes. Therefore, implementing an intervention with a balance between education, resources,
37
and respect of the parents’ time is necessary. Further, higher initial parent stress is associated
with less adaptive behavior outcomes in staff-provided interventions, even if the parent is not the
main person responsible for the implementation of treatment (Shine & Perry, 2010). Thus,
targeting parent stress seems necessary for both the parent and child in making significant gains.
Additionally, results from this study indicate that while PSE should be a component addressed in
treatment, there is a need for additional strategies to be included in training to enhance parents’
repertoire of responding to their child.
Limitations
Multiple limitations exist within the current study. Primarily, difficulties in recruitment
led to a number of limitations. First, the sample size did not allow for us to detect significance
from medium or small effect sizes, and the results of non-large effects, therefore, should be
interpreted with caution. To ensure the accuracy of results as well as expand on the moderation
analyses, the specified models should be tested in a larger sample. Additionally, the racial make
up of the sample was not diverse, which could impact the response patterns found in the current
sample. Parent stress and response patterns have not been specifically studied in looking at race
and ASD features, however further examination of these variables can shed light on potential
cultural differences. Although we attempted to recruit fathers to fill out additional surveys, we
did not have a promising response rate and stopped this component of the study. This did not
impact the present analyses; however, it would have allowed for another layer of analyses to
consider. Additional research should look at fathers’ or other caregivers’ responses in order to
get a more complete idea of other environmental variables. Finally, the examination of the
questions on the manipulation check did not demonstrate significant differences on helplessness,
controllability, or pleasure, though the overall stress ratings did indicate significant increases
38
after the task. Therefore, there is some ambiguity as to whether the task elicited the specific
aspects of stress we aimed to target.
Finally, while measures of PSE and the mother’s perception of their child’s social
functioning were included, child behavior factors were not included in the present analysis.
Specifically, a child’s problematic behavior could serve as an important antecedent and
reinforcer of parenting behaviors.
Future Directions
Future directions could expand on the work looking at parental stress. Researchers might
include additional diagnoses in order to compare the maternal stress response in mothers of
children with ASD to those with other diagnoses. Further, analyzing parent stress response via
other physiological measurements including electro-dermal activity (EDA), cortisol, and
pupillometry during eye tracking could allow greater insight into the sympathetic,
parasympathetic, and HPA influence during stressful situations. Many researchers have studied
the role cortisol plays in the HPA axis and its relationship to psychological stressors (Young et
al., 2004), combining this measurement with salivary alpha-amylase (sAA). It may also be
helpful to measure stress responses in multiple contexts beyond just the interaction with the
child, to examine the importance of differentiating state and trait features of a stress response.
Including a non-stressful task in order to compare HRV reactivity in a stressful and non-stressful
context might also be beneficial and an additional component to add in future studies. Moreover,
looking at other factors that may influence parental stress can also shed light on this concept. For
example, past studies have focused on parent’s levels of stress (i.e., self report and cortisol) in
relation to time spent with children, negative and positive affect, and types of stressors
encountered (Smith et al., 2010). Additionally, future studies could look at a behavioral measure
39
of stress as well as specific subscales and components of PSE, to tease apart what might be
accounting for the interaction of ASD traits, PSE, and parental stress. Mediation analyses might
reveal different interactions of these factors. Future work assessing parental BAPQ
characteristics more in depth, used as a covariate here, might also add a layer to the stress
literature. Examining the accuracy of performance on the tangram task might also be interesting
as it relates to stress reactivity in parents. Additionally, comparing state stress responses versus
trait stress response might also elucidate more information regarding this area of research.
In sum, this study continues to elucidate topics related to the stress parents of children
with ASD experience and the way in which PSE moderates the impact ASD traits have on this
stress. By including a physiological measure of stress, results were not only based on an
additional measure of stress, looking at the mother’s physiological response, but also
demonstrate how parental stress can impact parents’ general health. The study results highlight
the potential importance of conveying a range of specific strategies and targets of treatment to
improve parental coping, in addition to PSE in parent training and intervention, to add to positive
outcomes for both the children and their parents.
40
References
Abidin, R. R. (2012). Parenting Stress Index, Fourth Edition: Professional Manual. Odessa, FL:
Psychological Assessment Resources, Inc.
Aiken, L. S., & West, S. G. (1991). Multiple regression: Testing and interpreting interactions.
Newbury Park, CA: Sage.
Allen, J. J., Chambers, A. S., & Towers, D. N. (2007). The many metrics of cardiac
chronotropy: A pragmatic primer and a brief comparison of metrics. Biological
Psychology, 74(2), 243-262.
Allen, N., Kuppens, P., & Sheeber, L. (2012). Heart rate responses to parental behavior in
depressed adolescents. Biological Psychology, 90(1), 80-87.
doi:10.1016/j.biopsycho.2012.02.013
Appelhans, B. M., & Luecken, L. J. (2006). Heart rate variability as an index of regulated
emotional responding. Review of General Psychology, 10(3), 229.
Auyeung, B., Baron-Cohen, S., Wheelwright, S., & Allison, C. (2008). The autism spectrum
quotient: Children’s version (AQ-child). Journal of Autism and Developmental
Disorders, 38(7), 1230-1240. doi:10.1007/s10803-007-0504-z
Baker, B. L., McIntyre, L. L., Blacher, J., Crnic, K., Edelbrock, C., & Low, C. (2003). Pre-
school children with and without developmental delay: Behaviour problems and
parenting stress over time. Journal of Intellectual Disability Research, 47(4-5), 217-230.
doi:10.1046/j.1365-2788.2003.00484.x
Bandura, A. (1986). The explanatory and predictive scope of self-efficacy theory. Journal of
social and clinical psychology, 4(3), 359-373.
41
Bearss, K., Johnson, C., Handen, B., Smith, T., & Scahill, L. (2012). A pilot study of parent
training in young children with autism spectrum disorders and disruptive
behavior. Journal of autism and developmental disorders, 43(4), 829-840.
Berntson, G.G., Cacioppo, J.T., Quigley, K.S., & Fabro, V.T. (1994). Autonomic space and
psychophysiological responses. Psychophysiology, 31, 44-61.
Bolton, P. F., Golding, J., Emond, A., & Steer, C. D. (2012). Autism spectrum disorder and
autistic traits in the avon longitudinal study of parents and children: Precursors and early
signs. Journal of the American Academy of Child & Adolescent Psychiatry, 51(3), 249-
260.e25. doi:10.1016/j.jaac.2011.12.009
Centers for Disease Control and Prevention. (2014). Prevalence of Autism Spectrum Disorder
Among Children Aged 8 year- Autism and Developmental Disabilities Monitoring
Network, 11 sites, United States, 2010. Morbidity and Mortality Weekly Report
(MMWR) (http://www.cdc.gov/mmwr/preview/mmwrh
tml/ss6302a1.htm?s_cid=ss6302a1_w), Accessed March 28, 2014.
Cieslak, R., Benight, C. C., & Lehman, V. C. (2008). Coping self-efficacy mediates the effects of
negative cognitions on posttraumatic distress. Behaviour Research And Therapy, 46(7),
788-798. doi:10.1016/j.brat.2008.03.007
Cohen J. (1988). Statistical Power Analysis for the Behavioral Sciences. New York, NY:
Routledge Academic.
Cohen, J. (1992). A power primer. Psychological bulletin, 112(1), 155.
Cohen, J., Cohen, P., West, S. G., & Aiken, L. S. (2013). Applied multiple regression/correlation
analysis for the behavioral sciences. Routledge.
42
Cohen, H., Kotler, M., Matar, M. A., Kaplan, Z., Loewenthal, U., Miodownik, H., & Cassuto, Y.
(1998). Analysis of heart rate variability in postraumatic stress disorder patients in
response to a trauma-related reminder. Biological psychiatry, 44(10), 1054-1059.
Constantino, J. N., & Gruber, C. P. (2012). Social Responsiveness Scale, Second Edition. Los
Angeles, CA: Western Psychological Services.
Davis, N. O., & Carter, A. S. (2008). Parenting stress in mothers and fathers of toddlers with
autism spectrum disorders: Associations with child characteristics. Journal of autism and
developmental disorders, 38(7), 1278-1291.
Deater-Deckard, K. (1998). Parenting stress and child adjustment: Some old hypotheses and new
questions. Clinical Psychology: Science And Practice, 5(3), 314-332. doi:10.1111/j.1468-
2850.1998.tb00152.x
Dunn, M. E., Burbine, T., Bowers, C. A., & Tantleff-Dunn, S. (2001). Moderators of stress in
parents of children with autism. Community mental health journal, 37(1), 39-52.
Estes, A., Olson, E., Sullivan, K., Greenson, J., Winter, J., Dawson, G., & Munson, J. (2013).
Parenting-related stress and psychological distress in mothers of toddlers with autism
spectrum disorders. Brain and Development,35(2), 133-138.
Fabes, R. A., & Eisenberg, N. (1997). Regulatory control and adults’ stress-related responses to
daily life events. Journal of Personality and Social Psychology, 73, 1107–1117.
Frazier, T. W., Ratliff, K. R., Gruber, C., Zhang, Y., Law, P. A., & Constantino, J. N. (2014).
Confirmatory factor analytic structure and measurement invariance of quantitative
autistic traits measured by the social responsiveness scale-2. Autism, 18(1), 31-44.
doi:10.1177/1362361313500382
Gamelin F.X., Berthoin S., & Bosquet L. (2006). Validity of the polar S810 heart rate monitor to
43
measure R-R intervals at rest. Medicine and Science in Sports and Exercise, 38, 887-893.
Geenen, R., van de Vijver, F.J.R. (1993). A simple test of the law of initial values.
Psychophysiolog,y 30(5), 525–530.
Goodie, J.L., Larkin, K.T., & Schauss, S. (2000). Validation of the Polar heart rate monitor for
assessing heart rate during physical and mental stress. Journal of Psychophysiology,
14,159-164.
Gulsrud, A. C., Jahromi, L. B., & Kasari, C. (2010). The co-regulation of emotions between
mothers and their children with autism. Journal Of Autism and Developmental Disorders,
40(2), 227-237. doi:10.1007/s10803-009-0861-x
Harris, P., Taylor, R., Thielke, R., Payne, J., Gonzalez, N., & Conde, J. (2009) Research
electronic data capture (REDCap) - A metadata-driven methodology and workflow
process for providing translational research informatics support. Journal of Biomedical
Information, 42(2), 377-381.
Hastings, P. D., Nuselovici, J. N., Utendale, W. T., Coutya, J., McShane, K. E., & Sullivan, C.
(2008). Applying the polyvagal theory to children's emotion regulation: Social context,
socialization, and adjustment. Biological Psychology, 79(3), 299-306.
doi:10.1016/j.biopsycho.2008.07.005
Hastings, R., & Brown, T. (2002). Behavior problems of children with autism, parental self-
efficacy, and mental health. American Journal on Mental Retardation, 107(3), 222-232.
Hastings, R. P., Kovshoff, H., Brown, T., Ward, N. J., Espinosa, F. D., & Remington, B. (2005).
Coping strategies in mothers and fathers of preschool and school-age children with
autism. Autism, 9(4), 377-391. doi:10.1177/1362361305056078
44
Hastings, R. P., & Symes, M. D. (2002). Early intensive behavioral intervention for children with
autism: Parental therapeutic self-efficacy. Research in Developmental Disabilities, 23(5),
332-341. doi:10.1016/S0891-4222(02)00137-3
Hastings, R., & Taunt, H. (2002). Positive perceptions in families of children with
developmental disabilities. American Journal on Mental Retardation, 107(2), 116-127.
Holroyd, K. A., & Lazarus, R. S. (1982). Stress, coping, and somatic adaptation. In L.
Goldberg & S. Breznitz (Eds.), Handbook of stress: Theoretical and clinical
aspects (pp. 21-35). New York: The Free Press.
Horsten, M., Erigson, M., Perski, A., Wamala, S. P., Schenck-Gustafsson, K., & Orth-Gomér, K.
(1999). Psychosocial factors and heart rate variability in healthy women. Psychosomatic
Medicine, 61(1), 49-57.
Hudson, J. L., & Rapee, R. M. (2001). Parent–child interactions and anxiety disorders: An
observational study. Behaviour research and therapy, 39(12), 1411-1427.
Huffman, L. C., Bryan, Y. E., Carmen, R., Pedersen, F. A., Doussard-Roosevelt, J. A., & Forges,
S. W. (1998). Infant temperament and cardiac vagal tone: Assessments at twelve weeks
of age. Child Development, 69(3), 624-635. doi:10.1111/j.1467-8624.1998.00624.x
Hurley, R. S. E., Losh, M., Parlier, M., Reznick, J. S., & Piven, J. (2007). The broad autism
phenotype questionnaire. Journal of Autism and Developmental Disorders, 37(9), 1679-
1690. doi:10.1007/s10803-006-0299-3
Ingersoll, B., & Hambrick, D. Z. (2011). The relationship between the broader autism phenotype,
child severity, and stress and depression in parents of children with autism spectrum
disorders. Research in Autism Spectrum Disorders, 5(1), 337-344.
doi:10.1016/j.rasd.2010.04.017
45
Jennings, J. R., Kamarck, T., Stewart, C., Eddy, M., & Johnson, P. (1992). Alternate
cardiovascular baseline assessment techniques: Vanilla or resting
baseline. Psychophysiology, 29(6), 742-750.
Johnston, C., & Mash, E. J. (1989). A measure of parenting satisfaction and efficacy. Journal of
clinical child psychology, 18(2), 167-175.
Jones, T. L., & Prinz, R. J. (2005). Potential roles of parental self-efficacy in parent and child
adjustment: A review. Clinical Psychology Review, 25, 341–363.
doi:10.1016/j.cpr.2004.12.004
Karst, J. S., & Van Hecke, A. V. (2012). Parent and family impact of autism spectrum disorders:
A review and proposed model for intervention evaluation. Clinical child and family
psychology review, 15(3), 247-277.
Kirschbaum, C., Pirke, K. M., & Hellhammer, D. H. (1993). The ‘Trier Social Stress Test’–a tool
for investigating psychobiological stress responses in a laboratory setting.
Neuropsychobiology, 28(1-2), 76-81.
Kreibig, S.D. (2010). Autonomic nervous system activity in emotion: A review. Biological
Psychology, 84, 394-421. doi: 10.1016/j.biopsycho.2010.03.010
Kudielka, B. M., Buske-Kirschbaum, A., Hellhammer, D. H., & Kirschbaum, C. (2004). HPA
axis responses to laboratory psychosocial stress in healthy elderly adults, younger adults,
and children: impact of age and gender. Psychoneuroendocrinology, 29(1), 83-98.
Kuhn, J. C., & Carter, A. S. (2006). Maternal self-efficacy and associated parenting cognitions
among mothers of children with autism. American Journal of Orthopsychiatry, 76(4),
564-575. doi:10.1037/0002-9432.76.4.564
46
Larson, M. R., Ader, R., & Moynihan, J. A. (2001). Heart rate, neuroendocrine, and
immunological reactivity in response to an acute laboratory stressor. Psychosomatic
Medicine, 63(3), 493-501.
Lecavalier, L., Leone, S., & Wiltz, J. (2006). The impact of behaviour problems on caregiver
stress in young people with autism spectrum disorders. Journal of Intellectual Disability
Research, 50(3), 172-183. doi:10.1111/j.1365-2788.2005.00732.x
Matthews, K. A., Manuck, S. B., & Saab, P. G. (1986). Cardiovascular responses of adolescents
during a naturally occurring stressor and their behavioral and psychophysiological
predictors. Psychophysiology, 23(2), 198-209.
McBride, B. A., Schoppe, S. J., & Rane, T. R. (2002). Child characteristics, parenting stress, and
parental involvement: Fathers versus mothers. Journal of Marriage and Family, 64(4),
998-1011.
Ohan, J. L., Leung, D. W., & Johnston, C. (2000). The parenting sense of competence scale:
Evidence of a stable factor structure and validity. Canadian Journal of Behavioural
Science, 32(4), 251.
Pakenham, K. I., Sofronoff, K., & Samios, C. (2004). Finding meaning in parenting a child with
asperger syndrome: Correlates of sense making and benefit finding. Research in
Developmental Disabilities, 25(3), 245-264. doi:10.1016/j.ridd.2003.06.003
Piven, J., Palmer, P., Jacobi, D., Childress, D., & Arndt, S. (1997). Broader autism phenotype:
Evidence from a family history study of multiple-incidence autism families. American
Journal of Psychiatry, 154(2), 185-190. doi:10.1176/ajp.154.2.18
47
Porges, S. W. (2001). The polyvagal theory: Phylogenetic substrates of a social nervous system.
International Journal of Psychophysiology, 42(2), 123-146. doi:10.1016/S0167-
8760(01)00162-3
Rao, P. A., & Beidel, D. C. (2009). The impact of children with high functioning autism on
parental stress, sibling adjustment, and family functioning. Behavior Modification, 33(4),
437–451.doi:10.1177/0145445509336427.
Rezendes, D. & Scarpa, A. (2011). Associations between parental anxiety/depression and child
behavior problems related to Autism Spectrum Disorders: The roles of parenting stress
and parenting self-efficacy. Autism Research and Treatment, 2011, 1-10; doi
10.1155/2011/395190.
Ryan, J. J., & Brown, K. I. (2005). Enhancing the clinical utility of the WASI: Reliabilities of
discrepancy scores and supplemental tables for profile analysis. Journal of
Psychoeducational Assessment, 23(2), 140-145. doi:10.1177/073428290502300203
Schlotz, W., Hammerfald, K., Ehlert, U., & Gaab, J. (2011). Individual differences in the cortisol
response to stress in young healthy men: Testing the roles of perceived stress reactivity
and threat appraisal using multiphase latent growth curve modeling. Biological
psychology, 87(2), 257-264.
Schlotz, W., Yim, I. S., Zoccola, P. M., Jansen, L., & Schulz, P. (2011). The perceived stress
reactivity scale: Measurement invariance, stability, and validity in three countries.
Psychological assessment, 23(1), 80.
Schulz, P., Jansen, L. J., & Schlotz, W. (2005). Stressreaktivitat: Theoretisches Konzept and
Messung [Stress reactivity: Theoretical concept and measurement]. Diagnostica, 51, 124-
133.
48
Smith, T. W., & Allred, K. D. (1989). Blood-pressure responses during social interaction in high-
and low-cynically hostile males. Journal of Behavioral Medicine, 12(2), 135-143.
Sofronoff, K., & Farbotko, M. (2002). The effectiveness of parent management training to
increase self-efficacy in parents of children with asperger syndrome. Autism, 6(3), 271-
286. doi:10.1177/1362361302006003005
Tehee, E., Honan, R., & Hevey, D. (2009). Factors contributing to stress in parents of individuals
with autistic spectrum disorders. Journal of Applied Research in Intellectual Disabilities,
22(1), 34-42. doi:10.1111/j.1468-3148.2008.00437.x
Thayer, J. F., & Lane, R. D. (2000). A model of neurovisceral integration in emotion regulation
and dysregulation. Journal of Affective Disorders, 61(3), 201-216. doi:10.1016/S0165-
0327(00)00338-4
The Theraplay Institute. (2005). Marschak Interaction Method: A structured observational
technique to assess the quality and nature of the parent-child relationship. Wilmette, IL:
Author.
Vancouver, J. B., Thompson, C. M., Tischner, E. C., & Putka, D. J. (2002). Two studies
examining the negative effect of self-efficacy on performance. Journal of Applied
Psychology, 87(3), 506.
Wechsler, D. (2011). Wechsler Abbreviated Scale of Intelligence, Second Edition (WASI-II). San
Antonio,TX: NCS Pearson.
Young, E. A., & Breslau, N. (2004). Saliva cortisol in posttraumatic stress disorder: a
community epidemiologic study. Biological Psychiatry, 56(3), 205-209.
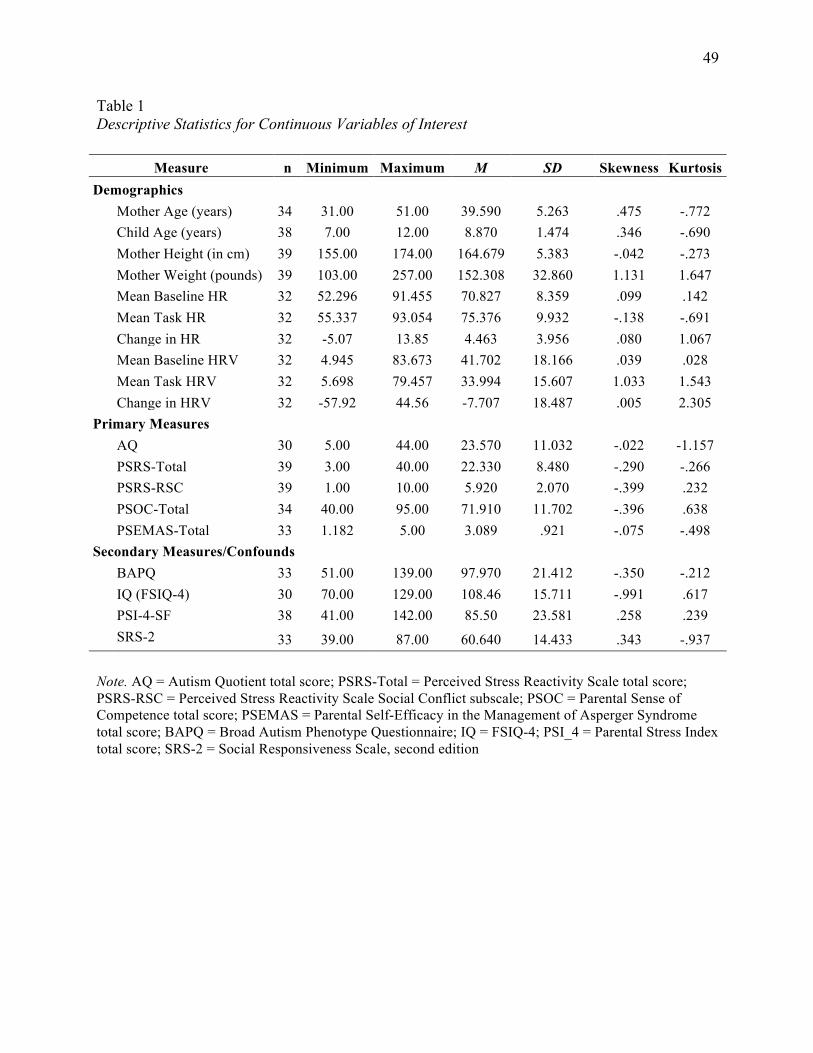
49
Table 1 Descriptive Statistics for Continuous Variables of Interest
Note. AQ = Autism Quotient total score; PSRS-Total = Perceived Stress Reactivity Scale total score; PSRS-RSC = Perceived Stress Reactivity Scale Social Conflict subscale; PSOC = Parental Sense of Competence total score; PSEMAS = Parental Self-Efficacy in the Management of Asperger Syndrome total score; BAPQ = Broad Autism Phenotype Questionnaire; IQ = FSIQ-4; PSI_4 = Parental Stress Index total score; SRS-2 = Social Responsiveness Scale, second edition
Measure n Minimum Maximum M SD Skewness Kurtosis Demographics Mother Age (years) 34 31.00 51.00 39.590 5.263 .475 -.772 Child Age (years) 38 7.00 12.00 8.870 1.474 .346 -.690 Mother Height (in cm) 39 155.00 174.00 164.679 5.383 -.042 -.273 Mother Weight (pounds) 39 103.00 257.00 152.308 32.860 1.131 1.647 Mean Baseline HR 32 52.296 91.455 70.827 8.359 .099 .142 Mean Task HR 32 55.337 93.054 75.376 9.932 -.138 -.691 Change in HR 32 -5.07 13.85 4.463 3.956 .080 1.067 Mean Baseline HRV 32 4.945 83.673 41.702 18.166 .039 .028 Mean Task HRV 32 5.698 79.457 33.994 15.607 1.033 1.543 Change in HRV 32 -57.92 44.56 -7.707 18.487 .005 2.305 Primary Measures AQ 30 5.00 44.00 23.570 11.032 -.022 -1.157 PSRS-Total 39 3.00 40.00 22.330 8.480 -.290 -.266 PSRS-RSC 39 1.00 10.00 5.920 2.070 -.399 .232 PSOC-Total 34 40.00 95.00 71.910 11.702 -.396 .638 PSEMAS-Total 33 1.182 5.00 3.089 .921 -.075 -.498 Secondary Measures/Confounds BAPQ 33 51.00 139.00 97.970 21.412 -.350 -.212 IQ (FSIQ-4) 30 70.00 129.00 108.46 15.711 -.991 .617 PSI-4-SF 38 41.00 142.00 85.50 23.581 .258 .239 SRS-2 33 39.00 87.00 60.640 14.433 .343 -.937
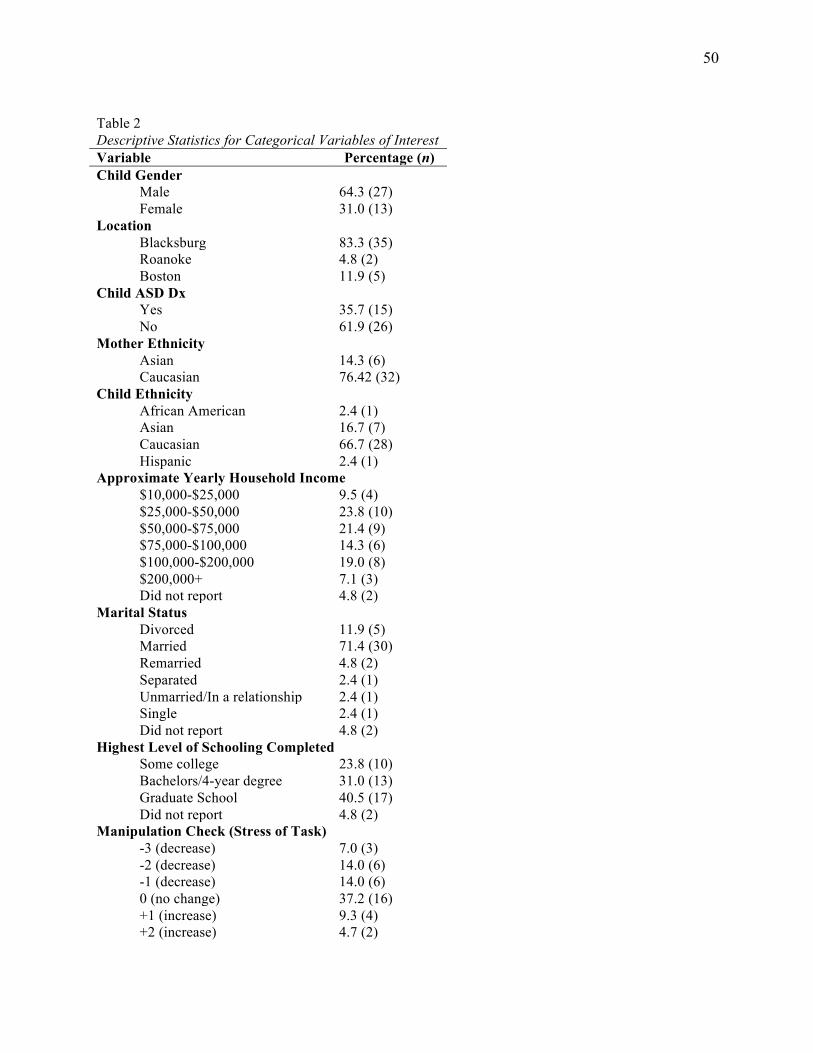
50
Table 2 Descriptive Statistics for Categorical Variables of Interest Variable Percentage (n) Child Gender Male 64.3 (27) Female 31.0 (13) Location Blacksburg 83.3 (35) Roanoke 4.8 (2) Boston 11.9 (5) Child ASD Dx Yes 35.7 (15) No 61.9 (26) Mother Ethnicity Asian 14.3 (6) Caucasian 76.42 (32) Child Ethnicity African American 2.4 (1) Asian 16.7 (7) Caucasian 66.7 (28) Hispanic 2.4 (1) Approximate Yearly Household Income $10,000-$25,000 9.5 (4) $25,000-$50,000 23.8 (10) $50,000-$75,000 21.4 (9) $75,000-$100,000 14.3 (6) $100,000-$200,000 19.0 (8) $200,000+ 7.1 (3) Did not report 4.8 (2) Marital Status Divorced 11.9 (5) Married 71.4 (30) Remarried 4.8 (2) Separated 2.4 (1) Unmarried/In a relationship 2.4 (1) Single 2.4 (1) Did not report 4.8 (2) Highest Level of Schooling Completed Some college 23.8 (10) Bachelors/4-year degree 31.0 (13) Graduate School 40.5 (17) Did not report 4.8 (2) Manipulation Check (Stress of Task) -3 (decrease) 7.0 (3) -2 (decrease) 14.0 (6) -1 (decrease) 14.0 (6) 0 (no change) 37.2 (16) +1 (increase) 9.3 (4) +2 (increase) 4.7 (2)
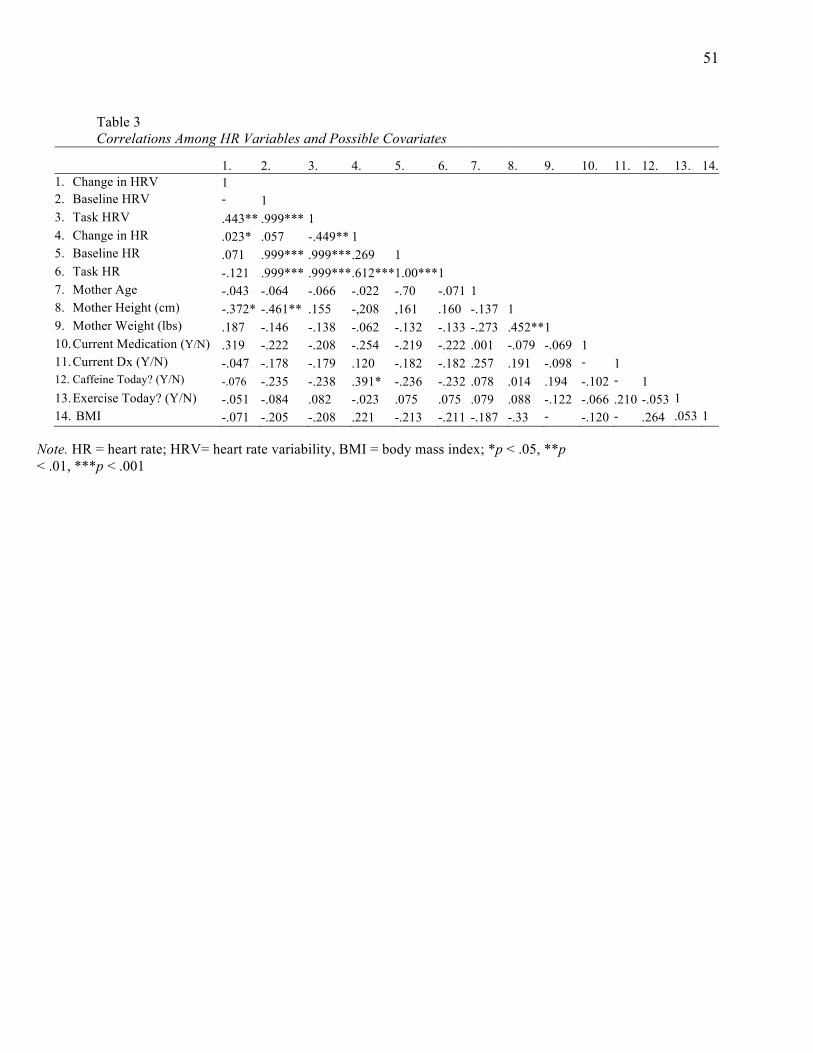
51
Table 3 Correlations Among HR Variables and Possible Covariates
1. 2. 3. 4. 5. 6. 7. 8. 9. 10. 11. 12. 13. 14. 1. Change in HRV 1 2. Baseline HRV -
.638*** 1
3. Task HRV .443** .999*** 1 4. Change in HR .023* .057 -.449** 1 5. Baseline HR .071 .999*** .999*** .269 1 6. Task HR -.121 .999*** .999*** .612*** 1.00*** 1 7. Mother Age -.043 -.064 -.066 -.022 -.70 -.071 1 8. Mother Height (cm) -.372* -.461** .155 -,208 ,161 .160 -.137 1 9. Mother Weight (lbs) .187 -.146 -.138 -.062 -.132 -.133 -.273 .452** 1 10. Current Medication (Y/N) .319 -.222 -.208 -.254 -.219 -.222 .001 -.079 -.069 1 11. Current Dx (Y/N) -.047 -.178 -.179 .120 -.182 -.182 .257 .191 -.098 -
.352* 1
12. Caffeine Today? (Y/N) -.076 -.235 -.238 .391* -.236 -.232 .078 .014 .194 -.102 -.173
1 13. Exercise Today? (Y/N) -.051 -.084 .082 -.023 .075 .075 .079 .088 -.122 -.066 .210 -.053 1 14. BMI -.071 -.205 -.208 .221 -.213 -.211 -.187 -.33 -
.444** -.120 -
.143 .264 .053 1
Note. HR = heart rate; HRV= heart rate variability, BMI = body mass index; *p < .05, **p < .01, ***p < .001
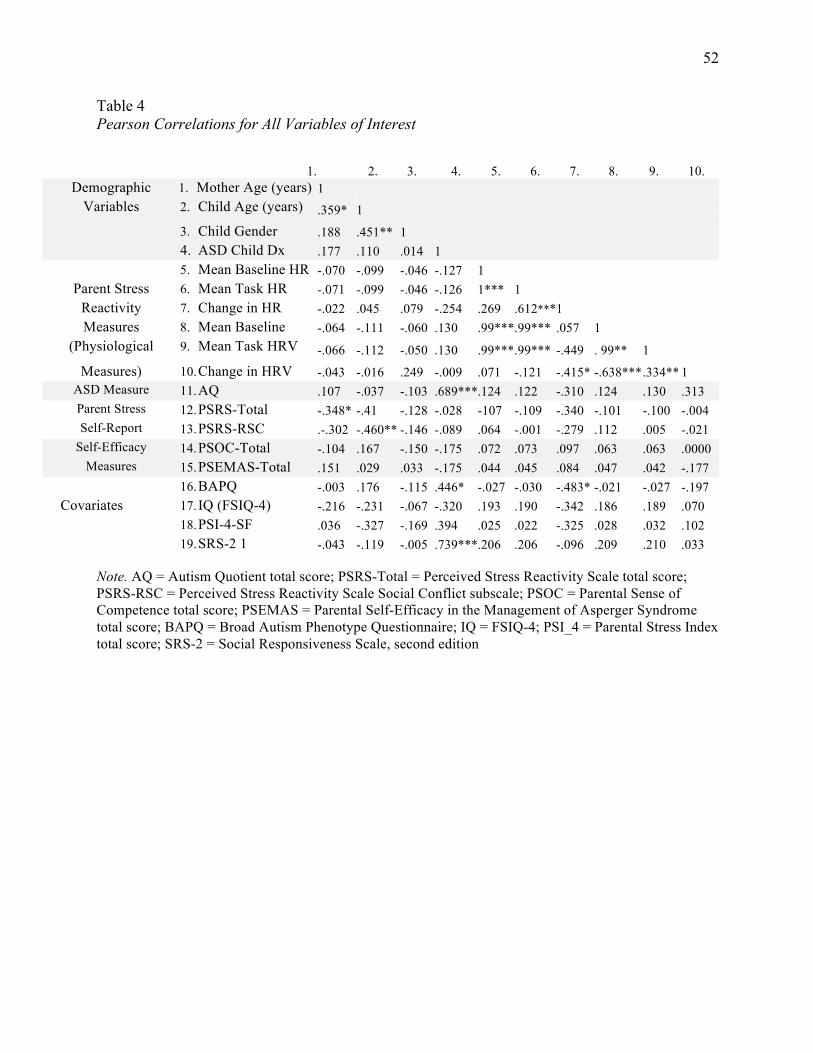
52
Table 4 Pearson Correlations for All Variables of Interest
1. 2. 3. 4. 5. 6. 7. 8. 9. 10.
Demographic 1. Mother Age (years) 1 Variables 2. Child Age (years) .359* 1
3. Child Gender .188 .451** 1 4. ASD Child Dx .177 .110 .014 1 5. Mean Baseline HR -.070 -.099 -.046 -.127 1
Parent Stress 6. Mean Task HR -.071 -.099 -.046 -.126 1*** 1 Reactivity 7. Change in HR -.022 .045 .079 -.254 .269 .612*** 1 Measures 8. Mean Baseline
HRV -.064 -.111 -.060 .130 .99*** .99*** .057 1
(Physiological 9. Mean Task HRV -.066 -.112 -.050 .130 .99*** .99*** -.449 . 99** 1 Measures) 10. Change in HRV -.043 -.016 .249 -.009 .071 -.121 -.415* -.638*** .334** 1
ASD Measure 11. AQ .107 -.037 -.103 .689*** .124 .122 -.310 .124 .130 .313 Parent Stress 12. PSRS-Total -.348* -.41 -.128 -.028 -107 -.109 -.340 -.101 -.100 -.004 Self-Report 13. PSRS-RSC .-.302 -.460** -.146 -.089 .064 -.001 -.279 .112 .005 -.021
Self-Efficacy 14. PSOC-Total -.104 .167 -.150 -.175 .072 .073 .097 .063 .063 .0000 Measures 15. PSEMAS-Total .151 .029 .033 -.175 .044 .045 .084 .047 .042 -.177
16. BAPQ -.003 .176 -.115 .446* -.027 -.030 -.483* -.021 -.027 -.197 Covariates 17. IQ (FSIQ-4) -.216 -.231 -.067 -.320 .193 .190 -.342 .186 .189 .070
18. PSI-4-SF .036 -.327 -.169 .394 .025 .022 -.325 .028 .032 .102 19. SRS-2 1 -.043 -.119 -.005 .739*** .206 .206 -.096 .209 .210 .033
Note. AQ = Autism Quotient total score; PSRS-Total = Perceived Stress Reactivity Scale total score; PSRS-RSC = Perceived Stress Reactivity Scale Social Conflict subscale; PSOC = Parental Sense of Competence total score; PSEMAS = Parental Self-Efficacy in the Management of Asperger Syndrome total score; BAPQ = Broad Autism Phenotype Questionnaire; IQ = FSIQ-4; PSI_4 = Parental Stress Index total score; SRS-2 = Social Responsiveness Scale, second edition
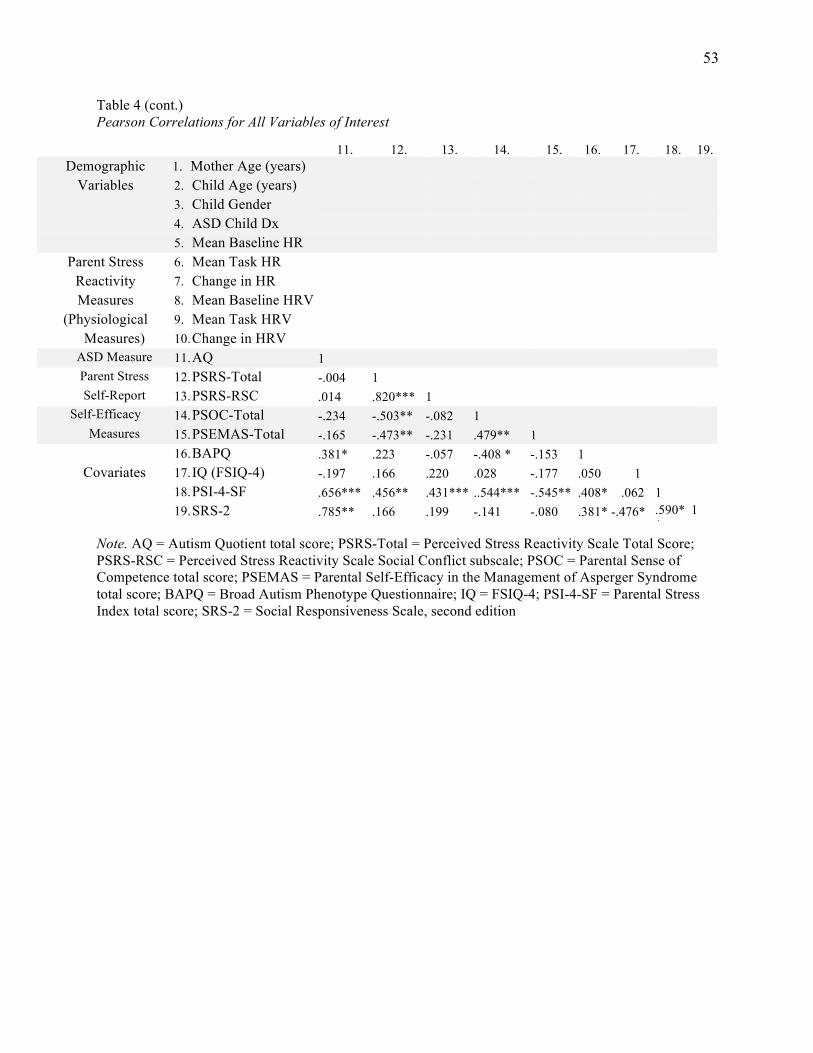
53
Table 4 (cont.) Pearson Correlations for All Variables of Interest
11. 12. 13. 14. 15. 16. 17. 18. 19.
Demographic 1. Mother Age (years) Variables 2. Child Age (years)
3. Child Gender 4. ASD Child Dx 5. Mean Baseline HR
Parent Stress 6. Mean Task HR Reactivity 7. Change in HR Measures 8. Mean Baseline HRV
(Physiological 9. Mean Task HRV Measures) 10. Change in HRV
ASD Measure 11. AQ 1 Parent Stress 12. PSRS-Total -.004 1 Self-Report 13. PSRS-RSC .014 .820*** 1
Self-Efficacy 14. PSOC-Total -.234 -.503** -.082 1 Measures 15. PSEMAS-Total -.165 -.473** -.231 .479** 1
16. BAPQ .381* .223 -.057 -.408 * -.153 1 Covariates 17. IQ (FSIQ-4) -.197 .166 .220 .028 -.177 .050 1
18. PSI-4-SF .656*** .456** .431*** ..544*** -.545** .408* .062 1 19. SRS-2 .785** .166 .199 -.141 -.080 .381* -.476* .590*
* 1
Note. AQ = Autism Quotient total score; PSRS-Total = Perceived Stress Reactivity Scale Total Score; PSRS-RSC = Perceived Stress Reactivity Scale Social Conflict subscale; PSOC = Parental Sense of Competence total score; PSEMAS = Parental Self-Efficacy in the Management of Asperger Syndrome total score; BAPQ = Broad Autism Phenotype Questionnaire; IQ = FSIQ-4; PSI-4-SF = Parental Stress Index total score; SRS-2 = Social Responsiveness Scale, second edition

54
Table 5 Autism Traits and Self-Report Stress, Moderated by Parental Self-Efficacy (PSOC) (N=27) Variable B SE Beta R2 Change F Change Outcome: PSRS-RSC Step 1 .284 4.569* BAPQ .019 .016 .222 Child Age -.589 -.506** Step 2 .029 .449 BAPQ .028 .020 .332 Child Age -.619 .218 -.531** AQ -.029 .031 -.192 PSOC .003 .033 .022 Step 3 .000 .001 BAPQ .029 .022 .335 Child Age -.621 .236 -.533* AQ -.029 .033 -.195 PSOC -.003 .034 .023 AQ-TotalxPSOC .000 .004 -.006
Note. AQ = Autism Quotient total score; PSRS-RSC = Perceived Stress Reactivity Scale Social Conflict subscale; PSOC = Parental Sense of Competence total score; BAPQ = Broad Autism Phenotype Questionnaire ; *p < .05, **p < .01, ***p < .001
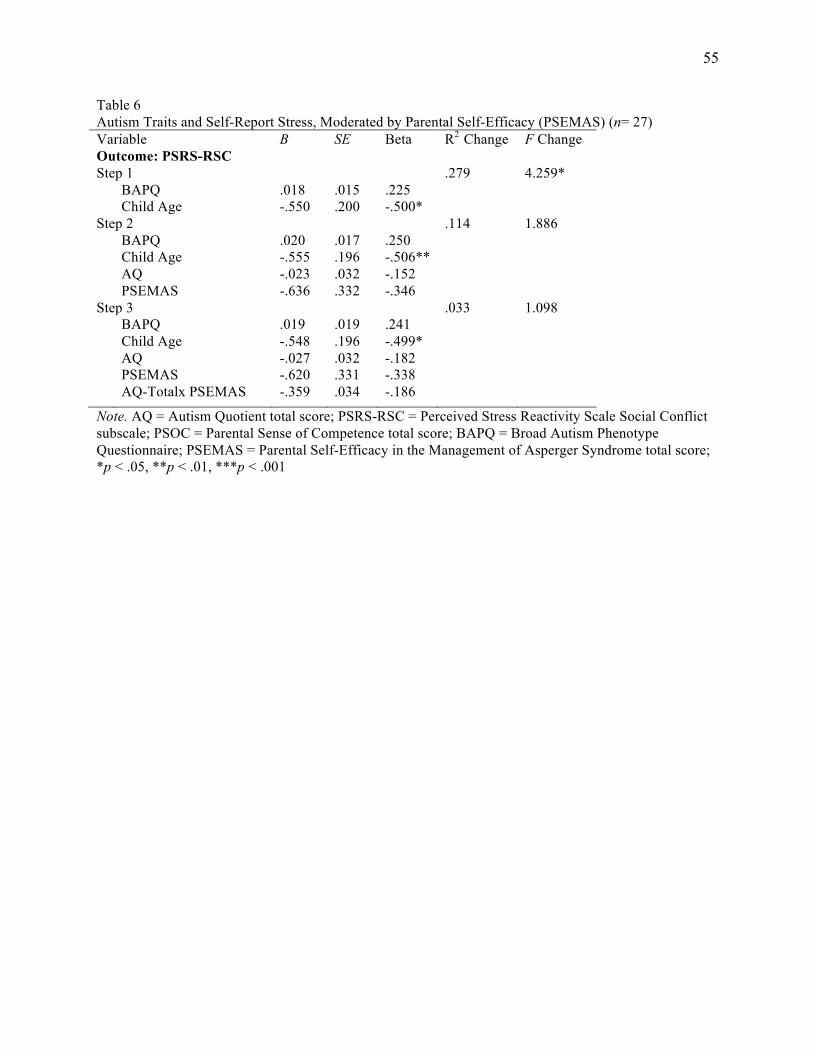
55
Table 6 Autism Traits and Self-Report Stress, Moderated by Parental Self-Efficacy (PSEMAS) (n= 27) Variable B SE Beta R2 Change F Change Outcome: PSRS-RSC Step 1 .279 4.259* BAPQ .018 .015 .225 Child Age -.550 .200 -.500* Step 2 .114 1.886 BAPQ .020 .017 .250 Child Age -.555 .196 -.506** AQ -.023 .032 -.152 PSEMAS -.636 .332 -.346 Step 3 .033 1.098 BAPQ .019 .019 .241 Child Age -.548 .196 -.499* AQ -.027 .032 -.182 PSEMAS -.620 .331 -.338 AQ-Totalx PSEMAS -.359 .034 -.186
Note. AQ = Autism Quotient total score; PSRS-RSC = Perceived Stress Reactivity Scale Social Conflict subscale; PSOC = Parental Sense of Competence total score; BAPQ = Broad Autism Phenotype Questionnaire; PSEMAS = Parental Self-Efficacy in the Management of Asperger Syndrome total score; *p < .05, **p < .01, ***p < .001
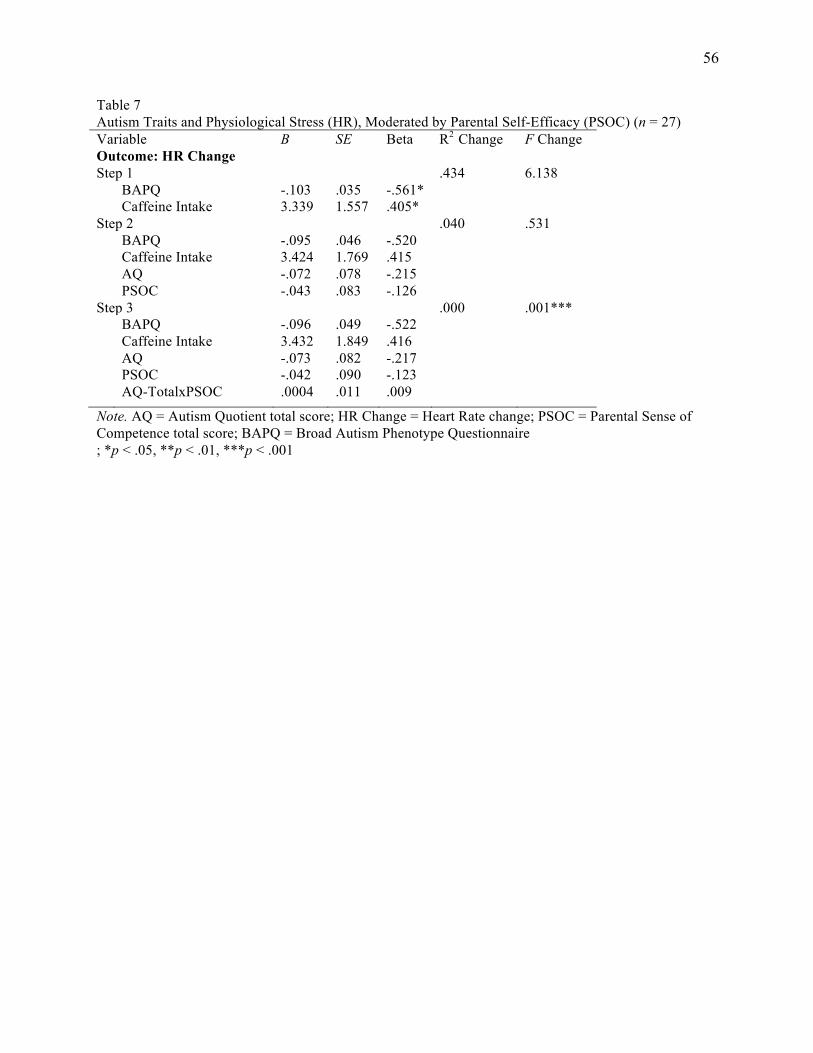
56
Table 7 Autism Traits and Physiological Stress (HR), Moderated by Parental Self-Efficacy (PSOC) (n = 27) Variable B SE Beta R2 Change F Change Outcome: HR Change Step 1 .434 6.138 BAPQ -.103 .035 -.561* Caffeine Intake 3.339 1.557 .405* Step 2 .040 .531 BAPQ -.095 .046 -.520 Caffeine Intake 3.424 1.769 .415 AQ -.072 .078 -.215 PSOC -.043 .083 -.126 Step 3 .000 .001*** BAPQ -.096 .049 -.522 Caffeine Intake 3.432 1.849 .416 AQ -.073 .082 -.217 PSOC -.042 .090 -.123 AQ-TotalxPSOC .0004 .011 .009
Note. AQ = Autism Quotient total score; HR Change = Heart Rate change; PSOC = Parental Sense of Competence total score; BAPQ = Broad Autism Phenotype Questionnaire ; *p < .05, **p < .01, ***p < .001
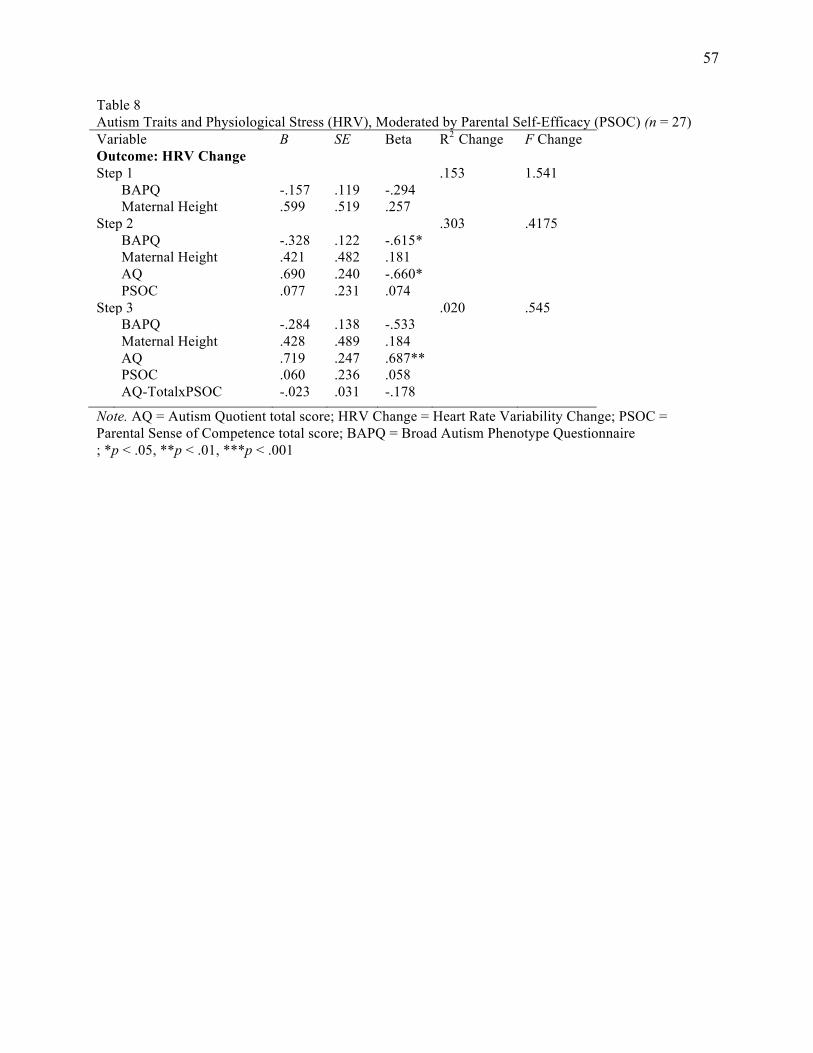
57
Table 8 Autism Traits and Physiological Stress (HRV), Moderated by Parental Self-Efficacy (PSOC) (n = 27) Variable B SE Beta R2 Change F Change Outcome: HRV Change Step 1 .153 1.541 BAPQ -.157 .119 -.294 Maternal Height .599 .519 .257 Step 2 .303 .4175 BAPQ -.328 .122 -.615* Maternal Height .421 .482 .181 AQ .690 .240 -.660* PSOC .077 .231 .074 Step 3 .020 .545 BAPQ -.284 .138 -.533 Maternal Height .428 .489 .184 AQ .719 .247 .687** PSOC .060 .236 .058 AQ-TotalxPSOC -.023 .031 -.178
Note. AQ = Autism Quotient total score; HRV Change = Heart Rate Variability Change; PSOC = Parental Sense of Competence total score; BAPQ = Broad Autism Phenotype Questionnaire ; *p < .05, **p < .01, ***p < .001
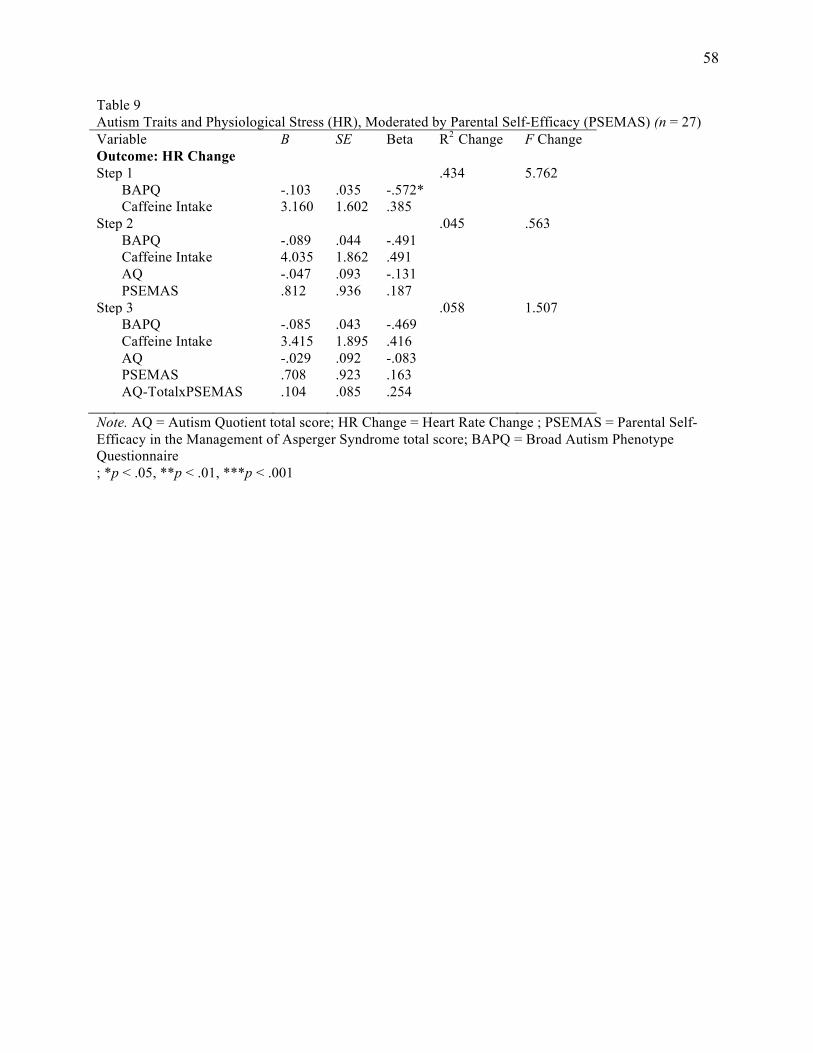
58
Table 9 Autism Traits and Physiological Stress (HR), Moderated by Parental Self-Efficacy (PSEMAS) (n = 27) Variable B SE Beta R2 Change F Change Outcome: HR Change Step 1 .434 5.762 BAPQ -.103 .035 -.572* Caffeine Intake 3.160 1.602 .385 Step 2 .045 .563 BAPQ -.089 .044 -.491 Caffeine Intake 4.035 1.862 .491 AQ -.047 .093 -.131 PSEMAS .812 .936 .187 Step 3 .058 1.507 BAPQ -.085 .043 -.469 Caffeine Intake 3.415 1.895 .416 AQ -.029 .092 -.083 PSEMAS .708 .923 .163 AQ-TotalxPSEMAS .104 .085 .254
Note. AQ = Autism Quotient total score; HR Change = Heart Rate Change ; PSEMAS = Parental Self-Efficacy in the Management of Asperger Syndrome total score; BAPQ = Broad Autism Phenotype Questionnaire ; *p < .05, **p < .01, ***p < .001
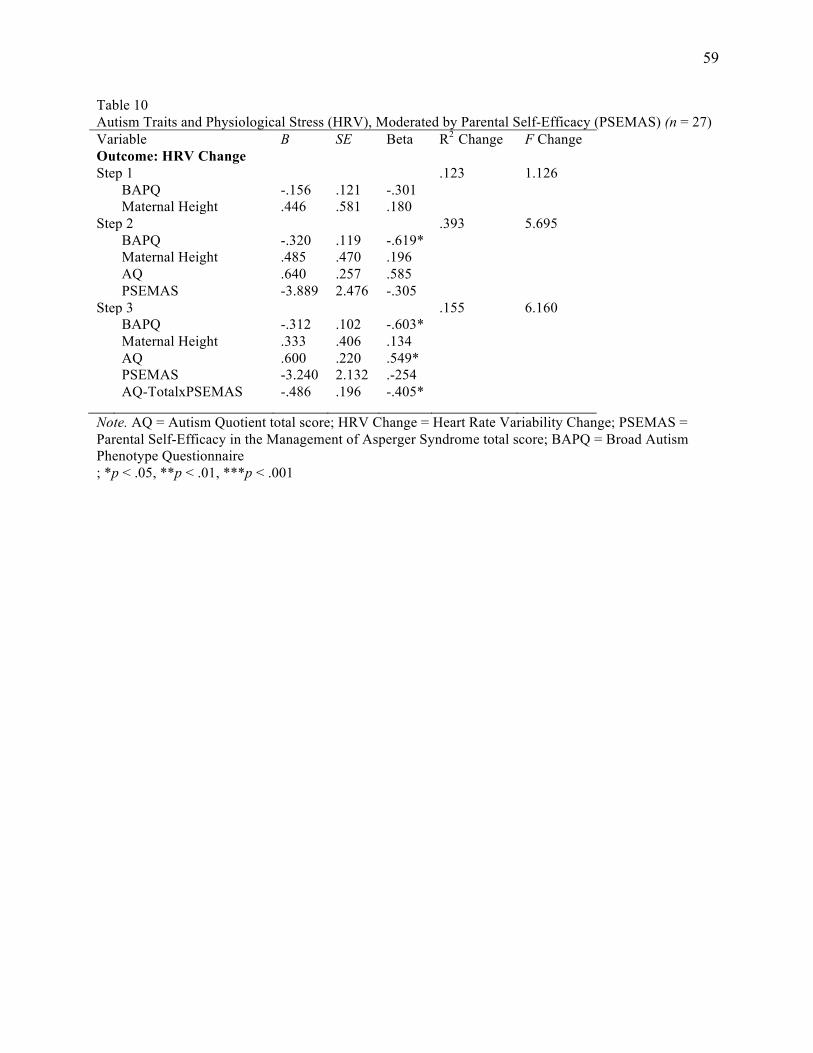
59
Table 10 Autism Traits and Physiological Stress (HRV), Moderated by Parental Self-Efficacy (PSEMAS) (n = 27) Variable B SE Beta R2 Change F Change Outcome: HRV Change Step 1 .123 1.126 BAPQ -.156 .121 -.301 Maternal Height .446 .581 .180 Step 2 .393 5.695 BAPQ -.320 .119 -.619* Maternal Height .485 .470 .196 AQ .640 .257 .585 PSEMAS -3.889 2.476 -.305 Step 3 .155 6.160 BAPQ -.312 .102 -.603* Maternal Height .333 .406 .134 AQ .600 .220 .549* PSEMAS -3.240 2.132 .-254 AQ-TotalxPSEMAS -.486 .196 -.405*
Note. AQ = Autism Quotient total score; HRV Change = Heart Rate Variability Change; PSEMAS = Parental Self-Efficacy in the Management of Asperger Syndrome total score; BAPQ = Broad Autism Phenotype Questionnaire ; *p < .05, **p < .01, ***p < .001
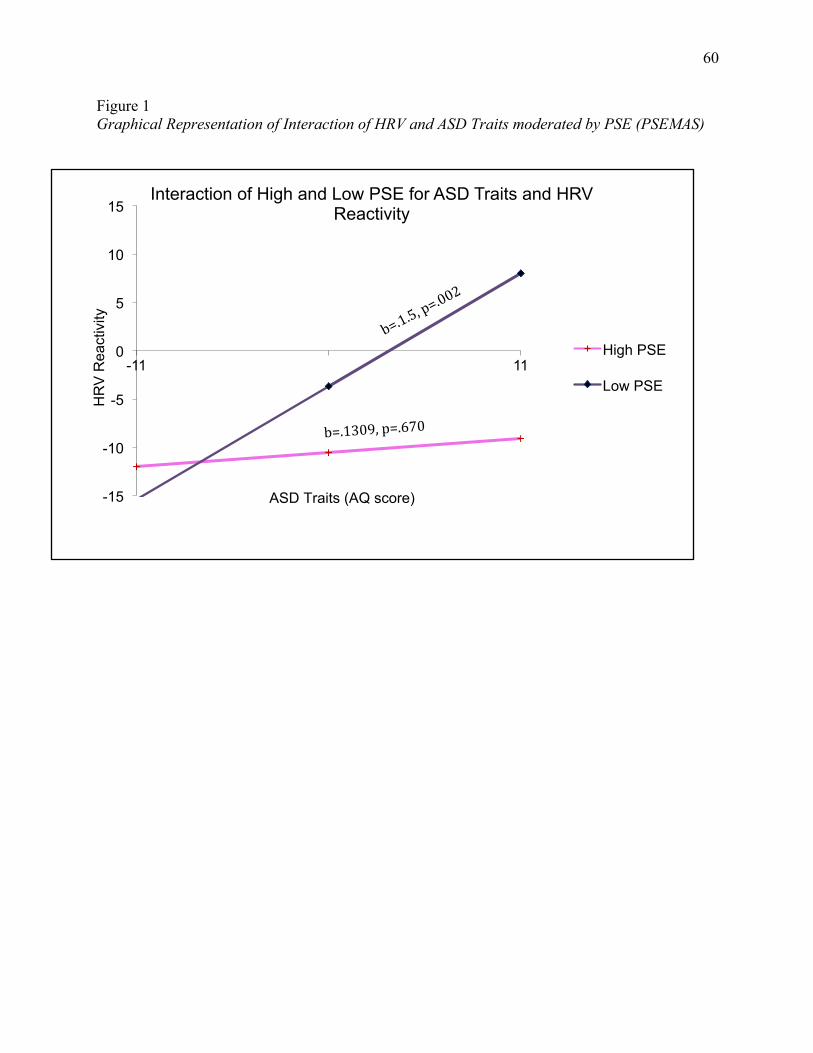
60
Figure 1 Graphical Representation of Interaction of HRV and ASD Traits moderated by PSE (PSEMAS)
-15
-10
-5
0
5
10
15
-11 11
HR
V R
eact
ivity
Interaction of High and Low PSE for ASD Traits and HRV Reactivity
High PSE
Low PSE
ASD Traits (AQ score)
b=.1309,p=.670
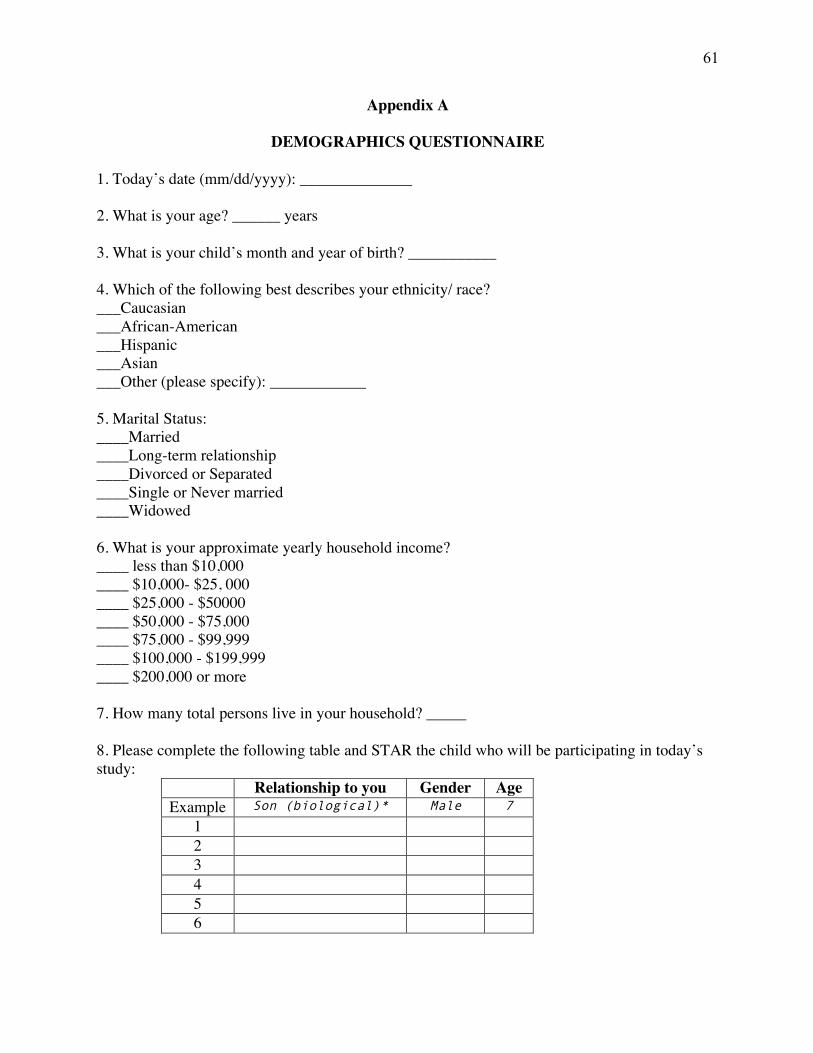
61
Appendix A
DEMOGRAPHICS QUESTIONNAIRE
1. Today’s date (mm/dd/yyyy): ______________ 2. What is your age? ______ years 3. What is your child’s month and year of birth? ___________ 4. Which of the following best describes your ethnicity/ race? ___Caucasian ___African-American ___Hispanic ___Asian ___Other (please specify): ____________ 5. Marital Status: ____Married ____Long-term relationship ____Divorced or Separated ____Single or Never married ____Widowed 6. What is your approximate yearly household income? ____ less than $10,000 ____ $10,000- $25, 000 ____ $25,000 - $50000 ____ $50,000 - $75,000 ____ $75,000 - $99,999 ____ $100,000 - $199,999 ____ $200,000 or more 7. How many total persons live in your household? _____
8. Please complete the following table and STAR the child who will be participating in today’s study:
Relationship to you Gender Age Example Son (biological)* Male 7
1 2 3 4 5 6
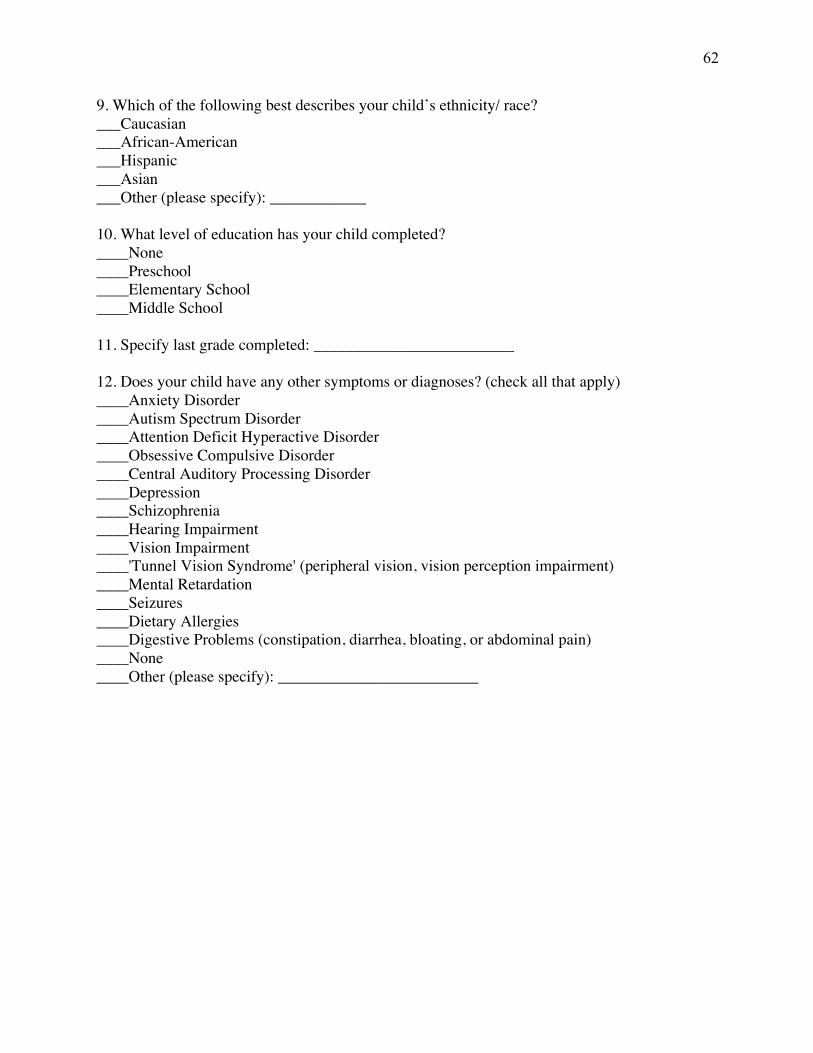
62
9. Which of the following best describes your child’s ethnicity/ race? ___Caucasian ___African-American ___Hispanic ___Asian ___Other (please specify): ____________ 10. What level of education has your child completed? ____None ____Preschool ____Elementary School ____Middle School 11. Specify last grade completed: _________________________ 12. Does your child have any other symptoms or diagnoses? (check all that apply) ____Anxiety Disorder ____Autism Spectrum Disorder ____Attention Deficit Hyperactive Disorder ____Obsessive Compulsive Disorder ____Central Auditory Processing Disorder ____Depression ____Schizophrenia ____Hearing Impairment ____Vision Impairment ____'Tunnel Vision Syndrome' (peripheral vision, vision perception impairment) ____Mental Retardation ____Seizures ____Dietary Allergies ____Digestive Problems (constipation, diarrhea, bloating, or abdominal pain) ____None ____Other (please specify): _________________________
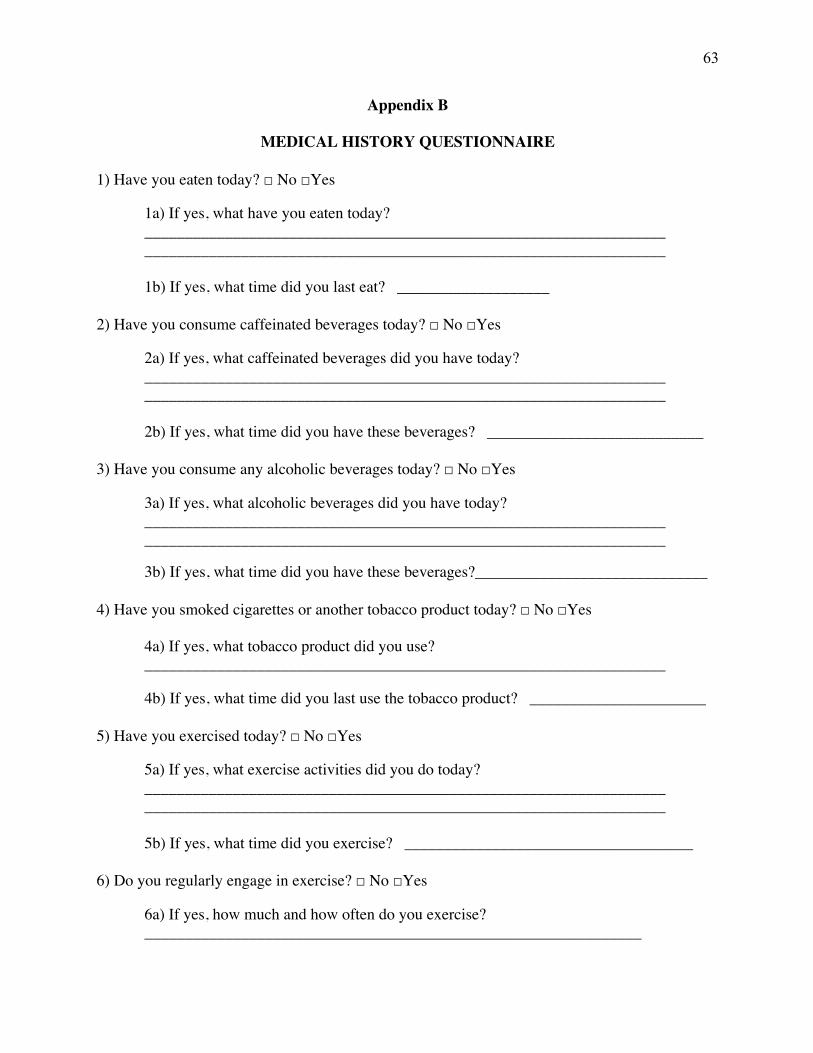
63
Appendix B
MEDICAL HISTORY QUESTIONNAIRE
1) Have you eaten today? □ No □Yes
1a) If yes, what have you eaten today? _________________________________________________________________ _________________________________________________________________
1b) If yes, what time did you last eat? ___________________
2) Have you consume caffeinated beverages today? □ No □Yes
2a) If yes, what caffeinated beverages did you have today? _________________________________________________________________ _________________________________________________________________
2b) If yes, what time did you have these beverages? ___________________________
3) Have you consume any alcoholic beverages today? □ No □Yes
3a) If yes, what alcoholic beverages did you have today? _________________________________________________________________ _________________________________________________________________
3b) If yes, what time did you have these beverages?_____________________________
4) Have you smoked cigarettes or another tobacco product today? □ No □Yes
4a) If yes, what tobacco product did you use? _________________________________________________________________
4b) If yes, what time did you last use the tobacco product? ______________________
5) Have you exercised today? □ No □Yes
5a) If yes, what exercise activities did you do today? _________________________________________________________________ _________________________________________________________________
5b) If yes, what time did you exercise? ____________________________________
6) Do you regularly engage in exercise? □ No □Yes
6a) If yes, how much and how often do you exercise? ______________________________________________________________
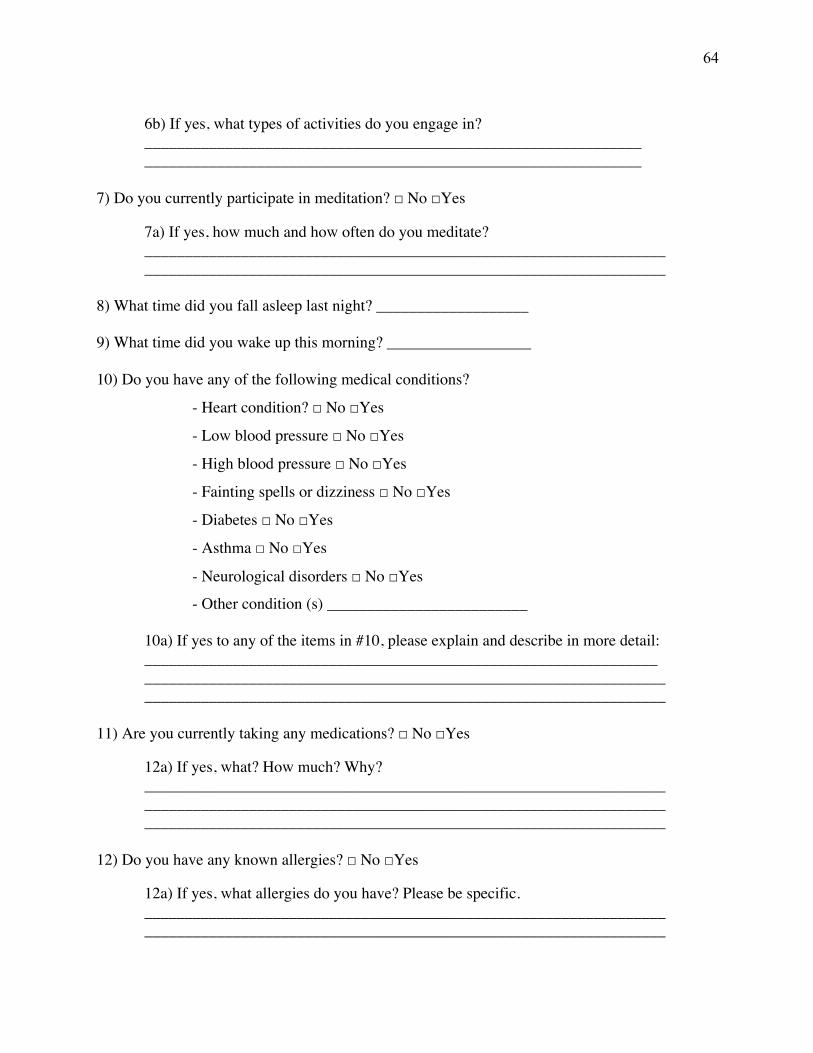
64
6b) If yes, what types of activities do you engage in? ______________________________________________________________ ______________________________________________________________
7) Do you currently participate in meditation? □ No □Yes 7a) If yes, how much and how often do you meditate?
_________________________________________________________________ _________________________________________________________________
8) What time did you fall asleep last night? ___________________ 9) What time did you wake up this morning? __________________ 10) Do you have any of the following medical conditions?
- Heart condition? □ No □Yes
- Low blood pressure □ No □Yes
- High blood pressure □ No □Yes
- Fainting spells or dizziness □ No □Yes
- Diabetes □ No □Yes
- Asthma □ No □Yes
- Neurological disorders □ No □Yes
- Other condition (s) _________________________
10a) If yes to any of the items in #10, please explain and describe in more detail: ________________________________________________________________ _________________________________________________________________ _________________________________________________________________
11) Are you currently taking any medications? □ No □Yes
12a) If yes, what? How much? Why? _________________________________________________________________ _________________________________________________________________ _________________________________________________________________
12) Do you have any known allergies? □ No □Yes
12a) If yes, what allergies do you have? Please be specific. _________________________________________________________________ _________________________________________________________________
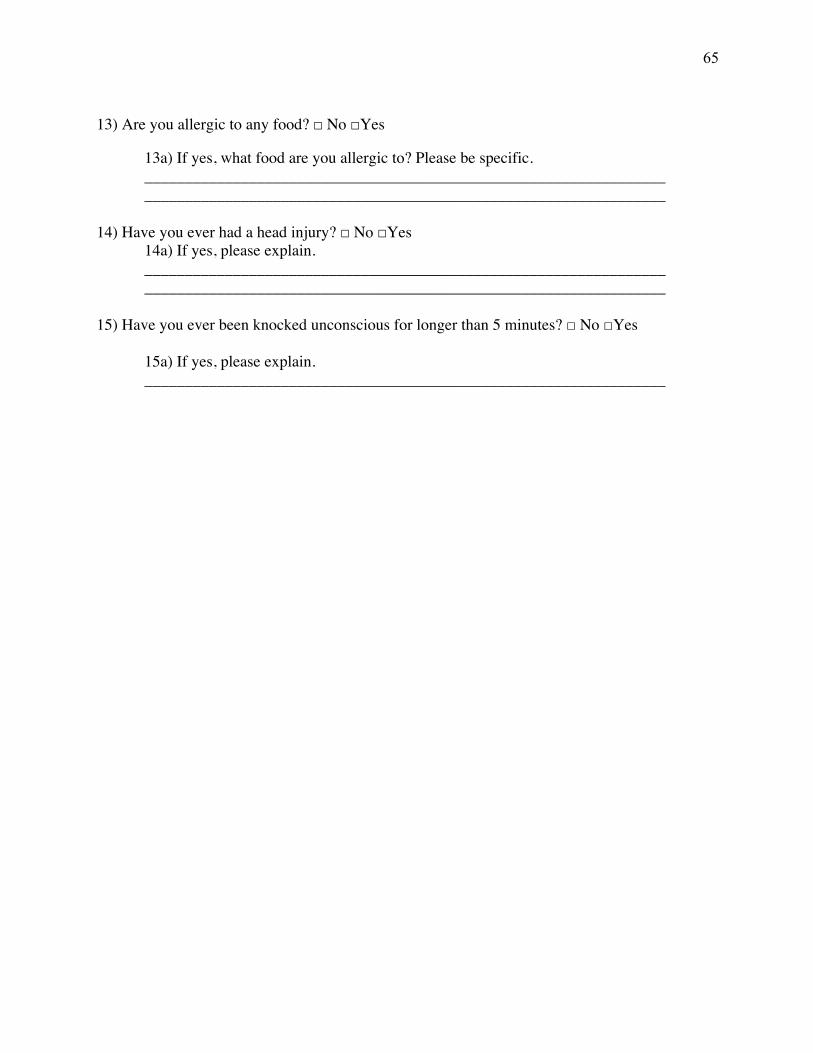
65
13) Are you allergic to any food? □ No □Yes
13a) If yes, what food are you allergic to? Please be specific. _________________________________________________________________ _________________________________________________________________
14) Have you ever had a head injury? □ No □Yes
14a) If yes, please explain. _________________________________________________________________ _________________________________________________________________
15) Have you ever been knocked unconscious for longer than 5 minutes? □ No □Yes
15a) If yes, please explain. _________________________________________________________________
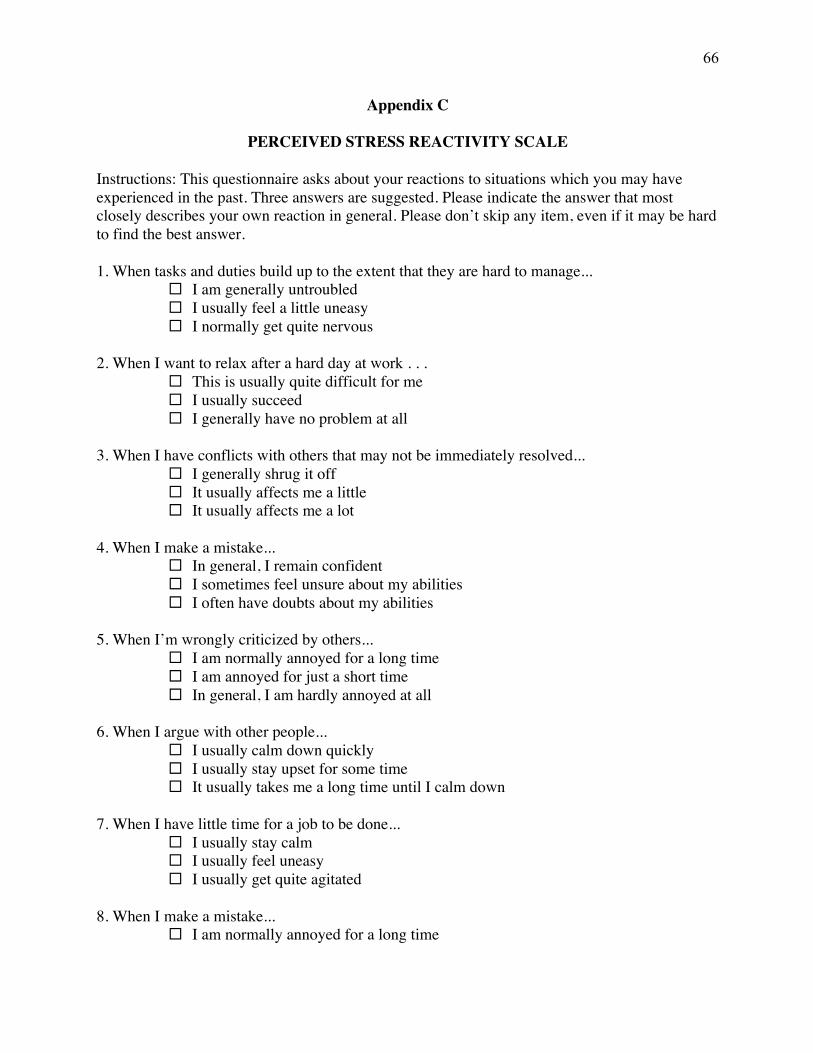
66
Appendix C
PERCEIVED STRESS REACTIVITY SCALE Instructions: This questionnaire asks about your reactions to situations which you may have experienced in the past. Three answers are suggested. Please indicate the answer that most closely describes your own reaction in general. Please don’t skip any item, even if it may be hard to find the best answer. 1. When tasks and duties build up to the extent that they are hard to manage...
¨ I am generally untroubled ¨ I usually feel a little uneasy ¨ I normally get quite nervous
2. When I want to relax after a hard day at work . . .
¨ This is usually quite difficult for me ¨ I usually succeed ¨ I generally have no problem at all
3. When I have conflicts with others that may not be immediately resolved...
¨ I generally shrug it off ¨ It usually affects me a little ¨ It usually affects me a lot
4. When I make a mistake...
¨ In general, I remain confident ¨ I sometimes feel unsure about my abilities ¨ I often have doubts about my abilities
5. When I’m wrongly criticized by others...
¨ I am normally annoyed for a long time ¨ I am annoyed for just a short time ¨ In general, I am hardly annoyed at all
6. When I argue with other people...
¨ I usually calm down quickly ¨ I usually stay upset for some time ¨ It usually takes me a long time until I calm down
7. When I have little time for a job to be done...
¨ I usually stay calm ¨ I usually feel uneasy ¨ I usually get quite agitated
8. When I make a mistake...
¨ I am normally annoyed for a long time
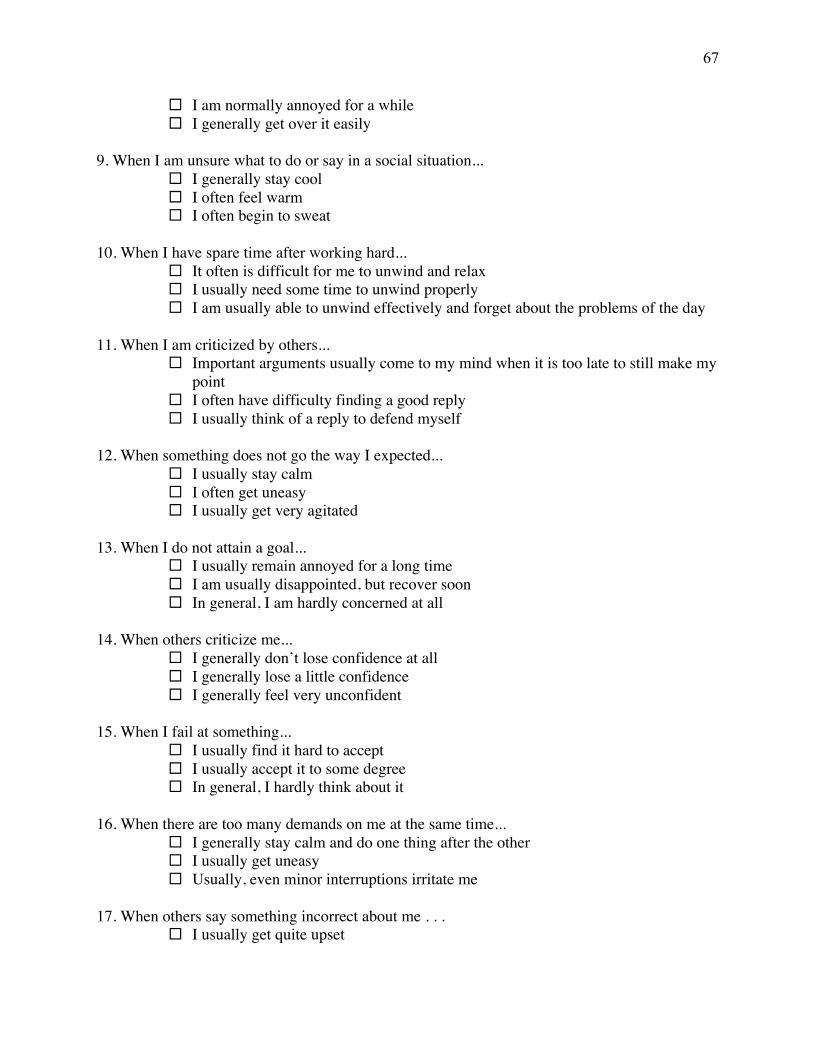
67
¨ I am normally annoyed for a while ¨ I generally get over it easily
9. When I am unsure what to do or say in a social situation...
¨ I generally stay cool ¨ I often feel warm ¨ I often begin to sweat
10. When I have spare time after working hard...
¨ It often is difficult for me to unwind and relax ¨ I usually need some time to unwind properly ¨ I am usually able to unwind effectively and forget about the problems of the day
11. When I am criticized by others...
¨ Important arguments usually come to my mind when it is too late to still make my point
¨ I often have difficulty finding a good reply ¨ I usually think of a reply to defend myself
12. When something does not go the way I expected...
¨ I usually stay calm ¨ I often get uneasy ¨ I usually get very agitated
13. When I do not attain a goal...
¨ I usually remain annoyed for a long time ¨ I am usually disappointed, but recover soon ¨ In general, I am hardly concerned at all
14. When others criticize me...
¨ I generally don’t lose confidence at all ¨ I generally lose a little confidence ¨ I generally feel very unconfident
15. When I fail at something...
¨ I usually find it hard to accept ¨ I usually accept it to some degree ¨ In general, I hardly think about it
16. When there are too many demands on me at the same time...
¨ I generally stay calm and do one thing after the other ¨ I usually get uneasy ¨ Usually, even minor interruptions irritate me
17. When others say something incorrect about me . . .
¨ I usually get quite upset
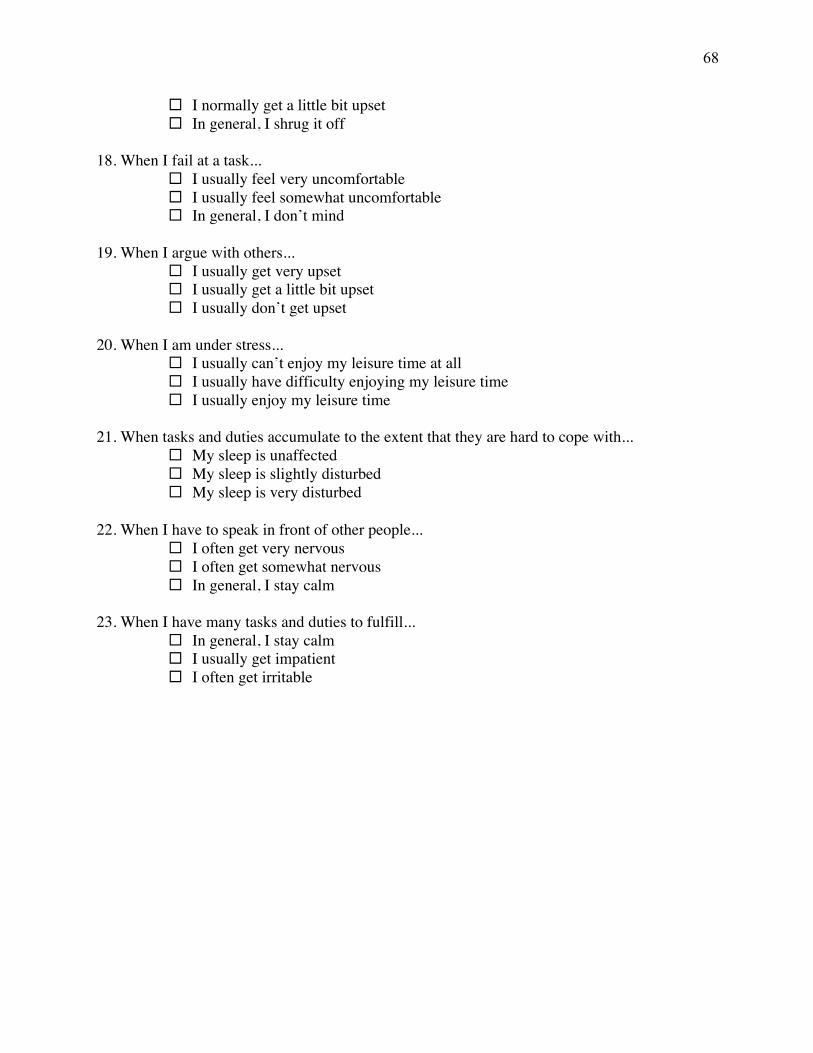
68
¨ I normally get a little bit upset ¨ In general, I shrug it off
18. When I fail at a task...
¨ I usually feel very uncomfortable ¨ I usually feel somewhat uncomfortable ¨ In general, I don’t mind
19. When I argue with others...
¨ I usually get very upset ¨ I usually get a little bit upset ¨ I usually don’t get upset
20. When I am under stress...
¨ I usually can’t enjoy my leisure time at all ¨ I usually have difficulty enjoying my leisure time ¨ I usually enjoy my leisure time
21. When tasks and duties accumulate to the extent that they are hard to cope with...
¨ My sleep is unaffected ¨ My sleep is slightly disturbed ¨ My sleep is very disturbed
22. When I have to speak in front of other people...
¨ I often get very nervous ¨ I often get somewhat nervous ¨ In general, I stay calm
23. When I have many tasks and duties to fulfill...
¨ In general, I stay calm ¨ I usually get impatient ¨ I often get irritable
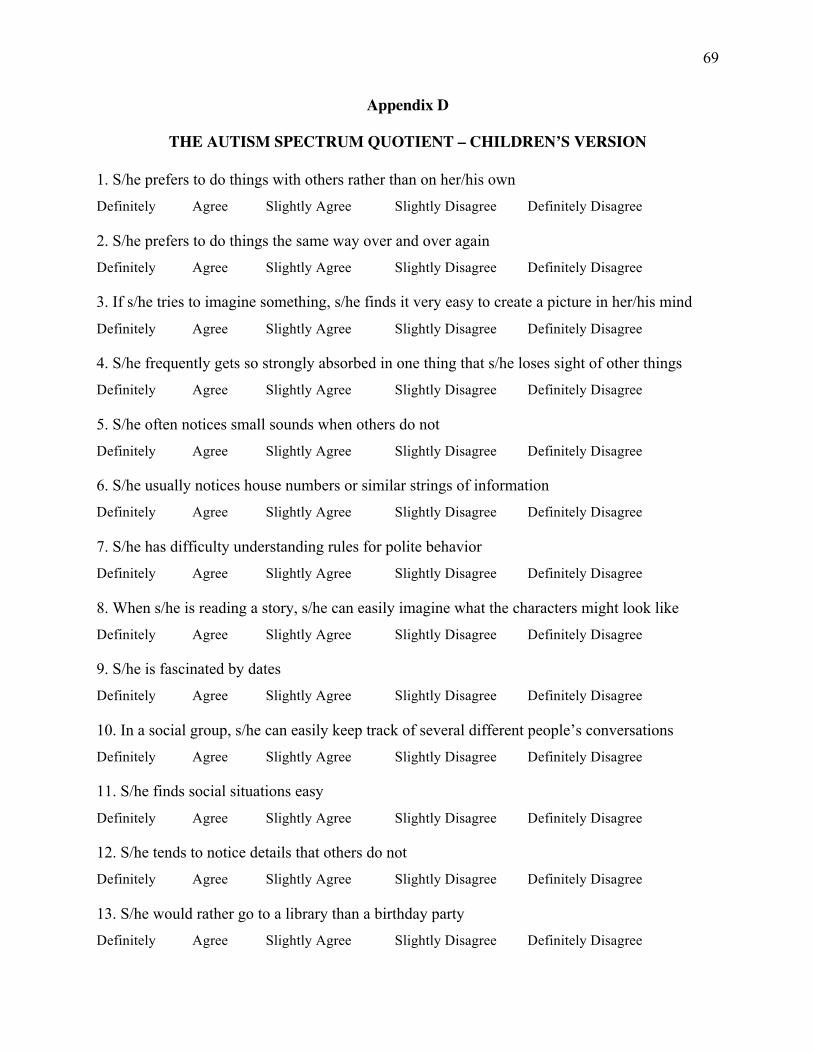
69
Appendix D
THE AUTISM SPECTRUM QUOTIENT – CHILDREN’S VERSION
1. S/he prefers to do things with others rather than on her/his own Definitely Agree Slightly Agree Slightly Disagree Definitely Disagree
2. S/he prefers to do things the same way over and over again Definitely Agree Slightly Agree Slightly Disagree Definitely Disagree
3. If s/he tries to imagine something, s/he finds it very easy to create a picture in her/his mind
Definitely Agree Slightly Agree Slightly Disagree Definitely Disagree
4. S/he frequently gets so strongly absorbed in one thing that s/he loses sight of other things Definitely Agree Slightly Agree Slightly Disagree Definitely Disagree
5. S/he often notices small sounds when others do not Definitely Agree Slightly Agree Slightly Disagree Definitely Disagree
6. S/he usually notices house numbers or similar strings of information Definitely Agree Slightly Agree Slightly Disagree Definitely Disagree
7. S/he has difficulty understanding rules for polite behavior Definitely Agree Slightly Agree Slightly Disagree Definitely Disagree
8. When s/he is reading a story, s/he can easily imagine what the characters might look like Definitely Agree Slightly Agree Slightly Disagree Definitely Disagree
9. S/he is fascinated by dates Definitely Agree Slightly Agree Slightly Disagree Definitely Disagree
10. In a social group, s/he can easily keep track of several different people’s conversations Definitely Agree Slightly Agree Slightly Disagree Definitely Disagree
11. S/he finds social situations easy
Definitely Agree Slightly Agree Slightly Disagree Definitely Disagree
12. S/he tends to notice details that others do not Definitely Agree Slightly Agree Slightly Disagree Definitely Disagree
13. S/he would rather go to a library than a birthday party Definitely Agree Slightly Agree Slightly Disagree Definitely Disagree
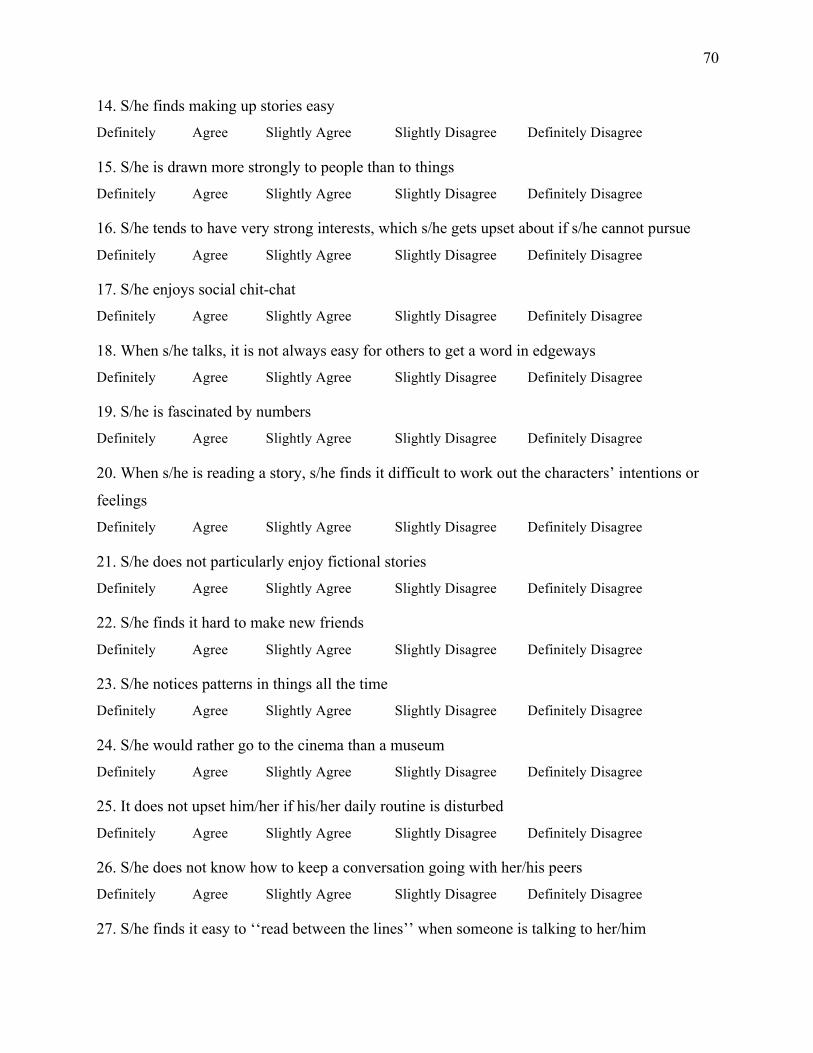
70
14. S/he finds making up stories easy Definitely Agree Slightly Agree Slightly Disagree Definitely Disagree
15. S/he is drawn more strongly to people than to things Definitely Agree Slightly Agree Slightly Disagree Definitely Disagree
16. S/he tends to have very strong interests, which s/he gets upset about if s/he cannot pursue
Definitely Agree Slightly Agree Slightly Disagree Definitely Disagree
17. S/he enjoys social chit-chat Definitely Agree Slightly Agree Slightly Disagree Definitely Disagree
18. When s/he talks, it is not always easy for others to get a word in edgeways Definitely Agree Slightly Agree Slightly Disagree Definitely Disagree
19. S/he is fascinated by numbers Definitely Agree Slightly Agree Slightly Disagree Definitely Disagree
20. When s/he is reading a story, s/he finds it difficult to work out the characters’ intentions or
feelings Definitely Agree Slightly Agree Slightly Disagree Definitely Disagree
21. S/he does not particularly enjoy fictional stories Definitely Agree Slightly Agree Slightly Disagree Definitely Disagree
22. S/he finds it hard to make new friends
Definitely Agree Slightly Agree Slightly Disagree Definitely Disagree
23. S/he notices patterns in things all the time Definitely Agree Slightly Agree Slightly Disagree Definitely Disagree
24. S/he would rather go to the cinema than a museum Definitely Agree Slightly Agree Slightly Disagree Definitely Disagree
25. It does not upset him/her if his/her daily routine is disturbed
Definitely Agree Slightly Agree Slightly Disagree Definitely Disagree
26. S/he does not know how to keep a conversation going with her/his peers Definitely Agree Slightly Agree Slightly Disagree Definitely Disagree
27. S/he finds it easy to ‘‘read between the lines’’ when someone is talking to her/him
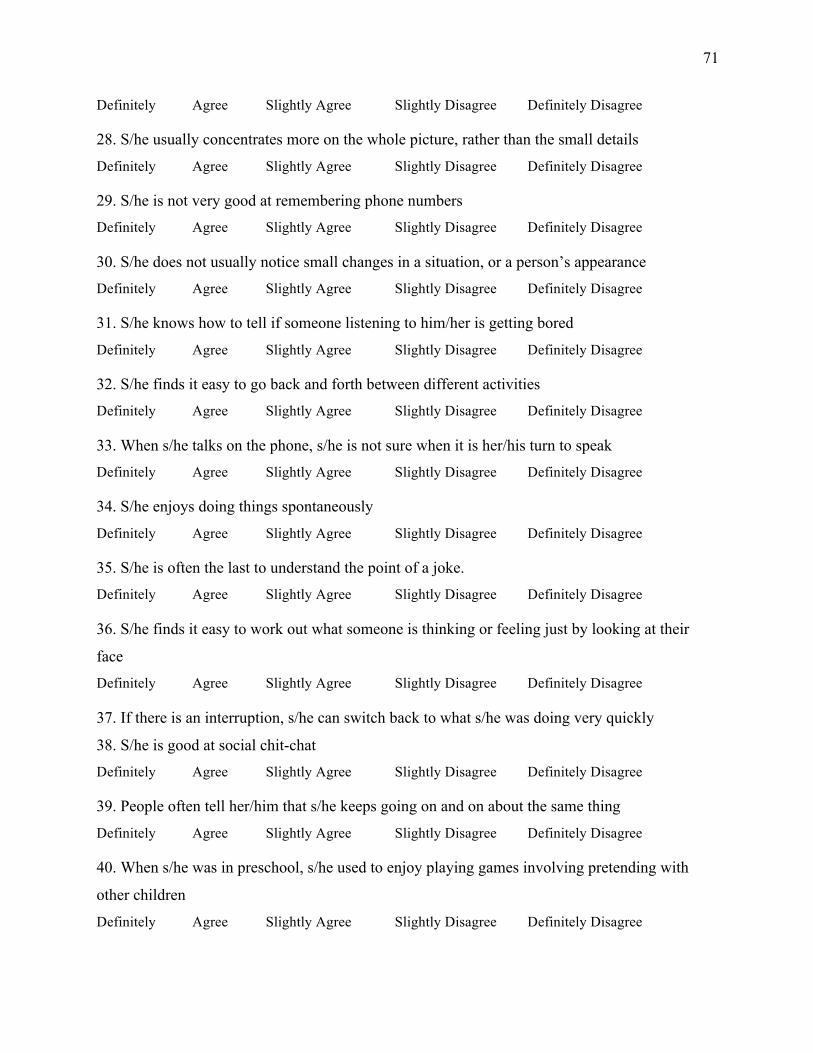
71
Definitely Agree Slightly Agree Slightly Disagree Definitely Disagree
28. S/he usually concentrates more on the whole picture, rather than the small details
Definitely Agree Slightly Agree Slightly Disagree Definitely Disagree
29. S/he is not very good at remembering phone numbers Definitely Agree Slightly Agree Slightly Disagree Definitely Disagree
30. S/he does not usually notice small changes in a situation, or a person’s appearance Definitely Agree Slightly Agree Slightly Disagree Definitely Disagree
31. S/he knows how to tell if someone listening to him/her is getting bored
Definitely Agree Slightly Agree Slightly Disagree Definitely Disagree
32. S/he finds it easy to go back and forth between different activities Definitely Agree Slightly Agree Slightly Disagree Definitely Disagree
33. When s/he talks on the phone, s/he is not sure when it is her/his turn to speak Definitely Agree Slightly Agree Slightly Disagree Definitely Disagree
34. S/he enjoys doing things spontaneously
Definitely Agree Slightly Agree Slightly Disagree Definitely Disagree
35. S/he is often the last to understand the point of a joke. Definitely Agree Slightly Agree Slightly Disagree Definitely Disagree
36. S/he finds it easy to work out what someone is thinking or feeling just by looking at their
face Definitely Agree Slightly Agree Slightly Disagree Definitely Disagree
37. If there is an interruption, s/he can switch back to what s/he was doing very quickly
38. S/he is good at social chit-chat Definitely Agree Slightly Agree Slightly Disagree Definitely Disagree
39. People often tell her/him that s/he keeps going on and on about the same thing
Definitely Agree Slightly Agree Slightly Disagree Definitely Disagree
40. When s/he was in preschool, s/he used to enjoy playing games involving pretending with
other children
Definitely Agree Slightly Agree Slightly Disagree Definitely Disagree
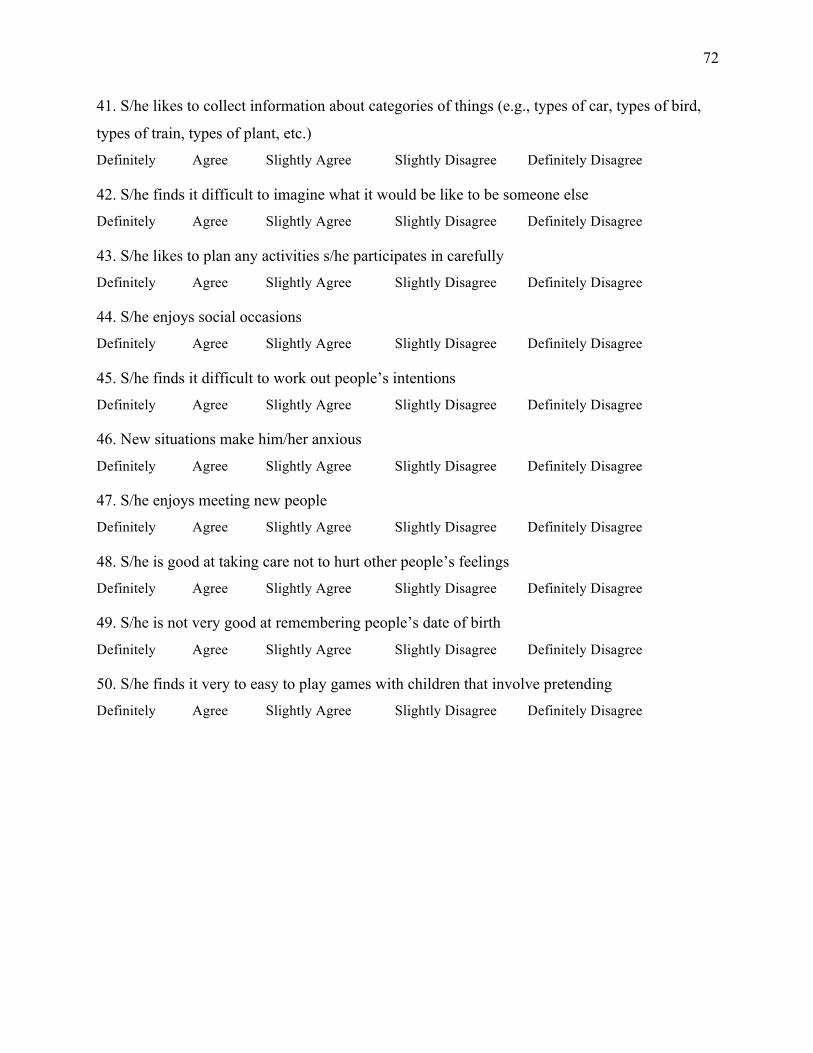
72
41. S/he likes to collect information about categories of things (e.g., types of car, types of bird,
types of train, types of plant, etc.) Definitely Agree Slightly Agree Slightly Disagree Definitely Disagree
42. S/he finds it difficult to imagine what it would be like to be someone else Definitely Agree Slightly Agree Slightly Disagree Definitely Disagree
43. S/he likes to plan any activities s/he participates in carefully Definitely Agree Slightly Agree Slightly Disagree Definitely Disagree
44. S/he enjoys social occasions Definitely Agree Slightly Agree Slightly Disagree Definitely Disagree
45. S/he finds it difficult to work out people’s intentions Definitely Agree Slightly Agree Slightly Disagree Definitely Disagree
46. New situations make him/her anxious
Definitely Agree Slightly Agree Slightly Disagree Definitely Disagree
47. S/he enjoys meeting new people Definitely Agree Slightly Agree Slightly Disagree Definitely Disagree
48. S/he is good at taking care not to hurt other people’s feelings Definitely Agree Slightly Agree Slightly Disagree Definitely Disagree
49. S/he is not very good at remembering people’s date of birth
Definitely Agree Slightly Agree Slightly Disagree Definitely Disagree
50. S/he finds it very to easy to play games with children that involve pretending Definitely Agree Slightly Agree Slightly Disagree Definitely Disagree
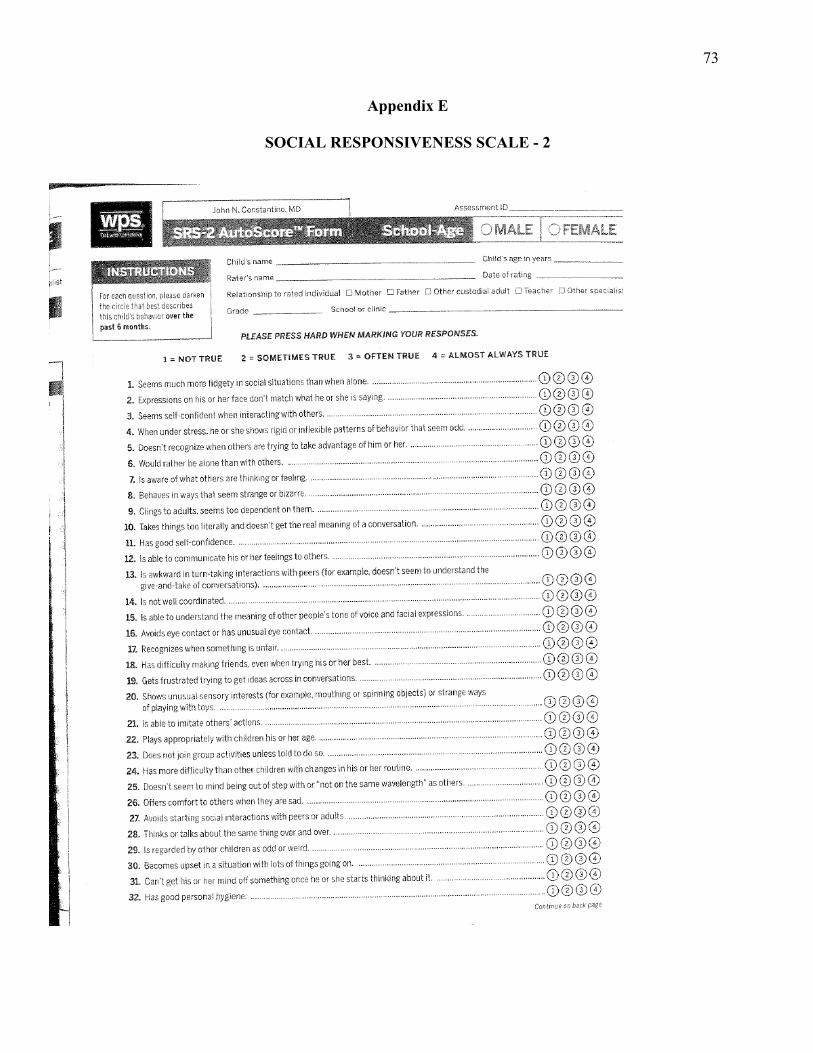
73
Appendix E
SOCIAL RESPONSIVENESS SCALE - 2
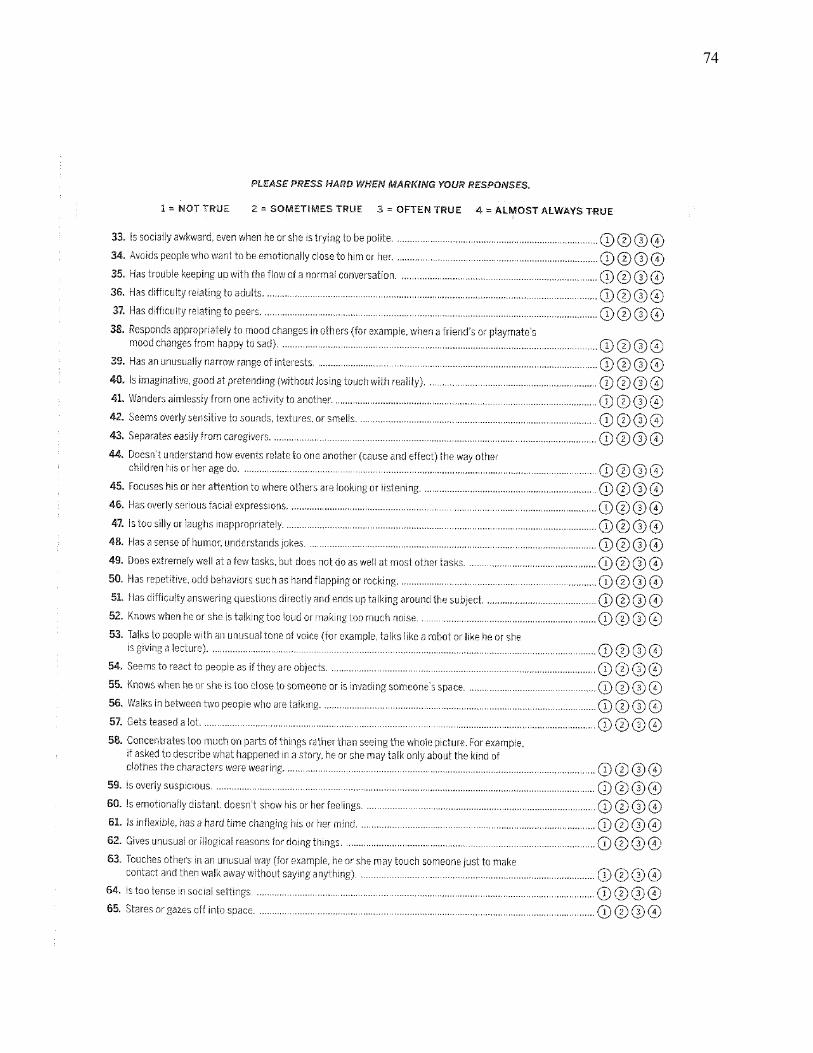
74
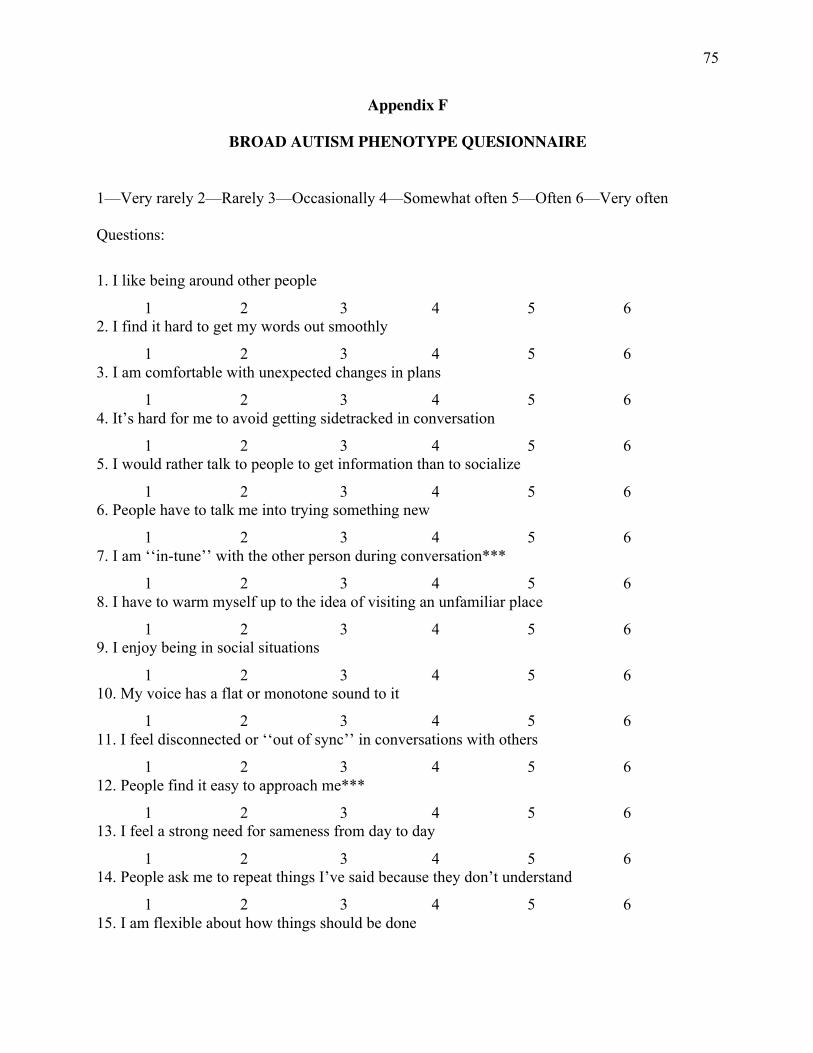
75
Appendix F
BROAD AUTISM PHENOTYPE QUESIONNAIRE
1—Very rarely 2—Rarely 3—Occasionally 4—Somewhat often 5—Often 6—Very often Questions:
1. I like being around other people
1 2 3 4 5 6 2. I find it hard to get my words out smoothly
1 2 3 4 5 6 3. I am comfortable with unexpected changes in plans
1 2 3 4 5 6 4. It’s hard for me to avoid getting sidetracked in conversation
1 2 3 4 5 6 5. I would rather talk to people to get information than to socialize
1 2 3 4 5 6 6. People have to talk me into trying something new
1 2 3 4 5 6 7. I am ‘‘in-tune’’ with the other person during conversation***
1 2 3 4 5 6 8. I have to warm myself up to the idea of visiting an unfamiliar place
1 2 3 4 5 6 9. I enjoy being in social situations
1 2 3 4 5 6 10. My voice has a flat or monotone sound to it
1 2 3 4 5 6 11. I feel disconnected or ‘‘out of sync’’ in conversations with others
1 2 3 4 5 6 12. People find it easy to approach me***
1 2 3 4 5 6 13. I feel a strong need for sameness from day to day
1 2 3 4 5 6 14. People ask me to repeat things I’ve said because they don’t understand
1 2 3 4 5 6 15. I am flexible about how things should be done
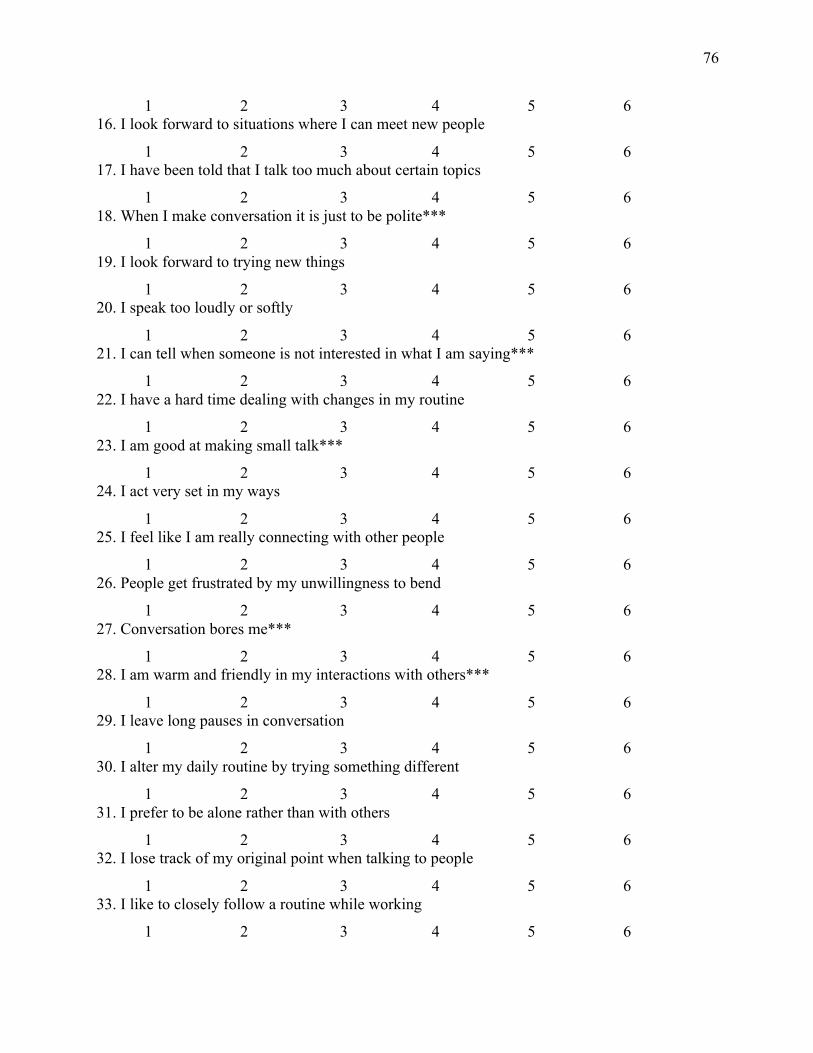
76
1 2 3 4 5 6 16. I look forward to situations where I can meet new people
1 2 3 4 5 6 17. I have been told that I talk too much about certain topics
1 2 3 4 5 6 18. When I make conversation it is just to be polite***
1 2 3 4 5 6 19. I look forward to trying new things
1 2 3 4 5 6 20. I speak too loudly or softly
1 2 3 4 5 6 21. I can tell when someone is not interested in what I am saying***
1 2 3 4 5 6 22. I have a hard time dealing with changes in my routine
1 2 3 4 5 6 23. I am good at making small talk***
1 2 3 4 5 6 24. I act very set in my ways
1 2 3 4 5 6 25. I feel like I am really connecting with other people
1 2 3 4 5 6 26. People get frustrated by my unwillingness to bend
1 2 3 4 5 6 27. Conversation bores me***
1 2 3 4 5 6 28. I am warm and friendly in my interactions with others***
1 2 3 4 5 6 29. I leave long pauses in conversation
1 2 3 4 5 6 30. I alter my daily routine by trying something different
1 2 3 4 5 6 31. I prefer to be alone rather than with others
1 2 3 4 5 6 32. I lose track of my original point when talking to people
1 2 3 4 5 6 33. I like to closely follow a routine while working
1 2 3 4 5 6
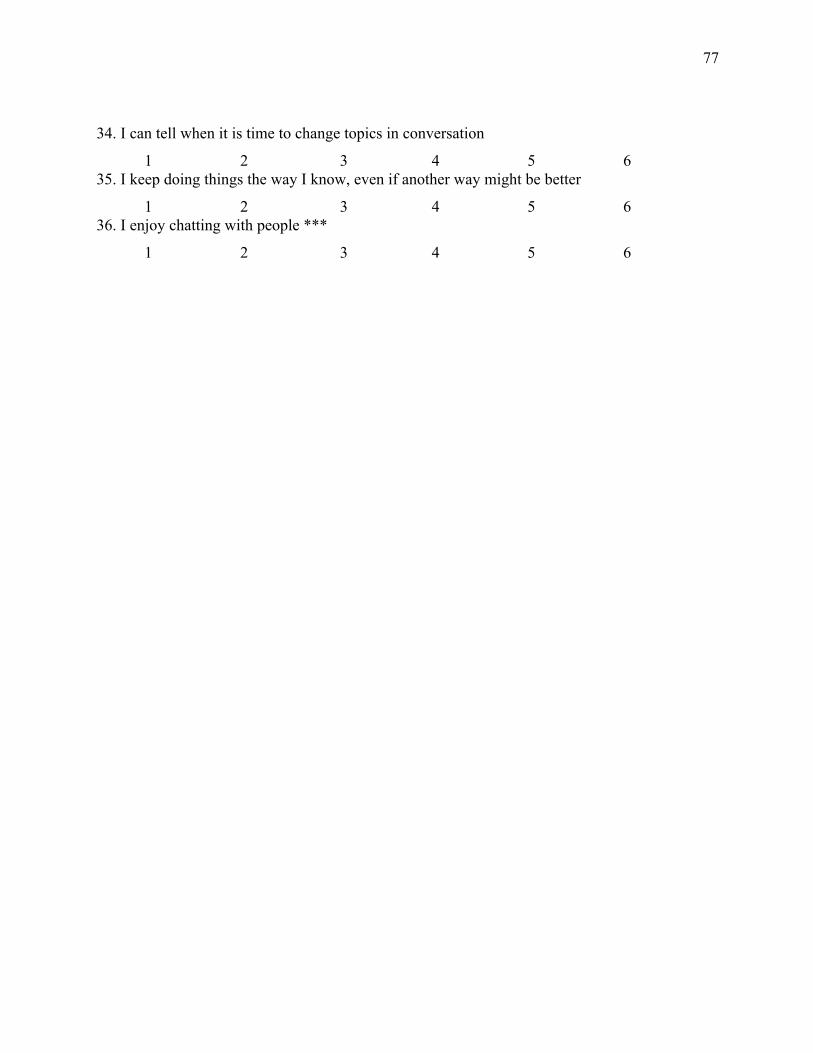
77
34. I can tell when it is time to change topics in conversation
1 2 3 4 5 6 35. I keep doing things the way I know, even if another way might be better
1 2 3 4 5 6 36. I enjoy chatting with people ***
1 2 3 4 5 6
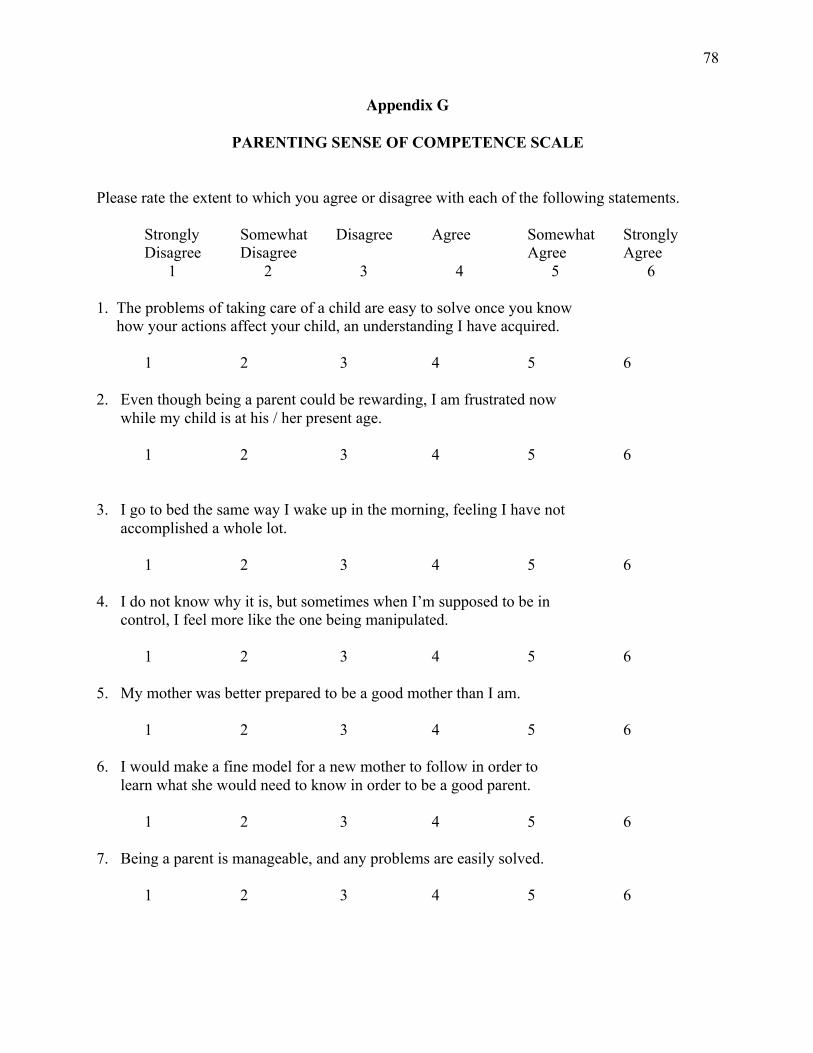
78
Appendix G
PARENTING SENSE OF COMPETENCE SCALE
Please rate the extent to which you agree or disagree with each of the following statements.
Strongly Somewhat Disagree Agree Somewhat Strongly Disagree Disagree Agree Agree 1 2 3 4 5 6
1. The problems of taking care of a child are easy to solve once you know how your actions affect your child, an understanding I have acquired.
1 2 3 4 5 6
2. Even though being a parent could be rewarding, I am frustrated now while my child is at his / her present age.
1 2 3 4 5 6
3. I go to bed the same way I wake up in the morning, feeling I have not accomplished a whole lot.
1 2 3 4 5 6
4. I do not know why it is, but sometimes when I’m supposed to be in control, I feel more like the one being manipulated.
1 2 3 4 5 6 5. My mother was better prepared to be a good mother than I am.
1 2 3 4 5 6
6. I would make a fine model for a new mother to follow in order to learn what she would need to know in order to be a good parent.
1 2 3 4 5 6 7. Being a parent is manageable, and any problems are easily solved.
1 2 3 4 5 6
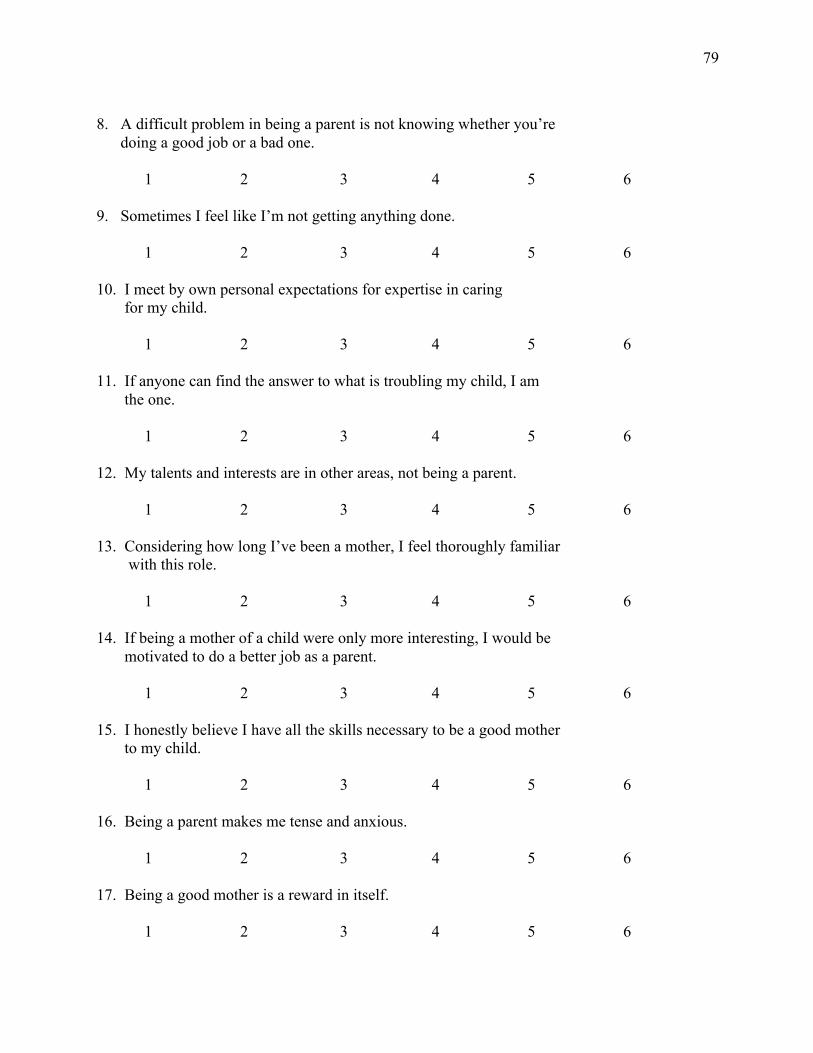
79
8. A difficult problem in being a parent is not knowing whether you’re doing a good job or a bad one.
1 2 3 4 5 6
9. Sometimes I feel like I’m not getting anything done.
1 2 3 4 5 6 10. I meet by own personal expectations for expertise in caring for my child.
1 2 3 4 5 6
11. If anyone can find the answer to what is troubling my child, I am the one.
1 2 3 4 5 6 12. My talents and interests are in other areas, not being a parent.
1 2 3 4 5 6 13. Considering how long I’ve been a mother, I feel thoroughly familiar with this role.
1 2 3 4 5 6 14. If being a mother of a child were only more interesting, I would be motivated to do a better job as a parent.
1 2 3 4 5 6 15. I honestly believe I have all the skills necessary to be a good mother to my child.
1 2 3 4 5 6 16. Being a parent makes me tense and anxious.
1 2 3 4 5 6 17. Being a good mother is a reward in itself.
1 2 3 4 5 6
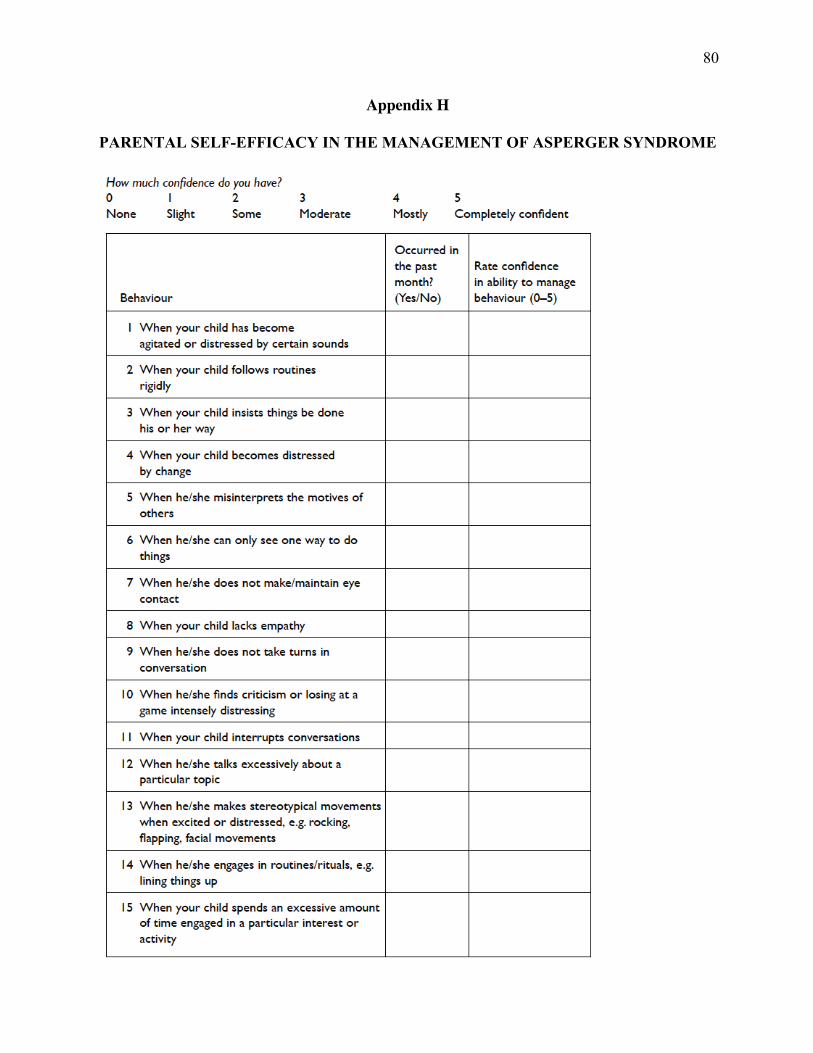
80
Appendix H
PARENTAL SELF-EFFICACY IN THE MANAGEMENT OF ASPERGER SYNDROME
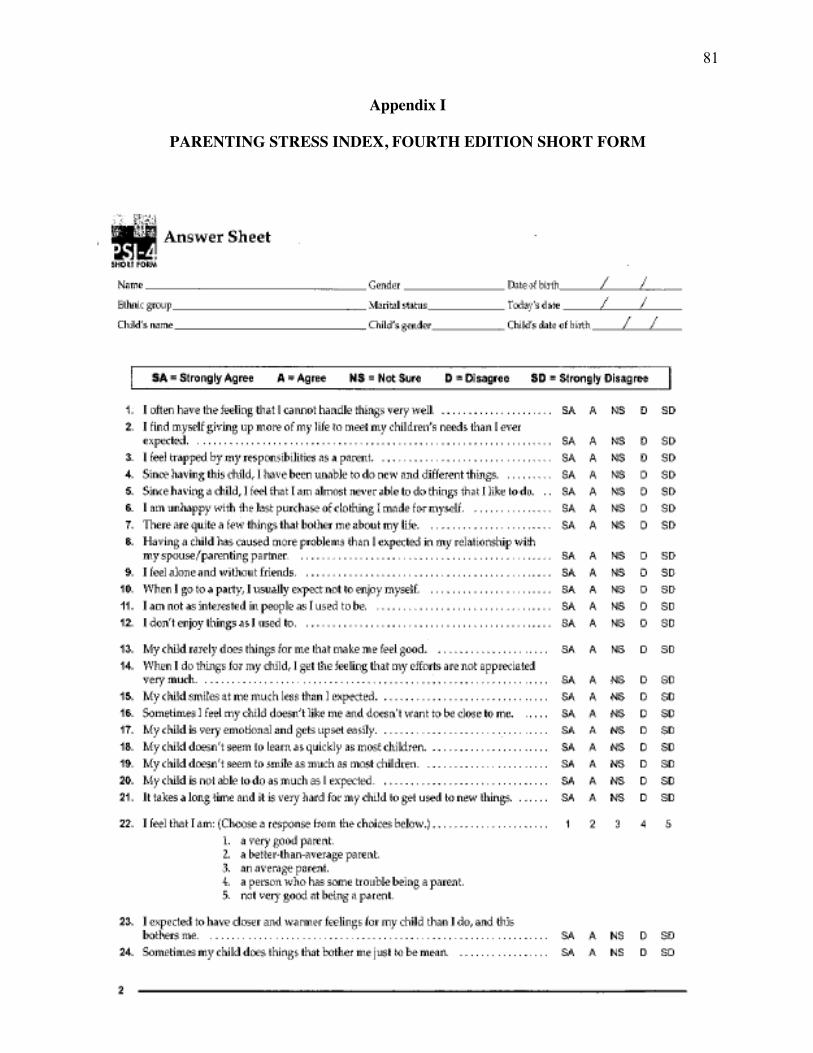
81
Appendix I
PARENTING STRESS INDEX, FOURTH EDITION SHORT FORM
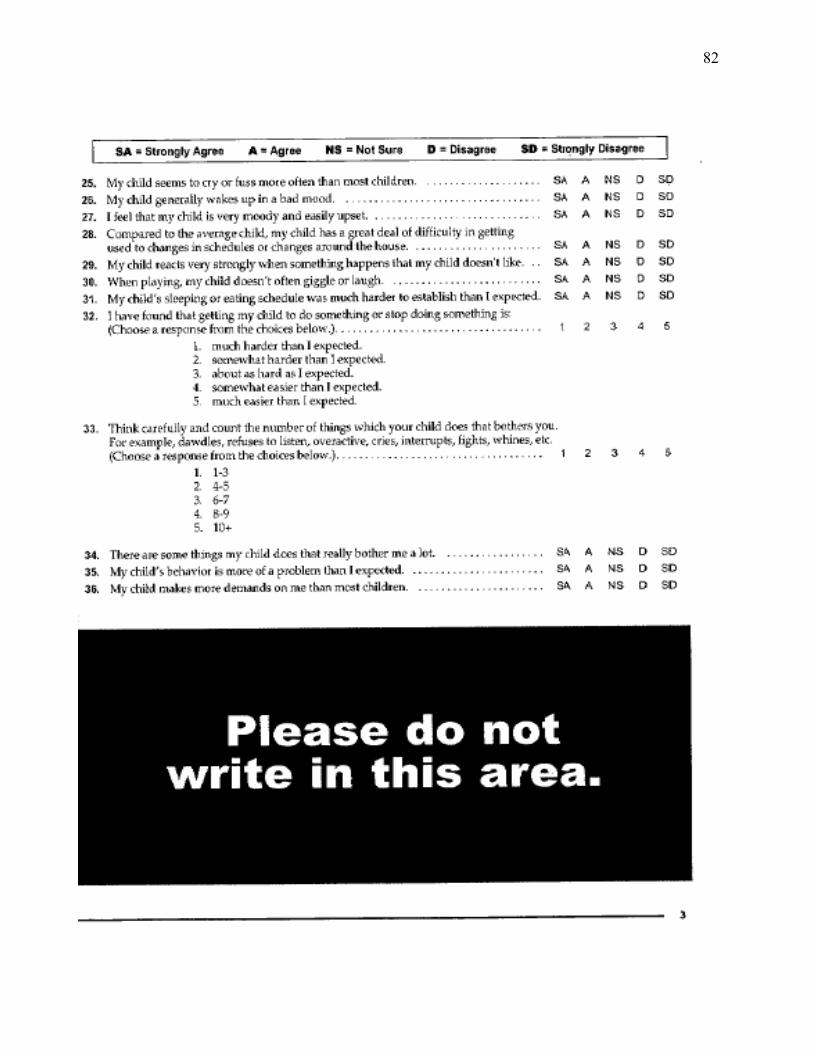
82
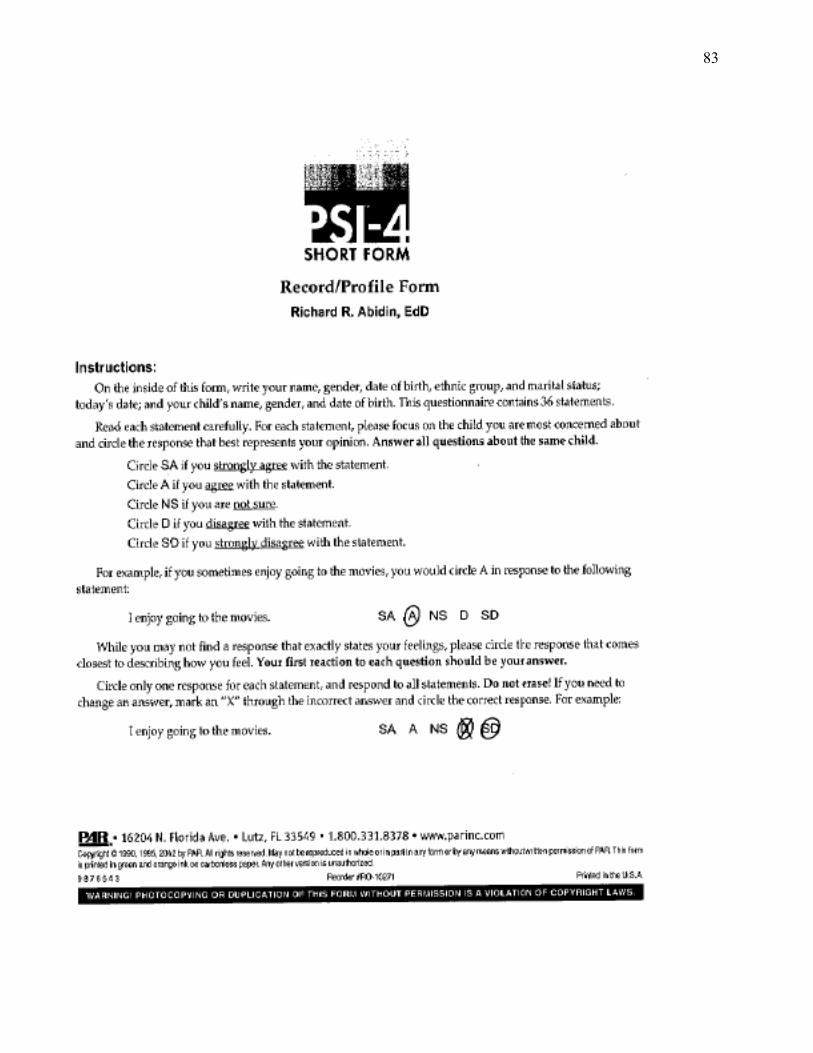
83
84
Appendix J
INFORMED CONSENT AND PARENT PERMISSION FORM
Study Title: Physiological Responses During Parent and Child Interaction Investigators: Reina Factor, B.A. [email protected] Angela Scarpa, Ph.D. [email protected] I. Purpose of this Research The purpose of this study is to understand the relationship between maternal stress and mother child interactions. The purpose for conducting this research is for a thesis project and results may be submitted for publication. The number of subjects involved includes 62 mother and child dyads. Children will range in age from 7 to 10 years. There are two possible parts to this study, however, this consent form is only for Part 1. II. Procedures Should you agree to participate, you and your child will be asked to complete an hour long session at the Virginia Tech Autism Clinic. III. Risks There are no more than minimal risks to you from answering the questionnaires or wearing a heart rate monitor during a task with your son or daughter. However, while participating in the activity with your son or daughter, you may experience some stress as the task may be difficult for him or her. In addition, there could be some discomfort from wearing the chest heart rate monitor. Note, however, that these procedures have been used by these investigators in several other studies, with no complaints. IV. Benefits There is a societal benefit of increasing the understanding of the relationship between maternal stress and mother interactions with her child which can help inform future intervention studies. V. Extent of Anonymity Confidentiality will be assured by assigning code numbers to all participants, and only these identifiers will appear on data collection instruments and documents used in statistical analyses. No information concerning a participant will be released without the participant’s written consent. No presentations or publications resulting from this project will identify individual parties. Confidentiality will not be maintained, however, if you express intent to harm or kill yourself or someone else, as we are legally required to divulge that information to the appropriate public authorities. VI. Compensation The child will receive a small toy as compensation for participation in the study. In addition, mother-child dyads that qualify and choose to participate in Phase 2 of the study will be compensated after completing the second phase. VII. Freedom to Withdraw
85
You should also understand that you are free to withdraw from the study at any time. You do not have to answer any questions that you do not choose to. VIII. Participant’s Responsibility Signing of this form and agreement to participate is voluntary. You are responsible for answering questionnaires about your past and recent experiences as well as wear a heart rate monitor while completing several different tasks. IX. Questions or Concerns Should you have any questions about this study, you may contact one of the research investigators whose contact information is included at the beginning of this document. Should you have any questions or concerns about the study’s conduct or your rights as a research subject, or need to report a research-related injury or event, you may contact the VT IRB Chair, Dr. David M. Moore at [email protected] or (540) 231-4991 or Dr. David Harrison, the Chair of the Psychology Department Human Subjects Committee, at [email protected] or (540) 231-4422. X. Participant’s Permission You have read and understood the Informed Consent Form and conditions of this project. You have had all your questions answered. You hereby acknowledge the above and give your voluntary consent for participation in this project. If you participate, you may withdraw at any time. You agree to abide by the rules of this project. XI. Subject's Consent I have read the Consent Form and conditions of this project. I have had all my questions answered. I hereby acknowledge the above and give my voluntary consent: _______________________________________________ Date__________ Subject signature _______________________________________________ Subject printed name
86
Appendix K
VERBALCHILDASSENTFORM(AGES7-10YEARS)
VirginiaTechPhysiologicalResponsesDuringParentandChildInteraction
Investigators: Reina Factor, B.A. Angela Scarpa, Ph.D. Hi _____________, We are asking you to be in a study at Virginia Tech so that we can understand how you and your mom interact while you play a task. We would like to know if you are okay with being in the study. You do not have to be in this study if you do not want to. You can stop being in the study at any time. Nobody will be mad or upset and we will still treat you the same no matter what. As part of this study, you will be asked to come to Virginia Tech one time play some games with a research assistant and with your mom. Your mom will be filling out forms while you play the games with a research assistant. Nothing that you do during your visit here is dangerous, and all of the information we get from you or your mom is private. This means nobody can see the information unless your parent says it is okay for them see it. If you tell us about harming or hurting yourself or others or the court asks us, we cannot keep that information private. If you are worried about something and want to ask questions let the person you are with know that so that they can help you. Do you have any questions right now about anything I just said? Obtain verbal assent via reading this script and get confirmation from the child that they understand what is going to happen during their visit. Also make sure that the parent consent form, along with this verbal assent for children is completed. Child’s name: ____________________________________ Date: _____________________