Embed Size (px)
Citation preview
A Women’s Sports Foundation Research Report
October 2008
Go Out and Play
Youth Sports in America
Authorship and Acknowledgments
This report was co-authored by Don Sabo, Ph.D., and
Phil Veliz, M.A. The study was developed through a
collaboration between the Women’s Sports Foundation and
the Center for Research on Physical Activity, Sport & Health
at D’Youville College, and conducted for them by Harris
Interactive, Inc. Special thanks to Marjorie A. Snyder, Ph.D.,
for guiding the project, to Deana Monahan for her editorial
expertise and to George DelGiorno for graphic assistance
with the many tables in this report. The dedication and skills
of Harris Interactive’s youth research team—Dana Markow,
Ph.D., Chris Moessner and Jay Oppenheim—are much
appreciated.Thanks go to David Olson, Ph.D., for allowing
use of the Family Adaptability & Cohesion Scale.
The Women’s Sports Foundation also thanks its sponsors
the PepsiCo Foundation for its corporate leadership and its
foundation partners and individual donors for their support
in expanding the knowledge base critical to girls’ physical,
psychological and social well-being. Thanks also to Deborah
Slaner Larkin, Donna Lopiano, Ph.D., Michael Messner, Ph.D.,
Kathleen Miller, Ph.D., and Denise Roche, Ph.D.
Published October 2008, by the Women’s Sports Foundation®
Eisenhower Park, 1899 Hempstead Turnpike, Suite 400
East Meadow, NY 11554
www.WomensSportsFoundation.org
© 2008, Women’s Sports Foundation, All Rights Reserved
This report may be downloaded from www.WomensSportsFoundation.org.
This report may be reproduced and distributed only in its entirety. Any
material taken from this report and published or transmitted in any form,
electronic or mechanical, must be properly attributed to Go Out and Play:
Youth Sports in America, published by the Women’s Sports Foundation.
Preferred citation: Sabo, D. and Veliz, P. (2008). Go Out and Play: Youth
Sports in America. East Meadow, NY: Women’s Sports Foundation.

October 2008
Go Out and Play
Youth Sports in America

2
1
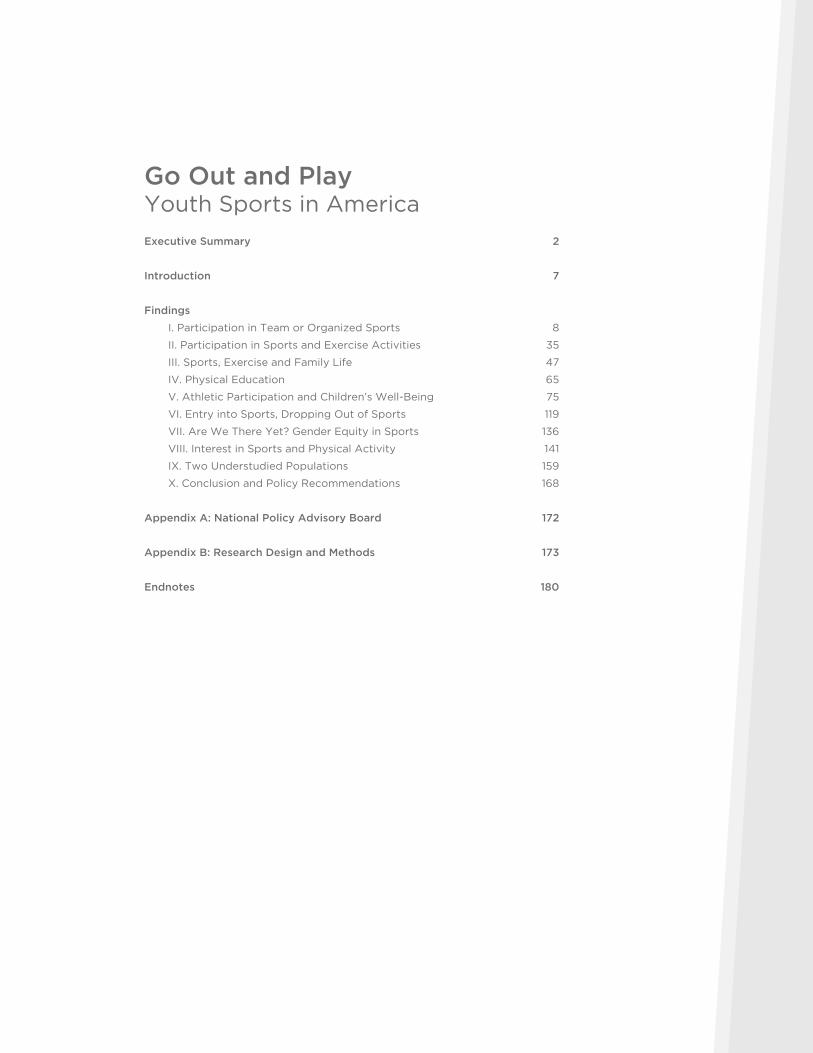
Go Out and Play Youth Sports in America
Executive Summary 2
Introduction 7
Findings
I. Participation in Team or Organized Sports 8
II. Participation in Sports and Exercise Activities 35
III. Sports, Exercise and Family Life 47
IV. Physical Education 65
V. Athletic Participation and Children’s Well-Being 75
VI. Entry into Sports, Dropping Out of Sports 119
VII. Are We There Yet? Gender Equity in Sports 136
VIII. Interest in Sports and Physical Activity 141
IX. Two Understudied Populations 159
X. Conclusion and Policy Recommendations 168
Appendix A: National Policy Advisory Board 172
Appendix B: Research Design and Methods 173
Endnotes 180

A Women’s Sports Foundation Research Report2
Executive SummaryThis study measures the nationwide participation rates of girls and boys in
exercise and organized team sports. The central focus is on how the intersections
among families, schools and communities are related to children’s involvement
and interest in athletics and physical activity. Some of the personal and social
benefits associated with children’s athletic participation are also identified and
discussed. The athletic interests and involvements of girls and boys are examined
from childhood through late adolescence, including entry into sport as well as
drop-out patterns.
American families display a wide array of cultural, economic, racial and ethnic
characteristics. Despite this diversity, all families have two things in common. First,
they nurture children from infancy through young adulthood. Second, parents do
not raise their children in isolation. Family life unfolds within an institutional web
that includes schools, churches, community organizations, after-school programs,
government, economic forces and—central to this study—sports. It is within this
wider social matrix that children’s athletic ability and interest in physical activity
take shape and either blossom or dwindle.
The findings and conclusions in this report are based on two nationwide surveys.
The Women’s Sports Foundation commissioned Harris Interactive to complete a
school-based survey of youth drawn from a random selection of approximately
100,000 public, private and parochial schools in the United States. The school-
based survey method yields highly reliable results. The nationwide sample consists
of 2,185 third- through 12th-grade girls and boys. In addition, phone interviews
were conducted with a national cross-section of 863 randomly selected parents
of children in grades 3 through 12. Parents were asked how they think and feel
about their children’s interest and involvement in sports and physical activity.
African-American and Hispanic parents were over-sampled in order to deepen
understanding of the needs and experiences of underserved girls, boys and
their families.
This report confirms that sports are a resource for U.S. children as well as their
families. Children’s athletic participation was associated with higher levels of family
satisfaction. Sports and physical activity were also linked with improved physical
and emotional health, academic achievement and quality of life for children.
A complex picture of gender differences in athletic opportunities and physical
activity emerges from this study. There is a nationwide gender gap in physical
activity and sports involvement between girls and boys. The size of the gender
gap, however, does not stretch uniformly across the country and age brackets. In
many communities, girls show similar levels of athletic participation and interest
as boys. In other communities, however, access to sport and physical activity for
girls appears to be thwarted by economic disadvantages and inadequate school
resources. Young urban girls, especially, have a narrower window of opportunity
for becoming involved with sports than their male counterparts and girls from
Go Out and Play: Youth Sports in America 3
suburban and rural communities. One in four ninth- to 12th-grade girls has never
participated in organized or team sports in urban schools, compared to about one
in six urban boys. In short, progress on the gender front in U.S. sports has been
made, but it remains uneven, and it is often poor and mainly urban girls who are
being left behind.
Some of the major findings documented by this study are summarized below
within four main themes.
Participation In Sports And Physical Activity: The Gender Gap1. A Gender Gap Exists in Sports and Physical Activity—But It Is Uneven
Girls generally are not as involved with sports and physical activity as boys.
However, the gender gap is not uniform across the nation. Whereas similar rates of
sports participation between girls and boys exist in suburban communities, urban
and rural girls are less involved than their male peers. Variations in the gender gap
in athletic participation often appear to be driven by economic disparities, race
and ethnicity, and family characteristics. These variations strongly suggest that the
girls’ and boys’ participation in sports and exercise is primarily shaped by access
and opportunity.
2. Interest in Sports and Exercise Among Girls and Boys Is About Opportunity and
Encouragement, Not Biology
Girls’ and boys’ interest in sports and exercise varies by grade level, school
location and income level. In some communities boys and girls show similar levels
of interest in sport, while in other communities, boys’ interest levels are higher than
those of girls. Parents very often feel that their daughters and sons have similar
interest in sports, especially when their children are younger (third through eighth
grades). In short, interest in sports can often vary more within genders than it does
across genders. And finally, boys tend to overestimate their interest in sports,
while girls lean toward underestimating their athletic interests. For example, 42%
of third- to eighth-grade boys who are non-athletes said that “sports are a big part
of who they are,” compared to 16% of non-athletic girls. Female athletes, moreover,
are often involved with several clubs and organizations outside sport, whereas
male athletes focus more singly on sports.
3. The Gender Gap in Physical Education
Urban girls are the “have-nots” of physical education in the United States, with
84% report having no PE classes at all in the 11th and 12th grades. Rural girls in
the same grades are not far behind with 68% reporting no PE classes. Across the
country, young low-income children—both girls and boys—are underserved with
regard to school-based physical education. Generally, more boys attend PE classes
than girls, especially in urban and rural schools.

A Women’s Sports Foundation Research Report4
4. Girls Now Take Part in a Wider Array of Sports and Exercise Activities
than Boys
Girls explore a wider array of sports and exercise activities than boys do, including
traditional, recreational and newly emerging sports such as cheerleading,
dance, double Dutch and volleyball. Boys focus more on traditional sports and
exercise activities, which, most often, take the form of organized school and
community sports.
5. Girls Have a Narrower Window of Opportunity in Sports
Girls enter sports at a later age than boys (7.4 years old compared to 6.8 years
old). The widest gap between the age girls and boys enter sport appears in urban
communities (7.8 and 6.9 years old, respectively). Girls also drop out sooner and
in greater numbers than boys. Girls’ late start may set them up for failure in sports
during the middle-school years (sixth through eighth grades).
Sports and Family Life1. Sports Are an Asset for U.S. Families, and Families Are a Resource for
Young Athletes
Children’s involvement with sports is associated with higher levels of family
satisfaction. Youth sports can help build communication and trust between parents
and children. Sports help parents and children spend more time together. The
positive connections are particularly evident in dual-parent families, but they also
resonate in single-parent families.
2. Many Parents Say Their Daughters Are Being Shortchanged
While a majority of parents say they want similar levels of athletic opportunity for
their daughters and sons, many believe that their schools and communities are
failing to deliver the goods. Many parents are aware that girls are getting fewer
opportunities in sports and physical activity than boys are. More African-American
and Hispanic parents feel schools and communities are failing their daughters.
3. More Dads Need to “Step Up to the Plate” to Mentor Young Female Athletes
Non-family members are the top two people girls mentioned as their mentors
in exercise and sports—coaches and physical education teachers. For boys, in
contrast, dads and coaches top the list of main mentors. Forty-six percent of boys
and 28% of girls credit their father for teaching them “the most” about sports and
exercise. While mothers and fathers provide similar levels of encouragement and
support for both their daughters and sons, many girls may be shortchanged by
dads who channel more energy into mentoring sons than daughters.
Children’s Well-Being and Development 1. Sports Help Create Healthy, Well-Adjusted Children
Sports are a health and educational asset for U.S. girls and boys. Organized sports
are associated with children’s general health and body esteem, healthy weight,

Go Out and Play: Youth Sports in America 5
popularity, quality of life and educational achievement. Female athletes often
derive greater benefits from athletic participation than their male peers.
2. Participating in Organized or Team Sports Helps Enhance Girls’ Quality of Life
Girls who do not currently participate in a team sport are less content with their
lives than girls involved with sports. Sports involvement enhances the quality of life
for girls.
3. The Benefits of Athletic Participation Unfold Long Before High School
Many of the social, educational and health benefits linked to sports participation
begin during the elementary school years. The positive contributions of athletic
involvement to youth development are especially visible among sixth- to eighth-
grade girls and boys.
Diverse and Unrecognized Populations1. Sports Are Racially and Ethnically Diverse, but Inequities Are Very Real
Youth sports are racially and ethnically diverse. Fifteen percent of all girls and 16%
of all boys who participate in sports are African-American. Seventeen percent of
female athletes and 15% of male athletes are Hispanic, and 8% of Asian girls and
12% of Asian boys play sports. And yet, proportionally fewer girls of color are
involved with sports than white girls. Girls of color are also much more likely than
their male counterparts to be non-athletes. The same discrepancies across racial
and ethnic groups do not exist among boys. Girls of color are doubly hit by both
gender and race discrimination in sport.
2. Children with Disabilities
About nine out of every 100 U.S. families have a child who has a disability that
can interfere with sports and exercise. Most sports and physical activity programs
are currently designed to meet the interests and needs of children without
disabilities. Some sport leaders and educators assume that children with some
kind of disability are not capable of being physically active or just not interested
in sports. The findings in this study, however, show that children with special
needs are interested in sports and exercise, and many of their parents want to see
more programs offered in schools and communities. A gender gap in sports and
exercise activity does exist among children with disabilities, and it is the boys who
are less physically active than the girls. Finally, the exercise frequency of both girls
and boys with disabilities declines more sharply than their counterparts without
disabilities from the elementary through middle school and high school years.
3. Boys in Immigrant Families Are More Likely than Girls to Play Sports
This is the first study to gather some basic facts about athletic participation among
children in immigrant families. Nearly a quarter (23%) of children have at least
one parent born outside the United States. Compared to boys, girls in immigrant
families report lower rates of athletic participation. Many immigrant parents also
hold more traditional attitudes toward girls’ and boys’ interest in sports.

.
A Women’s Sports Foundation Research Report6
Policy RecommendationsThis research report is designed to foster public discussion and policy debate over
the state of girls’ sports and physical activity in the United States. In order to fulfill
its strategic research initiative, the Women’s Sports Foundation seeks to unite and
educate local and national nonprofit organizations, government agencies, schools
and sport organizations that serve the interest of girls’ health and empowerment
through physical activity. A National Policy Advisory Board was created to
review the findings of this study and to identify key policy recommendations. The
members are recognized leaders from academic research, education, health and
sport. See Appendix A for a list of their names and affiliations.
The findings in this study form an evidence-based foundation to help policymakers
assess the current state of U.S. girls’ and boys’ physical activity and sports. The
Center for Research on Physical Activity, Sport & Health has worked closely with
the Women’s Sports Foundation to prepare a list of eight policy recommendations
intended to advance the health and well-being of both girls and boys through
sports and physical activity. See the final section of this report.

Go Out and Play: Youth Sports in America 7
IntroductionFor decades before the passage of Title IX in 1972,
most parents saw school- and community-based
sports as an asset for their sons but not their
daughters. Custom, gender stereotypes and men’s
traditional control of athletic organizations combined
to keep girls outside the athletic opportunity
mainstream. But the explosion of girls’ athletic
participation during the 35 years following Title IX
demonstrated the vitality of their interest and ability
in sports. Attitudes changed, gender stereotypes
faded, and more parents wanted their daughters as
well as their sons to pursue athletic dreams. Research
during the 1990s showed that for both girls and boys,
athletic participation favorably enhances children’s
health, self-image and educational achievement.1
Public health officials now extol the preventive value
of sports and physical activity as a key antidote for
rising rates of obesity and its related maladies.
This study combines two nationwide surveys in order
to take the pulse of U.S. girls’ and boys’ involvement
with sports and physical activity. The primary focus
is on how gender influences who plays, who benefits,
and how sports and physical activity influence
children’s lives and well-being. The findings reveal
who is being included and sustained under the “big
tent” of sport and who is being left outside. Economic
disparities, where girls and boys go to school, family
characteristics, and race and ethnicity enter into
children’s experiences with sports.
Two guiding concepts informed the design of this
study. First, sport is a major institutional theater for
youth development in the United States. Literally
tens of millions of children’s lives are touched by
sports and related exercise activities. Second, sport
is not a “stand-alone” component of children’s
lives and development. Sports are part of a larger
convoy of social support that includes family,
schools, community, church-based organizations,
nonprofits and networks of supportive adults that
can profoundly inform children’s lives, identities and
physical well-being. A chief goal of this study is to
better understand how these interfaces work so
that the resource of sports can be more effectively
channeled through the realms of family, education,
public health, youth development and the institution
of sport itself.
The Women’s Sports Foundation serves to advance
the lives of girls and women through sport and
physical activity. The Foundation regularly undertakes
research to this end. The findings of this study are
made publicly available in order to foster better
understanding of sports and physical activity as a real
or potential resource for U.S. children. The report is
also intended to be a touchstone for future research,
particularly in those areas in which topics are being
covered for the first time. Policy recommendations
appear in Section X of the report. A detailed summary
of the design components, sample characteristics,
methodological procedures, measures and data
analyses appears in Appendix B.
A Women’s Sports Foundation Research Report8
Part I: Participation in Team or Organized SportsMore children are involved with team or organized
sports today than ever before in American history.
They participate in schools, after-school programs,
playgrounds, community-based leagues, travel
teams, YMCAs and YWCAs, commercial facilities
and programs through their churches. The findings
below reveal that differences between girls’ and boys’
athletic participation are related to a variety of factors
including gender, age, economic disparities, race and
ethnicity, and school location.
Sport captures the energies and imaginations of tens
of millions of girls and boys. An estimated 7,342,910
children participated in high school sports during
the 2006-2007 school year.2 The number of girls
exceeded 3 million for the first time, and 54% of
all students enrolled in high school participated in
a sport of some kind. But little is known about the
extent of athletic participation among U.S. children
in the years before high school. How many third-
to fifth-grade children, for example, participate
in an organized or team sport in their school or
community? Where do children play sports? Do
similar numbers of pre-teen girls and boys play sports
at school, in community programs or within church-
based leagues?
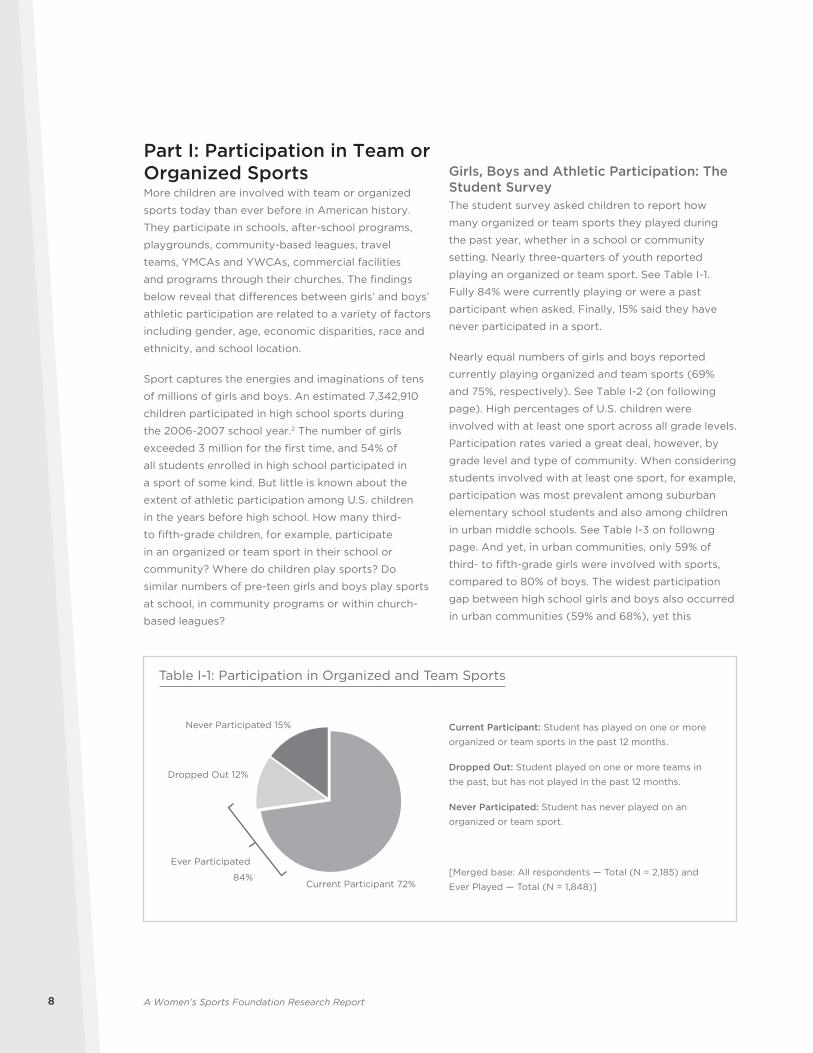
Girls, Boys and Athletic Participation: The Student SurveyThe student survey asked children to report how
many organized or team sports they played during
the past year, whether in a school or community
setting. Nearly three-quarters of youth reported
playing an organized or team sport. See Table I-1.
Fully 84% were currently playing or were a past
participant when asked. Finally, 15% said they have
never participated in a sport.
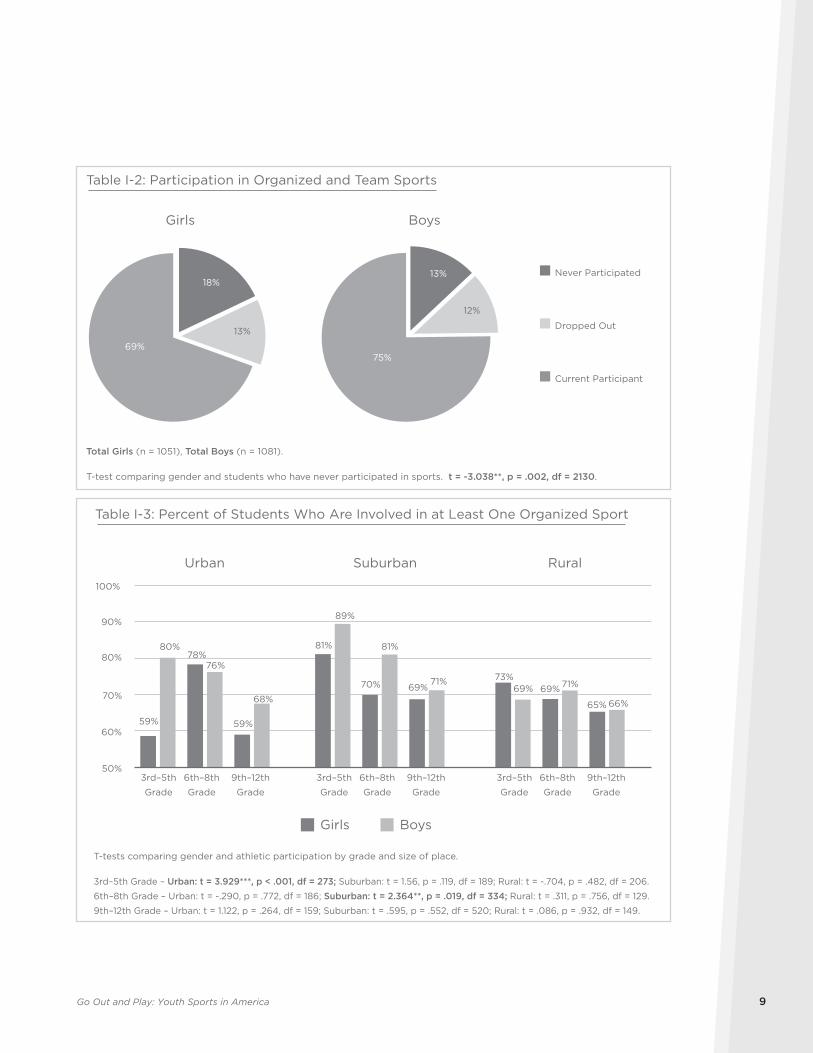
Nearly equal numbers of girls and boys reported
currently playing organized and team sports (69%
and 75%, respectively). See Table I-2 (on following
page). High percentages of U.S. children were
involved with at least one sport across all grade levels.
Participation rates varied a great deal, however, by
grade level and type of community. When considering
students involved with at least one sport, for example,
participation was most prevalent among suburban
elementary school students and also among children
in urban middle schools. See Table I-3 on followng
page. And yet, in urban communities, only 59% of
third- to fifth-grade girls were involved with sports,
compared to 80% of boys. The widest participation
gap between high school girls and boys also occurred
in urban communities (59% and 68%), yet this
Current Participant: Student has played on one or more
organized or team sports in the past 12 months.
Dropped Out: Student played on one or more teams in
the past, but has not played in the past 12 months.
Never Participated: Student has never played on an
organized or team sport.
[Merged base: All respondents — Total (N = 2,185) and
Ever Played — Total (N = 1,848)]
Table I-1: Participation in Organized and Team Sports
Never Participated 15%
Dropped Out 12%
Ever Participated
84%Current Participant 72%
Go Out and Play: Youth Sports in America 9
Table I-2: Participation in Organized and Team Sports
Girls
18%
13%
69%
Boys
13%
12%
75%
Never Participated
Dropped Out
Current Participant
Total Girls (n = 1051), Total Boys (n = 1081).
T-test comparing gender and students who have never participated in sports. t = -3.038**, p = .002, df = 2130.
50%
60%
70%
80%
90%
100%
Girls Boys
Table I-3: Percent of Students Who Are Involved in at Least One Organized Sport
T-tests comparing gender and athletic participation by grade and size of place.
3rd–5th Grade – Urban: t = 3.929***, p < .001, df = 273; Suburban: t = 1.56, p = .119, df = 189; Rural: t = -.704, p = .482, df = 206.
6th–8th Grade – Urban: t = -.290, p = .772, df = 186; Suburban: t = 2.364**, p = .019, df = 334; Rural: t = .311, p = .756, df = 129.
9th–12th Grade – Urban: t = 1.122, p = .264, df = 159; Suburban: t = .595, p = .552, df = 520; Rural: t = .086, p = .932, df = 149.
Suburban Rural
59%
78%
59%
80%
76%
68%
Urban
3rd–5th
Grade
6th–8th
Grade
9th–12th
Grade
81%
70% 69%
89%
81%
71%
3rd–5th
Grade
6th–8th
Grade
9th–12th
Grade
73%69%
65%
69% 71%
66%
3rd–5th
Grade
6th–8th
Grade
9th–12th
Grade
A Women’s Sports Foundation Research Report10
difference was not statistically significant. In rural
communities, similar percentages of girls and boys
across all grade levels played at least one sport.
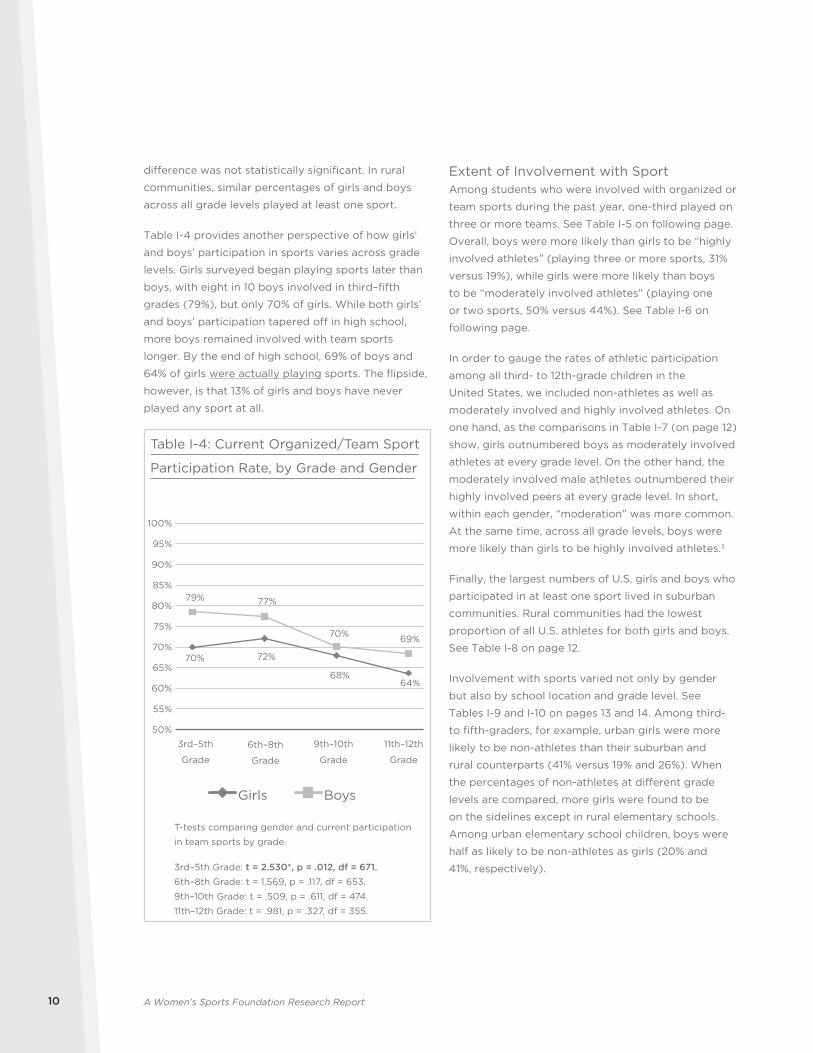
Table I-4 provides another perspective of how girls’
and boys’ participation in sports varies across grade
levels. Girls surveyed began playing sports later than
boys, with eight in 10 boys involved in third–fifth
grades (79%), but only 70% of girls. While both girls’
and boys’ participation tapered off in high school,
more boys remained involved with team sports
longer. By the end of high school, 69% of boys and
64% of girls were actually playing sports. The flipside,
however, is that 13% of girls and boys have never
played any sport at all.
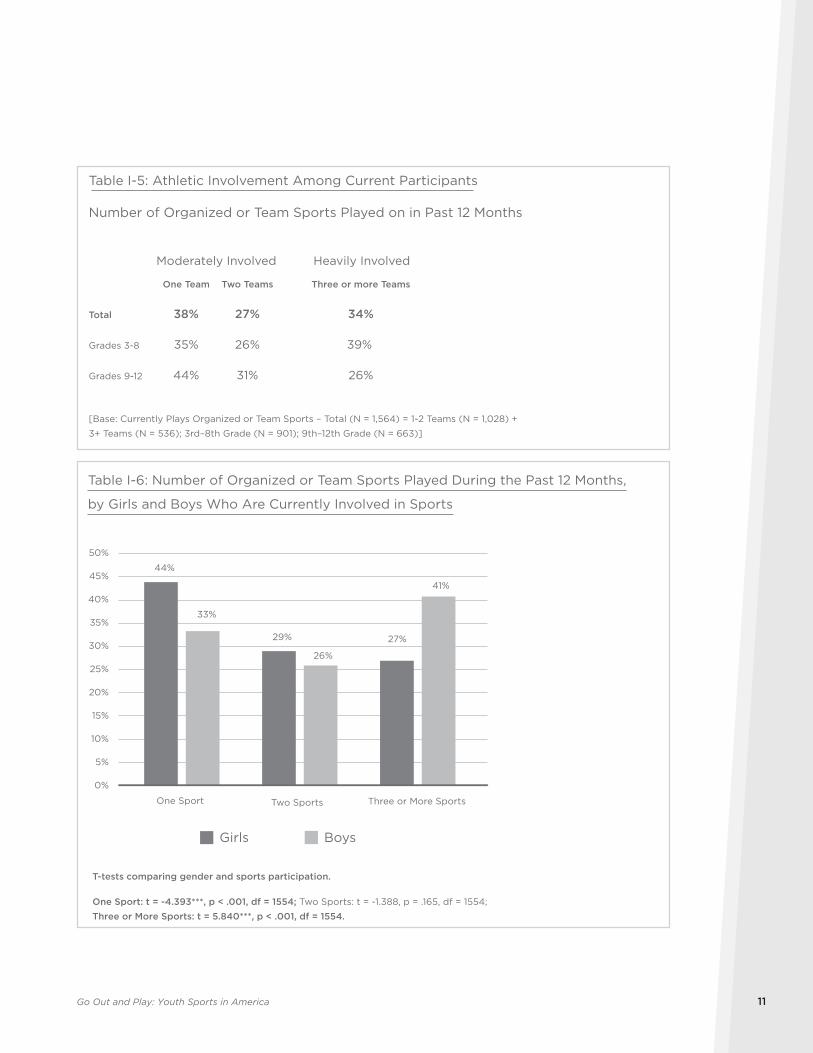
Extent of Involvement with SportAmong students who were involved with organized or
team sports during the past year, one-third played on
three or more teams. See Table I-5 on following page.
Overall, boys were more likely than girls to be “highly
involved athletes” (playing three or more sports, 31%
versus 19%), while girls were more likely than boys
to be “moderately involved athletes” (playing one
or two sports, 50% versus 44%). See Table I-6 on
following page.
In order to gauge the rates of athletic participation
among all third- to 12th-grade children in the
United States, we included non-athletes as well as
moderately involved and highly involved athletes. On
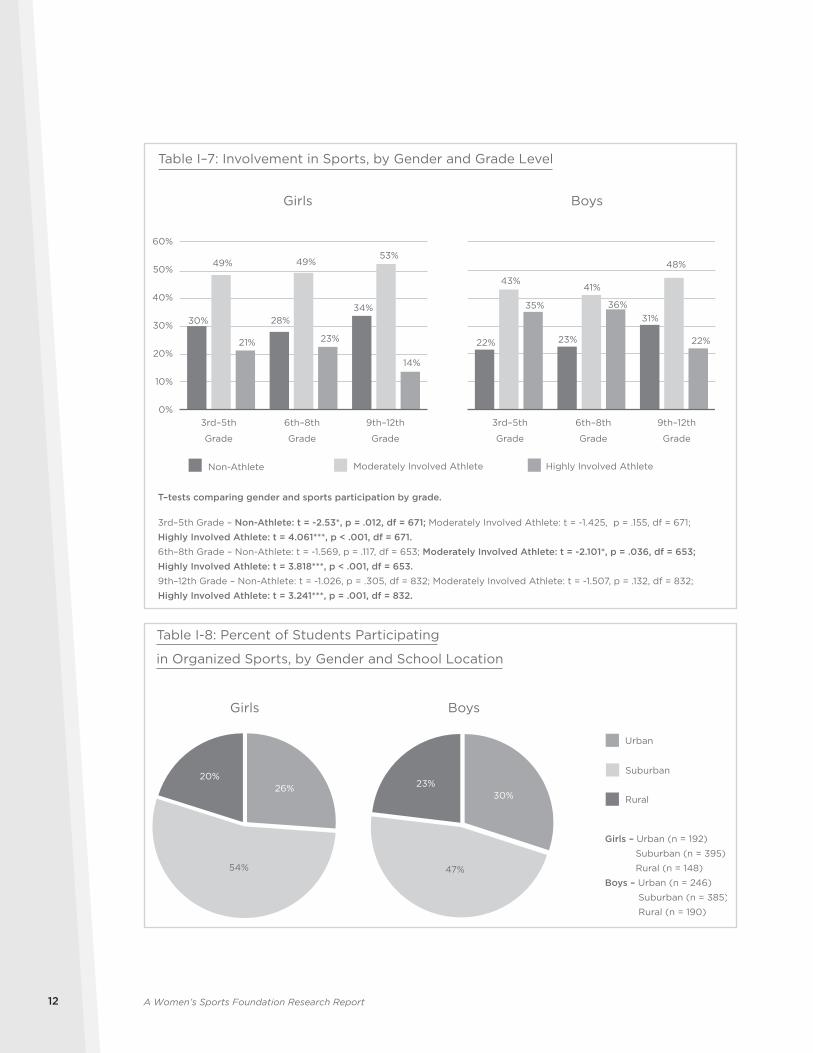
one hand, as the comparisons in Table I-7 (on page 12)
show, girls outnumbered boys as moderately involved
athletes at every grade level. On the other hand, the
moderately involved male athletes outnumbered their
highly involved peers at every grade level. In short,
within each gender, “moderation” was more common.
At the same time, across all grade levels, boys were
more likely than girls to be highly involved athletes.3
Finally, the largest numbers of U.S. girls and boys who
participated in at least one sport lived in suburban
communities. Rural communities had the lowest
proportion of all U.S. athletes for both girls and boys.
See Table I-8 on page 12.
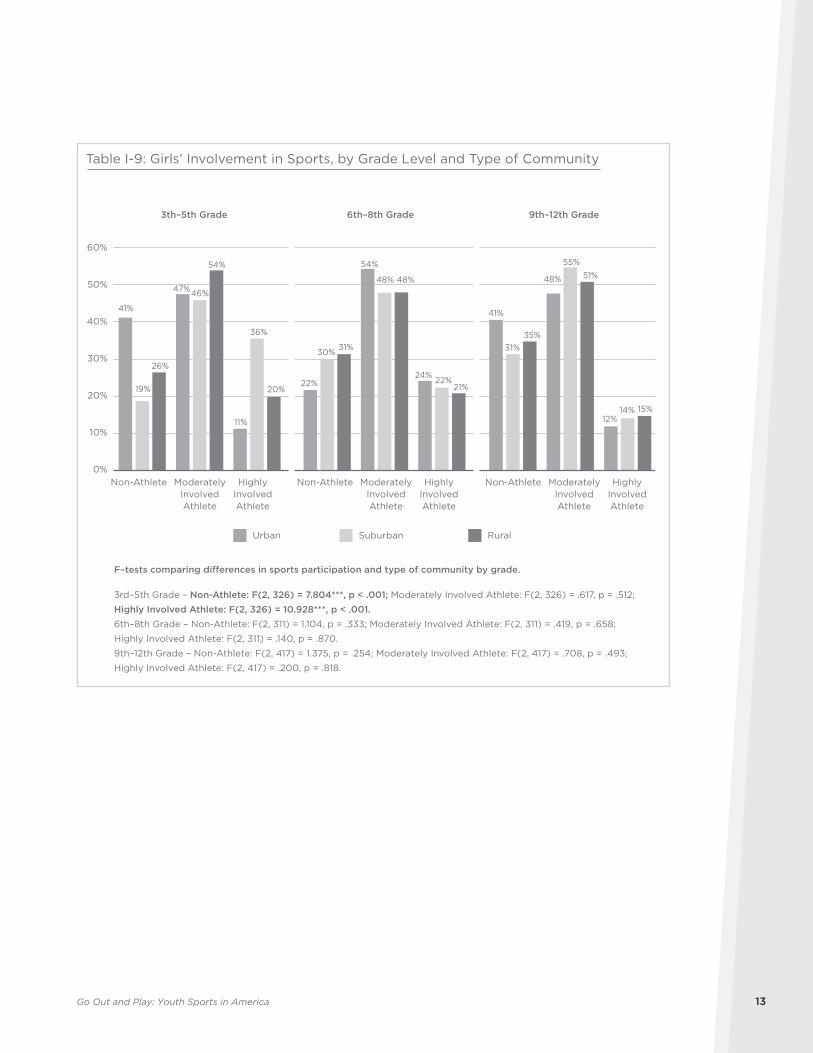
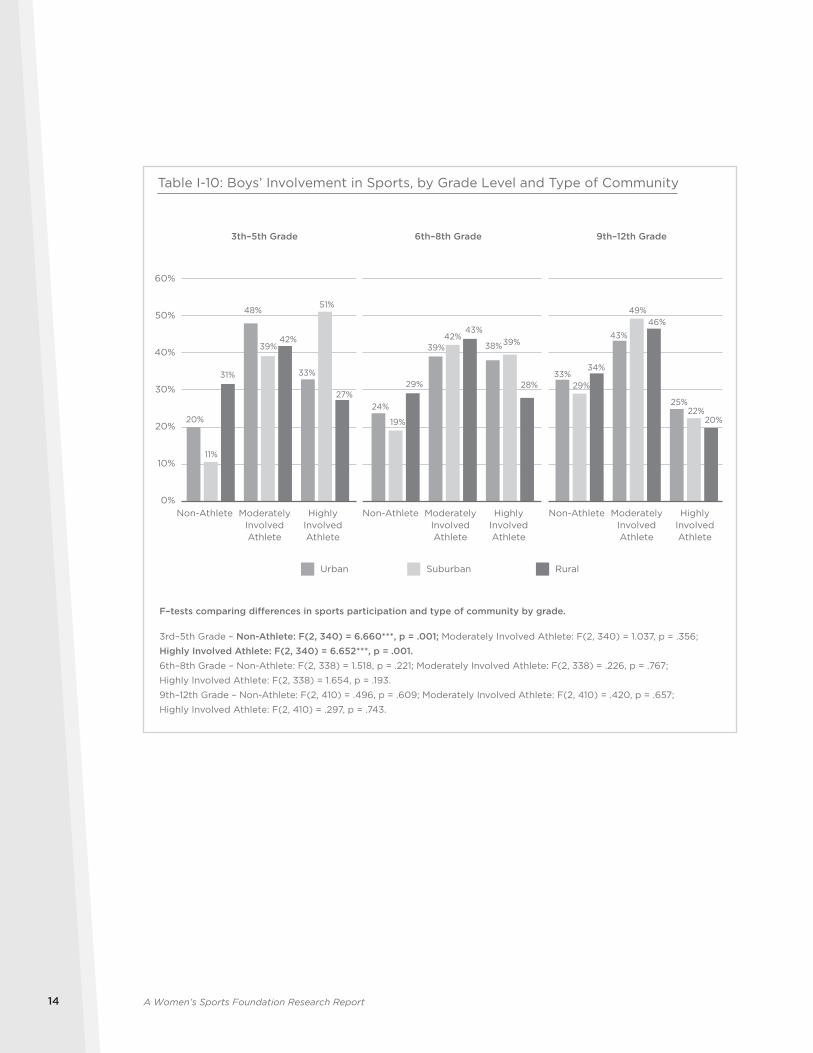
Involvement with sports varied not only by gender
but also by school location and grade level. See
Tables I-9 and I-10 on pages 13 and 14. Among third-
to fifth-graders, for example, urban girls were more
likely to be non-athletes than their suburban and
rural counterparts (41% versus 19% and 26%). When
the percentages of non-athletes at different grade
levels are compared, more girls were found to be
on the sidelines except in rural elementary schools.
Among urban elementary school children, boys were
half as likely to be non-athletes as girls (20% and
41%, respectively).
70% 72%
68%64%
79% 77%
70% 69%
50%
55%
60%
65%
70%
75%
80%
85%
90%
95%
100%
Girls Boys
Table I-4: Current Organized/Team Sport
Participation Rate, by Grade and Gender
T-tests comparing gender and current participation
in team sports by grade.
3rd–5th Grade: t = 2.530*, p = .012, df = 671.
6th–8th Grade: t = 1.569, p = .117, df = 653.
9th–10th Grade: t = .509, p = .611, df = 474.
11th–12th Grade: t = .981, p = .327, df = 355.
6th–8th
Grade
9th–10th
Grade
11th–12th
Grade
3rd–5th
Grade
Go Out and Play: Youth Sports in America 11
Table I-5: Athletic Involvement Among Current Participants
Number of Organized or Team Sports Played on in Past 12 Months
[Base: Currently Plays Organized or Team Sports – Total (N = 1,564) = 1-2 Teams (N = 1,028) +
3+ Teams (N = 536); 3rd–8th Grade (N = 901); 9th–12th Grade (N = 663)]
Moderately Involved Heavily Involved
One Team Two Teams Three or more Teams
Total 38% 27% 34%
Grades 3-8 35% 26% 39%
Grades 9-12 44% 31% 26%
44%
29% 27%
33%
26%
41%
0%
5%
10%
15%
20%
25%
30%
35%
40%
45%
50%
One Sport Two Sports Three or More Sports
Girls Boys
Table I-6: Number of Organized or Team Sports Played During the Past 12 Months,
by Girls and Boys Who Are Currently Involved in Sports
T-tests comparing gender and sports participation.
One Sport: t = -4.393***, p < .001, df = 1554; Two Sports: t = -1.388, p = .165, df = 1554;
Three or More Sports: t = 5.840***, p < .001, df = 1554.
A Women’s Sports Foundation Research Report12
Girls Boys
30% 28%34%
49% 49%53%
21% 23%
14%
0%
10%
20%
30%
40%
50%
60%
22% 23%
31%
43%41%
48%
35% 36%
22%
Moderately Involved Athlete Highly Involved Athlete
Table I–7: Involvement in Sports, by Gender and Grade Level
T–tests comparing gender and sports participation by grade.
3rd–5th Grade – Non-Athlete: t = -2.53*, p = .012, df = 671; Moderately Involved Athlete: t = -1.425, p = .155, df = 671;
Highly Involved Athlete: t = 4.061***, p < .001, df = 671.
6th–8th Grade – Non-Athlete: t = -1.569, p = .117, df = 653; Moderately Involved Athlete: t = -2.101*, p = .036, df = 653;
Highly Involved Athlete: t = 3.818***, p < .001, df = 653.
9th–12th Grade – Non-Athlete: t = -1.026, p = .305, df = 832; Moderately Involved Athlete: t = -1.507, p = .132, df = 832;
Highly Involved Athlete: t = 3.241***, p = .001, df = 832.
Non-Athlete
3rd–5th
Grade
6th–8th
Grade
9th–12th
Grade
3rd–5th
Grade
6th–8th
Grade
9th–12th
Grade
26%
54%
20%
Girls
30%
47%
23%
Boys
Urban
Suburban
Rural
Girls – Urban (n = 192)
Suburban (n = 395)
Rural (n = 148)
Boys – Urban (n = 246)
Suburban (n = 385)
Rural (n = 190)
Table I-8: Percent of Students Participating
in Organized Sports, by Gender and School Location
Go Out and Play: Youth Sports in America 13
41%
47%
11%
22%
54%
24%
41%
48%
12%
19%
46%
36%
30%
48%
22%
31%
55%
14%
26%
54%
20%
31%
48%
21%
35%
51%
15%
0%
10%
20%
30%
40%
50%
60%
Urban Suburban Rural
Table I-9: Girls’ Involvement in Sports, by Grade Level and Type of Community
Non-Athlete ModeratelyInvolvedAthlete
HighlyInvolvedAthlete
Non-Athlete ModeratelyInvolvedAthlete
HighlyInvolvedAthlete
Non-Athlete ModeratelyInvolvedAthlete
HighlyInvolvedAthlete
F–tests comparing differences in sports participation and type of community by grade.
3rd–5th Grade – Non-Athlete: F(2, 326) = 7.804***, p < .001; Moderately Involved Athlete: F(2, 326) = .617, p = .512;
Highly Involved Athlete: F(2, 326) = 10.928***, p < .001.
6th–8th Grade – Non-Athlete: F(2, 311) = 1.104, p = .333; Moderately Involved Athlete: F(2, 311) = .419, p = .658;
Highly Involved Athlete: F(2, 311) = .140, p = .870.
9th–12th Grade – Non-Athlete: F(2, 417) = 1.375, p = .254; Moderately Involved Athlete: F(2, 417) = .708, p = .493;
Highly Involved Athlete: F(2, 417) = .200, p = .818.
9th–12th Grade6th–8th Grade3th–5th Grade
A Women’s Sports Foundation Research Report14
20%
48%
33%
24%
39% 38%
33%
43%
25%
11%
39%
51%
19%
42%39%
29%
49%
22%
31%
42%
27%29%
43%
28%
34%
46%
20%
Table I-10: Boys’ Involvement in Sports, by Grade Level and Type of Community
F–tests comparing differences in sports participation and type of community by grade.
3rd–5th Grade – Non-Athlete: F(2, 340) = 6.660***, p = .001; Moderately Involved Athlete: F(2, 340) = 1.037, p = .356;
Highly Involved Athlete: F(2, 340) = 6.652***, p = .001.
6th–8th Grade – Non-Athlete: F(2, 338) = 1.518, p = .221; Moderately Involved Athlete: F(2, 338) = .226, p = .767;
Highly Involved Athlete: F(2, 338) = 1.654, p = .193.
9th–12th Grade – Non-Athlete: F(2, 410) = .496, p = .609; Moderately Involved Athlete: F(2, 410) = .420, p = .657;
Highly Involved Athlete: F(2, 410) = .297, p = .743.
0%
10%
20%
30%
40%
50%
60%
Urban Suburban Rural
Non-Athlete ModeratelyInvolvedAthlete
HighlyInvolvedAthlete
Non-Athlete ModeratelyInvolvedAthlete
HighlyInvolvedAthlete
Non-Athlete ModeratelyInvolvedAthlete
HighlyInvolvedAthlete
9th–12th Grade6th–8th Grade3th–5th Grade
Go Out and Play: Youth Sports in America 15
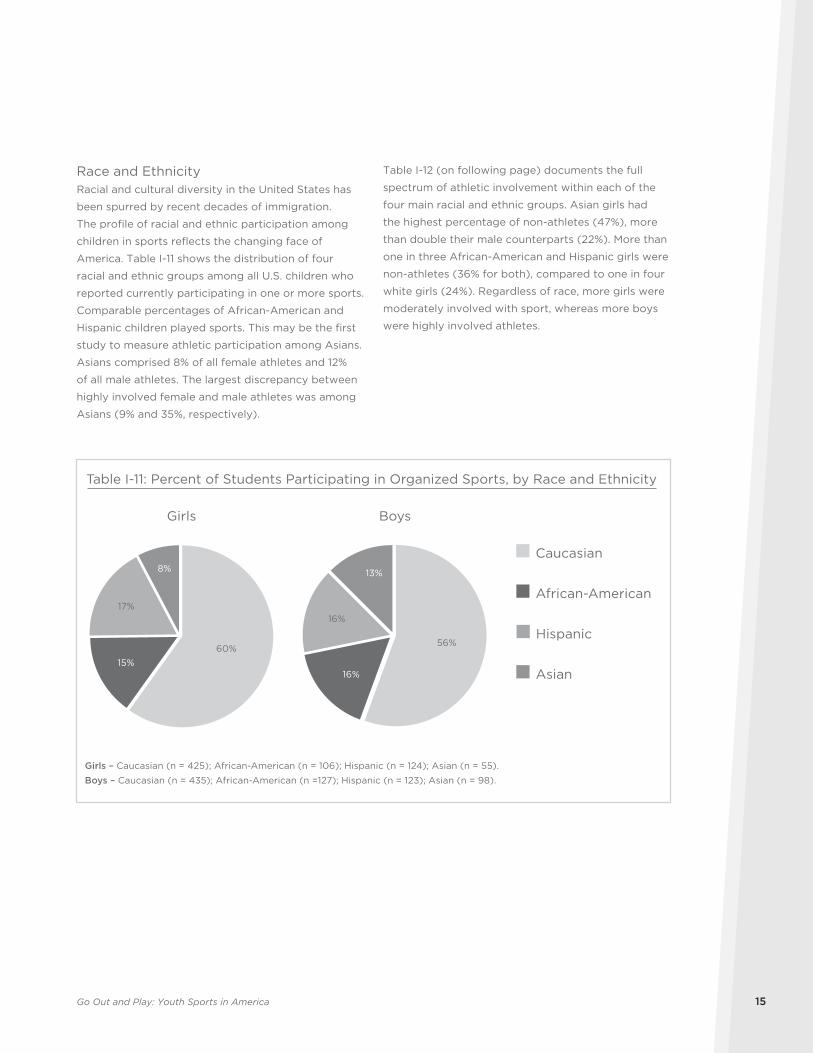
Race and EthnicityRacial and cultural diversity in the United States has
been spurred by recent decades of immigration.
The profile of racial and ethnic participation among
children in sports reflects the changing face of
America. Table I-11 shows the distribution of four
racial and ethnic groups among all U.S. children who
reported currently participating in one or more sports.
Comparable percentages of African-American and
Hispanic children played sports. This may be the first
study to measure athletic participation among Asians.
Asians comprised 8% of all female athletes and 12%
of all male athletes. The largest discrepancy between
highly involved female and male athletes was among
Asians (9% and 35%, respectively).
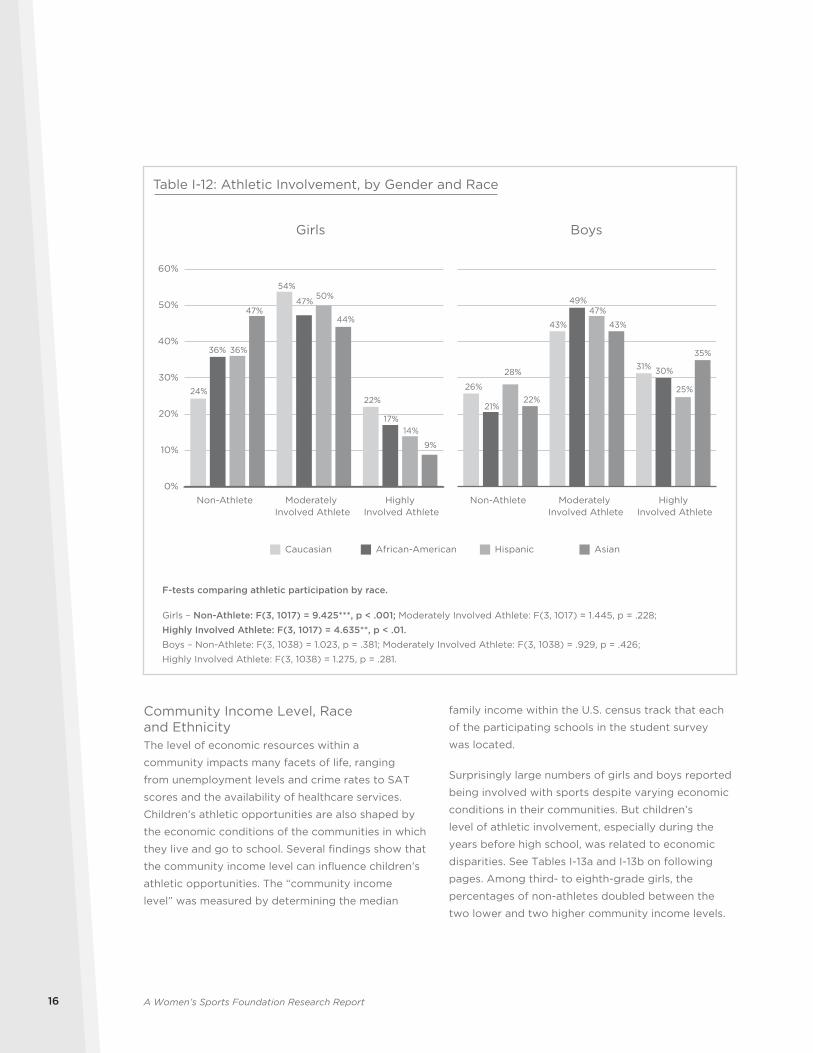
Table I-12 (on following page) documents the full
spectrum of athletic involvement within each of the
four main racial and ethnic groups. Asian girls had
the highest percentage of non-athletes (47%), more
than double their male counterparts (22%). More than
one in three African-American and Hispanic girls were
non-athletes (36% for both), compared to one in four
white girls (24%). Regardless of race, more girls were
moderately involved with sport, whereas more boys
were highly involved athletes.
60%
15%
17%
8%
Girls
56%
16%
16%
13%
Boys
Caucasian
African-American
Hispanic
Asian
Table I-11: Percent of Students Participating in Organized Sports, by Race and Ethnicity
Girls – Caucasian (n = 425); African-American (n = 106); Hispanic (n = 124); Asian (n = 55).
Boys – Caucasian (n = 435); African-American (n =127); Hispanic (n = 123); Asian (n = 98).
A Women’s Sports Foundation Research Report16
Community Income Level, Race and EthnicityThe level of economic resources within a
community impacts many facets of life, ranging
from unemployment levels and crime rates to SAT
scores and the availability of healthcare services.
Children’s athletic opportunities are also shaped by
the economic conditions of the communities in which
they live and go to school. Several findings show that
the community income level can influence children’s
athletic opportunities. The “community income
level” was measured by determining the median
family income within the U.S. census track that each
of the participating schools in the student survey
was located.
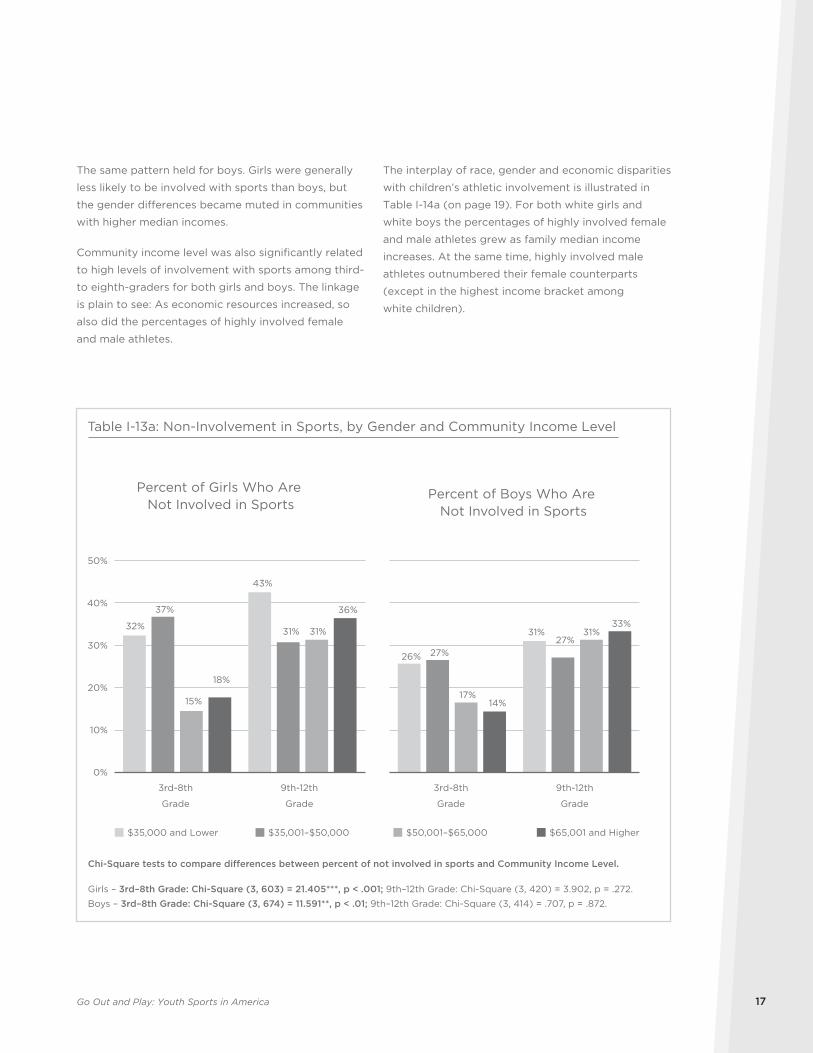
Surprisingly large numbers of girls and boys reported
being involved with sports despite varying economic
conditions in their communities. But children’s
level of athletic involvement, especially during the
years before high school, was related to economic
disparities. See Tables I-13a and I-13b on following
pages. Among third- to eighth-grade girls, the
percentages of non-athletes doubled between the
two lower and two higher community income levels.
Girls
24%
54%
22%
36%
47%
17%
36%
50%
14%
47%44%
9%
0%
10%
20%
30%
40%
50%
60%
Caucasian African-American Hispanic Asian
Boys
26%
43%
31%
21%
49%
30%28%
47%
25%22%
43%
35%
F-tests comparing athletic participation by race.
Girls – Non-Athlete: F(3, 1017) = 9.425***, p < .001; Moderately Involved Athlete: F(3, 1017) = 1.445, p = .228;
Highly Involved Athlete: F(3, 1017) = 4.635**, p < .01.
Boys – Non-Athlete: F(3, 1038) = 1.023, p = .381; Moderately Involved Athlete: F(3, 1038) = .929, p = .426;
Highly Involved Athlete: F(3, 1038) = 1.275, p = .281.
Table I-12: Athletic Involvement, by Gender and Race
Non-Athlete Moderately Involved Athlete
Highly Involved Athlete
Non-Athlete Moderately Involved Athlete
Highly Involved Athlete
Go Out and Play: Youth Sports in America 17
The same pattern held for boys. Girls were generally
less likely to be involved with sports than boys, but
the gender differences became muted in communities
with higher median incomes.
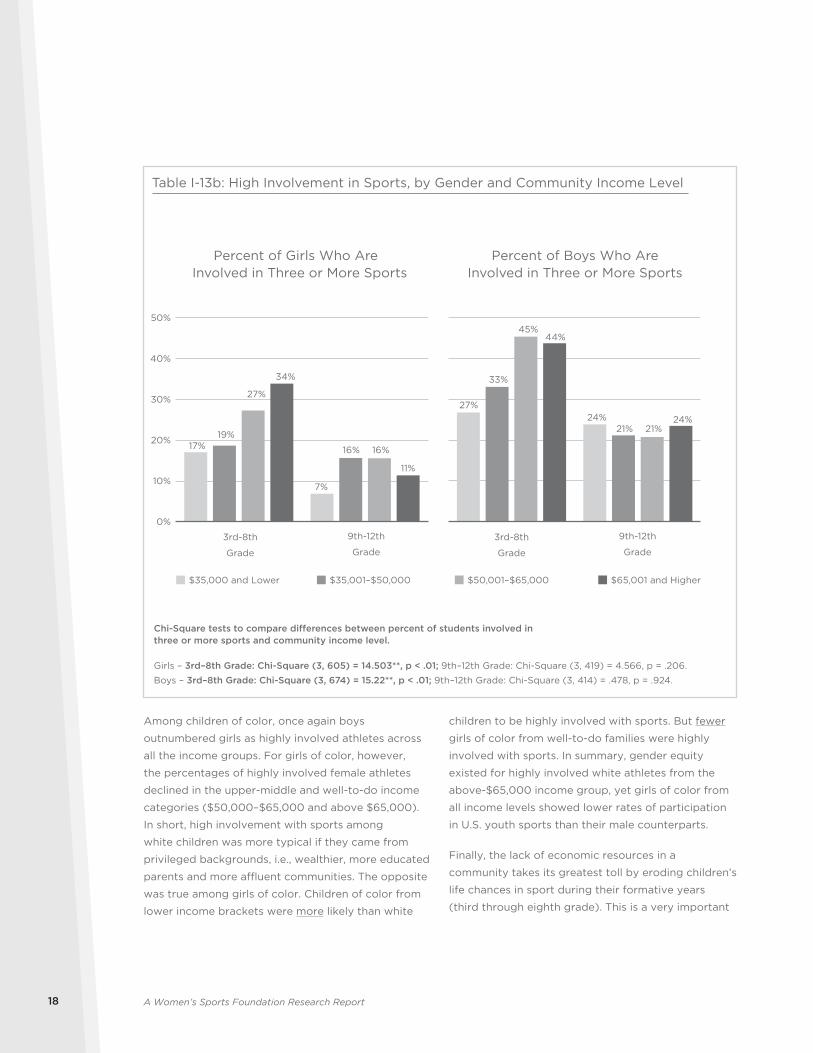
Community income level was also significantly related
to high levels of involvement with sports among third-
to eighth-graders for both girls and boys. The linkage
is plain to see: As economic resources increased, so
also did the percentages of highly involved female
and male athletes.
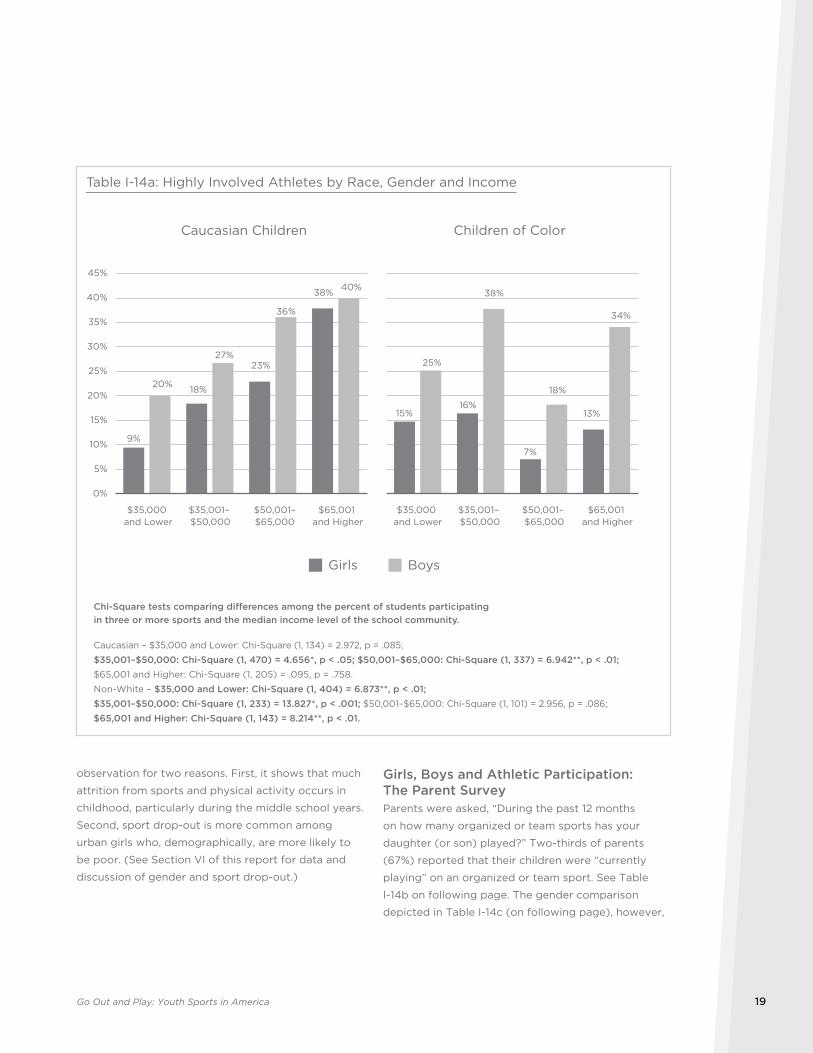
The interplay of race, gender and economic disparities
with children’s athletic involvement is illustrated in
Table I-14a (on page 19). For both white girls and
white boys the percentages of highly involved female
and male athletes grew as family median income
increases. At the same time, highly involved male
athletes outnumbered their female counterparts
(except in the highest income bracket among
white children).
32%
43%
37%
31%
15%
31%
18%
36%
0%
10%
20%
30%
40%
50%
$35,000 and Lower $35,001–$50,000 $50,001–$65,000 $65,001 and Higher
26%
31%
27%27%
17%
31%
14%
33%
Table I-13a: Non-Involvement in Sports, by Gender and Community Income Level
Percent of Girls Who Are Not Involved in Sports
Percent of Boys Who Are Not Involved in Sports
Chi-Square tests to compare differences between percent of not involved in sports and Community Income Level.
Girls – 3rd–8th Grade: Chi-Square (3, 603) = 21.405***, p < .001; 9th–12th Grade: Chi-Square (3, 420) = 3.902, p = .272.
Boys – 3rd–8th Grade: Chi-Square (3, 674) = 11.591**, p < .01; 9th–12th Grade: Chi-Square (3, 414) = .707, p = .872.
3rd-8th
Grade
9th-12th
Grade
3rd-8th
Grade
9th-12th
Grade
A Women’s Sports Foundation Research Report18
Among children of color, once again boys
outnumbered girls as highly involved athletes across
all the income groups. For girls of color, however,
the percentages of highly involved female athletes
declined in the upper-middle and well-to-do income
categories ($50,000–$65,000 and above $65,000).
In short, high involvement with sports among
white children was more typical if they came from
privileged backgrounds, i.e., wealthier, more educated
parents and more affluent communities. The opposite
was true among girls of color. Children of color from
lower income brackets were more likely than white
children to be highly involved with sports. But fewer
girls of color from well-to-do families were highly
involved with sports. In summary, gender equity
existed for highly involved white athletes from the
above-$65,000 income group, yet girls of color from
all income levels showed lower rates of participation
in U.S. youth sports than their male counterparts.
Finally, the lack of economic resources in a
community takes its greatest toll by eroding children’s
life chances in sport during their formative years
(third through eighth grade). This is a very important
0%
10%
20%
30%
40%
50%
17%
7%
19%
16%
27%
16%
34%
11%
27%24%
33%
21%
45%
21%
44%
24%
Table I-13b: High Involvement in Sports, by Gender and Community Income Level
Chi-Square tests to compare differences between percent of students involved in three or more sports and community income level.
Girls – 3rd–8th Grade: Chi-Square (3, 605) = 14.503**, p < .01; 9th–12th Grade: Chi-Square (3, 419) = 4.566, p = .206.
Boys – 3rd–8th Grade: Chi-Square (3, 674) = 15.22**, p < .01; 9th–12th Grade: Chi-Square (3, 414) = .478, p = .924.
$35,000 and Lower $35,001–$50,000 $50,001–$65,000 $65,001 and Higher
Percent of Girls Who Are Involved in Three or More Sports
Percent of Boys Who AreInvolved in Three or More Sports
3rd-8th
Grade
9th-12th
Grade
3rd-8th
Grade
9th-12th
Grade
Go Out and Play: Youth Sports in America 19
observation for two reasons. First, it shows that much
attrition from sports and physical activity occurs in
childhood, particularly during the middle school years.
Second, sport drop-out is more common among
urban girls who, demographically, are more likely to
be poor. (See Section VI of this report for data and
discussion of gender and sport drop-out.)
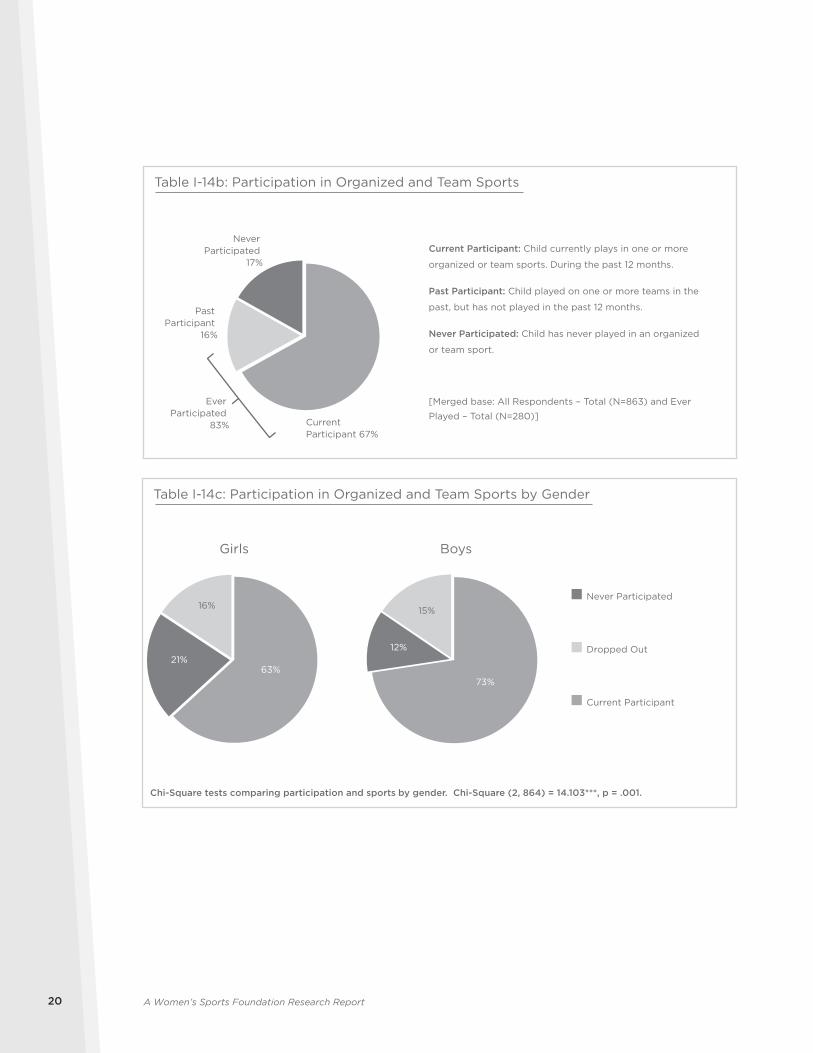
Girls, Boys and Athletic Participation: The Parent SurveyParents were asked, “During the past 12 months
on how many organized or team sports has your
daughter (or son) played?” Two-thirds of parents
(67%) reported that their children were “currently
playing” on an organized or team sport. See Table
I-14b on following page. The gender comparison
depicted in Table I-14c (on following page), however,
Caucasian Children
9%
18%
23%
38%
20%
27%
36%
40%
0%
5%
10%
15%
20%
25%
30%
35%
40%
45%
Children of Color
15%16%
7%
13%
25%
38%
18%
34%
Girls Boys
Table I-14a: Highly Involved Athletes by Race, Gender and Income
$35,000 and Lower
$35,001– $50,000
$50,001–$65,000
$65,001 and Higher
$35,000 and Lower
$35,001– $50,000
$50,001– $65,000
$65,001 and Higher
Chi-Square tests comparing differences among the percent of students participating in three or more sports and the median income level of the school community.
Caucasian – $35,000 and Lower: Chi-Square (1, 134) = 2.972, p = .085;
$35,001–$50,000: Chi-Square (1, 470) = 4.656*, p < .05; $50,001–$65,000: Chi-Square (1, 337) = 6.942**, p < .01;
$65,001 and Higher: Chi-Square (1, 205) = .095, p = .758.
Non-White – $35,000 and Lower: Chi-Square (1, 404) = 6.873**, p < .01;
$35,001–$50,000: Chi-Square (1, 233) = 13.827*, p < .001; $50,001–$65,000: Chi-Square (1, 101) = 2.956, p = .086;
$65,001 and Higher: Chi-Square (1, 143) = 8.214**, p < .01.
A Women’s Sports Foundation Research Report20
Table I-14b: Participation in Organized and Team Sports
Current Participant: Child currently plays in one or more
organized or team sports. During the past 12 months.
Past Participant: Child played on one or more teams in the
past, but has not played in the past 12 months.
Never Participated: Child has never played in an organized
or team sport.
[Merged base: All Respondents – Total (N=863) and Ever
Played – Total (N=280)]
Never Participated
17%
Current Participant 67%
Past Participant
16%
Ever Participated
83%
63%21%
16%
Girls
73%
12%
15%
Boys
Table I-14c: Participation in Organized and Team Sports by Gender
Chi-Square tests comparing participation and sports by gender. Chi-Square (2, 864) = 14.103***, p = .001.
Never Participated
Dropped Out
Current Participant
Go Out and Play: Youth Sports in America 21
shows that 73% of boys and 63% of girls played on
one or more organized or team sports during the
past year. In contrast, roughly equal percentages of
girls and boys (15% and 16%, respectively) played on
a team in the past, but had not participated during
the previous 12 months. Finally, more daughters (21%)
than sons (13%) were said to have “never played”
organized sports.
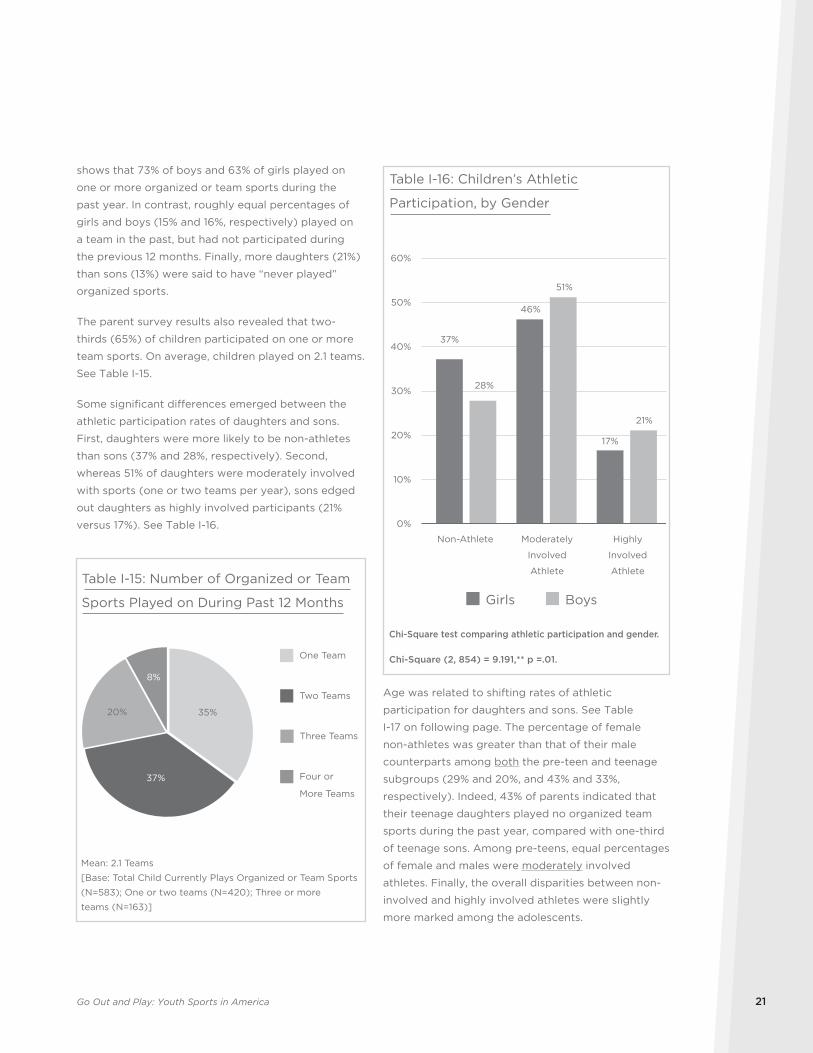
The parent survey results also revealed that two-
thirds (65%) of children participated on one or more
team sports. On average, children played on 2.1 teams.
See Table I-15.
Some significant differences emerged between the
athletic participation rates of daughters and sons.
First, daughters were more likely to be non-athletes
than sons (37% and 28%, respectively). Second,
whereas 51% of daughters were moderately involved
with sports (one or two teams per year), sons edged
out daughters as highly involved participants (21%
versus 17%). See Table I-16.
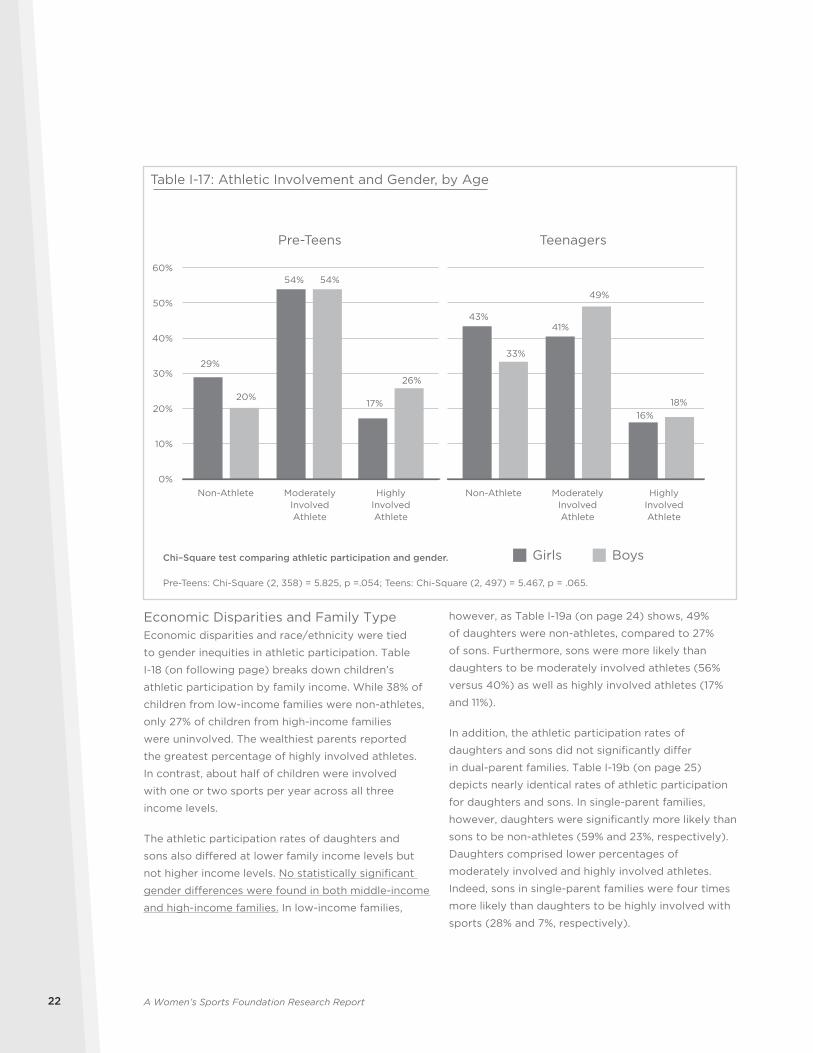
Age was related to shifting rates of athletic
participation for daughters and sons. See Table
I-17 on following page. The percentage of female
non-athletes was greater than that of their male
counterparts among both the pre-teen and teenage
subgroups (29% and 20%, and 43% and 33%,
respectively). Indeed, 43% of parents indicated that
their teenage daughters played no organized team
sports during the past year, compared with one-third
of teenage sons. Among pre-teens, equal percentages
of female and males were moderately involved
athletes. Finally, the overall disparities between non-
involved and highly involved athletes were slightly
more marked among the adolescents.
Table I-15: Number of Organized or Team
Sports Played on During Past 12 Months
Mean: 2.1 Teams
[Base: Total Child Currently Plays Organized or Team Sports
(N=583); One or two teams (N=420); Three or more
teams (N=163)]
One Team
Two Teams
Three Teams
Four or
More Teams
35%
37%
20%
8%
37%
46%
17%
28%
51%
21%
0%
10%
20%
30%
40%
50%
60%
Highly
Involved
Athlete
Girls Boys
Table I-16: Children’s Athletic
Participation, by Gender
Chi-Square test comparing athletic participation and gender.
Chi-Square (2, 854) = 9.191,** p =.01.
Non-Athlete Moderately
Involved
Athlete
A Women’s Sports Foundation Research Report22
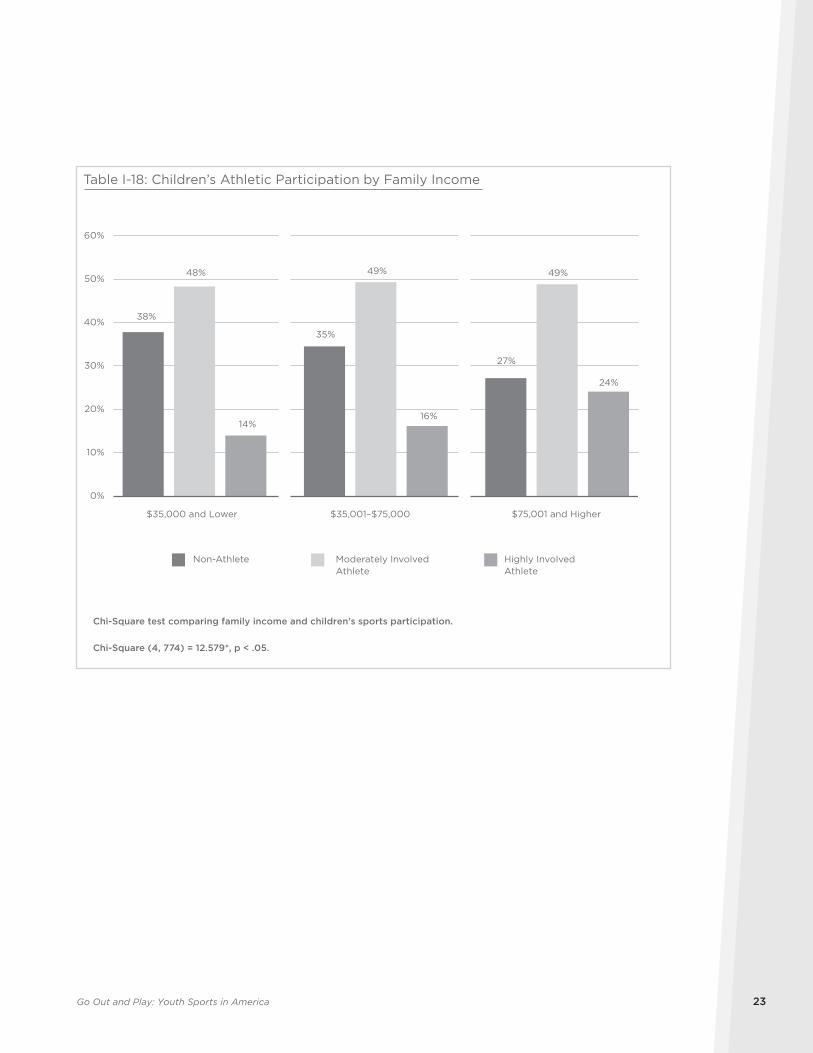
Economic Disparities and Family Type Economic disparities and race/ethnicity were tied
to gender inequities in athletic participation. Table
I-18 (on following page) breaks down children’s
athletic participation by family income. While 38% of
children from low-income families were non-athletes,
only 27% of children from high-income families
were uninvolved. The wealthiest parents reported
the greatest percentage of highly involved athletes.
In contrast, about half of children were involved
with one or two sports per year across all three
income levels.
The athletic participation rates of daughters and
sons also differed at lower family income levels but
not higher income levels. No statistically significant
gender differences were found in both middle-income
and high-income families. In low-income families,
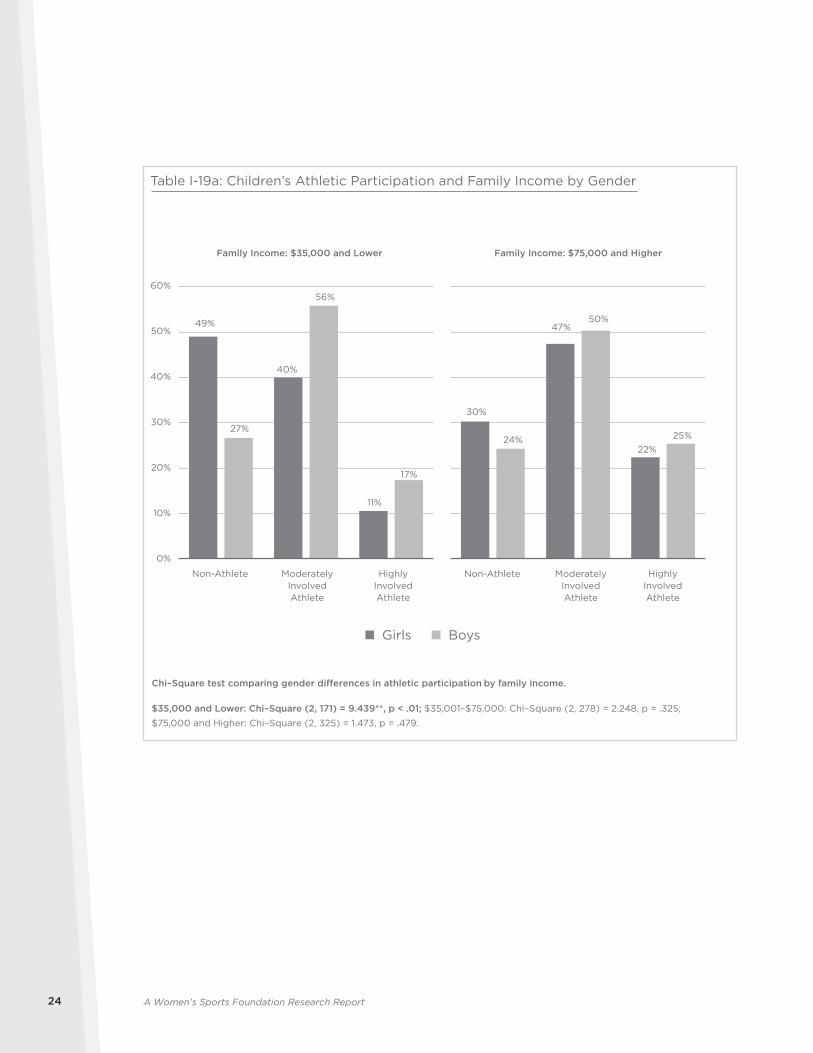
however, as Table I-19a (on page 24) shows, 49%
of daughters were non-athletes, compared to 27%
of sons. Furthermore, sons were more likely than
daughters to be moderately involved athletes (56%
versus 40%) as well as highly involved athletes (17%
and 11%).
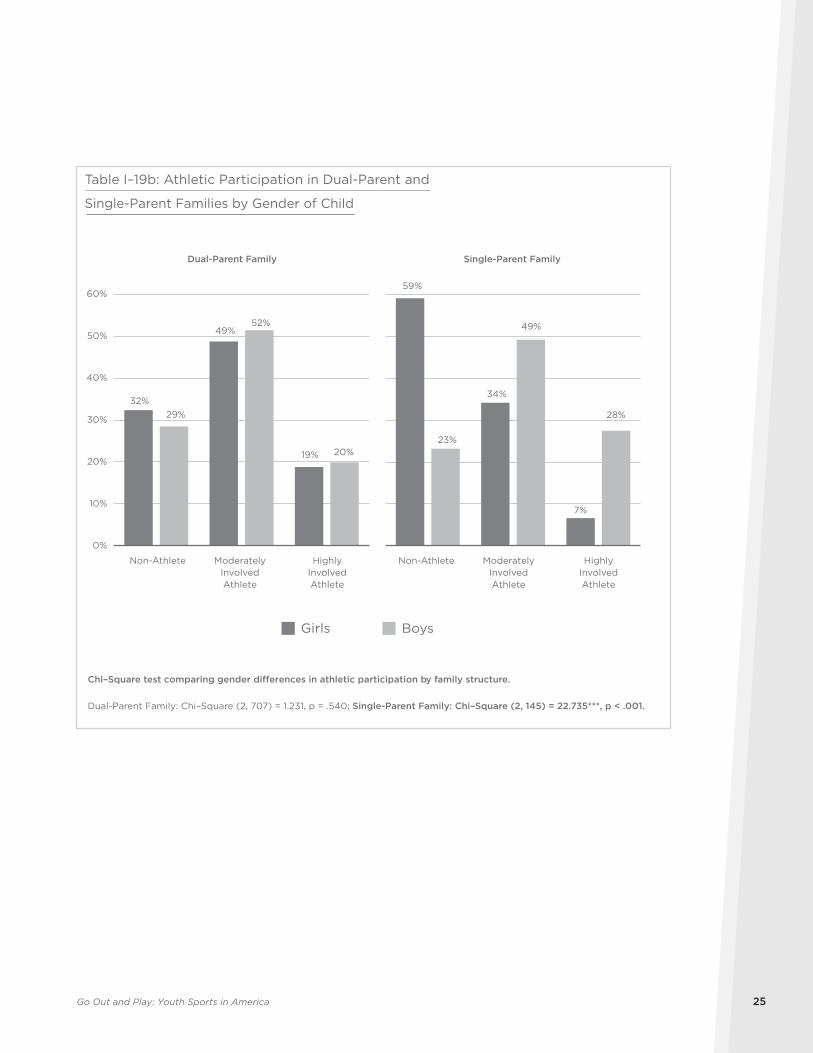
In addition, the athletic participation rates of
daughters and sons did not significantly differ
in dual-parent families. Table I-19b (on page 25)
depicts nearly identical rates of athletic participation
for daughters and sons. In single-parent families,
however, daughters were significantly more likely than
sons to be non-athletes (59% and 23%, respectively).
Daughters comprised lower percentages of
moderately involved and highly involved athletes.
Indeed, sons in single-parent families were four times
more likely than daughters to be highly involved with
sports (28% and 7%, respectively).
29%
54%
17%
43%41%
16%
20%
54%
26%
33%
49%
18%
0%
10%
20%
30%
40%
50%
60%
Girls Boys
Teenagers
HighlyInvolvedAthlete
Non-Athlete ModeratelyInvolvedAthlete
HighlyInvolvedAthlete
Non-Athlete ModeratelyInvolvedAthlete
Table I-17: Athletic Involvement and Gender, by Age
Pre-Teens
Chi–Square test comparing athletic participation and gender.
Pre-Teens: Chi-Square (2, 358) = 5.825, p =.054; Teens: Chi-Square (2, 497) = 5.467, p = .065.
Go Out and Play: Youth Sports in America 23
38%
35%
27%
48% 49% 49%
14%16%
24%
0%
10%
20%
30%
40%
50%
60%
Table I-18: Children’s Athletic Participation by Family Income
Chi-Square test comparing family income and children’s sports participation.
Chi-Square (4, 774) = 12.579*, p < .05.
Highly Involved Athlete
Non-Athlete Moderately Involved Athlete
$35,000 and Lower $35,001–$75,000 $75,001 and Higher
A Women’s Sports Foundation Research Report24
49%
40%
11%
27%
56%
17%
0%
10%
20%
30%
40%
50%
60%
Girls Boys
30%
47%
22%24%
50%
25%
Table I-19a: Children’s Athletic Participation and Family Income by Gender
Family Income: $35,000 and Lower Family Income: $75,000 and Higher
Chi–Square test comparing gender differences in athletic participation by family income.
$35,000 and Lower: Chi–Square (2, 171) = 9.439**, p < .01; $35,001–$75,000: Chi–Square (2, 278) = 2.248, p = .325;
$75,000 and Higher: Chi–Square (2, 325) = 1.473, p = .479.
HighlyInvolvedAthlete
Non-Athlete ModeratelyInvolvedAthlete
HighlyInvolvedAthlete
Non-Athlete ModeratelyInvolvedAthlete
Go Out and Play: Youth Sports in America 25
32%
49%
19%
29%
52%
20%
0%
10%
20%
30%
40%
50%
60%
Girls Boys
59%
34%
7%
23%
49%
28%
Table I–19b: Athletic Participation in Dual-Parent and
Single-Parent Families by Gender of Child
Dual-Parent Family Single-Parent Family
Chi–Square test comparing gender differences in athletic participation by family structure.
Dual-Parent Family: Chi–Square (2, 707) = 1.231, p = .540; Single-Parent Family: Chi–Square (2, 145) = 22.735***, p < .001.
HighlyInvolvedAthlete
Non-Athlete ModeratelyInvolvedAthlete
HighlyInvolvedAthlete
Non-Athlete ModeratelyInvolvedAthlete
A Women’s Sports Foundation Research Report26
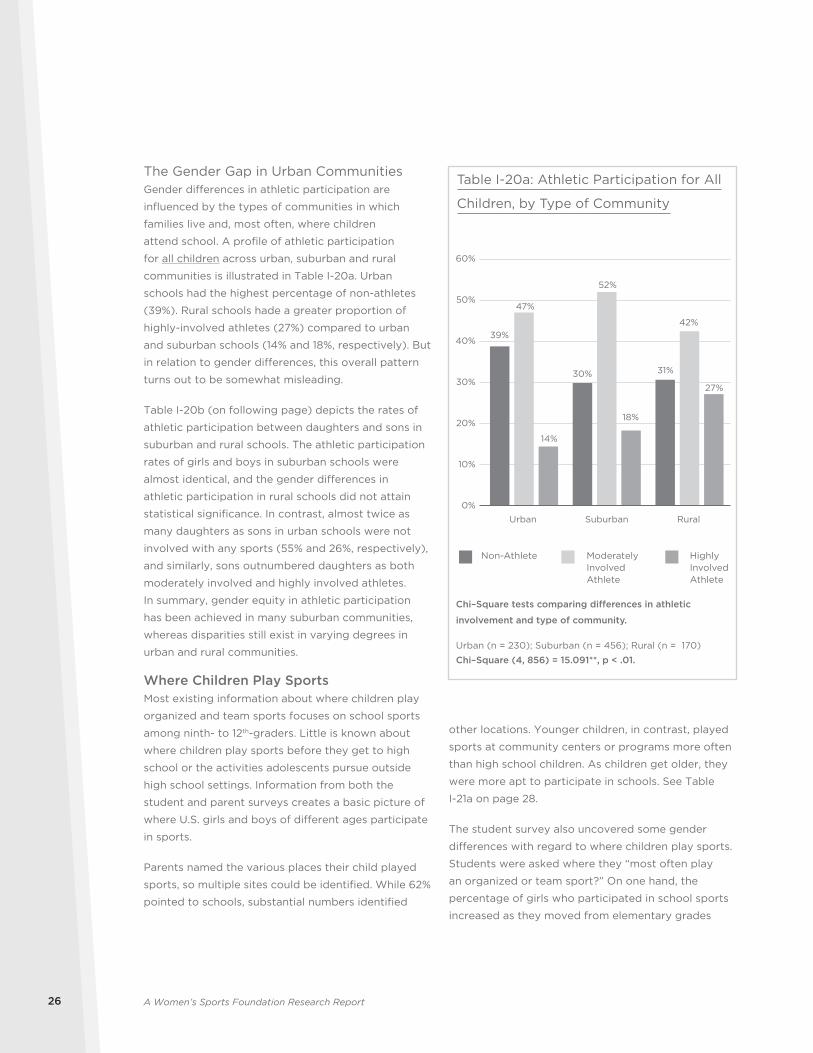
The Gender Gap in Urban CommunitiesGender differences in athletic participation are
influenced by the types of communities in which
families live and, most often, where children
attend school. A profile of athletic participation
for all children across urban, suburban and rural
communities is illustrated in Table I-20a. Urban
schools had the highest percentage of non-athletes
(39%). Rural schools hade a greater proportion of
highly-involved athletes (27%) compared to urban
and suburban schools (14% and 18%, respectively). But
in relation to gender differences, this overall pattern
turns out to be somewhat misleading.
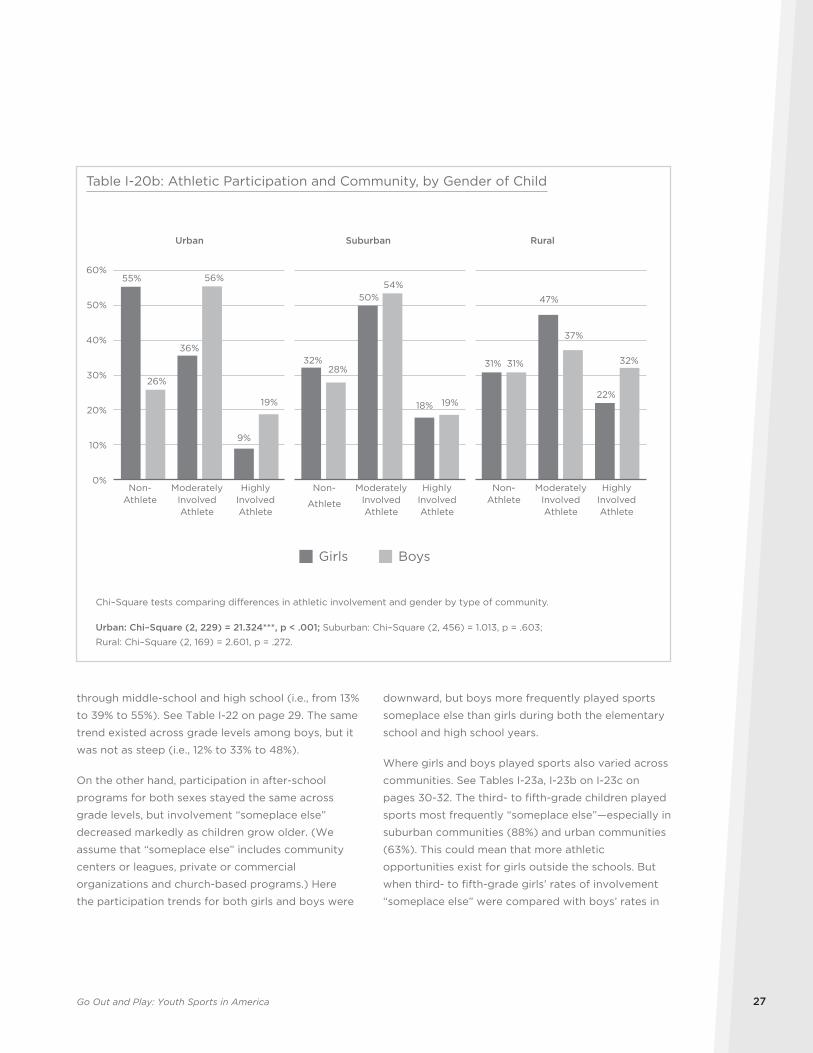
Table I-20b (on following page) depicts the rates of
athletic participation between daughters and sons in
suburban and rural schools. The athletic participation
rates of girls and boys in suburban schools were
almost identical, and the gender differences in
athletic participation in rural schools did not attain
statistical significance. In contrast, almost twice as
many daughters as sons in urban schools were not
involved with any sports (55% and 26%, respectively),
and similarly, sons outnumbered daughters as both
moderately involved and highly involved athletes.
In summary, gender equity in athletic participation
has been achieved in many suburban communities,
whereas disparities still exist in varying degrees in
urban and rural communities.
Where Children Play SportsMost existing information about where children play
organized and team sports focuses on school sports
among ninth- to 12th-graders. Little is known about
where children play sports before they get to high
school or the activities adolescents pursue outside
high school settings. Information from both the
student and parent surveys creates a basic picture of
where U.S. girls and boys of different ages participate
in sports.
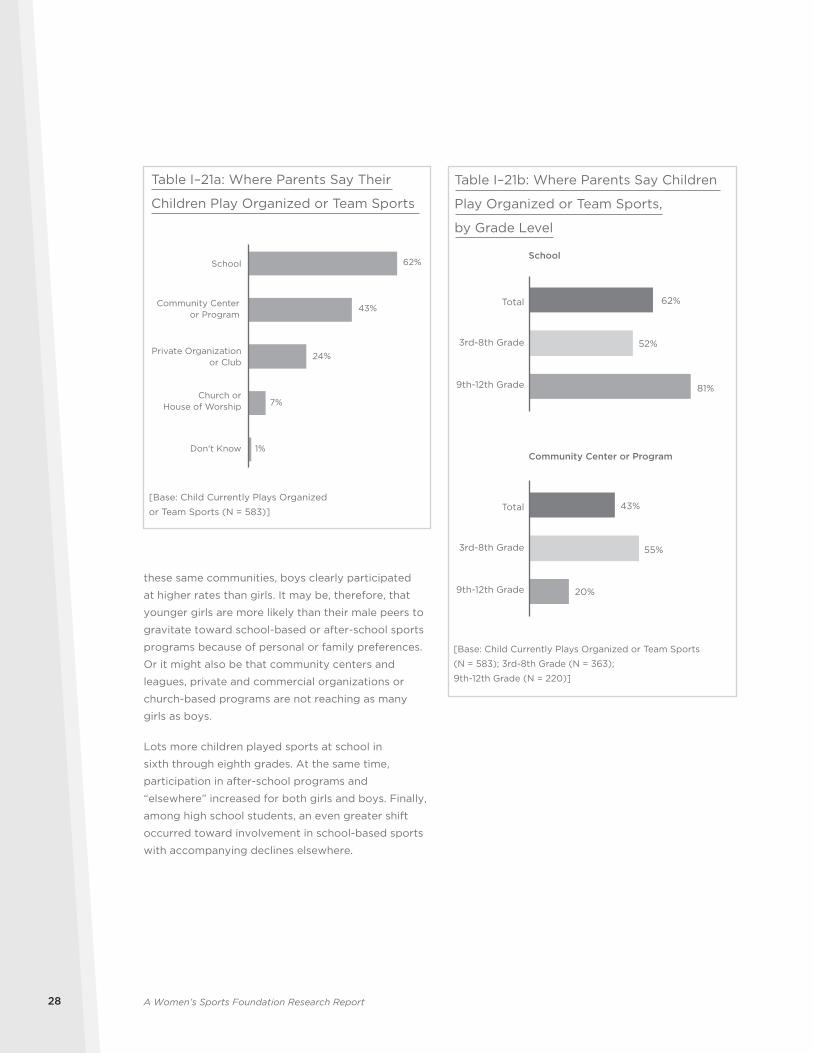
Parents named the various places their child played
sports, so multiple sites could be identified. While 62%
pointed to schools, substantial numbers identified
39%
30% 31%
47%
52%
42%
14%
18%
27%
0%
10%
20%
30%
40%
50%
60%
Urban Suburban Rural
Table I-20a: Athletic Participation for All
Children, by Type of Community
Chi–Square tests comparing differences in athletic
involvement and type of community.
Urban (n = 230); Suburban (n = 456); Rural (n = 170)
Chi–Square (4, 856) = 15.091**, p < .01.
Highly InvolvedAthlete
Non-Athlete Moderately InvolvedAthlete
other locations. Younger children, in contrast, played
sports at community centers or programs more often
than high school children. As children get older, they
were more apt to participate in schools. See Table
I-21a on page 28.
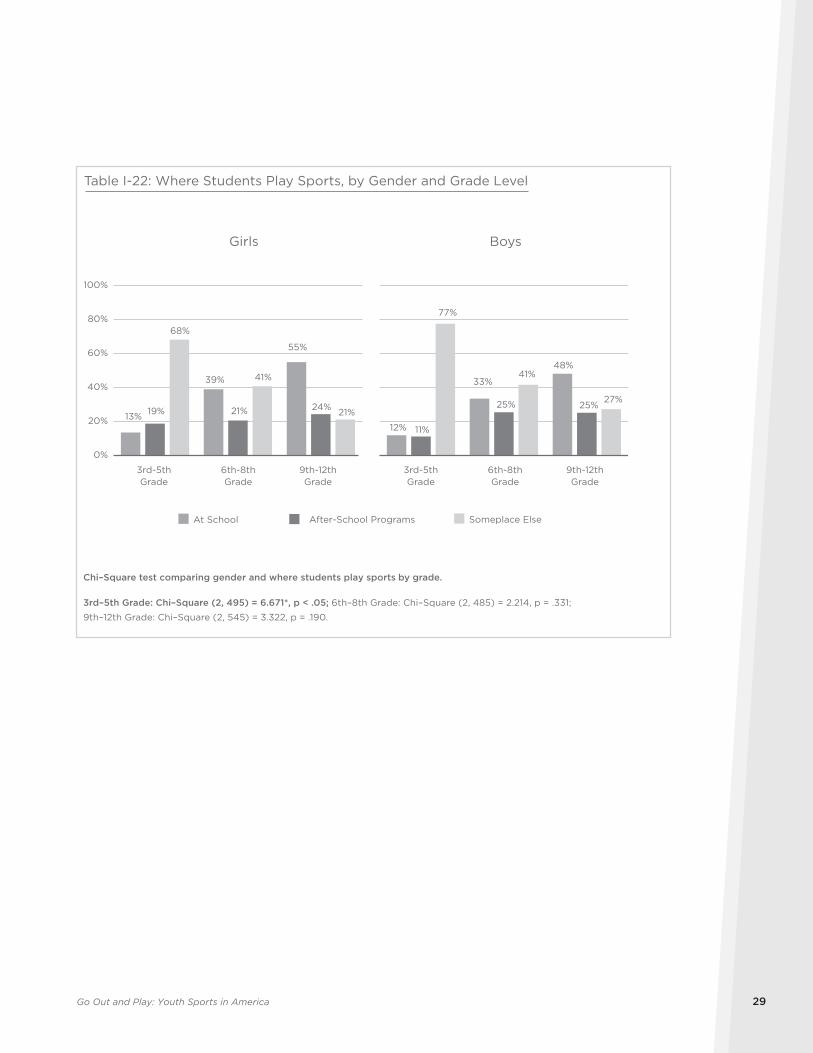
The student survey also uncovered some gender
differences with regard to where children play sports.
Students were asked where they “most often play
an organized or team sport?” On one hand, the
percentage of girls who participated in school sports
increased as they moved from elementary grades
Go Out and Play: Youth Sports in America 27
through middle-school and high school (i.e., from 13%
to 39% to 55%). See Table I-22 on page 29. The same
trend existed across grade levels among boys, but it
was not as steep (i.e., 12% to 33% to 48%).
On the other hand, participation in after-school
programs for both sexes stayed the same across
grade levels, but involvement “someplace else”
decreased markedly as children grow older. (We
assume that “someplace else” includes community
centers or leagues, private or commercial
organizations and church-based programs.) Here
the participation trends for both girls and boys were
downward, but boys more frequently played sports
someplace else than girls during both the elementary
school and high school years.
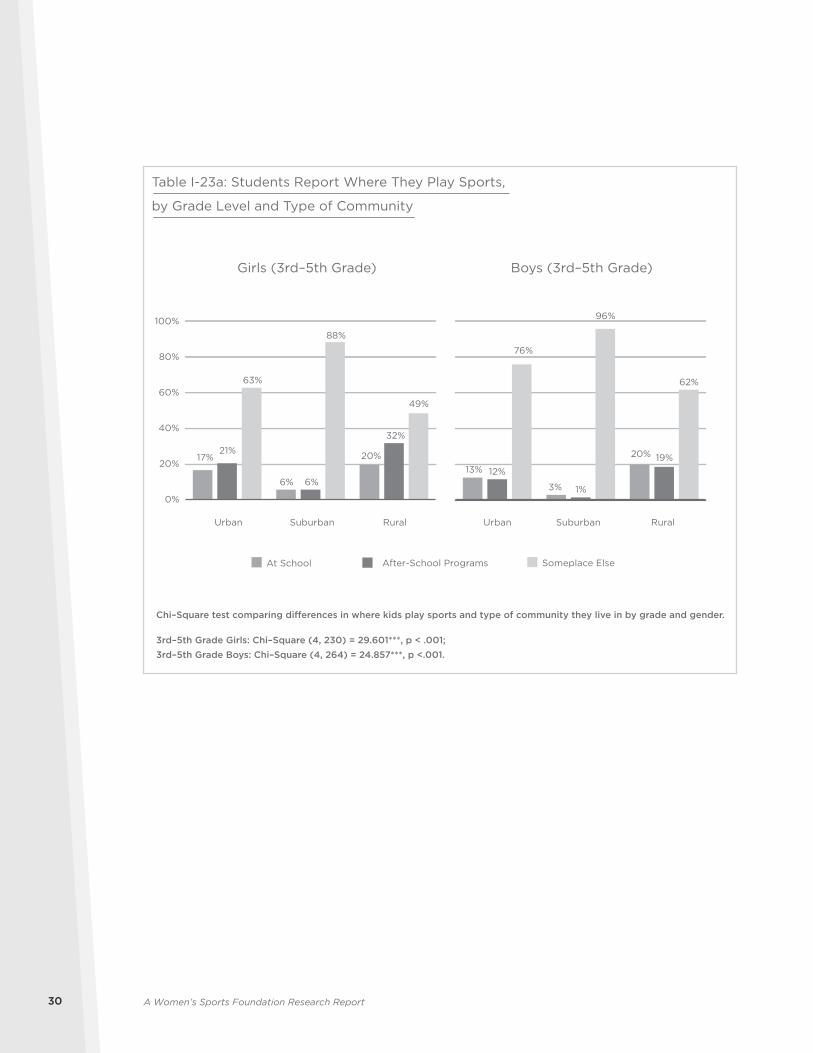
Where girls and boys played sports also varied across
communities. See Tables I-23a, I-23b on I-23c on
pages 30-32. The third- to fifth-grade children played
sports most frequently “someplace else”—especially in
suburban communities (88%) and urban communities
(63%). This could mean that more athletic
opportunities exist for girls outside the schools. But
when third- to fifth-grade girls’ rates of involvement
“someplace else” were compared with boys’ rates in
55%
36%
9%
32%
50%
18%
31%
47%
22%26%
56%
19%
28%
54%
19%
31%
37%
32%
0%
10%
20%
30%
40%
50%
60%
Girls Boys
Urban Suburban Rural
Table I-20b: Athletic Participation and Community, by Gender of Child
Chi–Square tests comparing differences in athletic involvement and gender by type of community.
Urban: Chi–Square (2, 229) = 21.324***, p < .001; Suburban: Chi–Square (2, 456) = 1.013, p = .603;
Rural: Chi–Square (2, 169) = 2.601, p = .272.
HighlyInvolvedAthlete
Non-Athlete
ModeratelyInvolvedAthlete
HighlyInvolvedAthlete
HighlyInvolvedAthlete
Non-Athlete
ModeratelyInvolvedAthlete
Non-
Athlete
ModeratelyInvolvedAthlete
A Women’s Sports Foundation Research Report28
these same communities, boys clearly participated
at higher rates than girls. It may be, therefore, that
younger girls are more likely than their male peers to
gravitate toward school-based or after-school sports
programs because of personal or family preferences.
Or it might also be that community centers and
leagues, private and commercial organizations or
church-based programs are not reaching as many
girls as boys.
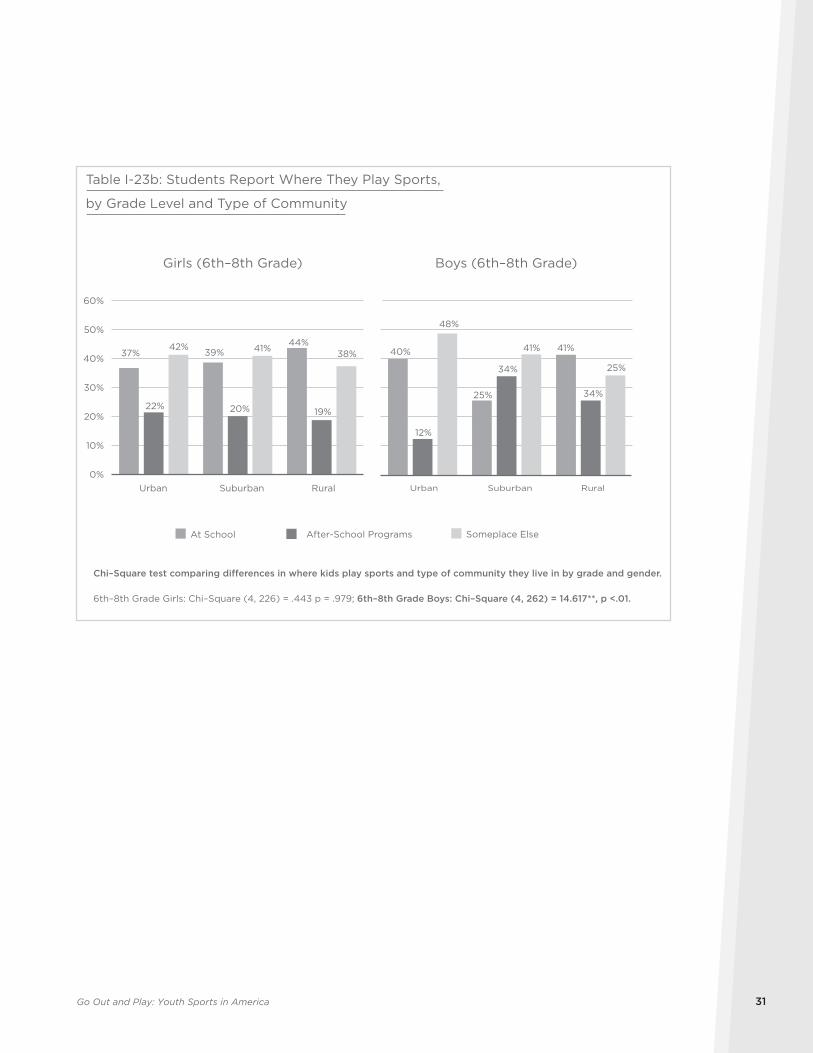
Lots more children played sports at school in
sixth through eighth grades. At the same time,
participation in after-school programs and
“elsewhere” increased for both girls and boys. Finally,
among high school students, an even greater shift
occurred toward involvement in school-based sports
with accompanying declines elsewhere.
62%
43%
24%
7%
1%
School
Don't Know
Table I–21a: Where Parents Say Their
Children Play Organized or Team Sports
Community Centeror Program
Private Organizationor Club
Church orHouse of Worship
[Base: Child Currently Plays Organized
or Team Sports (N = 583)]
62%
52%
81%
43%
55%
20%
School
Total
[Base: Child Currently Plays Organized or Team Sports
(N = 583); 3rd-8th Grade (N = 363);
9th-12th Grade (N = 220)]
Table I–21b: Where Parents Say Children
Play Organized or Team Sports,
by Grade Level
Community Center or Program
3rd-8th Grade
9th-12th Grade
Total
3rd-8th Grade
9th-12th Grade
Go Out and Play: Youth Sports in America 29
Girls
At School Someplace Else
Boys
13%
39%
55%
19% 21% 24%
68%
41%
21%
12%
33%
48%
11%
25% 25%
77%
41%
27%
Table I-22: Where Students Play Sports, by Gender and Grade Level
Chi–Square test comparing gender and where students play sports by grade.
3rd–5th Grade: Chi–Square (2, 495) = 6.671*, p < .05; 6th–8th Grade: Chi–Square (2, 485) = 2.214, p = .331;
9th–12th Grade: Chi–Square (2, 545) = 3.322, p = .190.
3rd-5thGrade
6th-8thGrade
9th-12thGrade
3rd-5thGrade
6th-8thGrade
9th-12thGrade
After-School Programs
0%
20%
40%
60%
80%
100%
A Women’s Sports Foundation Research Report30
0%
20%
40%
60%
80%
100%
Urban Suburban Rural
17%
6%
20%21%
6%
32%
63%
88%
49%
13%
3%
20%
12%
1%
19%
76%
96%
62%
Urban Suburban Rural
Table I-23a: Students Report Where They Play Sports,
by Grade Level and Type of Community
Girls (3rd–5th Grade) Boys (3rd–5th Grade)
Chi–Square test comparing differences in where kids play sports and type of community they live in by grade and gender.
3rd–5th Grade Girls: Chi–Square (4, 230) = 29.601***, p < .001;
3rd–5th Grade Boys: Chi–Square (4, 264) = 24.857***, p <.001.
At School Someplace ElseAfter-School Programs
Go Out and Play: Youth Sports in America 31
0%
10%
20%
30%
40%
50%
60%
Urban Suburban Rural
37% 39%44%
22% 20% 19%
42% 41% 38% 40%
25%
41%
12%
34% 25%
48%
41%
34%
Urban Suburban Rural
Table I-23b: Students Report Where They Play Sports,
by Grade Level and Type of Community
Girls (6th–8th Grade) Boys (6th–8th Grade)
At School Someplace ElseAfter-School Programs
Chi–Square test comparing differences in where kids play sports and type of community they live in by grade and gender.
6th–8th Grade Girls: Chi–Square (4, 226) = .443 p = .979; 6th–8th Grade Boys: Chi–Square (4, 262) = 14.617**, p <.01.
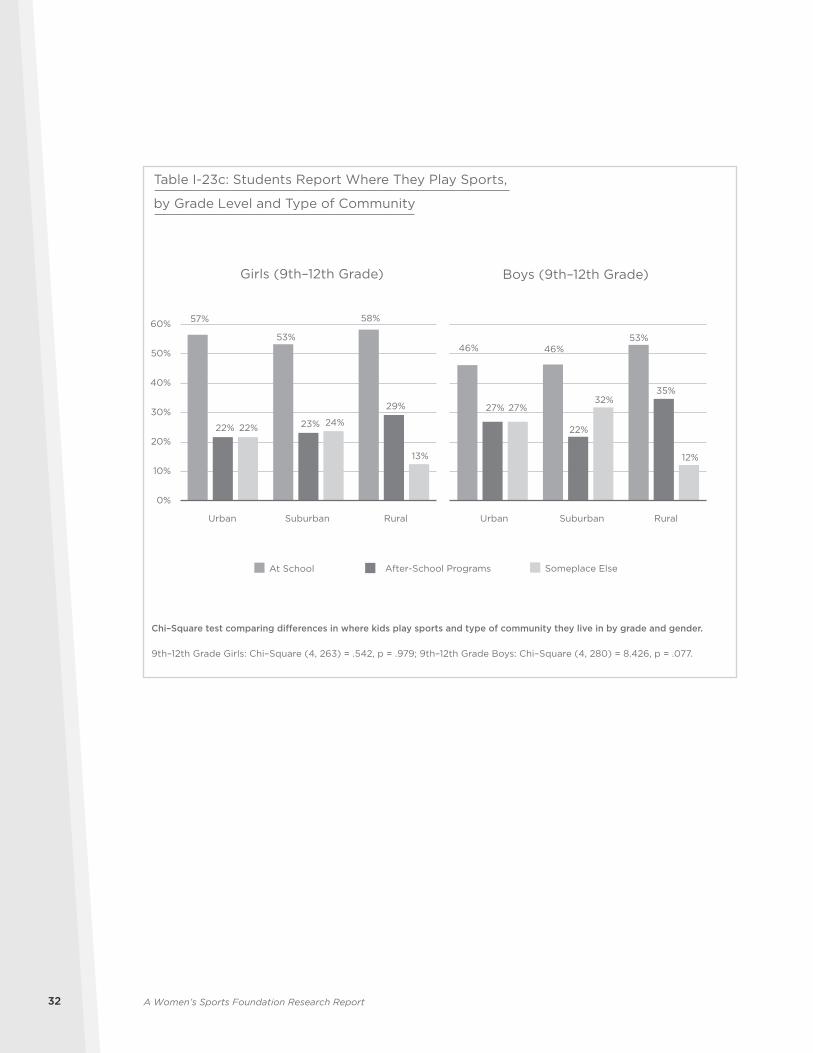
A Women’s Sports Foundation Research Report32
At School Someplace ElseAfter-School Programs
57%
53%
58%
22% 23%
29%
22% 24%
13%
0%
10%
20%
30%
40%
50%
60%
Urban Suburban Rural
46% 46%53%
27%
22%
35%
27%32%
12%
Urban Suburban Rural
Table I-23c: Students Report Where They Play Sports,
by Grade Level and Type of Community
Girls (9th–12th Grade) Boys (9th–12th Grade)
Chi–Square test comparing differences in where kids play sports and type of community they live in by grade and gender.
9th–12th Grade Girls: Chi–Square (4, 263) = .542, p = .979; 9th–12th Grade Boys: Chi–Square (4, 280) = 8.426, p = .077.
Go Out and Play: Youth Sports in America 33
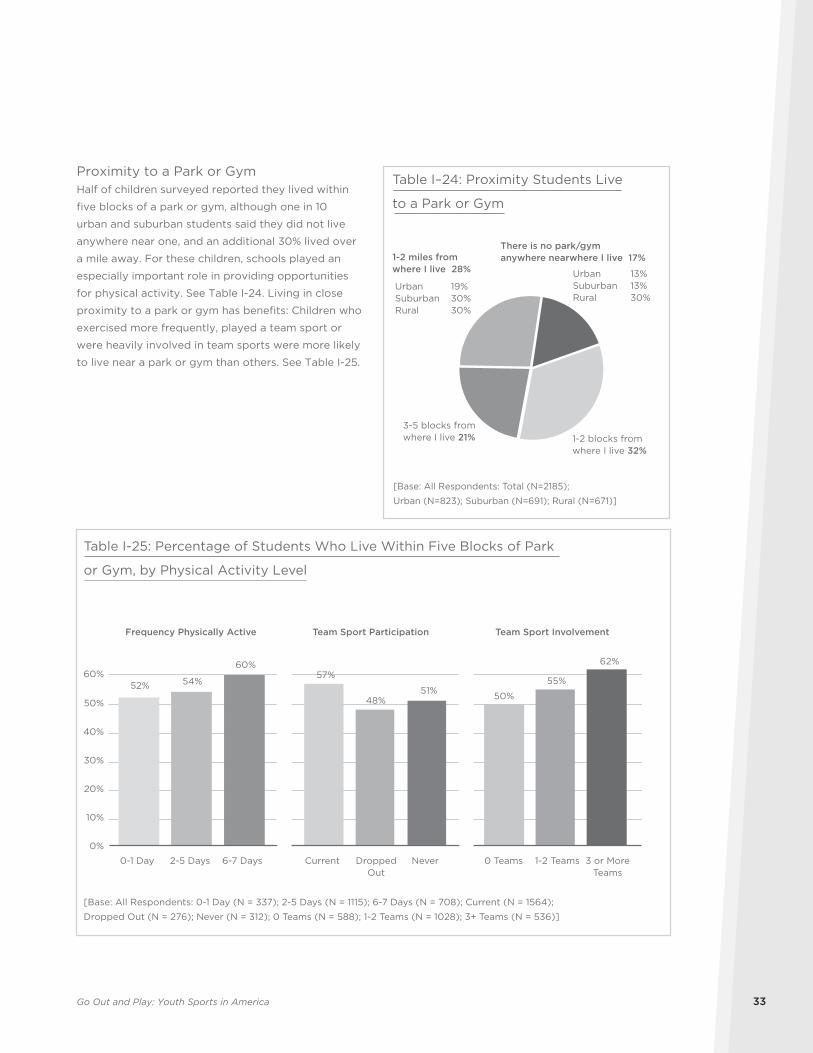
Proximity to a Park or GymHalf of children surveyed reported they lived within
five blocks of a park or gym, although one in 10
urban and suburban students said they did not live
anywhere near one, and an additional 30% lived over
a mile away. For these children, schools played an
especially important role in providing opportunities
for physical activity. See Table I-24. Living in close
proximity to a park or gym has benefits: Children who
exercised more frequently, played a team sport or
were heavily involved in team sports were more likely
to live near a park or gym than others. See Table I-25.
Table I–24: Proximity Students Live
to a Park or Gym
[Base: All Respondents: Total (N=2185);
Urban (N=823); Suburban (N=691); Rural (N=671)]
3-5 blocks from where I live 21% 1-2 blocks from
where I live 32%
There is no park/gym anywhere nearwhere I live 17%1-2 miles from
where I live 28% Urban 13%Suburban 13%Rural 30%
Urban 19%Suburban 30%Rural 30%
0%
10%
20%
30%
40%
50%
60%52% 54%
60%
0-1 Day 2-5 Days 6-7 Days
57%
48%51%
Current DroppedOut
Never
50%
55%
62%
0 Teams 1-2 Teams 3 or MoreTeams
Frequency Physically Active Team Sport Participation Team Sport Involvement
Table I-25: Percentage of Students Who Live Within Five Blocks of Park
or Gym, by Physical Activity Level
[Base: All Respondents: 0-1 Day (N = 337); 2-5 Days (N = 1115); 6-7 Days (N = 708); Current (N = 1564);
Dropped Out (N = 276); Never (N = 312); 0 Teams (N = 588); 1-2 Teams (N = 1028); 3+ Teams (N = 536)]

A Women’s Sports Foundation Research Report34
ConclusionWhile more girls are participating in sports than ever
before in American history, a gender gap stretches
across youth sports that favors males over females,
sons over daughters. The width of the gender gap
is not uniform, however, and it varies across grade
levels, communities, income levels and racial and
ethnic groups.
A recent historical overview of shifts in high school
athletic participation since the passage of Title IX
found that its benefits “were disproportionately
reaped by those at the top of the income
distribution.”4 The evidence here basically supports
this contention, but it also extends its application.
The gender gap emerges long before children reach
high school. Boys’ greater access to sports appears to
be sewn into current institutional arrangements that
impact third- to fifth-graders. A variety of factors—
individually distinguishable yet interdependent—are
related to girls’ and boys’ athletic participation: i.e.,
where children live and go to school (urban, suburban
and rural areas), their family’s income, race and
ethnicity, age differences and grade level.
Our findings suggest that if children are female, live in
an urban area and are growing up in a lower-income
single-parent family, they are less likely to be involved
with sports during childhood and adolescence.
Children’s life chances in sport, or the probabilities
that they will ever play and benefit from sports, flow
from the intersections between personal preferences
and social opportunities. Suburban girls have more
sport options than their urban and rural counterparts.
The chances that a poor girl will never play a sport are
greater than an upper-middle-class girl. Fewer urban
girls participate in sports than their male counterparts.
And these and other patterns of gender inequity and
differential opportunity differ between children’s
elementary school years, the middle school years and
high school phase of adolescence.
Go Out and Play: Youth Sports in America 35
Part II: Participation in Sports and Exercise ActivitiesIf asked to name the most popular youth sports
in 1975, the typical parent would probably have
cited basketball, football, baseball, track and field,
swimming and diving, and perhaps, bowling, skiing,
wrestling and gymnastics. Many of these same parents
would also have equated “sports” to boys’ and men’s
sports because so few girls were involved. In contrast,
today, most parents conjure up girls as well as boys
when they think “sports,” and they refer to a wide
array of activities under the umbrella of “sport and
exercise” that include the old standards but also
athletic activities such as volleyball, soccer, cycling,
lacrosse, field hockey, figure skating, inline skating,
skateboarding, dance, ultimate Frisbee, cheerleading,
double Dutch and stepping.
What kinds of sports and exercise activities do girls
and boys currently pursue? How often do girls and
boys exercise each week? What are the most popular
sports and exercise activities for girls and boys?
What kinds of factors appear to influence young
people’s involvement with sports and exercise? These
questions are answered in this section.
Diversity in the Types of Sports and ExerciseIn order to gather information about the full array of
physical activities that are popular among American
youth, we asked third- through 12th-grade students,
“During the past 12 months, which of the following
sports or exercises have you done?” The students
checked any of the 32 types of sports and exercise
activities listed, and they could also write in an activity
that was not listed.
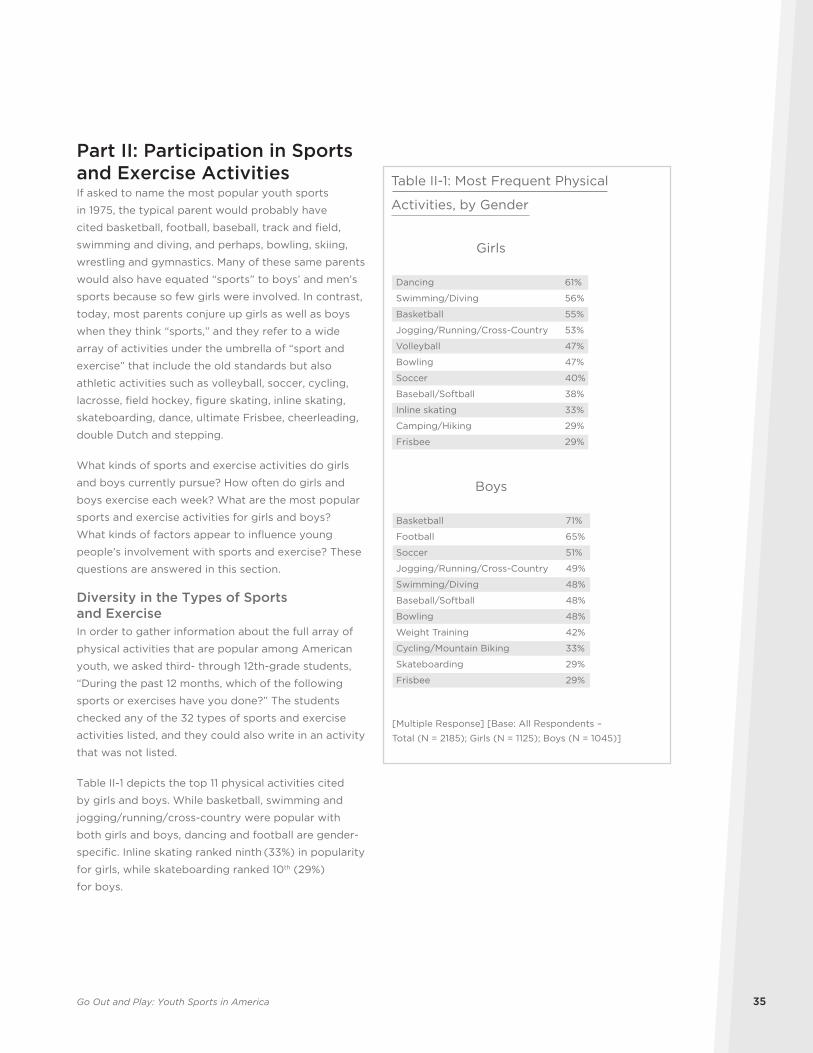
Table II-1 depicts the top 11 physical activities cited
by girls and boys. While basketball, swimming and
jogging/running/cross-country were popular with
both girls and boys, dancing and football are gender-
specific. Inline skating ranked ninth (33%) in popularity
for girls, while skateboarding ranked 10th (29%)
for boys.
Girls
Table II-1: Most Frequent Physical
Activities, by Gender
[Multiple Response] [Base: All Respondents –
Total (N = 2185); Girls (N = 1125); Boys (N = 1045)]
Dancing 61%
Swimming/Diving 56%
Basketball 55%
Jogging/Running/Cross-Country 53%
Volleyball 47%
Bowling 47%
Soccer 40%
Baseball/Softball 38%
Inline skating 33%
Camping/Hiking 29%
Frisbee 29%
Boys
Basketball 71%
Football 65%
Soccer 51%
Jogging/Running/Cross-Country 49%
Swimming/Diving 48%
Baseball/Softball 48%
Bowling 48%
Weight Training 42%
Cycling/Mountain Biking 33%
Skateboarding 29%
Frisbee 29%
A Women’s Sports Foundation Research Report36
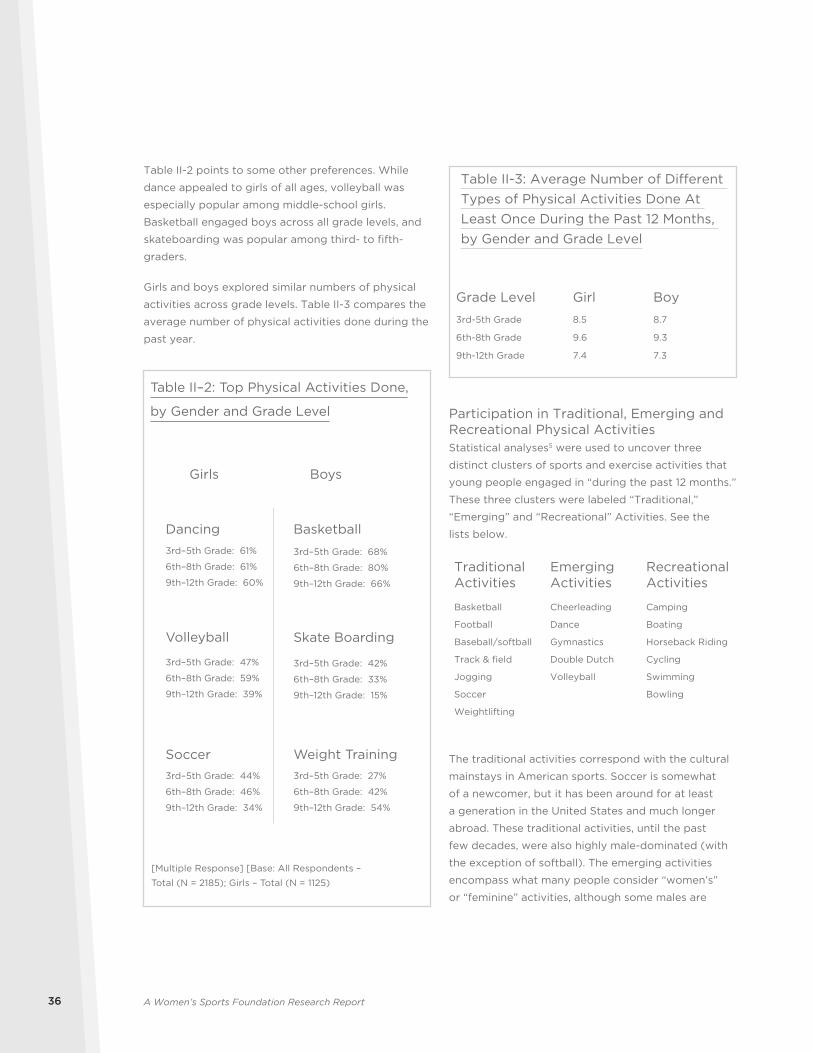
Table II-2 points to some other preferences. While
dance appealed to girls of all ages, volleyball was
especially popular among middle-school girls.
Basketball engaged boys across all grade levels, and
skateboarding was popular among third- to fifth-
graders.
Girls and boys explored similar numbers of physical
activities across grade levels. Table II-3 compares the
average number of physical activities done during the
past year.
Table II-3: Average Number of Different
Types of Physical Activities Done At
Least Once During the Past 12 Months,
by Gender and Grade Level
Grade Level Girl Boy
3rd-5th Grade 8.5 8.7
6th-8th Grade 9.6 9.3
9th-12th Grade 7.4 7.3
Participation in Traditional, Emerging and Recreational Physical ActivitiesStatistical analyses5 were used to uncover three
distinct clusters of sports and exercise activities that
young people engaged in “during the past 12 months.”
These three clusters were labeled “Traditional,”
“Emerging” and “Recreational” Activities. See the
lists below.
Traditional Activities
Emerging Activities
Recreational Activities
Basketball Cheerleading Camping
Football Dance Boating
Baseball/softball Gymnastics Horseback Riding
Track & field Double Dutch Cycling
Jogging Volleyball Swimming
Soccer Bowling
Weightlifting
The traditional activities correspond with the cultural
mainstays in American sports. Soccer is somewhat
of a newcomer, but it has been around for at least
a generation in the United States and much longer
abroad. These traditional activities, until the past
few decades, were also highly male-dominated (with
the exception of softball). The emerging activities
encompass what many people consider “women’s”
or “feminine” activities, although some males are
Dancing
Girls
Volleyball
Basketball
Boys
Skate Boarding
Soccer Weight Training
Table II–2: Top Physical Activities Done,
by Gender and Grade Level
[Multiple Response] [Base: All Respondents –
Total (N = 2185); Girls – Total (N = 1125)
3rd–5th Grade: 61%
6th–8th Grade: 61%
9th–12th Grade: 60%
3rd–5th Grade: 47%
6th–8th Grade: 59%
9th–12th Grade: 39%
3rd–5th Grade: 44%
6th–8th Grade: 46%
9th–12th Grade: 34%
3rd–5th Grade: 68%
6th–8th Grade: 80%
9th–12th Grade: 66%
3rd–5th Grade: 42%
6th–8th Grade: 33%
9th–12th Grade: 15%
3rd–5th Grade: 27%
6th–8th Grade: 42%
9th–12th Grade: 54%
Go Out and Play: Youth Sports in America 37
also involved. Here the descriptor “emerging” is used
because these activities are often not considered
sports (cheerleading, dance and double Dutch), even
though they are often highly competitive and involve
training and athleticism. Finally, the recreational
activities typically engage both females and males
and, while some can be competitive, they are typically
done for fun.
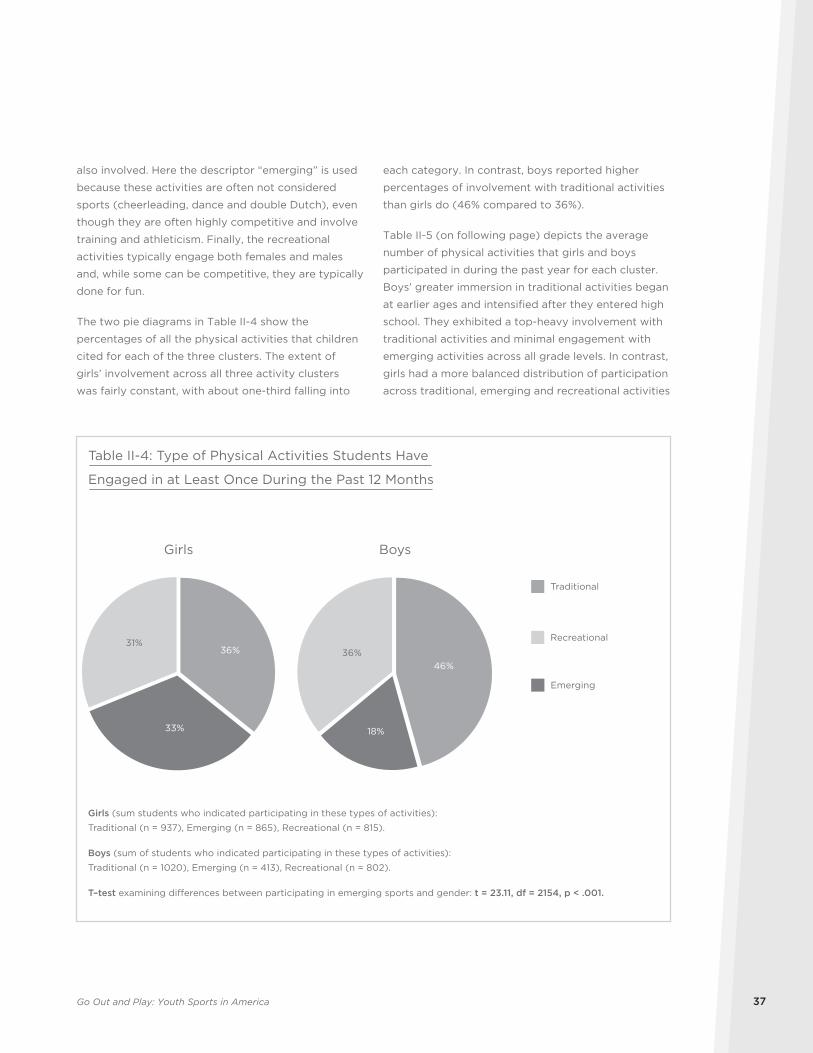
The two pie diagrams in Table II-4 show the
percentages of all the physical activities that children
cited for each of the three clusters. The extent of
girls’ involvement across all three activity clusters
was fairly constant, with about one-third falling into
each category. In contrast, boys reported higher
percentages of involvement with traditional activities
than girls do (46% compared to 36%).
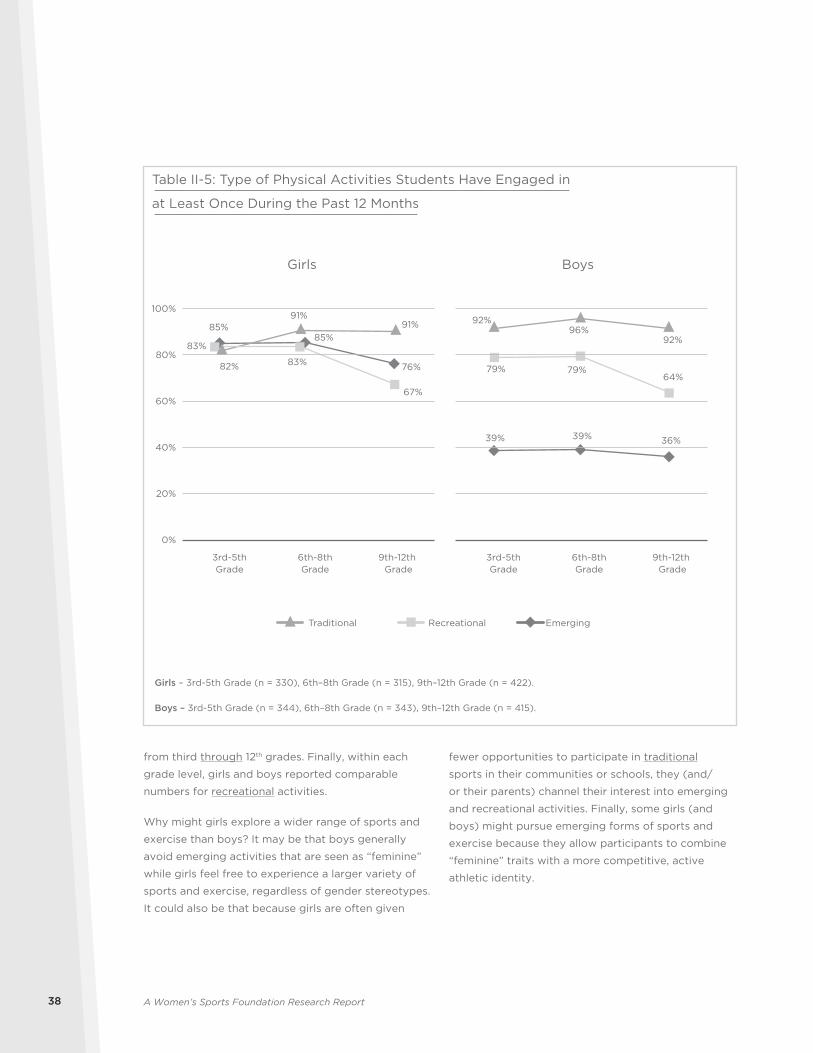
Table II-5 (on following page) depicts the average
number of physical activities that girls and boys
participated in during the past year for each cluster.
Boys’ greater immersion in traditional activities began
at earlier ages and intensified after they entered high
school. They exhibited a top-heavy involvement with
traditional activities and minimal engagement with
emerging activities across all grade levels. In contrast,
girls had a more balanced distribution of participation
across traditional, emerging and recreational activities
Girls
36%
33%
31%
Boys
46%
18%
36%
Table II-4: Type of Physical Activities Students Have
Engaged in at Least Once During the Past 12 Months
Girls (sum students who indicated participating in these types of activities):
Traditional (n = 937), Emerging (n = 865), Recreational (n = 815).
Boys (sum of students who indicated participating in these types of activities):
Traditional (n = 1020), Emerging (n = 413), Recreational (n = 802).
T–test examining differences between participating in emerging sports and gender: t = 23.11, df = 2154, p < .001.
Traditional
Emerging
Recreational
A Women’s Sports Foundation Research Report38
from third through 12th grades. Finally, within each
grade level, girls and boys reported comparable
numbers for recreational activities.
Why might girls explore a wider range of sports and
exercise than boys? It may be that boys generally
avoid emerging activities that are seen as “feminine”
while girls feel free to experience a larger variety of
sports and exercise, regardless of gender stereotypes.
It could also be that because girls are often given
fewer opportunities to participate in traditional
sports in their communities or schools, they (and/
or their parents) channel their interest into emerging
and recreational activities. Finally, some girls (and
boys) might pursue emerging forms of sports and
exercise because they allow participants to combine
“feminine” traits with a more competitive, active
athletic identity.
Traditional EmergingRecreational
Girls
0%
20%
40%
60%
80%
100%
Boys
85%85%
76%
83%
83%
67%
82%
91%91%
39% 39% 36%
79% 79%64%
92%96%
92%
Table II-5: Type of Physical Activities Students Have Engaged in
at Least Once During the Past 12 Months
Girls – 3rd-5th Grade (n = 330), 6th–8th Grade (n = 315), 9th–12th Grade (n = 422).
Boys – 3rd-5th Grade (n = 344), 6th–8th Grade (n = 343), 9th–12th Grade (n = 415).
3rd-5thGrade
6th-8thGrade
9th-12th Grade
3rd-5thGrade
6th-8thGrade
9th-12th Grade
Go Out and Play: Youth Sports in America 39
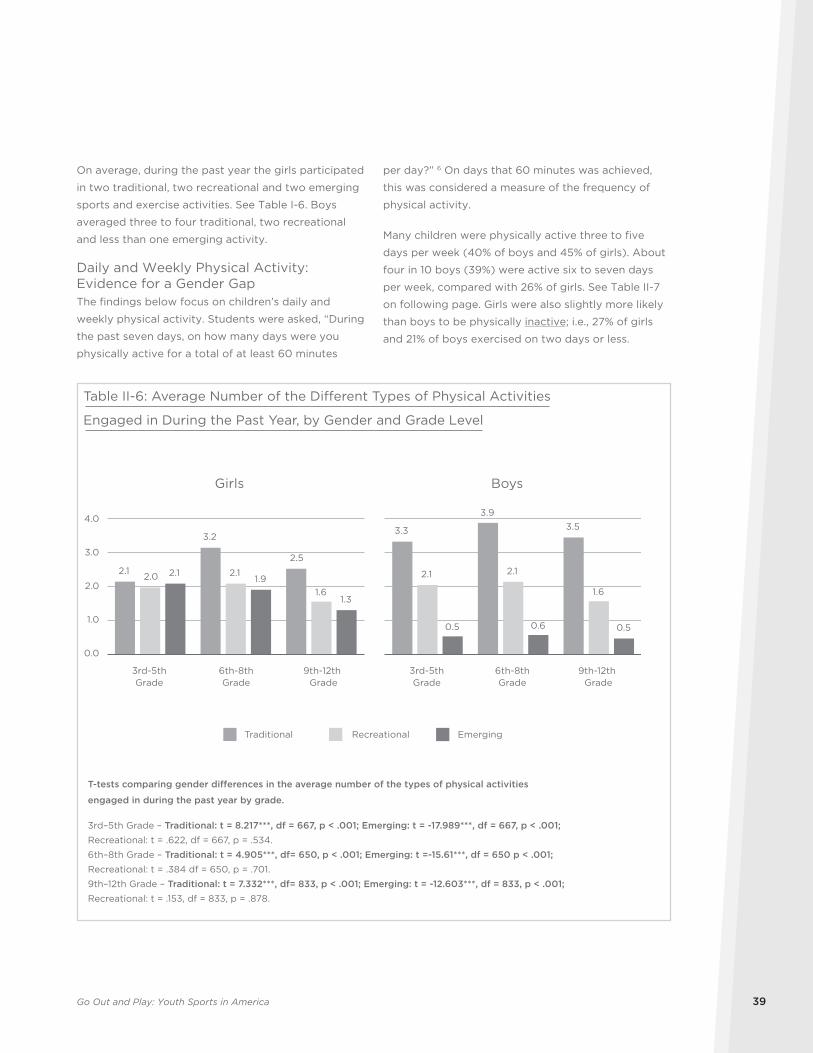
On average, during the past year the girls participated
in two traditional, two recreational and two emerging
sports and exercise activities. See Table I-6. Boys
averaged three to four traditional, two recreational
and less than one emerging activity.
Daily and Weekly Physical Activity: Evidence for a Gender GapThe findings below focus on children’s daily and
weekly physical activity. Students were asked, “During
the past seven days, on how many days were you
physically active for a total of at least 60 minutes
per day?” 6 On days that 60 minutes was achieved,
this was considered a measure of the frequency of
physical activity.
Many children were physically active three to five
days per week (40% of boys and 45% of girls). About
four in 10 boys (39%) were active six to seven days
per week, compared with 26% of girls. See Table II-7
on following page. Girls were also slightly more likely
than boys to be physically inactive; i.e., 27% of girls
and 21% of boys exercised on two days or less.
Girls
2.1
3.2
2.5
2.0 2.1
1.6
2.11.9
1.3
0.0
1.0
2.0
3.0
4.0
Boys
3.3
3.93.5
2.1 2.1
1.6
0.5 0.6 0.5
Table II-6: Average Number of the Di�erent Types of Physical Activities
Engaged in During the Past Year, by Gender and Grade Level
T-tests comparing gender differences in the average number of the types of physical activities
engaged in during the past year by grade.
3rd–5th Grade – Traditional: t = 8.217***, df = 667, p < .001; Emerging: t = -17.989***, df = 667, p < .001; Recreational: t = .622, df = 667, p = .534.
6th–8th Grade – Traditional: t = 4.905***, df= 650, p < .001; Emerging: t =-15.61***, df = 650 p < .001; Recreational: t = .384 df = 650, p = .701.
9th–12th Grade – Traditional: t = 7.332***, df= 833, p < .001; Emerging: t = -12.603***, df = 833, p < .001; Recreational: t = .153, df = 833, p = .878.
Traditional EmergingRecreational
3rd-5thGrade
6th-8thGrade
9th-12th Grade
3rd-5thGrade
6th-8thGrade
9th-12th Grade
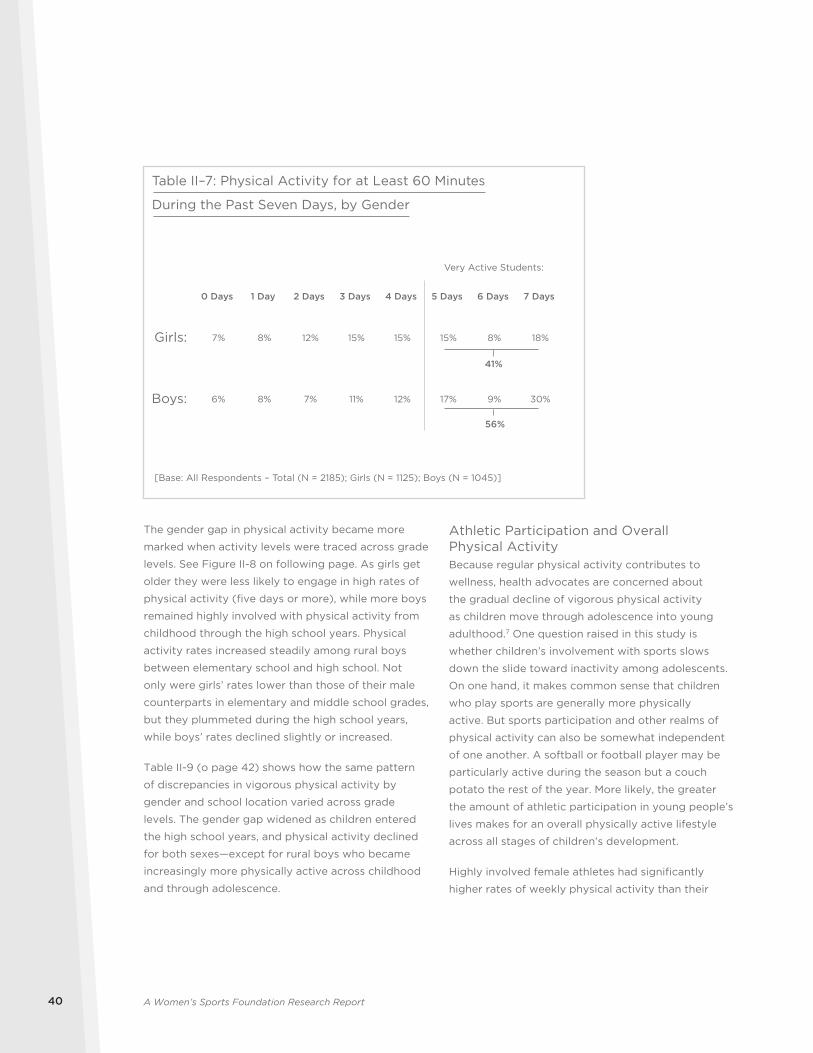
A Women’s Sports Foundation Research Report40
Athletic Participation and Overall Physical ActivityBecause regular physical activity contributes to
wellness, health advocates are concerned about
the gradual decline of vigorous physical activity
as children move through adolescence into young
adulthood.7 One question raised in this study is
whether children’s involvement with sports slows
down the slide toward inactivity among adolescents.
On one hand, it makes common sense that children
who play sports are generally more physically
active. But sports participation and other realms of
physical activity can also be somewhat independent
of one another. A softball or football player may be
particularly active during the season but a couch
potato the rest of the year. More likely, the greater
the amount of athletic participation in young people’s
lives makes for an overall physically active lifestyle
across all stages of children’s development.
Highly involved female athletes had significantly
higher rates of weekly physical activity than their
The gender gap in physical activity became more
marked when activity levels were traced across grade
levels. See Figure II-8 on following page. As girls get
older they were less likely to engage in high rates of
physical activity (five days or more), while more boys
remained highly involved with physical activity from
childhood through the high school years. Physical
activity rates increased steadily among rural boys
between elementary school and high school. Not
only were girls’ rates lower than those of their male
counterparts in elementary and middle school grades,
but they plummeted during the high school years,
while boys’ rates declined slightly or increased.
Table II-9 (o page 42) shows how the same pattern
of discrepancies in vigorous physical activity by
gender and school location varied across grade
levels. The gender gap widened as children entered
the high school years, and physical activity declined
for both sexes—except for rural boys who became
increasingly more physically active across childhood
and through adolescence.
Table II–7: Physical Activity for at Least 60 Minutes
During the Past Seven Days, by Gender
[Base: All Respondents – Total (N = 2185); Girls (N = 1125); Boys (N = 1045)]
0 Days
7%
1 Day
8%
2 Days
12%
3 Days
15%
6 Days
8%
7 Days
18%
4 Days
15%
5 Days
15%
6% 8% 7% 11% 9% 30%12% 17%Boys:
Girls:
41%
56%
Very Active Students:
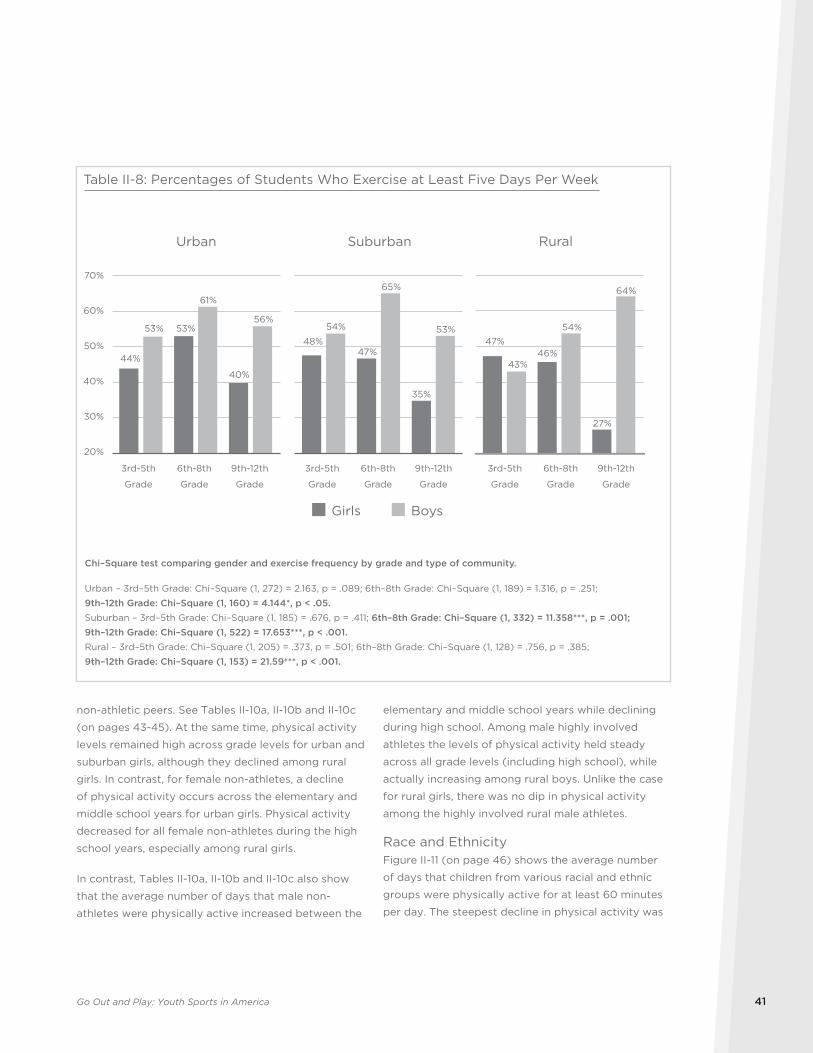
Go Out and Play: Youth Sports in America 41
elementary and middle school years while declining
during high school. Among male highly involved
athletes the levels of physical activity held steady
across all grade levels (including high school), while
actually increasing among rural boys. Unlike the case
for rural girls, there was no dip in physical activity
among the highly involved rural male athletes.
Race and EthnicityFigure II-11 (on page 46) shows the average number
of days that children from various racial and ethnic
groups were physically active for at least 60 minutes
per day. The steepest decline in physical activity was
non-athletic peers. See Tables II-10a, II-10b and II-10c
(on pages 43-45). At the same time, physical activity
levels remained high across grade levels for urban and
suburban girls, although they declined among rural
girls. In contrast, for female non-athletes, a decline
of physical activity occurs across the elementary and
middle school years for urban girls. Physical activity
decreased for all female non-athletes during the high
school years, especially among rural girls.
In contrast, Tables II-10a, II-10b and II-10c also show
that the average number of days that male non-
athletes were physically active increased between the
Girls Boys
44%
53%
40%
53%
61%
56%
20%
30%
40%
50%
60%
70%
48%47%
35%
54%
65%
53%
Table II-8: Percentages of Students Who Exercise at Least Five Days Per Week
Chi–Square test comparing gender and exercise frequency by grade and type of community.
Urban – 3rd–5th Grade: Chi–Square (1, 272) = 2.163, p = .089; 6th–8th Grade: Chi–Square (1, 189) = 1.316, p = .251;
9th–12th Grade: Chi–Square (1, 160) = 4.144*, p < .05.Suburban – 3rd–5th Grade: Chi–Square (1, 185) = .676, p = .411; 6th–8th Grade: Chi–Square (1, 332) = 11.358***, p = .001; 9th–12th Grade: Chi–Square (1, 522) = 17.653***, p < .001.Rural – 3rd–5th Grade: Chi–Square (1, 205) = .373, p = .501; 6th–8th Grade: Chi–Square (1, 128) = .756, p = .385;
9th–12th Grade: Chi–Square (1, 153) = 21.59***, p < .001.
3rd-5th
Grade
6th-8th
Grade
9th-12th
Grade
3rd-5th
Grade
6th-8th
Grade
9th-12th
Grade
3rd-5th
Grade
6th-8th
Grade
9th-12th
Grade
Urban Suburban
47%46%
27%
43%
54%
64%
Rural
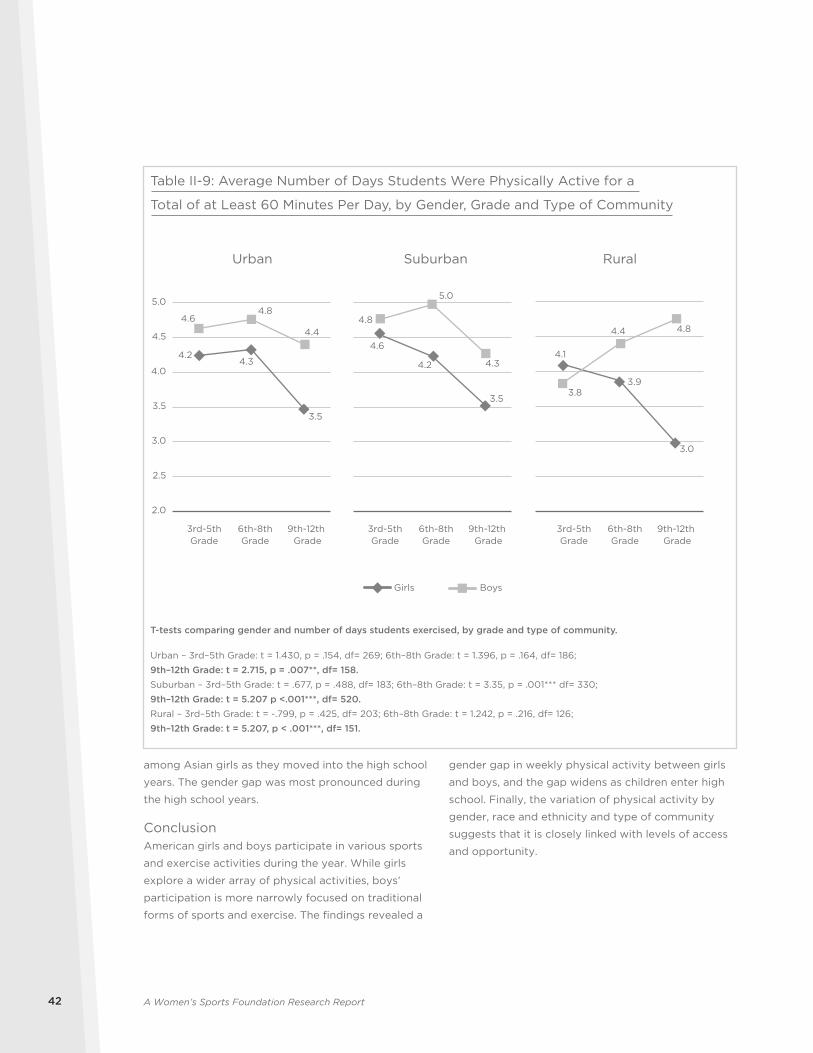
A Women’s Sports Foundation Research Report42
among Asian girls as they moved into the high school
years. The gender gap was most pronounced during
the high school years.
ConclusionAmerican girls and boys participate in various sports
and exercise activities during the year. While girls
explore a wider array of physical activities, boys’
participation is more narrowly focused on traditional
forms of sports and exercise. The findings revealed a
gender gap in weekly physical activity between girls
and boys, and the gap widens as children enter high
school. Finally, the variation of physical activity by
gender, race and ethnicity and type of community
suggests that it is closely linked with levels of access
and opportunity.
Urban
4.24.3
3.5
4.64.8
4.4
2.0
2.5
3.0
3.5
4.0
4.5
5.0
Suburban Rural
4.6
4.2
3.5
4.8
5.0
4.3
Girls Boys
4.1
3.9
3.0
3.8
4.4 4.8
Table II-9: Average Number of Days Students Were Physically Active for a
Total of at Least 60 Minutes Per Day, by Gender, Grade and Type of Community
3rd-5thGrade
6th-8thGrade
9th-12th Grade
3rd-5thGrade
6th-8thGrade
9th-12th Grade
3rd-5thGrade
6th-8thGrade
9th-12th Grade
T-tests comparing gender and number of days students exercised, by grade and type of community.
Urban – 3rd–5th Grade: t = 1.430, p = .154, df= 269; 6th–8th Grade: t = 1.396, p = .164, df= 186;
9th–12th Grade: t = 2.715, p = .007**, df= 158.Suburban – 3rd–5th Grade: t = .677, p = .488, df= 183; 6th–8th Grade: t = 3.35, p = .001*** df= 330;
9th–12th Grade: t = 5.207 p <.001***, df= 520.Rural – 3rd–5th Grade: t = -.799, p = .425, df= 203; 6th–8th Grade: t = 1.242, p = .216, df= 126;
9th–12th Grade: t = 5.207, p < .001***, df= 151.
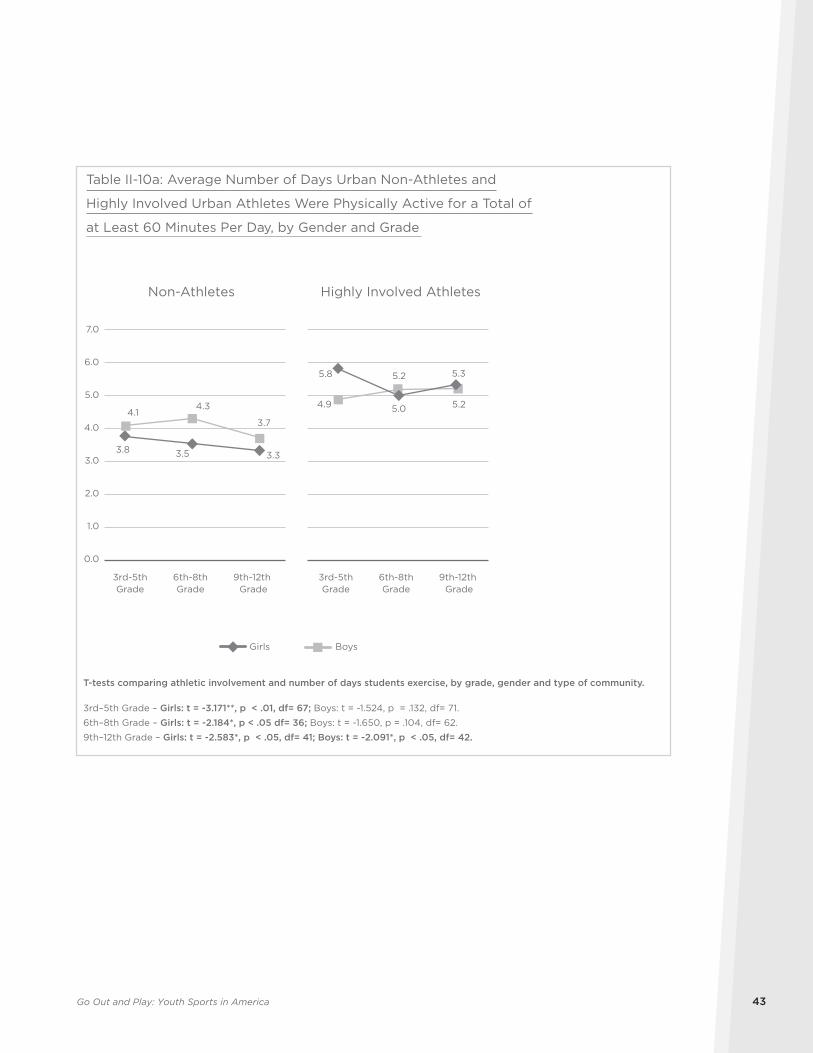
Go Out and Play: Youth Sports in America 43
3.8 3.5 3.3
4.14.3
3.7
0.0
1.0
2.0
3.0
4.0
5.0
6.0
7.0
Highly Involved Athletes
5.8
5.0
5.3
4.9
5.2
5.2
Girls Boys
3rd-5thGrade
6th-8thGrade
9th-12th Grade
3rd-5thGrade
6th-8thGrade
9th-12th Grade
Table II-10a: Average Number of Days Urban Non-Athletes and
Highly Involved Urban Athletes Were Physically Active for a Total of
at Least 60 Minutes Per Day, by Gender and Grade
Non-Athletes
T-tests comparing athletic involvement and number of days students exercise, by grade, gender and type of community.
3rd–5th Grade – Girls: t = -3.171**, p < .01, df= 67; Boys: t = -1.524, p = .132, df= 71.
6th–8th Grade – Girls: t = -2.184*, p < .05 df= 36; Boys: t = -1.650, p = .104, df= 62.
9th–12th Grade – Girls: t = -2.583*, p < .05, df= 41; Boys: t = -2.091*, p < .05, df= 42.
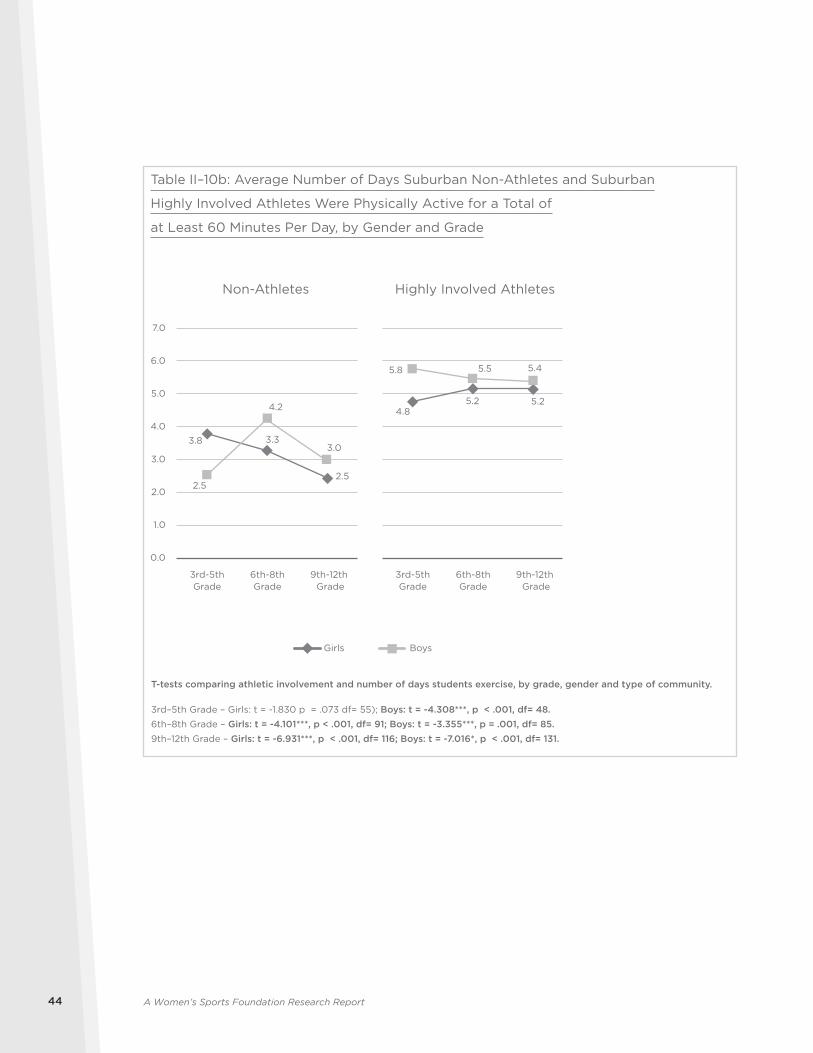
A Women’s Sports Foundation Research Report44
Highly Involved AthletesNon-Athletes
3.8 3.3
2.52.5
4.2
3.0
4.85.2 5.2
5.8 5.5 5.4
Table II–10b: Average Number of Days Suburban Non-Athletes and Suburban
Highly Involved Athletes Were Physically Active for a Total of
at Least 60 Minutes Per Day, by Gender and Grade
T-tests comparing athletic involvement and number of days students exercise, by grade, gender and type of community.
3rd–5th Grade – Girls: t = -1.830 p = .073 df= 55); Boys: t = -4.308***, p < .001, df= 48.6th–8th Grade – Girls: t = -4.101***, p < .001, df= 91; Boys: t = -3.355***, p = .001, df= 85. 9th–12th Grade – Girls: t = -6.931***, p < .001, df= 116; Boys: t = -7.016*, p < .001, df= 131.
0.0
1.0
2.0
3.0
4.0
5.0
6.0
7.0
Girls Boys
3rd-5thGrade
6th-8thGrade
9th-12th Grade
3rd-5thGrade
6th-8thGrade
9th-12th Grade
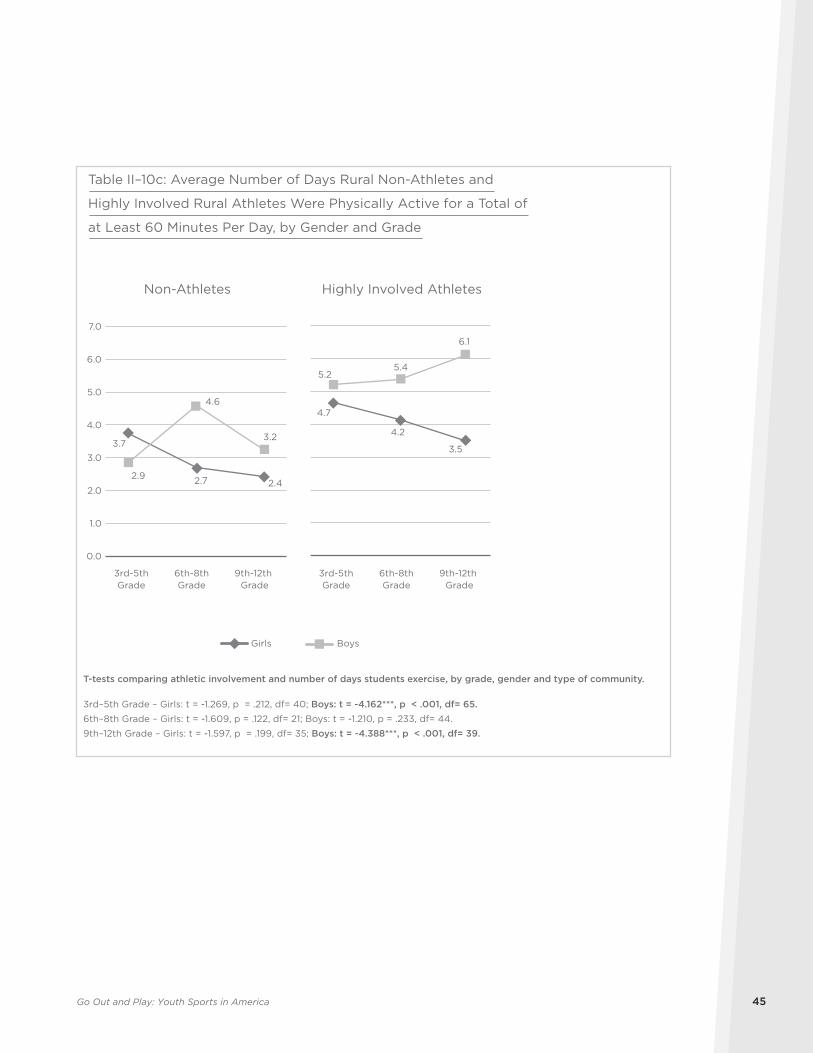
Go Out and Play: Youth Sports in America 45
3.7
2.7 2.42.9
4.6
3.2
4.7
4.2
3.5
5.25.4
6.1
Table II–10c: Average Number of Days Rural Non-Athletes and
Highly Involved Rural Athletes Were Physically Active for a Total of
at Least 60 Minutes Per Day, by Gender and Grade
T-tests comparing athletic involvement and number of days students exercise, by grade, gender and type of community.
3rd–5th Grade – Girls: t = -1.269, p = .212, df= 40; Boys: t = -4.162***, p < .001, df= 65.6th–8th Grade – Girls: t = -1.609, p = .122, df= 21; Boys: t = -1.210, p = .233, df= 44.
9th–12th Grade – Girls: t = -1.597, p = .199, df= 35; Boys: t = -4.388***, p < .001, df= 39.
Highly Involved AthletesNon-Athletes
Girls Boys
3rd-5thGrade
6th-8thGrade
9th-12th Grade
3rd-5thGrade
6th-8thGrade
9th-12th Grade
0.0
1.0
2.0
3.0
4.0
5.0
6.0
7.0
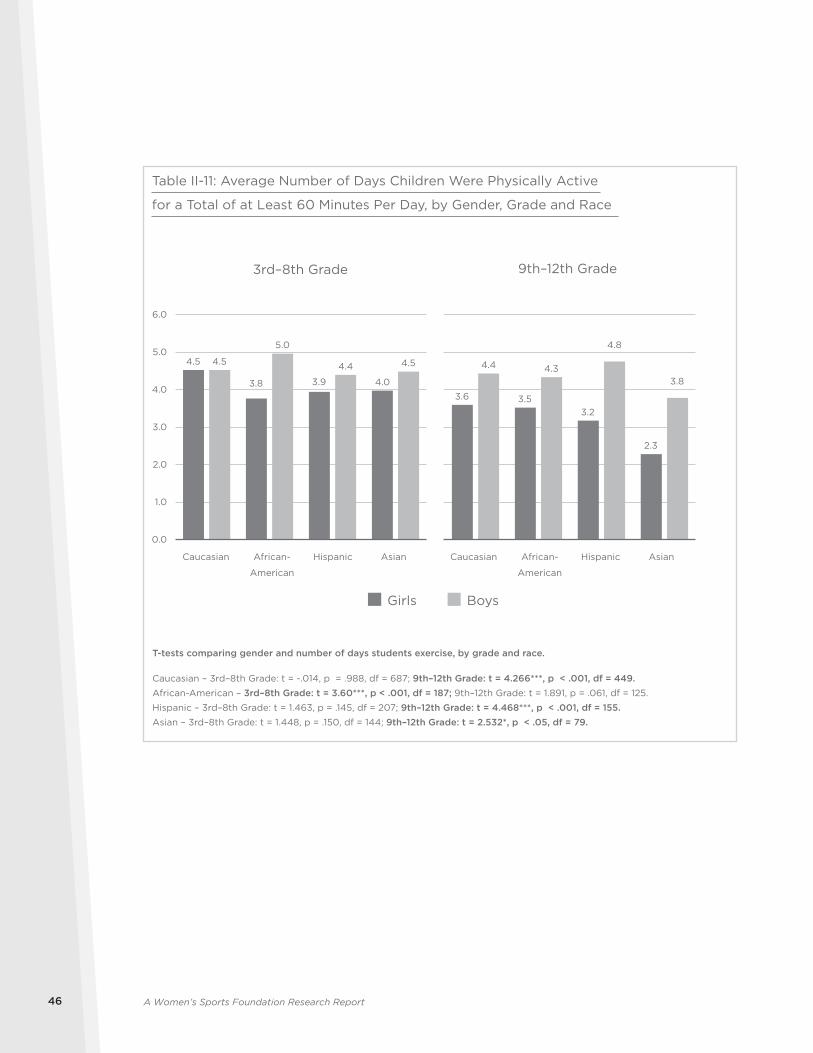
A Women’s Sports Foundation Research Report46
Girls Boys
4.5
3.8 3.9 4.0
4.5
5.0
4.4 4.5
0.0
1.0
2.0
3.0
4.0
5.0
6.0
Caucasian African-
American
Hispanic Asian Caucasian African-
American
Hispanic Asian
3.6 3.53.2
2.3
4.4 4.3
4.8
3.8
Table II-11: Average Number of Days Children Were Physically Active
for a Total of at Least 60 Minutes Per Day, by Gender, Grade and Race
3rd–8th Grade 9th–12th Grade
T-tests comparing gender and number of days students exercise, by grade and race.
Caucasian – 3rd–8th Grade: t = -.014, p = .988, df = 687; 9th–12th Grade: t = 4.266***, p < .001, df = 449.African-American – 3rd–8th Grade: t = 3.60***, p < .001, df = 187; 9th–12th Grade: t = 1.891, p = .061, df = 125.
Hispanic – 3rd–8th Grade: t = 1.463, p = .145, df = 207; 9th–12th Grade: t = 4.468***, p < .001, df = 155.Asian – 3rd–8th Grade: t = 1.448, p = .150, df = 144; 9th–12th Grade: t = 2.532*, p < .05, df = 79.
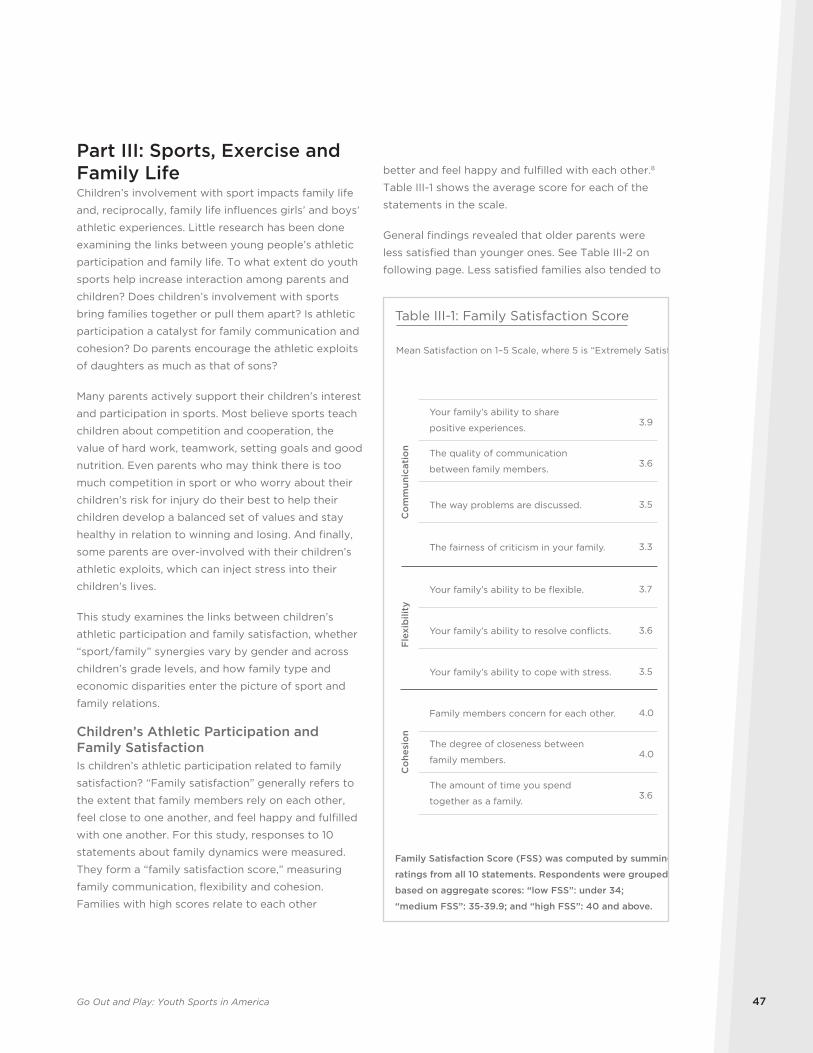
Go Out and Play: Youth Sports in America 47
Part III: Sports, Exercise and Family LifeChildren’s involvement with sport impacts family life
and, reciprocally, family life influences girls’ and boys’
athletic experiences. Little research has been done
examining the links between young people’s athletic
participation and family life. To what extent do youth
sports help increase interaction among parents and
children? Does children’s involvement with sports
bring families together or pull them apart? Is athletic
participation a catalyst for family communication and
cohesion? Do parents encourage the athletic exploits
of daughters as much as that of sons?
Many parents actively support their children’s interest
and participation in sports. Most believe sports teach
children about competition and cooperation, the
value of hard work, teamwork, setting goals and good
nutrition. Even parents who may think there is too
much competition in sport or who worry about their
children’s risk for injury do their best to help their
children develop a balanced set of values and stay
healthy in relation to winning and losing. And finally,
some parents are over-involved with their children’s
athletic exploits, which can inject stress into their
children’s lives.
This study examines the links between children’s
athletic participation and family satisfaction, whether
“sport/family” synergies vary by gender and across
children’s grade levels, and how family type and
economic disparities enter the picture of sport and
family relations.
Children’s Athletic Participation and Family SatisfactionIs children’s athletic participation related to family
satisfaction? “Family satisfaction” generally refers to
the extent that family members rely on each other,
feel close to one another, and feel happy and fulfilled
with one another. For this study, responses to 10
statements about family dynamics were measured.
They form a “family satisfaction score,” measuring
family communication, flexibility and cohesion.
Families with high scores relate to each other
better and feel happy and fulfilled with each other.8
Table III-1 shows the average score for each of the
statements in the scale.
General findings revealed that older parents were
less satisfied than younger ones. See Table III-2 on
following page. Less satisfied families also tended to
Co
mm
unic
atio
nF
lexi
bili
tyC
ohe
sio
nYour family’s ability to share
positive experiences.3.9
The quality of communication
between family members.3.6
The way problems are discussed. 3.5
The fairness of criticism in your family. 3.3
Your family’s ability to be flexible. 3.7
Your family’s ability to resolve conflicts. 3.6
Your family’s ability to cope with stress. 3.5
Family members concern for each other. 4.0
The degree of closeness between
family members.4.0
The amount of time you spend
together as a family.3.6
Table III-1: Family Satisfaction Score
Mean Satisfaction on 1–5 Scale, where 5 is “Extremely Satisfied”
Family Satisfaction Score (FSS) was computed by summing
ratings from all 10 statements. Respondents were grouped
based on aggregate scores: “low FSS”: under 34;
“medium FSS”: 35-39.9; and “high FSS”: 40 and above.
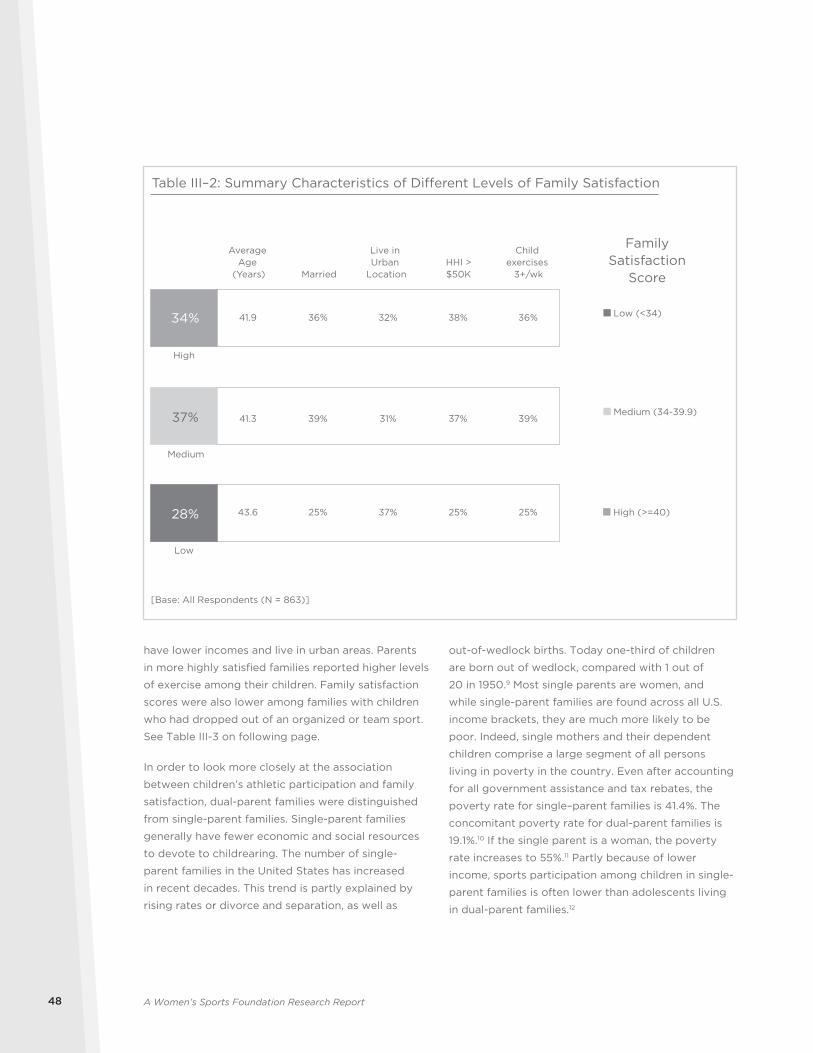
A Women’s Sports Foundation Research Report48
have lower incomes and live in urban areas. Parents
in more highly satisfied families reported higher levels
of exercise among their children. Family satisfaction
scores were also lower among families with children
who had dropped out of an organized or team sport.
See Table III-3 on following page.
In order to look more closely at the association
between children’s athletic participation and family
satisfaction, dual-parent families were distinguished
from single-parent families. Single-parent families
generally have fewer economic and social resources
to devote to childrearing. The number of single-
parent families in the United States has increased
in recent decades. This trend is partly explained by
rising rates or divorce and separation, as well as
out-of-wedlock births. Today one-third of children
are born out of wedlock, compared with 1 out of
20 in 1950.9 Most single parents are women, and
while single-parent families are found across all U.S.
income brackets, they are much more likely to be
poor. Indeed, single mothers and their dependent
children comprise a large segment of all persons
living in poverty in the country. Even after accounting
for all government assistance and tax rebates, the
poverty rate for single–parent families is 41.4%. The
concomitant poverty rate for dual-parent families is
19.1%.10 If the single parent is a woman, the poverty
rate increases to 55%.11 Partly because of lower
income, sports participation among children in single-
parent families is often lower than adolescents living
in dual-parent families.12
FamilySatisfaction
Score
Low (<34)
Medium (34-39.9)
High (>=40)
Low
Medium
High
Married
41.9 36% 32% 38% 36%
41.3 39% 31% 37% 39%
43.6 25% 37% 25% 25%
Table III–2: Summary Characteristics of Di�erent Levels of Family Satisfaction
[Base: All Respondents (N = 863)]
Average Age
(Years)
Live in Urban
LocationHHI >$50K
Child exercises
3+/wk
28%
37%
34%
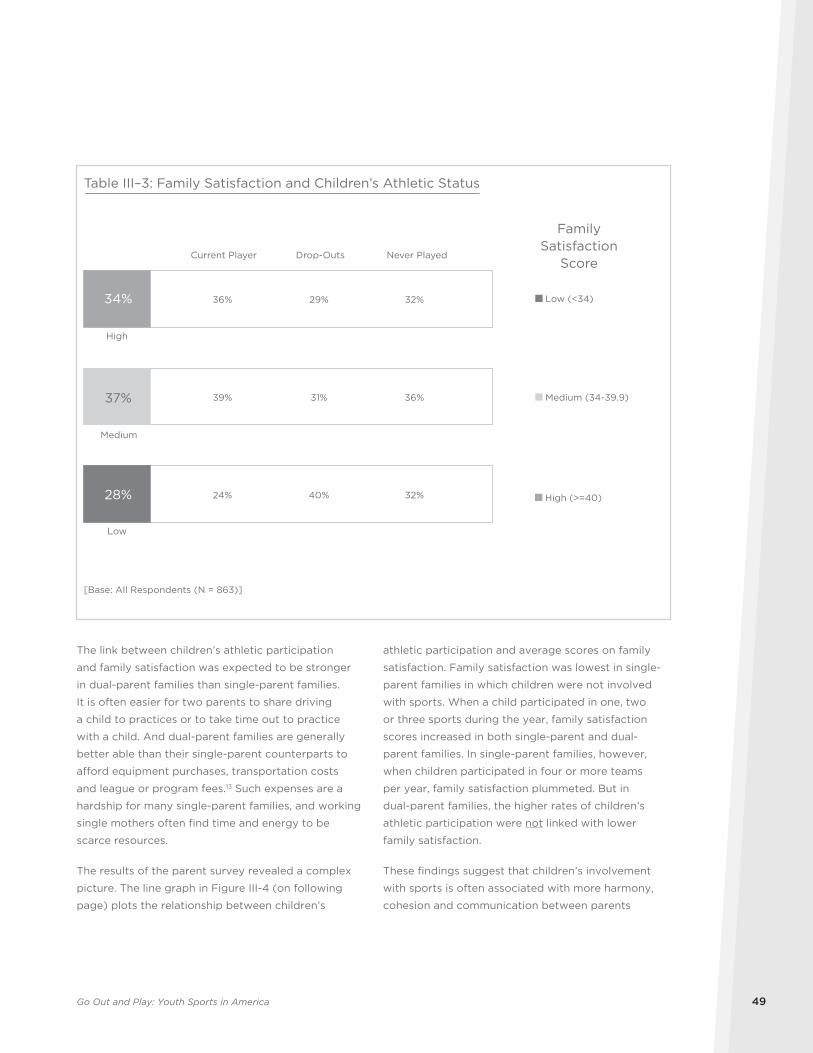
Go Out and Play: Youth Sports in America 49
The link between children’s athletic participation
and family satisfaction was expected to be stronger
in dual-parent families than single-parent families.
It is often easier for two parents to share driving
a child to practices or to take time out to practice
with a child. And dual-parent families are generally
better able than their single-parent counterparts to
afford equipment purchases, transportation costs
and league or program fees.13 Such expenses are a
hardship for many single-parent families, and working
single mothers often find time and energy to be
scarce resources.
The results of the parent survey revealed a complex
picture. The line graph in Figure III-4 (on following
page) plots the relationship between children’s
athletic participation and average scores on family
satisfaction. Family satisfaction was lowest in single-
parent families in which children were not involved
with sports. When a child participated in one, two
or three sports during the year, family satisfaction
scores increased in both single-parent and dual-
parent families. In single-parent families, however,
when children participated in four or more teams
per year, family satisfaction plummeted. But in
dual-parent families, the higher rates of children’s
athletic participation were not linked with lower
family satisfaction.
These findings suggest that children’s involvement
with sports is often associated with more harmony,
cohesion and communication between parents
Low
Medium
High
[Base: All Respondents (N = 863)]
28%
37%
34% 36% 29% 32%
39% 31% 36%
24% 40% 32%
Table III–3: Family Satisfaction and Children’s Athletic Status
Current Player Drop-Outs Never Played
FamilySatisfaction
Score
Low (<34)
Medium (34-39.9)
High (>=40)
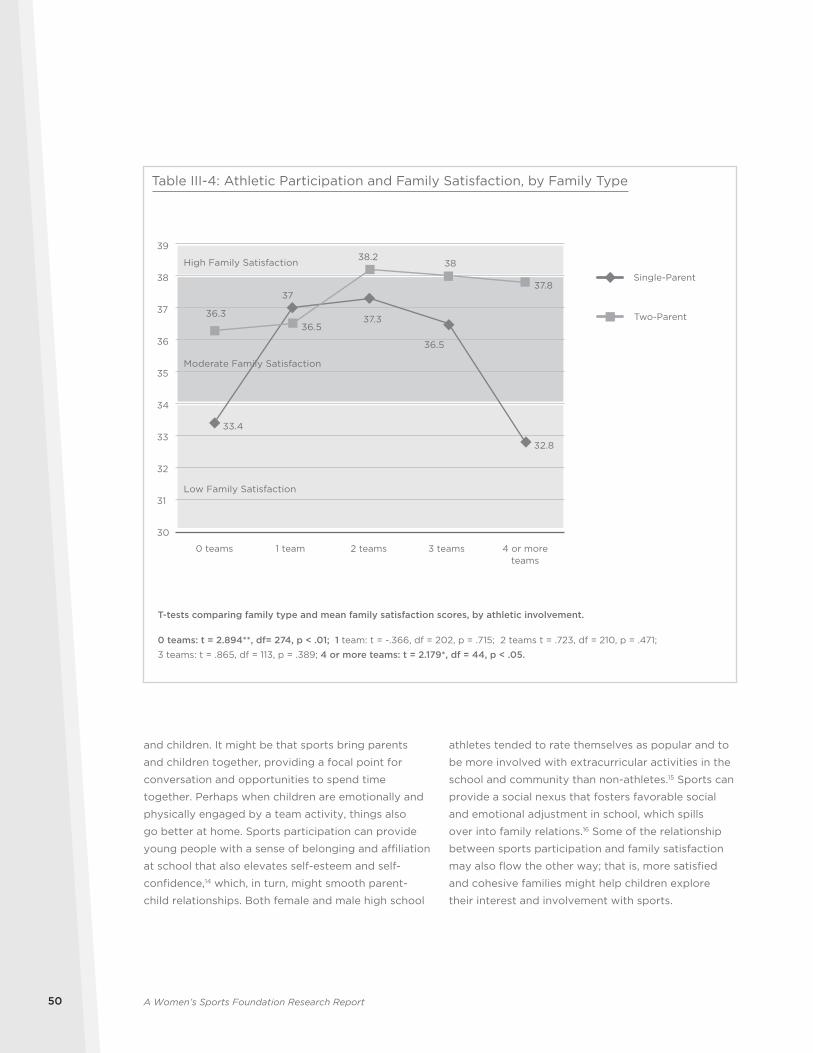
A Women’s Sports Foundation Research Report50
and children. It might be that sports bring parents
and children together, providing a focal point for
conversation and opportunities to spend time
together. Perhaps when children are emotionally and
physically engaged by a team activity, things also
go better at home. Sports participation can provide
young people with a sense of belonging and affiliation
at school that also elevates self-esteem and self-
confidence,14 which, in turn, might smooth parent-
child relationships. Both female and male high school
athletes tended to rate themselves as popular and to
be more involved with extracurricular activities in the
school and community than non-athletes.15 Sports can
provide a social nexus that fosters favorable social
and emotional adjustment in school, which spills
over into family relations.16 Some of the relationship
between sports participation and family satisfaction
may also flow the other way; that is, more satisfied
and cohesive families might help children explore
their interest and involvement with sports.
Low Family Satisfaction
33.4
37
37.3
36.5
32.8
36.336.5
38.238
37.8
30
31
32
33
34
35
36
37
38
39
0 teams 1 team 2 teams 3 teams
Table III-4: Athletic Participation and Family Satisfaction, by Family Type
Single-Parent
Two-Parent
T-tests comparing family type and mean family satisfaction scores, by athletic involvement.
0 teams: t = 2.894**, df= 274, p < .01; 1 team: t = -.366, df = 202, p = .715; 2 teams t = .723, df = 210, p = .471;
3 teams: t = .865, df = 113, p = .389; 4 or more teams: t = 2.179*, df = 44, p < .05.
4 or moreteams
Moderate Family Satisfaction
High Family Satisfaction
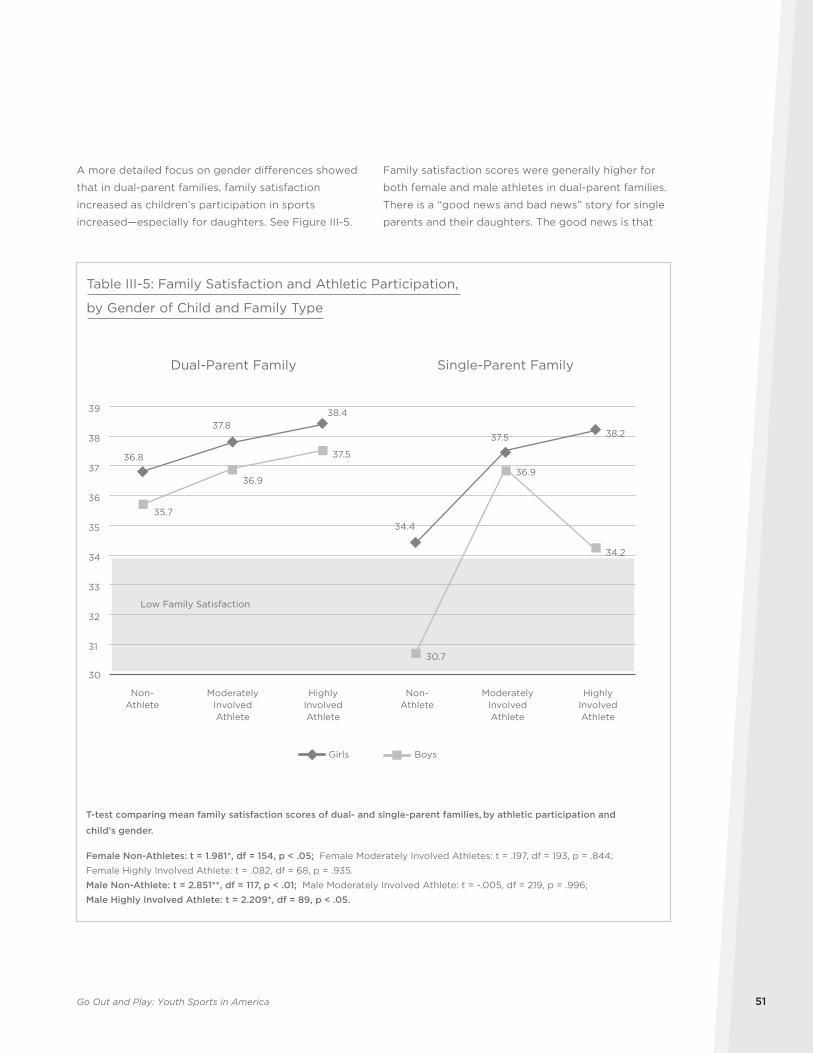
Go Out and Play: Youth Sports in America 51
A more detailed focus on gender differences showed
that in dual-parent families, family satisfaction
increased as children’s participation in sports
increased—especially for daughters. See Figure III-5.
Family satisfaction scores were generally higher for
both female and male athletes in dual-parent families.
There is a “good news and bad news” story for single
parents and their daughters. The good news is that
Girls Boys
Low Family Satisfaction
36.8
37.838.4
34.4
37.5 38.2
35.7
36.9
37.5
30.7
36.9
34.2
30
31
32
33
34
35
36
37
38
39
Single-Parent FamilyDual-Parent Family
Table III-5: Family Satisfaction and Athletic Participation,
by Gender of Child and Family Type
T-test comparing mean family satisfaction scores of dual- and single-parent families, by athletic participation and
child’s gender.
Female Non-Athletes: t = 1.981*, df = 154, p < .05; Female Moderately Involved Athletes: t = .197, df = 193, p = .844;
Female Highly Involved Athlete: t = .082, df = 68, p = .935.
Male Non-Athlete: t = 2.851**, df = 117, p < .01; Male Moderately Involved Athlete: t = -.005, df = 219, p = .996;
Male Highly Involved Athlete: t = 2.209*, df = 89, p < .05.
Non-Athlete
ModeratelyInvolvedAthlete
HighlyInvolvedAthlete
Non-Athlete
ModeratelyInvolvedAthlete
HighlyInvolvedAthlete
A Women’s Sports Foundation Research Report52
daughters’ involvement with sports was related to
higher levels of satisfaction in single-parent families.
The bad news is that girls’ participation in sports was
lowest in urban areas, where there are many single-
parent families.
The findings also show that in single-parent
families high rates of involvement among sons
were associated with a significant drop in family
satisfaction. It may be that high rates of participation
with sports by sons can strain parent-child
relationships in single-parent families or perhaps
put too much pressure on single parents to manage
the social and economic demands of their son’s
heightened athletic interests. In contrast, dual-parent
families may be socially and emotionally better
equipped to handle the demands that a child’s high
level of sports involvement can produce.
Finally, children’s involvement with sports may
be particularly important to many single parents.
Perhaps the African adage, “It takes a village to raise
a child,” comes into play here. Working single parents
might appreciate the extra time that daughters or
sons spend at school, knowing that their children are
safe and supervised. Young athletes can also develop
meaningful relationships with supportive adults (e.g.,
coaches, volunteers, athletic trainers, school nurses
or team “moms”) that extend the blanket of social
support in a child’s life.
There are many factors operating here. First,
dual-parent families generally had higher rates
of satisfaction than single-parent families. Yet
single parents with children involved with sports
(especially daughters) reported higher levels of family
satisfaction than their counterparts with children who
did not participate in sport. While more research is
needed, it appears that children’s involvement with
sports is related to favorable outcomes in both dual-
parent and single-parent families.
Parental Involvement and EncouragementA main assumption underpinning this study is that
children’s involvement with sports is nurtured,
guided and sustained by the interplay among peer
groups, families, schools and communities. Put
simply, girls and boys do not play sports in a vacuum.
Encouragement and support come from family
members, friends and supportive adults in school and
the community. The findings in this section look at the
sources of encouragement and support in children’s
athletic lives. The parent survey findings are discussed
first, and then we examine the reports of U.S. children.
How Parents Are InvolvedHow do parents encourage and support their
children’s interest and involvement with sports? What
is the overall pattern of parental involvement? Are
most parents disinterested or moderately involved?
How many seem to fit the stereotype of the over-
involved parent? Do parents support their daughters
as much as their sons?
During the telephone interviews, parents were asked,
“When your child is playing an organized or team
sport, how often do you or the child’s other parent
do the following with your child related to her (his)
involvement in the sport?” About nine in 10 (93%)
parents talked with their children about their sport
activities one to two times or more per week. See
Table III-6 on following page. The topic of sports may
be a common ice-breaker or focus for parent-child
communication. Next, 59% of parents spent time
driving their children back and forth from games and
practices three or more times per week. These “soccer
mom” or “hockey dad” moments may give mothers
and fathers a chance to chat with their children or to
eavesdrop on backseat conversations that, in turn,
may provide insights into their children’s lives. Once
at a practice or event, parents might also interact
with coaches, dance instructors, program heads or
teachers and do some “listening or lobbying” on their
children’s behalf.
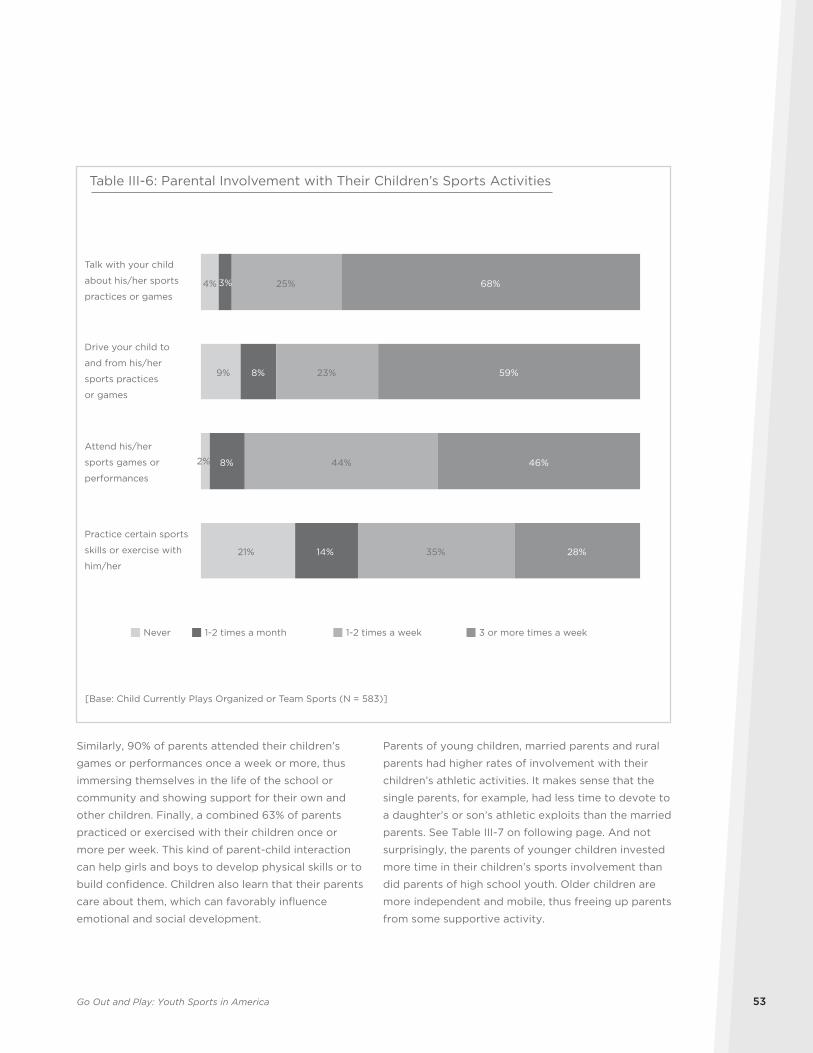
Go Out and Play: Youth Sports in America 53
Similarly, 90% of parents attended their children’s
games or performances once a week or more, thus
immersing themselves in the life of the school or
community and showing support for their own and
other children. Finally, a combined 63% of parents
practiced or exercised with their children once or
more per week. This kind of parent-child interaction
can help girls and boys to develop physical skills or to
build confidence. Children also learn that their parents
care about them, which can favorably influence
emotional and social development.
Parents of young children, married parents and rural
parents had higher rates of involvement with their
children’s athletic activities. It makes sense that the
single parents, for example, had less time to devote to
a daughter’s or son’s athletic exploits than the married
parents. See Table III-7 on following page. And not
surprisingly, the parents of younger children invested
more time in their children’s sports involvement than
did parents of high school youth. Older children are
more independent and mobile, thus freeing up parents
from some supportive activity.
4%
21%
8%
8%
14%
25%
23%
44%
35%
68%
59%
46%
28%
2%
9%
3%
Never 1-2 times a month 1-2 times a week 3 or more times a week
Table III-6: Parental Involvement with Their Children’s Sports Activities
[Base: Child Currently Plays Organized or Team Sports (N = 583)]
Talk with your child
about his/her sports
practices or games
Drive your child to
and from his/her
sports practices
or games
Attend his/her
sports games or
performances
Practice certain sports
skills or exercise with
him/her
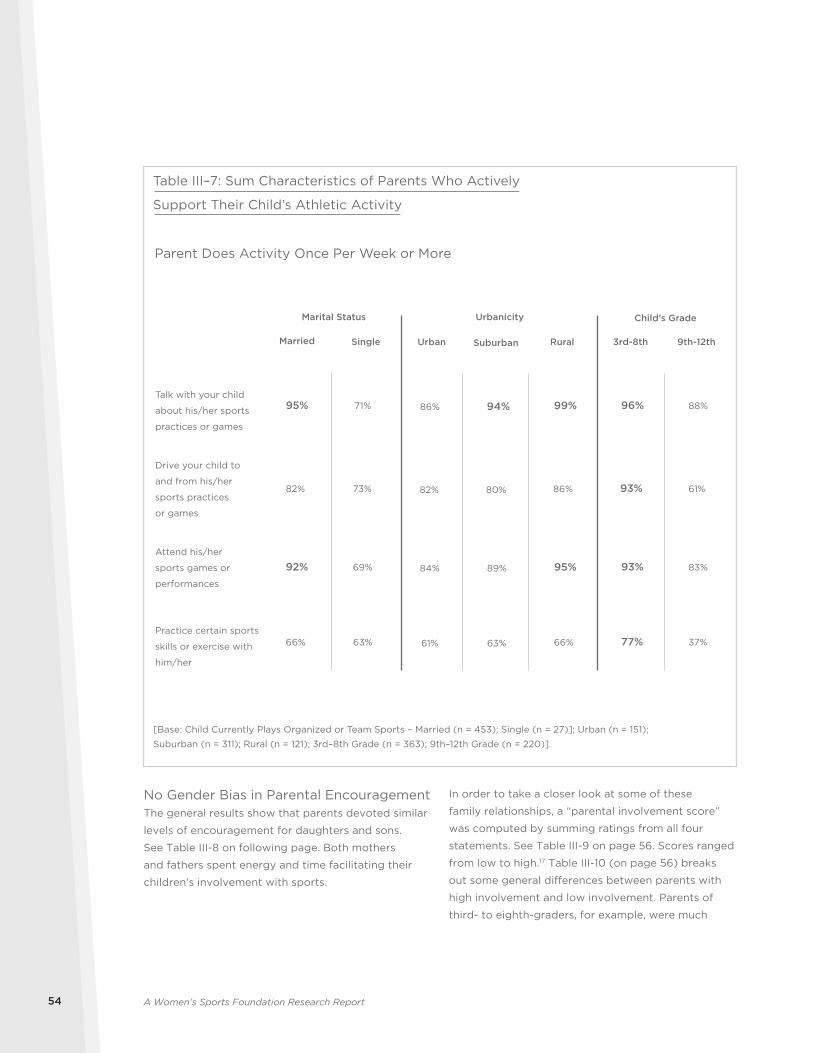
A Women’s Sports Foundation Research Report54
No Gender Bias in Parental EncouragementThe general results show that parents devoted similar
levels of encouragement for daughters and sons.
See Table III-8 on following page. Both mothers
and fathers spent energy and time facilitating their
children’s involvement with sports.
In order to take a closer look at some of these
family relationships, a “parental involvement score”
was computed by summing ratings from all four
statements. See Table III-9 on page 56. Scores ranged
from low to high.17 Table III-10 (on page 56) breaks
out some general differences between parents with
high involvement and low involvement. Parents of
third- to eighth-graders, for example, were much
Married Single
Parent Does Activity Once Per Week or More
95% 71%
82% 73%
92% 69%
66% 63%
Urban Suburban
86% 94%
82% 80%
84% 89%
61% 63%
Rural
99%
86%
95%
66%
96% 88%
93% 61%
93% 83%
77% 37%
Child’s GradeUrbanicityMarital Status
[Base: Child Currently Plays Organized or Team Sports – Married (n = 453); Single (n = 27)]; Urban (n = 151);
Suburban (n = 311); Rural (n = 121); 3rd–8th Grade (n = 363); 9th–12th Grade (n = 220)].
Talk with your child
about his/her sports
practices or games
Drive your child to
and from his/her
sports practices
or games
Attend his/her
sports games or
performances
Practice certain sports
skills or exercise with
him/her
Table III–7: Sum Characteristics of Parents Who Actively
Support Their Child’s Athletic Activity
3rd-8th 9th-12th
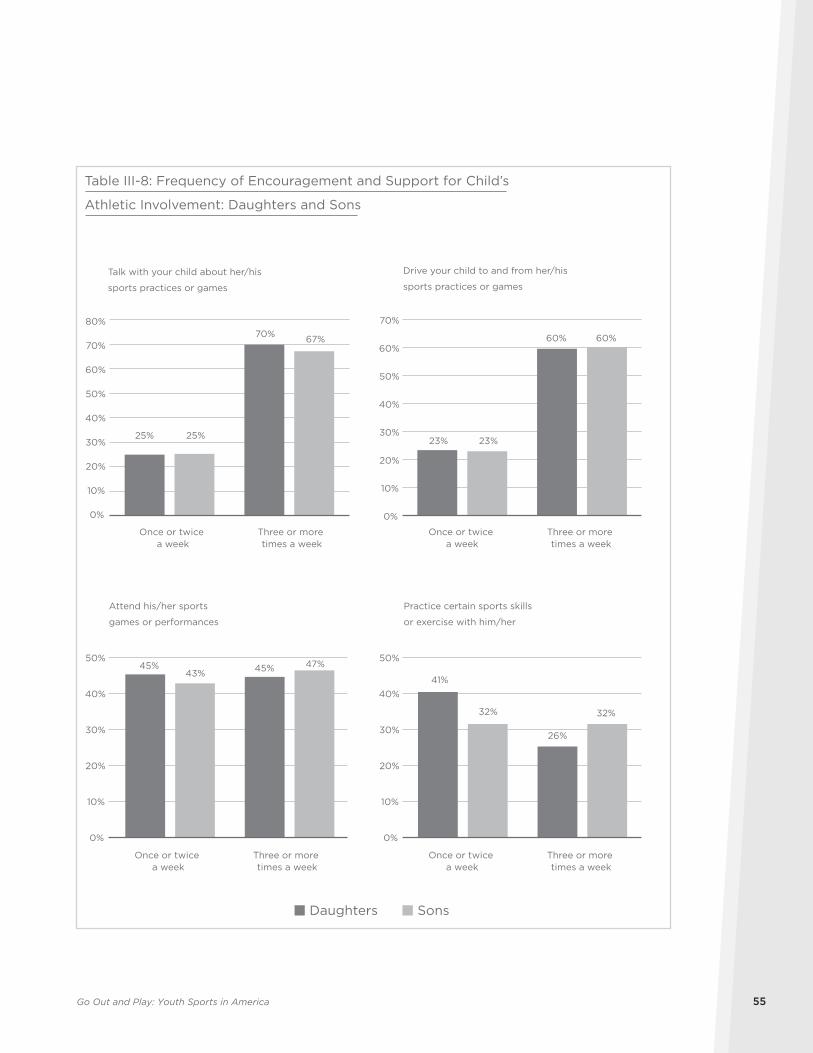
Go Out and Play: Youth Sports in America 55
25%
70%
25%
67%
0%
10%
20%
30%
40%
50%
60%
70%
80%
Once or twice a week
23%
60%
23%
60%
0%
10%
20%
30%
40%
50%
60%
70%
Daughters Sons
Table III-8: Frequency of Encouragement and Support for Child’s
Athletic Involvement: Daughters and Sons
Talk with your child about her/his
sports practices or games
Drive your child to and from her/his
sports practices or games
Three or more times a week
Once or twice a week
0%
10%
20%
30%
40%
50%
Three or more times a week
Once or twice a week
0%
10%
20%
30%
40%
50%
Three or more times a week
Once or twice a week
Three or more times a week
Attend his/her sports
games or performances
Practice certain sports skills
or exercise with him/her
45% 45%43%47%
41%
26%
32% 32%
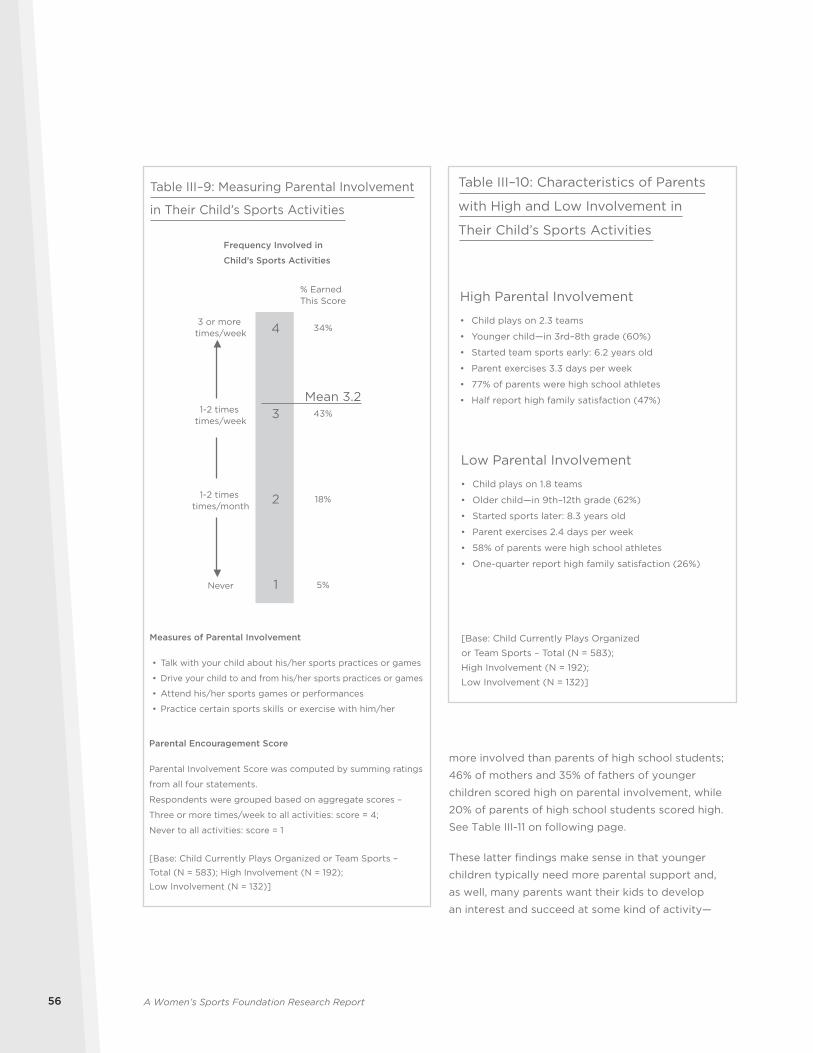
A Women’s Sports Foundation Research Report56
more involved than parents of high school students;
46% of mothers and 35% of fathers of younger
children scored high on parental involvement, while
20% of parents of high school students scored high.
See Table III-11 on following page.
These latter findings make sense in that younger
children typically need more parental support and,
as well, many parents want their kids to develop
an interest and succeed at some kind of activity—
Table III–9: Measuring Parental Involvement
in Their Child’s Sports Activities
Measures of Parental Involvement
• Talk with your child about his/her sports practices or games
• Drive your child to and from his/her sports practices or games
• Attend his/her sports games or performances
• Practice certain sports skills or exercise with him/her
Parental Encouragement Score
Parental Involvement Score was computed by summing ratings
from all four statements.
Respondents were grouped based on aggregate scores –
Three or more times/week to all activities: score = 4;
Never to all activities: score = 1
[Base: Child Currently Plays Organized or Team Sports –
Total (N = 583); High Involvement (N = 192);
Low Involvement (N = 132)]
34%
43%
18%
5%1
2
3
4
Frequency Involved in
Child’s Sports Activities
3 or more times/week
1-2 times times/week
1-2 times times/month
Never
Mean 3.2
% Earned This Score
Table III–10: Characteristics of Parents
with High and Low Involvement in
Their Child’s Sports Activities
[Base: Child Currently Plays Organized
or Team Sports – Total (N = 583);
High Involvement (N = 192);
Low Involvement (N = 132)]
High Parental Involvement
• Child plays on 2.3 teams
• Younger child—in 3rd–8th grade (60%)
• Started team sports early: 6.2 years old
• Parent exercises 3.3 days per week
• 77% of parents were high school athletes
• Half report high family satisfaction (47%)
Low Parental Involvement
• Child plays on 1.8 teams
• Older child—in 9th–12th grade (62%)
• Started sports later: 8.3 years old
• Parent exercises 2.4 days per week
• 58% of parents were high school athletes
• One-quarter report high family satisfaction (26%)
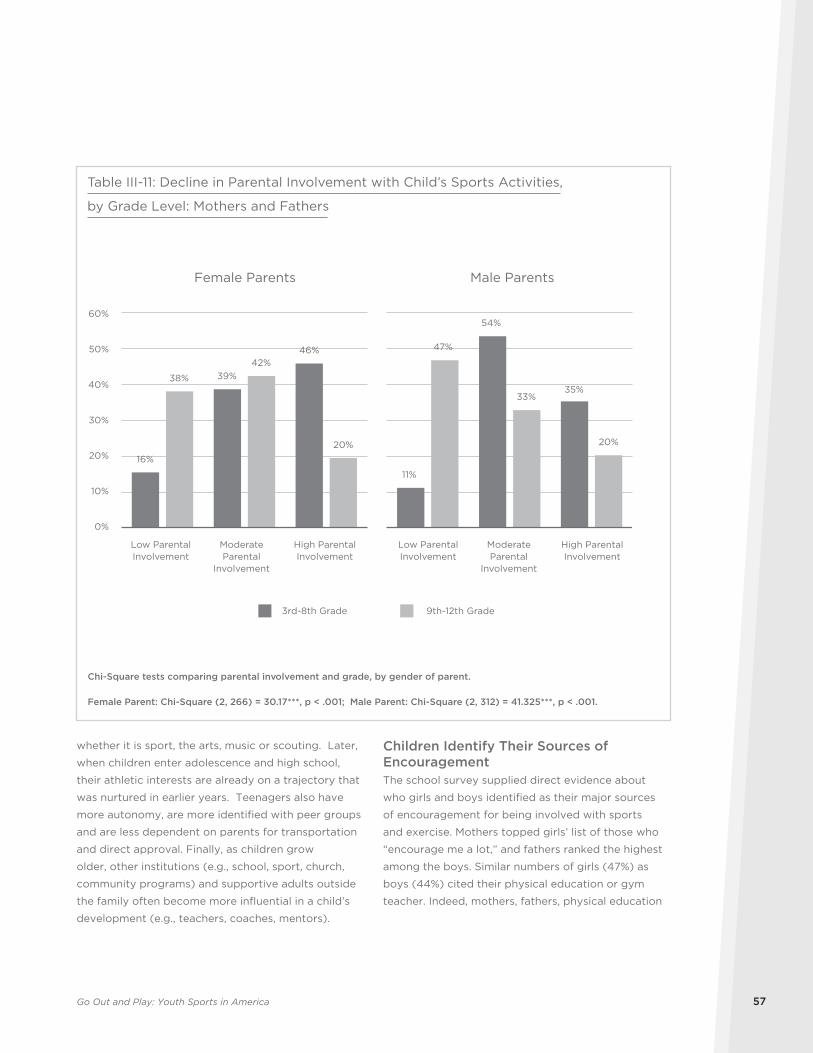
Go Out and Play: Youth Sports in America 57
whether it is sport, the arts, music or scouting. Later,
when children enter adolescence and high school,
their athletic interests are already on a trajectory that
was nurtured in earlier years. Teenagers also have
more autonomy, are more identified with peer groups
and are less dependent on parents for transportation
and direct approval. Finally, as children grow
older, other institutions (e.g., school, sport, church,
community programs) and supportive adults outside
the family often become more influential in a child’s
development (e.g., teachers, coaches, mentors).
Children Identify Their Sources of Encouragement The school survey supplied direct evidence about
who girls and boys identified as their major sources
of encouragement for being involved with sports
and exercise. Mothers topped girls’ list of those who
“encourage me a lot,” and fathers ranked the highest
among the boys. Similar numbers of girls (47%) as
boys (44%) cited their physical education or gym
teacher. Indeed, mothers, fathers, physical education
16%
39%
46%
38%
42%
20%
0%
10%
20%
30%
40%
50%
60%
Female Parents
11%
54%
35%
47%
33%
20%
Male Parents
Chi-Square tests comparing parental involvement and grade, by gender of parent.
Female Parent: Chi-Square (2, 266) = 30.17***, p < .001; Male Parent: Chi-Square (2, 312) = 41.325***, p < .001.
3rd-8th Grade 9th-12th Grade
Table III-11: Decline in Parental Involvement with Child’s Sports Activities,
by Grade Level: Mothers and Fathers
Low ParentalInvolvement
ModerateParental
Involvement
High ParentalInvolvement
Low ParentalInvolvement
ModerateParental
Involvement
High ParentalInvolvement
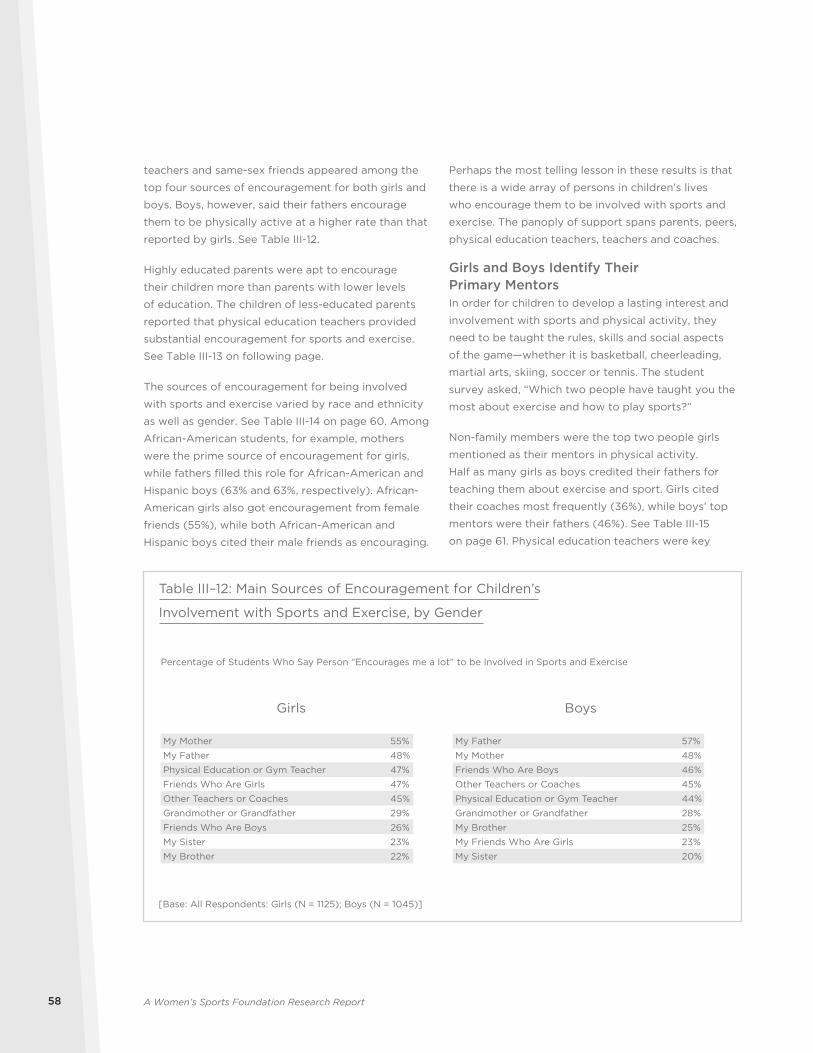
A Women’s Sports Foundation Research Report58
teachers and same-sex friends appeared among the
top four sources of encouragement for both girls and
boys. Boys, however, said their fathers encourage
them to be physically active at a higher rate than that
reported by girls. See Table III-12.
Highly educated parents were apt to encourage
their children more than parents with lower levels
of education. The children of less-educated parents
reported that physical education teachers provided
substantial encouragement for sports and exercise.
See Table III-13 on following page.
The sources of encouragement for being involved
with sports and exercise varied by race and ethnicity
as well as gender. See Table III-14 on page 60. Among
African-American students, for example, mothers
were the prime source of encouragement for girls,
while fathers filled this role for African-American and
Hispanic boys (63% and 63%, respectively). African-
American girls also got encouragement from female
friends (55%), while both African-American and
Hispanic boys cited their male friends as encouraging.
Perhaps the most telling lesson in these results is that
there is a wide array of persons in children’s lives
who encourage them to be involved with sports and
exercise. The panoply of support spans parents, peers,
physical education teachers, teachers and coaches.
Girls and Boys Identify Their Primary Mentors In order for children to develop a lasting interest and
involvement with sports and physical activity, they
need to be taught the rules, skills and social aspects
of the game—whether it is basketball, cheerleading,
martial arts, skiing, soccer or tennis. The student
survey asked, “Which two people have taught you the
most about exercise and how to play sports?”
Non-family members were the top two people girls
mentioned as their mentors in physical activity.
Half as many girls as boys credited their fathers for
teaching them about exercise and sport. Girls cited
their coaches most frequently (36%), while boys’ top
mentors were their fathers (46%). See Table III-15
on page 61. Physical education teachers were key
Girls Boys
My Mother 55% My Father 57%
My Father 48% My Mother 48%
Physical Education or Gym Teacher 47% Friends Who Are Boys 46%
Friends Who Are Girls 47% Other Teachers or Coaches 45%
Other Teachers or Coaches 45% Physical Education or Gym Teacher 44%
Grandmother or Grandfather 29% Grandmother or Grandfather 28%
Friends Who Are Boys 26% My Brother 25%
My Sister 23% My Friends Who Are Girls 23%
My Brother 22% My Sister 20%
Table III–12: Main Sources of Encouragement for Children’s
Involvement with Sports and Exercise, by Gender
Percentage of Students Who Say Person “Encourages me a lot” to be Involved in Sports and Exercise
[Base: All Respondents: Girls (N = 1125); Boys (N = 1045)]
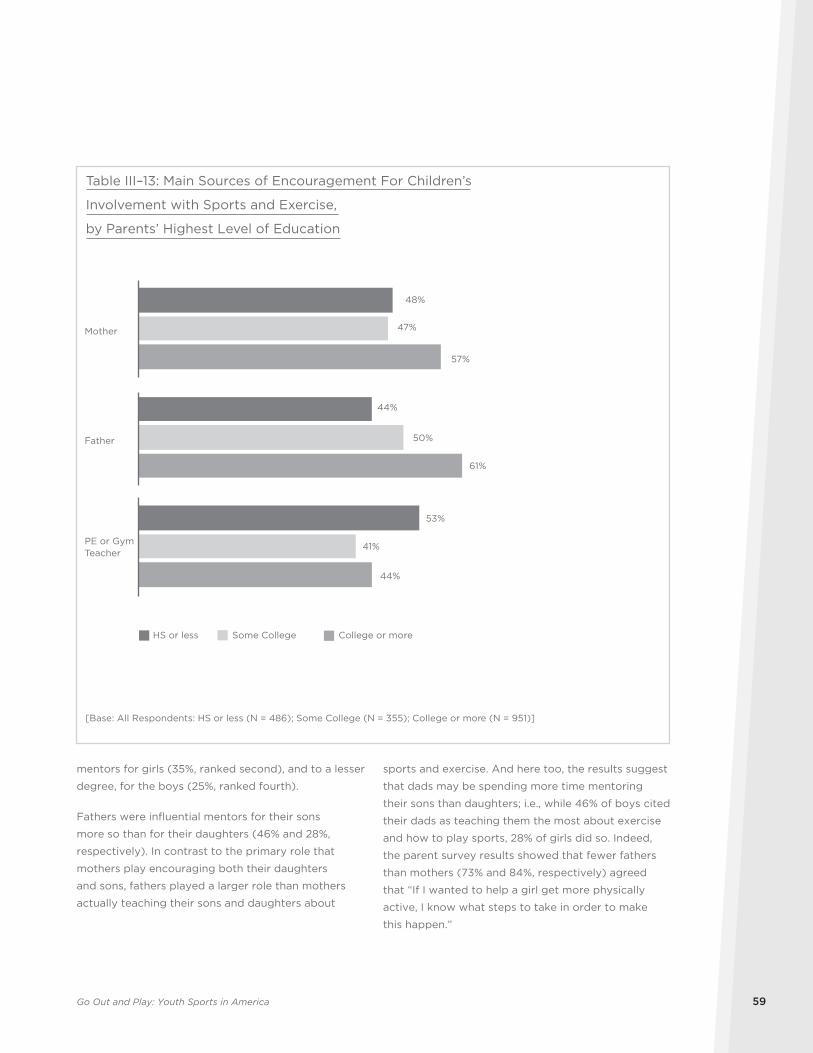
Go Out and Play: Youth Sports in America 59
mentors for girls (35%, ranked second), and to a lesser
degree, for the boys (25%, ranked fourth).
Fathers were influential mentors for their sons
more so than for their daughters (46% and 28%,
respectively). In contrast to the primary role that
mothers play encouraging both their daughters
and sons, fathers played a larger role than mothers
actually teaching their sons and daughters about
sports and exercise. And here too, the results suggest
that dads may be spending more time mentoring
their sons than daughters; i.e., while 46% of boys cited
their dads as teaching them the most about exercise
and how to play sports, 28% of girls did so. Indeed,
the parent survey results showed that fewer fathers
than mothers (73% and 84%, respectively) agreed
that “If I wanted to help a girl get more physically
active, I know what steps to take in order to make
this happen.”
48%
44%
53%
47%
50%
41%
57%
61%
44%
Mother
Father
PE or Gym Teacher
HS or less Some College College or more
Table III–13: Main Sources of Encouragement For Children’s
Involvement with Sports and Exercise,
by Parents’ Highest Level of Education
[Base: All Respondents: HS or less (N = 486); Some College (N = 355); College or more (N = 951)]
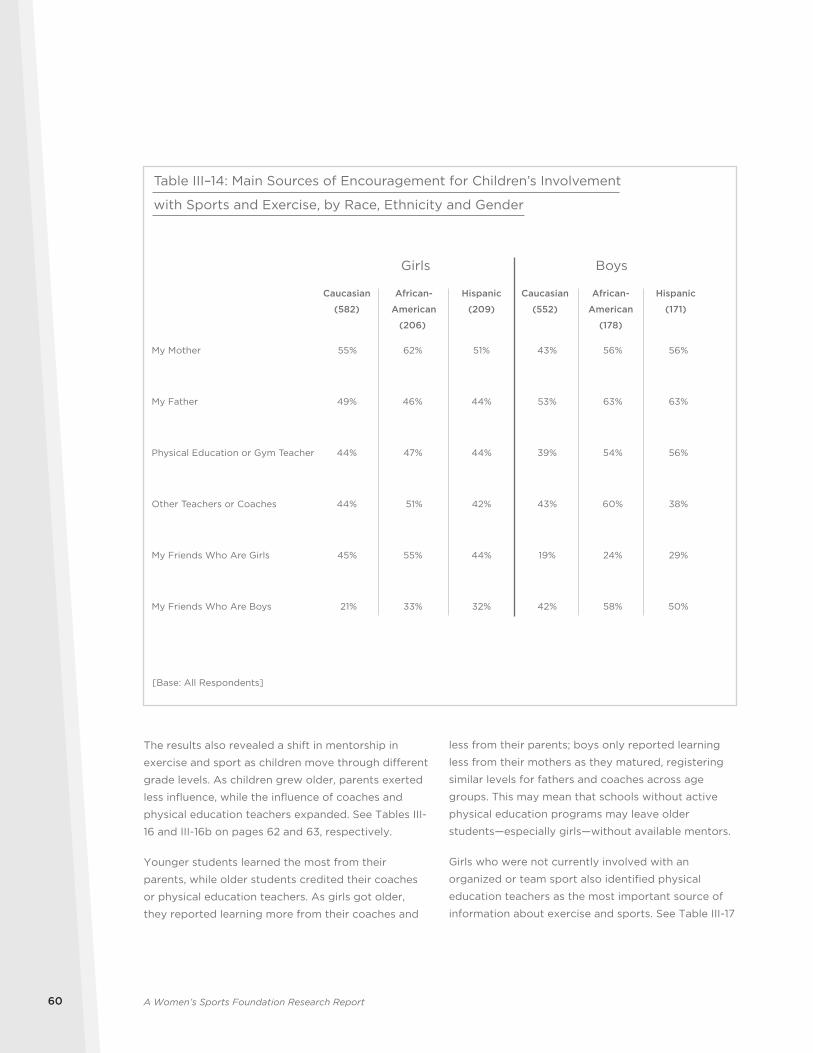
A Women’s Sports Foundation Research Report60
The results also revealed a shift in mentorship in
exercise and sport as children move through different
grade levels. As children grew older, parents exerted
less influence, while the influence of coaches and
physical education teachers expanded. See Tables III-
16 and III-16b on pages 62 and 63, respectively.
Younger students learned the most from their
parents, while older students credited their coaches
or physical education teachers. As girls got older,
they reported learning more from their coaches and
less from their parents; boys only reported learning
less from their mothers as they matured, registering
similar levels for fathers and coaches across age
groups. This may mean that schools without active
physical education programs may leave older
students—especially girls—without available mentors.
Girls who were not currently involved with an
organized or team sport also identified physical
education teachers as the most important source of
information about exercise and sports. See Table III-17
Girls Boys
My Mother
My Father
Physical Education or Gym Teacher
Other Teachers or Coaches
My Friends Who Are Girls
My Friends Who Are Boys
Caucasian
(582)
55%
49%
44%
44%
45%
21%
African-
American
(206)
62%
46%
47%
51%
55%
33%
Hispanic
(209)
51%
44%
44%
42%
44%
32%
Caucasian
(552)
43%
53%
39%
43%
19%
42%
African-
American
(178)
56%
63%
54%
60%
24%
58%
Hispanic
(171)
56%
63%
56%
38%
29%
50%
Table III–14: Main Sources of Encouragement for Children’s Involvement
with Sports and Exercise, by Race, Ethnicity and Gender
[Base: All Respondents]
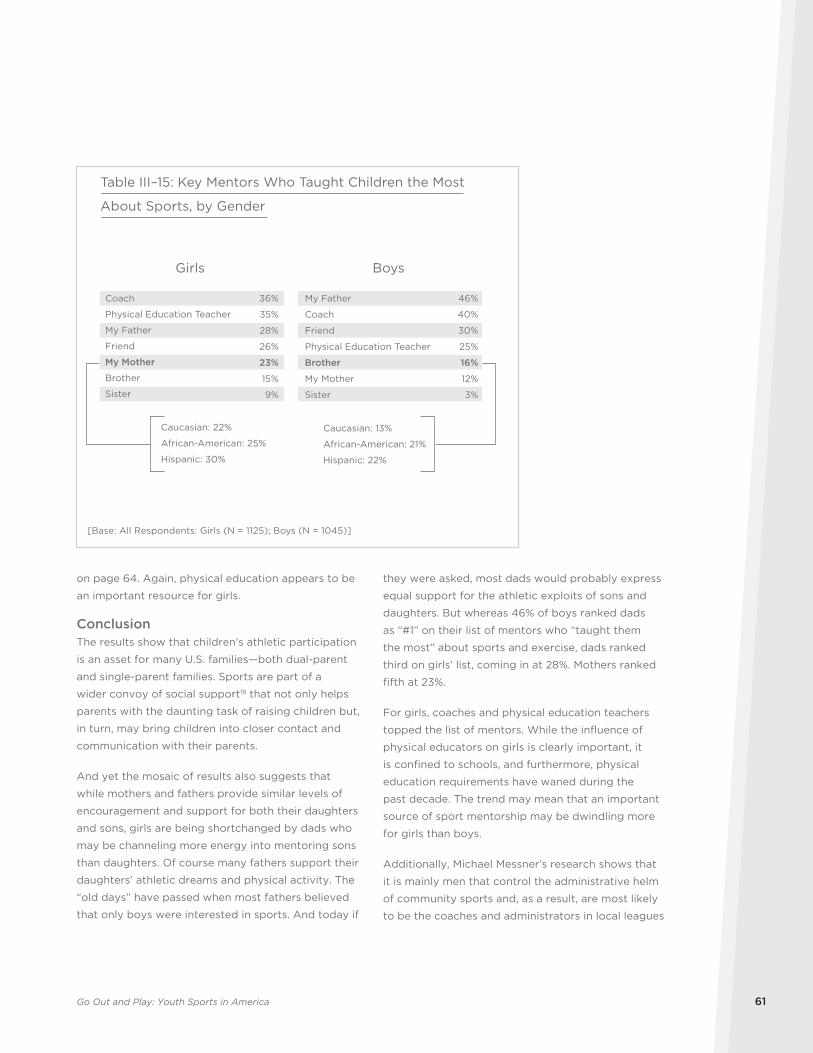
Go Out and Play: Youth Sports in America 61
on page 64. Again, physical education appears to be
an important resource for girls.
ConclusionThe results show that children’s athletic participation
is an asset for many U.S. families—both dual-parent
and single-parent families. Sports are part of a
wider convoy of social support18 that not only helps
parents with the daunting task of raising children but,
in turn, may bring children into closer contact and
communication with their parents.
And yet the mosaic of results also suggests that
while mothers and fathers provide similar levels of
encouragement and support for both their daughters
and sons, girls are being shortchanged by dads who
may be channeling more energy into mentoring sons
than daughters. Of course many fathers support their
daughters’ athletic dreams and physical activity. The
“old days” have passed when most fathers believed
that only boys were interested in sports. And today if
they were asked, most dads would probably express
equal support for the athletic exploits of sons and
daughters. But whereas 46% of boys ranked dads
as “#1” on their list of mentors who “taught them
the most” about sports and exercise, dads ranked
third on girls’ list, coming in at 28%. Mothers ranked
fifth at 23%.
For girls, coaches and physical education teachers
topped the list of mentors. While the influence of
physical educators on girls is clearly important, it
is confined to schools, and furthermore, physical
education requirements have waned during the
past decade. The trend may mean that an important
source of sport mentorship may be dwindling more
for girls than boys.
Additionally, Michael Messner’s research shows that
it is mainly men that control the administrative helm
of community sports and, as a result, are most likely
to be the coaches and administrators in local leagues
Girls Boys
Coach 36% My Father 46%
Physical Education Teacher 35% Coach 40%
My Father 28% Friend 30%
Friend 26% Physical Education Teacher 25%
My Mother 23% Brother 16%
Brother 15% My Mother 12%
Sister 9% Sister 3%
Table III–15: Key Mentors Who Taught Children the Most
About Sports, by Gender
[Base: All Respondents: Girls (N = 1125); Boys (N = 1045)]
Caucasian: 13%
African-American: 21%
Hispanic: 22%
Caucasian: 22%
African-American: 25%
Hispanic: 30%
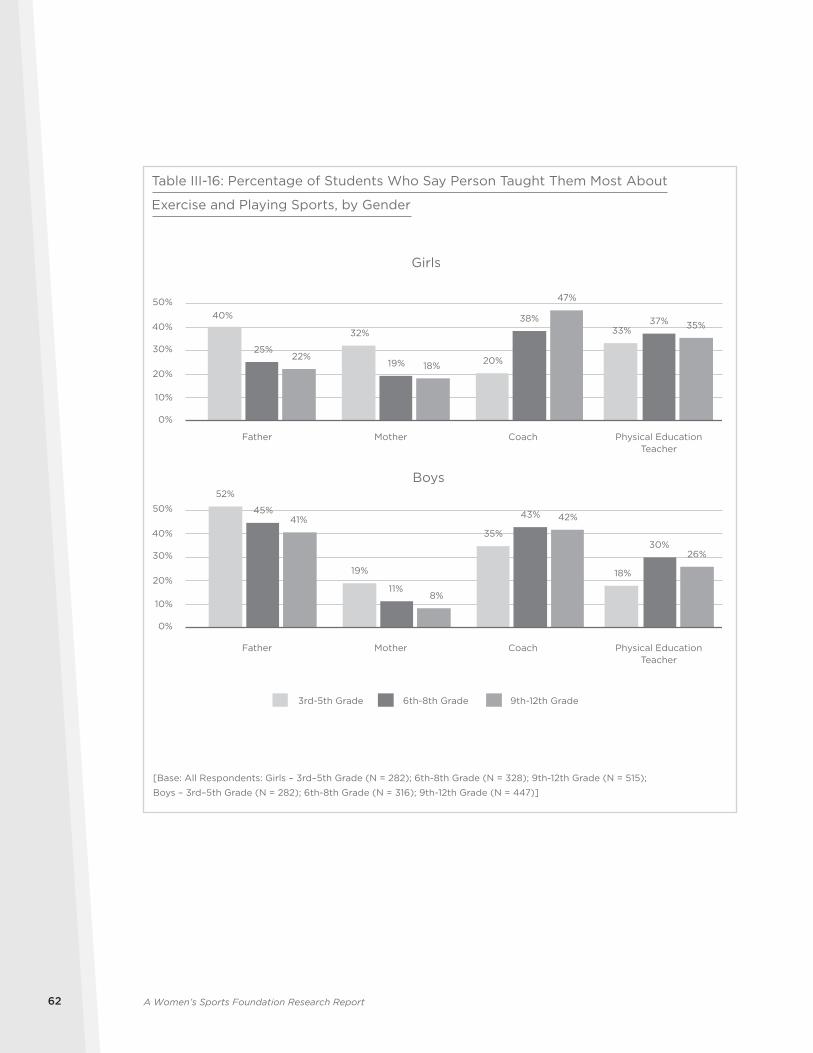
A Women’s Sports Foundation Research Report62
0%
10%
20%
30%
40%
50%
0%
10%
20%
30%
40%
50%
40%
32%
20%
33%
25%19%
38% 37%
22%18%
47%
35%
52%
19%
35%
18%
45%
11%
43%
30%
41%
8%
42%
26%
Father Mother Coach
Girls
Boys
Table III-16: Percentage of Students Who Say Person Taught Them Most About
Exercise and Playing Sports, by Gender
[Base: All Respondents: Girls – 3rd–5th Grade (N = 282); 6th-8th Grade (N = 328); 9th-12th Grade (N = 515);
Boys – 3rd–5th Grade (N = 282); 6th-8th Grade (N = 316); 9th-12th Grade (N = 447)]
Physical EducationTeacher
Father Mother Coach Physical EducationTeacher
6th-8th Grade 9th-12th Grade3rd-5th Grade
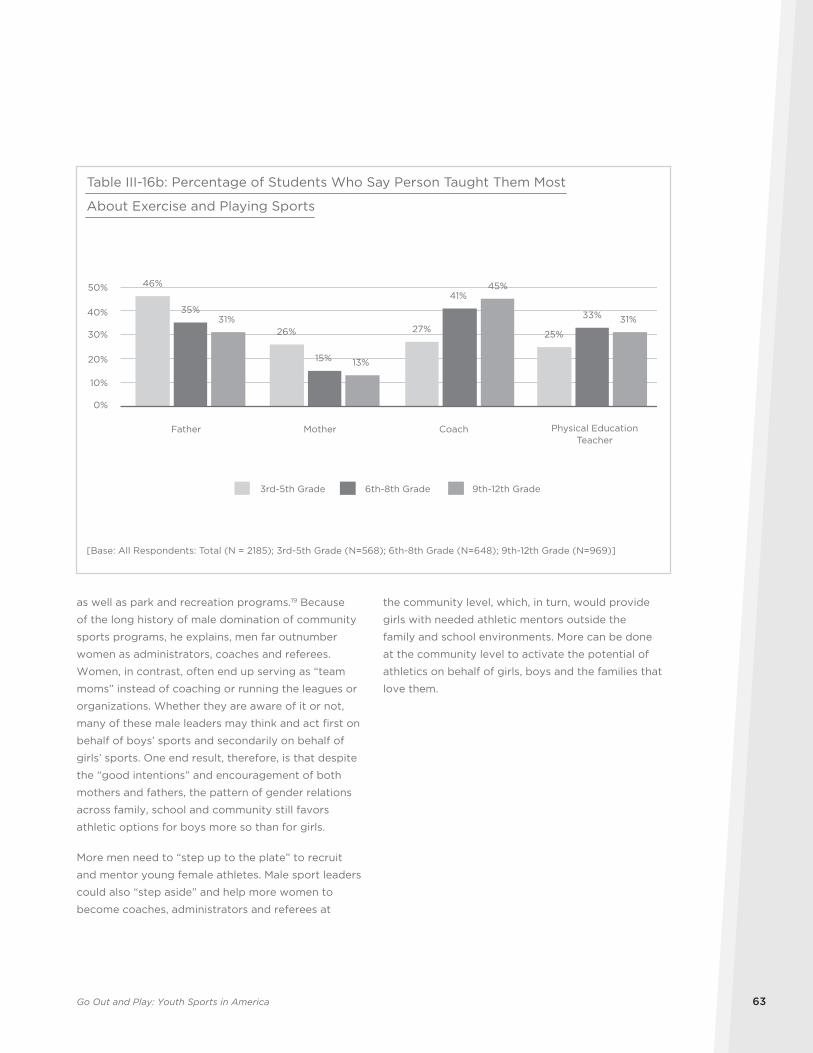
Go Out and Play: Youth Sports in America 63
the community level, which, in turn, would provide
girls with needed athletic mentors outside the
family and school environments. More can be done
at the community level to activate the potential of
athletics on behalf of girls, boys and the families that
love them.
as well as park and recreation programs.19 Because
of the long history of male domination of community
sports programs, he explains, men far outnumber
women as administrators, coaches and referees.
Women, in contrast, often end up serving as “team
moms” instead of coaching or running the leagues or
organizations. Whether they are aware of it or not,
many of these male leaders may think and act first on
behalf of boys’ sports and secondarily on behalf of
girls’ sports. One end result, therefore, is that despite
the “good intentions” and encouragement of both
mothers and fathers, the pattern of gender relations
across family, school and community still favors
athletic options for boys more so than for girls.
More men need to “step up to the plate” to recruit
and mentor young female athletes. Male sport leaders
could also “step aside” and help more women to
become coaches, administrators and referees at
0%
10%
20%
30%
40%
50% 46%
26% 27% 25%
35%
15%
41%
33%31%
13%
45%
31%
Father Mother Coach
Table III-16b: Percentage of Students Who Say Person Taught Them Most
About Exercise and Playing Sports
[Base: All Respondents: Total (N = 2185); 3rd-5th Grade (N=568); 6th-8th Grade (N=648); 9th-12th Grade (N=969)]
Physical EducationTeacher
6th-8th Grade 9th-12th Grade3rd-5th Grade
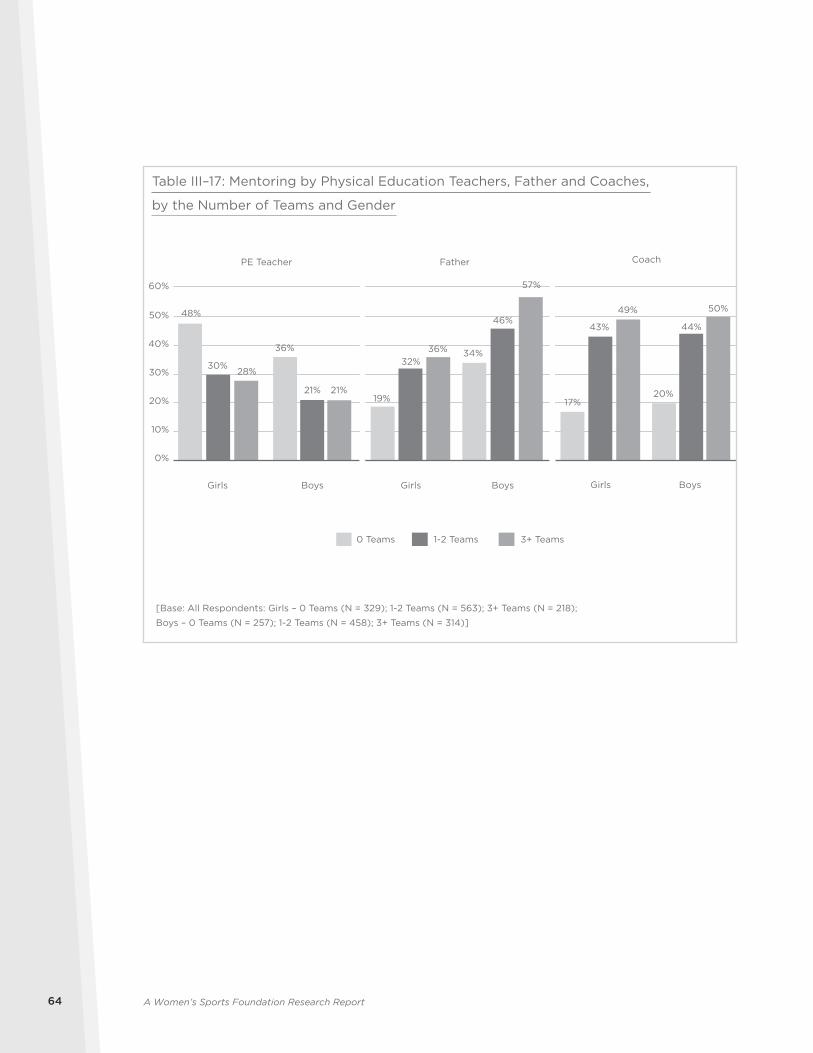
A Women’s Sports Foundation Research Report64
0%
10%
20%
30%
40%
50%
19%
34%32%
46%
36%
57%
Girls Boys
17%20%
43% 44%
49% 50%
Girls Boys
Father Coach
Table III–17: Mentoring by Physical Education Teachers, Father and Coaches,
by the Number of Teams and Gender
[Base: All Respondents: Girls – 0 Teams (N = 329); 1-2 Teams (N = 563); 3+ Teams (N = 218);
Boys – 0 Teams (N = 257); 1-2 Teams (N = 458); 3+ Teams (N = 314)]
48%
36%
30%
21%
28%
21%
Girls Boys
PE Teacher
0 Teams 3+ Teams1-2 Teams
60%
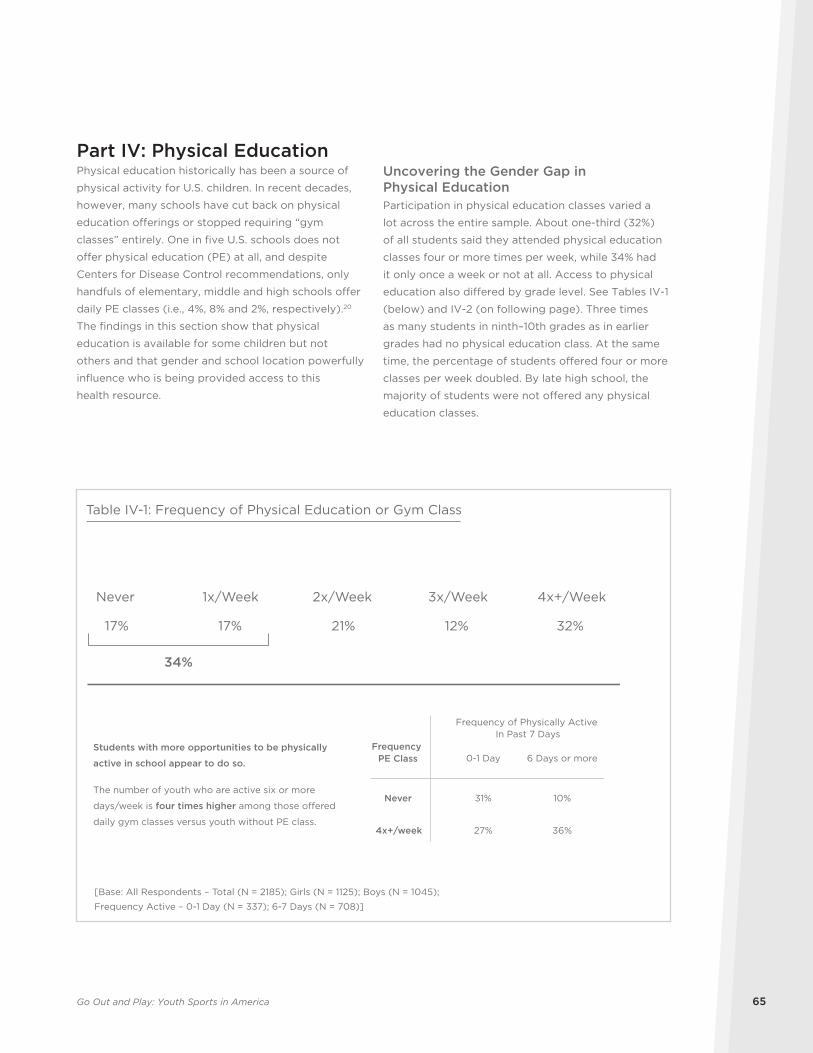
Go Out and Play: Youth Sports in America 65
Part IV: Physical EducationPhysical education historically has been a source of
physical activity for U.S. children. In recent decades,
however, many schools have cut back on physical
education offerings or stopped requiring “gym
classes” entirely. One in five U.S. schools does not
offer physical education (PE) at all, and despite
Centers for Disease Control recommendations, only
handfuls of elementary, middle and high schools offer
daily PE classes (i.e., 4%, 8% and 2%, respectively).20
The findings in this section show that physical
education is available for some children but not
others and that gender and school location powerfully
influence who is being provided access to this
health resource.
Uncovering the Gender Gap in Physical EducationParticipation in physical education classes varied a
lot across the entire sample. About one-third (32%)
of all students said they attended physical education
classes four or more times per week, while 34% had
it only once a week or not at all. Access to physical
education also differed by grade level. See Tables IV-1
(below) and IV-2 (on following page). Three times
as many students in ninth–10th grades as in earlier
grades had no physical education class. At the same
time, the percentage of students offered four or more
classes per week doubled. By late high school, the
majority of students were not offered any physical
education classes.
Never
17%
1x/Week
17%
2x/Week
21%
3x/Week
12%
4x+/Week
32%
34%
Table IV-1: Frequency of Physical Education or Gym Class
Students with more opportunities to be physically
active in school appear to do so.
The number of youth who are active six or more
days/week is four times higher among those o�ered
daily gym classes versus youth without PE class.
[Base: All Respondents – Total (N = 2185); Girls (N = 1125); Boys (N = 1045);
Frequency Active – 0-1 Day (N = 337); 6-7 Days (N = 708)]
6 Days or more
Never 31% 10%
4x+/week 27% 36%
Frequency of Physically Active In Past 7 Days
0-1 DayFrequency
PE Class
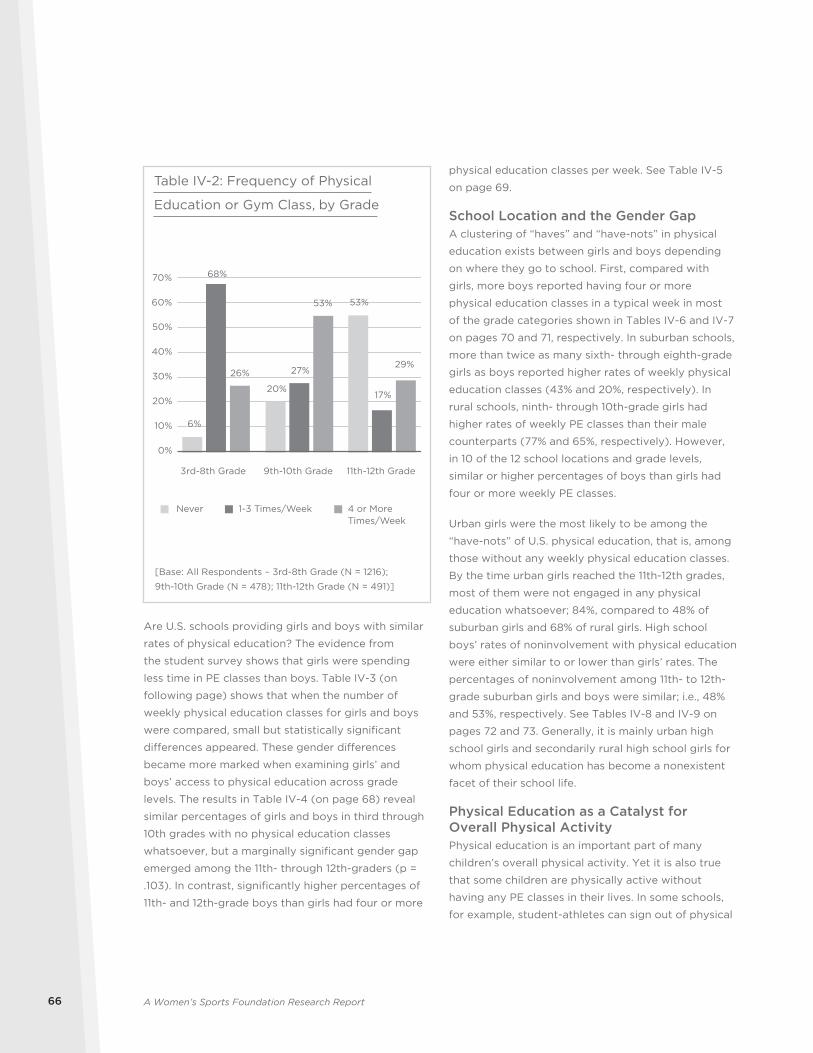
A Women’s Sports Foundation Research Report66
Are U.S. schools providing girls and boys with similar
rates of physical education? The evidence from
the student survey shows that girls were spending
less time in PE classes than boys. Table IV-3 (on
following page) shows that when the number of
weekly physical education classes for girls and boys
were compared, small but statistically significant
differences appeared. These gender differences
became more marked when examining girls’ and
boys’ access to physical education across grade
levels. The results in Table IV-4 (on page 68) reveal
similar percentages of girls and boys in third through
10th grades with no physical education classes
whatsoever, but a marginally significant gender gap
emerged among the 11th- through 12th-graders (p =
.103). In contrast, significantly higher percentages of
11th- and 12th-grade boys than girls had four or more
physical education classes per week. See Table IV-5
on page 69.
School Location and the Gender GapA clustering of “haves” and “have-nots” in physical
education exists between girls and boys depending
on where they go to school. First, compared with
girls, more boys reported having four or more
physical education classes in a typical week in most
of the grade categories shown in Tables IV-6 and IV-7
on pages 70 and 71, respectively. In suburban schools,
more than twice as many sixth- through eighth-grade
girls as boys reported higher rates of weekly physical
education classes (43% and 20%, respectively). In
rural schools, ninth- through 10th-grade girls had
higher rates of weekly PE classes than their male
counterparts (77% and 65%, respectively). However,
in 10 of the 12 school locations and grade levels,
similar or higher percentages of boys than girls had
four or more weekly PE classes.
Urban girls were the most likely to be among the
“have-nots” of U.S. physical education, that is, among
those without any weekly physical education classes.
By the time urban girls reached the 11th-12th grades,
most of them were not engaged in any physical
education whatsoever; 84%, compared to 48% of
suburban girls and 68% of rural girls. High school
boys’ rates of noninvolvement with physical education
were either similar to or lower than girls’ rates. The
percentages of noninvolvement among 11th- to 12th-
grade suburban girls and boys were similar; i.e., 48%
and 53%, respectively. See Tables IV-8 and IV-9 on
pages 72 and 73. Generally, it is mainly urban high
school girls and secondarily rural high school girls for
whom physical education has become a nonexistent
facet of their school life.
Physical Education as a Catalyst for Overall Physical Activity Physical education is an important part of many
children’s overall physical activity. Yet it is also true
that some children are physically active without
having any PE classes in their lives. In some schools,
for example, student-athletes can sign out of physical
0%
10%
20%
30%
40%
50%
60%
70%
6%
20%
53%
68%
27%
17%
26%
53%
29%
3rd-8th Grade 9th-10th Grade 11th-12th Grade
Never 1-3 Times/Week 4 or More Times/Week
Table IV-2: Frequency of Physical
Education or Gym Class, by Grade
[Base: All Respondents – 3rd-8th Grade (N = 1216);
9th-10th Grade (N = 478); 11th-12th Grade (N = 491)]
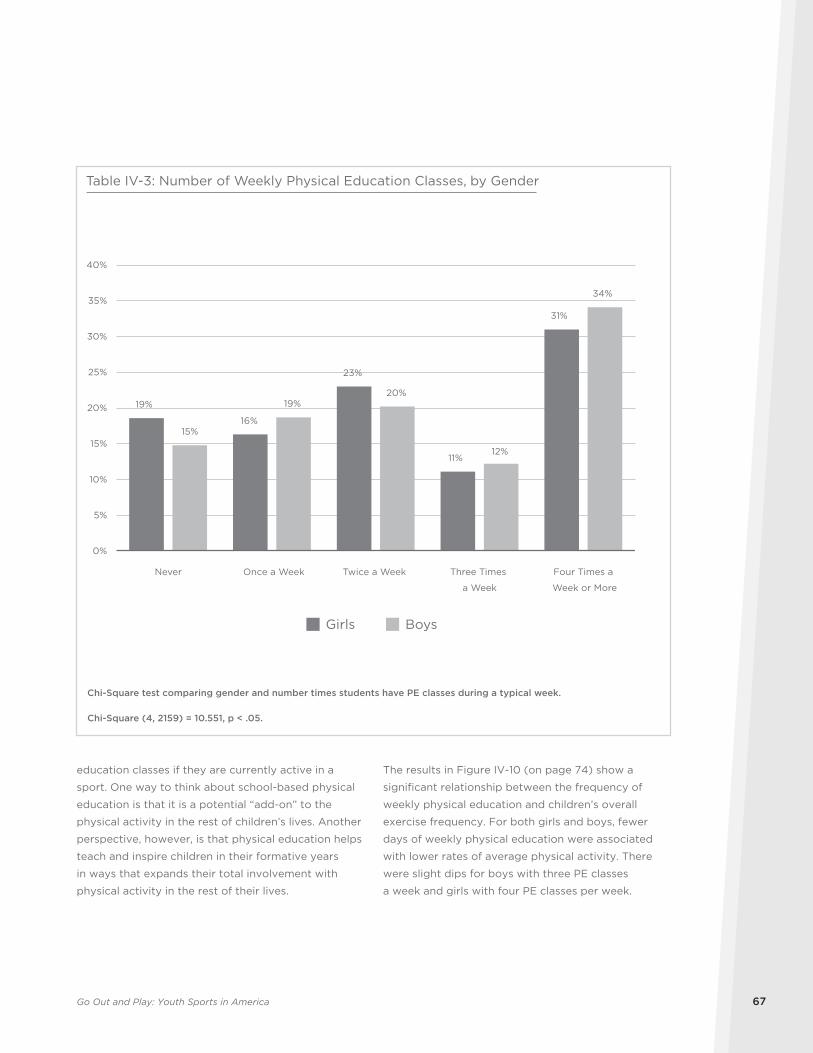
Go Out and Play: Youth Sports in America 67
education classes if they are currently active in a
sport. One way to think about school-based physical
education is that it is a potential “add-on” to the
physical activity in the rest of children’s lives. Another
perspective, however, is that physical education helps
teach and inspire children in their formative years
in ways that expands their total involvement with
physical activity in the rest of their lives.
The results in Figure IV-10 (on page 74) show a
significant relationship between the frequency of
weekly physical education and children’s overall
exercise frequency. For both girls and boys, fewer
days of weekly physical education were associated
with lower rates of average physical activity. There
were slight dips for boys with three PE classes
a week and girls with four PE classes per week.
19%
16%
23%
11%
31%
15%
19%20%
12%
34%
0%
5%
10%
15%
20%
25%
30%
35%
40%
Never Once a Week Twice a Week
Girls Boys
Table IV-3: Number of Weekly Physical Education Classes, by Gender
Three Times
a Week
Four Times a
Week or More
Chi-Square test comparing gender and number times students have PE classes during a typical week.
Chi-Square (4, 2159) = 10.551, p < .05.
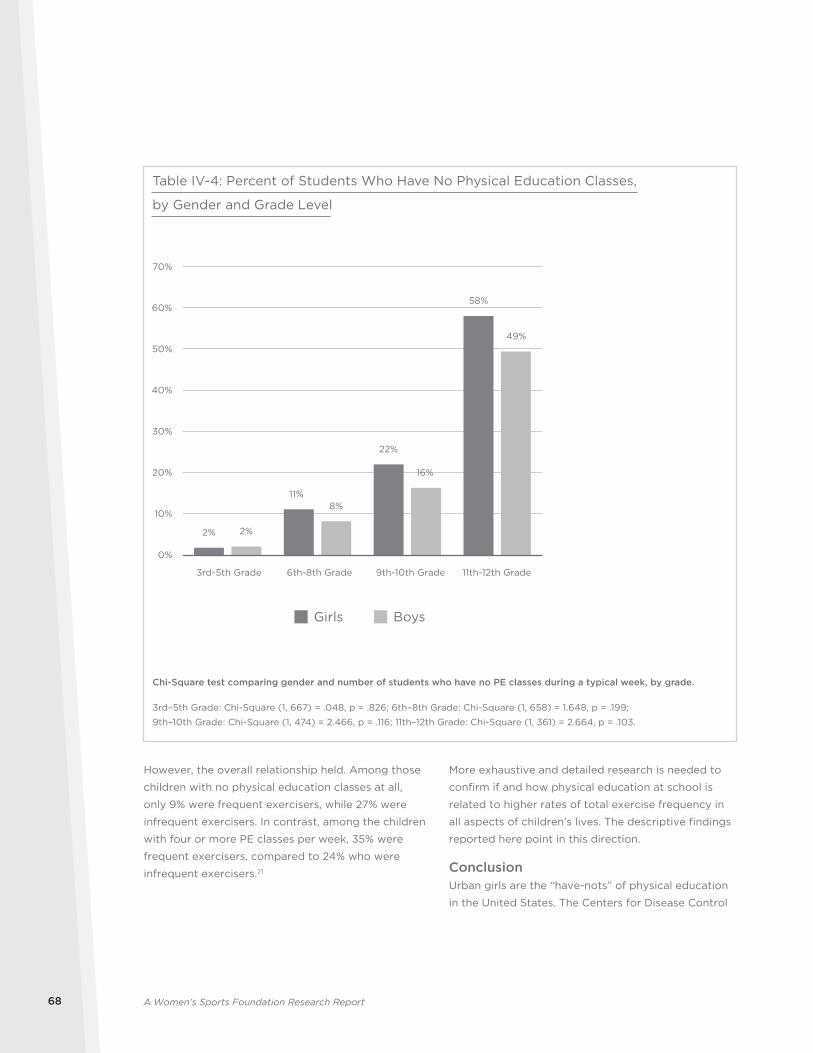
A Women’s Sports Foundation Research Report68
However, the overall relationship held. Among those
children with no physical education classes at all,
only 9% were frequent exercisers, while 27% were
infrequent exercisers. In contrast, among the children
with four or more PE classes per week, 35% were
frequent exercisers, compared to 24% who were
infrequent exercisers.21
More exhaustive and detailed research is needed to
confirm if and how physical education at school is
related to higher rates of total exercise frequency in
all aspects of children’s lives. The descriptive findings
reported here point in this direction.
ConclusionUrban girls are the “have-nots” of physical education
in the United States. The Centers for Disease Control
2%
11%
22%
58%
2%
8%
16%
49%
0%
10%
20%
30%
40%
50%
60%
70%
Girls Boys
Table IV-4: Percent of Students Who Have No Physical Education Classes,
by Gender and Grade Level
Chi-Square test comparing gender and number of students who have no PE classes during a typical week, by grade.
3rd–5th Grade: Chi-Square (1, 667) = .048, p = .826; 6th–8th Grade: Chi-Square (1, 658) = 1.648, p = .199;
9th–10th Grade: Chi-Square (1, 474) = 2.466, p = .116; 11th–12th Grade: Chi-Square (1, 361) = 2.664, p = .103.
3rd-5th Grade 6th-8th Grade 9th-10th Grade 11th-12th Grade
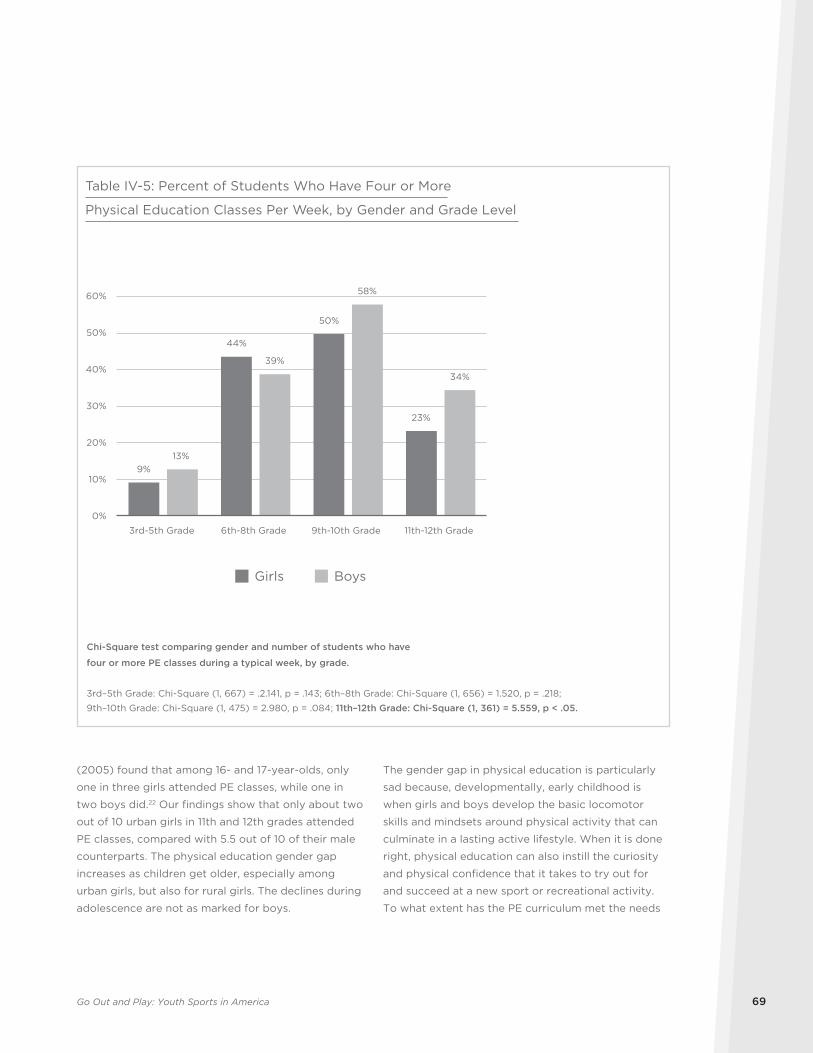
Go Out and Play: Youth Sports in America 69
(2005) found that among 16- and 17-year-olds, only
one in three girls attended PE classes, while one in
two boys did.22 Our findings show that only about two
out of 10 urban girls in 11th and 12th grades attended
PE classes, compared with 5.5 out of 10 of their male
counterparts. The physical education gender gap
increases as children get older, especially among
urban girls, but also for rural girls. The declines during
adolescence are not as marked for boys.
The gender gap in physical education is particularly
sad because, developmentally, early childhood is
when girls and boys develop the basic locomotor
skills and mindsets around physical activity that can
culminate in a lasting active lifestyle. When it is done
right, physical education can also instill the curiosity
and physical confidence that it takes to try out for
and succeed at a new sport or recreational activity.
To what extent has the PE curriculum met the needs
9%
44%
50%
23%
13%
39%
58%
34%
0%
10%
20%
30%
40%
50%
60%
Girls Boys
Table IV-5: Percent of Students Who Have Four or More
Physical Education Classes Per Week, by Gender and Grade Level
Chi-Square test comparing gender and number of students who have
four or more PE classes during a typical week, by grade.
3rd–5th Grade: Chi-Square (1, 667) = .2.141, p = .143; 6th–8th Grade: Chi-Square (1, 656) = 1.520, p = .218;
9th–10th Grade: Chi-Square (1, 475) = 2.980, p = .084; 11th–12th Grade: Chi-Square (1, 361) = 5.559, p < .05.
3rd-5th Grade 6th-8th Grade 9th-10th Grade 11th-12th Grade
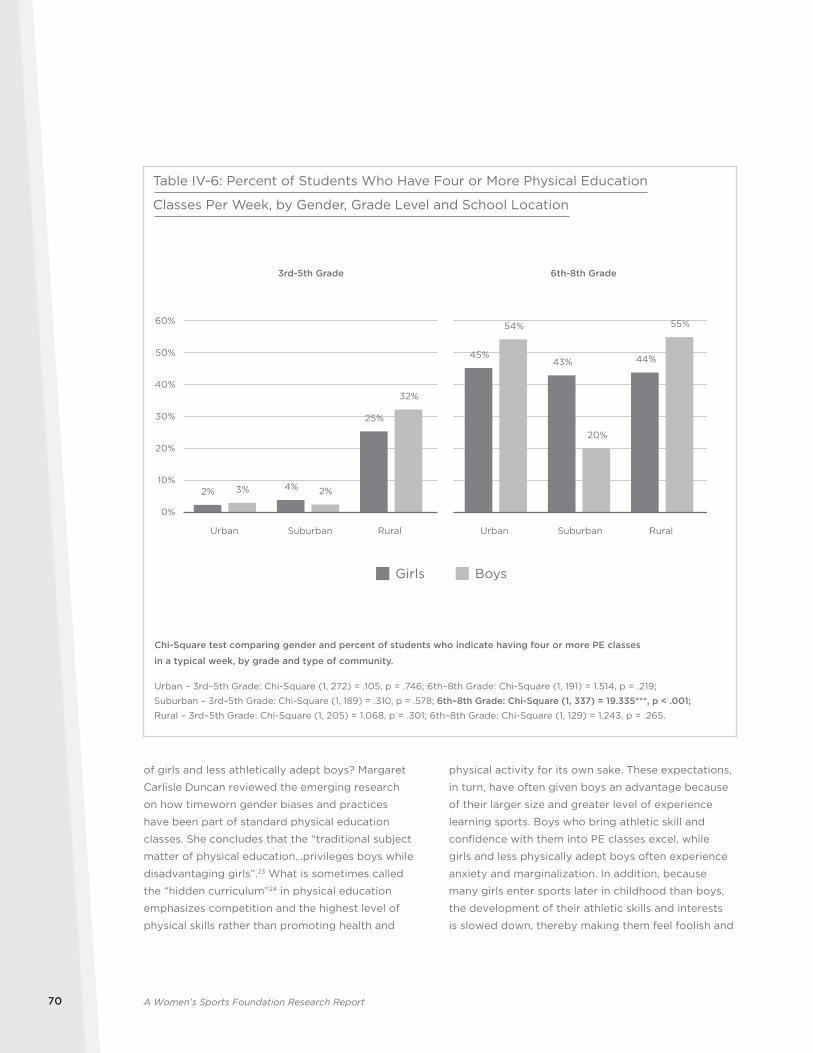
A Women’s Sports Foundation Research Report70
of girls and less athletically adept boys? Margaret
Carlisle Duncan reviewed the emerging research
on how timeworn gender biases and practices
have been part of standard physical education
classes. She concludes that the “traditional subject
matter of physical education…privileges boys while
disadvantaging girls”.23 What is sometimes called
the “hidden curriculum”24 in physical education
emphasizes competition and the highest level of
physical skills rather than promoting health and
physical activity for its own sake. These expectations,
in turn, have often given boys an advantage because
of their larger size and greater level of experience
learning sports. Boys who bring athletic skill and
confidence with them into PE classes excel, while
girls and less physically adept boys often experience
anxiety and marginalization. In addition, because
many girls enter sports later in childhood than boys,
the development of their athletic skills and interests
is slowed down, thereby making them feel foolish and
2% 4%
25%
45%43% 44%
3% 2%
32%
54%
20%
55%
0%
10%
20%
30%
40%
50%
60%
Urban Suburban Rural Urban Suburban Rural
Girls Boys
Table IV-6: Percent of Students Who Have Four or More Physical Education
Classes Per Week, by Gender, Grade Level and School Location
Chi-Square test comparing gender and percent of students who indicate having four or more PE classes
in a typical week, by grade and type of community.
Urban – 3rd–5th Grade: Chi-Square (1, 272) = .105, p = .746; 6th–8th Grade: Chi-Square (1, 191) = 1.514, p = .219;
Suburban – 3rd–5th Grade: Chi-Square (1, 189) = .310, p = .578; 6th–8th Grade: Chi-Square (1, 337) = 19.335***, p < .001;Rural – 3rd–5th Grade: Chi-Square (1, 205) = 1.068, p = .301; 6th–8th Grade: Chi-Square (1, 129) = 1.243, p = .265.
3rd-5th Grade 6th-8th Grade
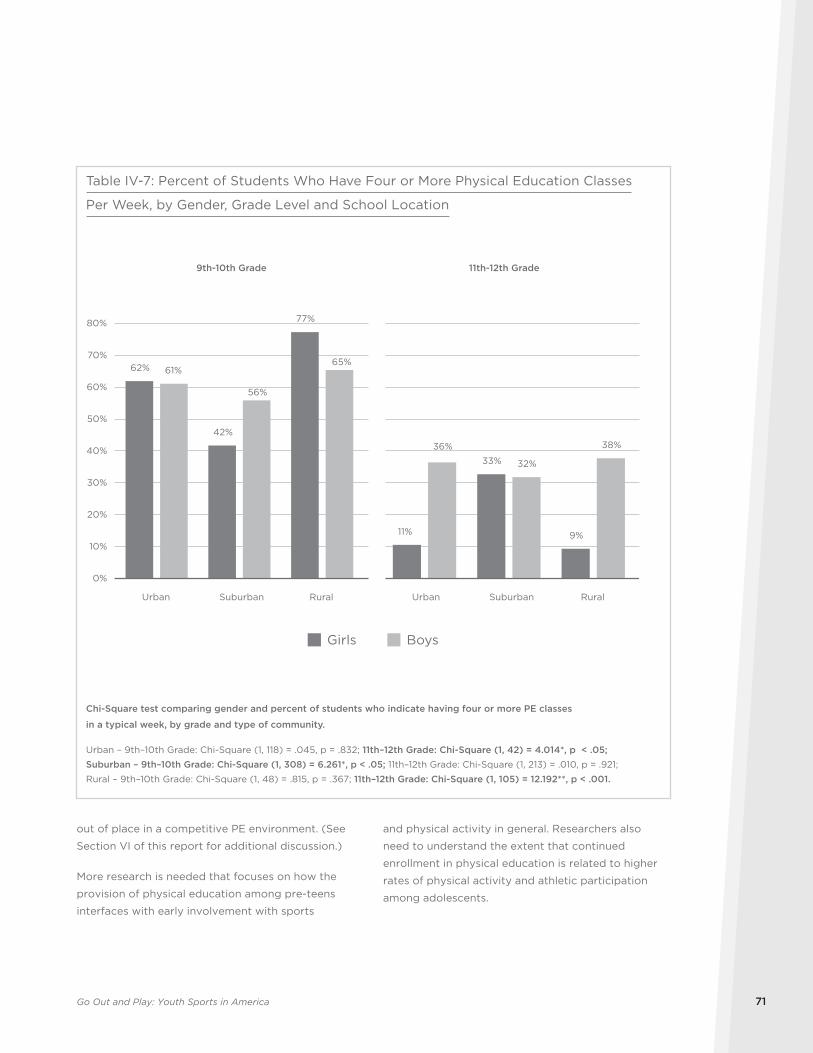
Go Out and Play: Youth Sports in America 71
out of place in a competitive PE environment. (See
Section VI of this report for additional discussion.)
More research is needed that focuses on how the
provision of physical education among pre-teens
interfaces with early involvement with sports
and physical activity in general. Researchers also
need to understand the extent that continued
enrollment in physical education is related to higher
rates of physical activity and athletic participation
among adolescents.
0%
10%
20%
30%
40%
50%
60%
70%
80%
Urban Suburban Rural Urban Suburban Rural
Girls Boys
Table IV-7: Percent of Students Who Have Four or More Physical Education Classes
Per Week, by Gender, Grade Level and School Location
9th-10th Grade 11th-12th Grade
Chi-Square test comparing gender and percent of students who indicate having four or more PE classes
in a typical week, by grade and type of community.
Urban – 9th–10th Grade: Chi-Square (1, 118) = .045, p = .832; 11th–12th Grade: Chi-Square (1, 42) = 4.014*, p < .05;Suburban – 9th–10th Grade: Chi-Square (1, 308) = 6.261*, p < .05; 11th–12th Grade: Chi-Square (1, 213) = .010, p = .921;
Rural – 9th–10th Grade: Chi-Square (1, 48) = .815, p = .367; 11th–12th Grade: Chi-Square (1, 105) = 12.192**, p < .001.
62%
42%
77%
11%
33%
9%
61%
56%
65%
36%
32%
38%
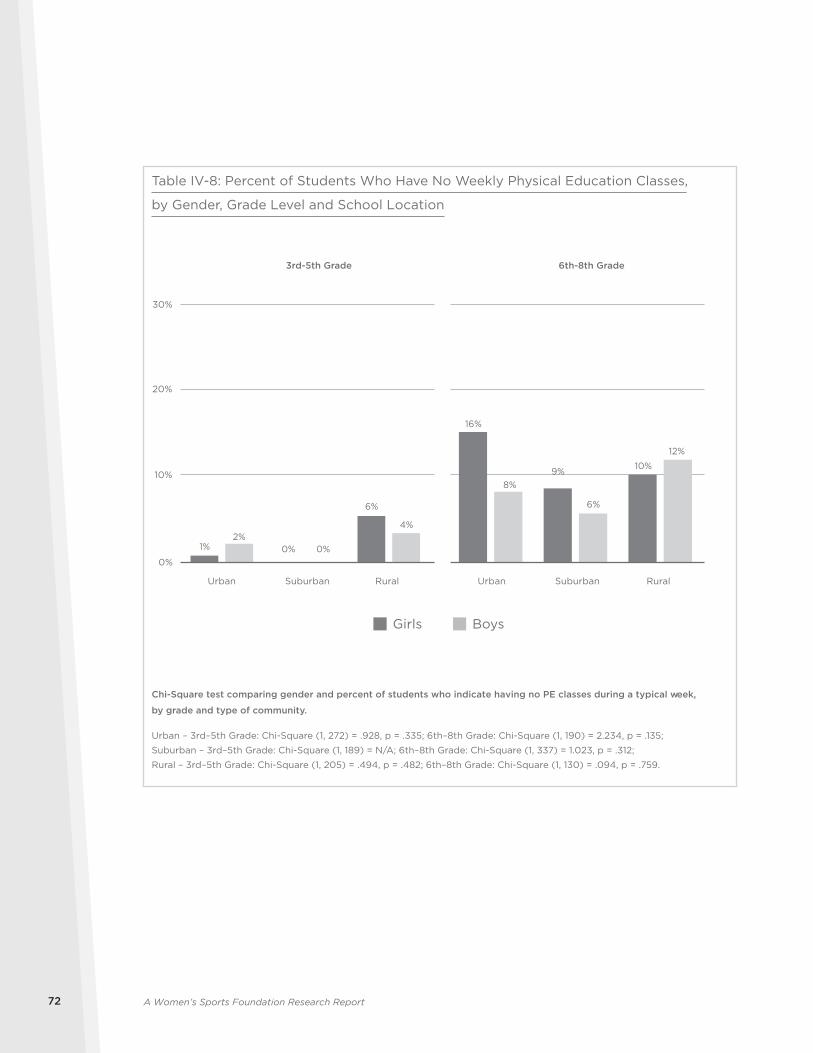
A Women’s Sports Foundation Research Report72
0%
10%
20%
30%
Urban Suburban Rural Urban Suburban Rural
Girls Boys
3rd-5th Grade 6th-8th Grade
1% 0%
6%
16%
9% 10%
2%0%
4%
8%
6%
12%
Chi-Square test comparing gender and percent of students who indicate having no PE classes during a typical week,
by grade and type of community.
Urban – 3rd–5th Grade: Chi-Square (1, 272) = .928, p = .335; 6th–8th Grade: Chi-Square (1, 190) = 2.234, p = .135;
Suburban – 3rd–5th Grade: Chi-Square (1, 189) = N/A; 6th–8th Grade: Chi-Square (1, 337) = 1.023, p = .312;
Rural – 3rd–5th Grade: Chi-Square (1, 205) = .494, p = .482; 6th–8th Grade: Chi-Square (1, 130) = .094, p = .759.
Table IV-8: Percent of Students Who Have No Weekly Physical Education Classes,
by Gender, Grade Level and School Location
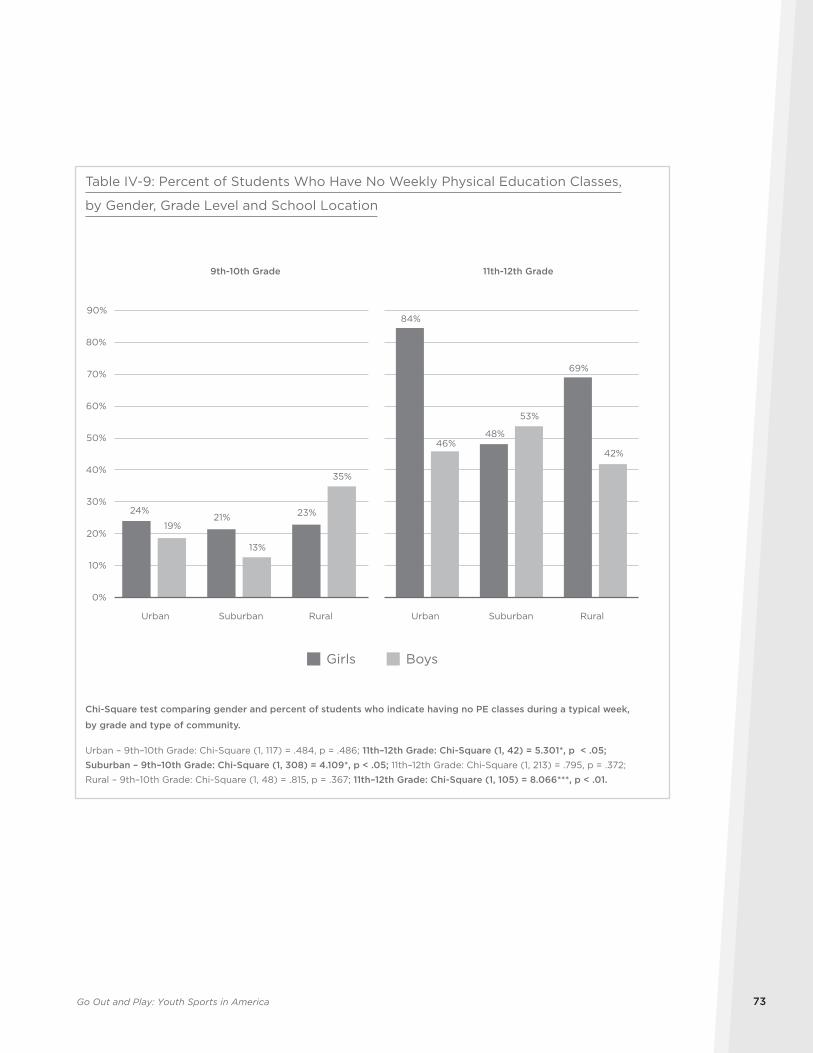
Go Out and Play: Youth Sports in America 73
0%
10%
20%
30%
40%
50%
60%
70%
80%
90%
Urban Suburban Rural Urban Suburban Rural
Girls Boys
9th-10th Grade 11th-12th Grade
Table IV-9: Percent of Students Who Have No Weekly Physical Education Classes,
by Gender, Grade Level and School Location
24%21% 23%
84%
48%
69%
19%
13%
35%
46%
53%
42%
Chi-Square test comparing gender and percent of students who indicate having no PE classes during a typical week,
by grade and type of community.
Urban – 9th–10th Grade: Chi-Square (1, 117) = .484, p = .486; 11th–12th Grade: Chi-Square (1, 42) = 5.301*, p < .05;Suburban – 9th–10th Grade: Chi-Square (1, 308) = 4.109*, p < .05; 11th–12th Grade: Chi-Square (1, 213) = .795, p = .372;
Rural – 9th–10th Grade: Chi-Square (1, 48) = .815, p = .367; 11th–12th Grade: Chi-Square (1, 105) = 8.066***, p < .01.
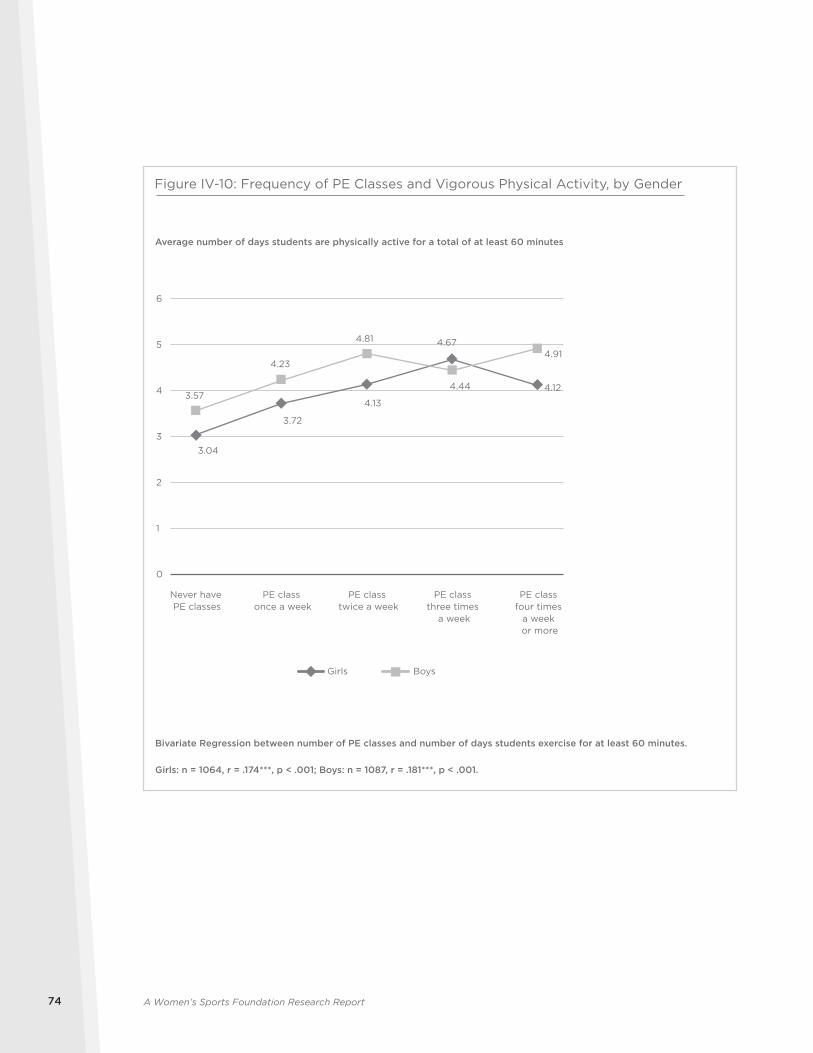
A Women’s Sports Foundation Research Report74
Girls Boys
3.04
3.72
4.13
4.67
4.123.57
4.23
4.81
4.44
4.91
0
1
2
3
4
5
6
Never have PE classes
PE class once a week
PE class twice a week
Bivariate Regression between number of PE classes and number of days students exercise for at least 60 minutes.
Girls: n = 1064, r = .174***, p < .001; Boys: n = 1087, r = .181***, p < .001.
Figure IV-10: Frequency of PE Classes and Vigorous Physical Activity, by Gender
Average number of days students are physically active for a total of at least 60 minutes
PE class three times
a week
PE class four times
a week or more
Go Out and Play: Youth Sports in America 75
Part V: Athletic Participation and Children’s Well-BeingAdvocates for youth sports often tout its favorable
influence on children’s health and emotional well-
being. This study explored a variety of ways that
sports involvement intersects with the overall
development of girls and boys. Here “health and well-
being” are broadly defined to include physical health,
emotional health and successful social adaptation in
school. The results show that for many U.S. children,
athletic participation contributes to general health
and body esteem, healthy weight, social relationships,
quality of life, and educational achievement.
Physical and Emotional HealthDoes athletic participation influence how children
think and feel about their health and bodies? In order
to measure children’s basic physical well-being,
students were asked to describe their own health.
Responses included “excellent,” “very good,” “good,”
“fair” and “poor.” The student survey also included a
three-item scale that measures body esteem, which
provided a basic touchstone for assessing children’s
emotional health.
Self-Reported HealthWithin each of the three clusters of grade levels,
higher percentages of female athletes than non-
athletes described their health as “excellent.” As
girls get older, they were less apt to see their health
as excellent, and yet, three times as many female
high school athletes as non-athletes (20% and 6%,
respectively) labeled their health as excellent. No
significant differences between female non-athletes
and athletes occurred among the sixth- through
eighth-graders. See Table V-1 on following page. More
than one-third of the third- through fifth-grade boys
rated their health as excellent (regardless of athletic
status). Male athletes were more apt to rate their
health as excellent among the sixth through eighth
grades and ninth through 12th grades.
The self-reported health of girls was also related to
the number of sports teams they played on during
the past year. See Table V-2 on page 77. While 51%
of highly involved third- through fifth-grade girls said
their health was excellent, for example, 32% of their
non-athletic counterparts did so. Three times as many
moderately involved high school female athletes than
non-athletes reported excellent health (22% and 6%,
respectively). The one exception was among highly
involved female high school athletes (11%) who,
instead, tended to classify their health as “very good”
more often than “excellent.”
Among the boys, no differences in self-rated health
issued for the third- through fifth-graders, regardless
of the degree of their athletic involvement. Both the
moderately involved and highly involved athletes,
however, were more likely than the non-athletes
from sixth through 12th grades to rate their health as
excellent. See Table V-2.25
Sport and Body EsteemWhile boys are no strangers to mixed feelings about
their bodies, girls are especially pushed by mass
media to develop unrealistic ideal body images,
and this can lead to unhealthy eating behaviors and
personal dissatisfaction.26 A Harvard Medical School
survey of fifth- through 12th-grade girls found that
nearly six of 10 were dissatisfied with their bodies.27
Whether young persons feel good about their
bodies is an important component of psychological
well-being.
This study found that athletic participation was
associated with the body esteem of both girls and
boys. Body esteem was measured by responses to
three statements about how students feel about their
bodies.28 See Table V-3 on page 78.
The favorable contributions of sport to body esteem,
moreover, were evident within grade levels and
school locations. More highly involved athletes scored
higher on the body esteem measure. See Table V-4 on
page 79.
High scores on body esteem were more likely at all
grade levels among girls who played three or more
sports per year. Moderately involved (one or two
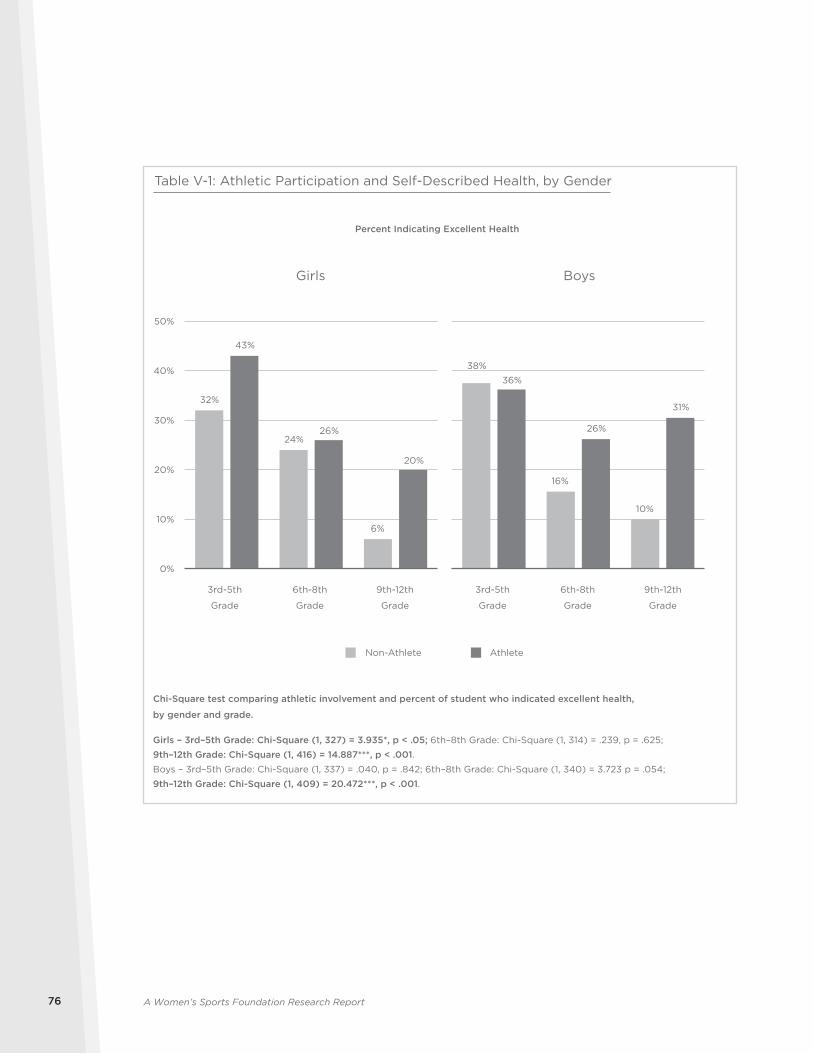
A Women’s Sports Foundation Research Report76
Girls
32%
24%
6%
43%
26%
20%
0%
10%
20%
30%
40%
50%
Percent Indicating Excellent Health
Boys
38%
16%
10%
36%
26%
31%
Table V-1: Athletic Participation and Self-Described Health, by Gender
Chi-Square test comparing athletic involvement and percent of student who indicated excellent health,
by gender and grade.
Girls – 3rd–5th Grade: Chi-Square (1, 327) = 3.935*, p < .05; 6th–8th Grade: Chi-Square (1, 314) = .239, p = .625;
9th–12th Grade: Chi-Square (1, 416) = 14.887***, p < .001.Boys – 3rd–5th Grade: Chi-Square (1, 337) = .040, p = .842; 6th–8th Grade: Chi-Square (1, 340) = 3.723 p = .054;
9th–12th Grade: Chi-Square (1, 409) = 20.472***, p < .001.
AthleteNon-Athlete
3rd-5th
Grade
6th-8th
Grade
9th-12th
Grade
3rd-5th
Grade
6th-8th
Grade
9th-12th
Grade
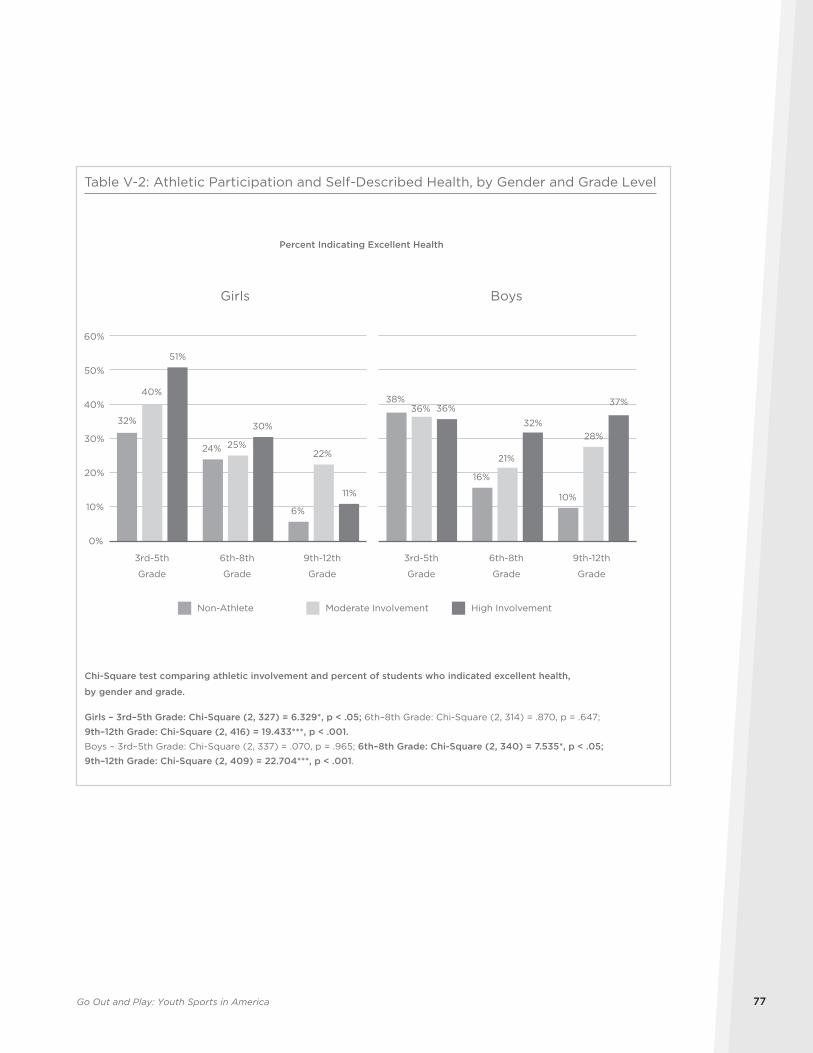
Go Out and Play: Youth Sports in America 77
Non-Athlete Moderate Involvement High Involvement
Girls
32%
24%
6%
40%
25%22%
51%
30%
11%
0%
10%
20%
30%
40%
50%
60%
Boys
38%
16%
10%
36%
21%
28%
36%
32%
37%
Percent Indicating Excellent Health
Table V-2: Athletic Participation and Self-Described Health, by Gender and Grade Level
Chi-Square test comparing athletic involvement and percent of students who indicated excellent health,
by gender and grade.
Girls – 3rd–5th Grade: Chi-Square (2, 327) = 6.329*, p < .05; 6th–8th Grade: Chi-Square (2, 314) = .870, p = .647;
9th–12th Grade: Chi-Square (2, 416) = 19.433***, p < .001. Boys – 3rd–5th Grade: Chi-Square (2, 337) = .070, p = .965; 6th–8th Grade: Chi-Square (2, 340) = 7.535*, p < .05; 9th–12th Grade: Chi-Square (2, 409) = 22.704***, p < .001.
3rd-5th
Grade
6th-8th
Grade
9th-12th
Grade
3rd-5th
Grade
6th-8th
Grade
9th-12th
Grade
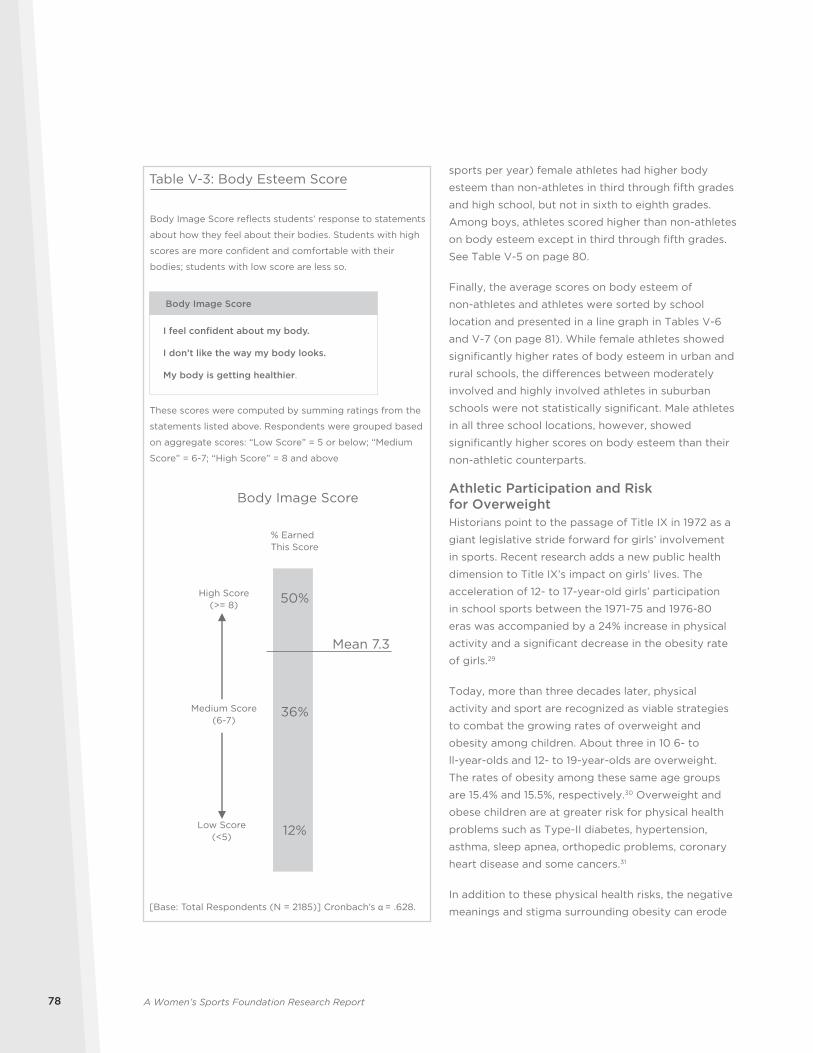
A Women’s Sports Foundation Research Report78
sports per year) female athletes had higher body
esteem than non-athletes in third through fifth grades
and high school, but not in sixth to eighth grades.
Among boys, athletes scored higher than non-athletes
on body esteem except in third through fifth grades.
See Table V-5 on page 80.
Finally, the average scores on body esteem of
non-athletes and athletes were sorted by school
location and presented in a line graph in Tables V-6
and V-7 (on page 81). While female athletes showed
significantly higher rates of body esteem in urban and
rural schools, the differences between moderately
involved and highly involved athletes in suburban
schools were not statistically significant. Male athletes
in all three school locations, however, showed
significantly higher scores on body esteem than their
non-athletic counterparts.
Athletic Participation and Risk for OverweightHistorians point to the passage of Title IX in 1972 as a
giant legislative stride forward for girls’ involvement
in sports. Recent research adds a new public health
dimension to Title IX’s impact on girls’ lives. The
acceleration of 12- to 17-year-old girls’ participation
in school sports between the 1971-75 and 1976-80
eras was accompanied by a 24% increase in physical
activity and a significant decrease in the obesity rate
of girls.29
Today, more than three decades later, physical
activity and sport are recognized as viable strategies
to combat the growing rates of overweight and
obesity among children. About three in 10 6- to
ll-year-olds and 12- to 19-year-olds are overweight.
The rates of obesity among these same age groups
are 15.4% and 15.5%, respectively.30 Overweight and
obese children are at greater risk for physical health
problems such as Type-II diabetes, hypertension,
asthma, sleep apnea, orthopedic problems, coronary
heart disease and some cancers.31
In addition to these physical health risks, the negative
meanings and stigma surrounding obesity can erode
Table V-3: Body Esteem Score
Body Image Score reflects students’ response to statements
about how they feel about their bodies. Students with high
scores are more confident and comfortable with their
bodies; students with low score are less so.
50%
36%
12%
Mean 7.3
% Earned This Score
Body Image Score
Medium Score(6-7)
Low Score(<5)
High Score(>= 8)
[Base: Total Respondents (N = 2185)] Cronbach’s α = .628.
These scores were computed by summing ratings from the
statements listed above. Respondents were grouped based
on aggregate scores: “Low Score” = 5 or below; “Medium
Score” = 6-7; “High Score” = 8 and above
Body Image Score
I feel confident about my body.
I don’t like the way my body looks.
My body is getting healthier.
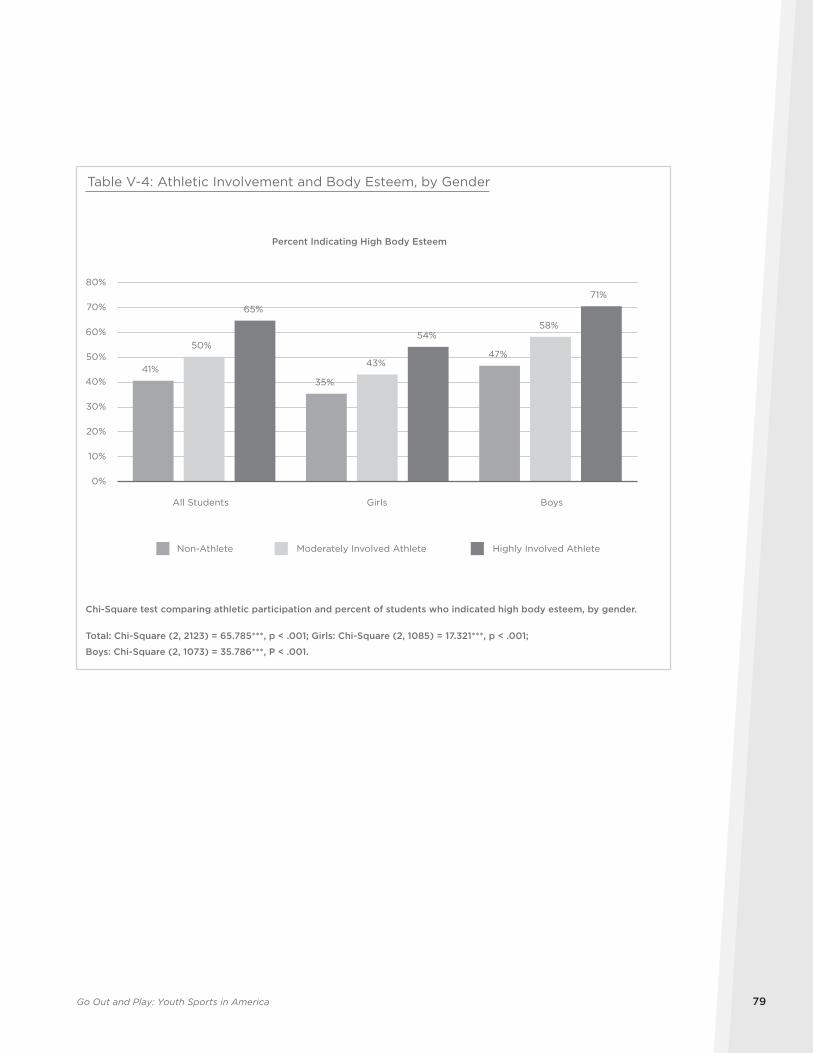
Go Out and Play: Youth Sports in America 79
41%35%
47%50%
43%
58%
65%
54%
71%
0%
10%
20%
30%
40%
50%
60%
70%
80%
All Students Girls Boys
Percent Indicating High Body Esteem
Table V-4: Athletic Involvement and Body Esteem, by Gender
Moderately Involved Athlete Highly Involved AthleteNon-Athlete
Chi-Square test comparing athletic participation and percent of students who indicated high body esteem, by gender.
Total: Chi-Square (2, 2123) = 65.785***, p < .001; Girls: Chi-Square (2, 1085) = 17.321***, p < .001;
Boys: Chi-Square (2, 1073) = 35.786***, P < .001.
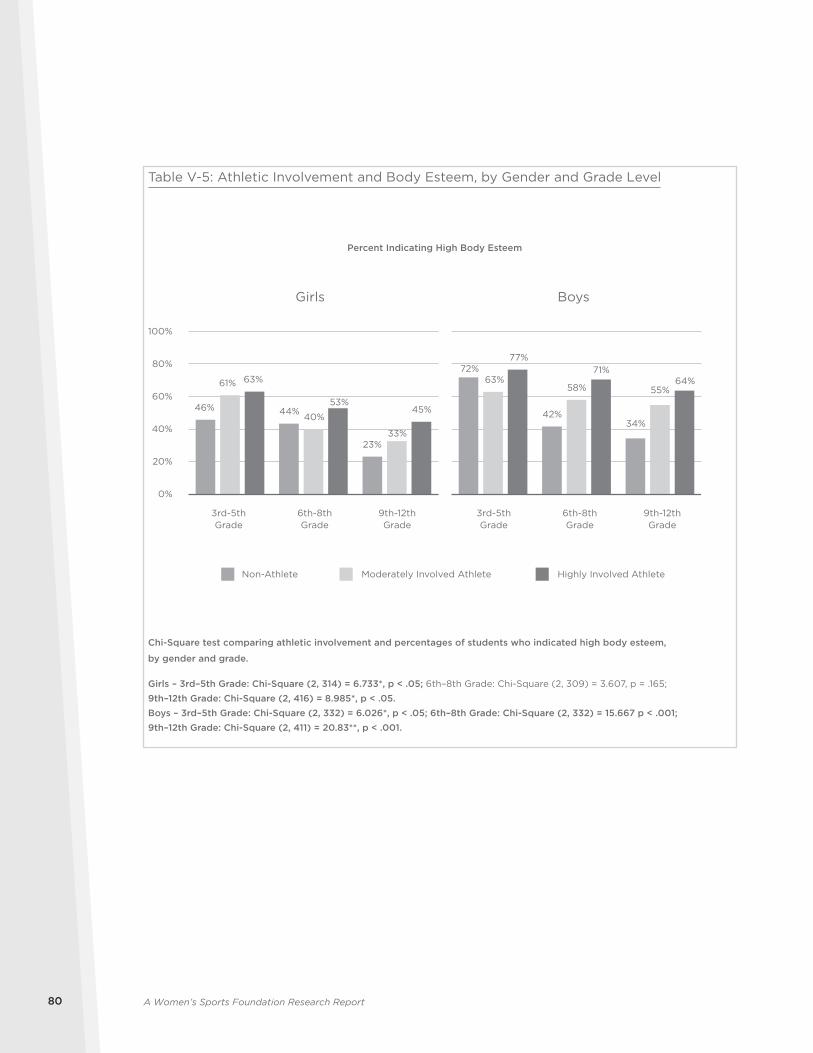
A Women’s Sports Foundation Research Report80
Moderately Involved Athlete Highly Involved AthleteNon-Athlete
Girls
46% 44%
23%
61%
40%
33%
63%
53%45%
0%
20%
40%
60%
80%
100%
Percent Indicating High Body Esteem
Boys
72%
42%34%
63%58% 55%
77%71%
64%
Table V-5: Athletic Involvement and Body Esteem, by Gender and Grade Level
Chi-Square test comparing athletic involvement and percentages of students who indicated high body esteem,
by gender and grade.
Girls – 3rd–5th Grade: Chi-Square (2, 314) = 6.733*, p < .05; 6th–8th Grade: Chi-Square (2, 309) = 3.607, p = .165;
9th–12th Grade: Chi-Square (2, 416) = 8.985*, p < .05.Boys – 3rd–5th Grade: Chi-Square (2, 332) = 6.026*, p < .05; 6th–8th Grade: Chi-Square (2, 332) = 15.667 p < .001; 9th–12th Grade: Chi-Square (2, 411) = 20.83**, p < .001.
3rd-5thGrade
6th-8thGrade
9th-12thGrade
3rd-5thGrade
6th-8thGrade
9th-12thGrade
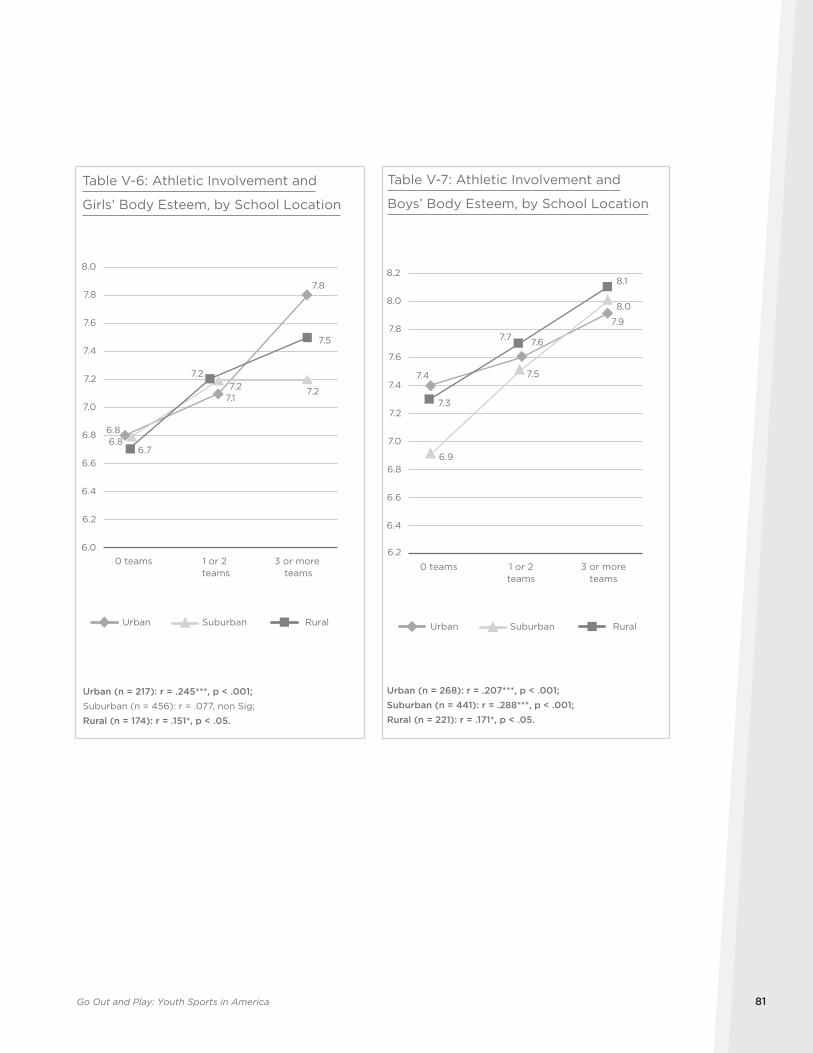
Go Out and Play: Youth Sports in America 81
6.8
7.1
7.8
6.7
7.2
7.5
6.8
7.2 7.2
6.0
6.2
6.4
6.6
6.8
7.0
7.2
7.4
7.6
7.8
8.0
0 teams 1 or 2 teams
3 or more teams
Urban RuralSuburban
Urban (n = 217): r = .245***, p < .001; Suburban (n = 456): r = .077, non Sig;
Rural (n = 174): r = .151*, p < .05.
Table V-6: Athletic Involvement and
Girls’ Body Esteem, by School Location
6.2
6.4
6.6
6.8
7.0
7.2
7.4
7.6
7.8
8.0
8.2
0 teams 1 or 2teams
3 or moreteams
Urban RuralSuburban
Table V-7: Athletic Involvement and
Boys’ Body Esteem, by School Location
Urban (n = 268): r = .207***, p < .001; Suburban (n = 441): r = .288***, p < .001;Rural (n = 221): r = .171*, p < .05.
7.4
7.6
7.9
7.3
7.7
8.1
6.9
7.5
8.0
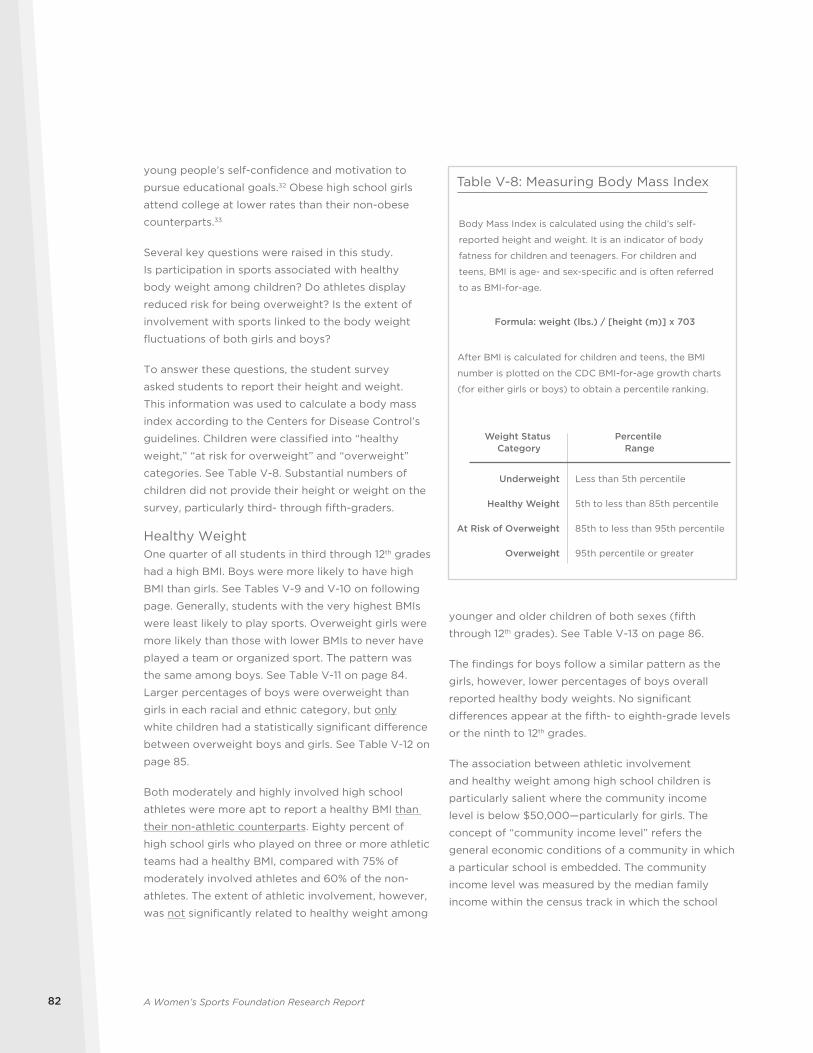
A Women’s Sports Foundation Research Report82
young people’s self-confidence and motivation to
pursue educational goals.32 Obese high school girls
attend college at lower rates than their non-obese
counterparts.33
Several key questions were raised in this study.
Is participation in sports associated with healthy
body weight among children? Do athletes display
reduced risk for being overweight? Is the extent of
involvement with sports linked to the body weight
fluctuations of both girls and boys?
To answer these questions, the student survey
asked students to report their height and weight.
This information was used to calculate a body mass
index according to the Centers for Disease Control’s
guidelines. Children were classified into “healthy
weight,” “at risk for overweight” and “overweight”
categories. See Table V-8. Substantial numbers of
children did not provide their height or weight on the
survey, particularly third- through fifth-graders.
Healthy WeightOne quarter of all students in third through 12th grades
had a high BMI. Boys were more likely to have high
BMI than girls. See Tables V-9 and V-10 on following
page. Generally, students with the very highest BMIs
were least likely to play sports. Overweight girls were
more likely than those with lower BMIs to never have
played a team or organized sport. The pattern was
the same among boys. See Table V-11 on page 84.
Larger percentages of boys were overweight than
girls in each racial and ethnic category, but only
white children had a statistically significant difference
between overweight boys and girls. See Table V-12 on
page 85.
Both moderately and highly involved high school
athletes were more apt to report a healthy BMI than
their non-athletic counterparts. Eighty percent of
high school girls who played on three or more athletic
teams had a healthy BMI, compared with 75% of
moderately involved athletes and 60% of the non-
athletes. The extent of athletic involvement, however,
was not significantly related to healthy weight among
younger and older children of both sexes (fifth
through 12th grades). See Table V-13 on page 86.
The findings for boys follow a similar pattern as the
girls, however, lower percentages of boys overall
reported healthy body weights. No significant
differences appear at the fifth- to eighth-grade levels
or the ninth to 12th grades.
The association between athletic involvement
and healthy weight among high school children is
particularly salient where the community income
level is below $50,000—particularly for girls. The
concept of “community income level” refers the
general economic conditions of a community in which
a particular school is embedded. The community
income level was measured by the median family
income within the census track in which the school
Weight Status Category
Percentile Range
Underweight
Healthy Weight
At Risk of Overweight
Overweight
Table V-8: Measuring Body Mass Index
Body Mass Index is calculated using the child’s self-
reported height and weight. It is an indicator of body
fatness for children and teenagers. For children and
teens, BMI is age- and sex-specific and is often referred
to as BMI-for-age.
Formula: weight (lbs.) / [height (m)] x 703
After BMI is calculated for children and teens, the BMI
number is plotted on the CDC BMI-for-age growth charts
(for either girls or boys) to obtain a percentile ranking.
Less than 5th percentile
5th to less than 85th percentile
85th to less than 95th percentile
95th percentile or greater

Go Out and Play: Youth Sports in America 83
3% 58% 16% 13%
High BMI: 28%
[Base: All Respondents – Total (N = 2185); Girls – 3rd-5th Grade (N = 282);
6th-8th Grade (N = 328); 9th-12th Grade (N = 515); Boys – 3rd-5th Grade (N = 282);
6th-8th Grade (N = 316); 9th-12th Grade (N = 447)]
Did not provide height or weight: 11%
UnderWeight
HealthyWeight
At Risk Overweight Overweight
Table V-9: Distribution of Children’s Body Mass Index
High BMI: 25%
High BMI: 32%
UnderWeight
HealthyWeight
At Risk Overweight Overweight
3% 61% 14% 11%
4% 55% 18% 15%
Girls
Boys
Table V-10: Distribution of Body Mass Index, by Gender
Did not provide height or weight: 11%
[Base: All Respondents – Total (N = 2185); Girls – 3rd-5th Grade (N = 282);
6th-8th Grade (N = 328); 9th-12th Grade (N = 515); Boys – 3rd-5th Grade (N = 282);
6th-8th Grade (N = 316); 9th-12th Grade (N = 447)]
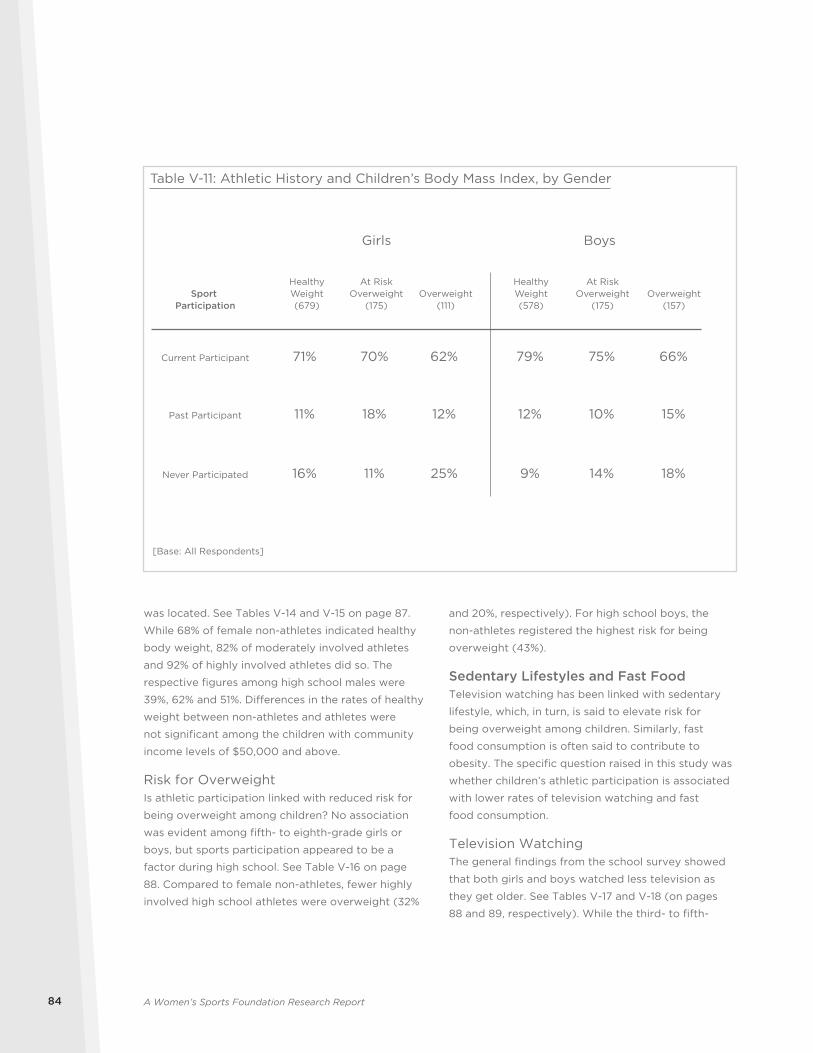
A Women’s Sports Foundation Research Report84
was located. See Tables V-14 and V-15 on page 87.
While 68% of female non-athletes indicated healthy
body weight, 82% of moderately involved athletes
and 92% of highly involved athletes did so. The
respective figures among high school males were
39%, 62% and 51%. Differences in the rates of healthy
weight between non-athletes and athletes were
not significant among the children with community
income levels of $50,000 and above.
Risk for OverweightIs athletic participation linked with reduced risk for
being overweight among children? No association
was evident among fifth- to eighth-grade girls or
boys, but sports participation appeared to be a
factor during high school. See Table V-16 on page
88. Compared to female non-athletes, fewer highly
involved high school athletes were overweight (32%
and 20%, respectively). For high school boys, the
non-athletes registered the highest risk for being
overweight (43%).
Sedentary Lifestyles and Fast FoodTelevision watching has been linked with sedentary
lifestyle, which, in turn, is said to elevate risk for
being overweight among children. Similarly, fast
food consumption is often said to contribute to
obesity. The specific question raised in this study was
whether children’s athletic participation is associated
with lower rates of television watching and fast
food consumption.
Television WatchingThe general findings from the school survey showed
that both girls and boys watched less television as
they get older. See Tables V-17 and V-18 (on pages
88 and 89, respectively). While the third- to fifth-
Sport Participation
Girls Boys
Current Participant 71% 70% 62% 79% 75% 66%
Past Participant 11% 18% 12% 12% 10% 15%
Never Participated 16% 11% 25% 9% 14% 18%
Table V-11: Athletic History and Children’s Body Mass Index, by Gender
[Base: All Respondents]
HealthyWeight(679)
At RiskOverweight
(175)Overweight
(111)
HealthyWeight(578)
At RiskOverweight
(175)Overweight
(157)
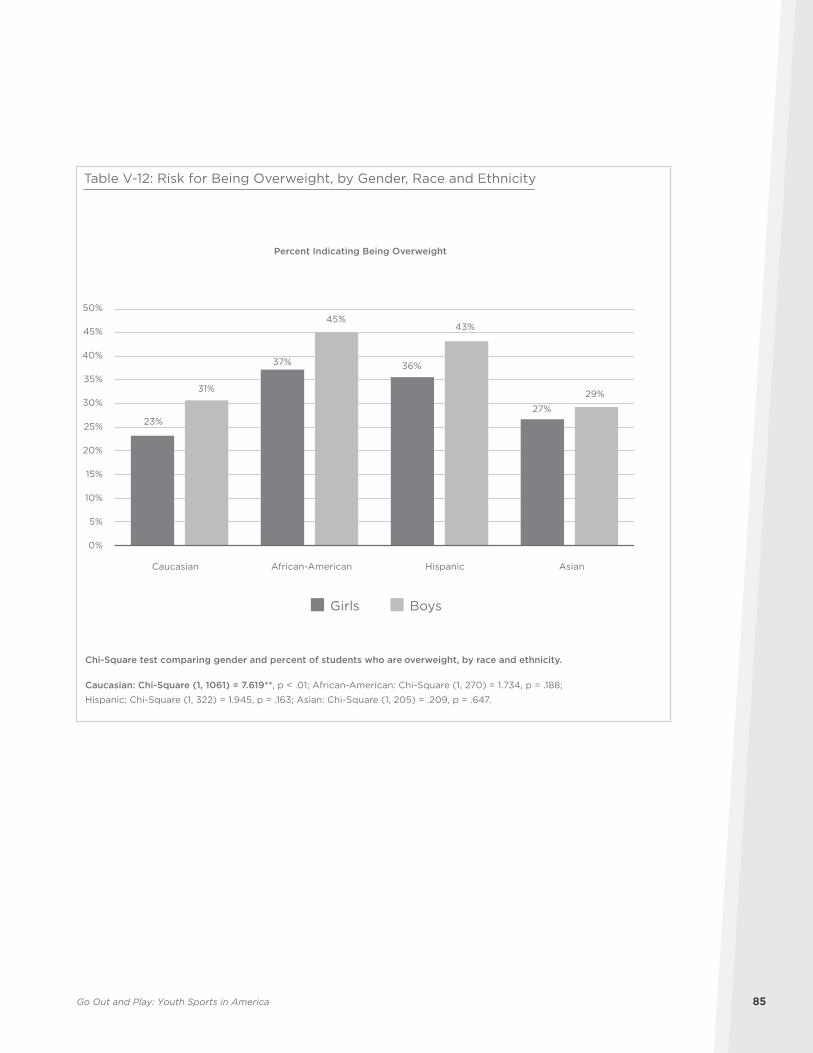
Go Out and Play: Youth Sports in America 85
Girls Boys
23%
37% 36%
27%
31%
45%43%
29%
0%
5%
10%
15%
20%
25%
30%
35%
40%
45%
50%
Caucasian African-American Hispanic Asian
Percent Indicating Being Overweight
Table V-12: Risk for Being Overweight, by Gender, Race and Ethnicity
Chi-Square test comparing gender and percent of students who are overweight, by race and ethnicity.
Caucasian: Chi-Square (1, 1061) = 7.619**, p < .01; African-American: Chi-Square (1, 270) = 1.734, p = .188;
Hispanic: Chi-Square (1, 322) = 1.945, p = .163; Asian: Chi-Square (1, 205) = .209, p = .647.
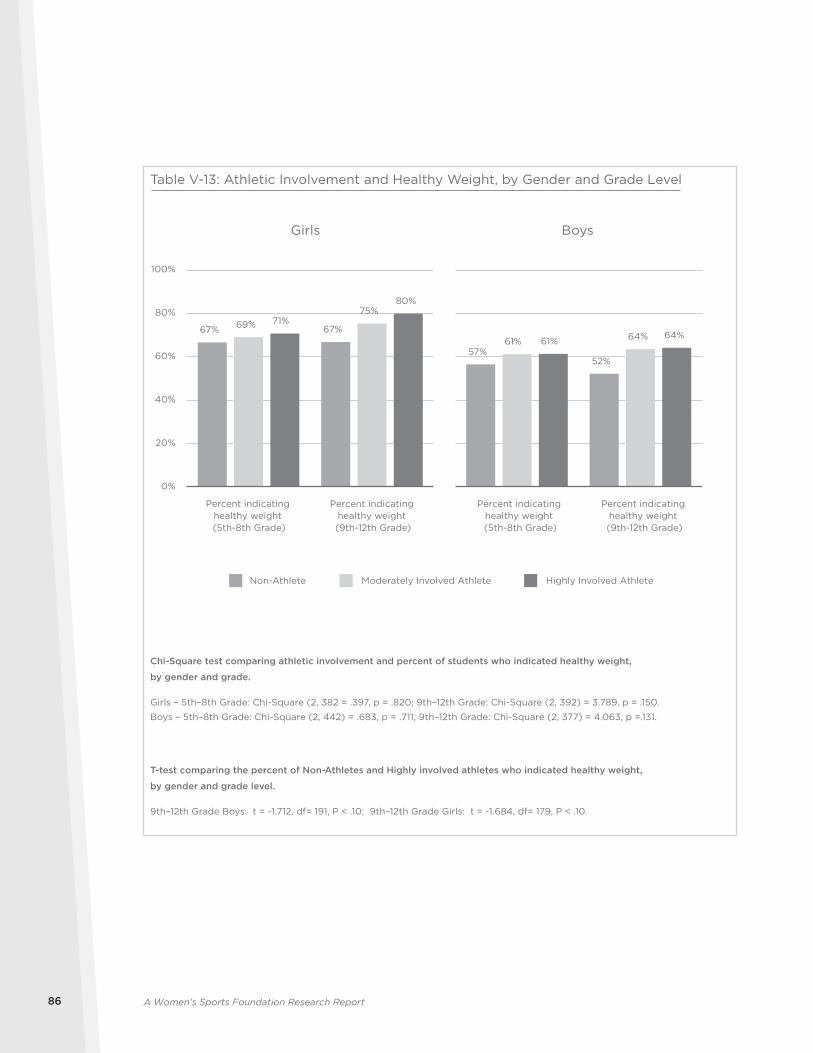
A Women’s Sports Foundation Research Report86
Moderately Involved Athlete Highly Involved AthleteNon-Athlete
67% 67%69%75%
71%
80%
0%
20%
40%
60%
80%
100%
57%52%
61% 64%61%64%
Table V-13: Athletic Involvement and Healthy Weight, by Gender and Grade Level
Girls Boys
Chi-Square test comparing athletic involvement and percent of students who indicated healthy weight,
by gender and grade.
Girls – 5th–8th Grade: Chi-Square (2, 382 = .397, p = .820; 9th–12th Grade: Chi-Square (2, 392) = 3.789, p = .150.
Boys – 5th–8th Grade: Chi-Square (2, 442) = .683, p = .711; 9th–12th Grade: Chi-Square (2, 377) = 4.063, p =.131.
T-test comparing the percent of Non-Athletes and Highly involved athletes who indicated healthy weight,
by gender and grade level.
9th–12th Grade Boys: t = -1.712, df= 191, P < .10; 9th–12th Grade Girls: t = -1.684, df= 179, P < .10.
Percent indicating healthy weight (5th-8th Grade)
Percent indicating healthy weight (9th-12th Grade)
Percent indicating healthy weight (5th-8th Grade)
Percent indicating healthy weight (9th-12th Grade)
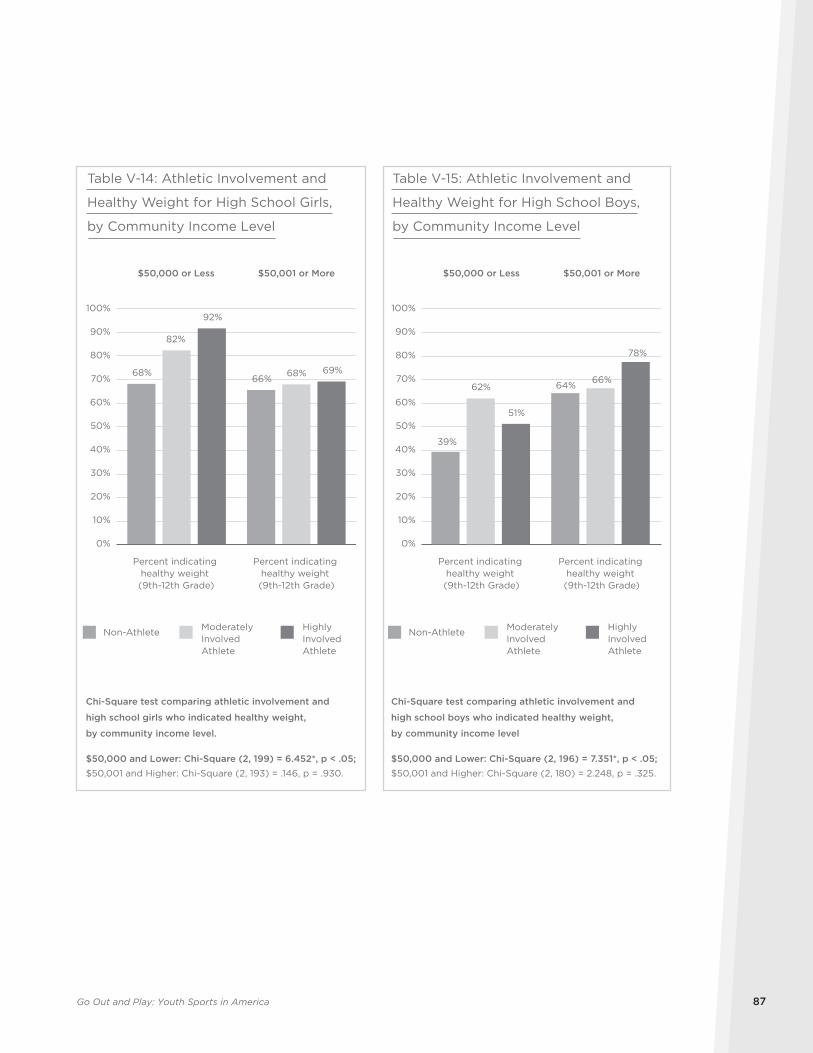
Go Out and Play: Youth Sports in America 87
Moderately Involved Athlete
Highly Involved Athlete
Non-Athlete
68%66%
82%
68%
92%
69%
0%
10%
20%
30%
40%
50%
60%
70%
80%
90%
100%
$50,000 or Less $50,001 or More
Table V-14: Athletic Involvement and
Healthy Weight for High School Girls,
by Community Income Level
Chi-Square test comparing athletic involvement and
high school girls who indicated healthy weight,
by community income level.
$50,000 and Lower: Chi-Square (2, 199) = 6.452*, p < .05;$50,001 and Higher: Chi-Square (2, 193) = .146, p = .930.
Percent indicating healthy weight (9th-12th Grade)
Percent indicating healthy weight (9th-12th Grade)
Moderately Involved Athlete
Highly Involved Athlete
Non-Athlete
39%
64%62%66%
51%
78%
0%
10%
20%
30%
40%
50%
60%
70%
80%
90%
100%
$50,000 or Less $50,001 or More
Table V-15: Athletic Involvement and
Healthy Weight for High School Boys,
by Community Income Level
Chi-Square test comparing athletic involvement and
high school boys who indicated healthy weight,
by community income level
$50,000 and Lower: Chi-Square (2, 196) = 7.351*, p < .05;$50,001 and Higher: Chi-Square (2, 180) = 2.248, p = .325.
Percent indicating healthy weight (9th-12th Grade)
Percent indicating healthy weight (9th-12th Grade)
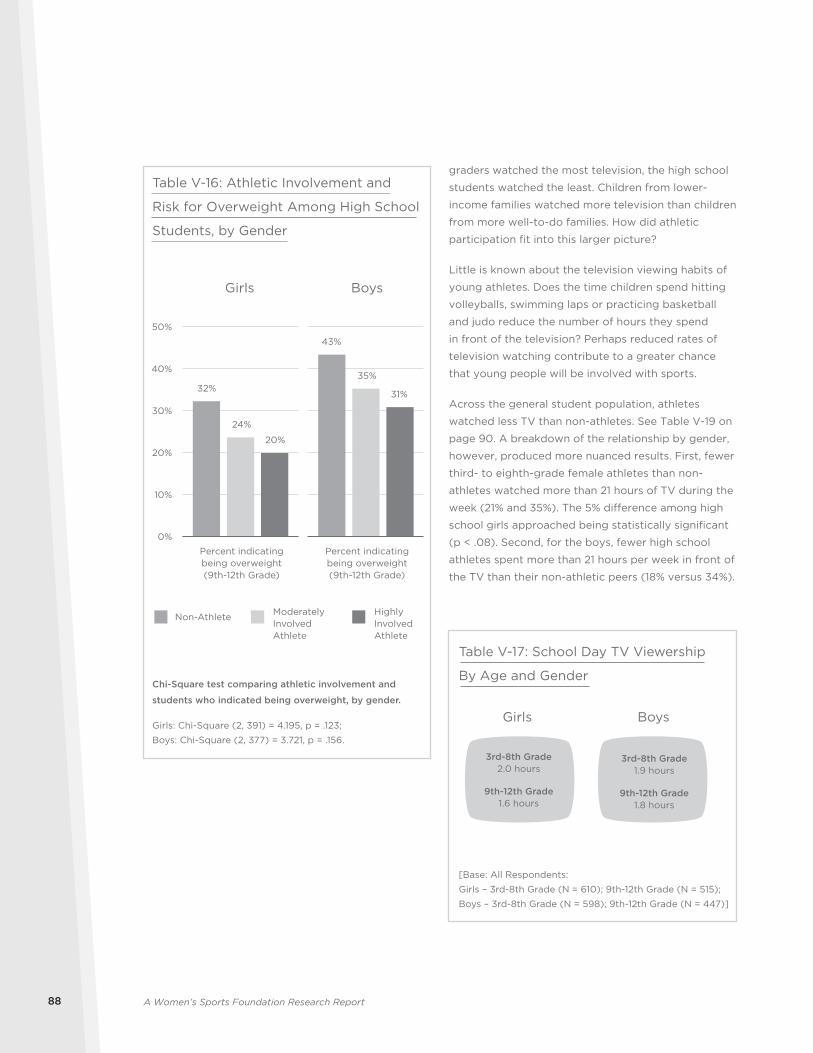
A Women’s Sports Foundation Research Report88
graders watched the most television, the high school
students watched the least. Children from lower-
income families watched more television than children
from more well-to-do families. How did athletic
participation fit into this larger picture?
Little is known about the television viewing habits of
young athletes. Does the time children spend hitting
volleyballs, swimming laps or practicing basketball
and judo reduce the number of hours they spend
in front of the television? Perhaps reduced rates of
television watching contribute to a greater chance
that young people will be involved with sports.
Across the general student population, athletes
watched less TV than non-athletes. See Table V-19 on
page 90. A breakdown of the relationship by gender,
however, produced more nuanced results. First, fewer
third- to eighth-grade female athletes than non-
athletes watched more than 21 hours of TV during the
week (21% and 35%). The 5% difference among high
school girls approached being statistically significant
(p < .08). Second, for the boys, fewer high school
athletes spent more than 21 hours per week in front of
the TV than their non-athletic peers (18% versus 34%).
32%
24%
20%
0%
10%
20%
30%
40%
50%
43%
35%
31%
Table V-16: Athletic Involvement and
Risk for Overweight Among High School
Students, by Gender
Girls Boys
Percent indicatingbeing overweight(9th-12th Grade)
Percent indicatingbeing overweight(9th-12th Grade)
Chi-Square test comparing athletic involvement and
students who indicated being overweight, by gender.
Girls: Chi-Square (2, 391) = 4.195, p = .123;
Boys: Chi-Square (2, 377) = 3.721, p = .156.
Moderately Involved Athlete
Highly Involved Athlete
Non-Athlete
Girls Boys
Table V-17: School Day TV Viewership
By Age and Gender
[Base: All Respondents:
Girls – 3rd-8th Grade (N = 610); 9th-12th Grade (N = 515);
Boys – 3rd-8th Grade (N = 598); 9th-12th Grade (N = 447)]
3rd-8th Grade2.0 hours
9th-12th Grade1.6 hours
3rd-8th Grade1.9 hours
9th-12th Grade1.8 hours
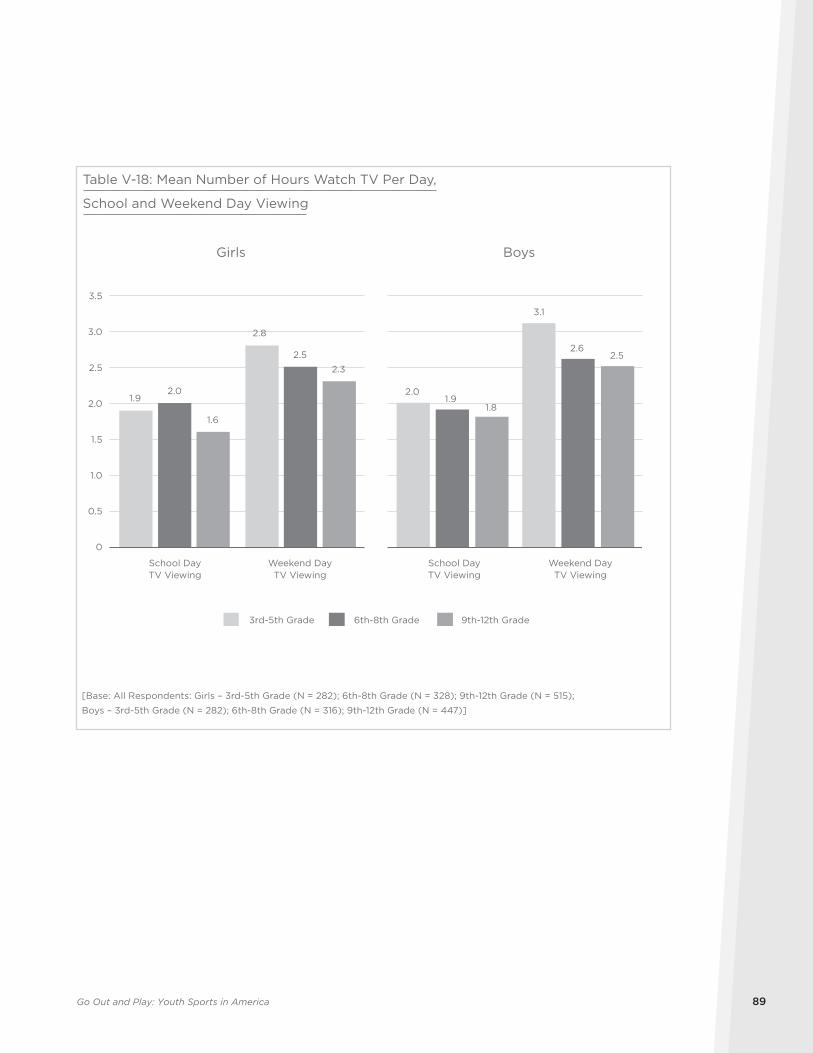
Go Out and Play: Youth Sports in America 89
0
0.5
1.0
1.5
2.0
2.5
3.0
3.5
6th-8th Grade 9th-12th Grade3rd-5th Grade
1.9
2.8
2.0
2.5
1.6
2.3
School DayTV Viewing
Weekend DayTV Viewing
2.0
3.1
1.9
2.6
1.8
2.5
School DayTV Viewing
Weekend DayTV Viewing
Girls Boys
Table V-18: Mean Number of Hours Watch TV Per Day,
School and Weekend Day Viewing
[Base: All Respondents: Girls – 3rd-5th Grade (N = 282); 6th-8th Grade (N = 328); 9th-12th Grade (N = 515);
Boys – 3rd-5th Grade (N = 282); 6th-8th Grade (N = 316); 9th-12th Grade (N = 447)]
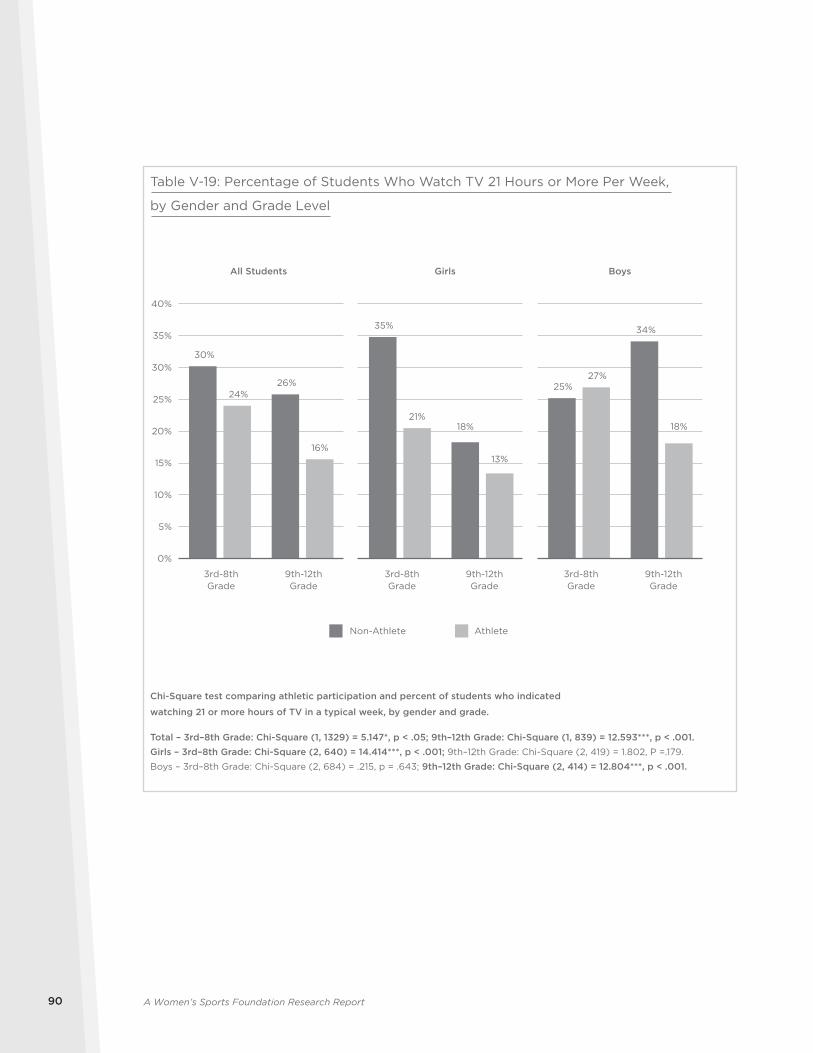
A Women’s Sports Foundation Research Report90
30%
26%
35%
18%
25%
34%
24%
16%
21%
13%
27%
18%
0%
5%
10%
15%
20%
25%
30%
35%
40%
All Students Girls Boys
Table V-19: Percentage of Students Who Watch TV 21 Hours or More Per Week,
by Gender and Grade Level
Chi-Square test comparing athletic participation and percent of students who indicated
watching 21 or more hours of TV in a typical week, by gender and grade.
Total – 3rd–8th Grade: Chi-Square (1, 1329) = 5.147*, p < .05; 9th–12th Grade: Chi-Square (1, 839) = 12.593***, p < .001.Girls – 3rd–8th Grade: Chi-Square (2, 640) = 14.414***, p < .001; 9th–12th Grade: Chi-Square (2, 419) = 1.802, P =.179.
Boys – 3rd–8th Grade: Chi-Square (2, 684) = .215, p = .643; 9th–12th Grade: Chi-Square (2, 414) = 12.804***, p < .001.
AthleteNon-Athlete
3rd-8thGrade
9th-12thGrade
3rd-8thGrade
9th-12thGrade
3rd-8thGrade
9th-12thGrade

Go Out and Play: Youth Sports in America 91
In summary, across the entire survey, only minimal
evidence accrues showing that athletes watch more
or less TV than non-athletes. And the findings that did
emerge do not invite easy explanation.
Fast Food ConsumptionStudents were queried about how often they “eat at
a fast food restaurant—like McDonald’s, Burger King
or Subway?” No differences were found between the
frequency that athletes and non-athletes eat at fast
food restaurants.
Social RelationshipsHaving friends and being socially involved can
enhance the social and psychological well-
being of children. A basic premise of this study
is that sports help to integrate children’s lives
within the school community. Would athletes be
more involved with extracurricular activities in
their school and community? Do athletes report
higher levels of popularity in school than their
non-athletic counterparts?
Participation in Clubs and GroupsA recent study of Canadians found that young people
who participate in organized sports are more likely
to be involved in community activities as adults.34
The argument is that sports help young people build
confidence, relationships and social skills that then get
expressed through school and community activities.
Other studies link high school sports involvement and
extracurricular activities.35
The student survey shows that girls, particularly those
in high school, were more likely to participate in clubs
than boys. See Table V-20 on following page. Athletes
were also more involved with clubs and groups than
non-athletes, especially girls. See Table V-21 on page
93. More than three-quarters (77%) of highly involved
female athletes participated in an extracurricular club
or group.
Among the sixth- to eighth- and ninth- to 12th-grade
girls, athletes reported significantly higher rates of
participation in clubs and groups than non-athletes.
See Table V-22 on page 94. Among high school
boys, athletic participation was not related to higher
rates of extracurricular involvement only among the
moderately involved athletes in the sixth to eighth
grades. Indeed, boys’ overall involvement in clubs and
groups was much lower than that of girls. During the
middle school and through the high school years—
whether they were moderately or highly involved with
sports—female athletes were engaged with clubs and
groups. High school male athletes, however, were not
as able or willing to mix their sport interests with club
involvement. More speculatively, it may be that many
boys’ investments of energy and identity into being
an athlete is narrower and more total than it is among
girls. Put another way, it may be that female athletes
have a wider array of interests outside of sport than
male athletes.
Participation in clubs and groups also varied with
children’s history of involvement with sport. See Table
V-23 on page 95. Girls who reported currently playing
on a team or organized sport were more likely to be
involved with clubs or groups than other girls or boys.
Popularity at SchoolThe student survey shows that girls and boys
reported being popular at school at similar rates. A
majority of children said they are “very popular” or
“somewhat popular” at school. See Tables V-24 and
V-25 (on pages 96 and 97, respectively). This study
finds that popularity was associated with athletic
participation for both female and male athletes. See
Table V-26 on page 98.
Two patterns emerged with greater scrutiny of
the results. See Table V-27 on page 99. First, the
popularity gains associated with sport involvement
were particularly evident among third- to fifth- and
sixth- to eighth-graders. This suggests that the
social benefits of sport begin in elementary school.
Second, whereas only 11% of the highly involved
ninth- to 12th-grade girls considered themselves
“very popular,” 84% labeled themselves “somewhat
popular” (compared with 65% of similar boys). This
could mean that the popularity of high school female
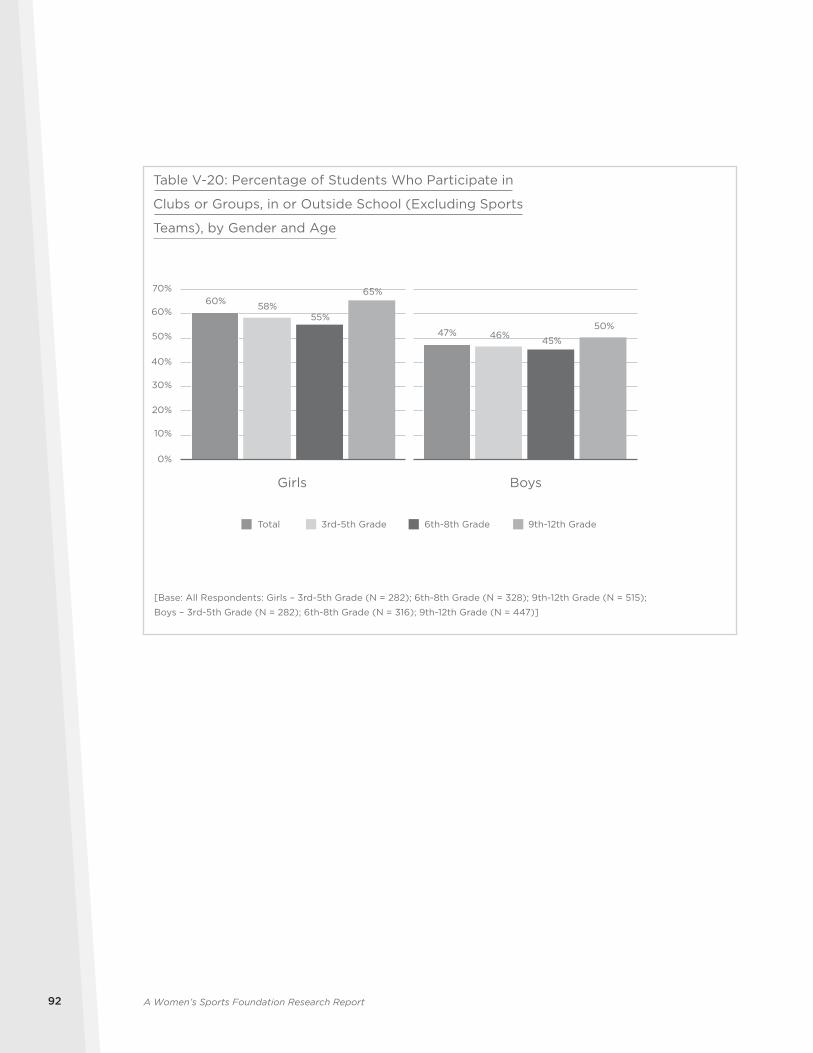
A Women’s Sports Foundation Research Report92
60%
47%
58%
46%
55%
45%
65%
50%
Girls Boys
[Base: All Respondents: Girls – 3rd-5th Grade (N = 282); 6th-8th Grade (N = 328); 9th-12th Grade (N = 515);
Boys – 3rd-5th Grade (N = 282); 6th-8th Grade (N = 316); 9th-12th Grade (N = 447)]
Table V-20: Percentage of Students Who Participate in
Clubs or Groups, in or Outside School (Excluding Sports
Teams), by Gender and Age
Total 6th-8th Grade 9th-12th Grade3rd-5th Grade
0%
50%
10%
20%
60%
30%
70%
40%
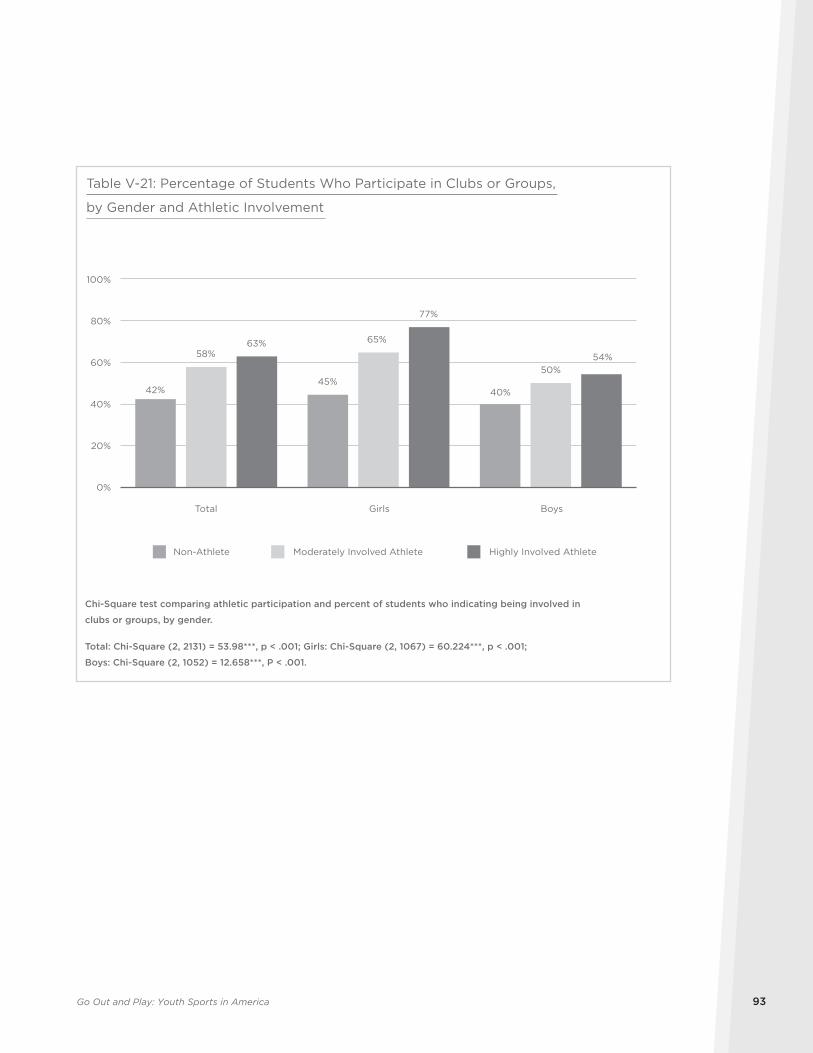
Go Out and Play: Youth Sports in America 93
Moderately Involved Athlete Highly Involved AthleteNon-Athlete
42%45%
40%
58%
65%
50%
63%
77%
54%
0%
20%
40%
60%
80%
100%
Total Girls Boys
Table V-21: Percentage of Students Who Participate in Clubs or Groups,
by Gender and Athletic Involvement
Chi-Square test comparing athletic participation and percent of students who indicating being involved in
clubs or groups, by gender.
Total: Chi-Square (2, 2131) = 53.98***, p < .001; Girls: Chi-Square (2, 1067) = 60.224***, p < .001;
Boys: Chi-Square (2, 1052) = 12.658***, P < .001.
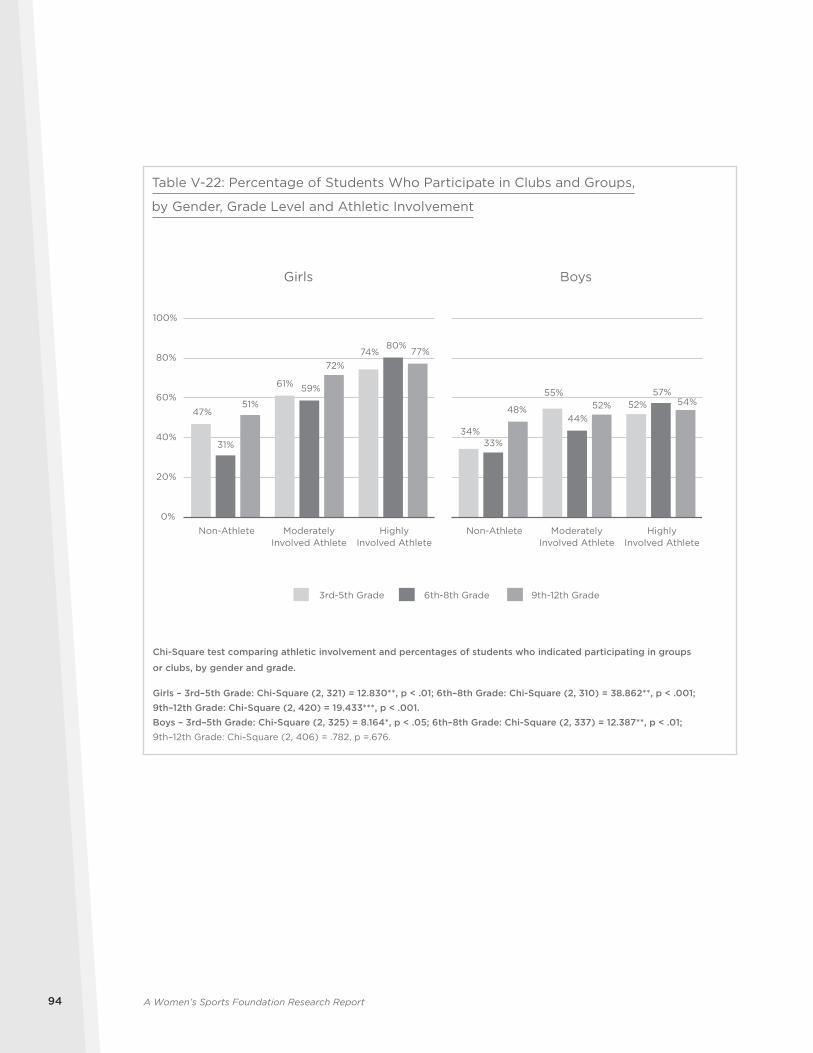
A Women’s Sports Foundation Research Report94
47%
61%
74%
31%
59%
80%
51%
72%77%
0%
20%
40%
60%
80%
100%
34%
55%52%
33%
44%
57%
48% 52% 54%
6th-8th Grade 9th-12th Grade3rd-5th Grade
Table V-22: Percentage of Students Who Participate in Clubs and Groups,
by Gender, Grade Level and Athletic Involvement
Girls Boys
Non-Athlete ModeratelyInvolved Athlete
HighlyInvolved Athlete
Non-Athlete ModeratelyInvolved Athlete
HighlyInvolved Athlete
Chi-Square test comparing athletic involvement and percentages of students who indicated participating in groups
or clubs, by gender and grade.
Girls – 3rd–5th Grade: Chi-Square (2, 321) = 12.830**, p < .01; 6th–8th Grade: Chi-Square (2, 310) = 38.862**, p < .001; 9th–12th Grade: Chi-Square (2, 420) = 19.433***, p < .001.Boys – 3rd–5th Grade: Chi-Square (2, 325) = 8.164*, p < .05; 6th–8th Grade: Chi-Square (2, 337) = 12.387**, p < .01; 9th–12th Grade: Chi-Square (2, 406) = .782, p =.676.
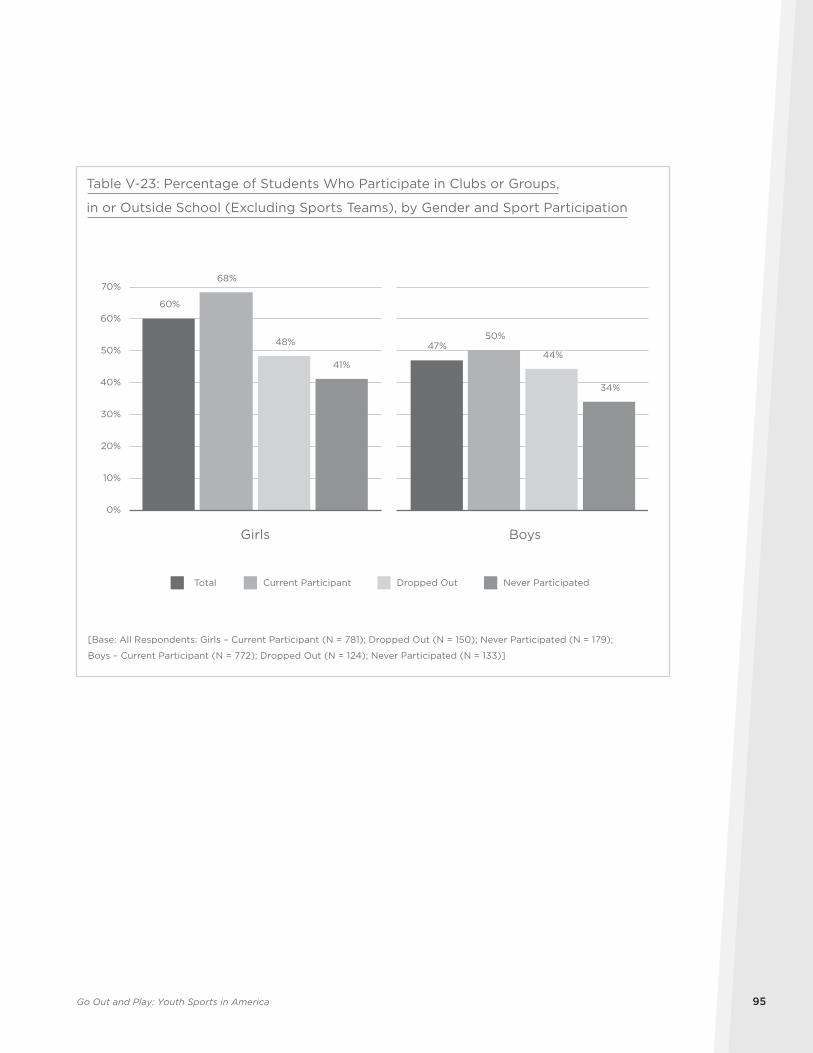
Go Out and Play: Youth Sports in America 95
60%
47%
68%
50%48%
44%41%
34%
Girls Boys
[Base: All Respondents: Girls – Current Participant (N = 781); Dropped Out (N = 150); Never Participated (N = 179);
Boys – Current Participant (N = 772); Dropped Out (N = 124); Never Participated (N = 133)]
Total Current Participant Dropped Out Never Participated
Table V-23: Percentage of Students Who Participate in Clubs or Groups,
in or Outside School (Excluding Sports Teams), by Gender and Sport Participation
0%
50%
10%
20%
60%
30%
70%
40%
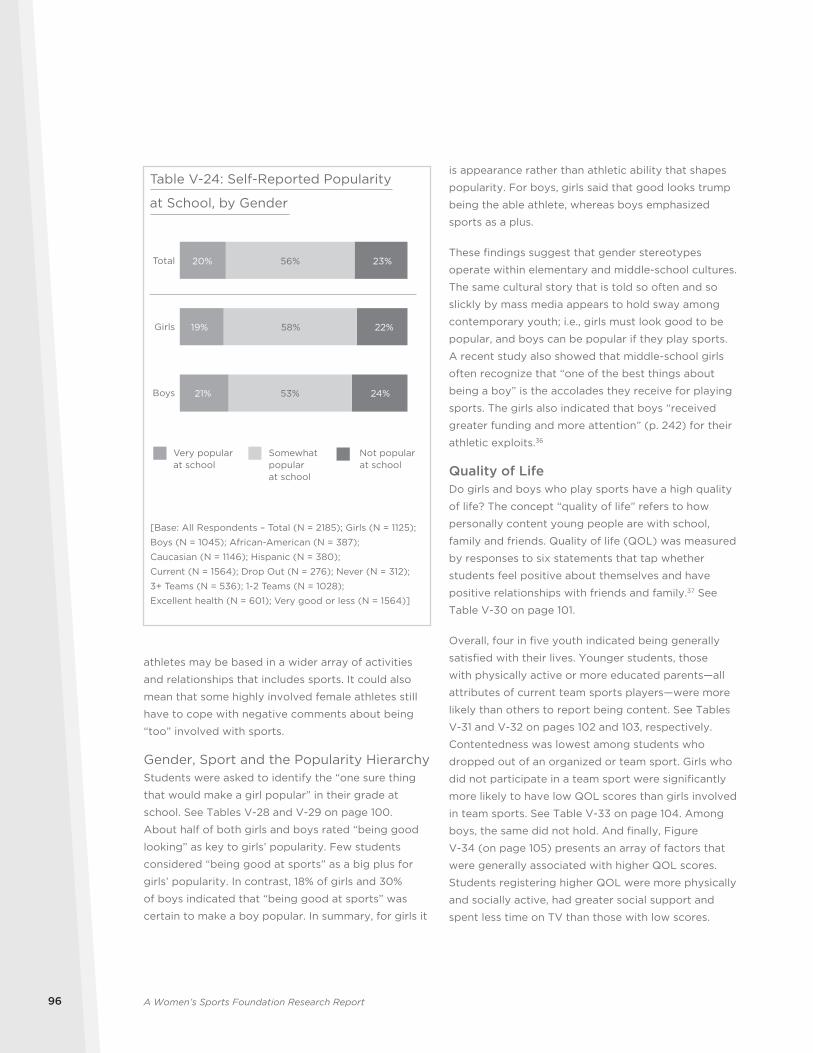
A Women’s Sports Foundation Research Report96
athletes may be based in a wider array of activities
and relationships that includes sports. It could also
mean that some highly involved female athletes still
have to cope with negative comments about being
“too” involved with sports.
Gender, Sport and the Popularity HierarchyStudents were asked to identify the “one sure thing
that would make a girl popular” in their grade at
school. See Tables V-28 and V-29 on page 100.
About half of both girls and boys rated “being good
looking” as key to girls’ popularity. Few students
considered “being good at sports” as a big plus for
girls’ popularity. In contrast, 18% of girls and 30%
of boys indicated that “being good at sports” was
certain to make a boy popular. In summary, for girls it
is appearance rather than athletic ability that shapes
popularity. For boys, girls said that good looks trump
being the able athlete, whereas boys emphasized
sports as a plus.
These findings suggest that gender stereotypes
operate within elementary and middle-school cultures.
The same cultural story that is told so often and so
slickly by mass media appears to hold sway among
contemporary youth; i.e., girls must look good to be
popular, and boys can be popular if they play sports.
A recent study also showed that middle-school girls
often recognize that “one of the best things about
being a boy” is the accolades they receive for playing
sports. The girls also indicated that boys “received
greater funding and more attention” (p. 242) for their
athletic exploits.36
Quality of LifeDo girls and boys who play sports have a high quality
of life? The concept “quality of life” refers to how
personally content young people are with school,
family and friends. Quality of life (QOL) was measured
by responses to six statements that tap whether
students feel positive about themselves and have
positive relationships with friends and family.37 See
Table V-30 on page 101.
Overall, four in five youth indicated being generally
satisfied with their lives. Younger students, those
with physically active or more educated parents—all
attributes of current team sports players—were more
likely than others to report being content. See Tables
V-31 and V-32 on pages 102 and 103, respectively.
Contentedness was lowest among students who
dropped out of an organized or team sport. Girls who
did not participate in a team sport were significantly
more likely to have low QOL scores than girls involved
in team sports. See Table V-33 on page 104. Among
boys, the same did not hold. And finally, Figure
V-34 (on page 105) presents an array of factors that
were generally associated with higher QOL scores.
Students registering higher QOL were more physically
and socially active, had greater social support and
spent less time on TV than those with low scores.
23%
22%
24%
56%
58%
53%
20%
19%
21%
Very popularat school
Somewhat popular at school
Not popular at school
Total
Girls
Boys
Table V-24: Self-Reported Popularity
at School, by Gender
[Base: All Respondents – Total (N = 2185); Girls (N = 1125);
Boys (N = 1045); African-American (N = 387);
Caucasian (N = 1146); Hispanic (N = 380);
Current (N = 1564); Drop Out (N = 276); Never (N = 312);
3+ Teams (N = 536); 1-2 Teams (N = 1028);
Excellent health (N = 601); Very good or less (N = 1564)]
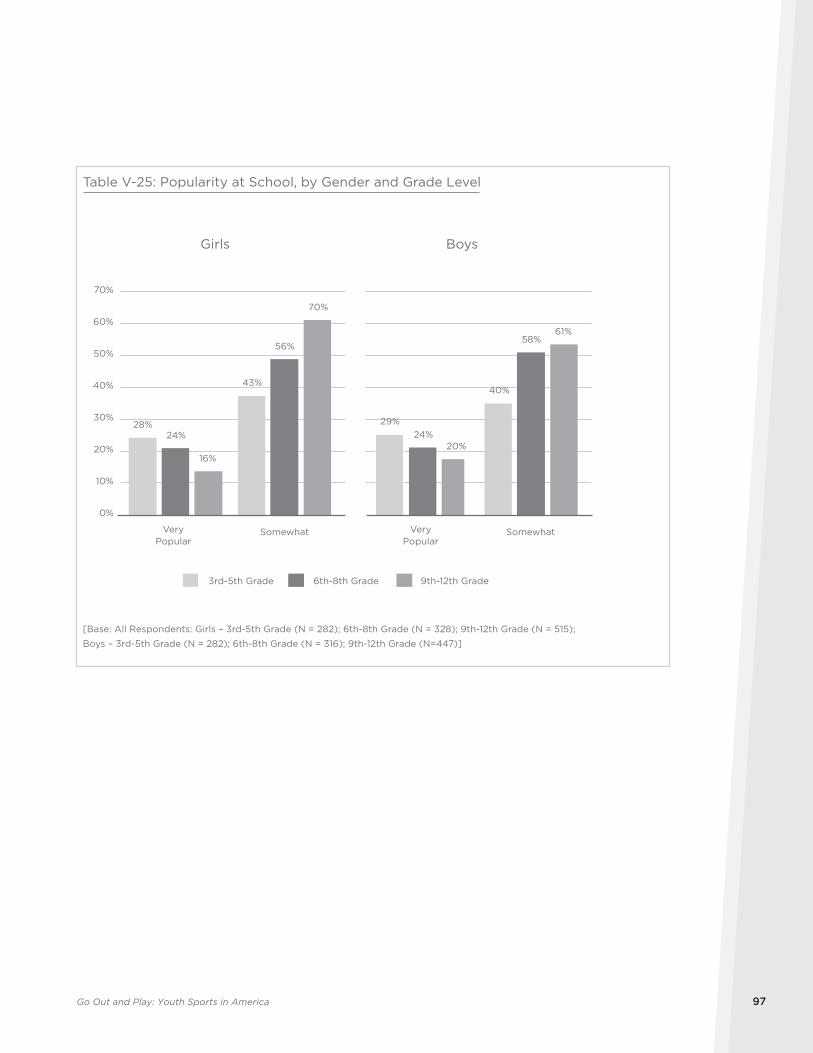
Go Out and Play: Youth Sports in America 97
6th-8th Grade 9th-12th Grade3rd-5th Grade
28%
43%
24%
56%
16%
70%
VeryPopular
Somewhat VeryPopular
Somewhat
29%
40%
24%
58%
20%
61%
Girls Boys
Table V-25: Popularity at School, by Gender and Grade Level
[Base: All Respondents: Girls – 3rd-5th Grade (N = 282); 6th-8th Grade (N = 328); 9th-12th Grade (N = 515);
Boys – 3rd-5th Grade (N = 282); 6th-8th Grade (N = 316); 9th-12th Grade (N=447)]
0%
50%
10%
20%
60%
30%
70%
40%
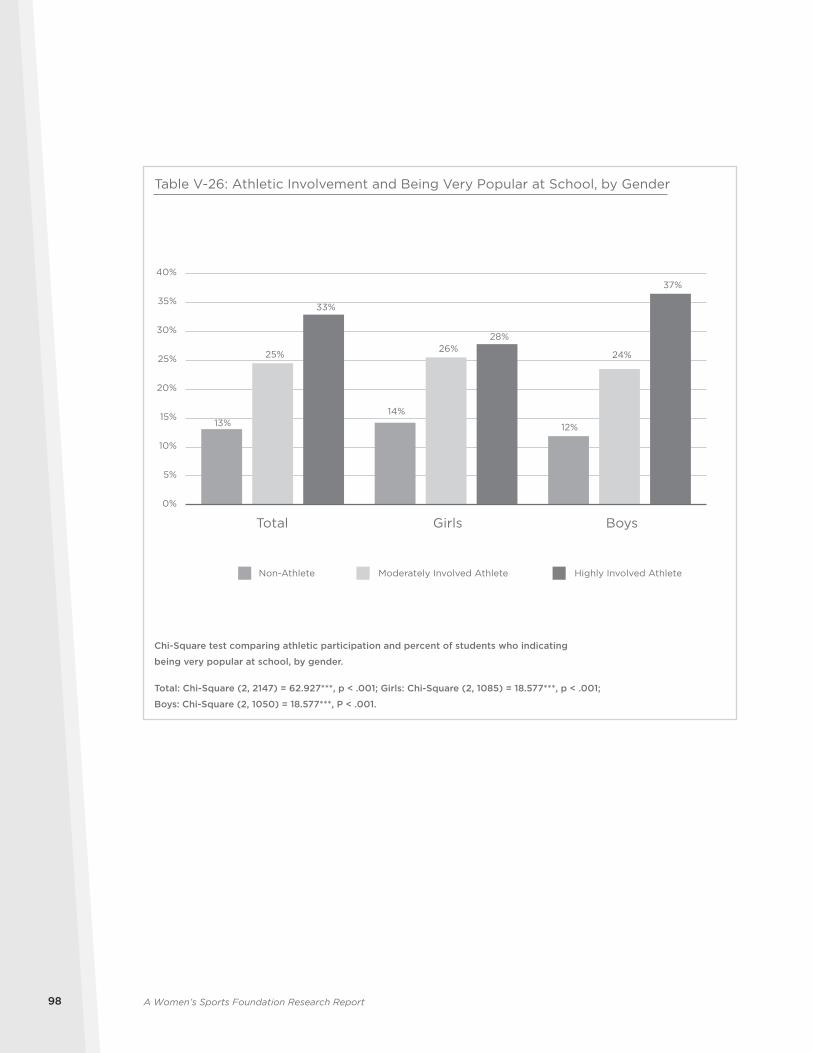
A Women’s Sports Foundation Research Report98
Moderately Involved Athlete Highly Involved AthleteNon-Athlete
13%14%
12%
25%26%
24%
33%
28%
37%
0%
5%
10%
15%
20%
25%
30%
35%
40%
Total Girls Boys
Table V-26: Athletic Involvement and Being Very Popular at School, by Gender
Chi-Square test comparing athletic participation and percent of students who indicating
being very popular at school, by gender.
Total: Chi-Square (2, 2147) = 62.927***, p < .001; Girls: Chi-Square (2, 1085) = 18.577***, p < .001;
Boys: Chi-Square (2, 1050) = 18.577***, P < .001.
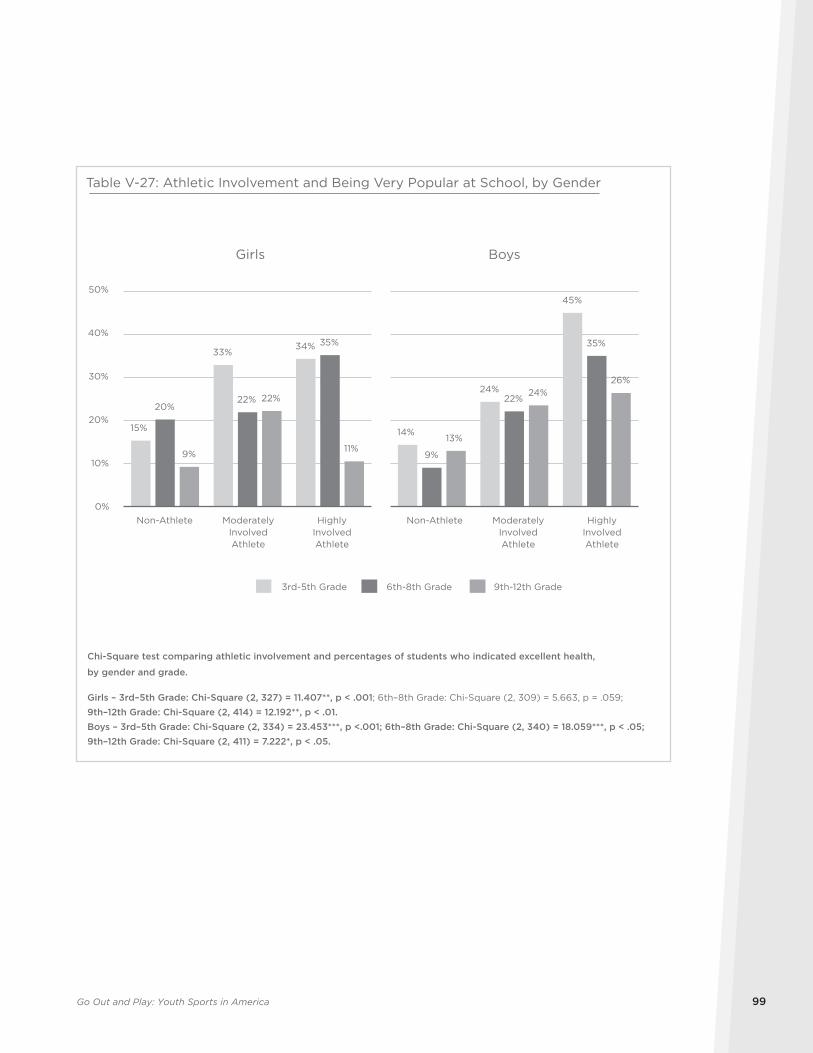
Go Out and Play: Youth Sports in America 99
6th-8th Grade 9th-12th Grade3rd-5th Grade
Girls
15%
33%34%
20%22%
35%
9%
22%
11%
0%
10%
20%
30%
40%
50%
Boys
14%
24%
45%
9%
22%
35%
13%
24%26%
Table V-27: Athletic Involvement and Being Very Popular at School, by Gender
Chi-Square test comparing athletic involvement and percentages of students who indicated excellent health,
by gender and grade.
Girls – 3rd–5th Grade: Chi-Square (2, 327) = 11.407**, p < .001; 6th–8th Grade: Chi-Square (2, 309) = 5.663, p = .059;
9th–12th Grade: Chi-Square (2, 414) = 12.192**, p < .01.Boys – 3rd–5th Grade: Chi-Square (2, 334) = 23.453***, p <.001; 6th–8th Grade: Chi-Square (2, 340) = 18.059***, p < .05; 9th–12th Grade: Chi-Square (2, 411) = 7.222*, p < .05.
Non-Athlete ModeratelyInvolvedAthlete
HighlyInvolvedAthlete
Non-Athlete ModeratelyInvolvedAthlete
HighlyInvolvedAthlete
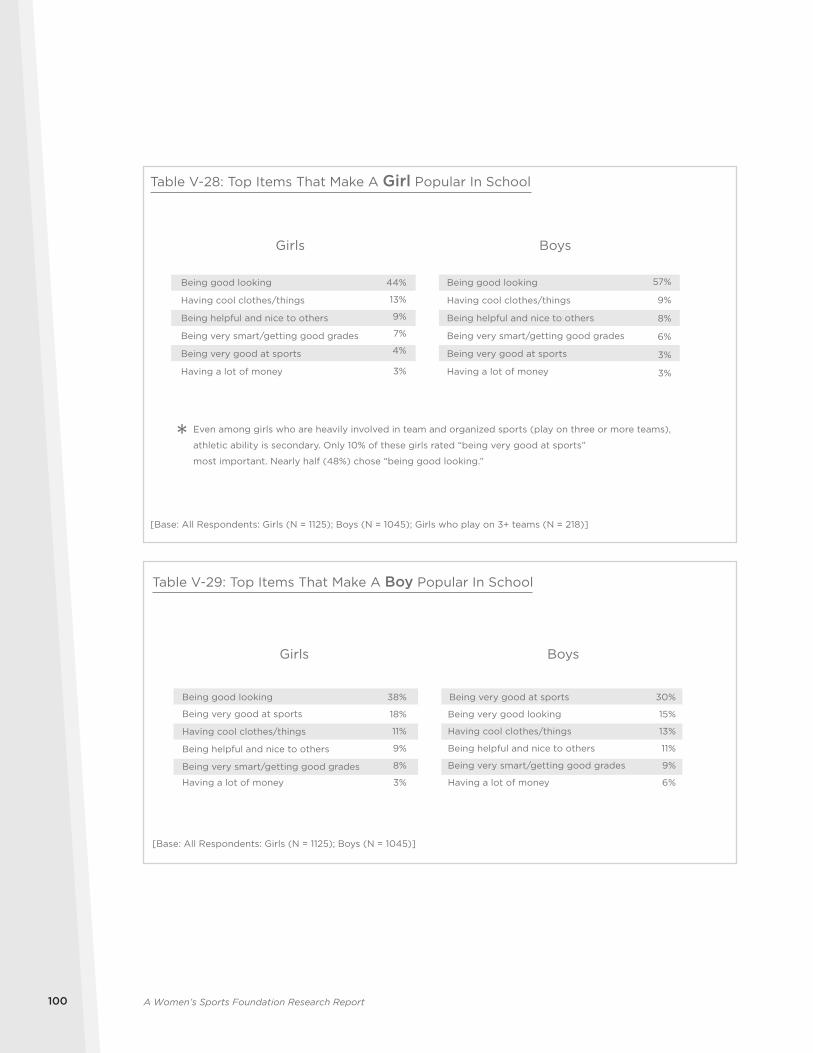
A Women’s Sports Foundation Research Report100
Girls Boys
Being good looking 44% Being good looking 57%
Having cool clothes/things 13% Having cool clothes/things 9%
Being helpful and nice to others 9% Being helpful and nice to others 8%
Being very smart/getting good grades 7% Being very smart/getting good grades 6%
Being very good at sports 4% Being very good at sports 3%
Having a lot of money 3% Having a lot of money 3%
Table V-28: Top Items That Make A Girl Popular In School
[Base: All Respondents: Girls (N = 1125); Boys (N = 1045); Girls who play on 3+ teams (N = 218)]
* Even among girls who are heavily involved in team and organized sports (play on three or more teams),
athletic ability is secondary. Only 10% of these girls rated “being very good at sports”
most important. Nearly half (48%) chose “being good looking.”
Girls Boys
Being good looking 38% Being very good at sports 30%
Being very good at sports 18% Being very good looking 15%
Having cool clothes/things 11% Having cool clothes/things 13%
Being helpful and nice to others 9% Being helpful and nice to others 11%
Being very smart/getting good grades 8% Being very smart/getting good grades 9%
Having a lot of money 3% Having a lot of money 6%
Table V-29: Top Items That Make A Boy Popular In School
[Base: All Respondents: Girls (N = 1125); Boys (N = 1045)]

Go Out and Play: Youth Sports in America 101
athletes had low QOL, compared to 21% of moderately
involved athletes and only 10% of highly involved
athletes. The statistical differences for boys were not
as marked, but they attained significance.
Finally, the findings revealed an overall pattern
of associations between athletic participation
and children’s quality of life across grade levels.
Among the third- to fifth-grade girls and boys,
the percentages of athletes and non-athletes who
reported high (and/or low) quality of life were not
significantly different. Among the sixth- to eighth-
grade and ninth- to 12th-grade girls and boys, greater
athletic participation was significantly related to
higher quality of life.38
Athletic Involvement, Quality of Life and Grade LevelSeveral significant relationships between athletic
involvement and QOL were verified. First, across the
entire sample, greater degrees of athletic participation
were related to higher QOL. See Table V-35 on page
106. Second, the same positive association held for
girls in sixth to eighth and ninth to 12th grades and
their male counterparts. See Table V-36 on page
107. Third, the sixth- to 12th-grade girls who played
sports were less apt to report low QOL scores than
their non-athletic peers. The same was true among
boys. See Table V-37 on page 108. Among the girls,
for example, 28% of the sixth- to eighth-grade non-
Table V-30: Measuring Quality of Life
“Quality of Life” score measures personal contentedness or social adjustment.
Students rate six self-descriptive statements about their relationships and general happiness.
These scores were computed
by summing ratings from the
six statements listed here.
Respondents were grouped
based on aggregate scores:
• “Low score”: 15 or below
• “Medium score”: 16-21
• “High score”: 22 and above.
Quality of Life Score
• have a lot of friends.
• I get along well with my parents.
• I am often bored. (Reversed scale)
• I often feel sad and unhappy. (Reversed scale)
• I have been happy at school this year.
• I get into trouble a lot. (Reversed scale)
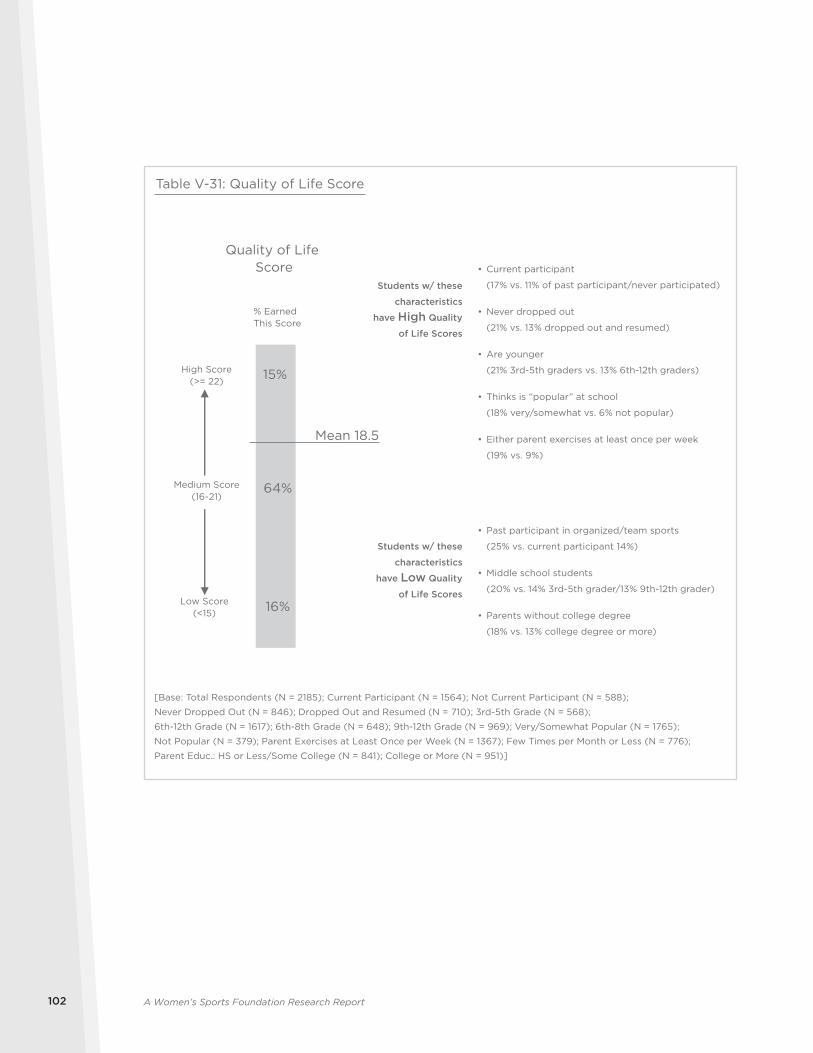
A Women’s Sports Foundation Research Report102
Table V-31: Quality of Life Score
[Base: Total Respondents (N = 2185); Current Participant (N = 1564); Not Current Participant (N = 588);
Never Dropped Out (N = 846); Dropped Out and Resumed (N = 710); 3rd-5th Grade (N = 568);
6th-12th Grade (N = 1617); 6th-8th Grade (N = 648); 9th-12th Grade (N = 969); Very/Somewhat Popular (N = 1765);
Not Popular (N = 379); Parent Exercises at Least Once per Week (N = 1367); Few Times per Month or Less (N = 776);
Parent Educ.: HS or Less/Some College (N = 841); College or More (N = 951)]
15%
64%
16%
Mean 18.5
% Earned This Score
Medium Score(16-21)
Low Score(<15)
High Score(>= 22)
Quality of Life Score
Students w/ these
characteristics
have High Quality
of Life Scores
Students w/ these
characteristics
have Low Quality
of Life Scores
• Current participant
(17% vs. 11% of past participant/never participated)
• Never dropped out
(21% vs. 13% dropped out and resumed)
• Are younger
(21% 3rd-5th graders vs. 13% 6th-12th graders)
• Thinks is “popular” at school
(18% very/somewhat vs. 6% not popular)
• Either parent exercises at least once per week
(19% vs. 9%)
• Past participant in organized/team sports
(25% vs. current participant 14%)
• Middle school students
(20% vs. 14% 3rd-5th grader/13% 9th-12th grader)
• Parents without college degree
(18% vs. 13% college degree or more)
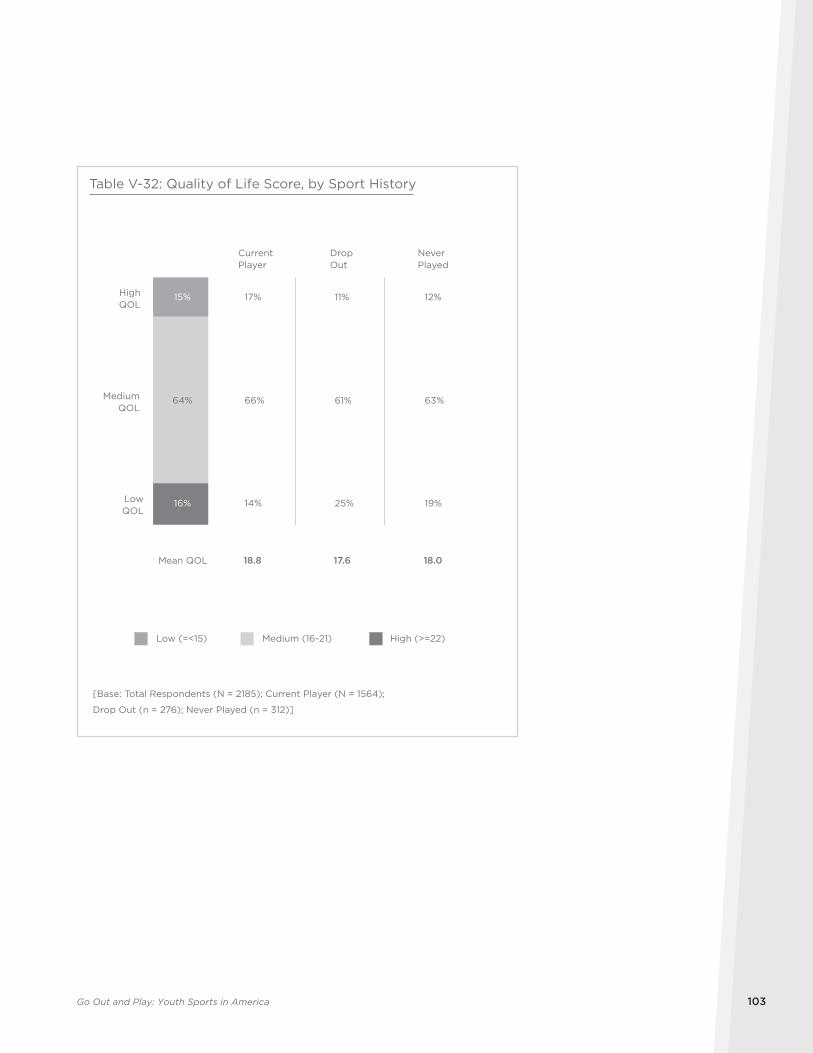
Go Out and Play: Youth Sports in America 103
16%
64%
15%
Low (=<15) Medium (16-21) High (>=22)
17% 11% 12%
66% 61% 63%
14% 25% 19%
18.8 17.6 18.0
[Base: Total Respondents (N = 2185); Current Player (N = 1564);
Drop Out (n = 276); Never Played (n = 312)]
Table V-32: Quality of Life Score, by Sport History
HighQOL
MediumQOL
LowQOL
Mean QOL
CurrentPlayer
DropOut
NeverPlayed
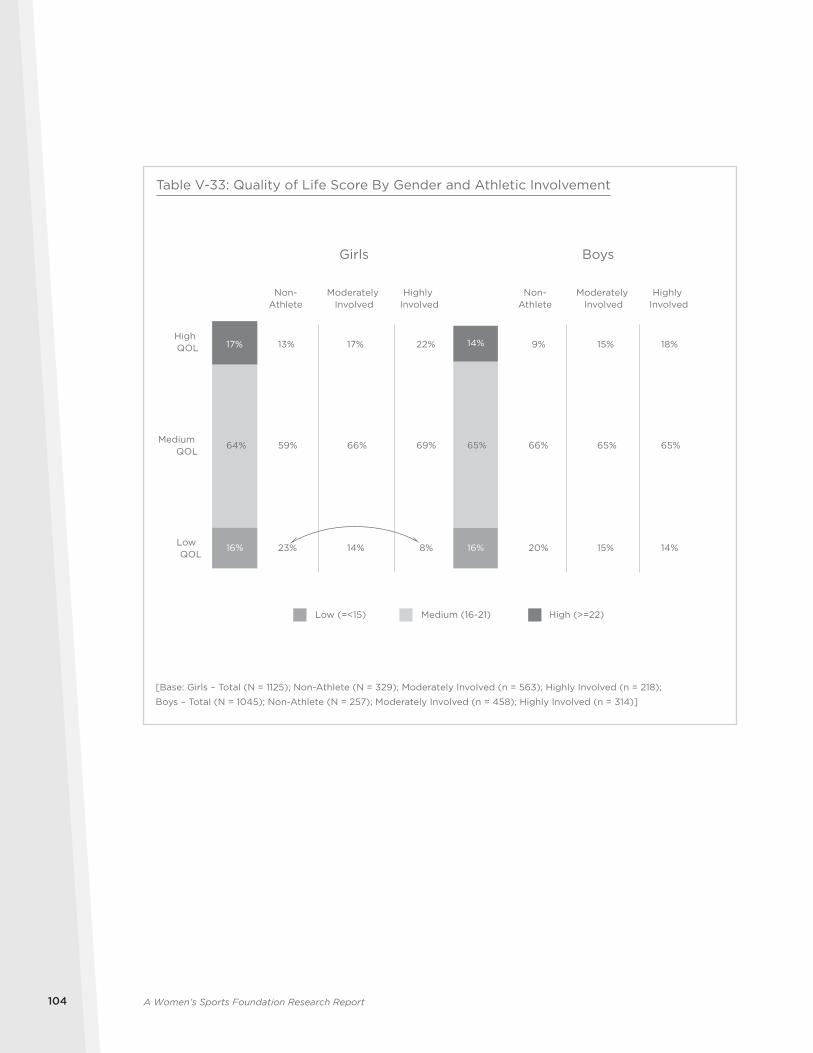
A Women’s Sports Foundation Research Report104
Non-Athlete
Moderately Involved
Highly Involved
Non-Athlete
Moderately Involved
Highly Involved
High QOL
Medium QOL
Low QOL
16%
64%
17% 13% 17% 22%
59% 66% 69%
23% 14% 8% 16%
65%
14% 9% 15% 18%
66% 65% 65%
20% 15% 14%
Girls Boys
Low (=<15) Medium (16-21) High (>=22)
Table V-33: Quality of Life Score By Gender and Athletic Involvement
[Base: Girls – Total (N = 1125); Non-Athlete (N = 329); Moderately Involved (n = 563); Highly Involved (n = 218);
Boys – Total (N = 1045); Non-Athlete (N = 257); Moderately Involved (n = 458); Highly Involved (n = 314)]
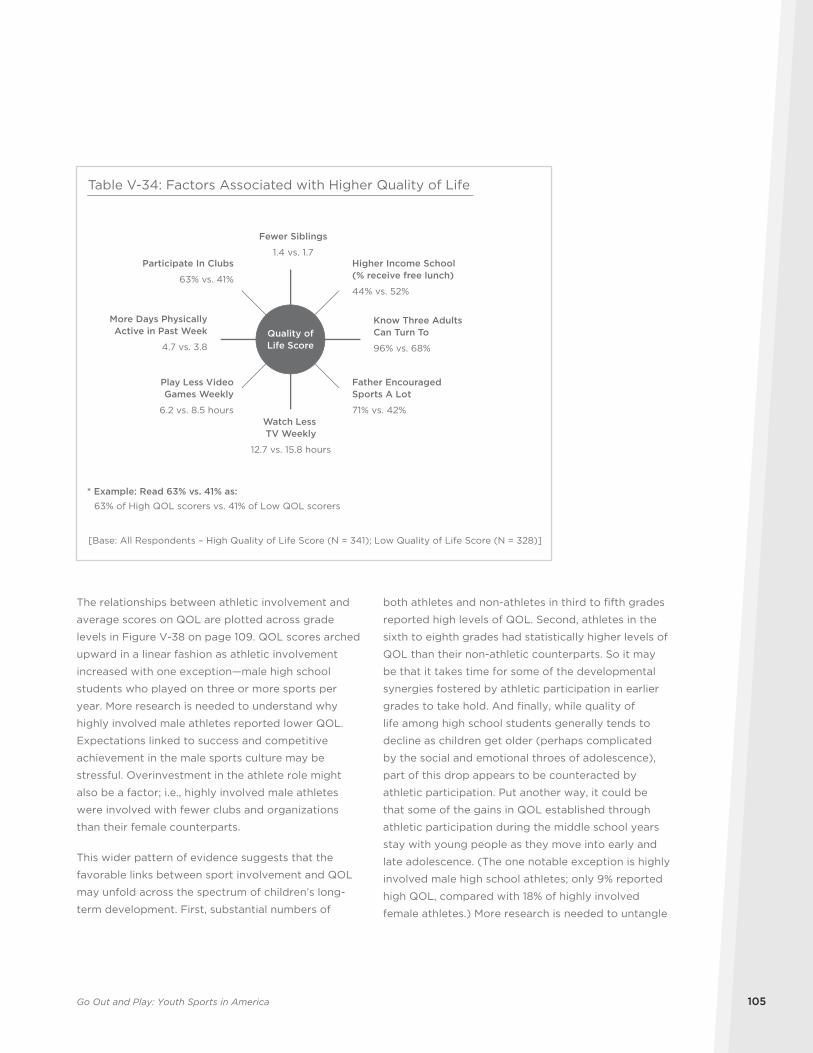
Go Out and Play: Youth Sports in America 105
both athletes and non-athletes in third to fifth grades
reported high levels of QOL. Second, athletes in the
sixth to eighth grades had statistically higher levels of
QOL than their non-athletic counterparts. So it may
be that it takes time for some of the developmental
synergies fostered by athletic participation in earlier
grades to take hold. And finally, while quality of
life among high school students generally tends to
decline as children get older (perhaps complicated
by the social and emotional throes of adolescence),
part of this drop appears to be counteracted by
athletic participation. Put another way, it could be
that some of the gains in QOL established through
athletic participation during the middle school years
stay with young people as they move into early and
late adolescence. (The one notable exception is highly
involved male high school athletes; only 9% reported
high QOL, compared with 18% of highly involved
female athletes.) More research is needed to untangle
The relationships between athletic involvement and
average scores on QOL are plotted across grade
levels in Figure V-38 on page 109. QOL scores arched
upward in a linear fashion as athletic involvement
increased with one exception—male high school
students who played on three or more sports per
year. More research is needed to understand why
highly involved male athletes reported lower QOL.
Expectations linked to success and competitive
achievement in the male sports culture may be
stressful. Overinvestment in the athlete role might
also be a factor; i.e., highly involved male athletes
were involved with fewer clubs and organizations
than their female counterparts.
This wider pattern of evidence suggests that the
favorable links between sport involvement and QOL
may unfold across the spectrum of children’s long-
term development. First, substantial numbers of
Table V-34: Factors Associated with Higher Quality of Life
Fewer Siblings
1.4 vs. 1.7Higher Income School (% receive free lunch)
44% vs. 52%
Know Three Adults Can Turn To
96% vs. 68%
Father Encouraged Sports A Lot
71% vs. 42%Watch Less TV Weekly
12.7 vs. 15.8 hours
Play Less VideoGames Weekly
6.2 vs. 8.5 hours
More Days PhysicallyActive in Past Week
4.7 vs. 3.8
Participate In Clubs
63% vs. 41%
* Example: Read 63% vs. 41% as: 63% of High QOL scorers vs. 41% of Low QOL scorers
Quality ofLife Score
[Base: All Respondents – High Quality of Life Score (N = 341); Low Quality of Life Score (N = 328)]
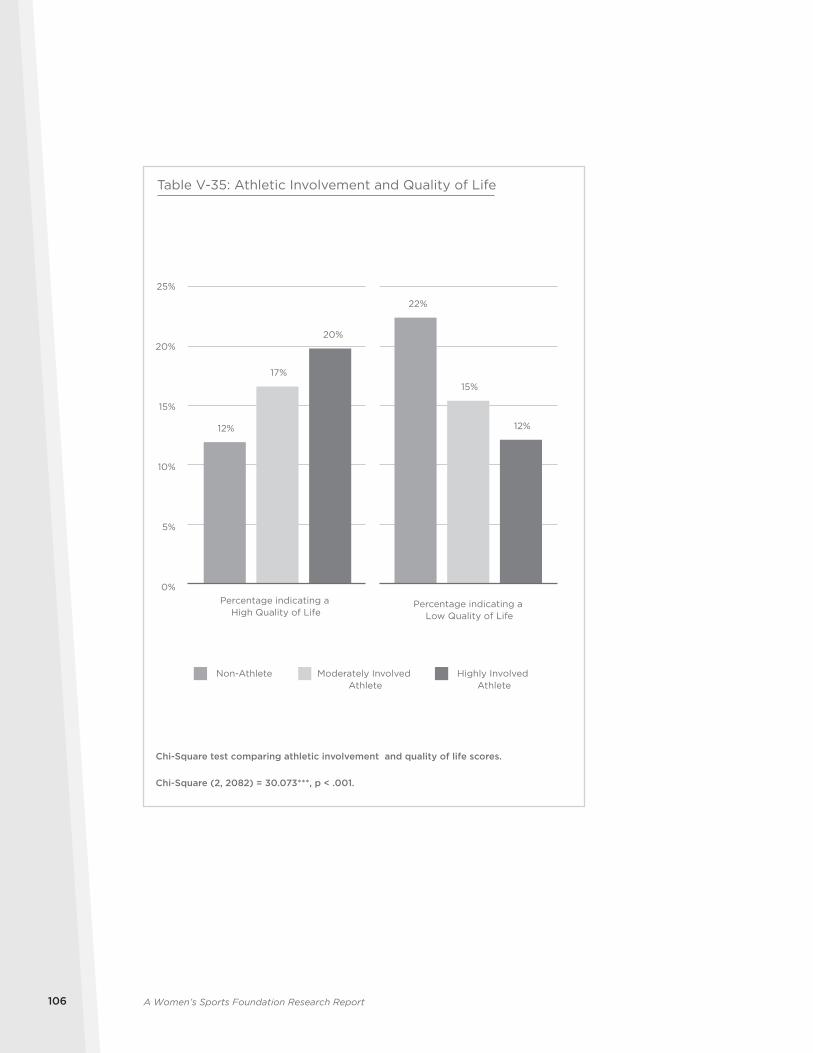
A Women’s Sports Foundation Research Report106
12%
22%
17%
15%
20%
12%
0%
5%
10%
15%
20%
25%
Percentage indicating a High Quality of Life
Percentage indicating a Low Quality of Life
Table V-35: Athletic Involvement and Quality of Life
Chi-Square test comparing athletic involvement and quality of life scores.
Chi-Square (2, 2082) = 30.073***, p < .001.
Non-Athlete Moderately Involved Athlete
Highly Involved Athlete
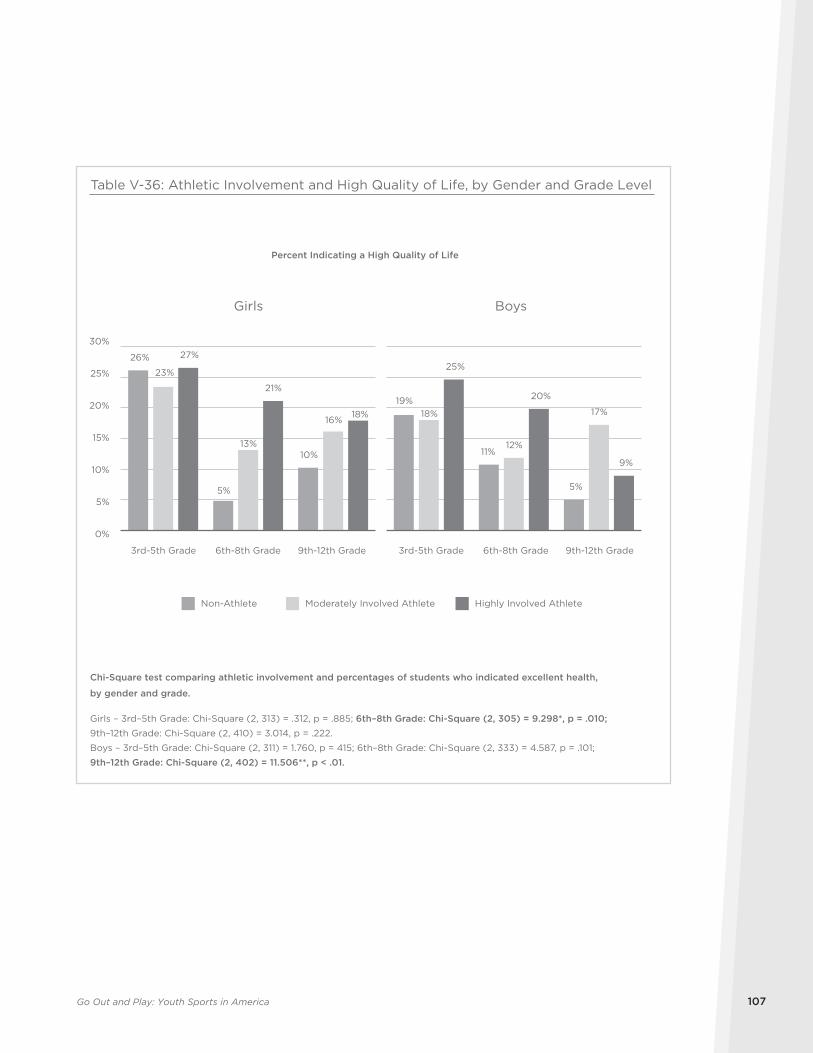
Go Out and Play: Youth Sports in America 107
Girls
26%
5%
10%
23%
13%
16%
27%
21%
18%
0%
5%
10%
15%
20%
25%
30%
Boys
19%
11%
5%
18%
12%
17%
25%
20%
9%
Percent Indicating a High Quality of Life
Table V-36: Athletic Involvement and High Quality of Life, by Gender and Grade Level
Chi-Square test comparing athletic involvement and percentages of students who indicated excellent health,
by gender and grade.
Girls – 3rd–5th Grade: Chi-Square (2, 313) = .312, p = .885; 6th–8th Grade: Chi-Square (2, 305) = 9.298*, p = .010; 9th–12th Grade: Chi-Square (2, 410) = 3.014, p = .222.
Boys – 3rd–5th Grade: Chi-Square (2, 311) = 1.760, p = 415; 6th–8th Grade: Chi-Square (2, 333) = 4.587, p = .101;
9th–12th Grade: Chi-Square (2, 402) = 11.506**, p < .01.
Non-Athlete Moderately Involved Athlete Highly Involved Athlete
6th-8th Grade 9th-12th Grade3rd-5th Grade 6th-8th Grade 9th-12th Grade3rd-5th Grade
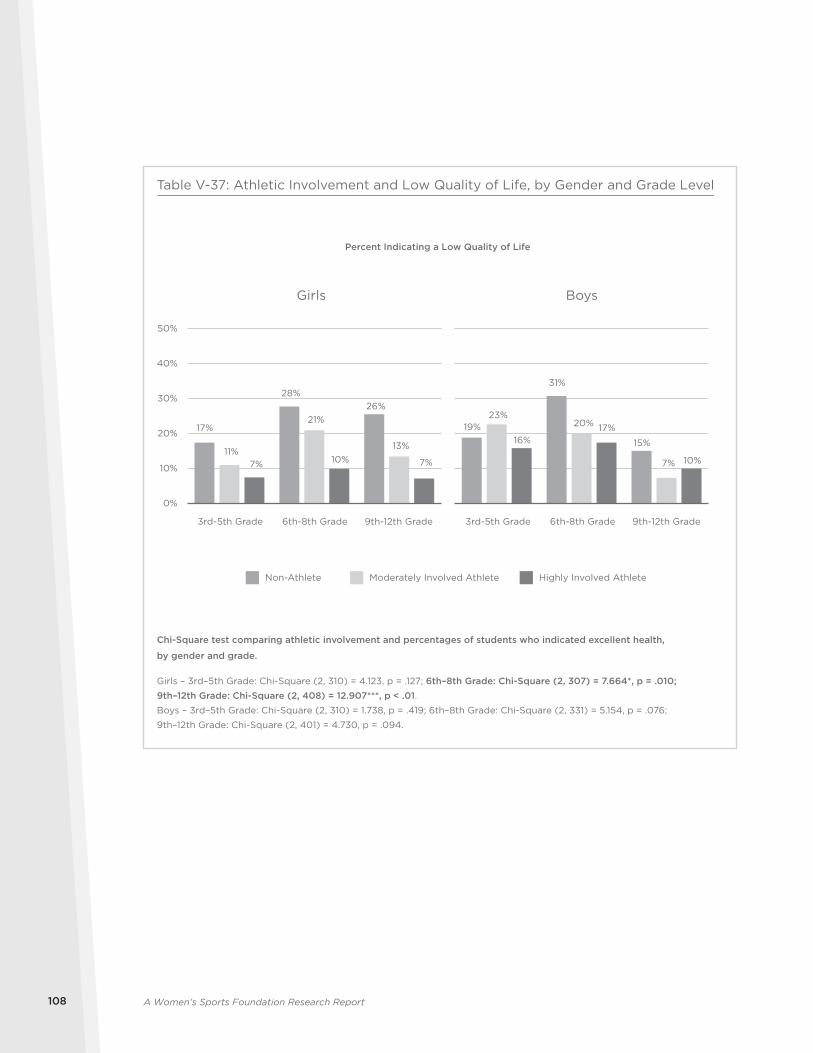
A Women’s Sports Foundation Research Report108
Non-Athlete Moderately Involved Athlete Highly Involved Athlete
6th-8th Grade 9th-12th Grade3rd-5th Grade 6th-8th Grade 9th-12th Grade3rd-5th Grade
Girls
17%
28%26%
11%
21%
13%
7% 10% 7%
0%
10%
20%
30%
40%
50%
Percent Indicating a Low Quality of Life
Boys
19%
31%
15%
23%20%
7%
16%17%
10%
Table V-37: Athletic Involvement and Low Quality of Life, by Gender and Grade Level
Chi-Square test comparing athletic involvement and percentages of students who indicated excellent health,
by gender and grade.
Girls – 3rd–5th Grade: Chi-Square (2, 310) = 4.123, p = .127; 6th–8th Grade: Chi-Square (2, 307) = 7.664*, p = .010; 9th–12th Grade: Chi-Square (2, 408) = 12.907***, p < .01.Boys – 3rd–5th Grade: Chi-Square (2, 310) = 1.738, p = .419; 6th–8th Grade: Chi-Square (2, 331) = 5.154, p = .076;
9th–12th Grade: Chi-Square (2, 401) = 4.730, p = .094.
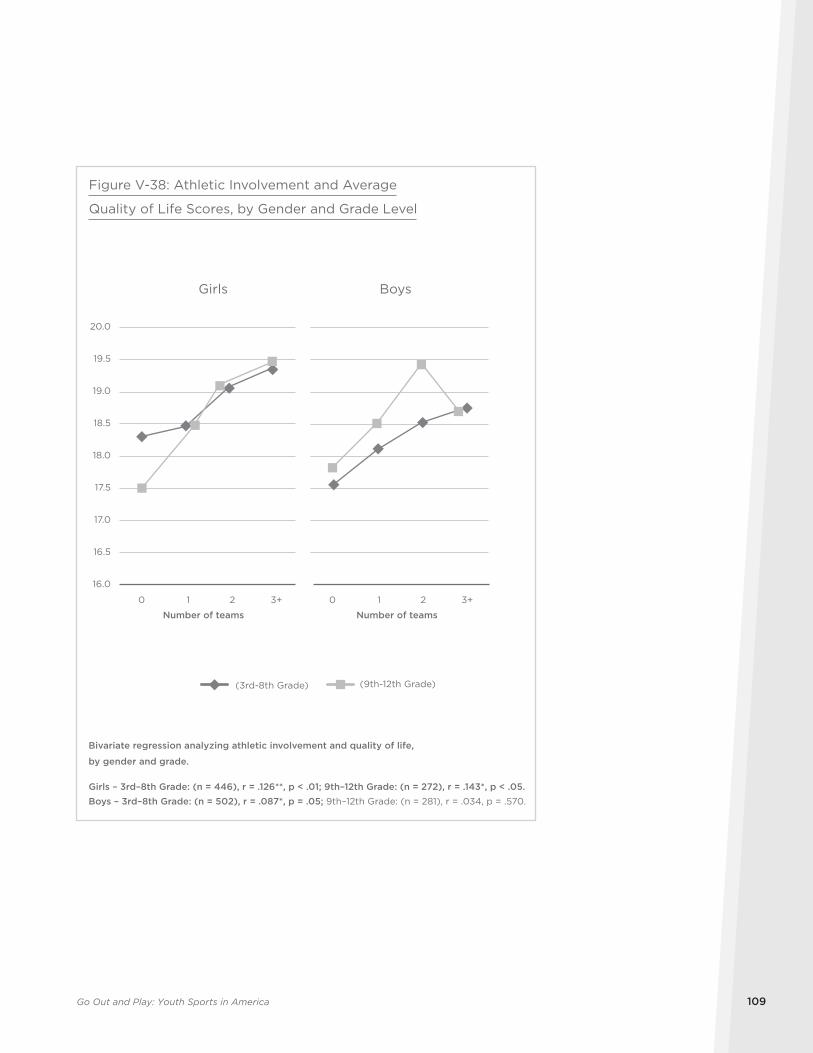
Go Out and Play: Youth Sports in America 109
Girls
16.0
16.5
17.0
17.5
18.0
18.5
19.0
19.5
20.0
Boys
Figure V-38: Athletic Involvement and Average
Quality of Life Scores, by Gender and Grade Level
Bivariate regression analyzing athletic involvement and quality of life,
by gender and grade.
Girls – 3rd–8th Grade: (n = 446), r = .126**, p < .01; 9th–12th Grade: (n = 272), r = .143*, p < .05.
Boys – 3rd–8th Grade: (n = 502), r = .087*, p = .05; 9th–12th Grade: (n = 281), r = .034, p = .570.
(3rd-8th Grade) (9th-12th Grade)
0 1 2 3+ 0 1 2 3+
Number of teams Number of teams

A Women’s Sports Foundation Research Report110
if and how the personal and social assets fostered
by athletic participation flow across childhood
and adolescence.
School Location and Family TypeWhen girls’ and boys’ average QOL scores were
plotted in relation to athletic involvement across
school locations, the overall results were positive.
See Table V-39 on following page. There was a dip
downward in average QOL scores, however, among
both highly involved female and male athletes from
rural schools.
Finally, in Section III of this report, findings showed
that higher levels of children’s involvement
with sports were associated with greater family
satisfaction. Moreover, this positive synergy held
for daughters in both dual-parent and single-parent
families. A similar relationship is illustrated in Figure
V-40 (on page 112). Daughters involved with three or
more sports from single-parent families reported the
highest average QOL score. This is another indication
that something special is happening for highly active
female athletes in single-parent families.
Academic AchievementPrevious studies show that student-athletes do well
academically during the high school years.39 Athletes
not only have higher grades than non-athletes, but
also study longer and are more apt to be enrolled
in a university two years after high school.40 The
findings below explore whether athletic participation
is an educational resource for students across the
elementary, middle-school and high school years.
Among all U.S. third- to 12th-grade students, more
athletes than non-athletes enjoyed greater levels of
high academic achievement.41 Highly involved athletes
of both sexes reported receiving “mostly A’s” on their
report cards. See Table V-41 on page 113. Moderately
involved female athletes did just as well as their highly
involved peers in the “A-grade” department. Among
the boys, however, only those playing three or more
sports reported mostly A’s on their report cards.
When the “sport and classroom” connections are
broken down by grade levels, the picture becomes
more complex, but some key findings emerged.
See Table V-42 on page 114. Moderately involved
female athletes outpaced their non-athletic peers at
every grade level. Moderately involved male athletes
showed no such surge in academic excellence. Highly
involved athletes of both sexes, in contrast, generated
significantly more A-grades than non-athletes at
every grade level except among third- to fifth-
grade boys.
The positive links between athletic participation
and academic performance often persisted across
school locations—especially for girls. See Tables V-43
and V-44 on pages 115 and 116, respectively. Female
athletes (both moderately and highly involved)
outpaced their non-athletic peers in every grade level
and school location except in rural high schools.
The findings for boys were mixed. Moderately
involved male athletes in the third to eighth grades
did better in the classroom than non-athletes in
urban and rural schools but not suburban schools.
Highly involved male athletes excelled in “A-grade”
production in all school locations. In rural high
schools, however, moderately involved athletes in
the high school reported fewer “A’s” than their non-
athletic peers.
Finally, economic disparities were linked with the
academic performance of athletes. A comparison of
the data in Tables V-45 and V-46 (on pages 117 and
118, respectively) suggests that the most consistent
academic gains associated with athletic participation
were made by girls who live in higher-income
communities. The third- to eighth-grade female
athletes in the lower income bracket ($50,000 or
less median family income) also reported more A’s
than their non-athletic peers. Among the males in this
lower-income group, only the highly involved athletes
showed academic gains.
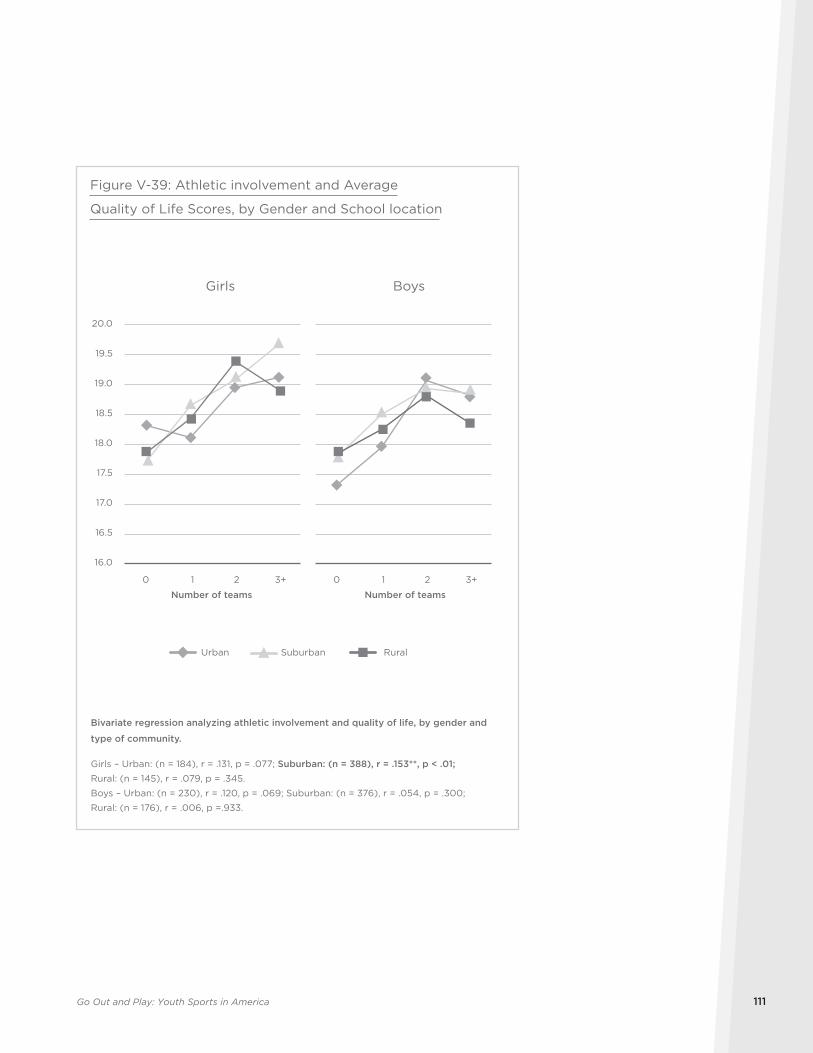
Go Out and Play: Youth Sports in America 111
Girls
16.0
16.5
17.0
17.5
18.0
18.5
19.0
19.5
20.0
Boys
Figure V-39: Athletic involvement and Average
Quality of Life Scores, by Gender and School location
Bivariate regression analyzing athletic involvement and quality of life, by gender and
type of community.
Girls – Urban: (n = 184), r = .131, p = .077; Suburban: (n = 388), r = .153**, p < .01;
Rural: (n = 145), r = .079, p = .345.
Boys – Urban: (n = 230), r = .120, p = .069; Suburban: (n = 376), r = .054, p = .300;
Rural: (n = 176), r = .006, p =.933.
Urban RuralSuburban
0 1 2 3+ 0 1 2 3+
Number of teams Number of teams
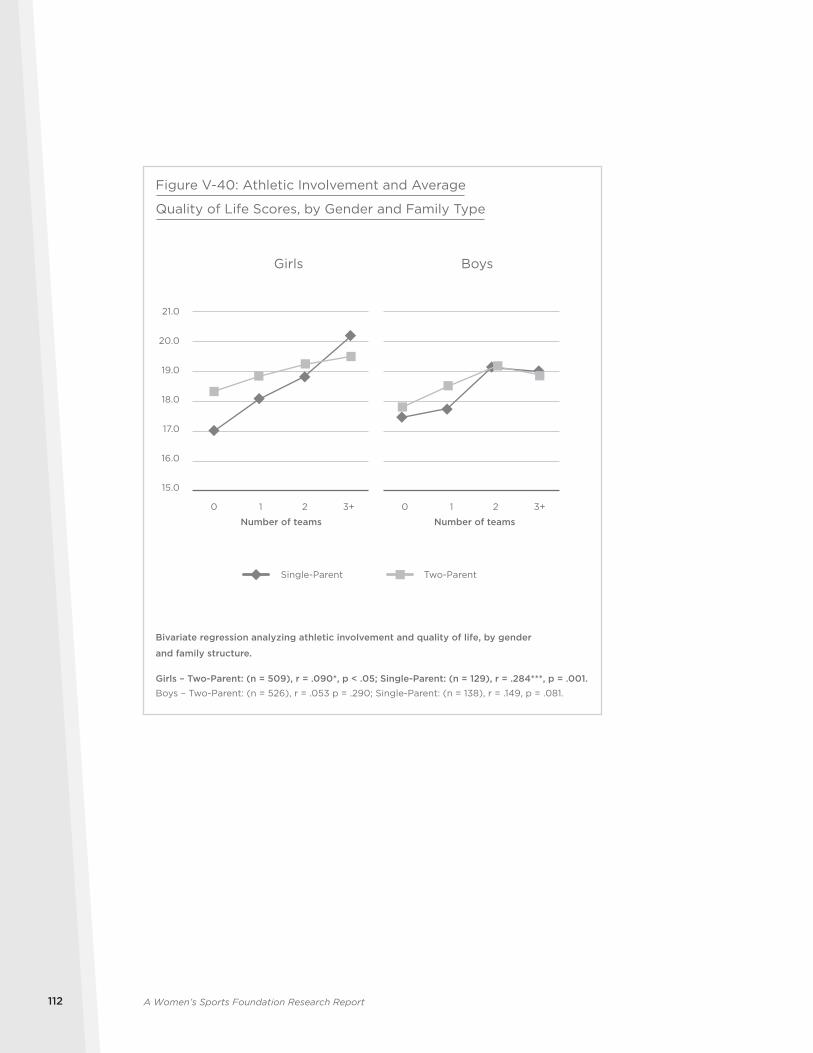
A Women’s Sports Foundation Research Report112
15.0
16.0
17.0
18.0
19.0
20.0
21.0
Girls Boys
0 1 2 3+ 0 1 2 3+
Number of teams Number of teams
Figure V-40: Athletic Involvement and Average
Quality of Life Scores, by Gender and Family Type
Bivariate regression analyzing athletic involvement and quality of life, by gender
and family structure.
Girls – Two-Parent: (n = 509), r = .090*, p < .05; Single-Parent: (n = 129), r = .284***, p = .001.
Boys – Two-Parent: (n = 526), r = .053 p = .290; Single-Parent: (n = 138), r = .149, p = .081.
Single-Parent Two-Parent
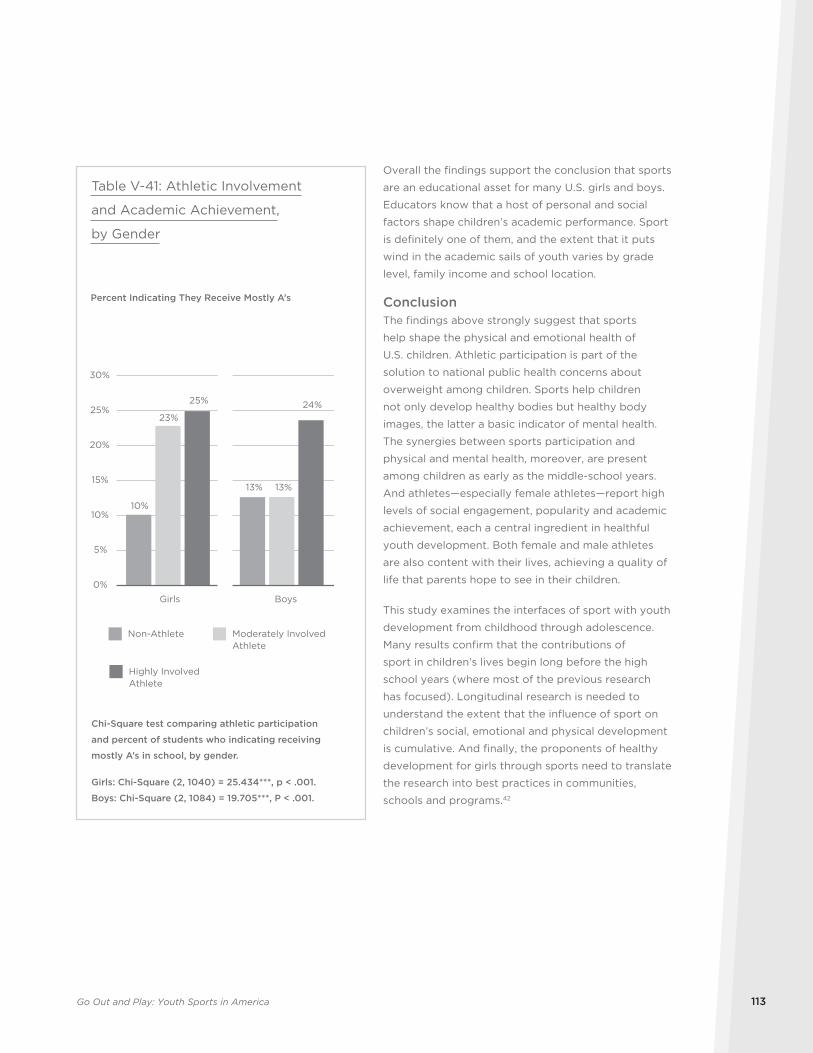
Go Out and Play: Youth Sports in America 113
Overall the findings support the conclusion that sports
are an educational asset for many U.S. girls and boys.
Educators know that a host of personal and social
factors shape children’s academic performance. Sport
is definitely one of them, and the extent that it puts
wind in the academic sails of youth varies by grade
level, family income and school location.
ConclusionThe findings above strongly suggest that sports
help shape the physical and emotional health of
U.S. children. Athletic participation is part of the
solution to national public health concerns about
overweight among children. Sports help children
not only develop healthy bodies but healthy body
images, the latter a basic indicator of mental health.
The synergies between sports participation and
physical and mental health, moreover, are present
among children as early as the middle-school years.
And athletes—especially female athletes—report high
levels of social engagement, popularity and academic
achievement, each a central ingredient in healthful
youth development. Both female and male athletes
are also content with their lives, achieving a quality of
life that parents hope to see in their children.
This study examines the interfaces of sport with youth
development from childhood through adolescence.
Many results confirm that the contributions of
sport in children’s lives begin long before the high
school years (where most of the previous research
has focused). Longitudinal research is needed to
understand the extent that the influence of sport on
children’s social, emotional and physical development
is cumulative. And finally, the proponents of healthy
development for girls through sports need to translate
the research into best practices in communities,
schools and programs.42
10%
13%
23%
13%
25% 24%
0%
5%
10%
15%
20%
25%
30%
Girls Boys
Percent Indicating They Receive Mostly A’s
Table V-41: Athletic Involvement
and Academic Achievement,
by Gender
Chi-Square test comparing athletic participation
and percent of students who indicating receiving
mostly A’s in school, by gender.
Girls: Chi-Square (2, 1040) = 25.434***, p < .001.
Boys: Chi-Square (2, 1084) = 19.705***, P < .001.
Non-Athlete Moderately Involved Athlete
Highly Involved Athlete
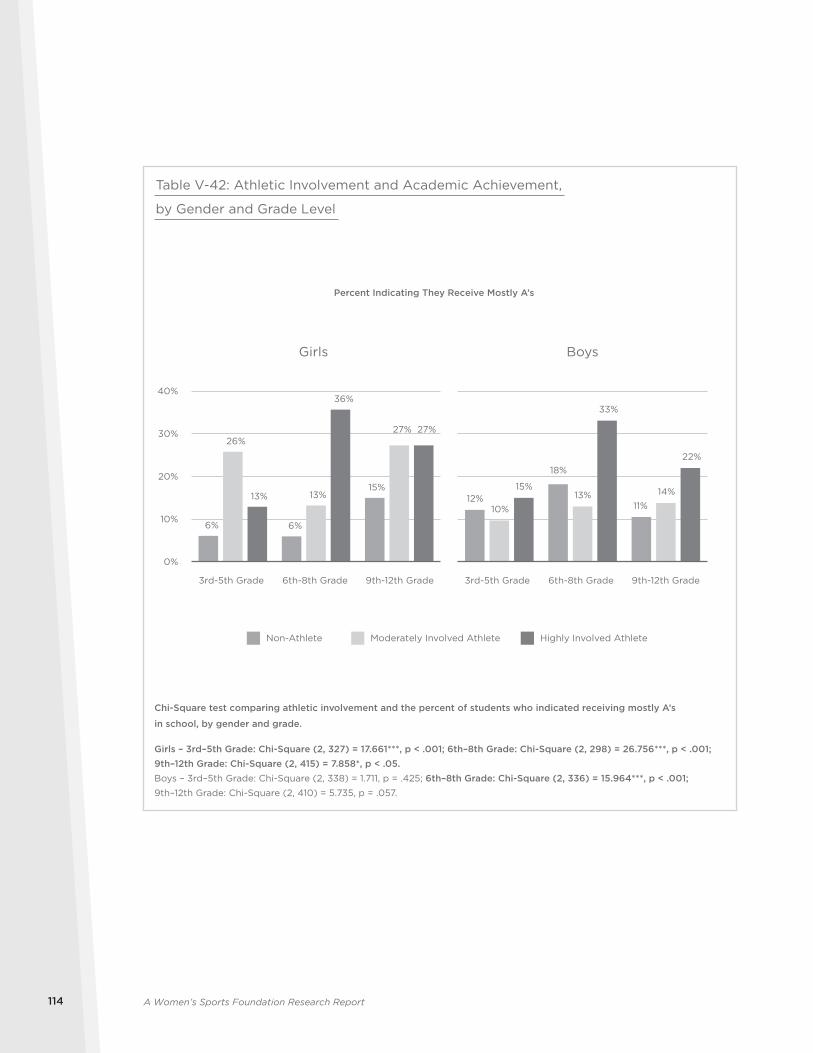
A Women’s Sports Foundation Research Report114
6% 6%
15%
26%
13%
27%
13%
36%
27%
0%
10%
20%
30%
40%
Girls
12%
18%
11%10%13% 14%15%
33%
22%
Boys
Table V-42: Athletic Involvement and Academic Achievement,
by Gender and Grade Level
Percent Indicating They Receive Mostly A’s
Chi-Square test comparing athletic involvement and the percent of students who indicated receiving mostly A’s
in school, by gender and grade.
Girls – 3rd–5th Grade: Chi-Square (2, 327) = 17.661***, p < .001; 6th–8th Grade: Chi-Square (2, 298) = 26.756***, p < .001; 9th–12th Grade: Chi-Square (2, 415) = 7.858*, p < .05.Boys – 3rd–5th Grade: Chi-Square (2, 338) = 1.711, p = .425; 6th–8th Grade: Chi-Square (2, 336) = 15.964***, p < .001; 9th–12th Grade: Chi-Square (2, 410) = 5.735, p = .057.
Non-Athlete Moderately Involved Athlete Highly Involved Athlete
6th-8th Grade 9th-12th Grade3rd-5th Grade 6th-8th Grade 9th-12th Grade3rd-5th Grade
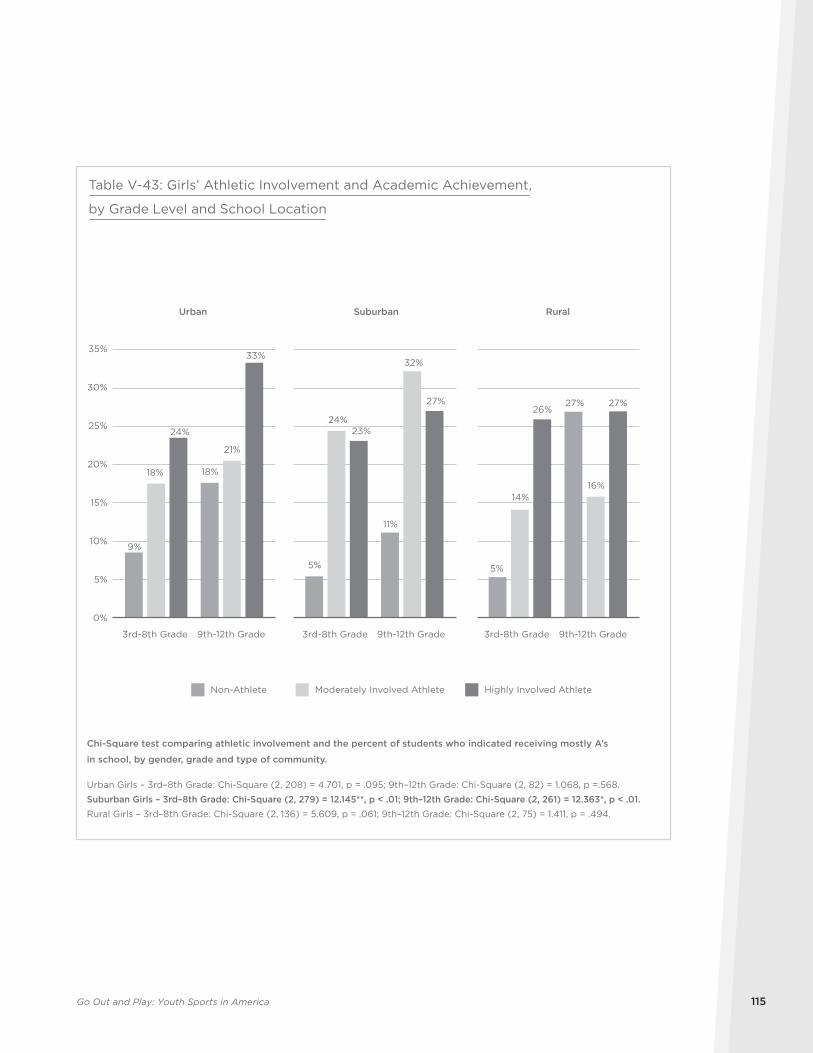
Go Out and Play: Youth Sports in America 115
9%
18%
5%
11%
5%
27%
18%
21%
24%
32%
14%16%
24%
33%
23%
27%26%
27%
0%
5%
10%
15%
20%
25%
30%
35%
Urban Suburban Rural
Table V-43: Girls’ Athletic Involvement and Academic Achievement,
by Grade Level and School Location
Chi-Square test comparing athletic involvement and the percent of students who indicated receiving mostly A’s
in school, by gender, grade and type of community.
Urban Girls – 3rd–8th Grade: Chi-Square (2, 208) = 4.701, p = .095; 9th–12th Grade: Chi-Square (2, 82) = 1.068, p =.568.
Suburban Girls – 3rd–8th Grade: Chi-Square (2, 279) = 12.145**, p < .01; 9th–12th Grade: Chi-Square (2, 261) = 12.363*, p < .01.Rural Girls – 3rd–8th Grade: Chi-Square (2, 136) = 5.609, p = .061; 9th–12th Grade: Chi-Square (2, 75) = 1.411, p = .494.
Non-Athlete Moderately Involved Athlete Highly Involved Athlete
9th-12th Grade3rd-8th Grade 9th-12th Grade3rd-8th Grade 9th-12th Grade3rd-8th Grade
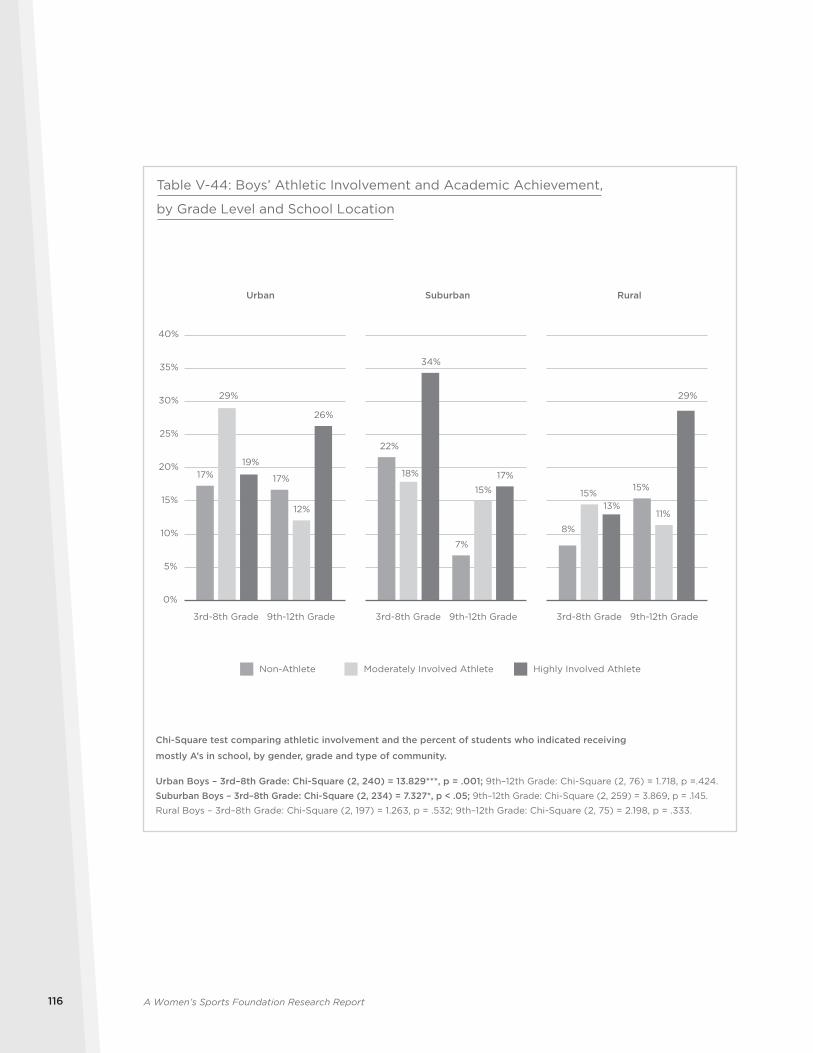
A Women’s Sports Foundation Research Report116
17% 17%
22%
7%
8%
15%
29%
12%
18%
15% 15%
11%
19%
26%
34%
17%
13%
29%
0%
5%
10%
15%
20%
25%
30%
35%
40%
Urban Suburban Rural
Table V-44: Boys’ Athletic Involvement and Academic Achievement,
by Grade Level and School Location
Chi-Square test comparing athletic involvement and the percent of students who indicated receiving
mostly A’s in school, by gender, grade and type of community.
Urban Boys – 3rd–8th Grade: Chi-Square (2, 240) = 13.829***, p = .001; 9th–12th Grade: Chi-Square (2, 76) = 1.718, p =.424.
Suburban Boys – 3rd–8th Grade: Chi-Square (2, 234) = 7.327*, p < .05; 9th–12th Grade: Chi-Square (2, 259) = 3.869, p = .145.
Rural Boys – 3rd–8th Grade: Chi-Square (2, 197) = 1.263, p = .532; 9th–12th Grade: Chi-Square (2, 75) = 2.198, p = .333.
9th-12th Grade3rd-8th Grade 9th-12th Grade3rd-8th Grade 9th-12th Grade3rd-8th Grade
Non-Athlete Moderately Involved Athlete Highly Involved Athlete
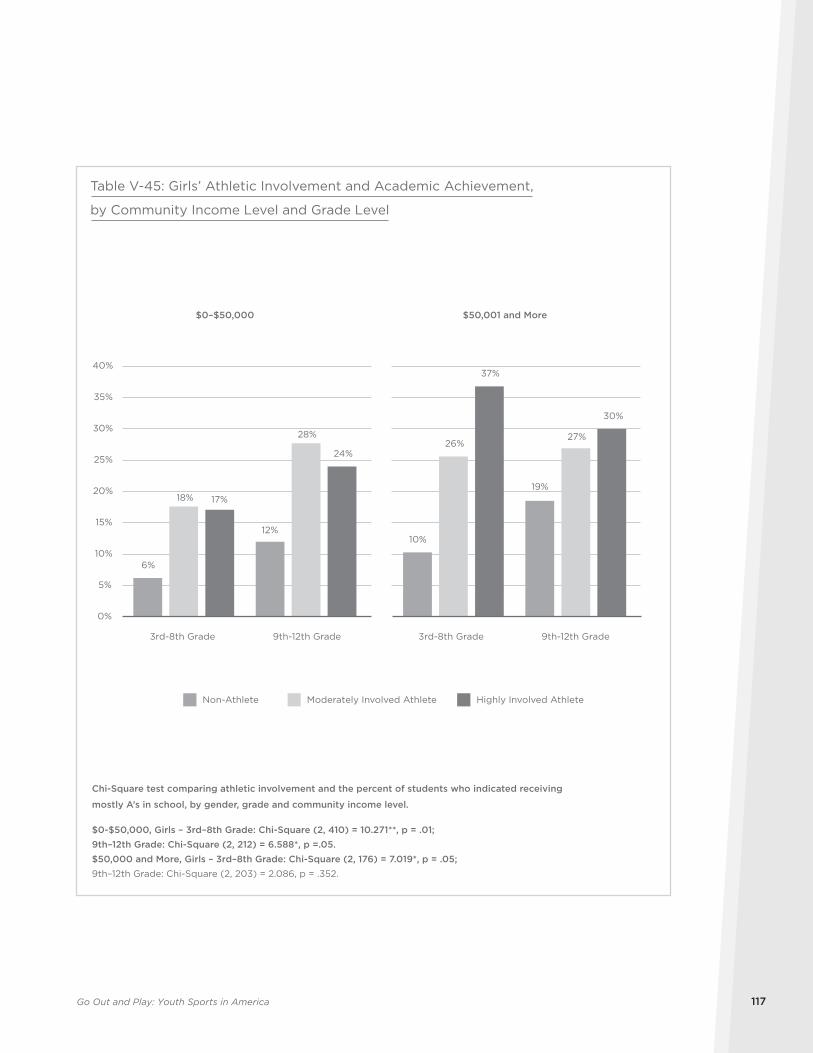
Go Out and Play: Youth Sports in America 117
6%
12%10%
19%18%
28%26%
27%
17%
24%
37%
30%
0%
5%
10%
15%
20%
25%
30%
35%
40%
$0–$50,000 $50,001 and More
Table V-45: Girls’ Athletic Involvement and Academic Achievement,
by Community Income Level and Grade Level
Chi-Square test comparing athletic involvement and the percent of students who indicated receiving
mostly A’s in school, by gender, grade and community income level.
$0-$50,000, Girls – 3rd–8th Grade: Chi-Square (2, 410) = 10.271**, p = .01;
9th–12th Grade: Chi-Square (2, 212) = 6.588*, p =.05.
$50,000 and More, Girls – 3rd–8th Grade: Chi-Square (2, 176) = 7.019*, p = .05;
9th–12th Grade: Chi-Square (2, 203) = 2.086, p = .352.
9th-12th Grade3rd-8th Grade 9th-12th Grade3rd-8th Grade
Non-Athlete Moderately Involved Athlete Highly Involved Athlete
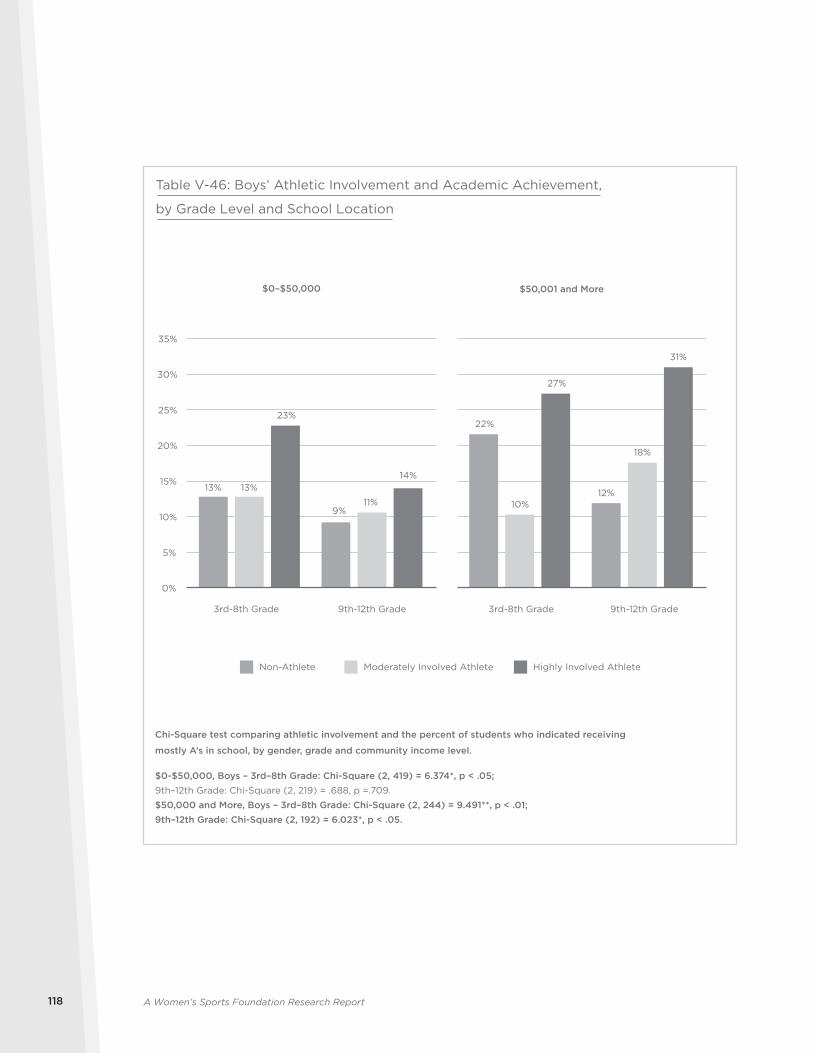
A Women’s Sports Foundation Research Report118
13%
9%
22%
12%13%
11% 10%
18%
23%
14%
27%
31%
0%
5%
10%
15%
20%
25%
30%
35%
$0–$50,000 $50,001 and More
Table V-46: Boys’ Athletic Involvement and Academic Achievement,
by Grade Level and School Location
Chi-Square test comparing athletic involvement and the percent of students who indicated receiving
mostly A’s in school, by gender, grade and community income level.
$0-$50,000, Boys – 3rd–8th Grade: Chi-Square (2, 419) = 6.374*, p < .05;
9th–12th Grade: Chi-Square (2, 219) = .688, p =.709.
$50,000 and More, Boys – 3rd–8th Grade: Chi-Square (2, 244) = 9.491**, p < .01;
9th–12th Grade: Chi-Square (2, 192) = 6.023*, p < .05.
9th-12th Grade3rd-8th Grade 9th-12th Grade3rd-8th Grade
Non-Athlete Moderately Involved Athlete Highly Involved Athlete
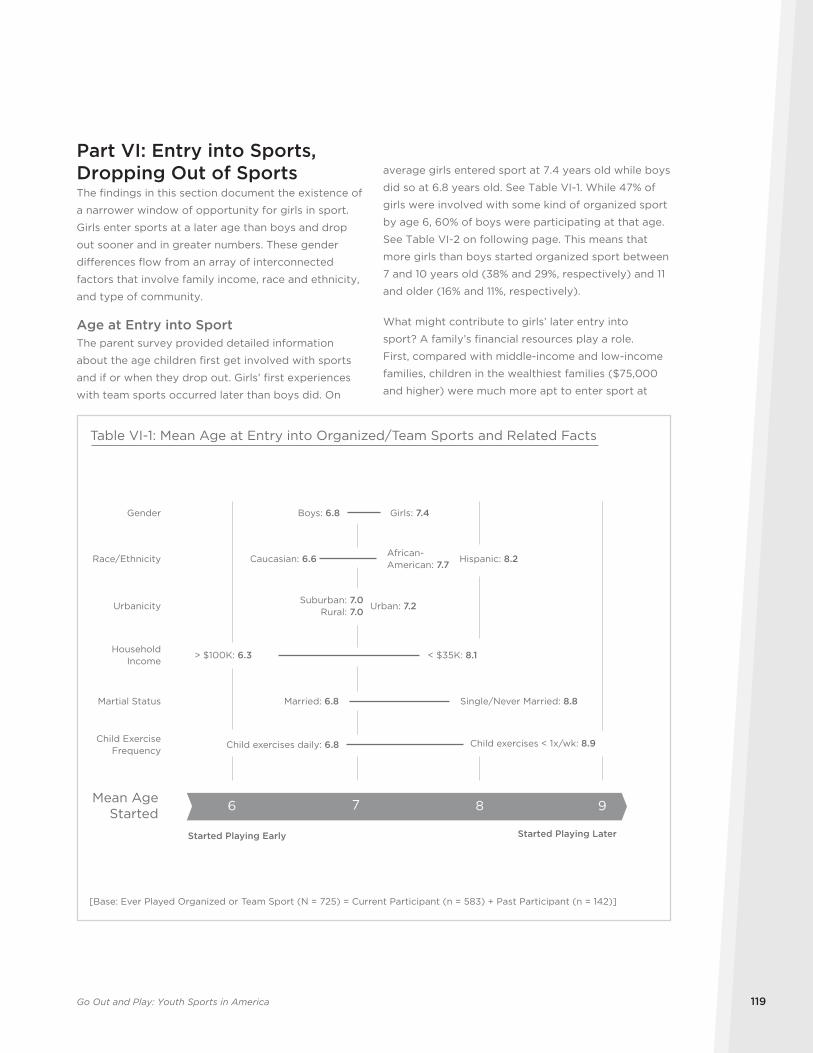
Go Out and Play: Youth Sports in America 119
average girls entered sport at 7.4 years old while boys
did so at 6.8 years old. See Table VI-1. While 47% of
girls were involved with some kind of organized sport
by age 6, 60% of boys were participating at that age.
See Table VI-2 on following page. This means that
more girls than boys started organized sport between
7 and 10 years old (38% and 29%, respectively) and 11
and older (16% and 11%, respectively).
What might contribute to girls’ later entry into
sport? A family’s financial resources play a role.
First, compared with middle-income and low-income
families, children in the wealthiest families ($75,000
and higher) were much more apt to enter sport at
Part VI: Entry into Sports, Dropping Out of SportsThe findings in this section document the existence of
a narrower window of opportunity for girls in sport.
Girls enter sports at a later age than boys and drop
out sooner and in greater numbers. These gender
differences flow from an array of interconnected
factors that involve family income, race and ethnicity,
and type of community.
Age at Entry into SportThe parent survey provided detailed information
about the age children first get involved with sports
and if or when they drop out. Girls’ first experiences
with team sports occurred later than boys did. On
9876
Boys: 6.8 Girls: 7.4
African-American: 7.7
Caucasian: 6.6 Hispanic: 8.2
Urban: 7.2Suburban: 7.0
Rural: 7.0
< $35K: 8.1> $100K: 6.3
Single/Never Married: 8.8 Married: 6.8
Gender
Urbanicity
Martial Status
Started Playing Early Started Playing Later
Table VI-1: Mean Age at Entry into Organized/Team Sports and Related Facts
Child ExerciseFrequency
[Base: Ever Played Organized or Team Sport (N = 725) = Current Participant (n = 583) + Past Participant (n = 142)]
HouseholdIncome
Race/Ethnicity
Child exercises < 1x/wk: 8.9Child exercises daily: 6.8
Mean AgeStarted
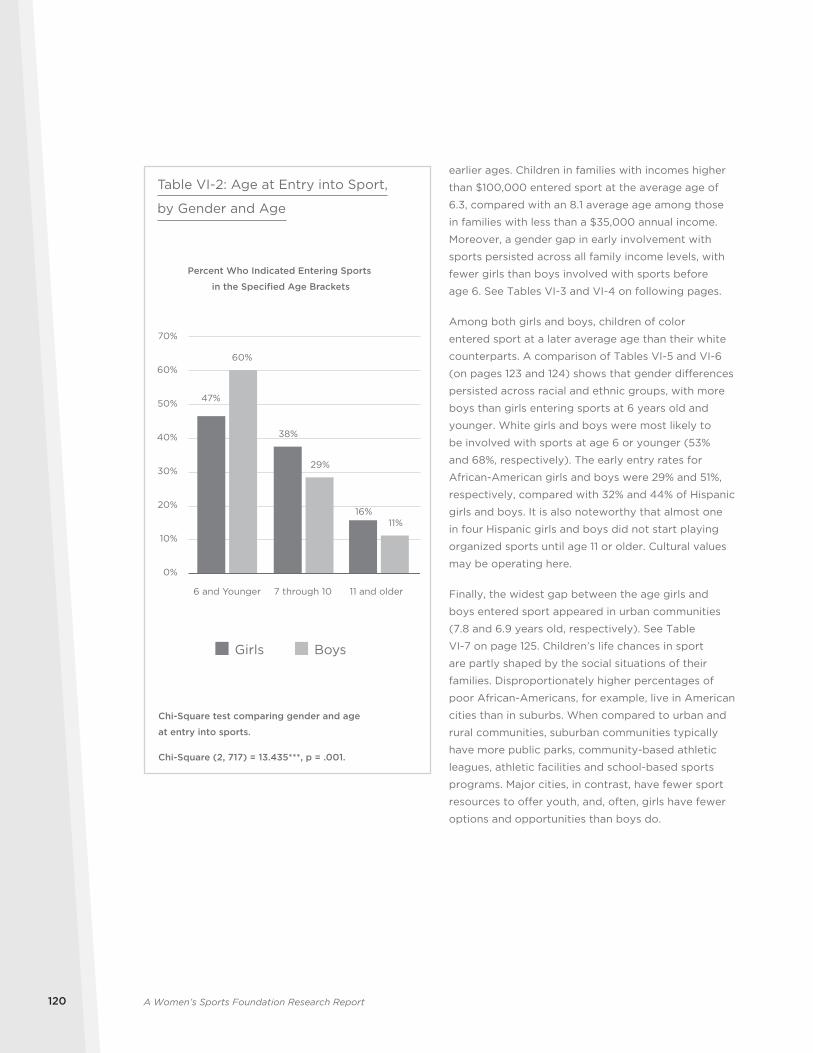
A Women’s Sports Foundation Research Report120
earlier ages. Children in families with incomes higher
than $100,000 entered sport at the average age of
6.3, compared with an 8.1 average age among those
in families with less than a $35,000 annual income.
Moreover, a gender gap in early involvement with
sports persisted across all family income levels, with
fewer girls than boys involved with sports before
age 6. See Tables VI-3 and VI-4 on following pages.
Among both girls and boys, children of color
entered sport at a later average age than their white
counterparts. A comparison of Tables VI-5 and VI-6
(on pages 123 and 124) shows that gender differences
persisted across racial and ethnic groups, with more
boys than girls entering sports at 6 years old and
younger. White girls and boys were most likely to
be involved with sports at age 6 or younger (53%
and 68%, respectively). The early entry rates for
African-American girls and boys were 29% and 51%,
respectively, compared with 32% and 44% of Hispanic
girls and boys. It is also noteworthy that almost one
in four Hispanic girls and boys did not start playing
organized sports until age 11 or older. Cultural values
may be operating here.
Finally, the widest gap between the age girls and
boys entered sport appeared in urban communities
(7.8 and 6.9 years old, respectively). See Table
VI-7 on page 125. Children’s life chances in sport
are partly shaped by the social situations of their
families. Disproportionately higher percentages of
poor African-Americans, for example, live in American
cities than in suburbs. When compared to urban and
rural communities, suburban communities typically
have more public parks, community-based athletic
leagues, athletic facilities and school-based sports
programs. Major cities, in contrast, have fewer sport
resources to offer youth, and, often, girls have fewer
options and opportunities than boys do.
Girls Boys
47%
38%
16%
60%
29%
11%
0%
10%
20%
30%
40%
50%
60%
70%
6 and Younger 7 through 10 11 and older
Percent Who Indicated Entering Sports
in the Specified Age Brackets
Table VI-2: Age at Entry into Sport,
by Gender and Age
Chi-Square test comparing gender and age
at entry into sports.
Chi-Square (2, 717) = 13.435***, p = .001.
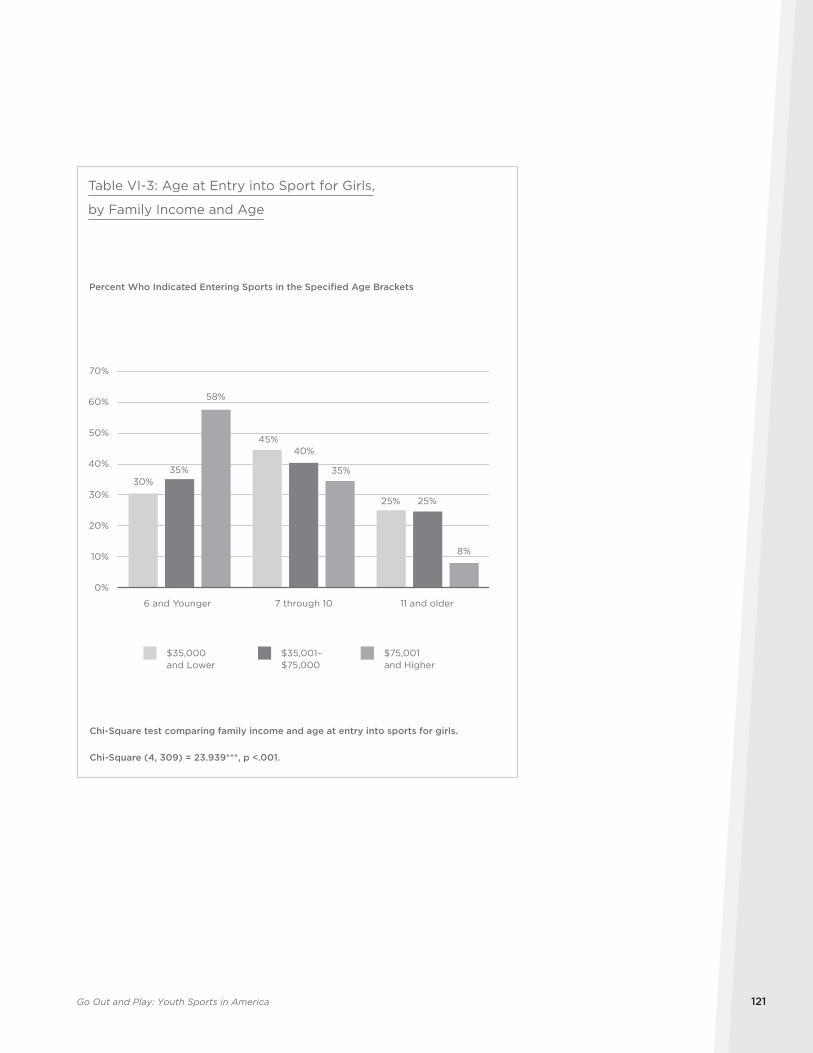
Go Out and Play: Youth Sports in America 121
30%
45%
25%
35%
40%
25%
58%
35%
8%
0%
10%
20%
30%
40%
50%
60%
70%
6 and Younger 7 through 10 11 and older
Percent Who Indicated Entering Sports in the Specified Age Brackets
$35,000 and Lower
$35,001– $75,000
$75,001 and Higher
Table VI-3: Age at Entry into Sport for Girls,
by Family Income and Age
Chi-Square test comparing family income and age at entry into sports for girls.
Chi-Square (4, 309) = 23.939***, p <.001.
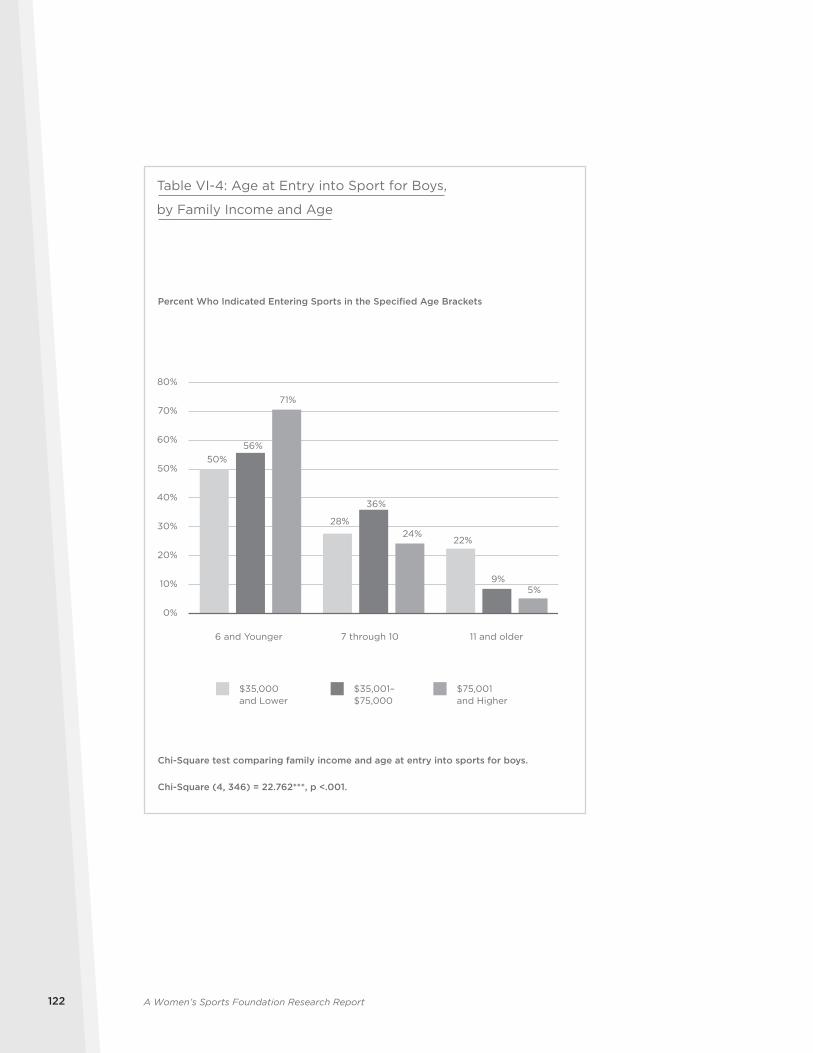
A Women’s Sports Foundation Research Report122
50%
28%
22%
56%
36%
9%
71%
24%
5%
0%
10%
20%
30%
40%
50%
60%
70%
80%
6 and Younger 7 through 10 11 and older
Percent Who Indicated Entering Sports in the Specified Age Brackets
Table VI-4: Age at Entry into Sport for Boys,
by Family Income and Age
Chi-Square test comparing family income and age at entry into sports for boys.
Chi-Square (4, 346) = 22.762***, p <.001.
$35,000 and Lower
$35,001–$75,000
$75,001 and Higher
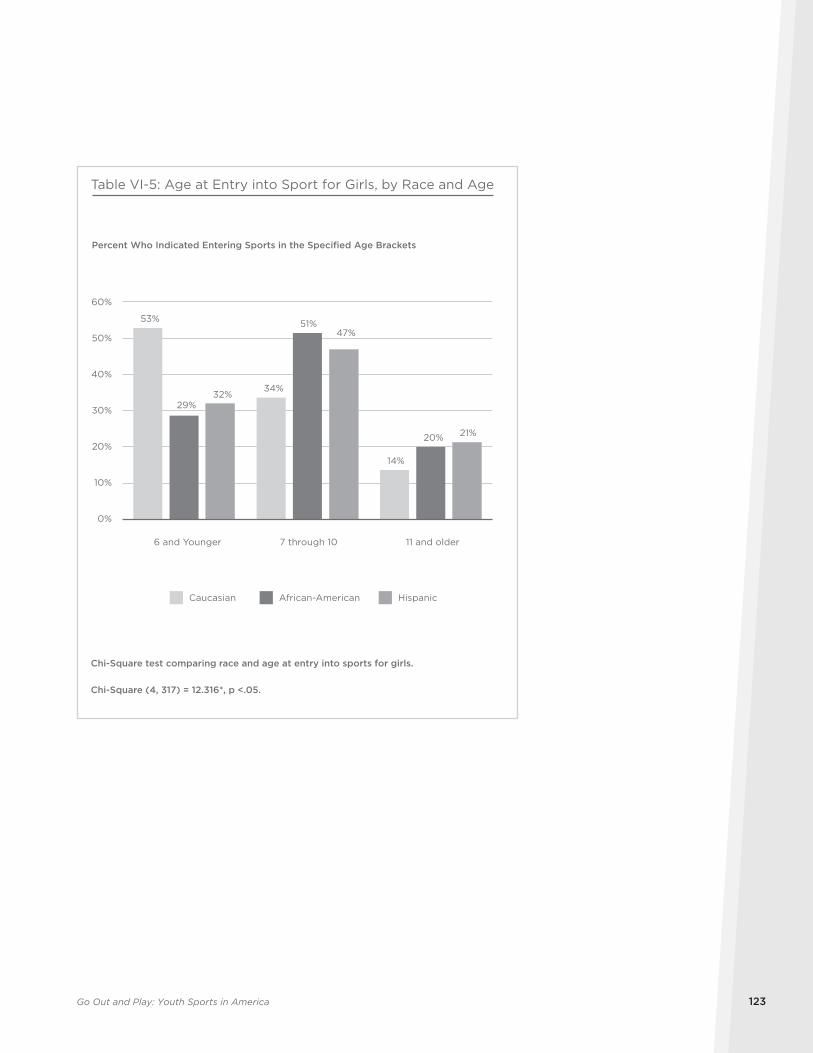
Go Out and Play: Youth Sports in America 123
53%
34%
14%
29%
51%
20%
32%
47%
21%
0%
10%
20%
30%
40%
50%
60%
6 and Younger 7 through 10 11 and older
Percent Who Indicated Entering Sports in the Specified Age Brackets
Caucasian African-American Hispanic
Table VI-5: Age at Entry into Sport for Girls, by Race and Age
Chi-Square test comparing race and age at entry into sports for girls.
Chi-Square (4, 317) = 12.316*, p <.05.
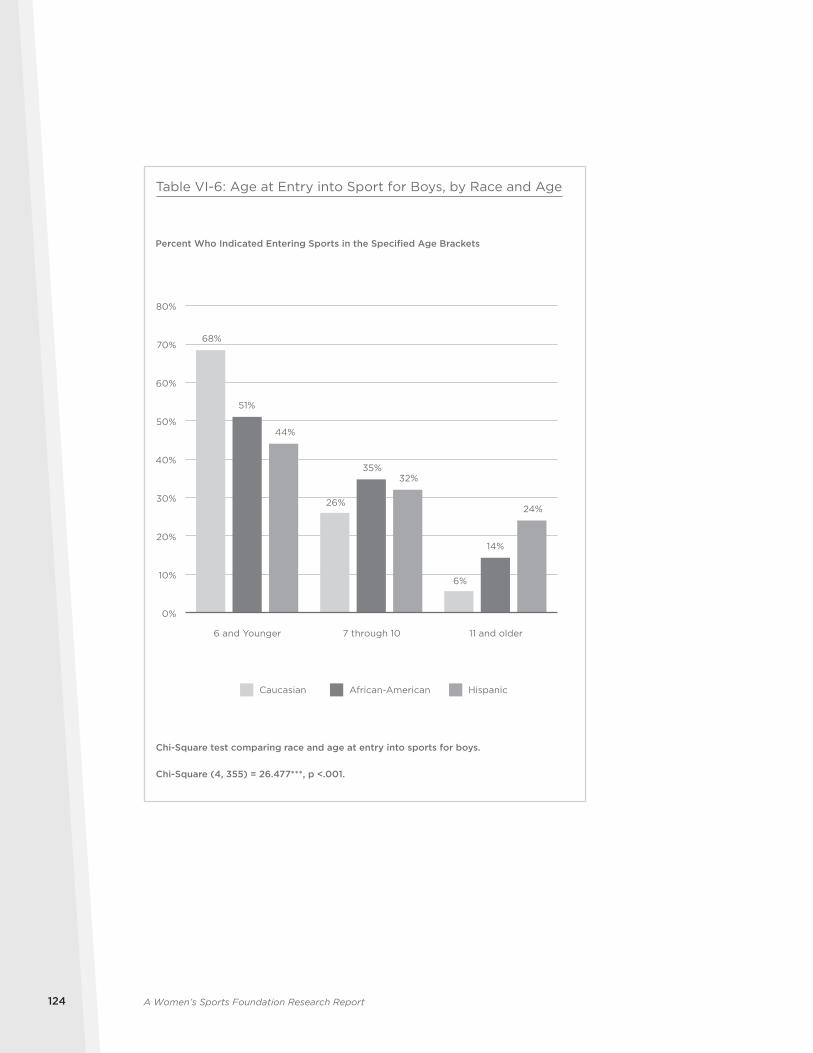
A Women’s Sports Foundation Research Report124
68%
26%
6%
51%
35%
14%
44%
32%
24%
0%
10%
20%
30%
40%
50%
60%
70%
80%
6 and Younger 7 through 10 11 and older
Percent Who Indicated Entering Sports in the Specified Age Brackets
Table VI-6: Age at Entry into Sport for Boys, by Race and Age
Chi-Square test comparing race and age at entry into sports for boys.
Chi-Square (4, 355) = 26.477***, p <.001.
Caucasian African-American Hispanic
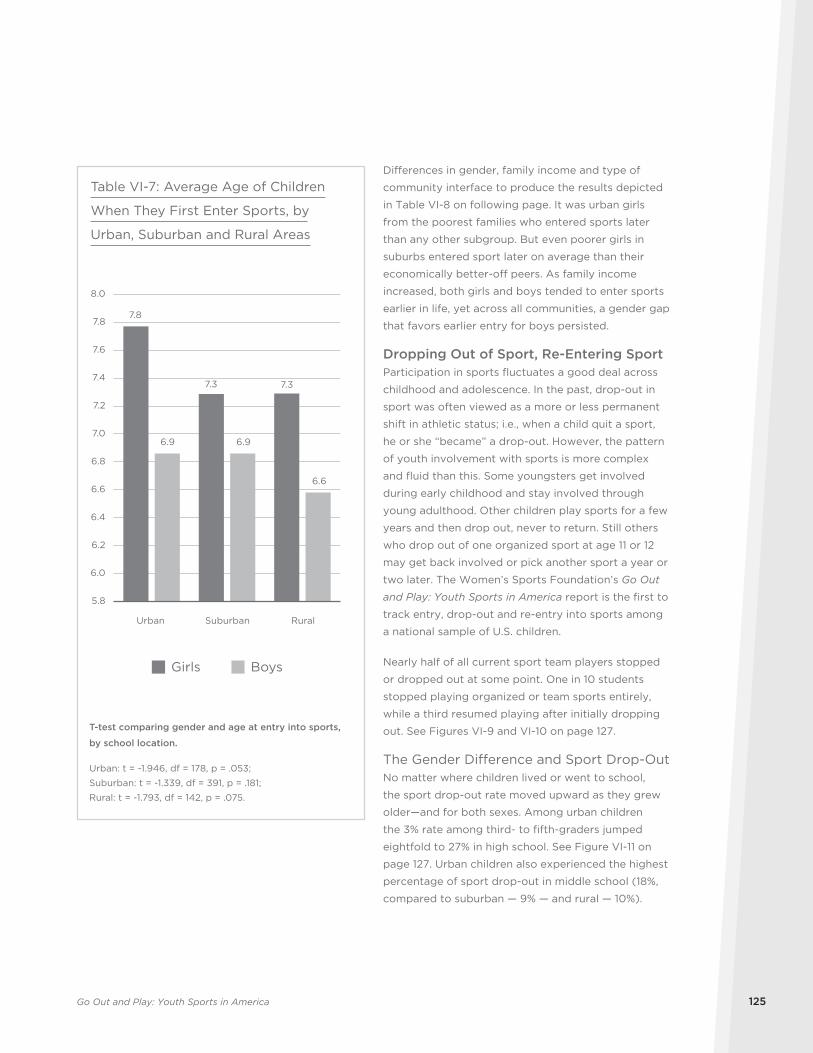
Go Out and Play: Youth Sports in America 125
Differences in gender, family income and type of
community interface to produce the results depicted
in Table VI-8 on following page. It was urban girls
from the poorest families who entered sports later
than any other subgroup. But even poorer girls in
suburbs entered sport later on average than their
economically better-off peers. As family income
increased, both girls and boys tended to enter sports
earlier in life, yet across all communities, a gender gap
that favors earlier entry for boys persisted.
Dropping Out of Sport, Re-Entering SportParticipation in sports fluctuates a good deal across
childhood and adolescence. In the past, drop-out in
sport was often viewed as a more or less permanent
shift in athletic status; i.e., when a child quit a sport,
he or she “became” a drop-out. However, the pattern
of youth involvement with sports is more complex
and fluid than this. Some youngsters get involved
during early childhood and stay involved through
young adulthood. Other children play sports for a few
years and then drop out, never to return. Still others
who drop out of one organized sport at age 11 or 12
may get back involved or pick another sport a year or
two later. The Women’s Sports Foundation’s Go Out
and Play: Youth Sports in America report is the first to
track entry, drop-out and re-entry into sports among
a national sample of U.S. children.
Nearly half of all current sport team players stopped
or dropped out at some point. One in 10 students
stopped playing organized or team sports entirely,
while a third resumed playing after initially dropping
out. See Figures VI-9 and VI-10 on page 127.
The Gender Difference and Sport Drop-OutNo matter where children lived or went to school,
the sport drop-out rate moved upward as they grew
older—and for both sexes. Among urban children
the 3% rate among third- to fifth-graders jumped
eightfold to 27% in high school. See Figure VI-11 on
page 127. Urban children also experienced the highest
percentage of sport drop-out in middle school (18%,
compared to suburban — 9% — and rural — 10%).
Girls Boys
7.8
7.3 7.3
6.9 6.9
6.6
5.8
6.0
6.2
6.4
6.6
6.8
7.0
7.2
7.4
7.6
7.8
8.0
Urban Suburban Rural
Table VI-7: Average Age of Children
When They First Enter Sports, by
Urban, Suburban and Rural Areas
T-test comparing gender and age at entry into sports,
by school location.
Urban: t = -1.946, df = 178, p = .053;
Suburban: t = -1.339, df = 391, p = .181;
Rural: t = -1.793, df = 142, p = .075.
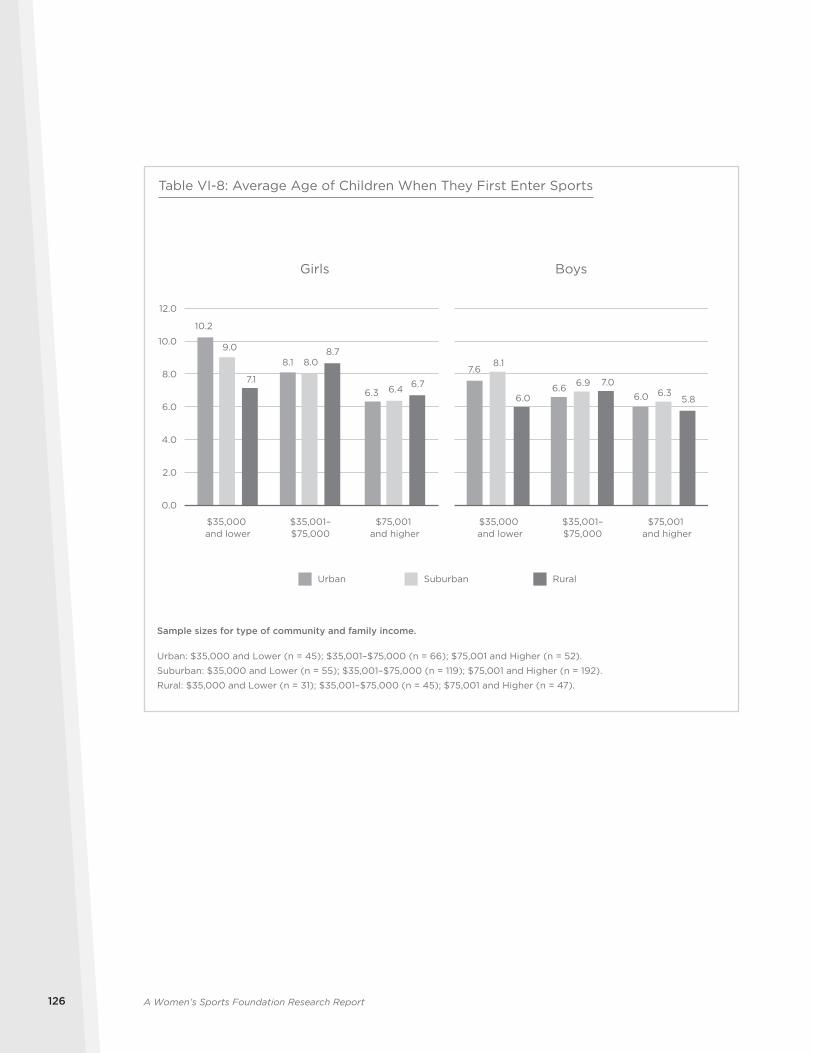
A Women’s Sports Foundation Research Report126
Urban Suburban Rural
Girls
10.2
9.0
7.1
8.1 8.08.7
6.3 6.4 6.7
0.0
2.0
4.0
6.0
8.0
10.0
12.0
Boys
7.68.1
6.06.6 6.9 7.0
6.0 6.35.8
$35,000 and lower
$75,001 and higher
Table VI-8: Average Age of Children When They First Enter Sports
Sample sizes for type of community and family income.
Urban: $35,000 and Lower (n = 45); $35,001–$75,000 (n = 66); $75,001 and Higher (n = 52).
Suburban: $35,000 and Lower (n = 55); $35,001–$75,000 (n = 119); $75,001 and Higher (n = 192).
Rural: $35,000 and Lower (n = 31); $35,001–$75,000 (n = 45); $75,001 and Higher (n = 47).
$35,001–$75,000
$35,000 and lower
$75,001 and higher
$35,001–$75,000
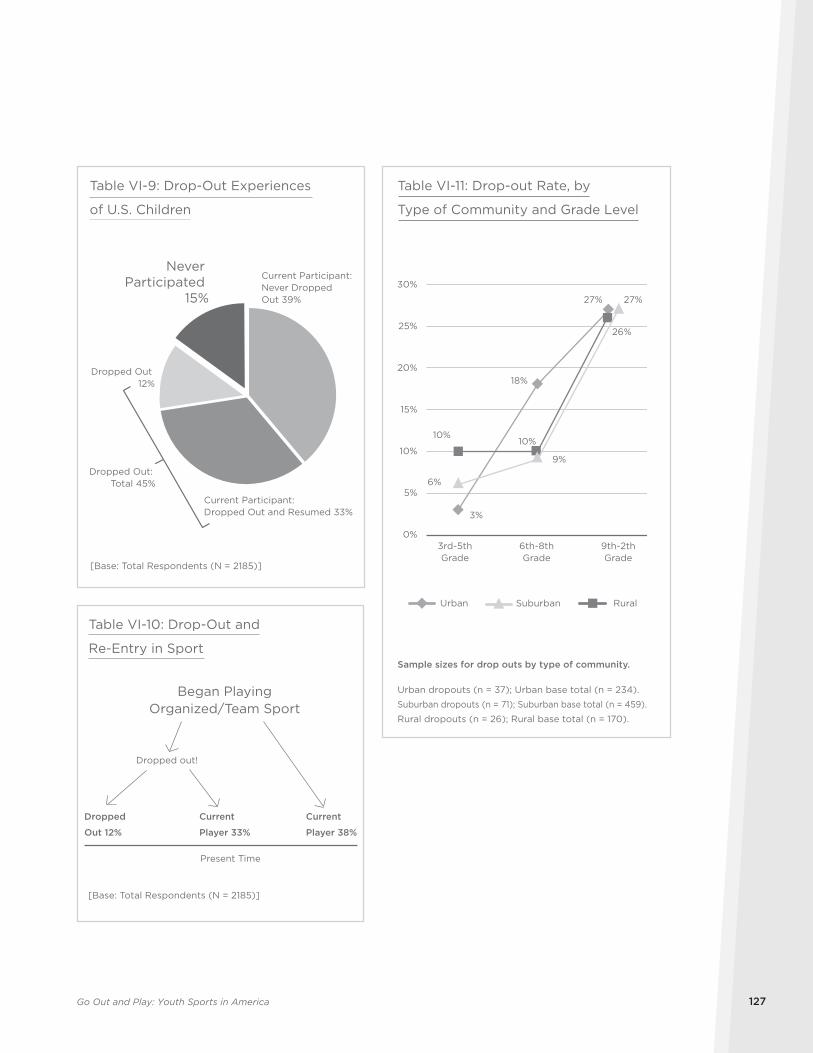
Go Out and Play: Youth Sports in America 127
Table VI-9: Drop-Out Experiences
of U.S. Children
Never Participated
15%
Current Participant: Never Dropped Out 39%
[Base: Total Respondents (N = 2185)]
Current Participant: Dropped Out and Resumed 33%
Dropped Out: Total 45%
Dropped Out 12%
Dropped out!
Table VI-10: Drop-Out and
Re-Entry in Sport
Began PlayingOrganized/Team Sport
[Base: Total Respondents (N = 2185)]
Present Time
Dropped
Out 12%
Current
Player 33%
Current
Player 38%
Urban RuralSuburban
3%
18%
27%
6%
9%
27%
10%10%
26%
0%
5%
10%
15%
20%
25%
30%
Table VI-11: Drop-out Rate, by
Type of Community and Grade Level
3rd-5thGrade
6th-8thGrade
9th-2thGrade
Sample sizes for drop outs by type of community.
Urban dropouts (n = 37); Urban base total (n = 234).
Suburban dropouts (n = 71); Suburban base total (n = 459).
Rural dropouts (n = 26); Rural base total (n = 170).
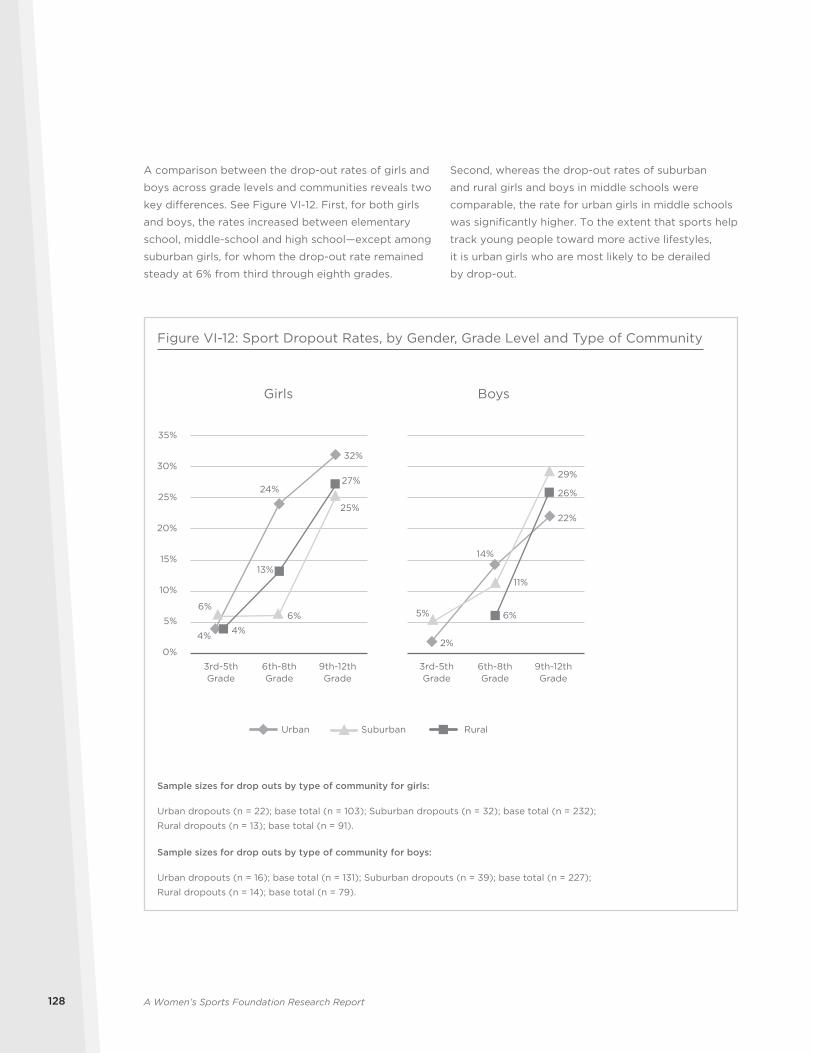
A Women’s Sports Foundation Research Report128
Second, whereas the drop-out rates of suburban
and rural girls and boys in middle schools were
comparable, the rate for urban girls in middle schools
was significantly higher. To the extent that sports help
track young people toward more active lifestyles,
it is urban girls who are most likely to be derailed
by drop-out.
A comparison between the drop-out rates of girls and
boys across grade levels and communities reveals two
key differences. See Figure VI-12. First, for both girls
and boys, the rates increased between elementary
school, middle-school and high school—except among
suburban girls, for whom the drop-out rate remained
steady at 6% from third through eighth grades.
Urban RuralSuburban
4%
24%
32%
2%
14%
22%
6%6%
25%
5%
11%
29%
4%
13%
27%
6%
26%
0%
5%
10%
15%
20%
25%
35%
30%
Girls Boys
3rd-5thGrade
6th-8thGrade
9th-12thGrade
3rd-5thGrade
6th-8thGrade
9th-12thGrade
Figure VI-12: Sport Dropout Rates, by Gender, Grade Level and Type of Community
Sample sizes for drop outs by type of community for girls:
Urban dropouts (n = 22); base total (n = 103); Suburban dropouts (n = 32); base total (n = 232);
Rural dropouts (n = 13); base total (n = 91).
Sample sizes for drop outs by type of community for boys:
Urban dropouts (n = 16); base total (n = 131); Suburban dropouts (n = 39); base total (n = 227);
Rural dropouts (n = 14); base total (n = 79).
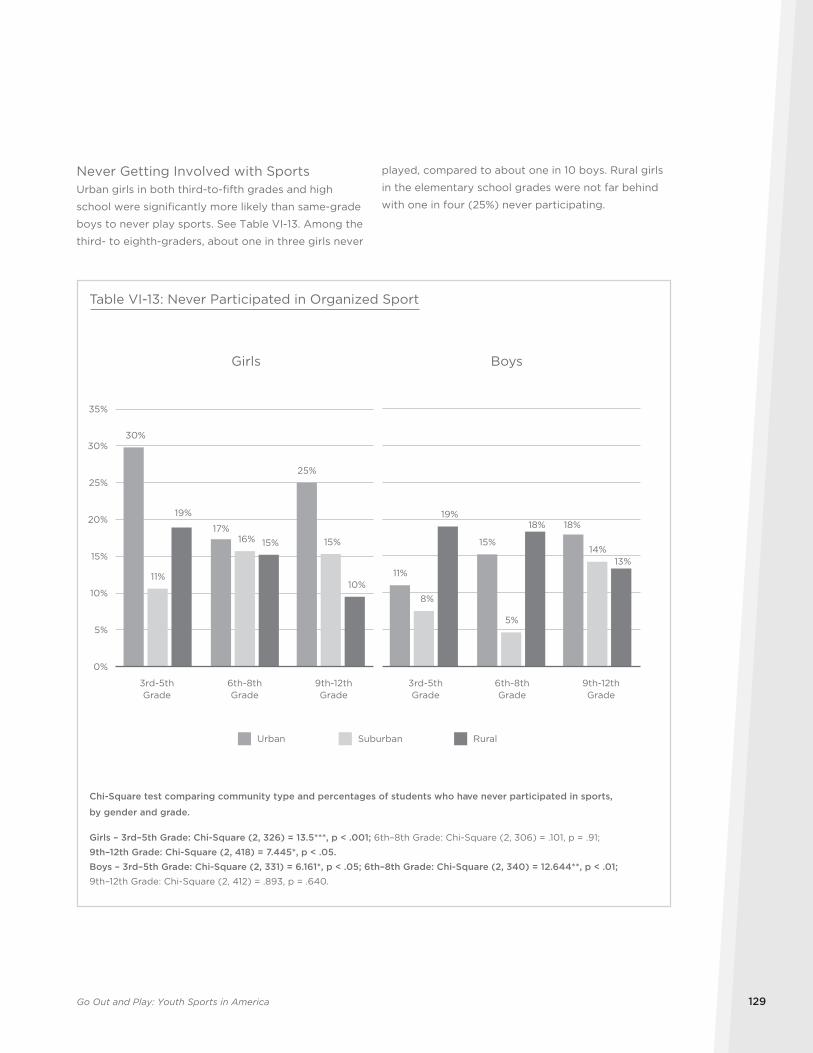
Go Out and Play: Youth Sports in America 129
played, compared to about one in 10 boys. Rural girls
in the elementary school grades were not far behind
with one in four (25%) never participating.
Never Getting Involved with SportsUrban girls in both third-to-fifth grades and high
school were significantly more likely than same-grade
boys to never play sports. See Table VI-13. Among the
third- to eighth-graders, about one in three girls never
Girls
30%
17%
25%
11%
16% 15%
19%
15%
10%
0%
5%
10%
15%
20%
25%
30%
35%
Urban Suburban Rural
Boys
11%
15%
18%
8%
5%
14%
19%18%
13%
3rd-5thGrade
6th-8thGrade
9th-12thGrade
3rd-5thGrade
6th-8thGrade
9th-12thGrade
Table VI-13: Never Participated in Organized Sport
Chi-Square test comparing community type and percentages of students who have never participated in sports,
by gender and grade.
Girls – 3rd–5th Grade: Chi-Square (2, 326) = 13.5***, p < .001; 6th–8th Grade: Chi-Square (2, 306) = .101, p = .91;
9th–12th Grade: Chi-Square (2, 418) = 7.445*, p < .05.Boys – 3rd–5th Grade: Chi-Square (2, 331) = 6.161*, p < .05; 6th–8th Grade: Chi-Square (2, 340) = 12.644**, p < .01; 9th–12th Grade: Chi-Square (2, 412) = .893, p = .640.

A Women’s Sports Foundation Research Report130
Four groups of reasons emerged why students
dropped out of organized or team sports: family/
money reasons, health problems, interest in other
activities and finding that sports are not enjoyable.
Tables VI-15 through VI-18 (on pages 131 to 134)
present a variety of basic findings that pertain to
grade level, race and ethnicity, and whether students
had dropped out and later returned to sport. Older
girls were more likely to stop sports in order to get a
job or to care for younger siblings.
Finally, the parent survey queried fathers and mothers
about why their child had dropped out of sports.
“It was no longer fun” topped the list of parental
explanations for both daughters and sons. Too much
competition and not being “good enough” were
Students State Their Reasons for Dropping OutIf students indicated that they had once stopped
playing an organized or team sport, then they
checked “yes” or “no” to a list of 16 reasons for
dropping out. They were also invited to write in “some
other reason” not on the list, which were later coded.
Not having fun was the main reason students dropped
out of organized sports. See Table VI-14. More girls
than boys also stopped playing in order to focus on
academics. Injuries were often cited by both girls
and boys. While 22% of girls “wanted to focus more
on other clubs or activities,” this was not a reason
among boys.
38% 39%
36% 29%
27% 26%
22% 22%
18% 18%
16% 16%
15% 15%
14% 12%
Girls Boys
Multiple Response
Table VI-14: Top Reasons Dropped Out Or Stopped Playing
Organized/Team Sports
Q36 Is each of the following statements a reason why you stopped or dropped out of playing
an organized or team sport? [Multiple Response]
[Base: Played on an Organized/Team SportBut At Some Point Have Stopped (N=986);
Girl (N=537); Boy (N=443)]
I was not having fun
I wanted to focus more on studying and grades
I had a health problem or injury
I wanted to focus more on other clubs or activities
I did not like or get along with the coach
I did not like or get along with others on the team
I was not a good enough player
My family worried about me getting hurt or injured while playing sports
I was not having fun
I had a health problem or injury
I wanted to focus more on studying and grades
I did not like or get along with the coach
I wanted to focus more on other clubs or activities
I did not like or get along with others on the team
I was not a good enough player
My family worried about me getting hurt or injured while playing sports
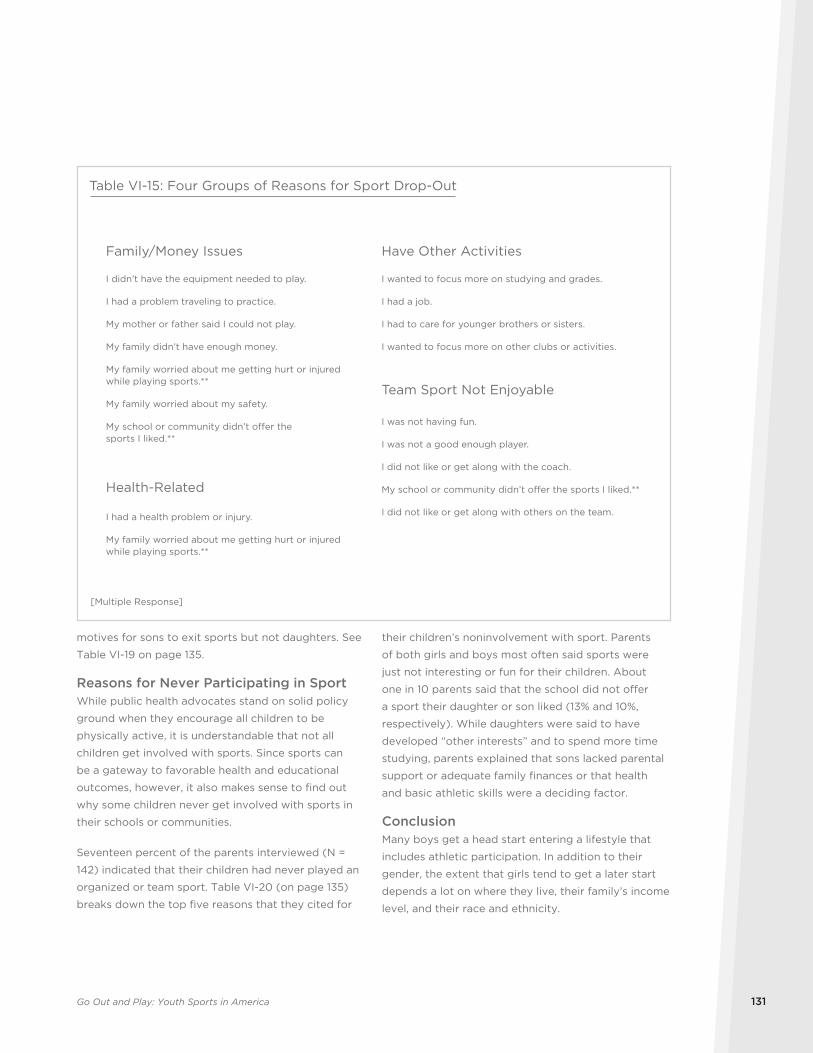
Go Out and Play: Youth Sports in America 131
their children’s noninvolvement with sport. Parents
of both girls and boys most often said sports were
just not interesting or fun for their children. About
one in 10 parents said that the school did not offer
a sport their daughter or son liked (13% and 10%,
respectively). While daughters were said to have
developed “other interests” and to spend more time
studying, parents explained that sons lacked parental
support or adequate family finances or that health
and basic athletic skills were a deciding factor.
ConclusionMany boys get a head start entering a lifestyle that
includes athletic participation. In addition to their
gender, the extent that girls tend to get a later start
depends a lot on where they live, their family’s income
level, and their race and ethnicity.
motives for sons to exit sports but not daughters. See
Table VI-19 on page 135.
Reasons for Never Participating in SportWhile public health advocates stand on solid policy
ground when they encourage all children to be
physically active, it is understandable that not all
children get involved with sports. Since sports can
be a gateway to favorable health and educational
outcomes, however, it also makes sense to find out
why some children never get involved with sports in
their schools or communities.
Seventeen percent of the parents interviewed (N =
142) indicated that their children had never played an
organized or team sport. Table VI-20 (on page 135)
breaks down the top five reasons that they cited for
Family/Money Issues
Health-Related
Have Other Activities
Team Sport Not Enjoyable
Table VI-15: Four Groups of Reasons for Sport Drop-Out
I didn’t have the equipment needed to play.
I had a problem traveling to practice.
My mother or father said I could not play.
My family didn’t have enough money.
My family worried about me getting hurt or injured while playing sports.**
My family worried about my safety.
My school or community didn’t offer the sports I liked.**
I had a health problem or injury.
My family worried about me getting hurt or injured while playing sports.**
[Multiple Response]
I wanted to focus more on studying and grades.
I had a job.
I had to care for younger brothers or sisters.
I wanted to focus more on other clubs or activities.
I was not having fun.
I was not a good enough player.
I did not like or get along with the coach.
My school or community didn’t offer the sports I liked.**
I did not like or get along with others on the team.
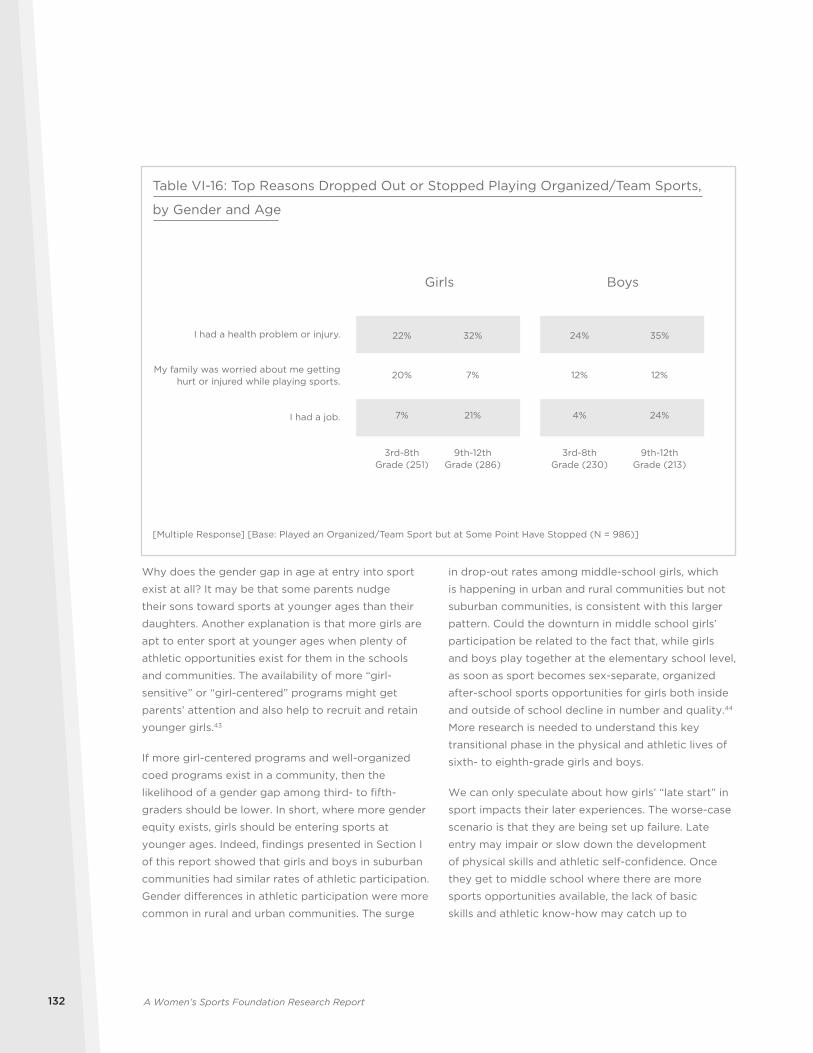
A Women’s Sports Foundation Research Report132
in drop-out rates among middle-school girls, which
is happening in urban and rural communities but not
suburban communities, is consistent with this larger
pattern. Could the downturn in middle school girls’
participation be related to the fact that, while girls
and boys play together at the elementary school level,
as soon as sport becomes sex-separate, organized
after-school sports opportunities for girls both inside
and outside of school decline in number and quality.44
More research is needed to understand this key
transitional phase in the physical and athletic lives of
sixth- to eighth-grade girls and boys.
We can only speculate about how girls’ “late start” in
sport impacts their later experiences. The worse-case
scenario is that they are being set up failure. Late
entry may impair or slow down the development
of physical skills and athletic self-confidence. Once
they get to middle school where there are more
sports opportunities available, the lack of basic
skills and athletic know-how may catch up to
Why does the gender gap in age at entry into sport
exist at all? It may be that some parents nudge
their sons toward sports at younger ages than their
daughters. Another explanation is that more girls are
apt to enter sport at younger ages when plenty of
athletic opportunities exist for them in the schools
and communities. The availability of more “girl-
sensitive” or “girl-centered” programs might get
parents’ attention and also help to recruit and retain
younger girls.43
If more girl-centered programs and well-organized
coed programs exist in a community, then the
likelihood of a gender gap among third- to fifth-
graders should be lower. In short, where more gender
equity exists, girls should be entering sports at
younger ages. Indeed, findings presented in Section I
of this report showed that girls and boys in suburban
communities had similar rates of athletic participation.
Gender differences in athletic participation were more
common in rural and urban communities. The surge
Girls Boys
I had a health problem or injury. 22% 32% 24% 35%
20% 7% 12% 12%
I had a job. 7% 21% 4% 24%
Table VI-16: Top Reasons Dropped Out or Stopped Playing Organized/Team Sports,
by Gender and Age
[Multiple Response] [Base: Played an Organized/Team Sport but at Some Point Have Stopped (N = 986)]
My family was worried about me gettinghurt or injured while playing sports.
9th-12thGrade (286)
3rd-8thGrade (251)
9th-12thGrade (213)
3rd-8thGrade (230)
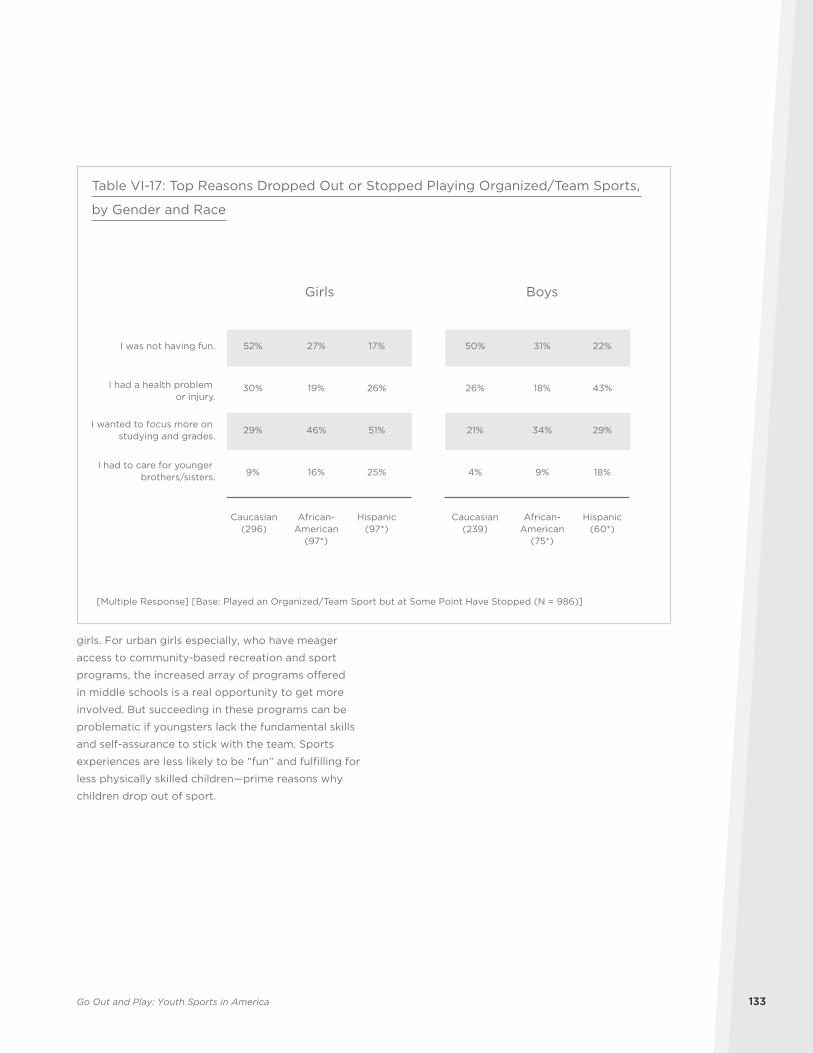
Go Out and Play: Youth Sports in America 133
girls. For urban girls especially, who have meager
access to community-based recreation and sport
programs, the increased array of programs offered
in middle schools is a real opportunity to get more
involved. But succeeding in these programs can be
problematic if youngsters lack the fundamental skills
and self-assurance to stick with the team. Sports
experiences are less likely to be “fun” and fulfilling for
less physically skilled children—prime reasons why
children drop out of sport.
Girls Boys
I was not having fun. 52% 27% 17% 50% 31% 22%
I had a health problem or injury.
30% 19% 26% 26% 18% 43%
29% 46% 51% 21% 34% 29%
I had to care for younger brothers/sisters. 9% 16% 25% 4% 9% 18%
Table VI-17: Top Reasons Dropped Out or Stopped Playing Organized/Team Sports,
by Gender and Race
[Multiple Response] [Base: Played an Organized/Team Sport but at Some Point Have Stopped (N = 986)]
I wanted to focus more on studying and grades.
Caucasian(296)
African-American
(97*)
Hispanic(97*)
Caucasian(239)
African-American
(75*)
Hispanic(60*)
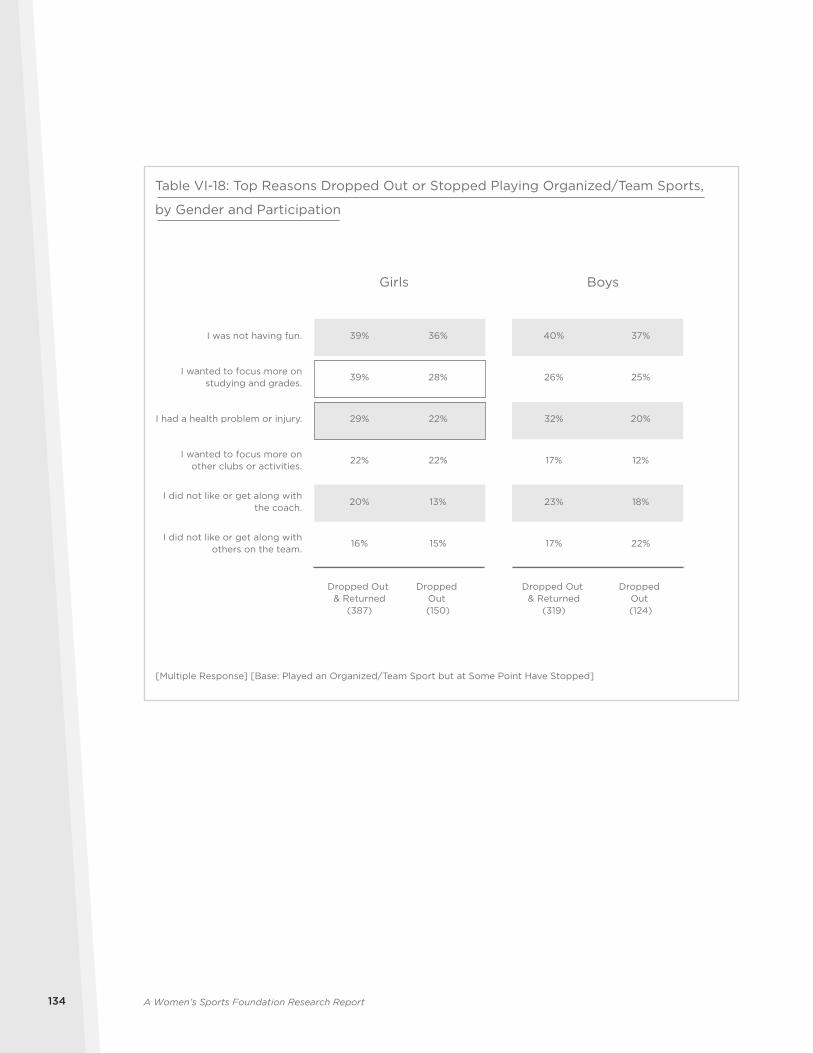
A Women’s Sports Foundation Research Report134
Girls Boys
I was not having fun. 39% 36% 40% 37%
39% 28% 26% 25%
I had a health problem or injury. 29% 22% 32% 20%
22% 22% 17% 12%
20% 13% 23% 18%
16% 15% 17% 22%
Table VI-18: Top Reasons Dropped Out or Stopped Playing Organized/Team Sports,
by Gender and Participation
[Multiple Response] [Base: Played an Organized/Team Sport but at Some Point Have Stopped]
I wanted to focus more onstudying and grades.
I wanted to focus more onother clubs or activities.
I did not like or get along withthe coach.
I did not like or get along withothers on the team.
Dropped Out & Returned
(387)
Dropped Out (150)
Dropped Out & Returned
(319)
Dropped Out (124)
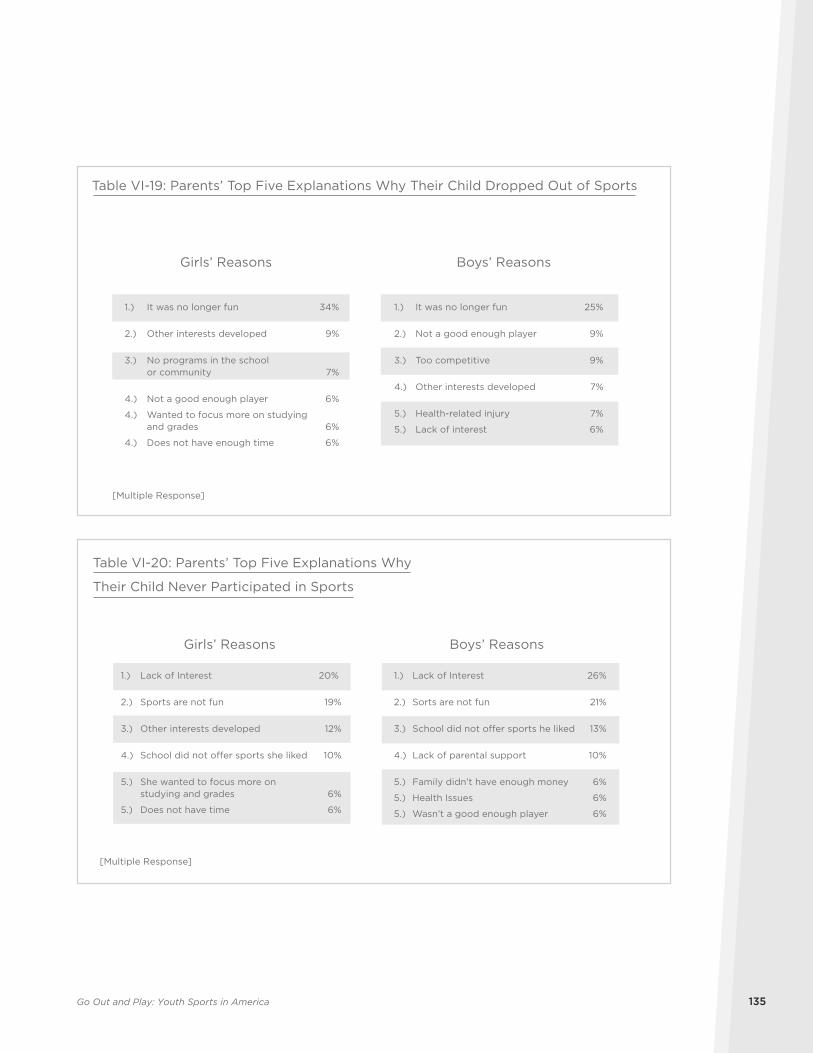
Go Out and Play: Youth Sports in America 135
Boys’ Reasons
Table VI-19: Parents’ Top Five Explanations Why Their Child Dropped Out of Sports
Girls’ Reasons
1.) It was no longer fun 34%
2.) Other interests developed 9%
3.) No programs in the school or community 7%
4.) Not a good enough player 6%
4.) Wanted to focus more on studying and grades 6%
4.) Does not have enough time 6%
1.) It was no longer fun 25%
2.) Not a good enough player 9%
3.) Too competitive 9%
4.) Other interests developed 7%
5.) Health-related injury 7%
5.) Lack of interest 6%
[Multiple Response]
Boys’ Reasons
Table VI-20: Parents’ Top Five Explanations Why
Their Child Never Participated in Sports
Girls’ Reasons
1.) Lack of Interest 20%
2.) Sports are not fun 19%
3.) Other interests developed 12%
4.) School did not o�er sports she liked 10%
5.) She wanted to focus more on studying and grades 6%
5.) Does not have time 6%
1.) Lack of Interest 26%
2.) Sorts are not fun 21%
3.) School did not o�er sports he liked 13%
4.) Lack of parental support 10%
5.) Family didn’t have enough money 6%
5.) Health Issues 6%
5.) Wasn’t a good enough player 6%
[Multiple Response]

A Women’s Sports Foundation Research Report136
community sports. Nearly half (49%) of Hispanic
parents also indicated that sport program offerings
for boys outnumber those provided to girls.
School LocationMore parents with children in urban and rural schools
said that their schools and communities fall short of
equal treatment for girls in sports. See Table VII-4
on page 140. Some previous findings in this report
revealed that the gender gap in athletic participation
is especially wide in urban schools, and so the fact
that more than four out of 10 parents see gender
inequity at play makes sense in this context. More
research is needed to understand why so many urban
and rural parents feel their daughters’ involvement
with sports is being devalued.
ConclusionFor substantial numbers of parents across the United
States, the proverbial “glass” of gender equity in
school and community sports is half-empty rather
than half-full. Similar numbers of mothers and fathers
report gender inequities, more people of color than
whites are concerned about lack of opportunity
for their daughters, and parents in lower-income
families see the greatest degree of unequal treatment
between girls and boys. Finally, to the extent that
these parental attitudes reflect the “realities on the
ground” in school and community sports, it appears
that urban and rural schools have the most work to
do in order to more fully meet the athletic needs and
interests of girls.
Part VII: Are We There Yet? Gender Equity In Sports “Are we there yet?” Impatient children often ask
this question from the backseats of cars en route to
distant destinations. Many parents, educators and
advocates for women’s sports ask the same question
about gender equity in athletics. How many parents
see an equal playing field with regard to gender and
youth sports? Do parents believe that schools and
communities provide similar athletic opportunities for
their daughters and sons? To what extent do their
views of gender equity vary by school location, family
income, and race or ethnicity?
Parents Assess Gender EquityThe results show that while progress toward gender
equity in sport has been made, equal opportunity
in children’s sports is not yet a reality in the eyes of
many parents. While a majority of parents agreed
that girls get a fair shake from sports in the schools
and communities, many felt that boys receive
preferential treatment.
Parents were asked to respond to two statements
that reflect perceptions of gender equity in sport.
Forty-two percent of mothers and 36% of fathers
agreed that “My community offers more sports
programs for boys than girls.” Similarly, more than
one-third (39%) of mothers and 37% of fathers agreed
that “The schools in my community care more about
boys’ sports programs than girls’ sports programs.”
See Table VII-1 on following page.
Income, Race and EthnicityMore parents in lower-income families indicated that
girls were not getting similar support and resources in
athletics as boys. Half of low-income parents agreed
that their schools and communities were not meeting
the needs of girls as much as those of boys, compared
with about one-third of middle- and upper-income
parents. See Table VII-2 on page 138.
Parental views of fair treatment for girls in sport
also varied by race and ethnicity. See Table VII-3 on
page 139. African-American parents were especially
likely to identify gender bias operating in school and
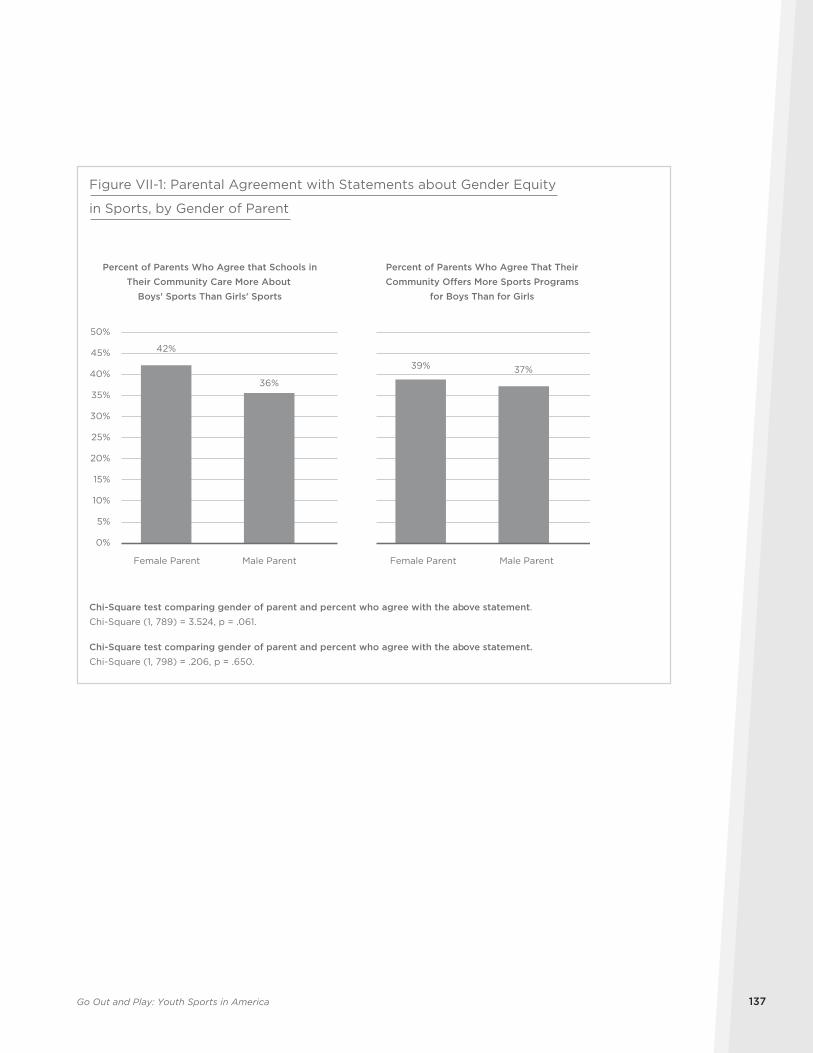
Go Out and Play: Youth Sports in America 137
42%
36%
0%
5%
10%
15%
20%
25%
30%
35%
40%
45%
50%
Female Parent Male Parent
39% 37%
Female Parent Male Parent
Figure VII-1: Parental Agreement with Statements about Gender Equity
in Sports, by Gender of Parent
Percent of Parents Who Agree that Schools in
Their Community Care More About
Boys' Sports Than Girls' Sports
Percent of Parents Who Agree That Their
Community Offers More Sports Programs
for Boys Than for Girls
Chi-Square test comparing gender of parent and percent who agree with the above statement.
Chi-Square (1, 789) = 3.524, p = .061.
Chi-Square test comparing gender of parent and percent who agree with the above statement.
Chi-Square (1, 798) = .206, p = .650.
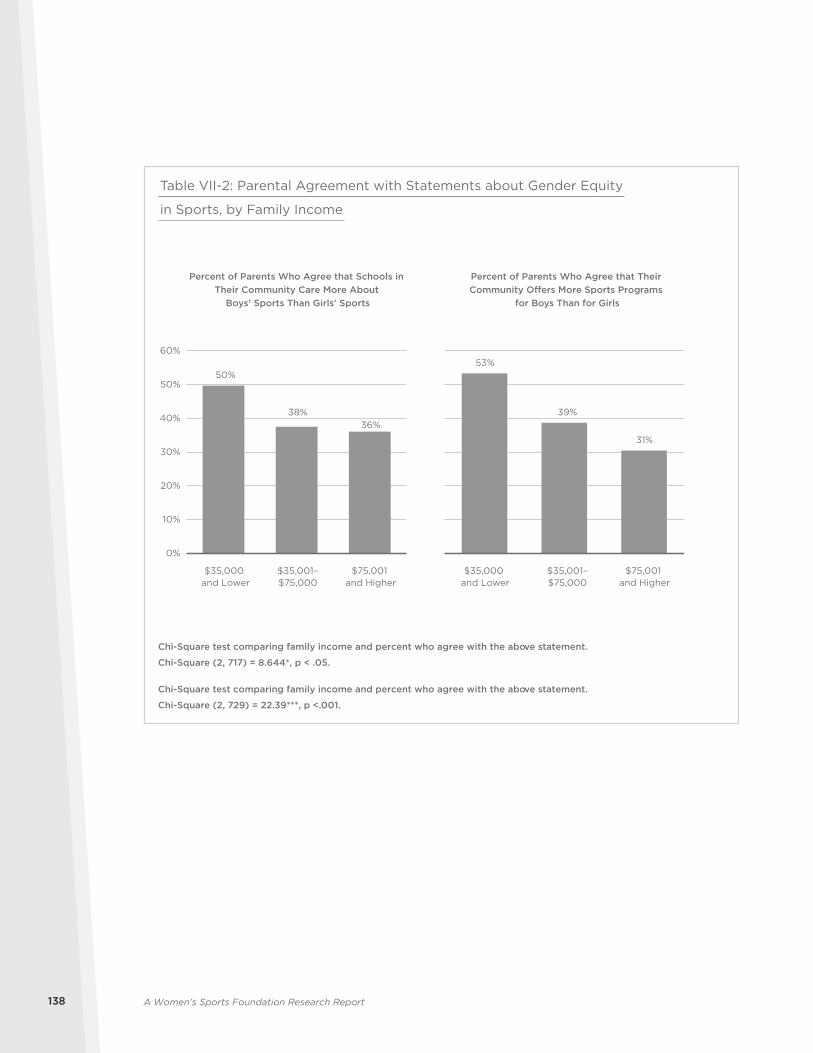
A Women’s Sports Foundation Research Report138
50%
38%36%
0%
10%
20%
30%
40%
50%
60%53%
39%
31%
Table VII-2: Parental Agreement with Statements about Gender Equity
in Sports, by Family Income
Percent of Parents Who Agree that Schools in Their Community Care More About
Boys' Sports Than Girls' Sports
Percent of Parents Who Agree that Their Community Offers More Sports Programs
for Boys Than for Girls
Chi-Square test comparing family income and percent who agree with the above statement.
Chi-Square (2, 717) = 8.644*, p < .05.
Chi-Square test comparing family income and percent who agree with the above statement.
Chi-Square (2, 729) = 22.39***, p <.001.
$35,000 and Lower
$35,001–$75,000
$75,001 and Higher
$35,000 and Lower
$35,001–$75,000
$75,001 and Higher
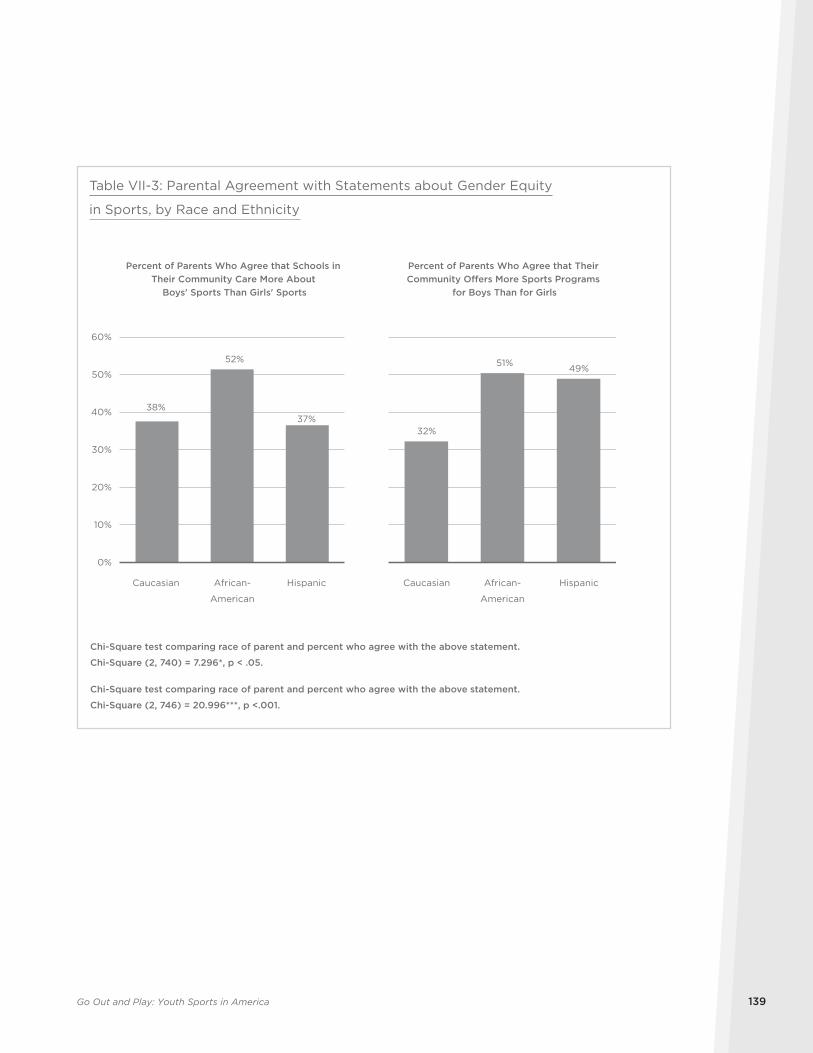
Go Out and Play: Youth Sports in America 139
38%
52%
37%
0%
10%
20%
30%
40%
50%
60%
Caucasian African-
American
Hispanic Caucasian African-
American
Hispanic
32%
51%49%
Table VII-3: Parental Agreement with Statements about Gender Equity
in Sports, by Race and Ethnicity
Percent of Parents Who Agree that Schools in Their Community Care More About
Boys' Sports Than Girls' Sports
Percent of Parents Who Agree that Their Community Offers More Sports Programs
for Boys Than for Girls
Chi-Square test comparing race of parent and percent who agree with the above statement.
Chi-Square (2, 740) = 7.296*, p < .05.
Chi-Square test comparing race of parent and percent who agree with the above statement.
Chi-Square (2, 746) = 20.996***, p <.001.
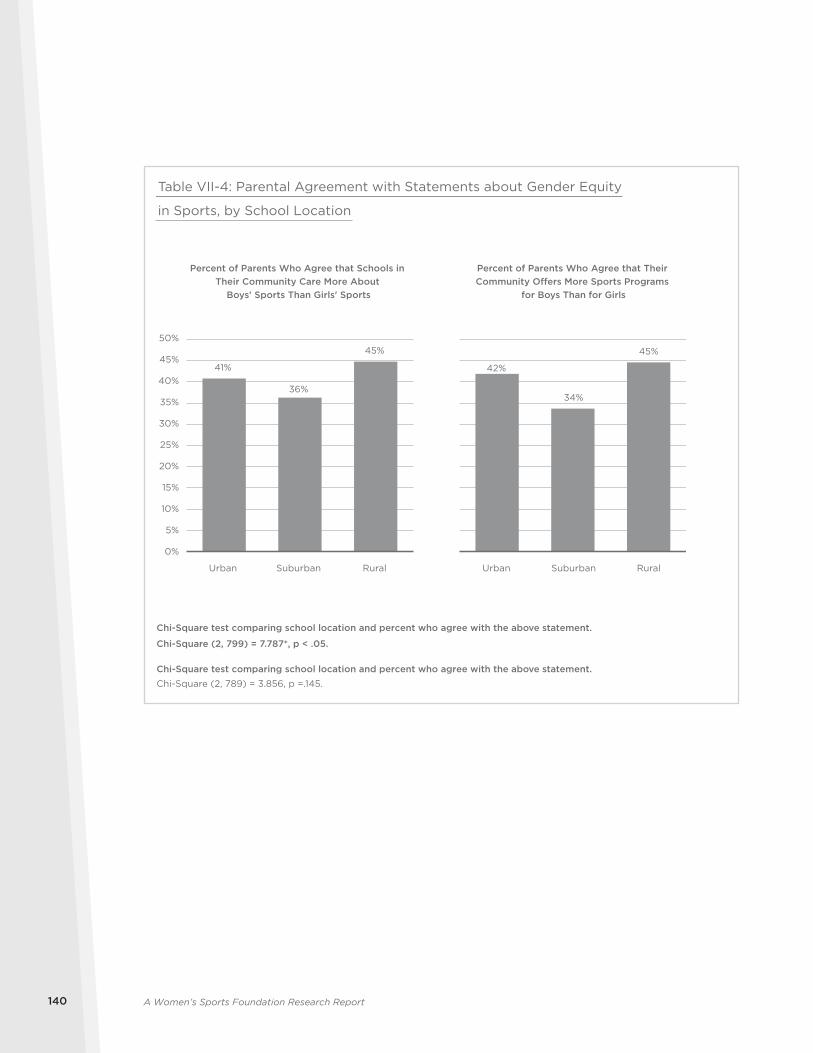
A Women’s Sports Foundation Research Report140
41%
36%
45%
0%
5%
10%
15%
20%
25%
30%
35%
40%
45%
50%
Urban Suburban Rural Urban Suburban Rural
42%
34%
45%
Table VII-4: Parental Agreement with Statements about Gender Equity
in Sports, by School Location
Percent of Parents Who Agree that Schools in Their Community Care More About
Boys' Sports Than Girls' Sports
Percent of Parents Who Agree that Their Community Offers More Sports Programs
for Boys Than for Girls
Chi-Square test comparing school location and percent who agree with the above statement.
Chi-Square (2, 799) = 7.787*, p < .05.
Chi-Square test comparing school location and percent who agree with the above statement.
Chi-Square (2, 789) = 3.856, p =.145.
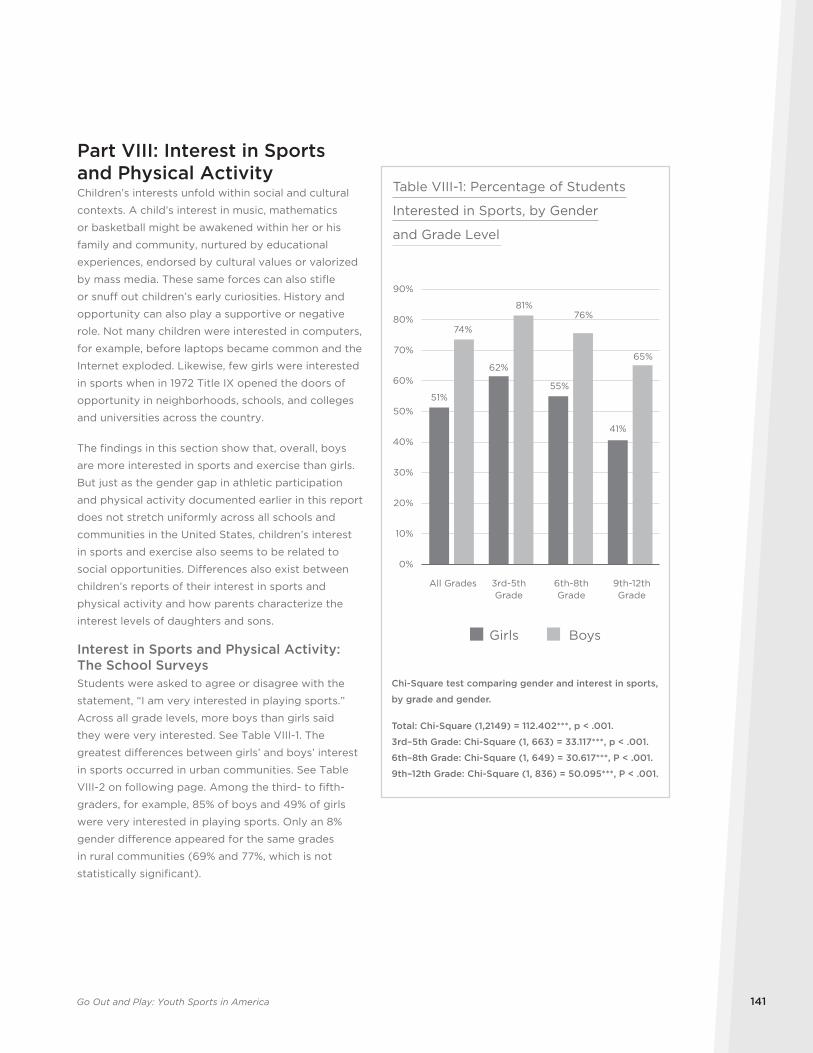
Go Out and Play: Youth Sports in America 141
Part VIII: Interest in Sports and Physical ActivityChildren’s interests unfold within social and cultural
contexts. A child’s interest in music, mathematics
or basketball might be awakened within her or his
family and community, nurtured by educational
experiences, endorsed by cultural values or valorized
by mass media. These same forces can also stifle
or snuff out children’s early curiosities. History and
opportunity can also play a supportive or negative
role. Not many children were interested in computers,
for example, before laptops became common and the
Internet exploded. Likewise, few girls were interested
in sports when in 1972 Title IX opened the doors of
opportunity in neighborhoods, schools, and colleges
and universities across the country.
The findings in this section show that, overall, boys
are more interested in sports and exercise than girls.
But just as the gender gap in athletic participation
and physical activity documented earlier in this report
does not stretch uniformly across all schools and
communities in the United States, children’s interest
in sports and exercise also seems to be related to
social opportunities. Differences also exist between
children’s reports of their interest in sports and
physical activity and how parents characterize the
interest levels of daughters and sons.
Interest in Sports and Physical Activity: The School SurveysStudents were asked to agree or disagree with the
statement, “I am very interested in playing sports.”
Across all grade levels, more boys than girls said
they were very interested. See Table VIII-1. The
greatest differences between girls’ and boys’ interest
in sports occurred in urban communities. See Table
VIII-2 on following page. Among the third- to fifth-
graders, for example, 85% of boys and 49% of girls
were very interested in playing sports. Only an 8%
gender difference appeared for the same grades
in rural communities (69% and 77%, which is not
statistically significant).
51%
62%
55%
41%
74%
81%76%
65%
0%
10%
20%
30%
40%
50%
60%
70%
80%
90%
All Grades
Table VIII-1: Percentage of Students
Interested in Sports, by Gender
and Grade Level
Girls Boys
3rd-5thGrade
6th-8thGrade
9th-12thGrade
Chi-Square test comparing gender and interest in sports,
by grade and gender.
Total: Chi-Square (1,2149) = 112.402***, p < .001.
3rd–5th Grade: Chi-Square (1, 663) = 33.117***, p < .001.
6th–8th Grade: Chi-Square (1, 649) = 30.617***, P < .001.
9th–12th Grade: Chi-Square (1, 836) = 50.095***, P < .001.
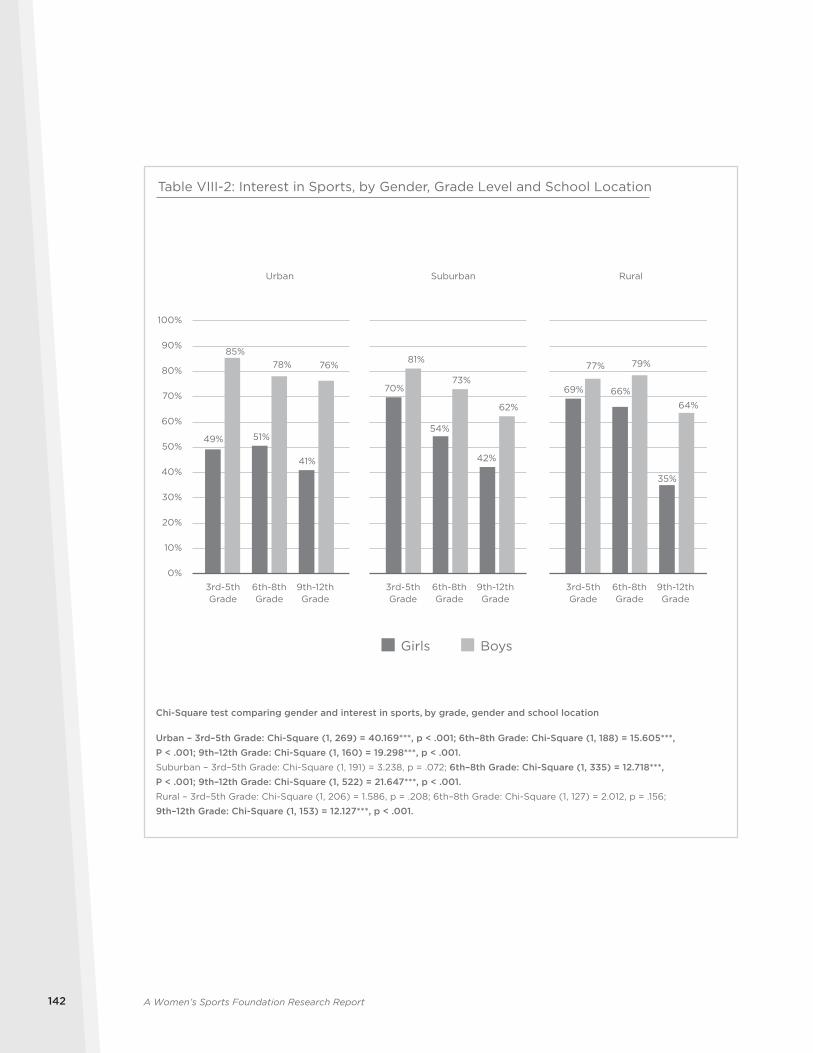
A Women’s Sports Foundation Research Report142
49% 51%
41%
70%
54%
42%
69% 66%
35%
85%78% 76% 81%
73%
62%
77% 79%
64%
0%
10%
20%
30%
40%
50%
60%
70%
80%
90%
100%
Urban Suburban Rural
Table VIII-2: Interest in Sports, by Gender, Grade Level and School Location
Girls Boys
3rd-5thGrade
6th-8thGrade
9th-12thGrade
3rd-5thGrade
6th-8thGrade
9th-12thGrade
3rd-5thGrade
6th-8thGrade
9th-12thGrade
Chi-Square test comparing gender and interest in sports, by grade, gender and school location
Urban – 3rd–5th Grade: Chi-Square (1, 269) = 40.169***, p < .001; 6th–8th Grade: Chi-Square (1, 188) = 15.605***, P < .001; 9th–12th Grade: Chi-Square (1, 160) = 19.298***, p < .001.Suburban – 3rd–5th Grade: Chi-Square (1, 191) = 3.238, p = .072; 6th–8th Grade: Chi-Square (1, 335) = 12.718***, P < .001; 9th–12th Grade: Chi-Square (1, 522) = 21.647***, p < .001.Rural – 3rd–5th Grade: Chi-Square (1, 206) = 1.586, p = .208; 6th–8th Grade: Chi-Square (1, 127) = 2.012, p = .156; 9th–12th Grade: Chi-Square (1, 153) = 12.127***, p < .001.
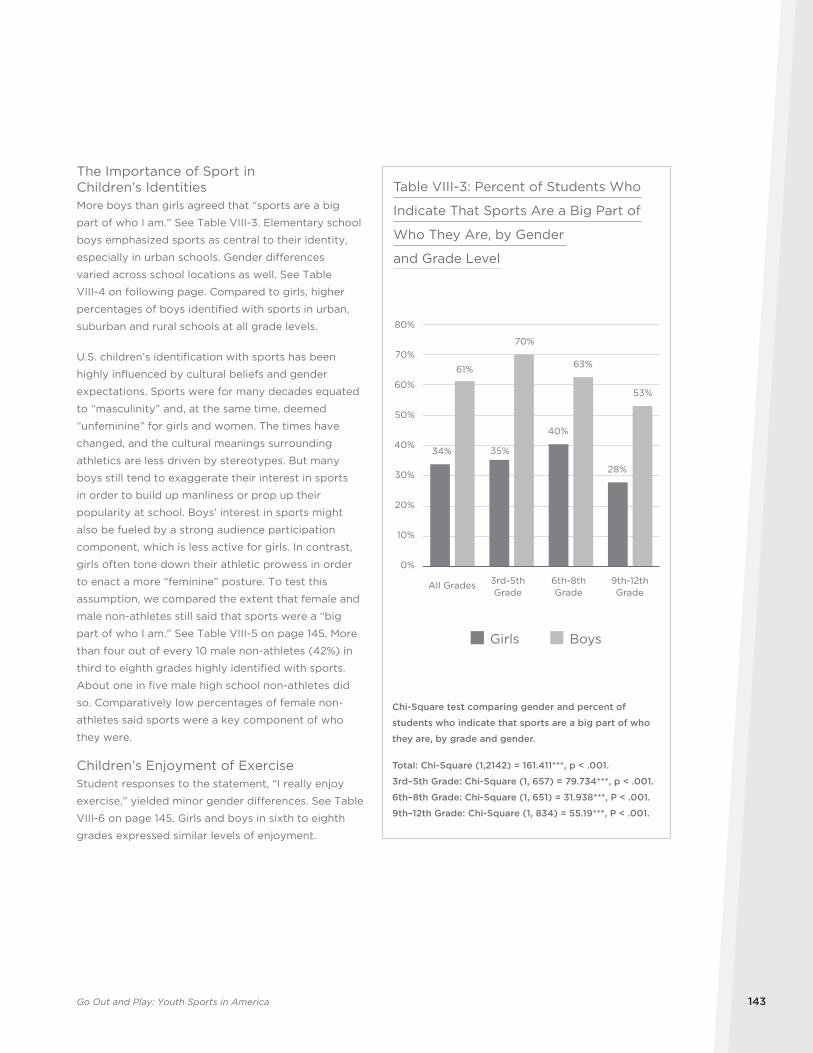
Go Out and Play: Youth Sports in America 143
The Importance of Sport in Children’s IdentitiesMore boys than girls agreed that “sports are a big
part of who I am.” See Table VIII-3. Elementary school
boys emphasized sports as central to their identity,
especially in urban schools. Gender differences
varied across school locations as well. See Table
VIII-4 on following page. Compared to girls, higher
percentages of boys identified with sports in urban,
suburban and rural schools at all grade levels.
U.S. children’s identification with sports has been
highly influenced by cultural beliefs and gender
expectations. Sports were for many decades equated
to “masculinity” and, at the same time, deemed
“unfeminine” for girls and women. The times have
changed, and the cultural meanings surrounding
athletics are less driven by stereotypes. But many
boys still tend to exaggerate their interest in sports
in order to build up manliness or prop up their
popularity at school. Boys’ interest in sports might
also be fueled by a strong audience participation
component, which is less active for girls. In contrast,
girls often tone down their athletic prowess in order
to enact a more “feminine” posture. To test this
assumption, we compared the extent that female and
male non-athletes still said that sports were a “big
part of who I am.” See Table VIII-5 on page 145. More
than four out of every 10 male non-athletes (42%) in
third to eighth grades highly identified with sports.
About one in five male high school non-athletes did
so. Comparatively low percentages of female non-
athletes said sports were a key component of who
they were.
Children’s Enjoyment of ExerciseStudent responses to the statement, “I really enjoy
exercise,” yielded minor gender differences. See Table
VIII-6 on page 145. Girls and boys in sixth to eighth
grades expressed similar levels of enjoyment.
34% 35%
40%
28%
61%
70%
63%
53%
0%
10%
20%
30%
40%
50%
60%
70%
80%
All Grades
Table VIII-3: Percent of Students Who
Indicate That Sports Are a Big Part of
Who They Are, by Gender
and Grade Level
Girls Boys
3rd-5thGrade
6th-8thGrade
9th-12thGrade
Chi-Square test comparing gender and percent of
students who indicate that sports are a big part of who
they are, by grade and gender.
Total: Chi-Square (1,2142) = 161.411***, p < .001.
3rd–5th Grade: Chi-Square (1, 657) = 79.734***, p < .001.
6th–8th Grade: Chi-Square (1, 651) = 31.938***, P < .001.
9th–12th Grade: Chi-Square (1, 834) = 55.19***, P < .001.
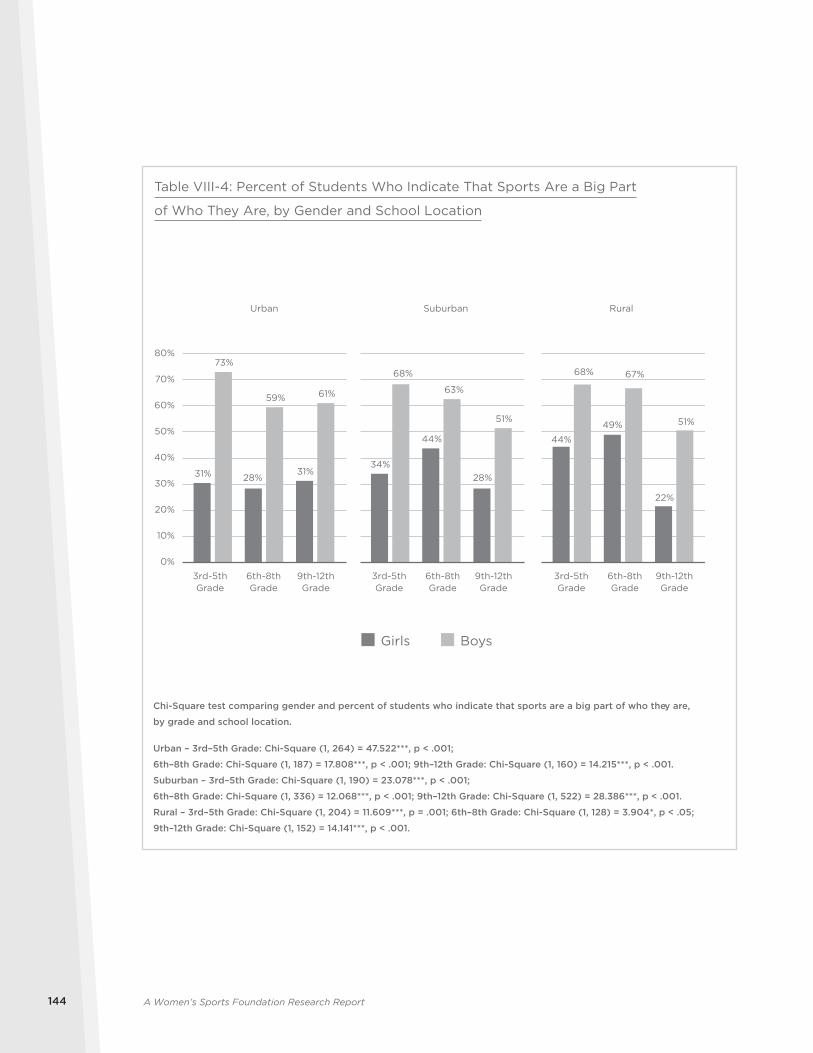
A Women’s Sports Foundation Research Report144
31% 28%31%
34%
44%
28%
44%
49%
22%
73%
59% 61%
68%
63%
51%
68% 67%
51%
0%
10%
20%
30%
40%
50%
60%
70%
80%
Urban Suburban Rural
Table VIII-4: Percent of Students Who Indicate That Sports Are a Big Part
of Who They Are, by Gender and School Location
Girls Boys
3rd-5thGrade
6th-8thGrade
9th-12thGrade
3rd-5thGrade
6th-8thGrade
9th-12thGrade
3rd-5thGrade
6th-8thGrade
9th-12thGrade
Chi-Square test comparing gender and percent of students who indicate that sports are a big part of who they are,
by grade and school location.
Urban – 3rd–5th Grade: Chi-Square (1, 264) = 47.522***, p < .001;
6th–8th Grade: Chi-Square (1, 187) = 17.808***, p < .001; 9th–12th Grade: Chi-Square (1, 160) = 14.215***, p < .001.
Suburban – 3rd–5th Grade: Chi-Square (1, 190) = 23.078***, p < .001;
6th–8th Grade: Chi-Square (1, 336) = 12.068***, p < .001; 9th–12th Grade: Chi-Square (1, 522) = 28.386***, p < .001.
Rural – 3rd–5th Grade: Chi-Square (1, 204) = 11.609***, p = .001; 6th–8th Grade: Chi-Square (1, 128) = 3.904*, p < .05;
9th–12th Grade: Chi-Square (1, 152) = 14.141***, p < .001.
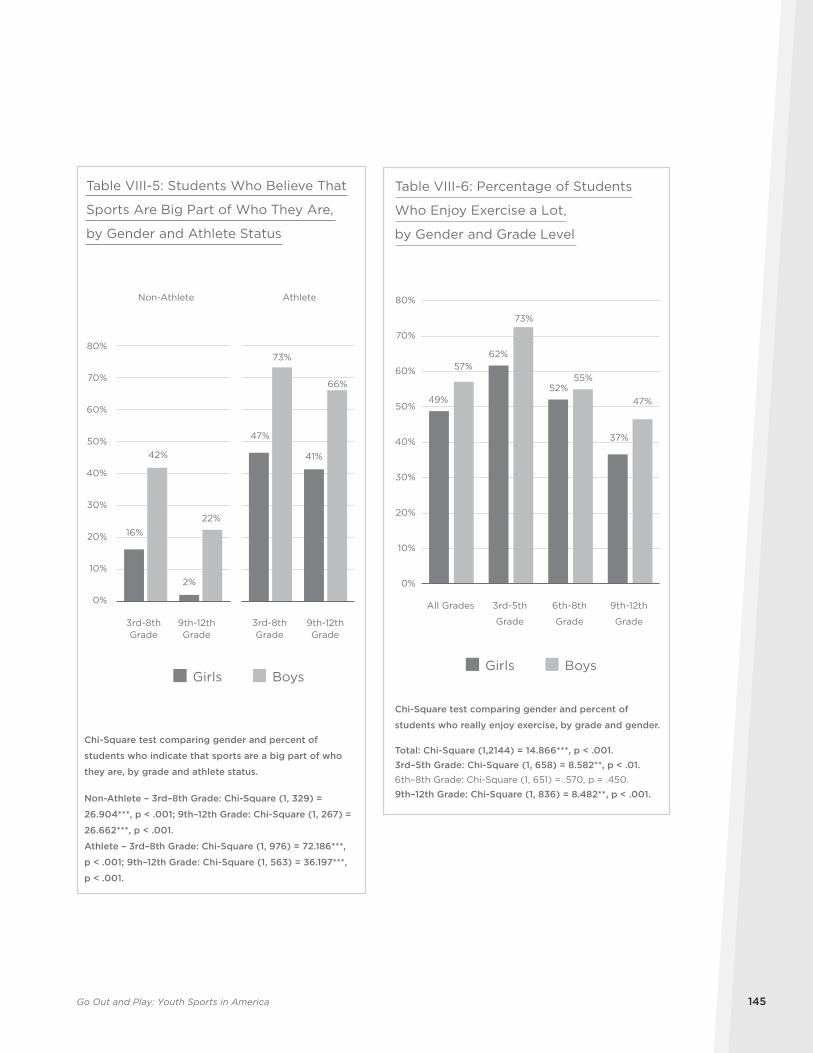
Go Out and Play: Youth Sports in America 145
16%
2%
47%
41%42%
22%
73%
66%
0%
10%
20%
30%
40%
50%
60%
70%
80%
Athlete
Table VIII-5: Students Who Believe That
Sports Are Big Part of Who They Are,
by Gender and Athlete Status
3rd-8thGrade
9th-12thGrade
3rd-8thGrade
9th-12thGrade
Girls Boys
Non-Athlete
Chi-Square test comparing gender and percent of
students who indicate that sports are a big part of who
they are, by grade and athlete status.
Non-Athlete – 3rd–8th Grade: Chi-Square (1, 329) =
26.904***, p < .001; 9th–12th Grade: Chi-Square (1, 267) =
26.662***, p < .001.
Athlete – 3rd–8th Grade: Chi-Square (1, 976) = 72.186***,
p < .001; 9th–12th Grade: Chi-Square (1, 563) = 36.197***,
p < .001.
Girls Boys
6th-8th
Grade
9th-12th
Grade
3rd-5th
Grade
49%
62%
52%
37%
57%
73%
55%
47%
0%
10%
20%
30%
40%
50%
60%
70%
80%
All Grades
Table VIII-6: Percentage of Students
Who Enjoy Exercise a Lot,
by Gender and Grade Level
Chi-Square test comparing gender and percent of
students who really enjoy exercise, by grade and gender.
Total: Chi-Square (1,2144) = 14.866***, p < .001.3rd–5th Grade: Chi-Square (1, 658) = 8.582**, p < .01. 6th–8th Grade: Chi-Square (1, 651) = .570, p = .450.
9th–12th Grade: Chi-Square (1, 836) = 8.482**, p < .001.
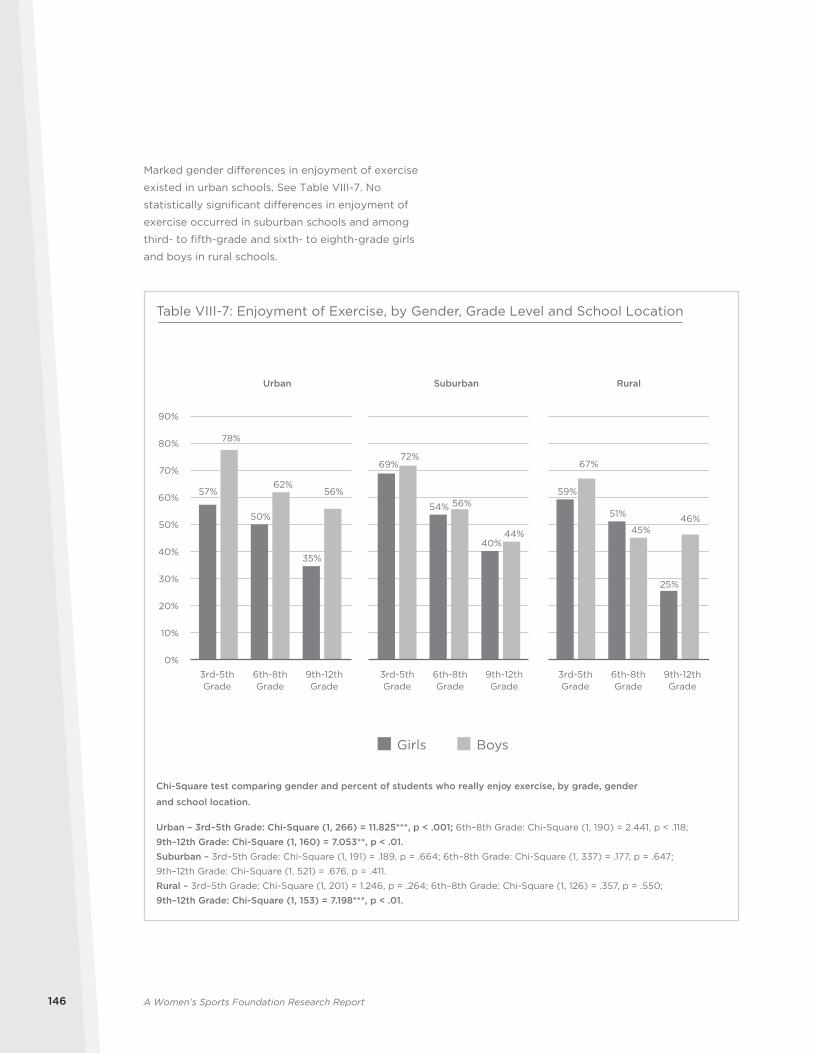
A Women’s Sports Foundation Research Report146
Marked gender differences in enjoyment of exercise
existed in urban schools. See Table VIII-7. No
statistically significant differences in enjoyment of
exercise occurred in suburban schools and among
third- to fifth-grade and sixth- to eighth-grade girls
and boys in rural schools.
Girls Boys
57%
50%
35%
69%
54%
40%
59%
51%
25%
78%
62%56%
72%
56%
44%
67%
45%46%
0%
10%
20%
30%
40%
50%
60%
70%
80%
90%
Urban Suburban Rural
Table VIII-7: Enjoyment of Exercise, by Gender, Grade Level and School Location
Chi-Square test comparing gender and percent of students who really enjoy exercise, by grade, gender
and school location.
Urban – 3rd–5th Grade: Chi-Square (1, 266) = 11.825***, p < .001; 6th–8th Grade: Chi-Square (1, 190) = 2.441, p < .118;
9th–12th Grade: Chi-Square (1, 160) = 7.053**, p < .01.Suburban – 3rd–5th Grade: Chi-Square (1, 191) = .189, p = .664; 6th–8th Grade: Chi-Square (1, 337) = .177, p = .647;
9th–12th Grade: Chi-Square (1, 521) = .676, p = .411.
Rural – 3rd–5th Grade: Chi-Square (1, 201) = 1.246, p = .264; 6th–8th Grade: Chi-Square (1, 126) = .357, p = .550;
9th–12th Grade: Chi-Square (1, 153) = 7.198***, p < .01.
6th-8thGrade
9th-12thGrade
3rd-5thGrade
6th-8thGrade
9th-12thGrade
3rd-5thGrade
6th-8thGrade
9th-12thGrade
3rd-5thGrade
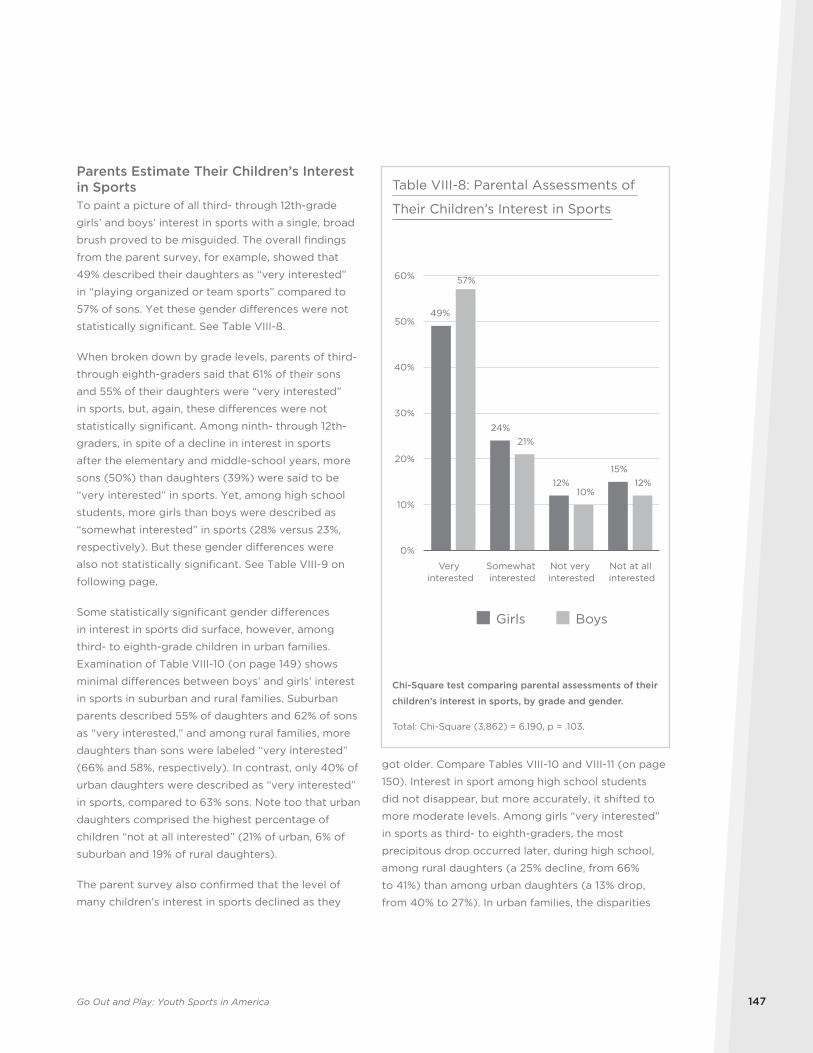
Go Out and Play: Youth Sports in America 147
got older. Compare Tables VIII-10 and VIII-11 (on page
150). Interest in sport among high school students
did not disappear, but more accurately, it shifted to
more moderate levels. Among girls “very interested”
in sports as third- to eighth-graders, the most
precipitous drop occurred later, during high school,
among rural daughters (a 25% decline, from 66%
to 41%) than among urban daughters (a 13% drop,
from 40% to 27%). In urban families, the disparities
Parents Estimate Their Children’s Interest in SportsTo paint a picture of all third- through 12th-grade
girls’ and boys’ interest in sports with a single, broad
brush proved to be misguided. The overall findings
from the parent survey, for example, showed that
49% described their daughters as “very interested”
in “playing organized or team sports” compared to
57% of sons. Yet these gender differences were not
statistically significant. See Table VIII-8.
When broken down by grade levels, parents of third-
through eighth-graders said that 61% of their sons
and 55% of their daughters were “very interested”
in sports, but, again, these differences were not
statistically significant. Among ninth- through 12th-
graders, in spite of a decline in interest in sports
after the elementary and middle-school years, more
sons (50%) than daughters (39%) were said to be
“very interested” in sports. Yet, among high school
students, more girls than boys were described as
“somewhat interested” in sports (28% versus 23%,
respectively). But these gender differences were
also not statistically significant. See Table VIII-9 on
following page.
Some statistically significant gender differences
in interest in sports did surface, however, among
third- to eighth-grade children in urban families.
Examination of Table VIII-10 (on page 149) shows
minimal differences between boys’ and girls’ interest
in sports in suburban and rural families. Suburban
parents described 55% of daughters and 62% of sons
as “very interested,” and among rural families, more
daughters than sons were labeled “very interested”
(66% and 58%, respectively). In contrast, only 40% of
urban daughters were described as “very interested”
in sports, compared to 63% sons. Note too that urban
daughters comprised the highest percentage of
children “not at all interested” (21% of urban, 6% of
suburban and 19% of rural daughters).
The parent survey also confirmed that the level of
many children’s interest in sports declined as they
Girls Boys
49%
24%
12%15%
57%
21%
10%12%
0%
10%
20%
30%
40%
50%
60%
Very interested
Somewhat interested
Not very interested
Not at all interested
Table VIII-8: Parental Assessments of
Their Children’s Interest in Sports
Chi-Square test comparing parental assessments of their
children’s interest in sports, by grade and gender.
Total: Chi-Square (3,862) = 6.190, p = .103.
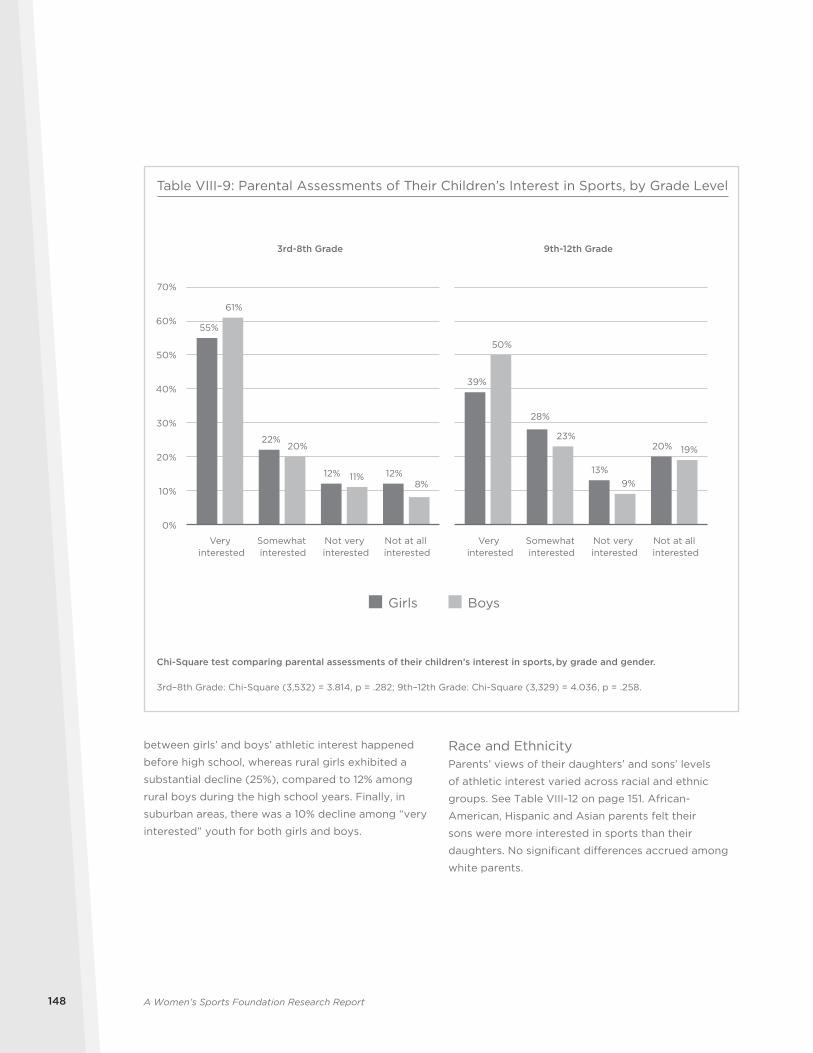
A Women’s Sports Foundation Research Report148
Race and EthnicityParents’ views of their daughters’ and sons’ levels
of athletic interest varied across racial and ethnic
groups. See Table VIII-12 on page 151. African-
American, Hispanic and Asian parents felt their
sons were more interested in sports than their
daughters. No significant differences accrued among
white parents.
between girls’ and boys’ athletic interest happened
before high school, whereas rural girls exhibited a
substantial decline (25%), compared to 12% among
rural boys during the high school years. Finally, in
suburban areas, there was a 10% decline among “very
interested” youth for both girls and boys.
Girls Boys
55%
22%
12% 12%
39%
28%
13%
20%
61%
20%
11%8%
50%
23%
9%
19%
0%
10%
20%
30%
40%
50%
60%
70%
Table VIII-9: Parental Assessments of Their Children’s Interest in Sports, by Grade Level
Chi-Square test comparing parental assessments of their children’s interest in sports, by grade and gender.
3rd–8th Grade: Chi-Square (3,532) = 3.814, p = .282; 9th–12th Grade: Chi-Square (3,329) = 4.036, p = .258.
Very interested
Somewhat interested
Not very interested
Not at all interested
Very interested
Somewhat interested
Not very interested
Not at all interested
9th-12th Grade3rd-8th Grade
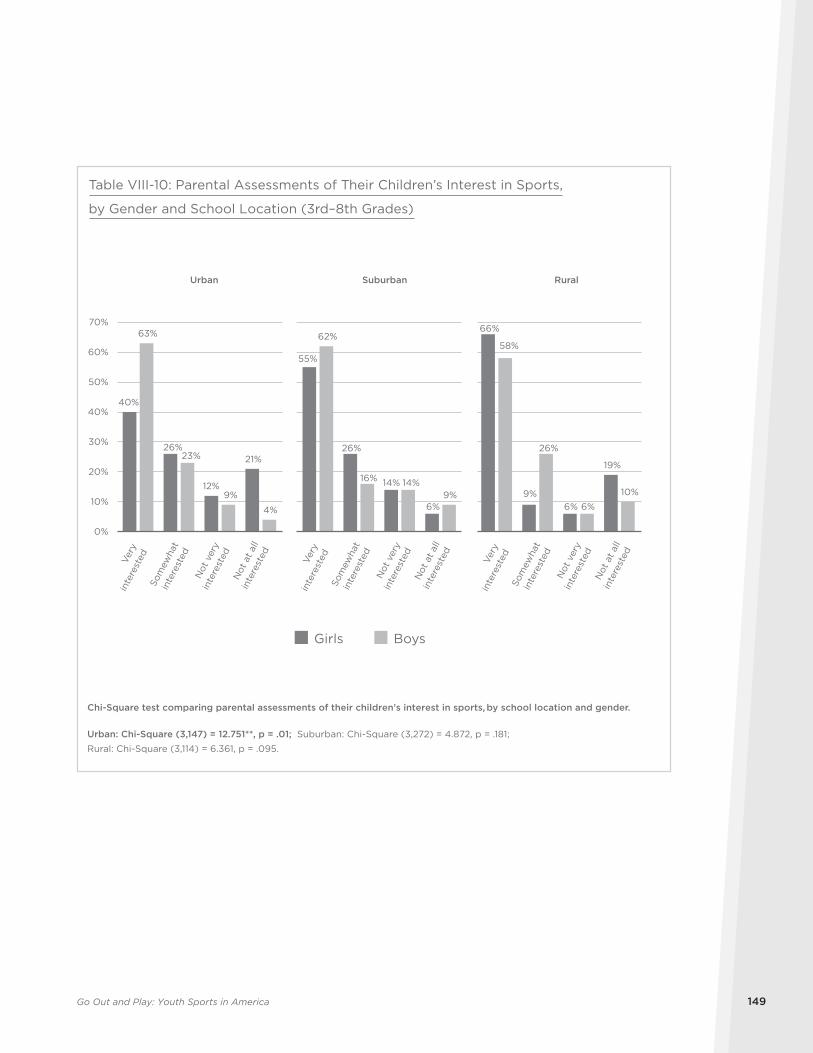
Go Out and Play: Youth Sports in America 149
Girls Boys
40%
26%
12%
21%
55%
26%
14%
6%
66%
9%6%
19%
63%
23%
9%
4%
62%
16% 14%9%
58%
26%
6%
10%
0%
10%
20%
30%
40%
50%
60%
70%
Urban Suburban Rural
Table VIII-10: Parental Assessments of Their Children’s Interest in Sports,
by Gender and School Location (3rd–8th Grades)
Chi-Square test comparing parental assessments of their children’s interest in sports, by school location and gender.
Urban: Chi-Square (3,147) = 12.751**, p = .01; Suburban: Chi-Square (3,272) = 4.872, p = .181; Rural: Chi-Square (3,114) = 6.361, p = .095.
Very
inte
rest
edSo
mew
hat
inte
rest
edN
ot v
ery
inte
rest
edN
ot a
t all
inte
rest
ed Very
inte
rest
edSo
mew
hat
inte
rest
edN
ot v
ery
inte
rest
edN
ot a
t all
inte
rest
ed Very
inte
rest
edSo
mew
hat
inte
rest
edN
ot v
ery
inte
rest
edN
ot a
t all
inte
rest
ed
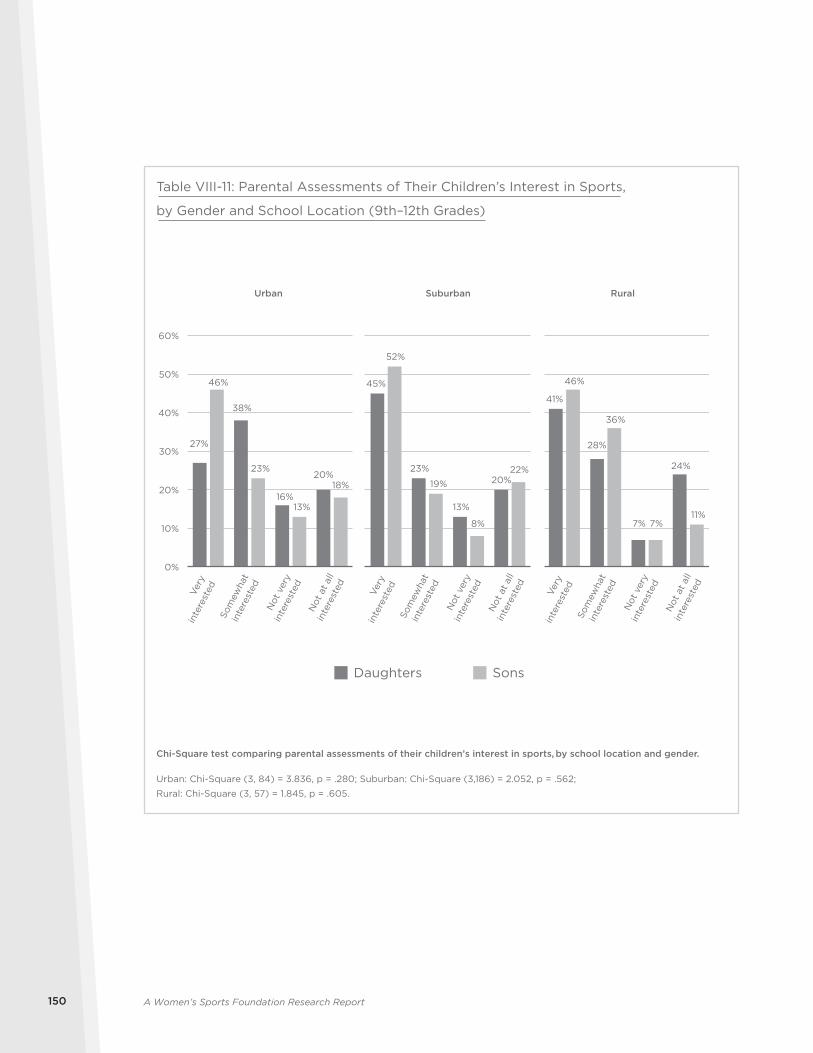
A Women’s Sports Foundation Research Report150
27%
38%
16%
20%
45%
23%
13%
20%
41%
28%
7%
24%
46%
23%
13%
18%
52%
19%
8%
22%
46%
36%
7%11%
0%
10%
20%
30%
40%
50%
60%
Daughters Sons
Urban Suburban Rural
Table VIII-11: Parental Assessments of Their Children’s Interest in Sports,
by Gender and School Location (9th–12th Grades)
Chi-Square test comparing parental assessments of their children’s interest in sports, by school location and gender.
Urban: Chi-Square (3, 84) = 3.836, p = .280; Suburban: Chi-Square (3,186) = 2.052, p = .562;
Rural: Chi-Square (3, 57) = 1.845, p = .605.
Very
inte
rest
edSo
mew
hat
inte
rest
ed
Not
ver
yin
tere
sted
Not
at a
llin
tere
sted Ve
ryin
tere
sted
Som
ewha
tin
tere
sted
Not
ver
yin
tere
sted
Not
at a
llin
tere
sted Ve
ryin
tere
sted
Som
ewha
tin
tere
sted
Not
ver
yin
tere
sted
Not
at a
llin
tere
sted
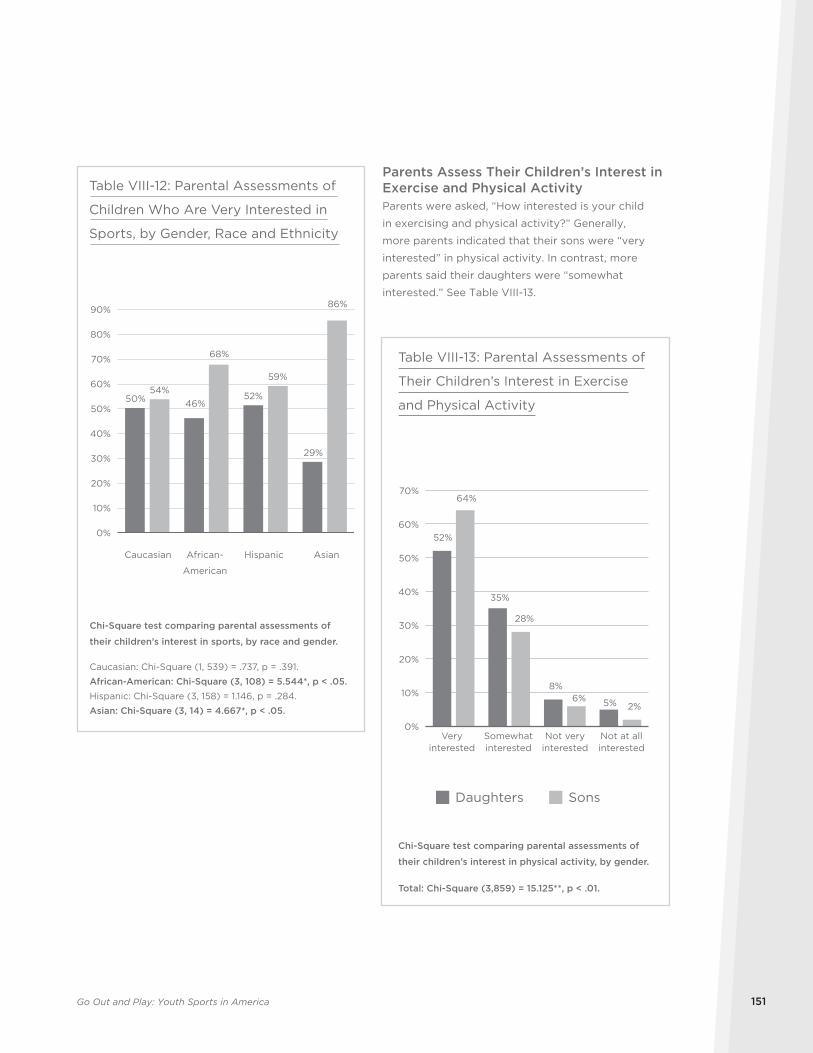
Go Out and Play: Youth Sports in America 151
Parents Assess Their Children’s Interest in Exercise and Physical ActivityParents were asked, “How interested is your child
in exercising and physical activity?” Generally,
more parents indicated that their sons were “very
interested” in physical activity. In contrast, more
parents said their daughters were “somewhat
interested.” See Table VIII-13.
50% 46%52%
29%
54%
68%
59%
86%
0%
10%
20%
30%
40%
50%
60%
70%
80%
90%
Caucasian African-
American
Hispanic Asian
Table VIII-12: Parental Assessments of
Children Who Are Very Interested in
Sports, by Gender, Race and Ethnicity
Chi-Square test comparing parental assessments of
their children’s interest in sports, by race and gender.
Caucasian: Chi-Square (1, 539) = .737, p = .391.
African-American: Chi-Square (3, 108) = 5.544*, p < .05.Hispanic: Chi-Square (3, 158) = 1.146, p = .284.
Asian: Chi-Square (3, 14) = 4.667*, p < .05.
Daughters Sons
52%
35%
8%
5%
64%
28%
6%2%
0%
10%
20%
30%
40%
50%
60%
70%
Table VIII-13: Parental Assessments of
Their Children’s Interest in Exercise
and Physical Activity
Chi-Square test comparing parental assessments of
their children’s interest in physical activity, by gender.
Total: Chi-Square (3,859) = 15.125**, p < .01.
Veryinterested
Somewhatinterested
Not veryinterested
Not at allinterested
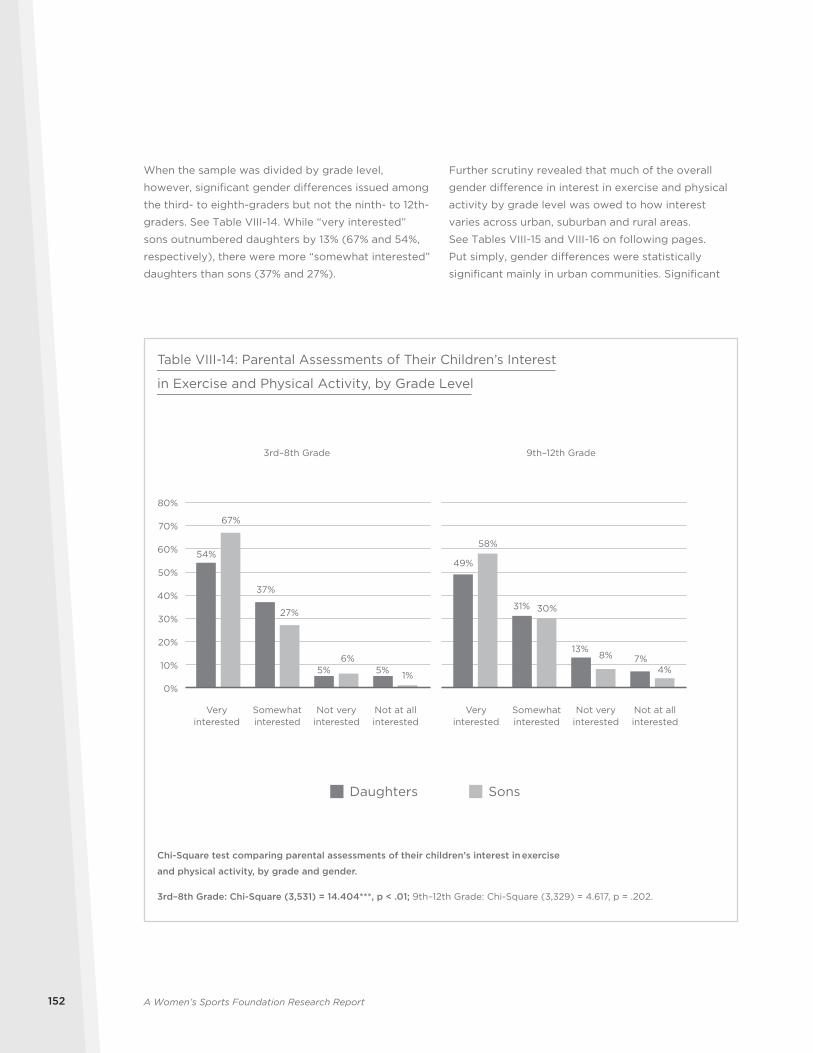
A Women’s Sports Foundation Research Report152
Further scrutiny revealed that much of the overall
gender difference in interest in exercise and physical
activity by grade level was owed to how interest
varies across urban, suburban and rural areas.
See Tables VIII-15 and VIII-16 on following pages.
Put simply, gender differences were statistically
significant mainly in urban communities. Significant
When the sample was divided by grade level,
however, significant gender differences issued among
the third- to eighth-graders but not the ninth- to 12th-
graders. See Table VIII-14. While “very interested”
sons outnumbered daughters by 13% (67% and 54%,
respectively), there were more “somewhat interested”
daughters than sons (37% and 27%).
Daughters Sons
54%
37%
5% 5%
49%
31%
13%7%
67%
27%
6%
1%
58%
30%
8%
4%
0%
10%
20%
30%
40%
50%
60%
70%
80%
Table VIII-14: Parental Assessments of Their Children’s Interest
in Exercise and Physical Activity, by Grade Level
Chi-Square test comparing parental assessments of their children’s interest in exercise
and physical activity, by grade and gender.
3rd–8th Grade: Chi-Square (3,531) = 14.404***, p < .01; 9th–12th Grade: Chi-Square (3,329) = 4.617, p = .202.
3rd–8th Grade 9th–12th Grade
Veryinterested
Somewhatinterested
Not veryinterested
Not at allinterested
Veryinterested
Somewhatinterested
Not veryinterested
Not at allinterested
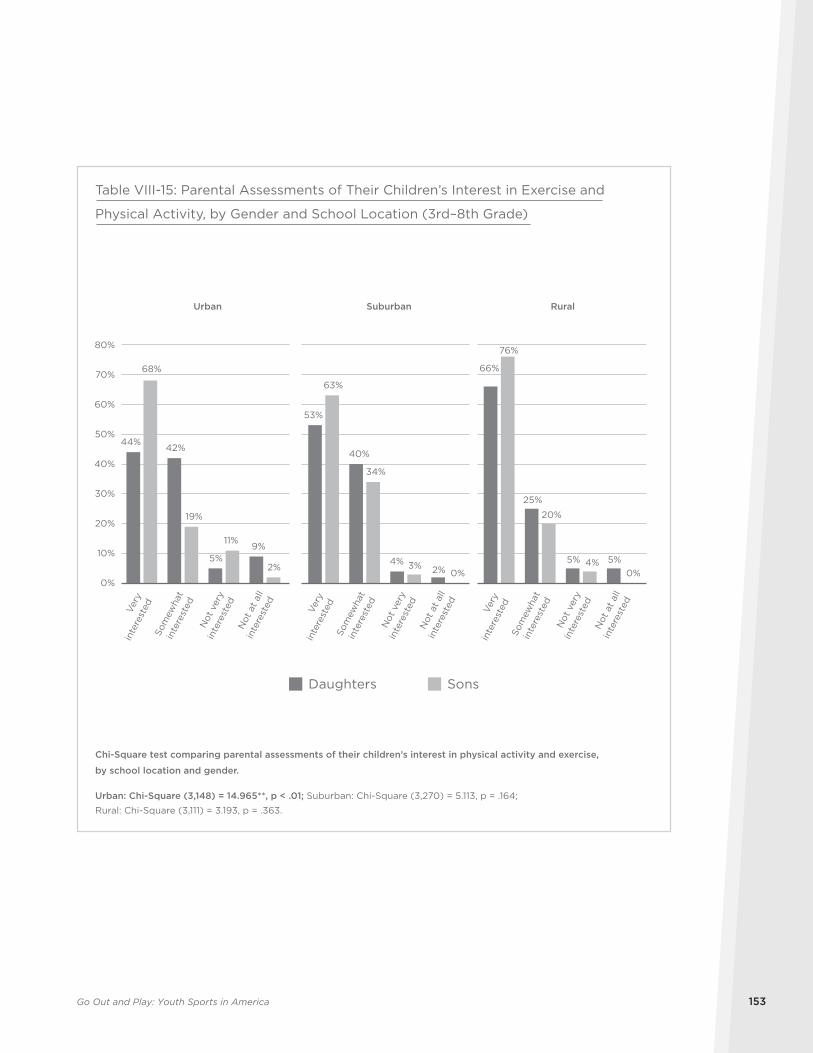
Go Out and Play: Youth Sports in America 153
Daughters Sons
44%42%
5%9%
53%
40%
4%2%
66%
25%
5% 5%
68%
19%
11%
2%
63%
34%
3%0%
76%
20%
4%0%
0%
10%
20%
30%
40%
50%
60%
70%
80%
Urban Suburban Rural
Table VIII-15: Parental Assessments of Their Children’s Interest in Exercise and
Physical Activity, by Gender and School Location (3rd–8th Grade)
Chi-Square test comparing parental assessments of their children’s interest in physical activity and exercise,
by school location and gender.
Urban: Chi-Square (3,148) = 14.965**, p < .01; Suburban: Chi-Square (3,270) = 5.113, p = .164;
Rural: Chi-Square (3,111) = 3.193, p = .363.
Very
inte
rest
edSo
mew
hat
inte
rest
edN
ot v
ery
inte
rest
edN
ot a
t all
inte
rest
ed Very
inte
rest
edSo
mew
hat
inte
rest
edN
ot v
ery
inte
rest
edN
ot a
t all
inte
rest
ed Very
inte
rest
edSo
mew
hat
inte
rest
edN
ot v
ery
inte
rest
edN
ot a
t all
inte
rest
ed
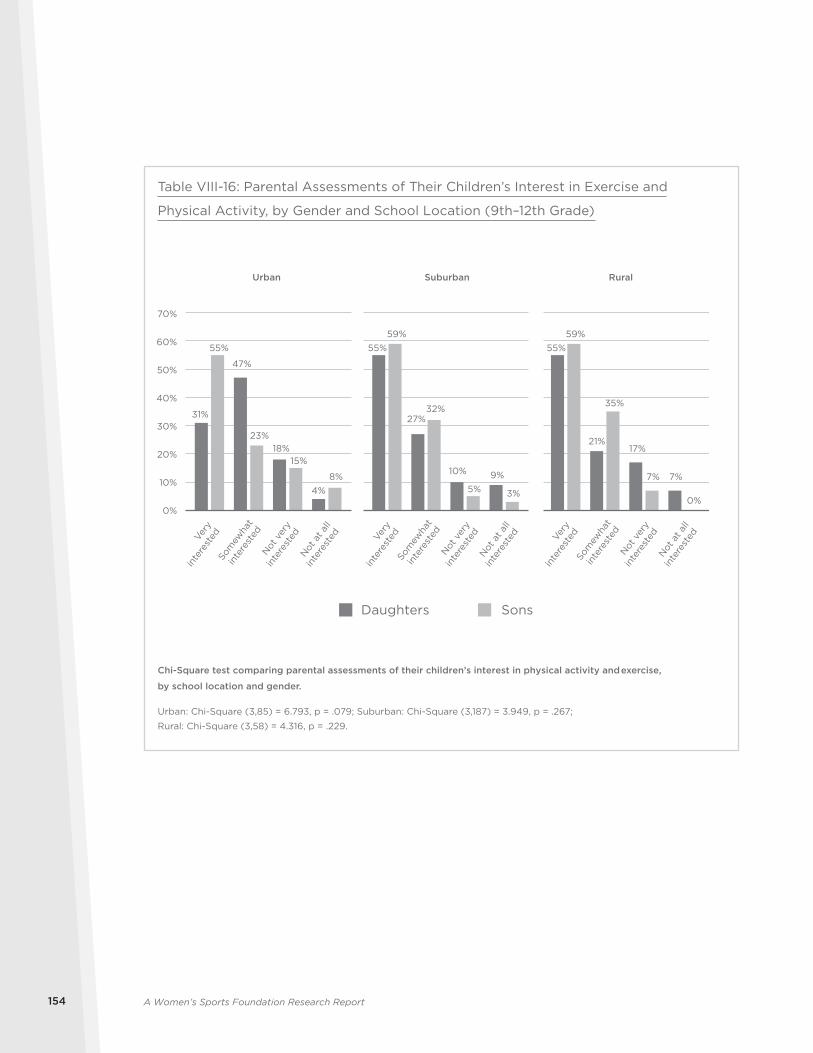
A Women’s Sports Foundation Research Report154
31%
47%
18%
4%
55%
27%
10% 9%
55%
21%17%
7%
55%
23%
15%
8%
59%
32%
5% 3%
59%
35%
7%
0%0%
10%
20%
30%
40%
50%
60%
70%
Daughters Sons
Urban Suburban Rural
Table VIII-16: Parental Assessments of Their Children’s Interest in Exercise and
Physical Activity, by Gender and School Location (9th–12th Grade)
Chi-Square test comparing parental assessments of their children’s interest in physical activity and exercise,
by school location and gender.
Urban: Chi-Square (3,85) = 6.793, p = .079; Suburban: Chi-Square (3,187) = 3.949, p = .267;
Rural: Chi-Square (3,58) = 4.316, p = .229.
Very
inte
rest
edSo
mew
hat
inte
rest
edNot
ver
y
inte
rest
edNot
at a
ll
inte
rest
ed Very
inte
rest
edSo
mew
hat
inte
rest
edNot
ver
y
inte
rest
edNot
at a
ll
inte
rest
ed Very
inte
rest
edSo
mew
hat
inte
rest
edNot
ver
y
inte
rest
edNot
at a
ll
inte
rest
ed
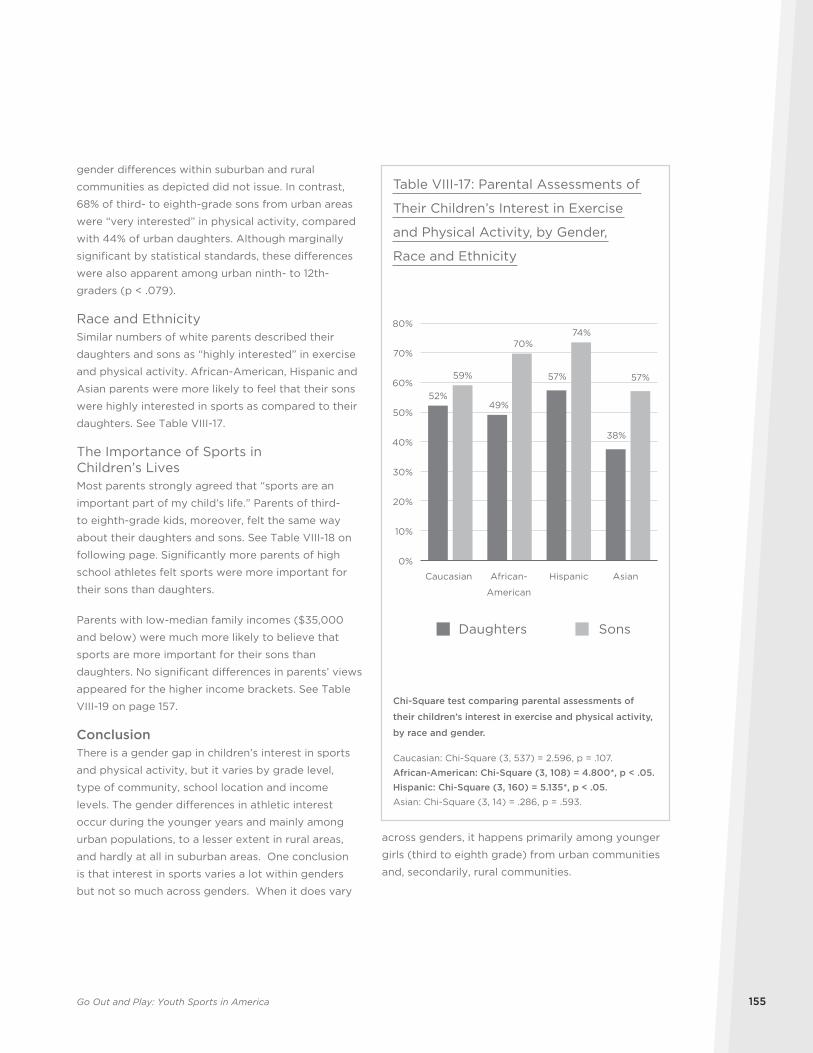
Go Out and Play: Youth Sports in America 155
across genders, it happens primarily among younger
girls (third to eighth grade) from urban communities
and, secondarily, rural communities.
gender differences within suburban and rural
communities as depicted did not issue. In contrast,
68% of third- to eighth-grade sons from urban areas
were “very interested” in physical activity, compared
with 44% of urban daughters. Although marginally
significant by statistical standards, these differences
were also apparent among urban ninth- to 12th-
graders (p < .079).
Race and EthnicitySimilar numbers of white parents described their
daughters and sons as “highly interested” in exercise
and physical activity. African-American, Hispanic and
Asian parents were more likely to feel that their sons
were highly interested in sports as compared to their
daughters. See Table VIII-17.
The Importance of Sports in Children’s LivesMost parents strongly agreed that “sports are an
important part of my child’s life.” Parents of third-
to eighth-grade kids, moreover, felt the same way
about their daughters and sons. See Table VIII-18 on
following page. Significantly more parents of high
school athletes felt sports were more important for
their sons than daughters.
Parents with low-median family incomes ($35,000
and below) were much more likely to believe that
sports are more important for their sons than
daughters. No significant differences in parents’ views
appeared for the higher income brackets. See Table
VIII-19 on page 157.
ConclusionThere is a gender gap in children’s interest in sports
and physical activity, but it varies by grade level,
type of community, school location and income
levels. The gender differences in athletic interest
occur during the younger years and mainly among
urban populations, to a lesser extent in rural areas,
and hardly at all in suburban areas. One conclusion
is that interest in sports varies a lot within genders
but not so much across genders. When it does vary
52%49%
57%
38%
59%
70%74%
57%
0%
10%
20%
30%
40%
50%
60%
70%
80%
Caucasian African-
American
Hispanic Asian
Table VIII-17: Parental Assessments of
Their Children’s Interest in Exercise
and Physical Activity, by Gender,
Race and Ethnicity
Chi-Square test comparing parental assessments of
their children’s interest in exercise and physical activity,
by race and gender.
Caucasian: Chi-Square (3, 537) = 2.596, p = .107.
African-American: Chi-Square (3, 108) = 4.800*, p < .05.Hispanic: Chi-Square (3, 160) = 5.135*, p < .05. Asian: Chi-Square (3, 14) = .286, p = .593.
Daughters Sons
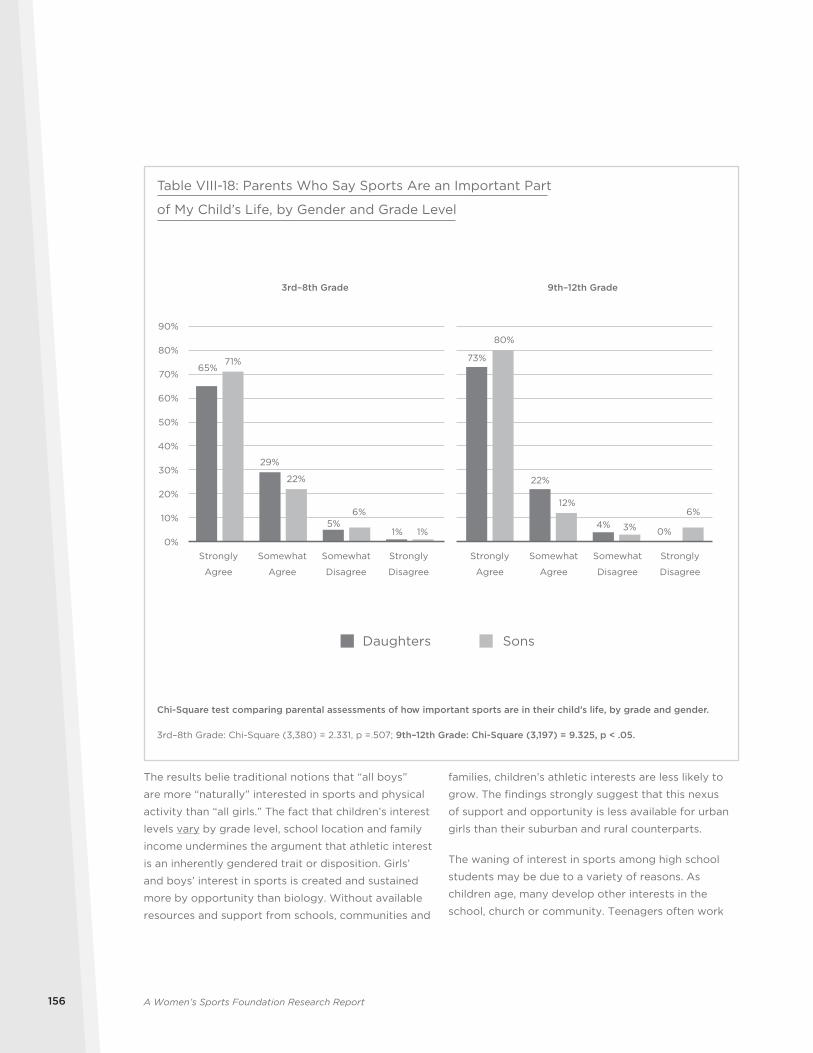
A Women’s Sports Foundation Research Report156
families, children’s athletic interests are less likely to
grow. The findings strongly suggest that this nexus
of support and opportunity is less available for urban
girls than their suburban and rural counterparts.
The waning of interest in sports among high school
students may be due to a variety of reasons. As
children age, many develop other interests in the
school, church or community. Teenagers often work
The results belie traditional notions that “all boys”
are more “naturally” interested in sports and physical
activity than “all girls.” The fact that children’s interest
levels vary by grade level, school location and family
income undermines the argument that athletic interest
is an inherently gendered trait or disposition. Girls’
and boys’ interest in sports is created and sustained
more by opportunity than biology. Without available
resources and support from schools, communities and
65%
29%
5%1%
73%
22%
4%0%
71%
22%
6%
1%
80%
12%
3%
6%
0%
10%
20%
30%
40%
50%
60%
70%
80%
90%
Daughters Sons
Table VIII-18: Parents Who Say Sports Are an Important Part
of My Child’s Life, by Gender and Grade Level
Chi-Square test comparing parental assessments of how important sports are in their child’s life, by grade and gender.
3rd–8th Grade: Chi-Square (3,380) = 2.331, p =.507; 9th–12th Grade: Chi-Square (3,197) = 9.325, p < .05.
3rd–8th Grade 9th–12th Grade
Strongly
Agree
Somewhat
Agree
Somewhat
Disagree
Strongly
Disagree
Strongly
Agree
Somewhat
Agree
Somewhat
Disagree
Strongly
Disagree
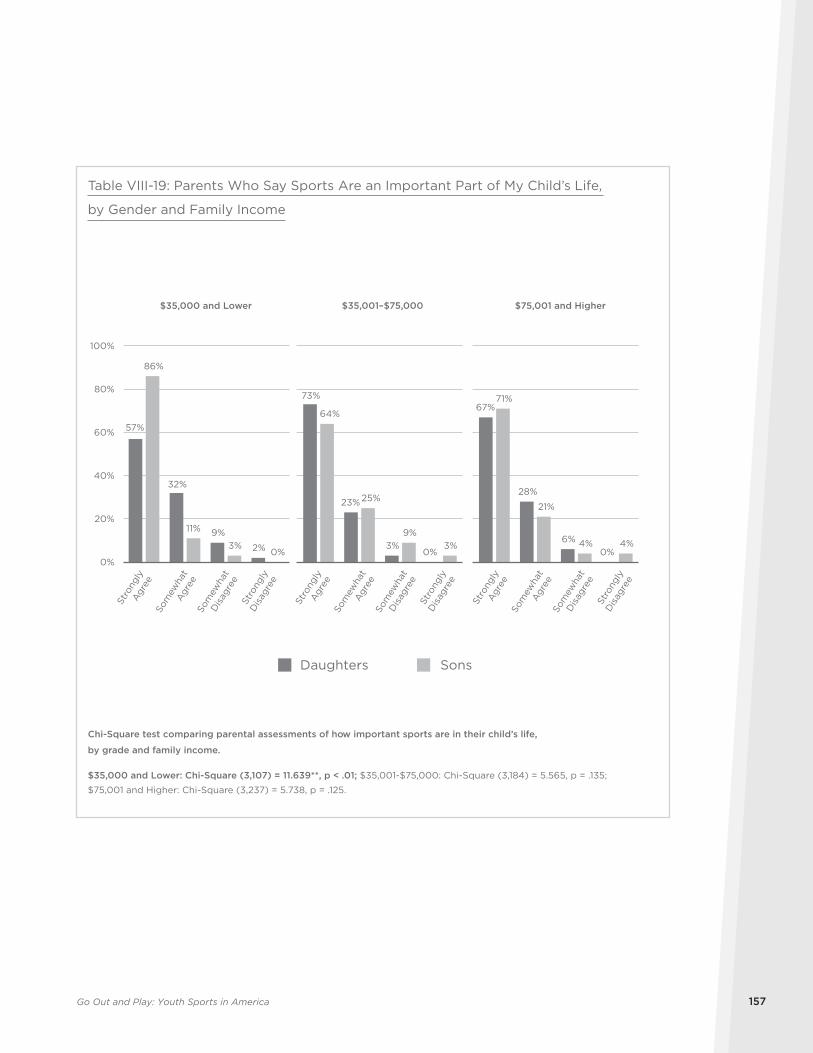
Go Out and Play: Youth Sports in America 157
57%
32%
9%
2%
73%
23%
3%0%
67%
28%
6%0%
86%
11%
3%0%
64%
25%
9%3%
71%
21%
4% 4%
0%
20%
40%
60%
80%
100%
$35,000 and Lower $75,001 and Higher
Daughters Sons
Table VIII-19: Parents Who Say Sports Are an Important Part of My Child’s Life,
by Gender and Family Income
Chi-Square test comparing parental assessments of how important sports are in their child’s life,
by grade and family income.
$35,000 and Lower: Chi-Square (3,107) = 11.639**, p < .01; $35,001-$75,000: Chi-Square (3,184) = 5.565, p = .135;
$75,001 and Higher: Chi-Square (3,237) = 5.738, p = .125.
Stro
ngly
Agr
eeSo
mew
hat
Agr
eeSo
mew
hat
Dis
agre
eSt
rong
lyD
isag
ree
Stro
ngly
Agr
eeSo
mew
hat
Agr
eeSo
mew
hat
Dis
agre
eSt
rong
lyD
isag
ree
Stro
ngly
Agr
eeSo
mew
hat
Agr
eeSo
mew
hat
Dis
agre
eSt
rong
lyD
isag
ree
$35,001–$75,000

A Women’s Sports Foundation Research Report158
after school or during summers. Others follow the
interests of friends. As we saw in Section VI, many
young people downsize their involvement with sports
as they move through high school.
Finally, there appear to be many reasons why boys
generally invest more of their interest and identity in
sports than girls. More boys construct their identities
through sports whether they actually play sports or
not. Many female athletes diversify their interests
and are involved with more clubs and groups at
school than male athletes. It also makes sense that
many boys still buy into cultural beliefs and media
portrayals of sports as an expression of masculine
adequacy. Being “into” sports reaps popularity gains
for boys—even boys who do not actually play sports.
There are also racial and ethnic dynamics at play.
More research is needed to explain how it is that
white and Hispanic girls and boys, particularly those
from more affluent communities, display similar
levels of interest in sports, while the interest levels
of African-American and Asian girls fall below their
male counterparts.
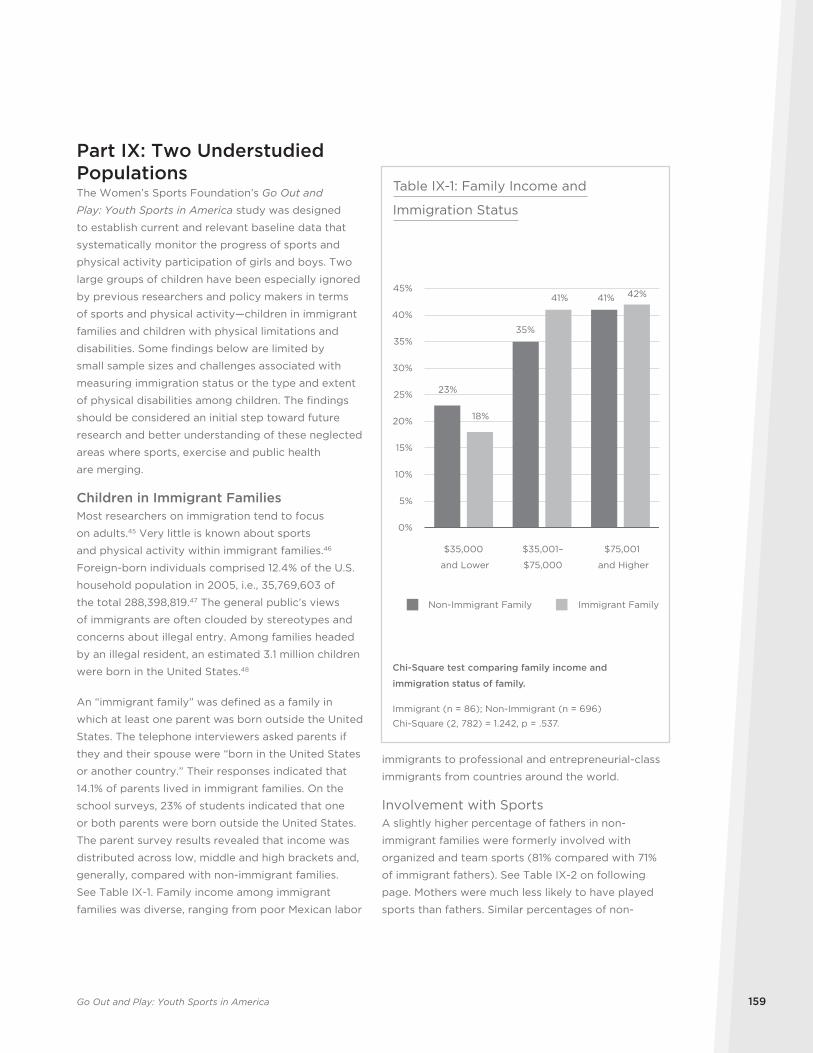
Go Out and Play: Youth Sports in America 159
immigrants to professional and entrepreneurial-class
immigrants from countries around the world.
Involvement with SportsA slightly higher percentage of fathers in non-
immigrant families were formerly involved with
organized and team sports (81% compared with 71%
of immigrant fathers). See Table IX-2 on following
page. Mothers were much less likely to have played
sports than fathers. Similar percentages of non-
Part IX: Two Understudied PopulationsThe Women’s Sports Foundation’s Go Out and
Play: Youth Sports in America study was designed
to establish current and relevant baseline data that
systematically monitor the progress of sports and
physical activity participation of girls and boys. Two
large groups of children have been especially ignored
by previous researchers and policy makers in terms
of sports and physical activity—children in immigrant
families and children with physical limitations and
disabilities. Some findings below are limited by
small sample sizes and challenges associated with
measuring immigration status or the type and extent
of physical disabilities among children. The findings
should be considered an initial step toward future
research and better understanding of these neglected
areas where sports, exercise and public health
are merging.
Children in Immigrant FamiliesMost researchers on immigration tend to focus
on adults.45 Very little is known about sports
and physical activity within immigrant families.46
Foreign-born individuals comprised 12.4% of the U.S.
household population in 2005, i.e., 35,769,603 of
the total 288,398,819.47 The general public’s views
of immigrants are often clouded by stereotypes and
concerns about illegal entry. Among families headed
by an illegal resident, an estimated 3.1 million children
were born in the United States.48
An “immigrant family” was defined as a family in
which at least one parent was born outside the United
States. The telephone interviewers asked parents if
they and their spouse were “born in the United States
or another country.” Their responses indicated that
14.1% of parents lived in immigrant families. On the
school surveys, 23% of students indicated that one
or both parents were born outside the United States.
The parent survey results revealed that income was
distributed across low, middle and high brackets and,
generally, compared with non-immigrant families.
See Table IX-1. Family income among immigrant
families was diverse, ranging from poor Mexican labor
23%
35%
41%
18%
41% 42%
0%
5%
10%
15%
20%
25%
30%
35%
40%
45%
$35,000
and Lower
$75,001
and Higher
Table IX-1: Family Income and
Immigration Status
$35,001–
$75,000
Immigrant FamilyNon-Immigrant Family
Chi-Square test comparing family income and
immigration status of family.
Immigrant (n = 86); Non-Immigrant (n = 696)
Chi-Square (2, 782) = 1.242, p = .537.
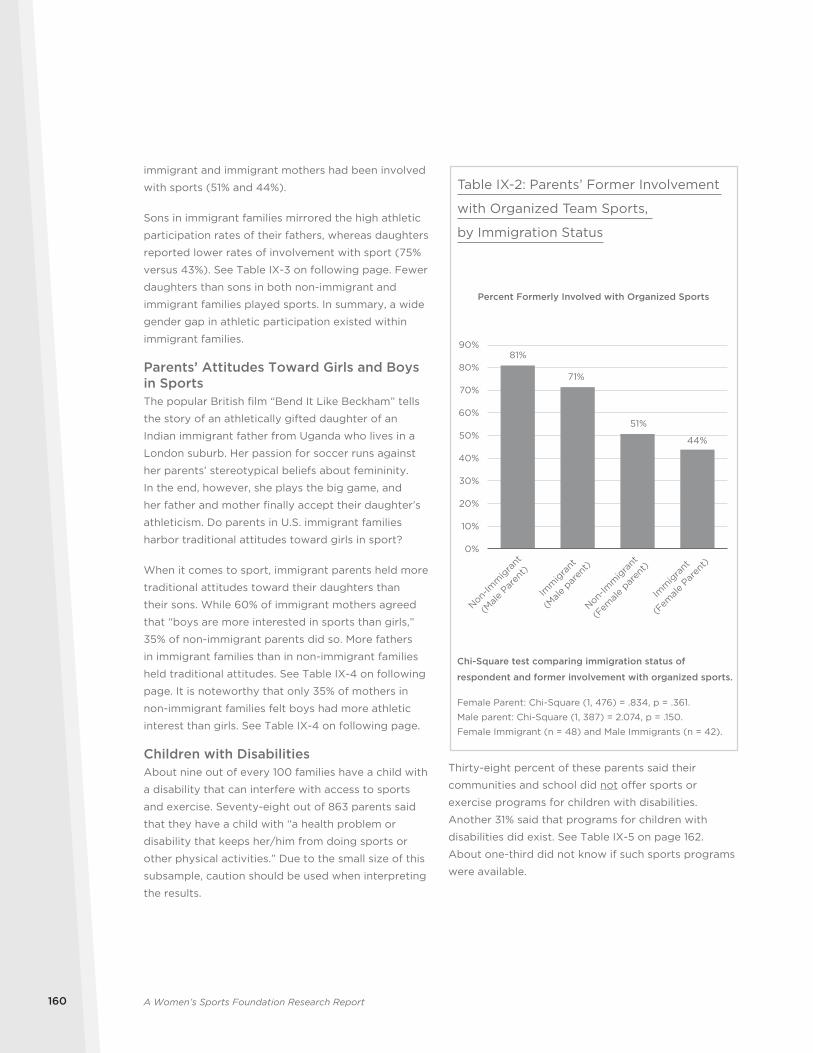
A Women’s Sports Foundation Research Report160
Thirty-eight percent of these parents said their
communities and school did not offer sports or
exercise programs for children with disabilities.
Another 31% said that programs for children with
disabilities did exist. See Table IX-5 on page 162.
About one-third did not know if such sports programs
were available.
immigrant and immigrant mothers had been involved
with sports (51% and 44%).
Sons in immigrant families mirrored the high athletic
participation rates of their fathers, whereas daughters
reported lower rates of involvement with sport (75%
versus 43%). See Table IX-3 on following page. Fewer
daughters than sons in both non-immigrant and
immigrant families played sports. In summary, a wide
gender gap in athletic participation existed within
immigrant families.
Parents’ Attitudes Toward Girls and Boys in SportsThe popular British film “Bend It Like Beckham” tells
the story of an athletically gifted daughter of an
Indian immigrant father from Uganda who lives in a
London suburb. Her passion for soccer runs against
her parents’ stereotypical beliefs about femininity.
In the end, however, she plays the big game, and
her father and mother finally accept their daughter’s
athleticism. Do parents in U.S. immigrant families
harbor traditional attitudes toward girls in sport?
When it comes to sport, immigrant parents held more
traditional attitudes toward their daughters than
their sons. While 60% of immigrant mothers agreed
that “boys are more interested in sports than girls,”
35% of non-immigrant parents did so. More fathers
in immigrant families than in non-immigrant families
held traditional attitudes. See Table IX-4 on following
page. It is noteworthy that only 35% of mothers in
non-immigrant families felt boys had more athletic
interest than girls. See Table IX-4 on following page.
Children with DisabilitiesAbout nine out of every 100 families have a child with
a disability that can interfere with access to sports
and exercise. Seventy-eight out of 863 parents said
that they have a child with “a health problem or
disability that keeps her/him from doing sports or
other physical activities.” Due to the small size of this
subsample, caution should be used when interpreting
the results.
81%
71%
51%
44%
0%
10%
20%
30%
40%
50%
60%
70%
80%
90%
Imm
igra
nt
(Male
par
ent)
Imm
igra
nt
(Fem
ale P
aren
t)
Percent Formerly Involved with Organized Sports
Table IX-2: Parents’ Former Involvement
with Organized Team Sports,
by Immigration Status
Chi-Square test comparing immigration status of
respondent and former involvement with organized sports.
Female Parent: Chi-Square (1, 476) = .834, p = .361.
Male parent: Chi-Square (1, 387) = 2.074, p = .150.
Female Immigrant (n = 48) and Male Immigrants (n = 42).
Non-Im
mig
rant
(Male
Par
ent)
Non-Im
mig
rant
(Fem
ale p
aren
t)
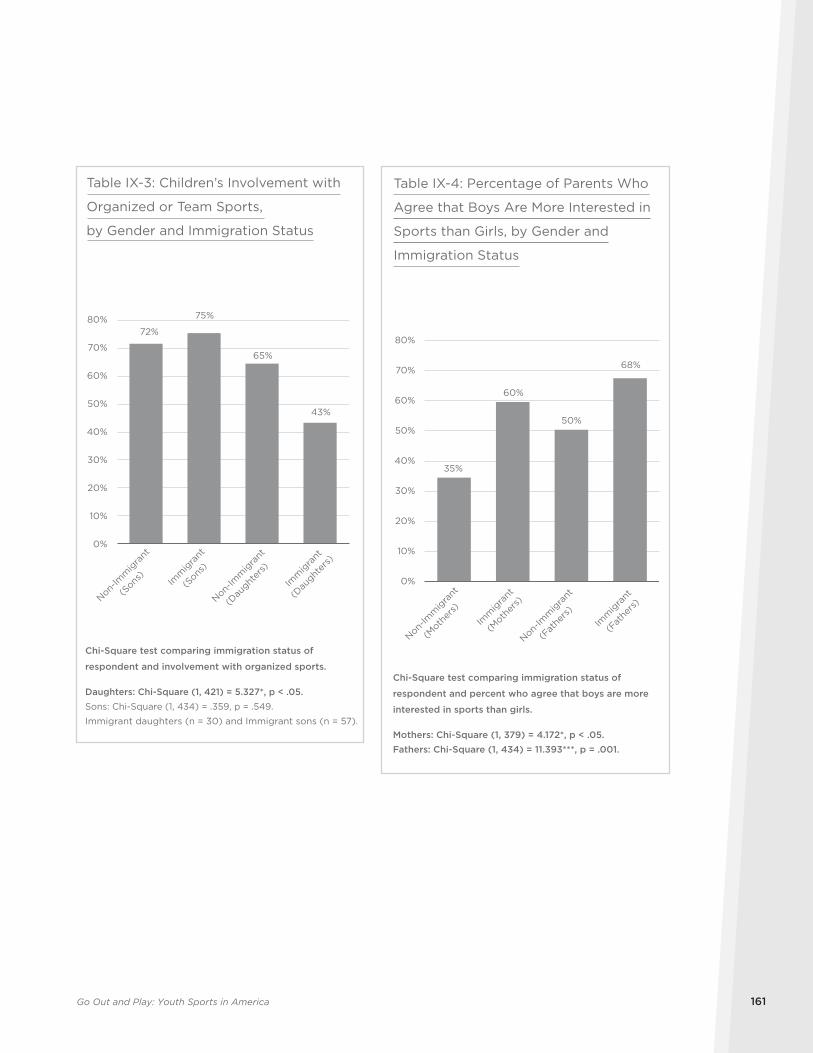
Go Out and Play: Youth Sports in America 161
72%
75%
65%
43%
0%
10%
20%
30%
40%
50%
60%
70%
80%
Imm
igra
nt
(Sons
)
Imm
igra
nt
(Dau
ghter
s)
Table IX-3: Children’s Involvement with
Organized or Team Sports,
by Gender and Immigration Status
Chi-Square test comparing immigration status of
respondent and involvement with organized sports.
Daughters: Chi-Square (1, 421) = 5.327*, p < .05. Sons: Chi-Square (1, 434) = .359, p = .549.
Immigrant daughters (n = 30) and Immigrant sons (n = 57).
Non-Im
mig
rant
(Sons
)
Non-Im
mig
rant
(Dau
ghter
s)
35%
60%
50%
68%
0%
10%
20%
30%
40%
50%
60%
70%
80%
Imm
igra
nt
(Moth
ers)
Imm
igra
nt
(Fat
hers
)
Table IX-4: Percentage of Parents Who
Agree that Boys Are More Interested in
Sports than Girls, by Gender and
Immigration Status
Chi-Square test comparing immigration status of
respondent and percent who agree that boys are more
interested in sports than girls.
Mothers: Chi-Square (1, 379) = 4.172*, p < .05.Fathers: Chi-Square (1, 434) = 11.393***, p = .001.
Non-Im
mig
rant
(Moth
ers)
Non-Im
mig
rant
(Fat
hers
)
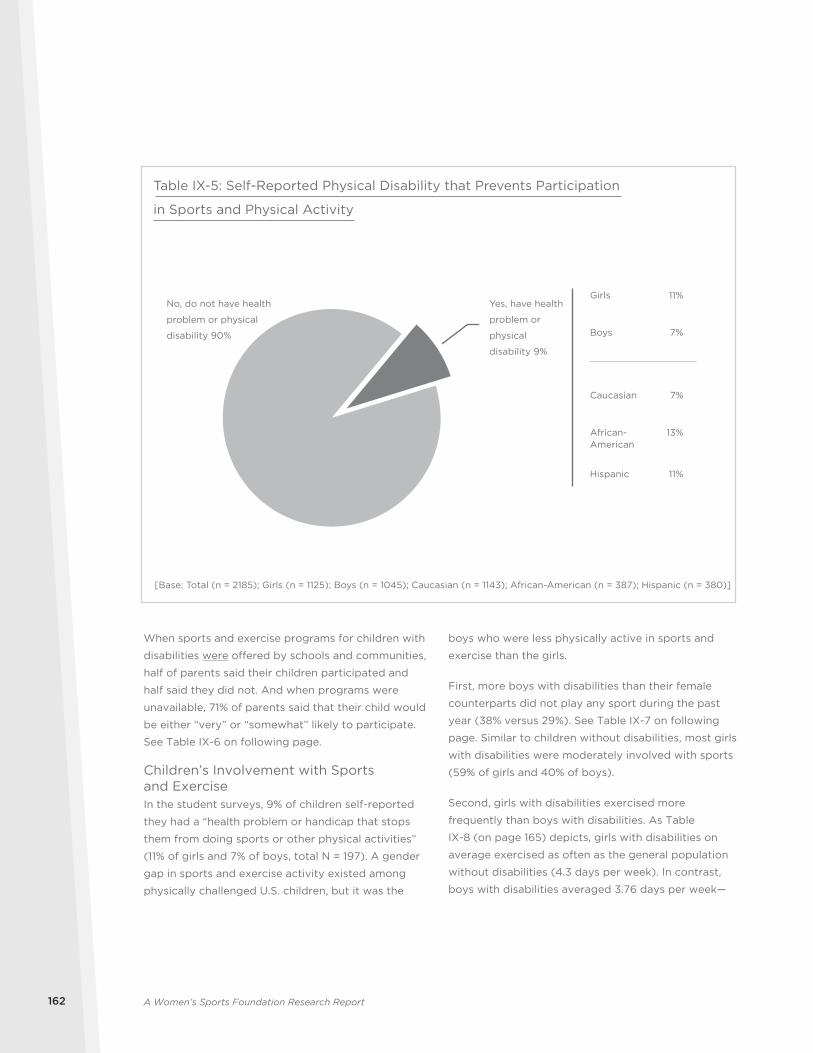
A Women’s Sports Foundation Research Report162
boys who were less physically active in sports and
exercise than the girls.
First, more boys with disabilities than their female
counterparts did not play any sport during the past
year (38% versus 29%). See Table IX-7 on following
page. Similar to children without disabilities, most girls
with disabilities were moderately involved with sports
(59% of girls and 40% of boys).
Second, girls with disabilities exercised more
frequently than boys with disabilities. As Table
IX-8 (on page 165) depicts, girls with disabilities on
average exercised as often as the general population
without disabilities (4.3 days per week). In contrast,
boys with disabilities averaged 3.76 days per week—
When sports and exercise programs for children with
disabilities were offered by schools and communities,
half of parents said their children participated and
half said they did not. And when programs were
unavailable, 71% of parents said that their child would
be either “very” or “somewhat” likely to participate.
See Table IX-6 on following page.
Children’s Involvement with Sports and ExerciseIn the student surveys, 9% of children self-reported
they had a “health problem or handicap that stops
them from doing sports or other physical activities”
(11% of girls and 7% of boys, total N = 197). A gender
gap in sports and exercise activity existed among
physically challenged U.S. children, but it was the
Girls 11%
Boys 7%
Caucasian 7%
African-American
13%
Hispanic 11%
Table IX-5: Self-Reported Physical Disability that Prevents Participation
in Sports and Physical Activity
[Base: Total (n = 2185); Girls (n = 1125); Boys (n = 1045); Caucasian (n = 1143); African-American (n = 387); Hispanic (n = 380)]
No, do not have health
problem or physical
disability 90%
Yes, have health
problem or
physical
disability 9%
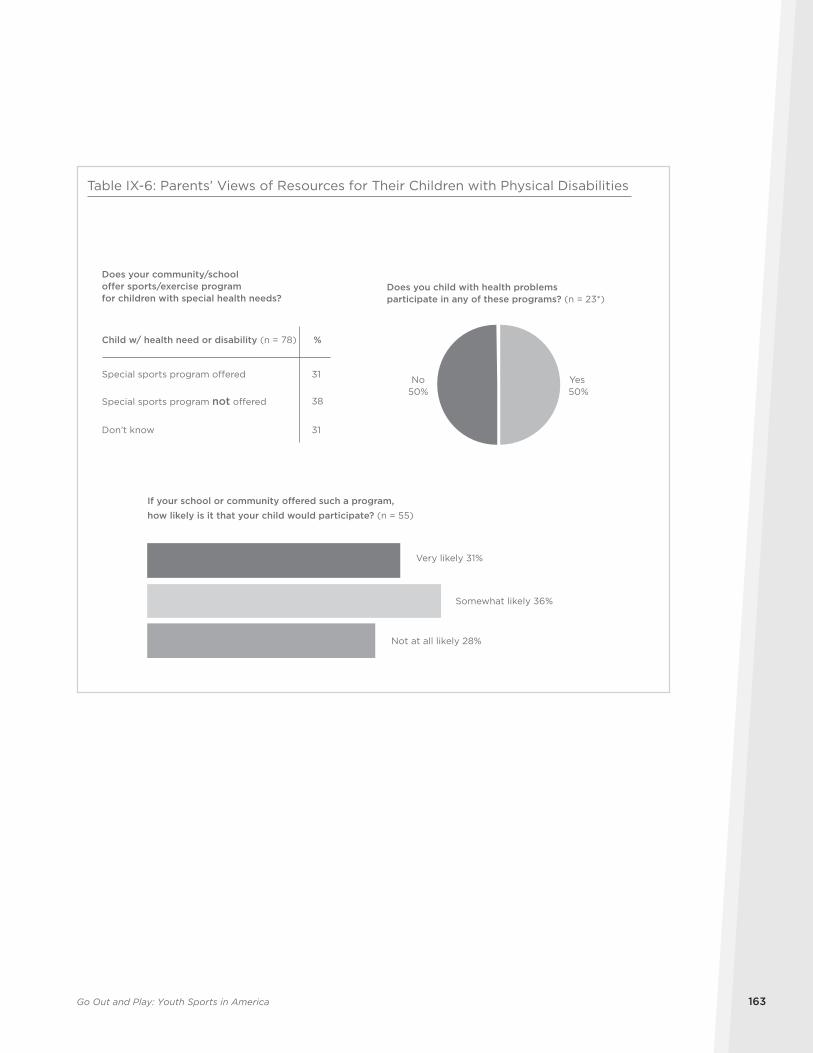
Go Out and Play: Youth Sports in America 163
%
Special sports program offered 31
38
Don’t know 31
No50%
Table IX-6: Parents’ Views of Resources for Their Children with Physical Disabilities
Does your community/school o�er sports/exercise program for children with special health needs?
Does you child with health problems participate in any of these programs? (n = 23*)
Yes 50%
If your school or community o�ered such a program, how likely is it that your child would participate? (n = 55)
Very likely 31%
Somewhat likely 36%
Not at all likely 28%
Child w/ health need or disability (n = 78)
Special sports program not offered
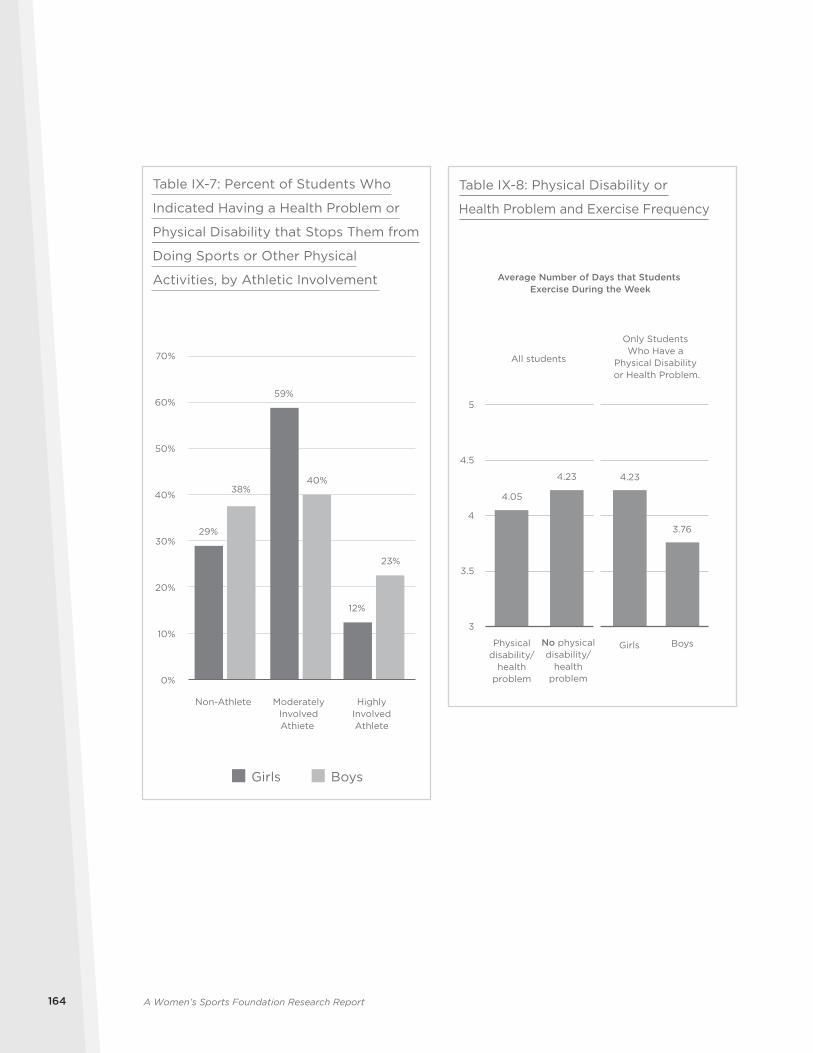
A Women’s Sports Foundation Research Report164
Girls Boys
29%
59%
12%
38%40%
23%
0%
10%
20%
30%
40%
50%
60%
70%
ModeratelyInvolvedAthiete
HighlyInvolvedAthlete
Table IX-7: Percent of Students Who
Indicated Having a Health Problem or
Physical Disability that Stops Them from
Doing Sports or Other Physical
Activities, by Athletic Involvement
Non-Athlete
All students
4.05
4.23
3
3.5
4
4.5
5
4.23
3.76
Table IX-8: Physical Disability or
Health Problem and Exercise Frequency
Only Students Who Have a
Physical Disability or Health Problem.
Average Number of Days that Students Exercise During the Week
Girls BoysPhysicaldisability/
healthproblem
No physicaldisability/
healthproblem
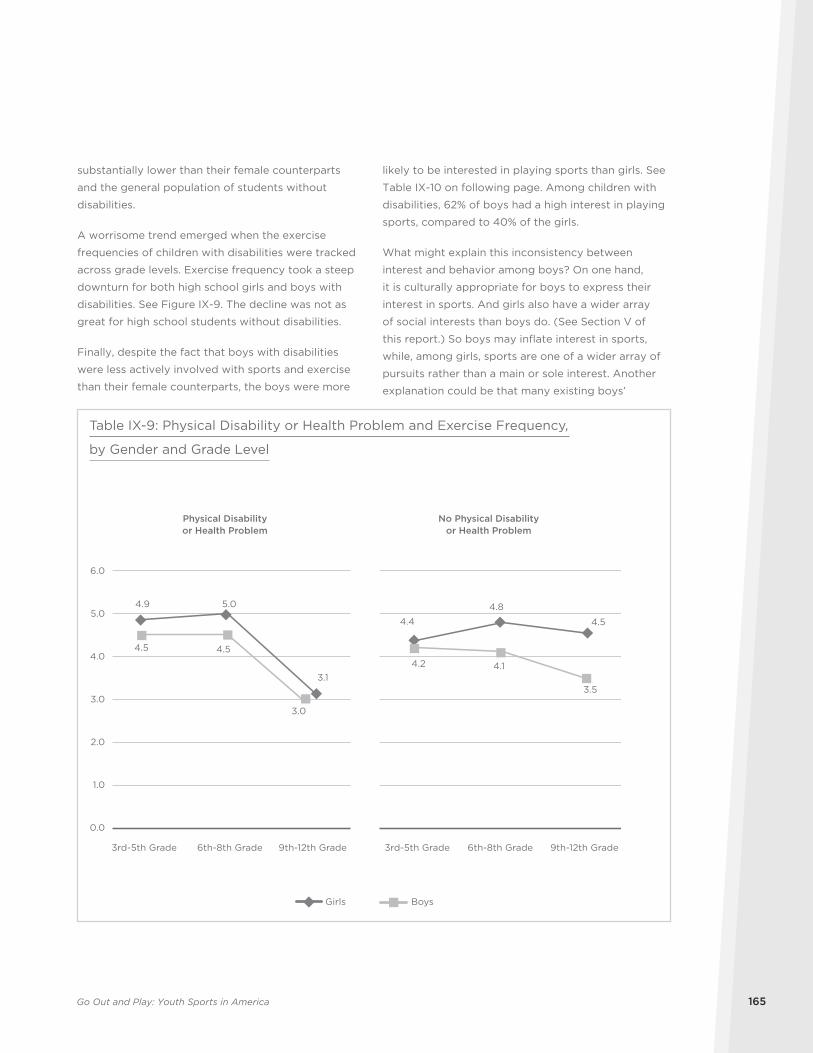
Go Out and Play: Youth Sports in America 165
likely to be interested in playing sports than girls. See
Table IX-10 on following page. Among children with
disabilities, 62% of boys had a high interest in playing
sports, compared to 40% of the girls.
What might explain this inconsistency between
interest and behavior among boys? On one hand,
it is culturally appropriate for boys to express their
interest in sports. And girls also have a wider array
of social interests than boys do. (See Section V of
this report.) So boys may inflate interest in sports,
while, among girls, sports are one of a wider array of
pursuits rather than a main or sole interest. Another
explanation could be that many existing boys’
substantially lower than their female counterparts
and the general population of students without
disabilities.
A worrisome trend emerged when the exercise
frequencies of children with disabilities were tracked
across grade levels. Exercise frequency took a steep
downturn for both high school girls and boys with
disabilities. See Figure IX-9. The decline was not as
great for high school students without disabilities.
Finally, despite the fact that boys with disabilities
were less actively involved with sports and exercise
than their female counterparts, the boys were more
Girls Boys
4.9 5.0
3.1
4.5 4.5
3.0
0.0
1.0
2.0
3.0
4.0
5.0
6.0
4.2 4.1
3.5
4.4
4.8
4.5
Table IX-9: Physical Disability or Health Problem and Exercise Frequency,
by Gender and Grade Level
3rd-5th Grade 6th-8th Grade 9th-12th Grade 3rd-5th Grade 6th-8th Grade 9th-12th Grade
Physical Disabilityor Health Problem
No Physical Disabilityor Health Problem
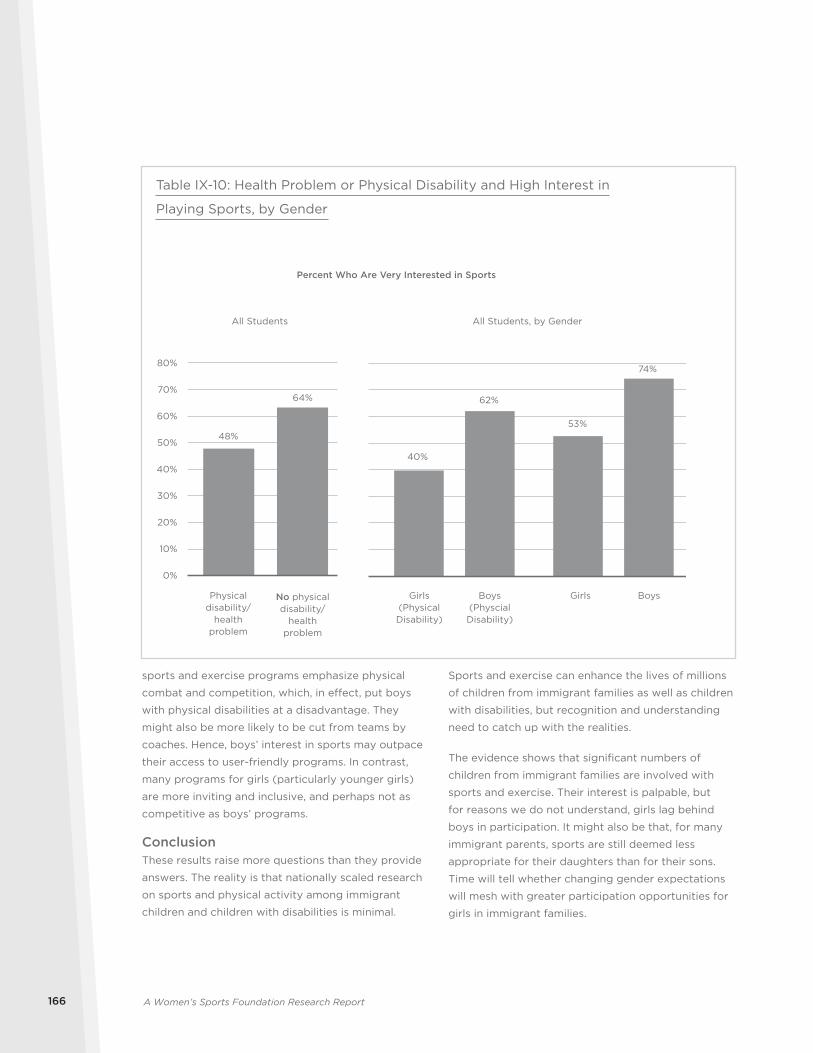
A Women’s Sports Foundation Research Report166
Sports and exercise can enhance the lives of millions
of children from immigrant families as well as children
with disabilities, but recognition and understanding
need to catch up with the realities.
The evidence shows that significant numbers of
children from immigrant families are involved with
sports and exercise. Their interest is palpable, but
for reasons we do not understand, girls lag behind
boys in participation. It might also be that, for many
immigrant parents, sports are still deemed less
appropriate for their daughters than for their sons.
Time will tell whether changing gender expectations
will mesh with greater participation opportunities for
girls in immigrant families.
sports and exercise programs emphasize physical
combat and competition, which, in effect, put boys
with physical disabilities at a disadvantage. They
might also be more likely to be cut from teams by
coaches. Hence, boys’ interest in sports may outpace
their access to user-friendly programs. In contrast,
many programs for girls (particularly younger girls)
are more inviting and inclusive, and perhaps not as
competitive as boys’ programs.
ConclusionThese results raise more questions than they provide
answers. The reality is that nationally scaled research
on sports and physical activity among immigrant
children and children with disabilities is minimal.
All Students
48%
64%
All Students, by Gender
40%
62%
53%
74%
0%
10%
20%
30%
40%
50%
60%
70%
80%
Girls Boys
Percent Who Are Very Interested in Sports
Table IX-10: Health Problem or Physical Disability and High Interest in
Playing Sports, by Gender
Physicaldisability/
healthproblem
No physicaldisability/
healthproblem
Girls(PhysicalDisability)
Boys(PhyscialDisability)

Go Out and Play: Youth Sports in America 167
The findings belie stereotypical images of children
with disabilities leading sedentary lives and being
disinterested in sports. Substantial numbers of
children with disabilities do participate in sports and
exercise, and many of their parents take advantage
of special school or community programs when they
are available. Meanwhile, other parents say more
sports and exercise opportunities are needed for their
children with disabilities, but it also appears that more
boys than girls are being left out the action. Both girls
and boys with disabilities want and deserve greater
access to physical activity.
A Women’s Sports Foundation Research Report168
active and athletic child. Many results presented
here show that sports favorably influence
children’s educational, physiological and emotional
development. But healthful youth development
through sports cannot flourish without the cultural
commitment and involvement of families, schools
and communities.
This research report provides parents, educators,
sports leaders, health advocates and public officials
with facts and analysis that can further understanding
of how to tap the real and potential power of sports
to enhance the lives of U.S. girls and boys. A group
of nationally recognized leaders from government,
education, academia and sport were invited to review
an earlier copy of this report and to recommend
guidelines for future planning and action. We
gratefully acknowledge their insights and expertise.
Provide Young Girls with the Tools to Succeed 1.
at Sport
Girls enter sports later in childhood than boys. Urban
girls generally participate in sports about two years
less than their rural and suburban counterparts;
i.e., they enter sports later in girlhood and drop
out sooner. Late entry into sport likely hinders the
development of basic physical skills and cultural
values that may be setting girls up for failure and
drop-out during the middle school years. The
actions below can help recruit, retain and train girls
more effectively.
The creation of more girl-centered sports and •
exercise programs that emphasize “fun and
friendships” may help schools, communities and
church leagues successfully recruit and retain girls
of elementary school age.
Middle schools might devise ways to identify and •
engage girls with histories of late entry into sport
in order to ease their transition into sports during
the sixth to eighth grades. The “newcomers” may
benefit from remedial training in basic exercise and
skills development.
X. Conclusion and Policy RecommendationsThere is no single source of reliable data that
can guide policy debates and planning in sport,
education and public health. Current scientific
research is consistently requested of the Women’s
Sports Foundation by the American public, media,
prospective funding sources, governmental agencies
and girl-serving organizations. This nationwide
study of athletic participation and physical activity
among girls and boys was undertaken to meet
these information needs. Consonant with this
goal, this project was also designed to provide an
evidence-based foundation for public debate and
policy development.
This study points to a formidable challenge to get
more girls involved with physical activity and sports.
Girls’ athletic participation has gone up since Title
IX, but not all girls are benefiting equally. In many
communities, girls lag behind boys in exercise
frequency and athletic participation. Much of the
gender gap in sports and physical activity is rooted
in wider economic inequalities, which, in turn, can
erode or elevate the capacity of families, schools
and communities to provide equal opportunities for
all children to engage in exercise and sports. The
convergence of the gender gap and wealth gap is
particularly salient in U.S. cities, where the rate of
physical activity among urban girls lags well behind
their male counterparts. Girls in rural communities
also often lack similar access to sports and exercise
programs as boys. The greater parity between girls’
and boys’ involvement with sports in suburban
communities not only shows that progress toward
gender equity in sports and physical activity has been
made but that it can be made.
Children’s interest and engagement in sports and
physical activity are either promoted or held back by
the amount of opportunities that flow through their
families, the schools they attend and the communities
in which they dwell. Just as the proverbial village
raises the child, it takes an orchestrated social
commitment to inspire and produce a physically

Go Out and Play: Youth Sports in America 169
Coaches can identify and work more closely •
with children to help them develop fundamental
physical skills that can, in turn, foster successful
development in relation to exercise and
athletics. Communities and school districts can
provide coach education programs in order to
raise awareness or girls’ unique interests and
developmental needs with regard to sport.
An emphasis on fun and fundamentals may help •
hold girls’ attention and personal commitments
to physical activity throughout the middle-school
period, when a surge in sport drop-out occurs
(especially among urban girls).
Similar interventions are likely to help those boys •
who may display late interest and entry in sport.
Help Families Tap the Resource of Sports2.
Families can gain from their children’s involvement
with sports, regardless of family type, income levels
and differences in race and ethnicity. The synergies
between sport and family well-being can be enhanced
in these ways.
Family-school partnerships should be created that •
promise to enhance children’s involvement with
community-based and school sports programs.49
Because poor families and single-parent •
families often do not have adequate social and
economic resources to facilitate their children’s
sports involvement, voucher programs and
scholarship incentives can be instituted to increase
participation opportunities.
School and community sport leaders can also •
reach out to single parents through educational
interventions and orientation programs that
welcome daughters and sons into organized teams.
Appropriate and culturally sensitive arrangements •
can be made to assuage parental concerns about
program safety and responsible supervision
of daughters.
Capitalize on School-Based and After-School 3.
Physical Education
School administrators and public officials should
work to redress the deficiencies in physical education
that are affecting girls, particularly girls in urban
schools. Many school-based physical education and
after-school activity programs are being underutilized
by girls.
Nationally and regionally scaled steps should be •
taken to counteract the downturn in physical
education attendance among high school girls.
Local, state, and federal health planners need to •
further invest in physical education and youth
sports as key elements of preventive health policy.
Guidelines and practices should be developed •
to close the gap in physical education between
girls and boys, girls of color and Caucasians,
and schools in poor communities and more
affluent communities.
School boards can reverse the cuts in PE offerings, •
make PE mandatory, and broaden the curriculum
to appeal to the wide range of girls’ interests in
exercise and physical activities.
Increasing opportunities for exercise in PE classes •
are also likely to be a highly effective mechanism
for infusing exercise into the lives of children who
do not like sports.
School officials can seek grants to initiate, expand, •
and improve their physical education programs for
K-12 students through the Carol M. White Physical
Education Program (PEP). For information on how
to apply, visit www.ed.gov
Schools and communities can seek information and •
resources in order to enhance their existing health
and physical education programs. For example,
see www.pe4life.org

A Women’s Sports Foundation Research Report170
Address Girls’ Wider Interests in Sports and 4.
Exercise Activities
U.S. girls, especially girls in third to eighth grades,
are interested in a more varied array of sports and
exercise activities than boys. And yet many schools
and community programs continue to offer traditional
physical activities and sports options, which, often,
have greater appeal for young boys than girls. Some
steps to provide more appealing opportunities follow.
In addition to traditional sport offerings, state high •
school associations can develop innovative sports
and physical activity programs that appeal to
increasing numbers of girls.
School and community leaders should broaden the •
concept of sports and physical activity in order to
recruit and meet the needs and interests of more
diverse groups; e.g., preteen girls, immigrants and
children with disabilities.
Local governments should subsidize nontraditional •
community sports and physical activities. The
inclusion of emerging and recreational activities
may foster greater physical activity and
protracted involvement through later childhood
and adolescence.
Close the Gender Gap in Sports and 5.
Physical Activity
The playing fields of youth sports and physical activity
have changed with regard to gender, but they have
yet to be leveled. Steps in this direction include
the following.
Parent-teacher associations, school officials, •
business leaders and community members should
promote public education around girls’ participation
in sports and physical activity.
The extent of gender equity within sports and •
physical activity programs within schools,
communities and after-school programs should be
actively evaluated.
Policy discussions and planning should aim at •
providing equal opportunities and treatment for
girls, a requirement of Title IX, a federal gender
equity law.
More public education about the social, educational, •
physiological, and epidemiological contributions of
girls’ sports participation needs to be done.
Family-school partnerships should be developed •
that that speak up for girls’ involvement with sports
and exercise.
Counteract the Negative Impacts of Economic 6.
Disparities on Children’s Development
through Sports
This report documents a variety of ways that reduced
economic resources in communities and families
negatively erode children’s chances to develop
personal and social well-being through sport.
The steady growth of “pay to play” sports programs •
in many schools and communities threatens to
further reduce participation among children from
poorer families—the very children for whom athletic
participation rates are already lower than their more
economically privileged peers. Policies should be
put in place that help less affluent families and their
aspiring athletes to fully participate in school and
community programs.
Corporations and non-profit organizations should •
continue to work with schools and communities
in order to support the provision of sports and
physical activity programs for children.
More community service organizations might •
develop scholarship funds and other financial
supports that facilitate greater participation among
economically marginalized children.
Professionals within institutions of higher •
learning can develop “town-gown” partnerships
or collaborations that seek to enhance poorer
children’s access to sport and physical activity

Go Out and Play: Youth Sports in America 171
programs; e.g., provide coaching resources, allow
community access to athletic and training facilities,
and set up mentoring programs between college
athletes and young athletes.
Empower Children with Disabilities 7.
Nine percent of American families have a child with
a disability who may have limited opportunities to
engage in sports or other physical activities. Many
parents in these families desire greater physical
activity opportunities for their children.
Much more research is needed to assess the •
interests and opportunities of pre-teen and teenage
children with disabilities.
School administrations, parent-teacher associations, •
and community leaders can evaluate whether or not
schools and physical activity providers are meeting
their obligations under the Rehabilitation Act of the
Americans with Disabilities Act to provide physical
activity to individuals with disabilities.
School administrators, community leaders, and •
government officials should find ways to develop
and provide exercise and sport programs that
include children with disabilities.
Increased efforts should be made to develop •
appropriately designed programs that attract and
involve parents and their children with disabilities.
Acknowledge the Physical Activity Needs of 8.
Children in Immigrant Families
About one-quarter of the U.S. children surveyed
indicated that one or both parents were born abroad.
Sport leaders, educators and public health •
advocates should begin to assess immigrant
children’s interest and involvement with sports and
physical activity.
Special focus should be on girls in immigrant •
families because their participation levels are
significantly lower than boys.
Scholars and researchers who study the social, •
economic, historical, and health-related facets of
immigration in the U.S. should include the institution
of sport as a key area for investigation and policy
assessment.
Recognize Diversity and Who Is In and Out of 9.
the Game
Schools, community-based programs, sport
governing bodies and commercial fitness/sport
programs should monitor minority participation in
athletics. Large numbers of girls as well as African-
American, Hispanic and Asian boys have joined
their Caucasian counterparts. The athletic and social
experiences within and across each of these groups
vary significantly by grade level, school location and
socioeconomic background.
Sport governing bodies should monitor and •
evaluate the ongoing provision of athletic
participation opportunities across race, ethnicity
and gender.
School and community program leaders should •
consider developing innovative sports and exercise
programs that fit some of the unique needs
and interests of children from different cultural
backgrounds, rather than expecting that all children
fit into the existing array of existing programs.

A Women’s Sports Foundation Research Report172
Appendix A: National Policy Advisory BoardAnita DeFrantz, Esquire, President, LA84 Foundation,
former Vice President of the International Olympic
Committee, member of the United States Olympic
Committee Executive Committee
Sumru Erkut, Ph.D., Associate Director and Senior
Research Scientist, Wellesley Centers for Women
Anne Flannery, Executive Director, PE4Life
Robert Gardner, Chief Executive Officer, National
Federation of State High School Associations
Mary Hums, Ph.D., Professor, Sports Administration,
University of Louisville
Deborah Slaner Larkin, former Executive Director of
the Women’s Sports Foundation, former member of
the President’s Council on Physical Fitness and Sports.
Michael Messner, Ph.D., Professor of Sociology and
Gender Studies, University of Southern California
Kathleen Miller, Research Scientist, University of
Buffalo Research Institute on Addictions
Merrill Melnick, Professor, Department of Physical
Education and Sport, State University of New York,
the College at Brockport
Benita Fitzgerald-Mosley, President and CEO, Women
in Cable Telecommunications
Donald Siegel, Ed.D., Professor, Department of
Exercise and Sports Studies, Smith College

Go Out and Play: Youth Sports in America 173
Appendix B: Research Design and Methods Harris Interactive, Inc. conducted Youth Sport in
America, a survey of parents and a survey of students
in grades 3 through 12, on behalf of the Women’s
Sports Foundation and in cooperation with the Center
for Research on Physical Activity, Sport & Health
at D’Youville College. The research design included
telephone interviews with a nationally representative
sample of 863 parents of children in grades 3 through
12. A total of 2,185 students in grades 3 through 12
were surveyed during an English class. Questionnaires
were administered by the classroom teacher, who
proctored the class and was available to answer
any student questions. The surveys are intended to
explore children’s participation in sports and physical
activities, with a particular focus on organized and
team sports. Topics covered in the surveys included
attitudes towards sports and physical activities,
sources of encouragement and support as well as
family and person satisfaction measures.
The design and methodological facets of the study
are discussed below. Additional details, information
about procedures, and questions regarding statistical
analyses can be routed to the Principal Investigator,
Don Sabo, Ph.D., as well as members of the Harris
Interactive, Inc. research team.
Public Release of Survey FindingsAll Harris Interactive, Inc. surveys are designed to
comply with the code and standards of the Council of
American Survey Research Organizations (CASRO)
and the code of the National Council of Public Polls
(NCPP). Because data from the survey may be
released to the public, release must stipulate that
the complete report is also available. Design and
methodological details can also be secured from the
Principal Investigator, Don Sabo, Ph.D., at the Center
for Research on Physical Activity, Sport & Health.
Parent Survey MethodologyThis methodology describes the sampling and
interviewing procedures used by Harris Interactive
Inc., for the parent survey in the Youth Sport in
America report. The survey questionnaire was
administered by means of a telephone interview to a
representative national sample of 863 adults, 18 years
of age or older, who were parents or legal guardians
of children in grades 3 through 12. The interview
averaged 11 minutes in length. Interviewing took place
between April 13, 2007, and May 22, 2007
The SampleThe Harris Interactive telephone sample is based on
a methodology designed to produce representative
samples of persons in telephone households in the
48 continental United States. The Harris telephone
sample makes use of random digit selection
procedures that ensure equal representation
of persons in households “listed” in telephone
directories, as well as persons in households which are
“unlisted” in telephone directories.50
Parents of African-American and Hispanic children
were interviewed at a higher rate than typical random
digit selection procedures to allow for more detailed
analysis of these populations. Sample for these
respondents was drawn using both random digit
selection procedures described above and targeted
random digit selection, based on known distributions
of minority population.
School Survey MethodologyAn OverviewHarris Interactive, Inc. has developed a sampling
process and survey methodology for surveying
nationally representative samples of school students.
All interviewing is conducted in the classroom.
A self-administered questionnaire was administered
during class time to 2,185 students in grades 3
through 12. Interviews were conducted between
February 21, 2007, and June 19, 2007, and then again
between September 13, 2007, and October 30, 2007.
There are several benefits that can be gained
from school-based interviewing as compared to
home-based, in-person or telephone interviewing.
The school setting proves to be far more neutral,
A Women’s Sports Foundation Research Report174
since young people are allowed to express their
attitudes and experiences without the influence of
a parent nearby. The privacy of a self-administered
questionnaire provides further guarantee of
confidentiality when asking young people questions
of a sensitive nature. The school-based method also
provides opportunities for the use of audio-visual aids.
Furthermore, this approach ensures that the sample
will include young people in households without
telephones or whose parents might otherwise not
agree to allow their child to complete an interview.
Creating a School SampleThe Harris national probability sample of schools and
students is based on a highly stratified two-stage
sampling design. This design employs features similar
to the sample designs used in various national surveys
of students and schools that are conducted by the
National Center for Educational Statistics (NCES).
Sample was drawn from a list of approximately
100,000 public, private and parochial schools in the
United States. Public schools were selected from a
list of public schools obtained from NCES. The listing
of private and parochial schools was obtained from
Market Data Retrieval. It is selected to account for
differences in grade enrollment, region and the size of
the municipality where schools are located. A random
selection of schools is drawn on the basis of the
number of students in each cell proportionate to the
number of students in the universe, creating a cross
section of young people in a set of designated grades
(in this study, grades 3 through 12).
Gaining the Principal’s Consent and Selecting a ClassAfter sending a letter to principals soliciting their
participation, Harris Interactive, Inc. contacted
the principals in selected schools by telephone to
request their participation in the survey. An eligible
grade was randomly assigned to each school. If the
principal agreed to participate in the survey, a random
selection process was then used to select a particular
class to complete the survey. The principal was asked
to alphabetize all classes for the grade assigned by
the Harris firm. Using a random number selection
grid, an interviewer identified an individual class. For
junior and senior high school, where students attend
different classes for each subject, only English classes
were used to make the selection. Since all students
in all grades must study English, this ensures a more
representative sample of students by academic track
and level of achievement.
Weighting of Data
As with all school-based surveys, a two-stage
weighting process is used to ensure a representative
sample of students. These weights are based on data
from the National Center for Educational Statistics
and the U.S. Bureau of the Census, and they control
the distribution of students by grade, region, size of
place, gender and race/ethnicity. The average class
size was 23 students per class.
Data Analysis
Descriptive statistics are reported throughout the
report. Subgroup comparisons were also made using
t-tests or chi square analyses in order to evaluate
basic hypothesized differences between subgroups.
These results are reported in most cases in the tables
and figures. In some cases, multivariate analyses
were conducted in order to assess whether key
hypothesized relationships remained significant
after controlling for additional variables; e.g., would
a hypothesized gender difference remain significant
after controlling for age, race and ethnicity, and
median family income? Footnotes are included in
the text to earmark use of multivariate analyses.
Finally, because the surveys produced cross-sectional
data, no claims are made for causal relationships in
this report. For details on data analysis procedures
and results, contact the principal investigator, Don
Sabo, Ph.D.
MeasuresThe measures for the main variables in this study
appear below. Consult the Principal Investigator, Don
Sabo, Ph.D., for additional information.

Go Out and Play: Youth Sports in America 175
Academic Achievement: Students were asked
to indicate “What grades do you usually get?”
Responses ranged from “Mostly A’s” or “Mostly
A’s and B’s” to “Mostly D’s and F’s.” An additional
response alternative stated, “My school does not
use grades.”
Age at Entry into Sport: Parents were asked, “How
old was your (#) year-old daughter (son) when
she (he) first started participating in organized or
team sports?”
Age at Drop-out: Parents were asked, “How old was
your (#) year-old daughter (son) when she (he)
stopped participating in organized or team sports?”
Athletic Participation: Children indicated the total
number of teams played in response to, “During the
past 12 months, on how many sports teams did you
play? Please include any teams run by your school
or community.”
Athletic Participation (Parental Estimates): Parents
were asked, “During the past 12 months, on how
many organized and team sports their (#) year-old
daughter (son) played?”
Athletic Ability: This concept was measured
combining student responses to three Likert-type
statements, “I’m not very good at sports,” “It is
easy for me to learn a new kind of exercise,” and “I
could get really good at a new sport if I tried it.” The
Cronbach’s alpha coefficient = .556.
Athletic Identity: This concept was measured
combining student responses to three Likert-type
statements, “Sports are a big part of who I am,” “I
plan to be involved with sports and exercise when
I am an adult,” and “I see myself as an athlete.” The
Cronbach’s alpha coefficient = .807.
Athletic Involvement: Students were asked, “During
the past 12 months, on how many organized or team
sports did you play? Please include any organized
or team sports run by your school or community.”
Response categories included “no teams,” “1 team,” (2
teams,” and “3 or more teams.”
Body Esteem: This concept was measured combining
student responses to three Likert-type statements, “I
feel confident about my body,” “I don’t like the way
my body looks,” and “My body is getting healthier.”
Cronbach’s alpha = .628.
Body Mass Index: The terms “underweight,” “healthy
weight,” “at risk of overweight” and “overweight”
are used by the Centers for Disease Control (CDC)
when describing children. There is no generally
accepted definition for “obesity” as distinct from
overweight in children and adolescents. This helps
to explain why the CDC uses a different set of terms
in their screening tools for children. The operational
definition of overweight used in this study is as
follows. Overweight is defined as above the 95th
percentile for the sex/age-appropriate scale. At
risk of overweight is defined as the 85th percentile
to less than the 95th percentile. An individual
child’s percentile indicates his or her relative position
to other children of the same sex and age. Age and
sex are considered for boys and girls because the
amount of body fat changes with age and the amount
of body fat differs between girls and boys. The BMI
calculations here are estimates—both because the
children are self-reporting their height and weight
and because the age-by-sex cut-offs used to define
the categories (healthy weight, at risk of overweight,
etc) are approximate rather than specific measures.
Finally, before data collection proceeded, teachers
in third to fifth grades were provided with tutorial
materials and an information form that involved
parents with teaching their children about height
and weight before the survey was administered.
This was done to augment the accuracy of their
responses. Despite this effort to enhance validity, we
still excluded the self-reported heights and weights
of third- to fifth-grade children in our hypothesis
tests due to a lack of confidence in the accuracy of
their reporting.

A Women’s Sports Foundation Research Report176
Community Income Level: The concept of
“community income level” refers the general
economic conditions of a community in which a
particular school is embedded. For this study the
school community income level was assessed by
gleaning statistics from Department of Census data
and the Common Core of Data (CCD) created by
the U.S. Department of Education’s National Center
for Education Statistics. The concept of “school
community” refers the community in which a
particular school is embedded. The economic vitality
of the communities was measured by the median
family income within the census track in which the
school was located. Based on these indicators, school
communities were categorized as lower-income,
middle-income, or upper-income. These same
government data sources were used to determine the
percentage of racial and ethnic minorities that live
within the school communities under study.
Disability Status of Child: Given the complexity
surrounding the myriad types of disabilities among
children, it was difficult to develop a highly valid
measure of disability status that could be integrated
into both the parent telephone survey and student
survey. In addition, basic terminology had to be used
in the parent survey to describe children’s disabilities
due to the wide range of educational backgrounds
of respondents. Simple and direct language was also
used in the student survey due to the young age of
many participants (e.g., third- to fifth-grade children).
It was also assumed that this study was an initial
step to assess the prevalence and perceptions of
children with disabilities as well as their parents using
nationwide samples. Parents were asked “Does your
(#) year-old daughter (son) or any of your children
have a health problem or disability that keeps her
(him) from doing sports or other physical activities?”
and, if necessary, “Does your child have a chronic
or persistent health problem?” Responses include,
“Yes, my (#) year-old daughter (son), “Yes, other
child(ren),” “No,” and “Don’t know.” In the student
survey, children responded “yes” or “no” when asked,
“Do you have a health problem or handicap that stops
you from doing sports or other physical activities?”
Drop-out Reasons of Children: Students indicated
“yes” or “no” to a list of 16 reasons in response to
the following instruction: “Is each of the following
statements a reason why you stopped or dropped out
of playing an organized or team sport? I stopped or
dropped out of an organized or team sport because…”
Students also had an option to write in their own
reason (which was later open-coded).
Drop-out Reasons of Parents: Parents voiced their
responses to this inquiry: “There are many reasons
why some young people stop playing organized or
team sports. Please tell me why you (#) year-old
daughter (son) stopped playing an organized or
team sport?” Statements were recorded and later
open-coded.
Enjoyment of Exercise: Student expressed
agreement or disagreement to the statement, “I really
enjoy exercise.”
Extracurricular Involvement: Students responded
“yes” or “no” to statement, “Do you participate in any
clubs or groups either in school or outside of school?”
Family Satisfaction: Family satisfaction was measured
with the 10-item Family Adaptability & Cohesion Scale
developed by D.H. Olson, J. Portner & Y. Lavee. The
Cronbach’s alpha for this study = .897.
Family Type: Based on basic demographic data
from either the parent survey or student survey,
families were categorized as “single-parent” or “dual-
parent” families.
Immigrant Family Status: The parent telephone
survey asked two questions to determine immigrant
family status: “Were you born in the United States or
another country?” and “Was your spouse or partner
born in the United States of another country?” The
student survey asked two questions. First, “In what
country were you born?” Responses included, “the

Go Out and Play: Youth Sports in America 177
United States,” “another country,” “not sure.” Second,
“In what country were your parents born?” Responses
included, “Both of my parents were born in the U.S.,”
“One of my parents was born in the U.S. and the other
was born in another country,” “both of my parents
were born in another country,” and “not sure.”
Importance of Sports for Children: Children
expressed agreement or disagreement with the
statement, “Sports are a big part of who I am.”
Importance of Sports for Children, Parent’s
Perceptions: Parents were asked to describe the
extent that “sports are an important part of my child’s
life.” Likert-type response alternatives were provided.
Interest in Exercise and Physical Activity (Parental
Perceptions): Parents were asked to describe
their child’s interest in exercise and physical
activity ranging from “very interested,” “somewhat
interested,” “not very interested,” to “not at
all interested.”
Interest in Organized and Team Sports (Children’s):
Students were asked to agree or disagree with the
statement, “I am very interested in playing sports.”
Interest in Sports (Parent’s Perceptions): Parents
were asked, “How interested is your ##-year old
daughter (or son) in exercising and physical activity
– very interested, somewhat interested, not very
interested or not at all interested?”
Fast Food Consumption: Students were asked,
“How often do you eat at a fast food restaurant –
like McDonald’s, Burger King, Subway?” Responses
ranged between “twice a week” to “I don’t eat at fast
food restaurants.”
Importance of Sports: Students were asked, “How
important is playing sports in your life right now?”
Responses included, “It’s the most important thing in
my life,” It’s one of the most important things in my
life,” “It’s not very important in my life,” and “It’s not
at all important in my life.”
Immigrant Family Status: If one or both parents were
reported to be born outside the United States, the
family is considered an “immigrant family.”
Location of Child’s Athletic Program: Parents were
asked, “Where is your (#) year-old daughter (son)
involved with these organized or team sports? Is
the program through a school, church or house of
worship, community program or center, private
organization or club, or somewhere else?”
Mentorship in Exercise & Sport: Students were asked
to identify “Which two people have taught you the
most about exercise and how to play sports?”
Parental Involvement: Parents were asked, “When
your child is playing an organized or team sport,
how often do you or the child’s other parent do
the following with your child related to her (his)
involvement in the sport?” Their responses to four
statements were combined to create the “parental
involvement” score. See Section III for details on
response categories. Cronbach’s alpha = .685.
Parents’ Perceived Equity in Sports: Parents were
asked to voice their agreement and disagreement
with the following statements. 1. The schools in
my community care more about boys’ sports
programs than girls’ sports programs. 2. Boys are
more interested in playing sports than girls. 3. My
community offers more sports programs for boys
than girls. 4. If I wanted to help a girl get more
physically active, I know what steps to take in order to
make this happen.
Participation in Clubs: Students were asked, “Do you
participate in any clubs or groups, either in school
or outside of school? Do not include sports teams.”
Response alternatives included “Yes, I participate in
a club or group” and “No, I do not participate in any
clubs or groups.”
Physical Education Frequency: Students were asked,
“In a typical week, how often do you have a physical
education (PE) or gym class at school? Responses

A Women’s Sports Foundation Research Report178
included “4 times a week or more,” “twice a week,” “3
times per week,” “once a week,” “never.”
Popularity at School: Students were asked, “Which
of the following best describes you?” Response
alternatives included, “I am very popular at school,”
“I am somewhat popular at school,” and “I am not
popular at school.”
Popularity for Boys: “What is the one sure thing that
would make a boy popular in your grade at school?”
Students checked on of 7 reasons for popularity or
write in their own reason.
Popularity for Girls: “What is the one sure thing that
would make a girl popular in your grade at school?”
Students checked on of 7 reasons for popularity or
write in their own reason.
Reasons for Never Playing Sports (Parents): Parents
who said their child had never played an organized or
team sport were asked, “There are many reasons why
some young people never play an organized or team
sport. Please tell me why your (#) year-old daughter
(son) never played an organized or team sport.”
Reasons for Never Playing Sports (Children): Parent
who said their child had never played an organized or
team sport were asked, “There are many reasons why
some young people never play an organized or team
sport. Please tell me why your (#) year-old daughter
(son) never played an organized or team sport.”
Self-Described Health: Students were asked to
describe their own health using these categories--
“excellent,” “very good,” “good,” “fair” and “poor.”
School Location: For the student survey, principals or
superintendents were asked to indicate if their school
was located in an rural, suburban or urban community.
For the parent survey, parents were asked the same
question with regard to their child’s school.
Sources of Encouragement: The student survey asked
respondents, “During the past month, how much has
each of the following people encouraged you to be
involved with sports and exercise? Has this person
encouraged you a lot, encouraged you a little, or did
not encourage you? If this type of person is not in
your life, please mark that column.”
Television Watching: Students were asked to report
the number of hours they watch television each day
and during weekends.
Types of Sports and Exercise: “During the past 12
months, which of the following sports or exercise have
you done?” Students checked off as many activities
from a list of 33 activities and, if preferred, they could
write in an additional activity on a blank line.
Quality of Life: Students answered the question, “How
well does each of the following statement describe
you?” Response alternatives included “A lot like me,”
“Somewhat like me,” “Not much like me,” and “Not at
all like me.” The statements included (1) I have a lot
of friends, (2) I get along well with my parents, (3) I
am often bored, (4) I often feel sad and unhappy, (5)
I have been happy at school this year, and (6) I get
into trouble a lot. This measure was developed by the
Kaiser Family Foundation.
School Location (or Urbanicity): The urbanicity
code (Q410) in the parent survey data file reflects
the urbanicity of the plurality of households in that
exchange (the first three digits of a seven-digit phone
number, a level of greater detail than the area code
alone). It is not based on a respondents’ answers.
Metropolitan Statistical Areas, as documented by
the Office of Management and Budget, determine
urbanicity. Locations in a central city of a MSA are
coded as Urban. Location not in a central city of a
MSA are coded as suburban. Locations not in an MSA
are coded as rural. Urbanicity coding is interative
process. Census tracts are first coded by urbanicity
based on the plurality of the population in the tract.
Then tract-level codes are converted to exchange-
level codes again based on the disposition of the
plurality of the population of households.

Go Out and Play: Youth Sports in America 179
Vigorous Physical Activity: Children were asked, “On
how many of the past 7 days did you exercise or do a
physical activity for at least 20 minutes straight that
made you sweat and breathe hard, such as basketball,
soccer, running, swimming laps, fast bicycling, hiking,
fast dancing, or similar activities?”
Vigorous Physical Activity (Parental Estimates):
Parents were asked, “How often does your daughter
(or son) exercise or do a physical activity for at least
20 minutes straight that makes her (him) breathe
hard and sweat?” Reponses included “everyday or
almost everyday,” “3-5 times a week,” “Once or twice
a week,” “a few times a month,” “less than once a
month,” and “never.”
Where Children Are Involved: The school survey
asked, “Where do you most often play an organized
or team sport?” Responses included “at school,” “in
after-school programs,” and “someplace else.”

A Women’s Sports Foundation Research Report180
Endnotes1 Two recent reviews of research on the links
between sport and the health of girls and women
are: Tucker Center for Research on Girls & Women
in Sport (2007). The 2007 Tucker Center Research
Report, Developing physically active girls: An
evidence-based multidisciplinary approach.
University of Minnesota, Minneapolis, MN:
Author; and Oglesby, C. A. and the International
Working Group on Women and Sport (IWG) and
WomenSport International (WSI) (December
2007), Women, Gender Equality and Sport: New
York: United Nations Publications
2 National Federation of State High School
Association, High School Sports Participation
Increases Again; Girls Exceed Three Million for
First Time. Retrieved online at www.nfhs.org/
web/2007/09/high_school_sports_participation.
aspx
3 Logistic regression was used to predict the odds
of students who were more likely to be moderately
involved with sports along with students who were
more likely to by highly involved in sports. Age,
gender, race, family structure, community income
level and community type were the independent
variables included as the relevant predictors in
the logistic regression models. Gender was a
significant predictor for both moderately and
highly involved athletes while controlling for
the variables mentioned above. Being female
increased the odds of being moderately involved
in sports by 25% (exp(b) = 1.255, p = .011), while
being female decreased the odds of being highly
involved in sports by almost 50% (exp(b) = .521,
p < .001).
4 Stevenson, B. (2007). Title IX and the Evolution
of High School Sports. Contemporary Economic
Policy, vol. 25, No. 4, 486-505.
5 A factor analysis was done in order to explore
whether specific clusters of activities formed
coherent general sub-groupings of activities. For
example, if a student indicated playing football
in the last year, they were also very likely to have
indicated playing basketball, baseball, track and
field, jogging, soccer and weight lifting. This cluster
forms a general sub-group of traditional sports
that are very commonly engaged in by student
throughout the United States. More detailed
tables of the factor analysis can be provided
upon request.
6 The U.S. Centers for Disease Control standards of
regular physical activity call for physical activity
that raises the heart rate and makes individuals
breathe hard some of the time for a total of at
least 60 minutes/day on more than five of the
seven days preceding the survey.
7 Nelson, T. F., Gortmaker, S. L., Bubramanian, S. V.
& Wechsler, H. (2007). Vigorous physical activity
among college students in the United States.
Journal of Physical Activity and Health, 4: 495-508.
8 Olson, D. H., Portner, J. & Lavee, Y. Family
Adaptability & Cohesion Scale. The utility of this
scale was demonstrated by Farrell, M. and Barnes,
G. (1993) Family systems and social support: A test
of the effects of cohesion and adaptability on the
functioning of parents and adolescents. Journal
of marriage and the Family, 55:119-32. Within
this study, the alpha reliability coefficient for the
10-item Family Satisfaction score was calculated
at .879.
9 Edin, K. & Kefalas, M. (2005). Unmarried with
children. In J. Goodwin and J. M. Jasper (Eds.)
The Contexts Reader. New York: W.W. Norton,
pp. 62-68.
10 Smeeding, T. (2005), Government Programs
and Social Outcomes: The United States in
Comparative Perspective. Luxembourg Income
Study Working Paper Series. Working Paper No.
426, pp. 20-22. Cited in Todd, C. (Feb. 2007),
Poverty reduction and welfare provision for single
parents in Aotearoa/New Aealand and the United
States: AComparative Analysis. Paper for USBIG
Conference (Feb 2007).

Go Out and Play: Youth Sports in America 181
11 Weinschenker, M. & Heuveline, P. (2006). The
International Poverty Gap: Does Demography
Matter? Luxembourg Income Study Working Paper
Series, Working Paper No. 441, p.3. Cited in Todd,
C. (Feb. 2007), Poverty reduction and welfare
provision for single parents in Aotearoa/New
Aealand and the United States: AComparative
Analysis. Paper for USBIG Conference (Feb 2007).
12 Videon, Tami M. (2002). Who plays and who
benefits: Gender, Interscholastic Athletics, and
Academic outcomes. Sociological Perspectives
45:415-444.
13 Harrison, P. A. & Narayan, G. (2003). Differences in
behavior, psychological factors, and environmental
factors associated with participation in school
sports and other activities in adolescence. The
Journal of School Health, 73(3), 113-120.
14 Snyder, E. E. and E. Spreitzer (1990). Sport,
education, and schools. In Handbook of Social
Science of Sport, edited by G. R. F. Lueschen and
G. H. Sage. Champaign, IL: Stipes Publishing. Miller,
Kathleen E., Grace M. Barnes, Donald Sabo, Merril
Melnick and Michael Farrell (2002). Anabolic-
androgenic steroid use and other adolescent
problem behaviors; Rethinking the male athlete
assumption. Sociological Perspectives 45: 467-
489. Tracy, Allison J. and Sumru Erkut, 2002.
Gender and Race Patterns in the Pathways from
Sports Participation to Self-Esteem. Sociological
Perspectives, 45: 445-466.
15 These connections were empirically documented
in an earlier Women’s Sports Foundation report.
See Sabo, D., Melnick, M., and Vanfossen, B.
(1989). Minorities in Sports. New York: Women’s
Sports Foundation.
16 It should be noted that the logistic regression
analyses showed that the association between
children’s athletic participation and family
satisfaction remained statistically significant after
controlling for the influences of socioeconomic
status, race and ethnicity, and the age of children.
Contact the authors of this report with questions.
17 The Cronbach’s alpha for the four-item Parental
Involvement score was .685.
18 Antonucci, T. C. & Akiyama, H. (1991). Convoys of
Social Support: Generational Issues. The Haworth
Press, pp. 103-118.
19 Messner, M. A. (forthcoming). It’s All for the Kids:
Gender, Families and Youth Sports. Berkeley, CA:
University of California Press.
20 Sack, K. (2007, October 20). Schools found
improving on nutrition and fitness. New York
Times, Section A; Column O; National Desk; pg. 10.
21 OLS regression was run to examine the
relationship between the frequency of PE classes
students have throughout the week and the
number of days students exercise during a typical
week. Gender, race, age, athletic participation,
community income level, community type and
frequency of PE classes were used to predict
weekly exercise frequency. Frequency of PE
classes was found to be a statistically significant
predictor of students’ weekly exercise frequency
(frequency of PE classes (β = .156, p < .001).
22 Centers for Disease Control and Prevention
(2005). Youth Risk Behavior Survey (YRBS).
23 Duncan, M. C. (2007). Sociological dimensions
of girls’ physical activity participation. Tucker
Center for Research on Girls & Women in Sport.
The 2007 Tucker Center Research Report,
Developing physically active girls: An evidence-
based multidisciplinary approach. University of
Minnesota, Minneapolis, MN, p. 34.
24 Garrett, R. (2004). Negotiating a physical identity:
Girls, bodies and physical education. Sport,
Education and Society, 9,223-237. Ronholt, H.
(2002). “It’s only the sissies…”: Analysis of teaching
and learning processes in physical education:

A Women’s Sports Foundation Research Report182
A contribution to the hidden curriculum. Sport,
Education and Society, 7, 25-36.
25 The relationship between athletic participation
and self-reported health for girls and boys was
tested using a logistic regression analysis to
predict which students were more likely to indicate
having excellent health. Age, gender, race, sports
involvement, family structure, community income
level and community type were the independent
variables included as the relevant predictors in the
logistic regression models. The analysis revealed
that the odds of a student indicating excellent
health were two times higher for highly involved
athletes when compared to non-athletes (exp(b) =
2.081, p < .001).
26 Field, A., Cheung, L., Wolf, A., Herzog, B.,
Gortmaker, S., and Colditz, G. (1999). Exposure
to the mass media and weight concerns among
girls. Pediatrics, 102(3). Available online at http://
pediatrics.aappublications.org/cgi/content/
full/103/3/e36. Sabo, D., Miller, K. E., Melnick, M.
J., & Heywood, L. (2004). Her Life Depends On
It: Sport, Physical Activity, and the Health and
Well-Being of American Girls. East Meadow, NY:
Women’s Sports Foundation.
27 Field, A., Cheung, L., Wolf, A., Herzog, B.,
Gortmaker, S., and Colditz, G. (1999). Exposure
to the mass media and weight concerns among
girls. Pediatrics, 103 (3). Available online at http://
pediatrics.aapulibcations.org/cgi/content/full/103/
e36.
28 The Cronbach’s alpha body esteem score is .628.
29 Kaestner, R & Xu, X. (2006). Effects of Title IX and
Sports Participation on Girls’ Physical Activity and
Weight. (2007). Advances in Health Economics
and Health Services Research, 17:79-111.
30 Bartlett, T., Lancaster, R. & New, N. (2005).
Pediatric Obesity: Use a Team Approach. The
Clinical Advisor (January, pp. 22, 25-31).
31 Anderson, P. S. & Butcher, K. F. (2006). Childhood
Obesity: Trends and Potential Causes. The Future
of Children, 16, pp. 19-45; Ferraro, K. F. and Kelley-
Moore, J. A. (2003). Cumulative disadvantage
of health: Long-term consequences of obesity?
American Sociological Review, 68:707-29. Toriano,
R. P., Flegal, K. M., Kuczmarski, R. J., Campbell, S.
M. & Johnson, C. L. (1995). Overweight prevalence
and trends for children and adolescents: The
National Health and Nutrition Examination Surveys,
1963-1991. Archives of Pediatric and Adolescent
Medicine, 149(10):1085-91, 1995 Oct..
32 Wigfield, A & Eccles, J. S. (2002). The
development of competence beliefs, expectancies
for success, and achievement values from
childhood through adolescence. In Development of
Achievement Motivation, edited by Alan Wigfield
and Jacquelynne S. Eccles. CA: Academic Press,
pp. 173-195.
33 Crosnoe, R. (2007). Gender, obesity, and
education. Sociology of Education, 80 (July):
241-260.
34 Perks, T. (2007). Does sport foster social
capital? The contribution of sport to a lifestyle
of community participation. Sociology of Sport
Journal, 24, 378-401.
35 The Cronbach’s alpha for the six-item quality of life
score was .570.
36 For a similar set of research results, see K.
Zittleman (2008). Being a girl and being a boy:
The voices of middle schoolers. In M. S. Kimmel &
A. Aronson (Eds.) The Gendered Society Reader.
New York: Oxford University Press, pp. 235-261.
37 The Cronbach’s alpha score for the quality of life
scale was .570.
38 OLS regression was run to examine the
relationship between students’ quality of life
score and athletic participation. Gender, race, age,

Go Out and Play: Youth Sports in America 183
athletic participation, family structure, community
income level, and community type were used to
predict quality of life scores. Athletic participation
was found to be the strongest predictor of
students quality of life scores (highly involved
athlete (β = .156, p < .001); moderately involved
athlete (β = .129, p < .001).
39 Sabo, D., Melnick, M. & Vanfossen, B. (1992).
Educational effects of interscholastic athletic
participation on African-American and Hispanic
youth. Journal of Adolescence 27(106):295-308.
Sabo, D., Melnick, M. & Vanfossen, B. (1992).
Effects of interscholastic athletic participation
on the social, educational, and career mobility
of Hispanic boys and girls. International Review
of Sport Sociology 27(1):57-75. Sabo, D.,
Melnick, M. & Vanfossen, B. (1993). Effects of
interscholastic athletic participation on post-
secondary educational and occupational mobility:
A focus on race and gender. Sociology of Sport
Journal.10(1):44-56.
40 Marsh, H. W. and Kleitman, S. (2003). School
athletic participation: Mostly gain with little
pain. Journal of Sport and Exercise Psychology,
25:205-228. Crosnoe, R. (2002). Academic and
health-related trajectories in adolescence: The
intersection of gender and athletics. Journal of
Health and Social Behavior, 43:317-335.
41 The relationship between athletic participation and
academic achievement remains significant after
controlling for age, socioeconomic status, and race
and ethnicity.
42 For a discussion of research-based best practices
for creating girls’ sports and physical activity
programs, see Tucker Center for Research on Girls
and Women in Sport (2007). The 2007 Tucker
Center Research Report, Developing physically
active girls: An evidence-based multidisciplinary
approach. University of Minnesota, MN: Author.
See also http://www.tuckercenter.org/projects/
tcrr/default.html
43 Discussions of just what constitutes a “girl-
centered” or “girl-sensitive” sports and exercise
program can be found in these sources. (1)
Cookey, C., (2006). Getting girls in the game: A
qualitative analysis of urban sports programs. A
dissertation, Department of Sociology, University
of Southern California. (2) Sabo, D. (2006). The
Boston Girls’ Sports & Physical Activity Project:
Midyear Report, 2006. Available through the
Women’s Sports Foundation, East Meadow, NY
11554. Sabo, D. & Ward, J. V. (2006). Wherefore
Art Thou Feminisms? Feminist Activism, Academic
Feminisms, and Women’s Sports Advocacy.
Scholar & Feminist Online, 4 (3). (4) Wheeler, K. A.,
Oliveri, R., Towery, I. D., & Mead, M. (2004). Where
are the girls? The state of girls’ programming in
greater Boston. Boston, MA: Girls Coalition of
Greater Boston.
44 For a discussion of how sex segregation in sports
may be negatively impacting girls’ development,
see McDonagh, E. & Pappano, L. Playing with the
Boys: Why Separate is Not Equal in Sports. New
York: Oxford University Press.
45 Portes, A. (Ed.) (1996). The New Second
Generation. New York: Russell Sage Foundation.
Portes, A. & Rumbaut, R. G. (2001). Berkeley, CA:
University of California Press.
46 Caution should be used when interpreting these
results due to the small base sample sizes. Some
parents may have been reluctant to reveal this
information to a telephone interviewer. For the
student survey, younger children may not be
certain of their parent’s birth place.
47 Pew Hispanic Center (October 2006), A Statistical
Portrait of the Foreign-Born Population at Mid-
Decade. Accessed online (November, 29, 2007),
http://pewhispanic.org/reports/foreignborn/
48 Ibid.

A Women’s Sports Foundation Research Report184
49 For relevant discussion of the role that family-
school partnerships can play with regard to
student academic achievement see Henderson, A.
T. & Mapp, K. L..(2002). A New Wave of Evidence:
The Impact of School, Family, and Community
Connections on Student Achievement. Austin, TX:
Southwest Educational Development Laboratory.
50 Some householders are “unlisted” as the result
of a request for an unlisted phone number by
the telephone subscriber. Other households are
“unlisted” in the published directory because
the telephone number was assigned after the
publication date of the directory. Samples that are
restricted to directory listed numbers only many
contain serious sample biases because of the
exclusion of various types of unlisted households.

Go Out and Play: Youth Sports in America 185

A Women’s Sports Foundation Research Report186

Template designed by Big Duck
About the Women’s Sports Foundation
The Women’s Sports Foundation—the leading authority on
the participation of women and girls in sports—advocates
for equality, educates the public, conducts research and
offers grants to promote sports and physical activity for
girls and women.
Founded by Billie Jean King in 1974, the Women’s Sports
Foundation builds on her legacy as a champion athlete,
advocate of social justice and agent of change. We strive
for gender equity and fight discrimination in all aspects
of athletics.
Our work shapes public attitude about women’s sports and
athletes, builds capacities for organizations that get girls
active, provides equal opportunities for girls and women,
and supports physically and emotionally healthy lifestyles.
The Women’s Sports Foundation is recognized worldwide
for its leadership, vision, strength, expertise and influence.
For more information, please call the Women’s
Sports Foundation at 800.227.3988 or visit
www.WomensSportsFoundation.org.

A Women’s Sports Foundation Research Report
Women’s Sports Foundation founded by Billie Jean King
Eisenhower Park 1899 Hempstead Turnpike, Suite 400 East Meadow, New York 11554 t 516.542.4700 f 516.542.4716 [email protected] www.WomensSportsFoundation.org