Embed Size (px)
Citation preview

Author's personal copy
Journal of Pharmaceutical and Biomedical Analysis 58 (2012) 27–33
Contents lists available at SciVerse ScienceDirect
Journal of Pharmaceutical and Biomedical Analysis
journa l homepage: www.e lsev ier .com/ locate / jpba
A validated CE method for determining dimethylsulfate a carcinogen andchloroacetyl chloride a potential genotoxin at trace levels in drug substances
Muzaffar Khana,∗, K. Jayasreea, K.V.S.R. Krishna Reddya, P.K. Dubeyb
a Analytical Development, Aptuit Laurus Private Limited, ICICI Knowledge Park, Shameerpet, Hyderabad 500078, Indiab Department of Chemistry, Jawaharlal Nehru Technological University, Kukatpally, Hyderabad 500072, India
a r t i c l e i n f o
Article history:Received 6 May 2011Received in revised form 13 August 2011Accepted 18 September 2011Available online 1 October 2011
Keywords:Dimethyl sulfateChloroacetyl chlorideGenotoxicCapillary electrophoresis and validation
a b s t r a c t
A simple and rapid capillary zone electrophoretic method was developed for determining dimethyl sul-fate a possible human carcinogen and mutagen and chloroacetyl chloride a potential genotoxic agent attrace levels in pharmaceutical drug substances by indirect photometric detection. A systematic screen-ing of various anionic probes was performed to obtain the best separation conditions and sensitivity.High sensitivities with low quantification and detection levels were achieved for dimethylsulfate andchloroacetyl chloride using a background electrolyte (BGE) containing 5 mM pyridine dicarboxylic acidas the probe ion. The method is specific, precise and accurate for the two genotoxins. The optimizedmethod was validated for specificity, precision, linearity, accuracy and stability in solution. Calibrationcurves were linear (R > 0.999) for both dimethylsulfate and chloroacetyl chloride in the range LOQ – 300%of nominal concentrations. The CE method was effectively implemented for estimating dimethylsulfateand chloroacetyl chloride in two different active pharmaceutical ingredients (APIs).
© 2011 Elsevier B.V. All rights reserved.
1. Introduction
Dimethyl sulfate (DMS) is widely used in the pharmaceuticaland chemical industries as a reagent for the methylation of phenols,amines and thiols. Compared to other methylating agents DMS ispreferred by the industry because of its low cost and high reactivity.DMS can affect the base-specific cleavage of guanine in DNA byrupturing the imidazole rings present in guanine [1]. This processcan be used to determine base sequencing, cleavage on the DNAchain and other applications.
DMS is classified as a Class 2 carcinogen by InternationalAgency for Research on Cancer [2] and is mutagenic, poisonous,corrosive, environmentally hazardous and volatile (presenting aninhalation hazard). DMS is absorbed through the skin, mucousmembranes, and gastrointestinal tract. Delayed toxicity allowspotentially fatal exposures to occur prior to development of anywarning symptoms [3]. DMS has been tested for carcinogenicityin rats by inhalation, subcutaneous and intravenous injection,and following prenatal exposure. It produced local sarcomas andtumours of the nervous system [2]. DMS, in our case is used as amethylating agent in one of the manufacturing steps of an active
∗ Corresponding author at: Analytical Development, Aptuit Laurus Private Limited,Turkapally, Shameerpet, Hyderabad, Andhra Pradesh 500078, India.Tel.: +91 40 230413531; fax: +91 40 23045438.
E-mail address: [email protected] (M. Khan).
pharmaceutical ingredient (API-1). With concerns rising due to theknown genotoxicity of DMS, it is necessary to demonstrate thatthe levels of DMS are within acceptable limits in API-1 through asuitable analytical method. Based on the daily dosage, a limit of50 ppm of DMS was considered in API-1 applying the threshold oftoxicological concern (TTC) concept.
Chloroacetyl chloride (CAC) is bifunctional; the acyl chlorideeasily forms esters and amides, while the other end of the moleculeis able to form other linkages, e.g. with amines. CAC is a knownreagent for acylation [4] and as a two carbon building block forcyclization reactions [5]. In our application it has been used foracylation followed by cyclization in an intermediate synthesis ofAPI-2. Although there is limited information available on the car-cinogenicity and genotoxicity of CAC, it can be categorized as astructural alert for genotoxic potential (Class 3 category as perMuller classification [10]). CAC decomposes on heating produc-ing toxic and corrosive fumes including phosgene and hydrogenchloride. A suitable analytical method should be developed todemonstrate that CAC is within acceptable limits of not more than75 ppm in API-2. This limit was arrived at, by considering the max-imum daily dosage of API-2 and TTC.
The current ICH guidelines describe a general concept of qual-ification of impurities in active substances (ICH Q3A (R) [6]) andmedicinal products (ICH Q3B (R2) [7]). These guidelines howeverdo not adequately address the concern for genotoxic impuritiesin drug substances and drug products. A Guideline on the Lim-its of Genotoxic Impurities [8] was subsequently issued by the
0731-7085/$ – see front matter © 2011 Elsevier B.V. All rights reserved.doi:10.1016/j.jpba.2011.09.019
Author's personal copy
28 M. Khan et al. / Journal of Pharmaceutical and Biomedical Analysis 58 (2012) 27–33
Committee for Medicinal Products (CHMP) to overcome the shortcomings of the ICH Q3A and Q3B guidelines. The CHMP guidelineprovides a general framework and practical risk based approachto deal with genotoxic impurities in drug substances. As per thisguideline, the genotoxic impurities with sufficient evidence for athreshold-related mechanism should be addressed using methodsoutlined in ICH Q3C (R3) for Class 2 solvents. For genotoxic impuri-ties without sufficient evidence for a threshold-related mechanism,the guideline proposes a policy of controlling levels to “as low asreasonably practicable” (ALARP principle). The CHMP guideline anda more recent draft guidance document on limits of genotoxic andcarcinogenic impurities [9] issued by the US Food and Drug Admin-istration recommend that an exposure level of 1.5 �g per personper day for each genotoxic impurity can be considered an accept-able qualification threshold. Any impurity found at a level belowthis threshold generally should not need further safety qualifica-tion for genotoxicity and carcinogenicity concerns. The acceptablerisk is defined as an additional cancer risk of not greater than 1in 100,000 based on a lifetime’s exposure to a genotoxic impu-rity. This approach is applied to impurities in the absence of datafrom carcinogenicity long-term studies or data providing evidencefor a threshold mechanism of genotoxicity and is defined by thethreshold of toxicological concern (TTC) considering an exposureof 1.5 �g/day lifetime intake of a genotoxic impurity being associ-ated with an acceptable risk [10]. However the CHMP opines thatthe genotoxic impurity limits can also vary based on differing peri-ods of exposure, while a 10-fold lower values are recommendedfor high potency carcinogens such as N-nitrosoamines, aflatoxinsand azoxy compounds the limits can be relatively relaxed for car-cinogens with established dietary exposure and life threateningindication such as cancer. In accordance with this, Muller et al. [11]suggest a staged TTC; whereby the acceptable daily intake valuesvary between 1.5 �g/day intake for lifetime exposure to 120 �g/dayfor 28 days (or less) exposure [12]. Dobo et al. have discussed theapproach that can be made during drug development to under-stand potential mutagenic and carcinogenic risks associated withcompounds used for synthesis and to understand the capability ofsynthetic processes to control genotoxic impurities in the API [13].Snodin provides a qualification strategy based on a review of rep-resentative compounds from structurally alerting substances [14].Even though structurally alerting compounds, particularly highlyreactive reagents introduced in the early stages of a multistep syn-thesis are unlikely to be carried over to the API, regulatory agenciesdemand that carry over studies are performed to demonstrate theabsence of PGIs in the drug substance at TTC levels, considering thepotential threat of genotoxins to human health.
GC–FID/MS and HPLC–UV/MS are the most widely applied tech-niques for determining genotoxic impurities at trace levels owingto their inherent high sensitivity and precision [15–17]. The samplepreparation often involves extractions for enhancement of sensitiv-ity and removal of matrix interferences. When the quantificationof a genotoxic impurity at trace levels in the API becomes daunt-ing, a higher limit for this impurity can be set in the intermediatestep where this genotoxic impurity is introduced. This limit shouldhowever be supported with a scientific rationale that the impuritywill either be structurally altered so that it is no longer genotoxicor is eliminated through several steps of purification in subsequentstages of synthesis.
Capillary electrophoresis offers simplicity, high separation effi-ciencies, low reagent consumption and is a cost effective andeco-friendly technique, specifically for the analysis of ionizablespecies. However the application of CE is not rampant for deter-mining trace analytes due to low sensitivity and poor precisionas compared to HPLC and GC. However in CE, the sensitivity oftrace analytes can be increased through sample stacking techniquesand enrichment of the analytes from the sample matrix using solid
phase extractions (SPE) and liquid–liquid extractions (LLE). The useof a MS detector coupled with CE can also enhance the sensitivityof trace analytes. The precision can be improved with the use of aninternal standard for quantification purposes.
Alzaga et al. [18] have developed a generic approach for thedetermination of alkylating agents by derivatisation followed byheadspace GC/MS. This method utilizes an in situ derivatisationprocedure with pentafluorothiophenol (PFTP) as the derivatisationagent. Methods for determining DMS by Head Space Gas Chro-matography (HS-GC) with MS detection [19] and HS-GC with FIDdetection [20] in intermediates and drug substances have beenreported. Hansen and Sheribah [21] have determined five residualalkylating impurities including alkyl chloride and alkyl bromide inbromazepam API using capillary electrophoresis with LOQ of 0.05%.To the best of our knowledge, no CE methods have been reported sofar in the literature for the determination of DMS and CAC. In thisarticle, we describe a simple and fast method for determining DMSand CAC in drug substances at trace levels by capillary electrophore-sis. This method has been successfully applied to demonstrate thatDMS and CAC in two different APIs were within acceptable regula-tory limits.
2. Materials and methods
2.1. Chemicals and reagents
Sodium hydroxide (0.1 N, CE grade) and CE grade water wereprocured from Agilent Technologies (Waldbronn, Germany). Pyri-dine 2,6-dicarboxilic acid was procured from Merck (Hohenbrunn,Germany), hexadecyl trimethyl ammonium bromide (CTAB),pyromellitic acid and paratoulene sulfonic acid were procured fromSigma–Aldrich (Steinheim, Germany). Benzoic acid and phthalicacid were procured from Rankem (New Delhi, India). DMS and CACwere procured from Spectrochem (Mumbai, India). All reagentswere of analytical grade or highest available purity. API-1 and API-2 were synthesized in Aptuit Laurus Private Limited (Hyderabad,India).
2.2. Equipment
The separation was performed on Agilent Technologies CapillaryElectrophoresis system with a built-in diode-array detector. TheAgilent ChemStation software was used for system control, dataacquisition and post-run processing. The separation was performedin a 64.5 cm (56 cm length to detector), 50-�m id, bare fused silicacapillary with extended light path having a bubble factor of 3 forenhanced sensitivity (Agilent Technologies, Waldbronn, Germany).An alignment interface, containing an optical slit matched to theinternal diameter of 150-�m, was used.
2.3. Preparation of analyte solutions and background electrolyte
About 30 mg each of DMS and CAC standards were accuratelyweighed into separate 100 mL volumetric flasks. The standardswere dissolved in 10 mL methanol by ultra sonication for 10 min.The flasks were cooled to room temperature and the volumes werethen made up to 100 mL mark with water. A 1.0 mL aliquot of thesestock solutions were further diluted independently to 100 mL each,with the diluent (methanol:water 10:90%, v/v) to obtain the DMSand CAC standard solutions. The standard solutions were filteredthrough 0.2 �m nylon syringe filters.
About 0.5 g of each API was accurately weighed into a 5 mL vol-umetric flask. A 0.5 mL aliquot of methanol was added to the flaskand sonicated for about 5 min. The flask was cooled to room tem-perature and volume was made up to 5 mL mark with the diluentand sonicated for 15 min with intermittent shaking. The samplesolutions were filtered through 0.2 �m nylon syringe filters.
Author's personal copy
M. Khan et al. / Journal of Pharmaceutical and Biomedical Analysis 58 (2012) 27–33 29
The background electrolyte (BGE) was prepared by dissolvingabout 83.0 mg of pyridine carboxylic acid and 14.5 mg of CTAB in100 mL HPCE grade water followed by ultra sonication for about10 min to facilitate complete dissolution. The pH of this solutionwas then adjusted to 5.6 ± 0.1 with 1 N NaOH. The BGE was filteredthrough 0.2 �m nylon syringe filters.
2.4. Electrophoretic conditions
A 30 kV voltage was applied with negative polarity setting. Sam-ples were injected hydrodynamically by pressure at 50 mbar for60 s followed by injection of a BGE plug by pressure at 50 mbar for5 s. The capillary cassette temperature was maintained at 20 ◦C. Thedetector signals were monitored at a wavelength of 350 nm (band-width 80 nm) with a reference wavelength of 200 nm (bandwidth20 nm). The migration times for DMS and CAC were about 3.0 minand 3.3 min respectively and the total run time was 5 min. The BGEreplenishment was done after every 25 injections.
New bare fused-silica capillaries were flushed with CE gradewater for 30 min following by the BGE for 30 min. Prior to everyuse the capillary was conditioned by flushing for 10 min with waterand then with the BGE for 15 min. Between analyses, the capillarywas flushed with the BGE for 2 min.
2.5. Method validation
The developed method was validated for determining DMS andCAC with the assessment of specificity, precision, sensitivity, lin-earity and range, accuracy and stability of analyte solutions. Thevalidation was performed keeping in mind the ICH guidelines foranalytical method validation [22].
2.5.1. SpecificitySpecificity was evaluated by injecting DMS and CAC individu-
ally and spiked to the respective APIs along with all other knownprocess related impurities and solvents at specification levels. Theelectropherograms were examined for interferences of other ana-lytes with DMS and CAC in the specificity samples.
2.5.2. PrecisionThe repeatability of the method was evaluated by separately
injecting replicate preparations (n = 6) of a spiked solution of API-1 containing DMS and spiked solution of API-2 containing CAC atLOQ levels, 50, 100, 150 and 300% of nominal analyte concentra-tions. To evaluate intermediate precision, six replicate samples ofthe APIs containing DMS and CAC at these concentrations were pre-pared and injected every day, on three different days. The %RSD forDMS and CAC and their migration times were evaluated to assessprecision of the method.
2.5.3. SensitivitySensitivity of the method was determined by establishing the
limit of detection (LOD) and limit of quantitation (LOQ) for DMSand CAC. The detector response was obtained for a series of dilutesolutions with known concentrations of DMS and CAC. Concentra-tions resulting in signal-to-noise ratios of about 3:1 and 10:1 wereconsidered as detection limits and quantitation limits respectively.The precision at LOQ level was assessed in terms of %RSD.
2.5.4. Linearity and rangeThe linearity solutions were prepared from individual stock
solutions of DMS and CAC at nine concentration levels – LOQ, 50, 75,100, 125, 150, 175, 200 and 300% of analyte concentrations, each intriplicate. The data was subjected to linear regression analysis withthe least squares method.
2.5.5. AccuracySamples of API-1 and API-2 were spiked with DMS and CAC
respectively at LOQ, 50, 100, 150 and 300% of the nominal ana-lyte concentrations. The spiking was performed in triplicate at eachlevel and the spiked samples were analyzed as per the method.Recoveries for DMS and CAC were calculated against freshly pre-pared standards. The mean percentage recoveries at each level wereused as a measure of accuracy of the method. An ANOVA test wasperformed to confirm that the recoveries were independent of thespiked concentrations.
2.5.6. Stability in analytical solutionStandard solutions of DMS and CAC were prepared in the diluent
at analyte concentrations. Each solution was analyzed immediatelyafter preparation and divided into two parts. While one part wasstored at 2–8 ◦C in a refrigerator, the other at bench top in tightlycapped volumetric flasks. The stored solutions were reanalyzedafter 24 and 48 h and the percentage recoveries of DMS and CACwere calculated against the zero hour samples.
3. Results and discussion
3.1. Method development and optimization
Dimethyl sulfate rapidly decomposes on contact with water tomethanol and methyl sulfate [23] as shown in Fig. 1a. Similarlychloroacetyl chloride reacts with water and the end products arechloroacetic acid and hydrochloric acid (Fig. 1b). Both DMS andCAC exist as uni-negative ions at the working pH of 5.6 and tend tomigrate towards the anode terminal under the influence of appliedelectrical field.
In the development and optimization trials, different anionicprobes were evaluated at 2, 5 and 10 mM concentrations for obtain-ing maximum sensitivity, peak symmetry and selectivity for DMSand CAC through indirect photometric detection. A sub-micellarconcentration of CTAB (0.4 mM) was used in all BGE systems forEOF reversal and separations were performed by applying potentialin negative polarity mode (detector end towards anode termi-nal). The peaks were found to be fronting in the BGE containing5 mM pyromellitate + 0.4 mM CTAB (pH 7.7 ± 0.1). While there waspoor separation in 5 mM p-toluene sulfonic acid + 0.4 mM CTAB(pH 6.0 ± 0.1), the DMS peak was found to be splitting in 5 mMbenzoic acid + 0.4 mM CTAB (pH 6.0 ± 0.1). Peak symmetries werepoor and a high level of background noise at the operationalwavelength was observed with 5 mM phthalate + 0.4 mM CTAB (pH6.5 ± 0.1).
In CE, the Kohlraush regulating function determines theprobe displacement by the analyte [24] and the probe’s mobil-ity and optical properties must be considered. The mobility andconcentration of the probe are crucial for the separation per-formance of the method because they influence peak shapesand efficiency. The mobilities of the probes that were evaluatedare in the order: pyromellitate > phthalate > pyridine dicarboxy-late > benzoate > p-toluene sulfonate [25]. While the highly mobilepyromellitate probe is suitable for analyzing smaller fast mov-ing anions, the benzoate and p-toluene sulfonate probes aremore suitable for analyzing the lower mobility compounds suchas short chain (C4–C8) carboxylic acids. Phthalate and pyri-dine dicarboxylate probes have similar mobilities and are mostsuitable for analyzing medium mobility species. The absorp-tivity of the probe at the detection wavelength is a keyparameter influencing the method sensitivity. The benzoateand pyridine dicarboxylate probes have higher molar absorp-tivities when compared to the other probes that were tested[26].

Author's personal copy
30 M. Khan et al. / Journal of Pharmaceutical and Biomedical Analysis 58 (2012) 27–33
OS
OO
O OS
OO
O
H2O + CH3OH+
Cl
O
ClCl
O
O+ H2O2 2 + 2 HCl
a
b
Fig. 1. (a) Reactivity of dimethylsulfate in water. (b) Reactivity of chloroacetyl chloride in water.
The medium mobility and high molar absorptivity of pyridine2,6-dicarboxylate rendered it as the preferred probe for analyzingthe species DMS and CAC. BGEs containing 2–10 mM pyridine 2,6-dicarboxylic acid + 0.4 mM CTAB (pH 5.6 ± 0.1) were evaluated foroptimum separation and sensitivity. Lower concentrations of pyri-dine 2,6-dicarboxylic acid were unfavorable as broad peaks wereobserved due to electromigration dispersion. On the other handhigher concentrations resulted in higher noise levels, decreasedsensitivity and an adverse affect on the linearity of detection[27]. Good peak symmetries, high sensitivity and high resolutionbetween DMS and CAC could be achieved using 5 mM pyridine2,6-dicarboxylic acid + 0.4 mM CTAB in the BGE system which waseventually finalized.
The separation was evaluated at 20, 25 and 30 kV and the migra-tion times decreased with the increase in the applied voltage. Thehighest available voltage on the equipment (30 kV) was chosen asit provided higher theoretical plates and resolution since the sep-aration proceeds rapidly minimizing the effects of diffusion andpeak broadening. The temperature effects on separation were eval-uated at 15, 20, 25, 30 and 35 ◦C. The migration times decreasedwith the increase in temperature due to a decrease in BGE vis-cosity. However the temperature was optimized to 20 ◦C as thetheoretical plates decreased and the noise increased significantlyat elevated temperatures. In indirect photometric detection, thetransparent analyte species are detected as negative peaks againsta high background absorbance of the probe ions. By choosingappropriate sample wavelength (where the sample has minimumabsorbance) and reference wavelength (where the probe has max-imum absorbance) positive signals can be obtained. Using thecapability of the Diode Array Detector (DAD) and with the knownknowledge of probe’s absorbance, several combinations of the sig-nal (sample wavelength) and reference channels were evaluated.The highest sensitivities (signal-to-noise) ratios were obtainedwith the signal acquired at 350 nm (bandwidth 80 nm) at a ref-erence wavelength of 200 nm (bandwidth 20 nm).
3.2. Method validation
3.2.1. SpecificitySpecificity is the ability of the method to measure the analyte
response in the presence of its potential impurities and other inter-ferences. No interferences were observed at the migration times ofDMS and CAC in the API samples that were spiked with all otherprocess related impurities and residual solvents. A specimen elec-tropherogram of the DMS and CAC standards is presented in Fig. 2a.
The residual acetic acid, a process related solvent was well sep-arated from DMS (Fig. 2b) in the real time sample analysis of API-1.In API-2, a major peak due to chloride (formed as a byproduct andalso introduced from the manufacturing process) was also wellresolved from the CAC peak (Fig. 2c). Thus the method was found tobe specific for determining DMS and CAC in presence of potentialinterferences.
3.2.2. PrecisionThe repeatability and inter-day precision of the method was
determined in terms of %RSD for migration times and recoveriesof DMS and CAC in the spiked samples. The overall RSD of migra-tion times was not more than 2.2% for DMS and not more than 2.0%for CAC. Similarly the overall RSD of recoveries of DMS and CACwere not more than 6.5% and 6.2% respectively (Table 1).
3.2.3. SensitivityThe LOD and LOQ were found to be 0.3 �g/mL and 1.0 �g/mL
respectively for both DMS and CAC corresponding to 3 ppm and10 ppm with respect to the sample concentrations. These resultsemphasize that the method is sensitive enough for determiningDMS and CAC at trace levels in real time samples considering thepermissible levels of these toxic impurities (Fig. 3).
3.2.4. Linearity and rangeThe detector response linearity to varying analyte concentra-
tions was established by analyzing standard solutions at ninedifferent concentrations ranging from LOQ to 300% of nominalanalyte concentration. Linearity curves (Area vs Conc.) were plot-ted for DMS and CAC and the data was subjected to regressionanalysis. Linear relationships confirm that the test results aredirectly proportional to the concentrations. The linear equationof regression for DMS was y = 9.9398x − 0.8980 with a correla-tion coefficient (R) of 0.9990. Similarly the regression equation forCAC was y = 15.9874x − 0.9366 with a correlation coefficient (R) of0.9992.
The range of a method is the interval in which it has a suitablelevel of precision, accuracy and linearity. From the results of val-idation tests that were performed, the range for this method wasLOQ to 300% of the nominal analyte concentration.
3.2.5. AccuracyThe accuracy of a method expresses the closeness between the
theoretical value and the determined value and was tested in twodifferent ways. The mean recoveries for DMS and CAC at LOQ levelwere 97.4% and 92.8% respectively. At other concentration levels
Table 1Precision results.
DMS (%RSD) CAC (%RSD)
Repeatabilitya Inter-dayprecisionb
Repeatabilitya Inter-dayprecisionb
LOQ 3.8 5.3 2.4 6.250% 4.2 6.5 3.7 2.8100% 2.2 4.2 2.6 3.5150% 3.7 4.9 4.7 4.1300% 2.5 3.3 2.9 5.3
a n = 6 determinations.b n = 6 determinations each on three different days.

Author's personal copy
M. Khan et al. / Journal of Pharmaceutical and Biomedical Analysis 58 (2012) 27–33 31
min0.5 1 1.5 2 2.5 3 3.5 4 4.5
mAU
-30
-25
-20
-15
-10
-5
0
5Chloroacetyl chloride
Chloride
min0.5 1 1.5 2 2.5 3 3.5 4 4.5
mAU
-30
-25
-20
-15
-10 Dimethyl sulfate
Acetic acid
min0.5 1 1.5 2 2.5 3 3.5 4 4.5
mAU
-30
-25
-20
-15
-10
-5Dimethyl sulfate
Chloroacetyl chloride
a
b
c
Fig. 2. Specimen electropherograms of (a) DMS and CAC standards, (b) API-1 spiked with dimethylsulfate and (c) API-2 spiked with chloroacetyl chloride.
min0.5 1 1.5 2 2.5 3 3.5 4 4.5
mAU
-35
-30
-25
-20
-15
-10
Blank solution
LOQ Solution
LOD Solution
Dimethylsulfate Chloroacetyl chloride
Fig. 3. Overlaid electropherograms of Blank, LOD and LOQ solutions.

Author's personal copy
32 M. Khan et al. / Journal of Pharmaceutical and Biomedical Analysis 58 (2012) 27–33
Table 2Accuracy results.
Accuracy level Dimethyl sulfate spiked to API-1a Chloroacetyl chloride spiked to API-2a
Amt. spiked(ng)
Amt. recovered(ng)
%Meanrecovery ± SD
Amt. spiked(ng)
Amt. recovered(ng)
%Meanrecovery ± SD
LOQ 1007.8 981.8 97.4 ± 7.87 981.2 910.9 92.8 ± 2.5450% 1511.7 1441.1 95.3 ± 7.07 1471.8 1379.9 93.8 ± 2.69100% 3023.4 2929.2 96.9 ± 6.36 2943.4 2793.4 94.9 ± 3.52150% 4535.1 4434.3 97.8 ± 2.07 4415.4 4003.0 90.7 ± 1.36300% 9070.2 8726.8 96.2 ± 3.60 8830.8 8567.4 97.0 ± 1.68
a n = 3 determinations.
Table 3Content of DMS in API-1 and CAC in API-2.
Dimethyl sulfate Chloroacetyl chloride
Lot # of API-1 DMS contenta (ppm)(limit = 50 ppm)
Lot # of API-2 CAC contenta (ppm)(limit = 75 ppm)
001 <10 001 17002 11 002 ND003 15 003 ND004 10 004 13005 <10 005 ND006 ND 006 22
ND, not detected.a n = 3 determinations.
the recoveries for DMS and CAC ranged between 95.3–97.8% and90.7–97.0% respectively (Table 2).
The linearity of the method in estimating the recoveries wasevaluated by performing a one-way hierarchical analysis of vari-ation (ANOVA) within the range to separate out the systematicvariability due to the sample preparation, injection and integra-tion. The recoveries were found to be independent of the spikedconcentrations (ANOVA, p > 0.05) for both the target analytes. Thesefindings suggest that the described method represents a valuableand accurate tool for the analysis of DMS and CAC in pharmaceuticaldrug substances.
3.2.6. Stability in analytical solutionNo remarkable variations were observed in percentage recov-
eries of DMS and CAC in the initial samples and samples that werestored at 2–8 ◦C and at room temperature for 24 and 48 h. Thus theanalytes were found to be stable for at least 48 h when stored ateither 2–8 ◦C or at room temperature.
3.2.7. Analysis of real time samplesThe developed method was applied for determining DMS in API-
1 and CAC in API-2. Six consecutive commercial scale batches ofeach API were analyzed in triplicate. The results concluded that thecontent of DMS in API-1 and the content of CAC in API-2 were withinthe acceptable and safe limits as presented in Table 3.
4. Conclusions
A CE method for determining DMS and CAC, two potentiallygenotoxic impurities in drug substances by indirect photometricdetection was developed and validated. The method is sensitive,offers simplicity and does not include laborious steps of derivati-sation as is usually the case for compounds lacking chromophores.The method is very specific, cost effective and eco-friendly; andhas been successfully applied for real time sample analyses.This method has been extended for determining other genotoxicimpurities such as diethylsulfate and diisopropylsulfate in drugsubstances, and the validation of this application is under study.Though genotoxins are mostly determined using HPLC–UV/MS andGS–MS techniques for their proven ruggedness and sensitivity, the
use of Capillary electrophoresis for estimating genotoxins can com-plement the existing approach for analysis and also open newhorizons.
Acknowledgements
The authors wish to thank the management of Aptuit Laurus Pvt.Ltd. for supporting this work. The authors also wish to acknowledgethe encouragement provided by Dr. Satyanarayana C. and Dr. SrihariRaju K., Aptuit Laurus Pvt. Ltd. throughout this work.
References
[1] A. Streitwieser, C.H. Heathcock, E.M. Kosower, Introduction to Organic Chem-istry, Prentice-Hall Inc., 1992, p. 1169.
[2] IARC monographs, Dimethylsulfate, 71 (1999) 575–588.[3] J.C.R. Rippey, M.I. Stallwood, Nine cases of accidental exposure to dimethyl
sulphate—a potential chemical weapon, Emerg. Med. J. 22 (2005) 878–879.[4] M.M. Krayushkin, V.N. Yarovenko, S.L. Semenov, I.V. Zavarzin, A.V. Ignatenko,
A.Y. Martynkin, B.M. Uzhinov, Synthesis of photochromic 1,2-dihetaryletheneusing regioselective acylation of thienopyrroles, Org. Lett. 4 (2002) 3879–3881.
[5] G.R. Brown, A.J. Foubister, Unambiguous synthesis of 3-aryloxymethyl- mor-pholine hydrochlorides without ring enlargement side reactions, J. Chem. Soc.,Perkin Trans. 1 (1989) 1401–1403.
[6] ICH Q3A (R), Impurities in New Drug Substances, February 2002, http://www.ICH.org/.
[7] ICH Q3B (R2), Impurities in New Drug Products, July 2006, http://www.ICH.org/.[8] Guideline on the Limits of Genotoxic Impurities, Committee for Medici-
nal Products (CHMP), European Medicines Agency, London, 28 June 2006(CPMP/SWP/5199/02, EMEA/CHMP/QWP/251344/2006).
[9] Guidance for Industry, Genotoxic and Carcinogenic Impurities in Drug Sub-stances and Products: Recommended Approaches, US Department of Healthand Human Services, Food and Drug Administration, Centre for Drug Evaluationand Research (CDER), 2008, December.
[10] R. Kroes, A.G. Renwick, M. Cheeseman, J. Kleiner, I. Mangelsdorf, A. Piersma, B.Schilter, J. Sclatter, F. van Schothorst, J.G. Vos, G. Wurtzen, Food Chem. Toxicol.42 (2004) 65–83.
[11] L. Muller, R.J. Mauthe, C.M. Riley, M.M. Andino, D. de Antonis, C. Beels, J.DeGeorge, A.G.M. De Knaep, D. Ellison, J.A. Fagerland, R. Frank, B. Fritschel,S. Galloway, E. Harpur, C.D.N. Humfrey, A.S. Jacks, N. Jagota, J. Mackinnon,G. Mohan, D.K. Ness, M.R. O’Donovan, M.D. Smith, G. Vudathala, L. Yotti, Arationale for determining, testing, and controlling specific impurities in phar-maceuticals that possess potential for genotoxicity, Regul. Toxicol. Pharmacol.44 (2006) 198–211.
[12] D.P. Elder, A. Teasdale, A.M. Lipczynski, Control and analysis of alkyl esters ofalkyl and aryl sulfonic acids in novel active pharmaceutical ingredients (APIs),J. Pharm. Biomed. Anal. 46 (2008) 1–8.
[13] K.L. Dobo, N. Greene, M.O. Cyr, S. Caron, W.W. Ku, The application of structure-based assessment to support safety and chemistry diligence to managegenotoxic impurities in active pharmaceutical ingredients during drug devel-opment, Regul. Toxicol. Pharmacol. 44 (2006) 282–293.
[14] D.J. Snodin, Genotoxic impurities: from structural alerts to qualification, Org.Process Res. Dev. 14 (2010) 960–976.
[15] Q. Yang, B.P. Haney, A. Vaux, D.A. Riley, L. Heidrich, P. He, P. Mason, A. Tehim,L.E. Fisher, H. Maag, N.G. Anderson, Controlling the genotoxins ethyl chlorideand methyl chloride formed during the preparation of amine hydrochloridesalts from solutions of ethanol and methanol, Org. Process Res. Dev. 13 (2009)786–791.
[16] D.P. Elder, A.M. Lipczynski, A. Teasdale, Control and analysis of alkyl and benzylhalides and other related reactive organohalides as potential genotoxic impu-rities in active pharmaceutical ingredients (APIs), J. Pharm. Biomed. Anal. 48(2008) 497–507.
[17] D.P. Elder, D. Snodin, A. Teasdale, Analytical approaches for the detection ofepoxides and hydroperoxides in active pharmaceutical ingredients, drug prod-ucts and herbals, J. Pharm. Biomed. Anal. 51 (2010) 1015–1023.

Author's personal copy
M. Khan et al. / Journal of Pharmaceutical and Biomedical Analysis 58 (2012) 27–33 33
[18] R. Alzaga, R.W. Ryan, K. Taylor-Worth, A.M. Lipczynski, R. Szucs, P. Sandra,A generic approach for the determination of residues of alkylating agentsin active pharmaceutical ingredients by in situ derivatization–headspace-gas chromatography–mass spectrometry, J. Pharm. Biomed. Anal. 45 (2007)472–479.
[19] J. Zheng, W.A. Pritts, S. Zhang, S. Wittenberger, Determination of low ppmlevels of dimethyl sulfate in an aqueous soluble API intermediate usingliquid–liquid extraction and GC–MS, J. Pharm. Biomed. Anal. 50 (2009)1054–1059.
[20] G.F. Deng, T.W. Yao, Determination of dimethyl sulphate residual in granisetronhydrochloride by headspace gas chromatography, Zhejiang Da Xue Xue Bao YiXue Ban 37 (2008) 156–158.
[21] S.H. Hansen, Z.A. Sheribah, Comparison of CZE, MEKC, MEEKC and non-aqueouscapillary electrophoresis for the determination of impurities in bromazepam,J. Pharm. Biomed. Anal. 39 (2005) 322–327.
[22] ICH Q2R1, Validation of Analytical Procedures: Text and Methodology, 1995,June, http://www.ICH.org/.
[23] B.H. Mathison, M.L. Taylor, M.S. Bogdanffy, Dimethyl sulfate uptake and methy-lation of DNA in rat respiratory tissues following acute inhalation, Fundam.Appl. Toxicol. 28 (1995) 255–263.
[24] F. Foret, L. Krivánková, P. Bocek, Capillary Zone Electrophoresis, VCH Publishers,New York, 1993, pp. 27–35.
[25] P. Doble, M. Macka, P.R. Haddad, Design of background electrolytes for indirectdetection of anions by capillary electrophoresis, Trends Analyt. Chem. 19 (2000)10–17.
[26] M. Macka, C. Johns, P. Doble, P.R. Haddad, K.D. Altria, Indirect photometricdetection in CE using buffered electrolytes. Part I. Principles, LCGC 19 (January)(2001), www.chromatographyonline.com.
[27] X. Xu, Th.W. Kok, H. Poppe, Noise and baseline disturbances in indirect UVdetection in capillary electrophoresis, J. Chromatogr. A 786 (1997) 333–345.

Author's personal copy
Journal of Pharmaceutical and Biomedical Analysis 59 (2012) 162– 166
Contents lists available at SciVerse ScienceDirect
Journal of Pharmaceutical and Biomedical Analysis
j ourna l ho me p a ge: www.elsev ier .com/ locate / jpba
Short communication
Development and validation of a stability indicating HPLC method forsimultaneous determination of four novel fluoroquinolone dimers as potentialantibacterial agents
Muzaffar Khana,∗, C. Naveen Kumar Reddyb, G. Ravindraa, K.V.S.R. Krishna Reddya, P.K. Dubeyc
a Analytical Development, Aptuit Laurus Private Limited, ICICI Knowledge Park, Turkapally, Shameerpet, Hyderabad, Andhra Pradesh 500078, Indiab Process Development, Aptuit Laurus Private Limited, ICICI Knowledge Park, Turkapally, Shameerpet, Hyderabad 500078, Indiac Department of Chemistry, Jawaharlal Nehru Technological University, Kukatpally, Hyderabad 500072, India
a r t i c l e i n f o
Article history:Received 19 April 2011Received in revised form23 September 2011Accepted 26 September 2011Available online 4 October 2011
Keywords:Novel fluoroquinolone dimersAntibacterialHPLCMethod developmentValidation
a b s t r a c t
A series of novel 6-fluoro1,4-dihydro-4-oxo-3-quinoline carboxylic acid dimers were synthesized aspotential antibacterial agents from commercially available substituted fluorobenzoic acids. A stabilityindicating HPLC method was developed to determine these novel fluoroquinolone dimers using a system-atic method development approach. Samples were subjected to stress conditions of hydrolysis, oxidation,photolysis and thermal degradation; and analyzed to demonstrate the specificity and stability indicatingability of the developed method. The precision for all four fluoroquinolone dimers was within 2.0% RSD.Calibration curves were linear (LOQ, 150%), with regression coefficients >0.99 for all dimers. The methodwas conveniently applied for determining purity and assay of these four novel fluoroquinolone dimers.
© 2011 Elsevier B.V. All rights reserved.
1. Introduction
1,4-Dihydro-4-oxo-6-fluoroquinoline-3-carboxylic acids andtheir ester derivatives are quinolone class of anti-bacterial agents[1,2] which are effective against a variety of gram-negativemicroorganisms. A number of fluoroquinolone antibacterial agentssuch as aspefloxacin, norfloxacin, ofloxacin, ciprofloxacin, lev-ofloxacin, lomefloxacin and sparfloxacin are in clinical use. Sincethere is a continuous demand for new antibacterials and fluo-roquinolones, many researchers have been working on modifiedquinolones to potentiate them further [3–5]. The antibacterialactivity of ciprofloxacin modified dimers [6,7] against drug resis-tant strains of bacteria has been evaluated.
A series of novel N1-quinolone dimers (Fig. 1) were synthesizedas potential antibacterial agents which have demonstrated promis-ing antibacterial activities [8]. The separation of quinolone drugs byHPLC coupled with UV detection [9], fluorescence detection [10],MS detection [11] and by capillary electrophoresis-fluorescencedetection [12] is reported in literature. The purpose of this researchwas to develop a stability indicating HPLC method for simultane-ous determination of the four novel fluoroquinolone dimers, before
∗ Corresponding author. Tel.: +91 40 230413531; fax: +91 40 23045438.E-mail address: [email protected] (M. Khan).
they could be evaluated for their antibacterial activities. In thispaper the development and validation of a simple HPLC method fordetermining a series of novel fluoroquinolone dimers is presented.
2. Materials and methods
2.1. Chemicals and materials
The fluoroquinolone dimers were synthesized at Research andDevelopment Centre, Aptuit Laurus Pvt. Ltd. (Hyderabad, India).Reference standards of the dimers were prepared in-house by semi-preparative LC purification. Inertsil ODS analytical and preparativecolumns were purchased from GL Sciences (Tokyo, Japan). X-TerraRP 18 and Acquity UPLC® BEH C8 columns were procured fromWaters Corporation Ltd. (Milford, MA, USA). Zorbax Eclipse XDB-C18 column was procured from Agilent Technologies (Waldbronn,Germany). Trifluoro acetic acid (TFA, HPLC grade), hydrochloric acid(HPLC grade) and maleic acid (Analytical grade) were procuredfrom Fluka (Steinheim, Germany). Hydrogen peroxide (30% solu-tion, AR grade), sodium hydroxide (AR grade), methanol (MeOH,HPLC grade) and acetonitrile (MeCN, HPLC grade) were procuredfrom Rankem Fine Chemicals Ltd. (New Delhi, India). Water wasfiltered and deionized with a Milli-Q, Millipore system (Milford,MA, USA).
0731-7085/$ – see front matter © 2011 Elsevier B.V. All rights reserved.doi:10.1016/j.jpba.2011.09.025
Author's personal copy
M. Khan et al. / Journal of Pharmaceutical and Biomedical Analysis 59 (2012) 162– 166 163
ONa
O
N
O
ONa
O
F
F
N
O
F
F
N
NN
N
ONa
O
N
O
ONa
O
F
F
N
O
F
F
N
NNH
NH
NH
N
ONa
O
N
O
ONa
O
F
F
N
O
NH
N
F
F
ONa
O
N
O
ONa
O
F
F
N
O
F
F
N
NNH
NH
A
C D
B
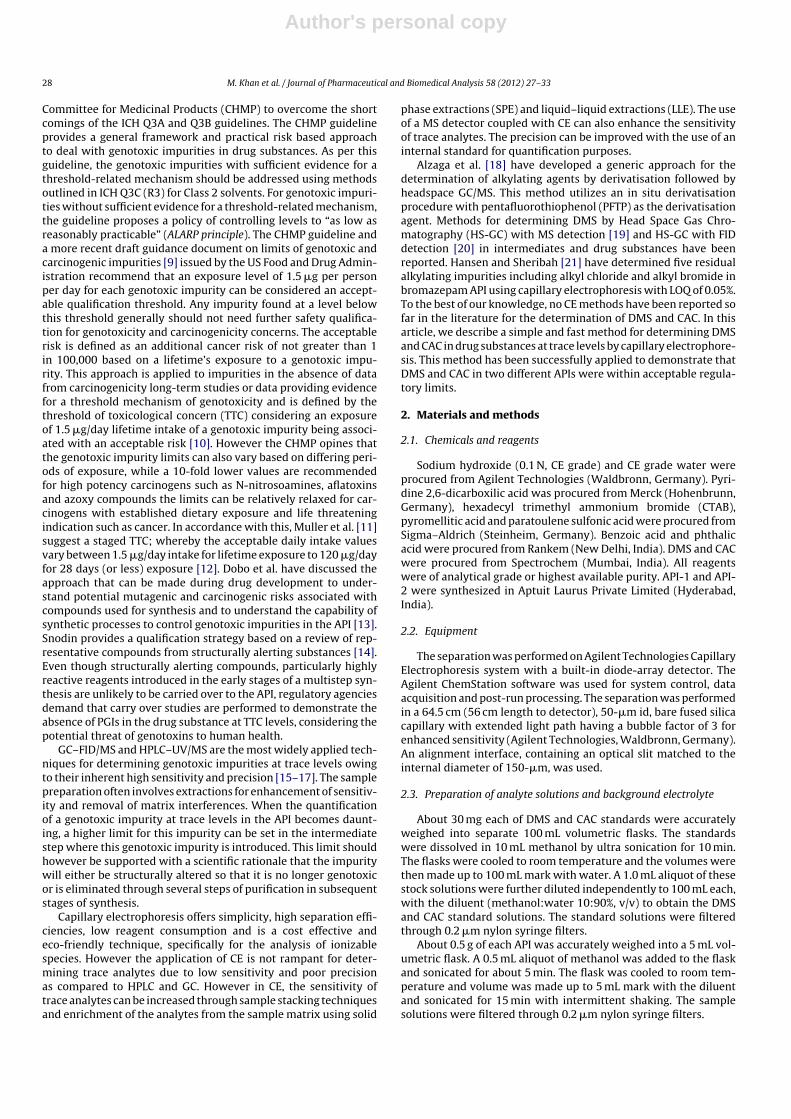
Fig. 1. Structures and chemical names of novel fluoroquinolone dimers. (A) 1-[2-(3-carboxy-6,8-difluoro-4-oxo-7-piperazino-1,4-dihydro-1-quinolinyl)ethyl]-6,8-difluoro-4-oxo-7-piperazino-1,4-dihydro-3-quinolinecarboxylic acid disodium salt. (B) 1-{2-[3-carboxy-6,8-difluoro-7-(4-methylpiperazino)-4-oxo-1,4-dihydro-1-quinolinyl]ethyl}-6,8-difluoro-7-(4-methylpiperazino)-4-oxo-1,4-dihydro-3-quinoline carboxylic acid disodium salt. (C) 1-{2-[3-carboxy-6,8-difluoro-7-(3-methylpiperazino)-4-oxo-1,4-dihydro-1-quinolinyl]ethyl}-6,8-difluoro-7-(3-methylpiperazino)-4-oxo-1,4-dihydro-3-quinoline carboxylic acid disodium salt. (D) 1-{2-(3-carboxy-6,8-difluoro-4-oxo-7-perhydropyrrolo [3,4-b]pyridin-6-yl-1,4-dihydro-1quinolinyl) ethyl}-6,8-difluoro-4-oxo-7-perhydropyrrolo[3,4-b]pyridin-6-yl-1,4-dihydro-3-quinolinecarboxylicacid disodium salt.
2.2. Instrumentation
A Waters Alliance 2695 separations module appended witha 2996 PDA detector and Empower software (Version 5.0) wereused throughout the studies. Purification was performed on Agi-lent Technologies 1200 series Preparative LC system equipped withChemstation software. A Buchi Rotavapor R-215 was used for sol-vent distillation. An XP205 Mettler Toledo balance (Greifensee,Switzerland), Bruker AVANCE II 300 MHz NMR Spectrometer(Fällanden, Switzerland) Newtronic NW-CON-51 Oven (Mumbai,India), Newtronic NEC 108RSPI photostability chamber (Mumbai,India) and Bandelin RK 510 Sonicator (Berlin, Germany) were usedduring the studies.
2.3. Chromatographic conditions
The separation was performed on a Zorbax Eclipse XDB-C18 (150 mm × 4.6 mm), 5 �m column maintained at 45 ◦C. Themobile phase A [0.1%, v/v, aqueous TFA] and mobile phase B[MeOH:MeCN:TFA (85:15:0.1, v/v/v)] were pumped in a gradientmode [(time in min vs. % mobile phase B) = 0:20, 10:30, 15:50, 20:80and 20.1:20]. The flow rate was 1.0 mL/min and the injection vol-ume was set to 5 �L. Data was acquired on a PDA detector andchromatograms were extracted at 285 nm. All the four compoundsand their related impurities were well separated within 15 min. andthe total run time was 20.1 min.
2.4. Preparation of standard and sample solutions
Stock solutions of the standard compounds were prepared(0.5 mg/mL) in diluent (Water:MeOH:TFA 80:20:0.1, v/v/v) by ultrasonication for 10 min. A standard mixture of the four compoundswas prepared by diluting 5 mL of each stock solution to 100 mL in
a single volumetric flask, obtaining a final concentration of about0.025 mg/mL of each compound.
About 12.5 mg of each sample was dissolved in 25 mL diluent byultra sonication for 10 min. These stock solutions were diluted 20folds (5–100 mL) and 5 folds (5–25 mL) with diluent to obtain thesample solutions for assay and purity analysis respectively.
2.5. Method validation
2.5.1. Specificity, sensitivity and linearityForced degradation studies were performed on the four com-
pounds under stress conditions of acid hydrolysis (1 N HCl for 48 h),base hydrolysis (1 N NaOH for 48 h), oxidative degradation (3%H2O2 for 6 h), heat (60 ◦C for 7 days) and photo-degradation (as perICH Q1B) [13]. The stressed samples were analyzed; and peak puri-ties of the dimers were assessed from the spectral signals obtainedby a photo diode array detector.
The detector response was obtained for a series of dilutesolutions with known concentrations of the dimers consideringsignal-to-noise ratios of 3:1 and 10:1 for LOD and LOQ, respec-tively. The linearity solutions were prepared at seven concentrationlevels—LOQ, 5, 50, 75, 100, 125 and 150% of nominal analyte con-centration and analyzed.
2.5.2. Precision and accuracyRepeatability was assessed as %RSD by analyzing as per method,
six sample solutions containing each dimer spiked at LOQ andanalyte concentrations. The inter-day precision was evaluated byrepeating the procedures on three consecutive days. The interme-diate precision (ruggedness) was evaluated by a different analyst,using a different column on a different instrument in the samelaboratory. For determining accuracy of the method, triplicatesample solutions at LOQ level, 80, 100, 120 and 150% of the nomi-nal analyte concentration were prepared and analyzed. The mean

Author's personal copy
164 M. Khan et al. / Journal of Pharmaceutical and Biomedical Analysis 59 (2012) 162– 166
Table 1System suitability results for optimization trials.
Chromatographic conditions Parameter Comp-A Comp-B Comp-C Comp-D
Inertsil ODS 3 V (150 mm × 4.6 mm), 5 �m N 834 13,980 3394 1.61MP: 0.025 M Phosphoric acid and MeCN + TEA Tf – 1.83 – 1.32
˛ 1.24 5.01 – 2.35Rs 1.08 7.09 – 2.05
X-Terra RP18 (150 mm × 4.6 mm), 3.5 �m N 24,787 70,291 – 39,111MP: 0.025 M Phosphoric acid and MeCN + TEA Tf 1.04 1.10 – 1.04
˛ – 1.23 – 1.23Rs – 14.78 – 8.16
X-Terra RP18 (150 mm × 4.6 mm), 3.5 �m N 56,245 106,419 34,649 75,805MP A: 0.1% TFA in water Tf – 1.13 – 1.18MP B: 0.1% TFA in MeCN 1.01 1.15 – 1.10
Rs 0.71 10.43 – 6.10
X-Terra RP18 (150 mm × 4.6 mm), 3.5 �m N 24,599 158,416 21,508 32,683MP A: 0.1% TFA in water Tf 1.00 1.12 – 0.95MP B: 0.1% TFA in MeOH:MeCN (85:15, v/v) 1.05 1.14 – 1.26
Rs 1.59 7.60 – 8.81
Zorbax XDB C18 (150 mm × 4.6 mm), 5 �m N 14,409 98,265 12,077 17,565MP A: 0.1% TFA in water Tf 1.01 1.02 1.01 1.02MP B: 0.1% TFA in MeOH:MeCN (85:15, v/v) 1.14 1.37 – 1.46
Rs 3.30 14.20 – 10.63
MP, mobile phase; MeCN, acetonitrile; MeOH, methanol; TEA, triethylamine.
%recoveries calculated against the standards at each level wereused as a measure of accuracy.
2.5.3. Robustness and stability of analytical solutionsDeliberate changes to the standard experimental conditions
were made and the resolution (Rs) between the fluoroquinolonedimers was evaluated. The impact of flow rate (0.9, 1.0 and1.1 mL/min) and the column temperature (40, 45 and 50 ◦C) on res-olution was studied. The %TFA in mobile phase was varied between0.05 and 0.15% (v/v). Gradient runs were performed by varying theabsolute % of mobile phase B within ±2% of the set composition. Theratio of MeCN in mobile phase B was varied between ±5% (v/v).
Standard solutions were analyzed immediately after prepara-tion and divided into two parts. One part was stored at 2–8 ◦C in arefrigerator and the other at bench top in tightly capped volumetricflasks. The stored solutions were reanalyzed after 6, 12, 24 36 and48 h.
3. Results and discussion
3.1. Method development
Initial separation trials were made in accordance with Ph.Eur.monograph of Ciprofloxacin hydrochloride monohydrate on anInertsil ODS (150 mm × 4.6 mm), 5 �m column using a mobilephase that consisted of aqueous phosphoric acid (0.025 M, adjustedto pH 3.0 with TEA) and MeCN in a gradient mode. Under these chro-matographic conditions, all the four dimers exhibited poor peakefficiencies (N) and peak symmetries (Tf); and a partial resolution(Rs) between Comp-A and Comp-C was achieved (Table 1). Withthe same mobile phase, peak symmetries and peak efficienciesimproved on an X-Terra RP18 (150 mm × 4.6 mm), 3.5 �m columnbut selectivity for Comp-A and Comp-C was lost.
While Comp-A and Comp-C could not be resolved on an InertsilODS column, a low resolution between the two was obtained on anX-Terra RP 18 column with a mobile phase that consisted of 0.1%aqueous TFA and 0.1% TFA in MeOH. The use of MeOH providedan alternate selectivity which could not be obtained with MeCN. Abaseline separation between these critical pair components (Comp-A and Comp-C) could be achieved with the same mobile phaseon a Zorbax Eclipse XDB-C18 column. To increase the efficiency
while retaining selectivity, mixtures of MeOH and MeCN in differ-ent proportions were evaluated and the organic phase containingMeOH:MeCN:TFA (85:15:0.1, v/v/v) was found to be the most opti-mum, providing satisfactory separation, symmetric peaks and highefficiencies for all the four compounds.
In order to increase the throughput time, the separation wasattempted on an Acquity UPLC® BEH C8 (100 mm × 2.1 mm) 1.7 �mcolumn on a UPLC system using 0.1% aqueous TFA and 0.1% TFAin MeOH:MeCN (85:15, v/v) as mobile phase in a gradient mode.No separation could be achieved between Comp-A and Comp-C,therefore no further trials were made on the UPLC system.
A shallow gradient facilitated improved resolution betweenComp-A and Comp-C. The resolution increased at elevated temper-atures therefore the column temperature was optimized to 45 ◦C.Representative chromatograms of the four fluoroquinolone dimers,spiked standard and stressed samples in the optimized method areshown in Fig. 2.
3.2. Purification of crude fluoroquinolone dimers
The crude fluoroquinolone dimers (purity 72–94% area/area)were purified by preparative LC for evaluating their biologicalactivities and preparing reference standards. On an Inertsil ODS3 V (250 mm × 50 mm, 7 �m) preparative column, a mobile phasecomprising of water and MeOH in gradient proportions [(time inmin − % MeOH) of 0:10, 10:45, 13.50:45, 14:100, 17:100, 17.10:10and 20:10] was pumped at a flow rate of 80 mL/min. A 1.5 mLaliquot of the crude sample solutions (20 mg/mL) was injectedand the eluent was monitored at 285 nm. The desired fractionswere collected from several injections and evaporated to obtainthe standard compounds. After purification, the purities of thedimers were improved in the range of 97–98% area/area. Thepotencies (%w/w) of purified dimers were determined by quan-titative 1H NMR spectroscopy using maleic acid as an internalstandard.
3.3. Method validation
3.3.1. Specificity, sensitivity and linearityNo degradation of the dimers was observed under stress con-
ditions of acid hydrolysis, base hydrolysis, thermal stress and

Author's personal copy
M. Khan et al. / Journal of Pharmaceutical and Biomedical Analysis 59 (2012) 162– 166 165
A AU
Minutes
0.0 5.0 10 .0 15 .0 20 .0
B
AU
Minutes
0.0 5. 0 10.0 15.0 20.0
C
AU
Minutes
0.0 5.0 10.0 15.0 20.0
D
AU
Minutes
0.0 5. 0 10.0 15.0 20.0
E
AU
Minutes
0.0 5.0 10.0 15.0 20.0
C A
D
B
F
AU
Minutes
0.0 5.0 10.0 15.0 20.0
H2O2
B1
A1
C
A
A2 B2
D
C1
B
D1
C2
Fig. 2. Representative chromatograms of (A) compound-A; (B) compound-B; (C) compound-C; (D) compound-D; (E) spike of four fluoroquinolone dimer standards and(F) spike of stressed samples (A1 and A2 = degradants of compound-A; B1 and B2 = degradants of compound-B; C1 and C2 = degradants of compound-C; D1 = degradant ofcompound-D).
photo-degradation. However the dimers showed considerabledegradation (10–15%) when oxidized in 3% H2O2. The degradantswere well separated from the fluoroquinolone dimers (Fig. 2F) andthe spectral peak purity tests confirmed the homogeneity of dimerpeaks in the stressed samples.
The limits of detection of the four compounds were in therange 0.04–0.1 �g/mL and limits of quantification were in the range0.1–0.3 �g/mL. The detector response linearity to varying analyteconcentrations was established by analyzing standard solutions atseven different concentrations ranging from LOQ to 150% of nom-inal analyte concentration. Linearity curves (area vs. conc.) wereplotted for each compound and the data was subjected to regres-sion analysis. The test results confirm linear relationships betweendetector response and concentrations (Table 2). From the results ofvalidation tests that were performed, the range for this method isLOQ to 150% of the nominal analyte concentration.
Table 2Linearity results.
Fluoroquinolonedimer
Range Equation R2 LOQ (�g/mL)
Comp-A LOQ–150% y = 21057x + 1253 0.9991 0.3Comp-B LOQ–150% y = 21921x + 952 0.9997 0.1Comp-C LOQ–150% y = 18043x + 4843 0.9910 0.3Comp-D LOQ–150% y = 13175x + 1630 0.9995 0.3
3.3.2. Precision and accuracyThe %RSD in area at LOQ levels for all four compounds was not
more than 10.0% during the repeatability, inter-day and interme-diate precision experiments. At the nominal analyte concentration,the %RSD for the four compounds was better than 2.0% for all pre-cision experiments which assert the suitability of the developedmethod.
Author's personal copy
166 M. Khan et al. / Journal of Pharmaceutical and Biomedical Analysis 59 (2012) 162– 166
Table 3Accuracy results.
Fluoroquinolone dimer Accuracy level
LOQ 80% 100% 120% 150%
% Mean recoverya ± std. dev.Comp-A 96.15 ± 0.81 101.09 ± 0.26 98.82 ± 0.63 99.83 ± 0.28 98.27 ± 0.55Comp-B 98.84 ± 0.32 99.32 ± 0.61 100.82 ± 1.38 99.96 ± 0.15 99.51 ± 0.17Comp-C 96.54 ± 0.27 98.13 ± 0.35 99.83 ± 0.49 101.64 ± 0.24 101.04 ± 0.28Comp-D 97.25 ± 0.18 100.11 ± 0.18 100.84 ± 0.44 99.65 ± 0.26 100.45 ± 0.03
a n = 3 determinations.
For all compounds, the recoveries at LOQ ranged from 96.2 to98.8%, and the recoveries at other concentrations ranged from 98.1to 101.6% (Table 3). It is noteworthy that these recoveries attest thesuitability and performance of the developed method.
3.3.3. Robustness and stability of analytical solutionsA robustness test is expected to confirm the reliability of an
analysis to deliberately made alterations to the method parame-ters. Analyses results obtained in robustness studies under variedchromatographic conditions (flow rate, %TFA, %organic phase andcolumn temperature) illustrate that the resolution between thedimers and in particular the most critical pair (Comp-A and Comp-C) was always greater than 1.5 vindicating robustness of themethod.
The %RSD for the four dimers reanalyzed after 6, 12, 24, 36 and48 h of storage was not more than 2.0%, indicating that the samplesolutions were stable for at least 48 h when stored at 2–8 ◦C or roomtemperature.
4. Conclusion
A simple and effective stability indicating HPLC method wasdeveloped and validated for simultaneous quantitative determina-tion of four novel fluoroquinolone dimers. The method was found tobe suitable for determining the dimers within the range LOQ–150%of nominal analyte concentration and was conveniently appliedto determine the real samples before evaluating their biologicalactivities.
Acknowledgments
The authors are grateful to the management of Aptuit LaurusPvt. Ltd. for financially supporting this work. The authors wish toacknowledge the kind support and encouragement provided by Dr.Satyanarayana C., Dr. Srihari Raju K. and Mr. Shyam Kumar through-out this research.
References
[1] H. Koga, A. Itoh, T. Murayama, S. Suzue, T. Irikura, Structure-activityrelationships of antibacterial 6,7- and 7,8-disubstituted 1-alkyl-1,4-dihydro-4-oxoquinoline-3-carboxylic acids, J. Med. Chem. 23 (1980)1358–1363.
[2] R. Wise, J. Andrews, L. Edward, In vitro activity of Bay 09867, a new quinolonederivative, compared with those of other antimicrobial agents, Antimicrob.Agents Chemother. 23 (1983) 559–564.
[3] D.T.W. Chu, P.B. Fernandes, A.K. Claiborne, E. Pihuleac, C.W. Nordeen, R.E.Maleczka, A. Pernet, Synthesis and structure–activity relationship of 1-aryl-6,8-difluoroquinolone antibacterial agents, J. Med. Chem. 30 (1987)504–509.
[4] D.T.W. Chu, R.E. Maleczka, Synthesis of 4-oxo-4H-quino[2, 3,4-i,j][1,4]-benoxazine-5-carboxylic acid derivatives, J. Hetrocycl. Chem. 24 (1987)453–456.
[5] J.A. David, H.F. Andrew, F.K. Edward, Synthesis and antibacterial activity of 2,3-dehydroofloxacin, J. Hetrocycl. Chem. 27 (1990) 509–1511.
[6] X. Zhao, B. Quinn, R.J. Kerns, K. Drlica, Bactericidal activity and targetpreference of a piperazinyl-cross-linked ciprofloxacin dimer with Staphy-lococcus aureus and Escherichia coli, J. Antimicrob. Chemother. 58 (2006)1283–1286.
[7] K.A. Gould, X. Pan, R.J. Kerns, L.M. Fisher, Ciprofloxacin dimers targetgyrase in Streptococcus pneumonia, Antimicrob. Agents Chemother. 48 (2004)2108–2115.
[8] N.R. Chepyala, R.R. Durgi, L.K. Tatini, G.V. Subbaraju, R.M. Hindupur, M.R. Dhan-vada, Quinolone dimers as potential antibacterial agents, Lett. Org. Chem. 8(2010), in press.
[9] E. Nemutlu, S. Kır, ö. özyüncü, M.S. Beksac, Simultaneous Separation anddetermination of seven quinolones using HPLC: analysis of levofloxacinand moxifloxacin in plasma and amniotic fluid, Chromatographia 66 (2007)S15–S24.
[10] S. Schulte, T. Ackermann, N. Bertram, T. Sauerbruch, W.D. Paar, Determina-tion of the newer quinolones levofloxacin and moxifloxacin in plasma byhigh-performance liquid chromatography with fluorescence detection, J. Chro-matogr. Sci. 44 (2006) 205–208.
[11] D.A. Volmer, B. Mansoori, S.J. Locke, Study of 4-quinolone antibiotics inbiological samples by short-column liquid chromatography coupled withelectrospray ionization tandem mass spectrometry, Anal. Chem. 69 (1997)4143–4155.
[12] M. Ferdig, A. Kaleta, T.D. Thanh, W. Buchberger, Improved capillary elec-trophoretic separation of nine (fluoro)quinolones with fluorescence detectionfor biological and environmental samples, J. Chromatogr. A 1047 (2004)305–311.
[13] Stability testing of new drug substances and products Q1A (R2), in: Interna-tional Conference on Harmonization, IFPMA, Geneva, 2003.
1 23
ChromatographiaAn International Journal for RapidCommunication in Chromatography,Electrophoresis and AssociatedTechniques ISSN 0009-5893 ChromatographiaDOI 10.1007/s10337-013-2467-x
Simultaneous Trace Level Determinationof Potentially Genotoxic Hydrazine,Methylhydrazine and Alkylamines inPharmaceutical Substances by CE UsingIndirect Photometric DetectionMuzaffar Khan, Shyam Kumar,K. Jayasree, K. V. S. R. Krishna Reddy &P. K. Dubey

1 23
Your article is protected by copyright and
all rights are held exclusively by Springer-
Verlag Berlin Heidelberg. This e-offprint is
for personal use only and shall not be self-
archived in electronic repositories. If you wish
to self-archive your article, please use the
accepted manuscript version for posting on
your own website. You may further deposit
the accepted manuscript version in any
repository, provided it is only made publicly
available 12 months after official publication
or later and provided acknowledgement is
given to the original source of publication
and a link is inserted to the published article
on Springer's website. The link must be
accompanied by the following text: "The final
publication is available at link.springer.com”.
ORIGINAL
Simultaneous Trace Level Determination of Potentially GenotoxicHydrazine, Methylhydrazine and Alkylamines in PharmaceuticalSubstances by CE Using Indirect Photometric Detection
Muzaffar Khan • Shyam Kumar • K. Jayasree •
K. V. S. R. Krishna Reddy • P. K. Dubey
Received: 30 August 2012 / Revised: 4 April 2013 / Accepted: 4 April 2013
� Springer-Verlag Berlin Heidelberg 2013
Abstract A simple, fast, and sensitive capillary electro-
phoretic method was developed for determining two
genotoxic impurities hydrazine and methylhydrazine and
eight alkyl amines at trace levels in pharmaceutical sub-
stances using indirect photometric detection. The method
development involved a systematic screening of various
cationic visualizing reagents and optimization of separation
conditions to obtain the best resolution and sensitivities.
The optimized method was validated for specificity, pre-
cision, linearity, and accuracy. Linear calibration curves
(R [ 0.99) were obtained for all analytes in the range
LOQ–200 % of nominal concentrations. The developed CE
method was effectively implemented for estimating
hydrazine and alkylamines in several active pharmaceutical
ingredients (APIs).
Keywords Capillary electrophoresis � Genotoxic
impurities � Hydrazines � Alkylamine
Introduction
Genotoxic impurities have the potential to induce genetic
mutations, chromosomal aberrations and rearrangements
and can cause cancer in humans. These impurities may be
introduced into the drug substances and drug products as
residual starting materials and reagents, excipients, process
related by-products or through drug substance degradation.
The ICH Q3A(R), Q3B(R2), and Q3C(R5) guidelines [1–
3] do not adequately address the concerns of genotoxicity
and hence cannot be applied for controlling the genotoxic
impurities. The guidelines on the limits of genotoxic
impurities [4] and the USFDA draft guidance document [5]
provide guidance on dealing with genotoxic impurities in
drug substances and drug products. These guidelines con-
sider an exposure level of 1.5 lg/person/day as an
acceptable qualification threshold for each genotoxic
impurity. The guidelines [5, 6] also emphasize that the
TTC limits should be applied to the sum total of structur-
ally similar genotoxins as they are expected to have the
same mode of action and the same target. This concept of
TTC when applied ensures a lifetime risk of cancer of
\10-5, a risk level that is thought to pose negligible safety
concerns. A staged TTC based on the duration of exposure
may also be acceptable when the drug substance is not
intended for lifetime consumption [7]. The analyses of
genotoxic impurities remains a challenge, as their absolute
concentrations should be limited to ppm levels in the drug
substances.
Hydrazine is an useful building block in organic syn-
thesis of pharmaceuticals and pesticides owing to its
reducing properties. It has been used as a synthetic inter-
mediate in the manufacturing of several drugs such as
nufuroxazide, hydrazaline, isoniazid, etc. Hydrazine is a
degradation impurity in isoniazid [8], hydralazine,
M. Khan (&)
Regulatory Affairs, Laurus Labs Private Limited,
ICICI Knowledge Park, Turkapally, Shameerpet,
Hyderabad 500078, India
e-mail: [email protected]
S. Kumar � K. Jayasree � K. V. S. R. Krishna Reddy
Analytical Development, Laurus Labs Private Limited,
ICICI Knowledge Park, Turkapally, Shameerpet,
Hyderabad 500078, India
P. K. Dubey
Department of Chemistry, Jawaharlal Nehru Technological
University, Kukatpally, Hyderabad 500072, India
123
Chromatographia
DOI 10.1007/s10337-013-2467-x
Author's personal copy
phenelzine, and isocarboxazid [9, 10]. Hydrazine and
methylhydrazine are genotoxic in nature [11, 12] and
therefore warrant a control in the drug substances at or
below TTC levels.
The alkylamines such as ethylamine, diethylamine, and
triethylamine are used as solvents in the pharmaceutical
synthesis. Owing to their basic nature, the alkylamines are
frequently used to trap acids. While most of the arylamines
are considered to be genotoxic, the alkylamines are highly
corrosive, create respiratory problems, and need appropri-
ate control in drug substances. No specific limits for these
alkylamines have been proposed in the ICH Q3 guidelines.
In case of triethylamine, the regulatory assessors recognize
a level of 320 ppm (considering a 10 g daily dose) as
acceptably safe based on repeated dose toxicity and
reproductive toxicity studies. However, for other organic
bases, the proposed limits should be supported with toxi-
cological data.
Hydrazine, its methylated analogs and the aliphatic
amines in general are highly polar and basic molecules.
Hydrazines and the aliphatic amines are transparent to UV
detection as they lack chromophores and therefore cannot
be analyzed by HPLC–UV in their native form. The non-
substituted hydrazine does not contain carbon hence cannot
be detected by flame ionization detection technique. As
hydrazines are low molecular weight compounds, the trace
level analysis using MS detection can be challenging due to
interfering species. Elder et al. [13] have recently reviewed
the control and analysis of hydrazine, hydrazides, and
hydrazones in APIs and drug products. Derivatization fol-
lowed by HPLC [14] and GC [15] analysis have been the
techniques of choice for determining hydrazines. TLC, IC,
and electro-chromatographic methods have also been
employed for determining hydrazines after derivatization.
The authors [13] also quote two very recent examples of
hydrophilic interaction chromatography (HILIC) for
hydrazine analysis [16, 17] and predict that this may
become the favored analytical approach in future, as it does
not involve derivatization. However, CE can be a very
cost-effective alternative to ion chromatography and HI-
LIC but unfortunately is often underutilized. Recently,
Khan et al. [18] have demonstrated the application of CE
for determining genotoxins dimethylsulfate and chloro-
acetyl chloride at trace levels in drug substances.
The analysis of hydrazines and other trace analytes by
chromatographic techniques is often preceded by sample
pretreatment which involves removal of substrate inter-
ferences through liquid–liquid extraction (LLE) and
liquid–solid extraction (LSE) techniques. Recently, three
hydrazines namely hydrazine, methylhydrazine, and 1,1-
dimethylhydrazine were separated on a poly(methylmeth-
acrylate) microchip with contactless conductivity detection
[19]. Determination of hydrazine and its methylated
analogs by non-aqueous capillary electrophoresis with
amperometric detection [20] and by electrochemical
detection using a 4-pyridyl hydroquinone self-assembled
microdisk platinum electrode [21] has been reported.
The purpose of this research was to develop a simple
and fast generic method to determine hydrazine, meth-
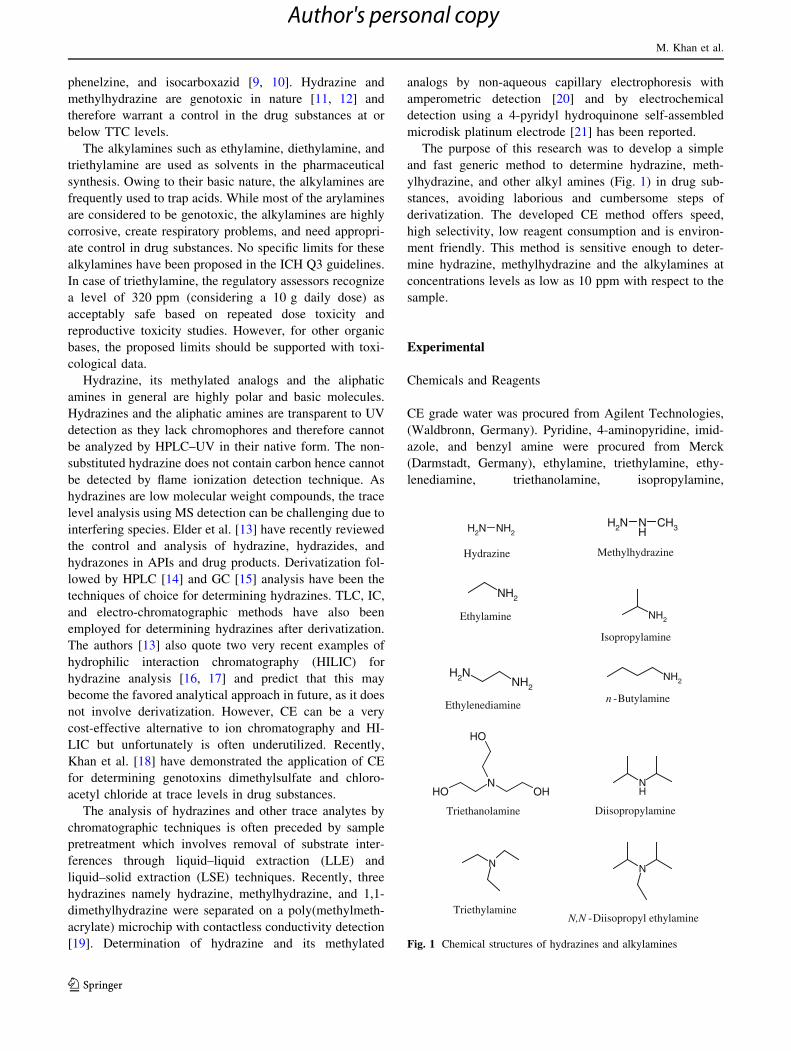
ylhydrazine, and other alkyl amines (Fig. 1) in drug sub-
stances, avoiding laborious and cumbersome steps of
derivatization. The developed CE method offers speed,
high selectivity, low reagent consumption and is environ-
ment friendly. This method is sensitive enough to deter-
mine hydrazine, methylhydrazine and the alkylamines at
concentrations levels as low as 10 ppm with respect to the
sample.
Experimental
Chemicals and Reagents
CE grade water was procured from Agilent Technologies,
(Waldbronn, Germany). Pyridine, 4-aminopyridine, imid-
azole, and benzyl amine were procured from Merck
(Darmstadt, Germany), ethylamine, triethylamine, ethy-
lenediamine, triethanolamine, isopropylamine,
NH2 NH2
Hydrazine
NH2 NH
CH3
Methylhydrazine
NH2
Ethylamine
NH2
NH2
Ethylenediamine
NH2
Isopropylamine
NH2
n -Butylamine
NOHOH
OH
Triethanolamine
NH
Diisopropylamine
N
Triethylamine
N
N,N -Diisopropyl ethylamine
Fig. 1 Chemical structures of hydrazines and alkylamines
M. Khan et al.
123
Author's personal copy
diisopropylamine, N,N-diisopropyl ethylamine and N-butyl-
amine were procured from Sigma Aldrich (Steinheim,
Germany). Hydrazine and methylhydrazine were procured
from Spectrochem (Mumbai, India). All reagents were of
analytical grade or highest available purity. The drug
substances Cisplatin, Carboplatin, Oxaliplatin, Emtricitabine
and Tenofovir disoproxil fumarate were synthesized at Lau-
rus Labs Private Limited (Hyderabad, India).
Instrumentation and Electrophoretic Conditions
An Agilent Technologies Capillary Electrophoresis system
equipped with an on-column diode-array detector, an auto-
sampler, autoinjector, a capillary thermostat and a power
supply able to deliver up to 30 kV was used for performing
the separations. Bare fused silica capillary of total length
80.5 cm (length to detector = 72 cm); 50-lm internal
diameter having an extended light path with a bubble factor of
3 (Agilent Technologies, Waldbronn, Germany) was used for
enhanced sensitivity. An alignment interface, containing an
optical slit matched to the internal diameter of 150-lm was
utilized. The Agilent ChemStation Software was used for
system control, data acquisition, and post-run processing.
A voltage of 30 kV was applied in positive polarity
mode. Injections were made hydrodynamically by pressure
at 50 mbar for 30 s followed by injection of a BGE plug by
pressure at 50 mbar for 2 s. The capillary was thermostated
at 25 �C. The detector signals were monitored at 350 nm
(bandwidth 80 nm) with a reference wavelength of 264 nm
(bandwidth 20 nm).
New capillaries were washed with CE grade water for
30 min, followed by the BGE for 50 min. Prior to every
use, on each day, the capillary was conditioned by flushing
with water for 10 min. and then with the BGE for 20 min.
Between analyses, the capillary was flushed with the BGE
for 3 min. To maintain a high level of reproducibility for
both migration times and peak areas, the BGE was replaced
after every 15 injections.
Preparation of Solutions
Preparation of Background Electrolyte
The background electrolyte (BGE) was prepared by dissolving
about 47.0 mg of 4-aminopyridine in 100 mL CE grade water.
The pH of this solution was adjusted to 5.5 ± 0.1 with 10 %
ortho-phosphoric acid. The resultant BGE was filtered through
0.2 lm nylon syringe filters before use.
Preparation of Standard (Analyte) and Sample Solutions
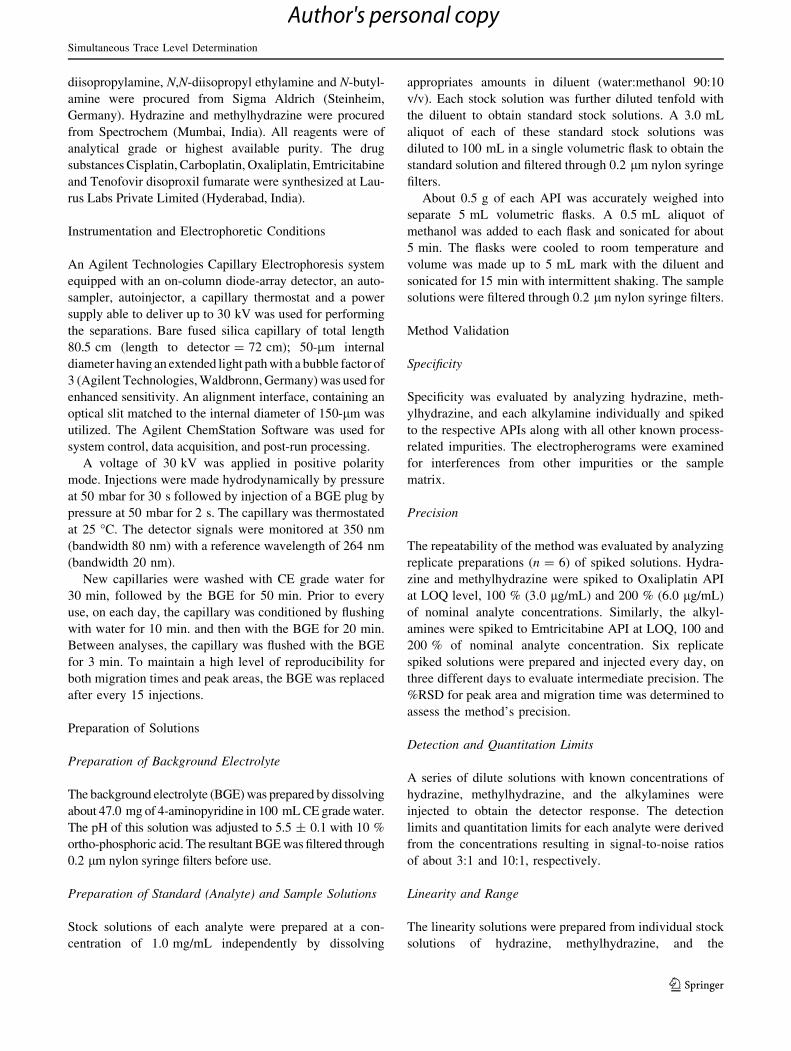
Stock solutions of each analyte were prepared at a con-
centration of 1.0 mg/mL independently by dissolving
appropriates amounts in diluent (water:methanol 90:10
v/v). Each stock solution was further diluted tenfold with
the diluent to obtain standard stock solutions. A 3.0 mL
aliquot of each of these standard stock solutions was
diluted to 100 mL in a single volumetric flask to obtain the
standard solution and filtered through 0.2 lm nylon syringe
filters.
About 0.5 g of each API was accurately weighed into
separate 5 mL volumetric flasks. A 0.5 mL aliquot of
methanol was added to each flask and sonicated for about
5 min. The flasks were cooled to room temperature and
volume was made up to 5 mL mark with the diluent and
sonicated for 15 min with intermittent shaking. The sample
solutions were filtered through 0.2 lm nylon syringe filters.
Method Validation
Specificity
Specificity was evaluated by analyzing hydrazine, meth-
ylhydrazine, and each alkylamine individually and spiked
to the respective APIs along with all other known process-
related impurities. The electropherograms were examined
for interferences from other impurities or the sample
matrix.
Precision
The repeatability of the method was evaluated by analyzing
replicate preparations (n = 6) of spiked solutions. Hydra-
zine and methylhydrazine were spiked to Oxaliplatin API
at LOQ level, 100 % (3.0 lg/mL) and 200 % (6.0 lg/mL)
of nominal analyte concentrations. Similarly, the alkyl-
amines were spiked to Emtricitabine API at LOQ, 100 and
200 % of nominal analyte concentration. Six replicate
spiked solutions were prepared and injected every day, on
three different days to evaluate intermediate precision. The
%RSD for peak area and migration time was determined to
assess the method’s precision.
Detection and Quantitation Limits
A series of dilute solutions with known concentrations of
hydrazine, methylhydrazine, and the alkylamines were
injected to obtain the detector response. The detection
limits and quantitation limits for each analyte were derived
from the concentrations resulting in signal-to-noise ratios
of about 3:1 and 10:1, respectively.
Linearity and Range
The linearity solutions were prepared from individual stock
solutions of hydrazine, methylhydrazine, and the
Simultaneous Trace Level Determination
123
Author's personal copy

alkylamines at LOQ, 50, 100, 150, and 200 % of analyte
concentrations and analyzed. The data were subjected to
linear regression analysis with the least squares method.
Accuracy
The samples of Oxaliplatin API were spiked with hydra-
zine and methylhydrazine at LOQ, 100 and 200 % of the
nominal analyte concentration. The alkylamines were
spiked to samples of Emtricitabine API at LOQ, 100 and
200 % of the nominal analyte concentrations covering the
range. Triplicate samples at each level were prepared and
analyzed as per the method. The recoveries of the spiked
analytes were calculated against freshly prepared standards
and the accuracy was assessed from mean percentage
recoveries.
Results and Discussion
Development and Optimization of Method
The development and optimization trials were made by
evaluating different cationic visualizing reagents for
obtaining the desired selectivities, maximum sensitivity,
and peak symmetry for the target analytes through indirect
photometric detection.
The principle of indirect photometric detection is
based on the fact that the UV-absorbing ions present in
BGE are displaced by the transparent, non-UV-absorbing
analyte ions [22]. This displacement causes a negative
signal in the analyte zone when compared to the high
continuous background signal. The negative signals cor-
responding to the analyte peaks can be made upright by
a Electropherogram of hydrazine and methylhydrazine spiked to Oxaliplatin API at LOQ level
b Electropherogram of alkylamines spiked to Emtricitabine API at LOQ level
min1 2 3 4 5 6 7
mAU
-16
-14
-12
-10
-8
-6
-4
-2
1
109
876
54
min1 2 3 4 5 6 7
mAU
-20
-17.5
-15
-12.5
-10
-7.5
-5
-2.5
2
3
Fig. 2 a Electropherogram of
hydrazine and methylhydrazine
spiked to Oxaliplatin API at
LOQ level. b Electropherogram
of alkylamines spiked to
Emtricitabine API at LOQ level
1. Ethylenediamine,
2.Hydrazine,
3. Methylhydrazine,
4. Ethylamine,
5. Isopropylamine,
6. n-Butylamine,
7. Triethylamine,
8. Diisopropylamine,
9. Triethanolamine,
10. N,N-Diisopropyl ethylamine
M. Khan et al.
123
Author's personal copy
subtracting suitable reference absorbance from the sam-
ple absorbance. The sensitivity of detection depends
upon the molar absorptivity of the visualizing reagent,
the baseline noise, the transfer ratio, and the optical path
length [23].
The visualizing reagent, detection wavelength, and the
electrolyte pH play a vital role in the separation and
detection of UV-inactive analytes. In CE, the Kohlraush
regulating function determines the probe displacement by
the analyte [24]. The electrophoretic mobility of the probe
ions relative to the analyte ions influence the peak shapes
due to electromigration dispersions.
BGEs containing 2–10 mM visualizing reagents pyri-
dine, imidazole, benzylamine, and 4-aminopyridine were
evaluated for obtaining optimum separation between the
analytes and sensitivity. The order of mobilities of the
visualizing reagents being evaluated was: pyridine \ ben-
zylamine \ 4-aminopyridine \ Imidazole. The molar
absorptivities of the visualizing reagents at the most
appropriate wavelengths were found to be in the order
pyridine \ benzylamine \ Imidazole \ 4-aminopyridine.
In accordance, the analyte response obtained with benzyl-
amine and pyridine was less when compared to the other
probes. The pH of the BGE played a critical role in
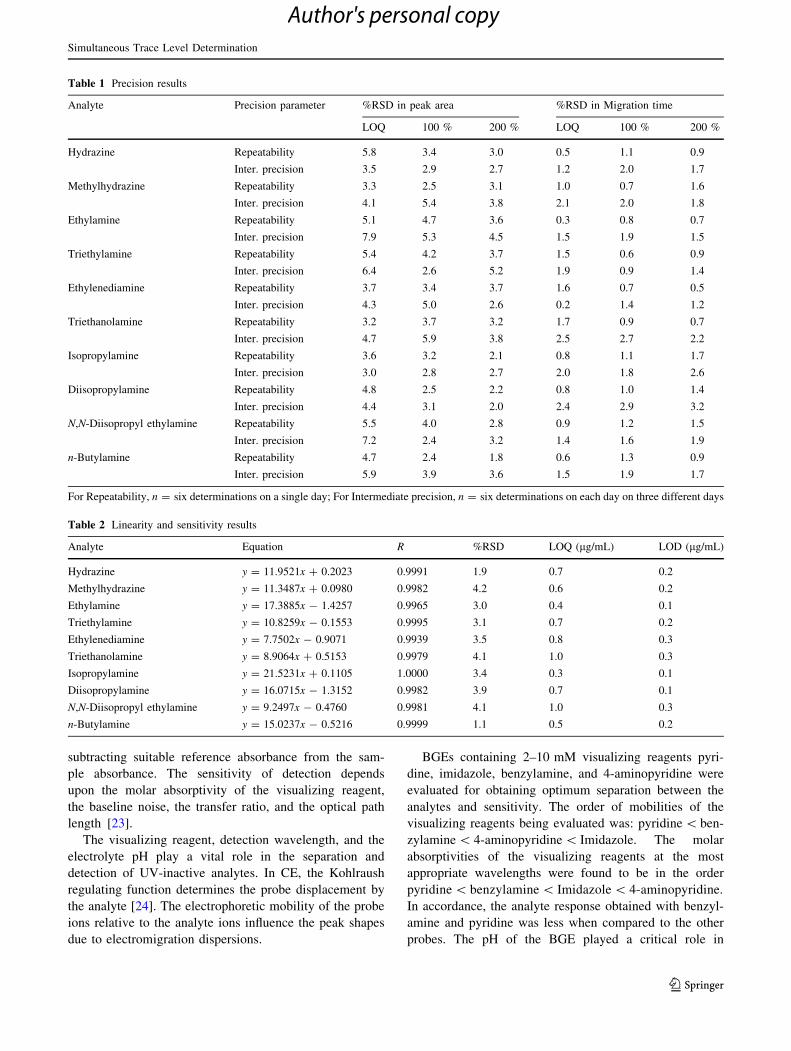
Table 1 Precision results
Analyte Precision parameter %RSD in peak area %RSD in Migration time
LOQ 100 % 200 % LOQ 100 % 200 %
Hydrazine Repeatability 5.8 3.4 3.0 0.5 1.1 0.9
Inter. precision 3.5 2.9 2.7 1.2 2.0 1.7
Methylhydrazine Repeatability 3.3 2.5 3.1 1.0 0.7 1.6
Inter. precision 4.1 5.4 3.8 2.1 2.0 1.8
Ethylamine Repeatability 5.1 4.7 3.6 0.3 0.8 0.7
Inter. precision 7.9 5.3 4.5 1.5 1.9 1.5
Triethylamine Repeatability 5.4 4.2 3.7 1.5 0.6 0.9
Inter. precision 6.4 2.6 5.2 1.9 0.9 1.4
Ethylenediamine Repeatability 3.7 3.4 3.7 1.6 0.7 0.5
Inter. precision 4.3 5.0 2.6 0.2 1.4 1.2
Triethanolamine Repeatability 3.2 3.7 3.2 1.7 0.9 0.7
Inter. precision 4.7 5.9 3.8 2.5 2.7 2.2
Isopropylamine Repeatability 3.6 3.2 2.1 0.8 1.1 1.7
Inter. precision 3.0 2.8 2.7 2.0 1.8 2.6
Diisopropylamine Repeatability 4.8 2.5 2.2 0.8 1.0 1.4
Inter. precision 4.4 3.1 2.0 2.4 2.9 3.2
N,N-Diisopropyl ethylamine Repeatability 5.5 4.0 2.8 0.9 1.2 1.5
Inter. precision 7.2 2.4 3.2 1.4 1.6 1.9
n-Butylamine Repeatability 4.7 2.4 1.8 0.6 1.3 0.9
Inter. precision 5.9 3.9 3.6 1.5 1.9 1.7
For Repeatability, n = six determinations on a single day; For Intermediate precision, n = six determinations on each day on three different days
Table 2 Linearity and sensitivity results
Analyte Equation R %RSD LOQ (lg/mL) LOD (lg/mL)
Hydrazine y = 11.9521x ? 0.2023 0.9991 1.9 0.7 0.2
Methylhydrazine y = 11.3487x ? 0.0980 0.9982 4.2 0.6 0.2
Ethylamine y = 17.3885x - 1.4257 0.9965 3.0 0.4 0.1
Triethylamine y = 10.8259x - 0.1553 0.9995 3.1 0.7 0.2
Ethylenediamine y = 7.7502x - 0.9071 0.9939 3.5 0.8 0.3
Triethanolamine y = 8.9064x ? 0.5153 0.9979 4.1 1.0 0.3
Isopropylamine y = 21.5231x ? 0.1105 1.0000 3.4 0.3 0.1
Diisopropylamine y = 16.0715x - 1.3152 0.9982 3.9 0.7 0.1
N,N-Diisopropyl ethylamine y = 9.2497x - 0.4760 0.9981 4.1 1.0 0.3
n-Butylamine y = 15.0237x - 0.5216 0.9999 1.1 0.5 0.2
Simultaneous Trace Level Determination
123
Author's personal copy

separating the analytes especially the late eluting amines.
The separation was evaluated at pH 4.2, 5.1, 5.5, and 6.0
and the best separation was obtained at a pH of 5.5.
Lower concentrations of the visualizing reagents resul-
ted in broad peaks due to electro-migration dispersion. On
the other hand, higher concentrations resulted in higher
noise levels, decreased sensitivity and an adverse effect on
the linearity of detection [25]. Good peak symmetries, high
sensitivity, and optimum resolution between the analytes
could be achieved using 5 mM 4-aminopyridine in the
BGE system at a pH of 5.5 which was chosen as final
conditions. When compared to other visualizing reagents,
the sensitivity of 4-aminopyridine for the analytes was at
least twofold higher which can be attributed to its higher
molar absorptivity. The sample and reference wavelengths
were optimized to achieve the highest sensitivity and
minimum baseline noise. Based on the visualizing
reagent’s absorption profile, different combinations of
sample wavelength and reference wavelength were
evaluated with the features of diode-array detector (DAD).
The method was found to be most sensitive when the
signals were acquired at a sample wavelength of 350 nm
(bandwidth 80 nm) using a reference wavelength of
264 nm (bandwidth 20 nm).
The sampling rate of the detector plays an important role
in both the sensitivity and the resolution of analyte peaks.
The effects are more prominent when the peaks are very
sharp and narrow, as obtained in CE and GC. The impact of
sampling rate (hertz) on peak height and baseline noise was
evaluated taking hydrazine as the model peak. The highest
sensitivity and minimum baseline noise was obtained with
a sampling rate of 20 hertz.
The separation was evaluated at 20, 25, and 30 kV and the
migration times decreased with the increase in the applied
voltage. The highest available voltage on the equipment
(30 kV) was chosen as it provided highest theoretical plates
and resolution since the separation proceeds rapidly mini-
mizing the effects of diffusion and peak broadening.
Table 3 Accuracy results
Analyte % Recovery ± SD (n = 3 determinations)
LOQ 50 % 100 % 200 %
Hydrazine 94.6 ± 2.6 98.0 ± 1.8 96.8 ± 1.7 96.7 ± 2.1
Methylhydrazine 92.2 ± 1.9 98.3 ± 2.0 94.5 ± 2.3 95.5 ± 2.5
Ethylamine 94.9 ± 1.3 100.2 ± 1.4 99.8 ± 1.4 98.6 ± 2.7
Triethylamine 97.5 ± 2.3 97.5 ± 2.6 96.6 ± 2.1 99.8 ± 0.7
Ethylenediamine 96.8 ± 1.8 95.8 ± 1.8 99.6 ± 1.9 98.3 ± 3.1
Triethanolamine 97.4 ± 2.5 97.7 ± 1.0 99.5 ± 1.1 99.5 ± 1.4
Isopropylamine 101.6 ± 2.2 102.9 ± 1.7 100.6 ± 2.6 96.8 ± 1.0
Diisopropylamine 93.4 ± 2.2 96.3 ± 1.4 94.4 ± 2.5 96.1 ± 3.1
N,N-Diisopropyl ethylamine 102.8 ± 2.1 98.9 ± 1.9 103.6 ± 0.8 100.5 ± 2.9
n-Butylamine 93.0 ± 1.6 96.4 ± 2.9 100.1 ± 2.5 95.3 ± 1.8
Table 4 Triethylamine and hydrazine results in APIs
Triethylamine content in
emtricitabine (limit = 320 ppm)
Hydrazine content in cisplatin
(limit = 8.3 ppm)
Hydrazine content in carboplatin
(limit = 3 ppm)
Hydrazine content in oxaliplatin
(limit = 7.5 ppm)
Batch no. of API Triethylamine
(ppm)
Batch no. of API Hydrazine
(ppm)
Batch no. of API Hydrazine
(ppm)
Batch no. of API Hydrazine
(ppm)
AECB-3/VSP1/
009/11
Not detected B/ACP-2/HYD1/
001/11
\2 ACB-2/HYD1/
007/10
\2 AOP-2/HYD1/
004/09
\2
AECB-3/VSP1/
010/11
35 B/ACP-2/HYD1/
002/11
\2 ACB-2/HYD1/
008/10
\2 AOP-2/HYD1/
005/09
\2
AECB-3/VSP1/
011/11
42 B/ACP-2/HYD1/
003/11
\2 ACB-2/HYD1/
009/10
\2 AOP-2/HYD1/
006/09
\2
AECB-3/VSP1/
025/10
76 B/ACP-2/HYD1/
004/11
\2 ACB-2/HYD1/
010/10
\2 AOP-2/HYD1/
007/09
\2
0087/Ast-3/2522/
087
220 B/ACP-2/HYD1/
005/11
\2 ACB-2/HYD1/
011/10
\2 AOP-2/HYD1/
012/10
\2
0087/Ast-3/0300/
063
275 B/ACP-2/HYD1/
001/10
\2 AOP-2/HYD1/
013/10
\2
M. Khan et al.
123
Author's personal copy
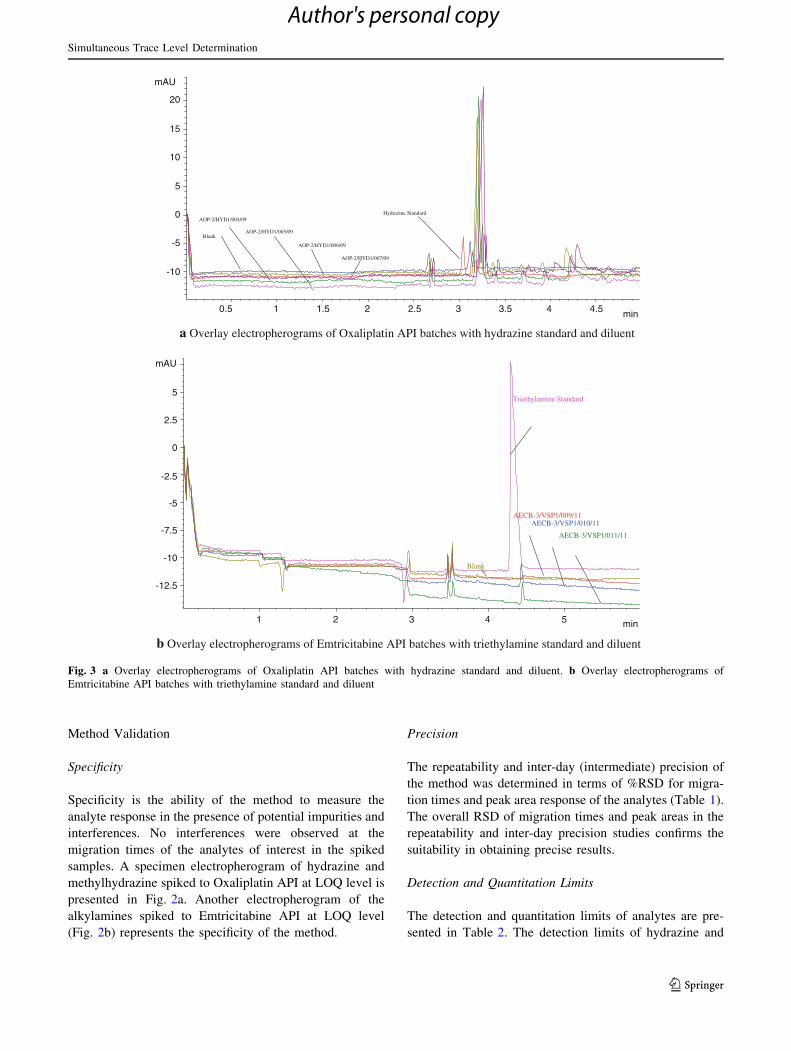
Method Validation
Specificity
Specificity is the ability of the method to measure the
analyte response in the presence of potential impurities and
interferences. No interferences were observed at the
migration times of the analytes of interest in the spiked
samples. A specimen electropherogram of hydrazine and
methylhydrazine spiked to Oxaliplatin API at LOQ level is
presented in Fig. 2a. Another electropherogram of the
alkylamines spiked to Emtricitabine API at LOQ level
(Fig. 2b) represents the specificity of the method.
Precision
The repeatability and inter-day (intermediate) precision of
the method was determined in terms of %RSD for migra-
tion times and peak area response of the analytes (Table 1).
The overall RSD of migration times and peak areas in the
repeatability and inter-day precision studies confirms the
suitability in obtaining precise results.
Detection and Quantitation Limits
The detection and quantitation limits of analytes are pre-
sented in Table 2. The detection limits of hydrazine and
a Overlay electropherograms of Oxaliplatin API batches with hydrazine standard and diluent
b Overlay electropherograms of Emtricitabine API batches with triethylamine standard and diluent
min1 2 3 4 5
mAU
-12.5
-10
-7.5
-5
-2.5
0
2.5
5Triethylamine Standard
Blank
AECB-3/VSP1/009/11AECB-3/VSP1/010/11
AECB-3/VSP1/011/11
min0.5 1 1.5 2 2.5 3 3.5 4 4.5
mAU
-10
-5
0
5
10
15
20
Blank
Hydrazine StandardAOP-2/HYD1/004/09
AOP-2/HYD1/005/09
AOP-2/HYD1/006/09
AOP-2/HYD1/007/09
Fig. 3 a Overlay electropherograms of Oxaliplatin API batches with hydrazine standard and diluent. b Overlay electropherograms of
Emtricitabine API batches with triethylamine standard and diluent
Simultaneous Trace Level Determination
123
Author's personal copy

methylhydrazine were 2 ppm and the quantification limits
about 7 ppm with respect to sample concentration. These
results emphasize that the method is sensitive enough for
determining hydrazine and methylhydrazine at ppm levels
in bulk drug samples considering the allowed levels of
these toxic impurities. The limit of detection for the
alkylamines ranged from 1–3 ppm, while the quantification
limits for the alkylamines ranged from 3–10 ppm with
respect to sample concentration (Table 2).
Linearity and Range
The detector response linearity to varying analyte con-
centrations was established by analyzing standard solutions
at five different concentrations ranging from LOQ to
200 % of nominal analyte concentration. Linearity curves
(Area vs Concentration) were plotted for each analyte and
the data were subjected to regression analysis. The linearity
experiments conclude that the peak responses are directly
proportional to their concentrations (Table 2). The range of
a method is the interval in which it has a suitable level
of precision, accuracy, and linearity. From the results of
validation tests that were performed, the range for this
method was LOQ to 200 % of the nominal analyte
concentration.
Accuracy
The accuracy of a method expresses the closeness between
the theoretical value and the determined value. The accu-
racy results were calculated as mean recoveries for
hydrazine, methylhydrazine and the alkylamines at LOQ
level, 50, 100, and 200 % of nominal analyte concentra-
tions (Table 3). The results suggest that this method rep-
resents a valuable and accurate tool for the analysis of
hydrazine, methylhydrazine, and alkylamines in pharma-
ceutical drug substances.
To separate out the systematic variability due to the
sample preparation, injection and integration, and demon-
strate linear accuracy, a one-way hierarchical analysis of
variation (ANOVA) within the range was performed. The
recoveries were found to be independent of the spiked
concentrations for all the analytes (ANOVA, p [ 0.05).
Application of the Method
The developed method was applied for determining
hydrazine in Cisplatin, Oxaliplatin, and Carboplatin APIs.
The results of hydrazine content in the platin drugs were
successfully defended to address regulatory queries
(Table 4). An overlay of the electropherograms of Oxa-
liplatin API batches with hydrazine standard and the dilu-
ent is presented in Fig. 3a. Several aliphatic alkylamines
such as triethyl amine (Table 4), diisopropyl amine and
ethyl amine used in the manufacturing process of different
APIs namely Emtricitabine, Tenofovir disoproxil fumarate,
etc. were estimated. An overlay of the electropherograms
of Tenofovir disoproxil fumarate, triethyl amine, and the
diluent blank is presented in Fig. 3b. This method was
applied as a part of routine in-process control and release
testing of several other APIs.
Conclusion
A simple fast generic CE method was developed and val-
idated for determining the genotoxic impurities hydrazine,
methylhydrazine, and aliphatic alkylamines in drug sub-
stances with indirect photometric detection. The method
was applied to demonstrate that the genotoxic hydrazines
were within the safe and acceptable levels in the drug
substances to address regulatory queries. The control of
alkylamines in several other drug substances was also
shown through carryover studies using the same analytical
method.
Acknowledgments The authors wish to thank the management of
Laurus Labs Pvt. Ltd. for supporting this work. The authors also wish
to acknowledge the encouragement provided by Dr. Satyanarayana
C., Dr. Srihari Raju K. and Mr. Ravindra G., Laurus Labs Pvt. Ltd.
throughout this work.
References
1. ICH Q3A (R) (2002) Impurities in new drug substances.
http://www.ICH.org/
2. ICH Q3B (R2) (2006) Impurities in new drug products.
http://www.ICH.org/
3. ICH Q3C (R5) (2011) Impurities: guidelines for residual solvents.
http://www.ICH.org/
4. European Medicines Agency, London (2006) Guideline on the
limits of genotoxic impurities. Committee for Medicinal Products
(CHMP) (CPMP/SWP/5199/02, EMEA/CHMP/QWP/251344/
2006)
5. US Department of Health and Human services, Food and Drug
Administration, Centre for Drug evaluation and Research
(CDER) (2008) Guidance for industry. Genotoxic and carcino-
genic impurities in drug substances and products: recommended
approaches
6. EMEA Q&A, EMEA/CHMP/SWP/431994/2007. http://www.emea.
europa.eu/pdfs/human/swp/43199407en.pdf
7. Muller L, Mauthe RJ, Riley CM, Andino MM, de Antonis D,
Beels C, DeGeorge J, De Knaep AGM, Ellison D, Fagerland JA,
Frank R, Fritschel B, Galloway S, Harpur E, Humfrey CDN,
Jacks AS, Jagota N, Mackinnon J, Mohan G, Ness DK,
O’Donovan MR, Smith MD, Vudathala G, Yotti L (2006) Reg
Toxicol Pharm 44:198–211
8. Carlin J, Gregory N, Simmons J (1998) J Pharm Biomed Anal
17:885–890
9. Lovering EG, Matsui F, Curran NM, Robertson DL, Sears RW
(1983) J Pharm Sci 72:965–967
M. Khan et al.
123
Author's personal copy
10. Lovering EG, Matsui F, Robertson DL, Curran NM (1985) J
Pharm Sci 74:105–107
11. Hydrazine (1999) IARC monographs on the evaluation of car-
cinogenic risks to humans 71: p 991
12. Knottnerus JA (2002) N-Methylhydrazine, evaluation of the
carcinogenicity and genotoxicity, Dutch Expert Committee on
Occupational Standards. A Committee of the Health Council of
the Netherlands, Nr 2002/07OSH, The Hague
13. Elder DP, Snodin D, Teasdale A (2011) J Pharm Biomed Anal
54:900–910
14. Kean T, Miller JH, Skellern GG, Snodin D (2006) Pharmeur Sci
Notes 2:23–33
15. Sun M, Bai L, Lui DQ (2008) J Pharm Biomed Anal 49:529–533
16. Hmelnickis J, Pugovics O, Kazoka H, Viskna A, Susinskis I,
Kokums K (2008) J Pharm Biomed Anal 48:649–656
17. Liu M, Ostovic J, Chen EX, Cauchon N (2009) J Chromatogr A
1216:2362–2370
18. Khan M, Jayasree K, Reddy KVSRK, Dubey PK (2012) J Pharm
Biomed Anal 58:27–33
19. Kumar A, Burns J, Hoffmann W, Demattio H, Malik AK, Mat-
ysik FM (2011) Electrophoresis 32:920–925
20. Guo L, Matysik FM, Glaser P, Engewald W (2005) Electropho-
resis 26(17):3341–3348
21. You T, Niu L, Gui JY, Dong S, Wang E (1999) J Pharm Biomed
Anal 19(1–2):231–237
22. Yeung ES, Kuhr WG (1991) Anal Chem 63:275A–282A
23. Macka M, Johns C, Doble P, Haddad PR, Altria K.D (2001)
LCGC 19 (1) www.chromatographyonline.com
24. Foret F, Krivankova L, Bocek P (1993) Capillary zone electro-
phoresis. VCH Publishers, New York, pp 27–35
25. Xu X, Kok WT, Poppe H (1997) J Chromatogr A 786:333–345
Simultaneous Trace Level Determination
123
Author's personal copy