Embed Size (px)
Citation preview
This article appeared in a journal published by Elsevier. The attachedcopy is furnished to the author for internal non-commercial researchand education use, including for instruction at the authors institution
and sharing with colleagues.
Other uses, including reproduction and distribution, or selling orlicensing copies, or posting to personal, institutional or third party
websites are prohibited.
In most cases authors are permitted to post their version of thearticle (e.g. in Word or Tex form) to their personal website orinstitutional repository. Authors requiring further information
regarding Elsevier’s archiving and manuscript policies areencouraged to visit:
http://www.elsevier.com/authorsrights
Author's personal copy
An efficient algorithm for smoothing airspace congestion byfine-tuning take-off times
Jenaro Nosedal a,⇑, Miquel A. Piera a, Sergio Ruiz a, Alvaro Nosedal b
a Technical Innovation Cluster on Aeronautical Management, Universitat Autonoma de Barcelona, Sabadell, Barcelona, Spainb Statistics Department, University of New Mexico, USA
a r t i c l e i n f o
Article history:Received 23 December 2013Received in revised form 28 March 2014Accepted 28 March 2014
Keywords:Air traffic managementTrajectory-based operationsDecision support toolsConstraint programming
a b s t r a c t
Current technological advances in communications and navigation have improved air traf-fic management (ATM) with new decision support tools to balance airspace capacity withuser demands. Despite agreements achieved in flying reference business trajectories (RBTs)among different stakeholders, tight spatio-temporal connectivity between trajectories indense sectors can cause perturbations that might introduce time or space deviations intothe original RBTs, thus potentially affecting other 4D trajectories. In this paper, severalchallenging results are presented by properly tuning the Calculated Take-Off Times(CTOTs) as a tool for mitigating the propagation of perturbations between trajectories thatcan readily appear in dense sectors. Based on the identification of ‘‘collective microre-gions’’, a tool for predicting potential spatio-temporal concurrence events between trajec-tories over the European airspace was developed, together with a CTOT algorithm tosequence the departures that preserve the scheduled slots while relaxing tight trajectoryinteractions. The algorithm was tested by considering a realistic scenario (designed andanalyzed in the STREAM project (Stream, 2013)) to evaluate relevant ATM KPIs that provideaggregated information about the sensitivity of the system to trajectory interactions,taking into account the system dynamics at a network level. The proposed approachcontributes to enhancing the ATM capacity of airports to mitigate network perturbations.
� 2014 Elsevier Ltd. All rights reserved.
1. Introduction
The level of saturation at different periods in some air traffic sectors in the European airspace, together with the predictedgrowth in air traffic demand, requires a new design for decision support systems (DSSs) to improve certain procedures of airtraffic management (ATM).
One of the most important challenges of the SESAR (Sesar program, 2013) and Next Gen (Next Gen program, 2013)programs regarding current ATM is the introduction of trajectory-based operations (TBO), which involve the use of 4D tra-jectories (defined by consecutive waypoints in three spatial dimensions and their corresponding time-stamps), also knownas business trajectories (BTs) according to SESAR’s terminology for civil flights. It is expected that the use of 4D trajectoriesand the underlying new ATM procedures will improve the synchronization and predictability of the air transportationsystem (Korn et al., 2006).
http://dx.doi.org/10.1016/j.trc.2014.03.0170968-090X/� 2014 Elsevier Ltd. All rights reserved.
⇑ Corresponding author. Tel.: +34 935817754.E-mail addresses: [email protected] (J. Nosedal), [email protected] (M.A. Piera), [email protected] (S. Ruiz), [email protected]
(A. Nosedal).
Transportation Research Part C 44 (2014) 171–184
Contents lists available at ScienceDirect
Transportation Research Part C
journal homepage: www.elsevier .com/locate / t rc
Author's personal copy
Currently, if an imbalance is predicted on the day of operations between the traffic demand and the available airspacecapacity, the ATM authority (i.e., the ATFCM) issues a regulation to maximize the rate of flights entering the ATM sectorsat a given time. When the regulation delays flight departures (Castelli et al., 2011), the delays are often known as green delays(Piera et al., 2014).
As alternatives to the ATM regulations, air traffic controllers (ATCOs) frequently issue maneuvers at a tactical level con-sisting of holding stacks, headings or speed variations (ATFCM Services, 2013); unfortunately, such maneuvers are often notconsidered desirable measures by AUs due to high operational and fuel consumption costs (i.e., airborne delays, whenincurred, dominate ground delay costs (Ferguson et al., 2013). Green delays are therefore deemed more acceptable alterna-tives (Carlier et al., 2007).
The purpose of this ground-holding scheme is to respect the en route capacity constraints provided by each ATC center(ATCC) as the number of aircraft that can coexist in the same sector within a given time frame, based on their daily schedule.The number of aircraft in a sector is the air traffic characteristic that has been most cited, studied and evaluated in terms ofits influence on workload (Prandini et al., 2011). However, a limitation of this regulation model is that the definition of thesector’s capacity (the hourly rate of aircraft entering a sector) is poorly related to traffic complexity (Barnier et al., 2001). Tocapture ATC complexity more accurately, it is necessary to consider the flight characteristics of each individual aircraft andinteractions between aircraft pairs. (Djokic et al., 2010)
Air traffic complexity can be measured by the control activity required to accept an additional aircraft entering a sector(Lee et al., 2007) (i.e., local complexity). From a network perspective, global complexity is related to the interactions betweentrajectories (i.e., all en route potential conflicts).
Due to the high degree of connectivity in air traffic networks (Lu and Shi, 2007), it is expected that only if global trafficcomplexity is considered can all potential interactions be identified.
Domino effects (Ruiz et al., 2014), together with a lack of complete understanding and a suitable formalism for modelingthese interactions, are key elements that often lead to the introduction of negative network effects (i.e., ground holdingbased solely on local complexity information) and the impossibility of taking advantage of positive network effects (i.e.,ground holding to improve the network’s robustness).Thus, even small delays can easily propagate through trajectories(Pyrgiotis et al., 2013), leading to regulations that could be avoided (e.g., the application of unnecessary delays and/or air-borne holding procedures) and the underuse of sectors (European Commission, 2013).
In this paper, by identifying ‘‘collective microregions’’ (square cells of six NM used by two or more flights at the sameFlight Level (FL), independent of occupancy time window) and the analysis of occupancy time windows (i.e., temporal-lon-gitudinal looseness (Ruiz et al., 2012), the volume of potential concurrence events that could require controller interventionis determined. Furthermore, an algorithm that can mitigate the effect of potential spatio-temporal concurrence events (i.e.,congestion) between any two interacting trajectories is proposed. This algorithm preserves all pre-assigned slots by comput-ing and applying ‘‘fine-tuning’’ (i.e., time offsets of [0,15] minutes) on the Calculated Take-Off Times (CTOTs).
The proposed algorithm allows for the analysis of the interactions among en route trajectories (i.e., loss of due safety dis-tance between the geometric description of flight paths) to calculate ‘‘clearance’’ and ‘‘overlapping’’ time windows along thecomplete flight paths, thus predicting potential ‘‘concurrence events’’ (i.e., conflicts) and/or the longitudinal looseness foreach trajectory (assuming TBO). With this approach, the proposed algorithm seeks to help ATM incorporate new strategiesbased on complete interaction-causal analysis to improve decision-making processes.
The paper is organized as follows. Section 2 provides a literature review. Section 3 describes the algorithm. Experimentalresults for a realistic scenario are reported in Section 4, and conclusions and opportunities for further work are discussed inSection 5.
2. Literature review
Traffic assignment techniques have been developed to reduce congestion in transportation networks by distributingtraffic demand across time and space (Delahaye et al., 2005). Because congestion indicates that aircraft are occupying thesame space at the same time, it can be reduced by shifting flight trajectories in time (slot re-allocation) or in space (routere-allocation). The following approaches have been developed to solve this general route-time allocation problem: space–time network (Zenios, 1991); variational inequality (Nagurney, 1998); optimal control (Janson et al., 1993); simulation(Cascetta, 1987); integer and dynamic programming (ground-holding problem) (Glover and et al., 2013; Maugis, 1996);and more recently, the collaborative en route resource allocation model (Combined Trajectory Options Program) (Kimet al., 2013) and airspace planning and design based on conflict risk assessment (Netjasov et al., 2013) have beeninvestigated.
Slot allocation problems focused on controllers’ workload using constraint programming (CP) technology are discussed inBarnier et al. (2001). Multi-sector complexity planning resolution using CP technology is presented in Flener et al. (2007). InPeeta and Ziliaskopoulos (2001), some of the most relevant dynamic traffic assignment (DTA) methods are analyzed, andpath processing modeling approaches are addressed as the core of future DTA development. In Delahaye et al. (2005), theapplication of multi-objective stochastic methods (i.e., genetic algorithms) on real traffic data, not by using the flow networkconcept but by simulating the flight of each aircraft, for one day over the French airspace is presented. In Margellos (2012),Monte Carlo simulations and reachability analysis are applied to assess the 4D trajectory concept. Theoretical and
172 J. Nosedal et al. / Transportation Research Part C 44 (2014) 171–184
Author's personal copy
experimental results for a new air traffic system, based on the moving point paradigm, are reported in Prot et al. (2014),where air traffic is completely organized by a 4D-sequencing (i.e., an allocation of flights to multi-directional lattices isproposed).
The abovementioned approaches partially solve the bi-allocation problem and propose solutions for slot allocation only,route allocation only or both for extremely minor instances of the problem. They also fail to offer a global scope of air trafficcomplexity because they do not consider the full European ATM network.
Some airspace analyses and partitioning (or repartitioning) methods based on superimposing traffic flows over a fine gridhave been used by several researchers. Dynamic airspace configuration (DAC) is a new operational paradigm that proposesmigrating from the current structured, static airspace to a dynamic airspace (Kopardekar et al., 2007). In DAC research,dynamic airspace sectorization (DAS) represents an initial approach to restructuring airspace to achieve capacity-demandbalance, while managing air traffic controllers’ workload and ensuring an orderly flow of traffic (Tang et al., 2012).
The sectorization problem, considered an NP-hard problem, has been studied most recently as a global optimization prob-lem using integer programming (Basu et al., 2009). Other proposed approaches to the sectorization problem include the useof genetic algorithms (Delahaye et al., 1994) and graph partitioning (Trandac et al., 2005). A survey of the algorithmic aspectsof airspace sectorization tools developed up to 2012 is provided in Flener (2012). In Alam et al. (2008), the Australian air-space is modeled as a hyper-rectangular discrete space (i.e., cells of 10 NM).
All of the cited works focus mainly on the sectorization problem at a macroscopic level, addressing only one country’sairspace or, in the most general cases, a single ATCC area, and therefore, they do not consider a microscopic representationof traffic at the network level, which would be aligned with 4DT concepts and TBO procedures.
The proposed algorithm facilitates a microanalysis along the entire en route path, can consider the entire European air-space and reduces the combinatorial explosion problem during the detection of ‘‘collective microregions’’ (pair-wise com-parison) by spatial data structure (SDS) analysis. The post-processing of a state space stored in the SDS to performsensitivity analysis of temporal/longitudinal looseness is described in Ruiz et al. (2012). The application of a spatial datastructure for the efficient analysis of interactions in large scenarios is described in Ruiz et al. (2013, 2014), and in Ruizet al. (2013), a CD&R platform-based SDS for a simplified 4D nominal model is proposed.
3. Algorithm description
To detect the different ‘‘collective microregions’’ throughout the entire European airspace, each en route trajectory is ini-tially projected onto a discrete grid (100,000 square macrocells of 12 NM) spanning longitudes of �20 to 30 degrees and lat-itudes of 0 to 80 degrees.
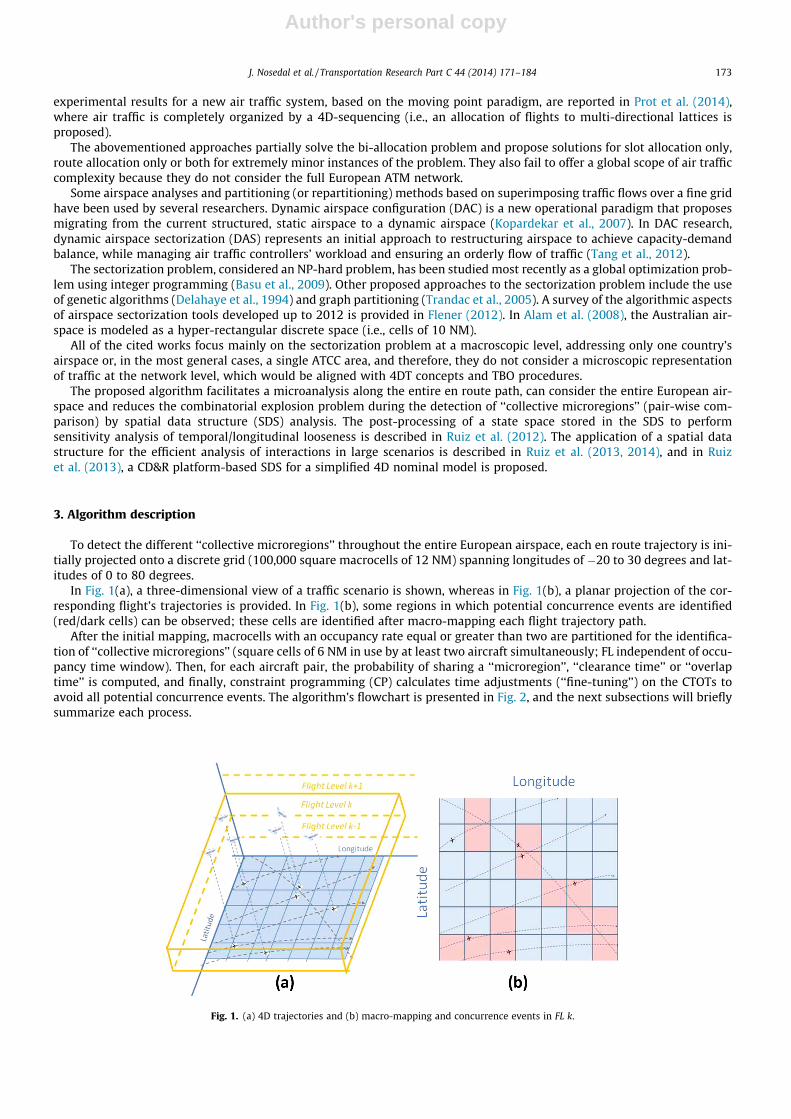
In Fig. 1(a), a three-dimensional view of a traffic scenario is shown, whereas in Fig. 1(b), a planar projection of the cor-responding flight’s trajectories is provided. In Fig. 1(b), some regions in which potential concurrence events are identified(red/dark cells) can be observed; these cells are identified after macro-mapping each flight trajectory path.
After the initial mapping, macrocells with an occupancy rate equal or greater than two are partitioned for the identifica-tion of ‘‘collective microregions’’ (square cells of 6 NM in use by at least two aircraft simultaneously; FL independent of occu-pancy time window). Then, for each aircraft pair, the probability of sharing a ‘‘microregion’’, ‘‘clearance time’’ or ‘‘overlaptime’’ is computed, and finally, constraint programming (CP) calculates time adjustments (‘‘fine-tuning’’) on the CTOTs toavoid all potential concurrence events. The algorithm’s flowchart is presented in Fig. 2, and the next subsections will brieflysummarize each process.
Fig. 1. (a) 4D trajectories and (b) macro-mapping and concurrence events in FL k.
J. Nosedal et al. / Transportation Research Part C 44 (2014) 171–184 173
Author's personal copy
3.1. Macro-mapping process
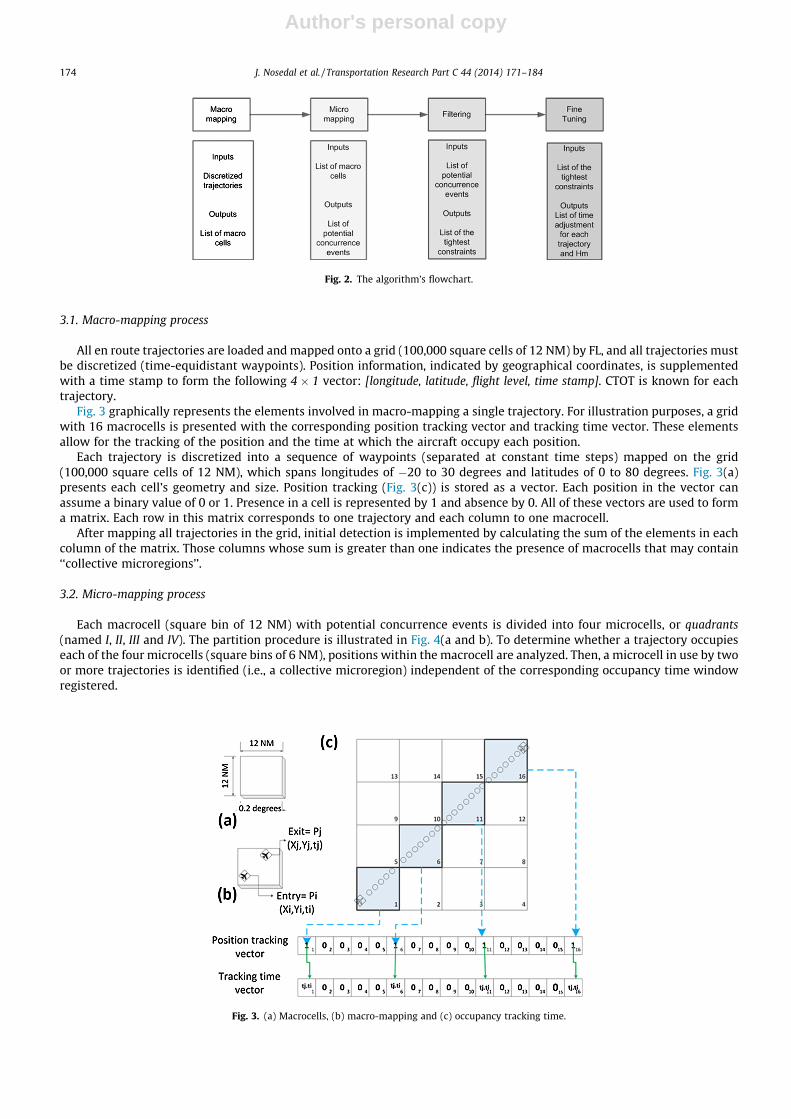
All en route trajectories are loaded and mapped onto a grid (100,000 square cells of 12 NM) by FL, and all trajectories mustbe discretized (time-equidistant waypoints). Position information, indicated by geographical coordinates, is supplementedwith a time stamp to form the following 4 � 1 vector: [longitude, latitude, flight level, time stamp]. CTOT is known for eachtrajectory.
Fig. 3 graphically represents the elements involved in macro-mapping a single trajectory. For illustration purposes, a gridwith 16 macrocells is presented with the corresponding position tracking vector and tracking time vector. These elementsallow for the tracking of the position and the time at which the aircraft occupy each position.
Each trajectory is discretized into a sequence of waypoints (separated at constant time steps) mapped on the grid(100,000 square cells of 12 NM), which spans longitudes of �20 to 30 degrees and latitudes of 0 to 80 degrees. Fig. 3(a)presents each cell’s geometry and size. Position tracking (Fig. 3(c)) is stored as a vector. Each position in the vector canassume a binary value of 0 or 1. Presence in a cell is represented by 1 and absence by 0. All of these vectors are used to forma matrix. Each row in this matrix corresponds to one trajectory and each column to one macrocell.
After mapping all trajectories in the grid, initial detection is implemented by calculating the sum of the elements in eachcolumn of the matrix. Those columns whose sum is greater than one indicates the presence of macrocells that may contain‘‘collective microregions’’.
3.2. Micro-mapping process
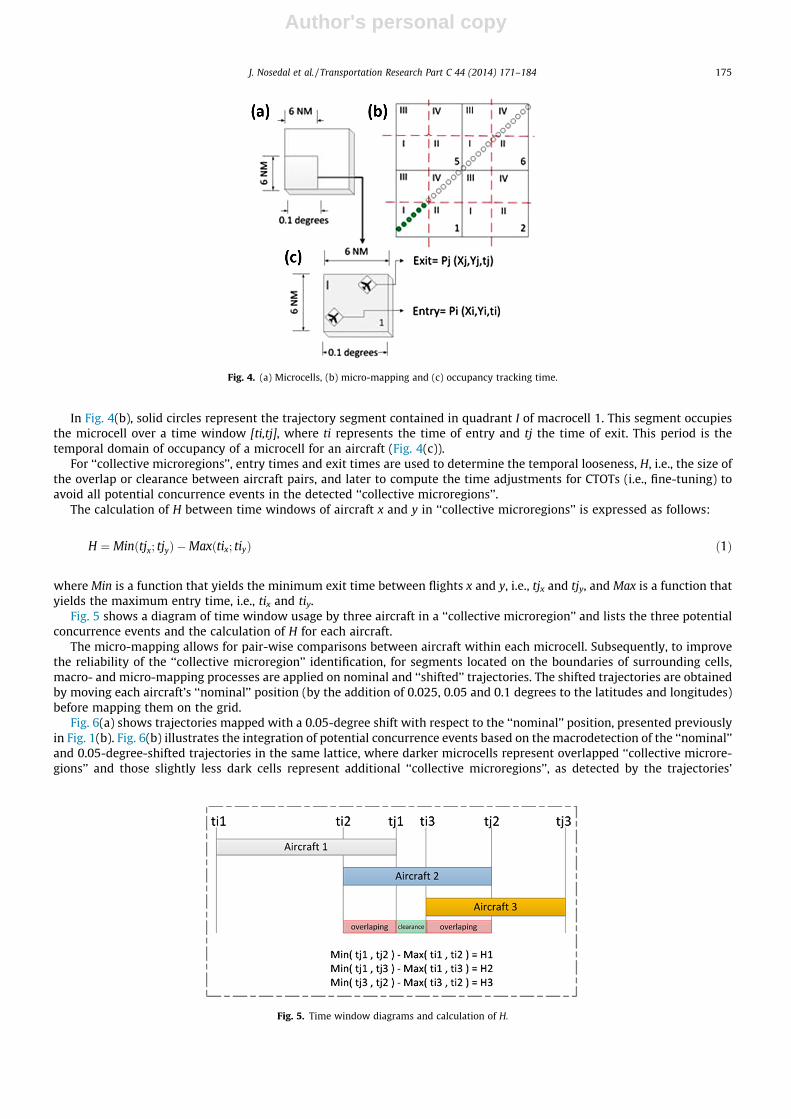
Each macrocell (square bin of 12 NM) with potential concurrence events is divided into four microcells, or quadrants(named I, II, III and IV). The partition procedure is illustrated in Fig. 4(a and b). To determine whether a trajectory occupieseach of the four microcells (square bins of 6 NM), positions within the macrocell are analyzed. Then, a microcell in use by twoor more trajectories is identified (i.e., a collective microregion) independent of the corresponding occupancy time windowregistered.
Fig. 3. (a) Macrocells, (b) macro-mapping and (c) occupancy tracking time.
Fig. 2. The algorithm’s flowchart.
174 J. Nosedal et al. / Transportation Research Part C 44 (2014) 171–184
Author's personal copy
In Fig. 4(b), solid circles represent the trajectory segment contained in quadrant I of macrocell 1. This segment occupiesthe microcell over a time window [ti,tj], where ti represents the time of entry and tj the time of exit. This period is thetemporal domain of occupancy of a microcell for an aircraft (Fig. 4(c)).
For ‘‘collective microregions’’, entry times and exit times are used to determine the temporal looseness, H, i.e., the size ofthe overlap or clearance between aircraft pairs, and later to compute the time adjustments for CTOTs (i.e., fine-tuning) toavoid all potential concurrence events in the detected ‘‘collective microregions’’.
The calculation of H between time windows of aircraft x and y in ‘‘collective microregions’’ is expressed as follows:
H ¼ Minðtjx; tjyÞ �Maxðtix; tiyÞ ð1Þ
where Min is a function that yields the minimum exit time between flights x and y, i.e., tjx and tjy, and Max is a function thatyields the maximum entry time, i.e., tix and tiy.
Fig. 5 shows a diagram of time window usage by three aircraft in a ‘‘collective microregion’’ and lists the three potentialconcurrence events and the calculation of H for each aircraft.
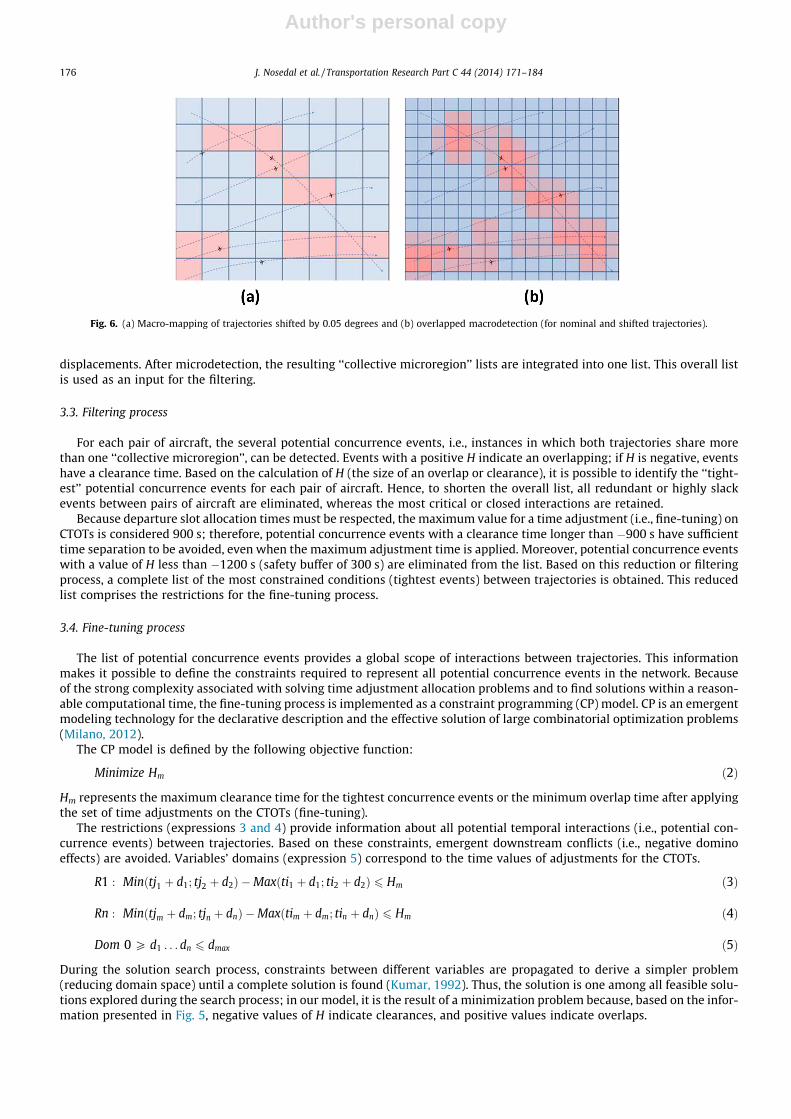
The micro-mapping allows for pair-wise comparisons between aircraft within each microcell. Subsequently, to improvethe reliability of the ‘‘collective microregion’’ identification, for segments located on the boundaries of surrounding cells,macro- and micro-mapping processes are applied on nominal and ‘‘shifted’’ trajectories. The shifted trajectories are obtainedby moving each aircraft’s ‘‘nominal’’ position (by the addition of 0.025, 0.05 and 0.1 degrees to the latitudes and longitudes)before mapping them on the grid.
Fig. 6(a) shows trajectories mapped with a 0.05-degree shift with respect to the ‘‘nominal’’ position, presented previouslyin Fig. 1(b). Fig. 6(b) illustrates the integration of potential concurrence events based on the macrodetection of the ‘‘nominal’’and 0.05-degree-shifted trajectories in the same lattice, where darker microcells represent overlapped ‘‘collective microre-gions’’ and those slightly less dark cells represent additional ‘‘collective microregions’’, as detected by the trajectories’
Fig. 4. (a) Microcells, (b) micro-mapping and (c) occupancy tracking time.
Fig. 5. Time window diagrams and calculation of H.
J. Nosedal et al. / Transportation Research Part C 44 (2014) 171–184 175
Author's personal copy
displacements. After microdetection, the resulting ‘‘collective microregion’’ lists are integrated into one list. This overall listis used as an input for the filtering.
3.3. Filtering process
For each pair of aircraft, the several potential concurrence events, i.e., instances in which both trajectories share morethan one ‘‘collective microregion’’, can be detected. Events with a positive H indicate an overlapping; if H is negative, eventshave a clearance time. Based on the calculation of H (the size of an overlap or clearance), it is possible to identify the ‘‘tight-est’’ potential concurrence events for each pair of aircraft. Hence, to shorten the overall list, all redundant or highly slackevents between pairs of aircraft are eliminated, whereas the most critical or closed interactions are retained.
Because departure slot allocation times must be respected, the maximum value for a time adjustment (i.e., fine-tuning) onCTOTs is considered 900 s; therefore, potential concurrence events with a clearance time longer than �900 s have sufficienttime separation to be avoided, even when the maximum adjustment time is applied. Moreover, potential concurrence eventswith a value of H less than �1200 s (safety buffer of 300 s) are eliminated from the list. Based on this reduction or filteringprocess, a complete list of the most constrained conditions (tightest events) between trajectories is obtained. This reducedlist comprises the restrictions for the fine-tuning process.
3.4. Fine-tuning process
The list of potential concurrence events provides a global scope of interactions between trajectories. This informationmakes it possible to define the constraints required to represent all potential concurrence events in the network. Becauseof the strong complexity associated with solving time adjustment allocation problems and to find solutions within a reason-able computational time, the fine-tuning process is implemented as a constraint programming (CP) model. CP is an emergentmodeling technology for the declarative description and the effective solution of large combinatorial optimization problems(Milano, 2012).
The CP model is defined by the following objective function:
Minimize Hm ð2Þ
Hm represents the maximum clearance time for the tightest concurrence events or the minimum overlap time after applyingthe set of time adjustments on the CTOTs (fine-tuning).
The restrictions (expressions 3 and 4) provide information about all potential temporal interactions (i.e., potential con-currence events) between trajectories. Based on these constraints, emergent downstream conflicts (i.e., negative dominoeffects) are avoided. Variables’ domains (expression 5) correspond to the time values of adjustments for the CTOTs.
R1 : Minðtj1 þ d1; tj2 þ d2Þ �Maxðti1 þ d1; ti2 þ d2Þ 6 Hm ð3Þ
Rn : Minðtjm þ dm; tjn þ dnÞ �Maxðtim þ dm; tin þ dnÞ 6 Hm ð4Þ
Dom 0 P d1 . . . dn 6 dmax ð5Þ
During the solution search process, constraints between different variables are propagated to derive a simpler problem(reducing domain space) until a complete solution is found (Kumar, 1992). Thus, the solution is one among all feasible solu-tions explored during the search process; in our model, it is the result of a minimization problem because, based on the infor-mation presented in Fig. 5, negative values of H indicate clearances, and positive values indicate overlaps.
Fig. 6. (a) Macro-mapping of trajectories shifted by 0.05 degrees and (b) overlapped macrodetection (for nominal and shifted trajectories).
176 J. Nosedal et al. / Transportation Research Part C 44 (2014) 171–184
Author's personal copy
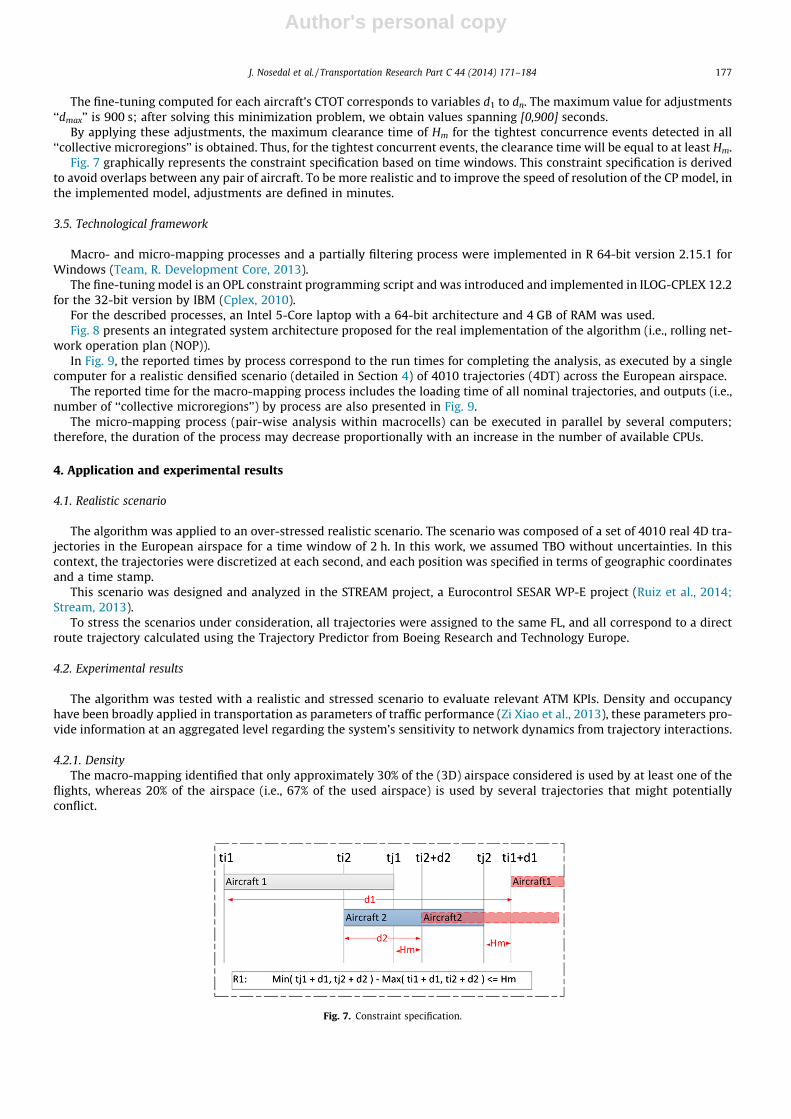
The fine-tuning computed for each aircraft’s CTOT corresponds to variables d1 to dn. The maximum value for adjustments‘‘dmax’’ is 900 s; after solving this minimization problem, we obtain values spanning [0,900] seconds.
By applying these adjustments, the maximum clearance time of Hm for the tightest concurrence events detected in all‘‘collective microregions’’ is obtained. Thus, for the tightest concurrent events, the clearance time will be equal to at least Hm.
Fig. 7 graphically represents the constraint specification based on time windows. This constraint specification is derivedto avoid overlaps between any pair of aircraft. To be more realistic and to improve the speed of resolution of the CP model, inthe implemented model, adjustments are defined in minutes.
3.5. Technological framework
Macro- and micro-mapping processes and a partially filtering process were implemented in R 64-bit version 2.15.1 forWindows (Team, R. Development Core, 2013).
The fine-tuning model is an OPL constraint programming script and was introduced and implemented in ILOG-CPLEX 12.2for the 32-bit version by IBM (Cplex, 2010).
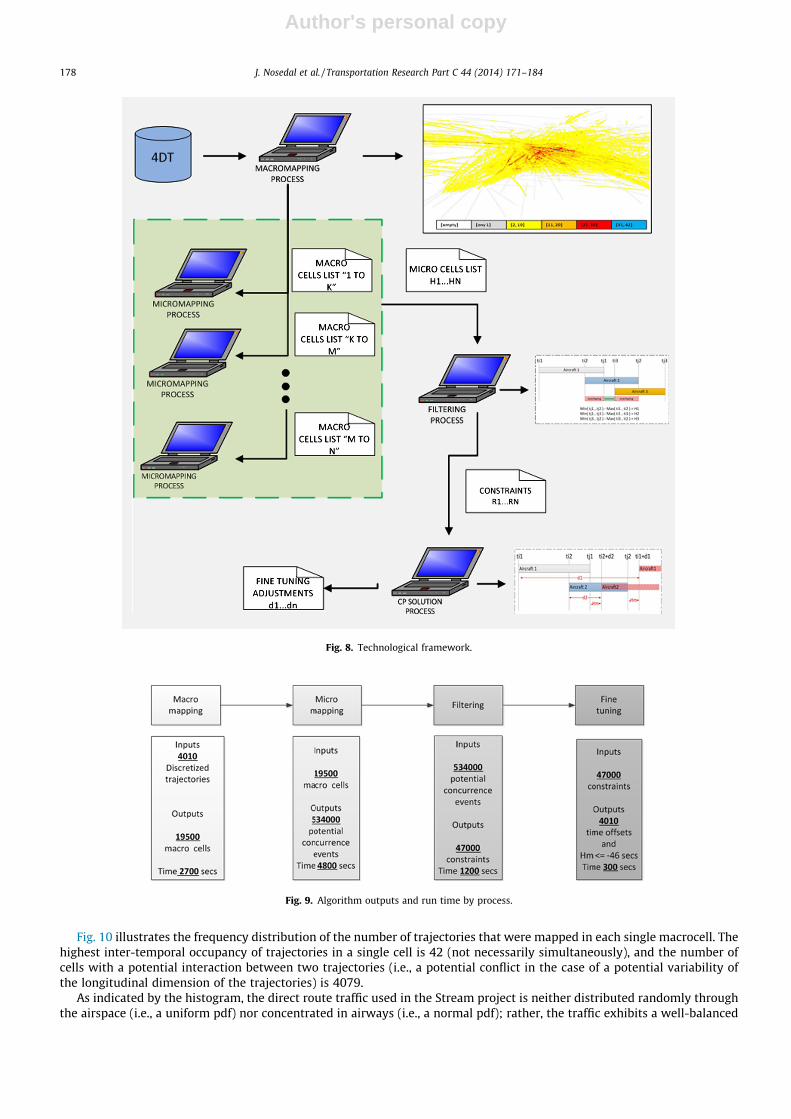
For the described processes, an Intel 5-Core laptop with a 64-bit architecture and 4 GB of RAM was used.Fig. 8 presents an integrated system architecture proposed for the real implementation of the algorithm (i.e., rolling net-
work operation plan (NOP)).In Fig. 9, the reported times by process correspond to the run times for completing the analysis, as executed by a single
computer for a realistic densified scenario (detailed in Section 4) of 4010 trajectories (4DT) across the European airspace.The reported time for the macro-mapping process includes the loading time of all nominal trajectories, and outputs (i.e.,
number of ‘‘collective microregions’’) by process are also presented in Fig. 9.The micro-mapping process (pair-wise analysis within macrocells) can be executed in parallel by several computers;
therefore, the duration of the process may decrease proportionally with an increase in the number of available CPUs.
4. Application and experimental results
4.1. Realistic scenario
The algorithm was applied to an over-stressed realistic scenario. The scenario was composed of a set of 4010 real 4D tra-jectories in the European airspace for a time window of 2 h. In this work, we assumed TBO without uncertainties. In thiscontext, the trajectories were discretized at each second, and each position was specified in terms of geographic coordinatesand a time stamp.
This scenario was designed and analyzed in the STREAM project, a Eurocontrol SESAR WP-E project (Ruiz et al., 2014;Stream, 2013).
To stress the scenarios under consideration, all trajectories were assigned to the same FL, and all correspond to a directroute trajectory calculated using the Trajectory Predictor from Boeing Research and Technology Europe.
4.2. Experimental results
The algorithm was tested with a realistic and stressed scenario to evaluate relevant ATM KPIs. Density and occupancyhave been broadly applied in transportation as parameters of traffic performance (Zi Xiao et al., 2013), these parameters pro-vide information at an aggregated level regarding the system’s sensitivity to network dynamics from trajectory interactions.
4.2.1. DensityThe macro-mapping identified that only approximately 30% of the (3D) airspace considered is used by at least one of the
flights, whereas 20% of the airspace (i.e., 67% of the used airspace) is used by several trajectories that might potentiallyconflict.
Fig. 7. Constraint specification.
J. Nosedal et al. / Transportation Research Part C 44 (2014) 171–184 177
Author's personal copy
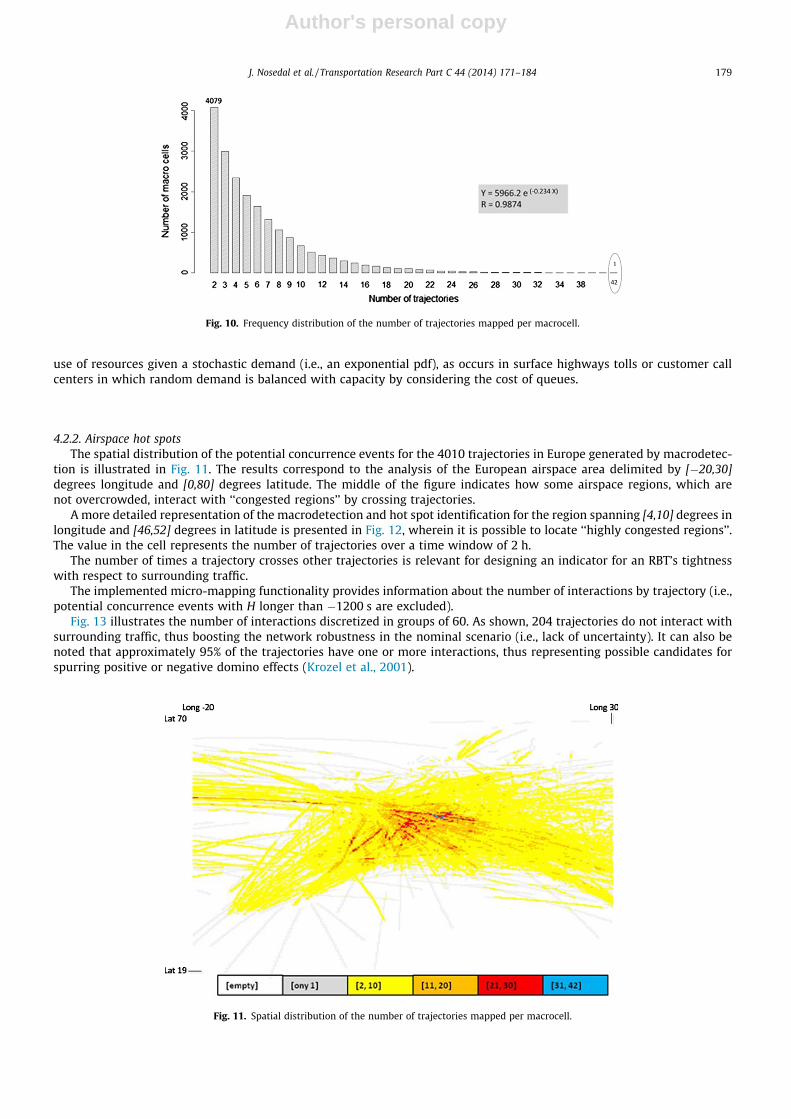
Fig. 10 illustrates the frequency distribution of the number of trajectories that were mapped in each single macrocell. Thehighest inter-temporal occupancy of trajectories in a single cell is 42 (not necessarily simultaneously), and the number ofcells with a potential interaction between two trajectories (i.e., a potential conflict in the case of a potential variability ofthe longitudinal dimension of the trajectories) is 4079.
As indicated by the histogram, the direct route traffic used in the Stream project is neither distributed randomly throughthe airspace (i.e., a uniform pdf) nor concentrated in airways (i.e., a normal pdf); rather, the traffic exhibits a well-balanced
Fig. 8. Technological framework.
Fig. 9. Algorithm outputs and run time by process.
178 J. Nosedal et al. / Transportation Research Part C 44 (2014) 171–184
Author's personal copy
use of resources given a stochastic demand (i.e., an exponential pdf), as occurs in surface highways tolls or customer callcenters in which random demand is balanced with capacity by considering the cost of queues.
4.2.2. Airspace hot spotsThe spatial distribution of the potential concurrence events for the 4010 trajectories in Europe generated by macrodetec-
tion is illustrated in Fig. 11. The results correspond to the analysis of the European airspace area delimited by [�20,30]degrees longitude and [0,80] degrees latitude. The middle of the figure indicates how some airspace regions, which arenot overcrowded, interact with ‘‘congested regions’’ by crossing trajectories.
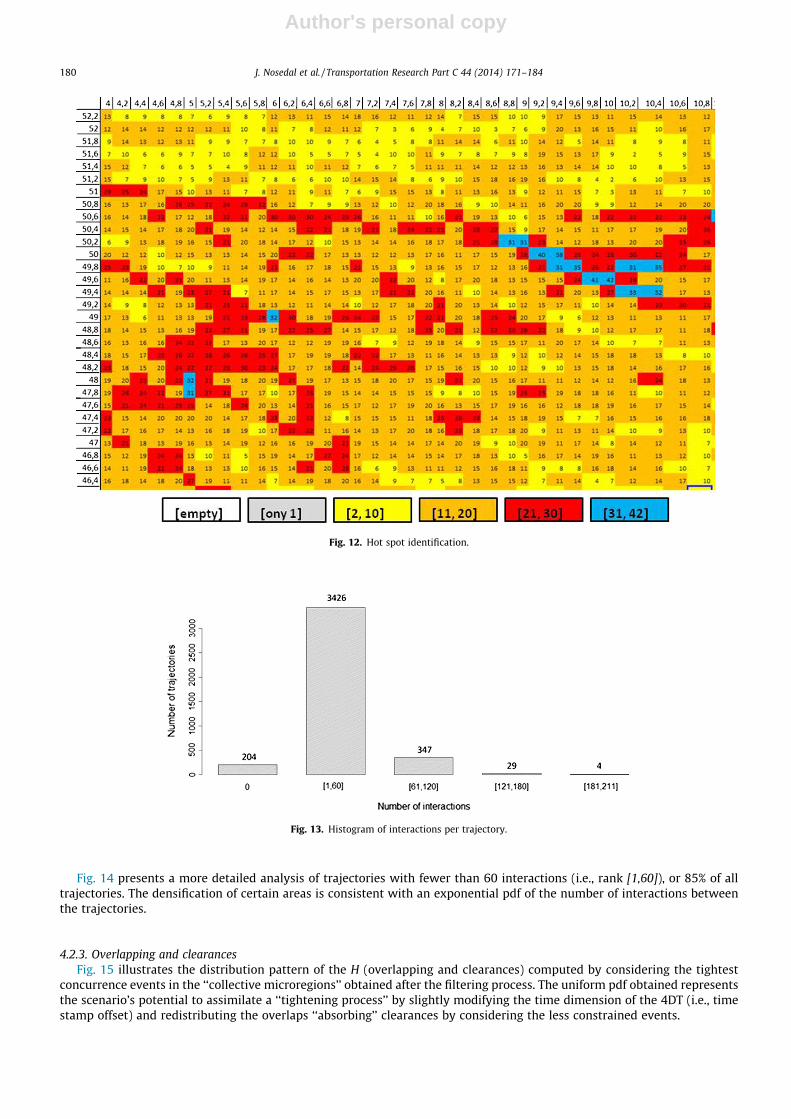
A more detailed representation of the macrodetection and hot spot identification for the region spanning [4,10] degrees inlongitude and [46,52] degrees in latitude is presented in Fig. 12, wherein it is possible to locate ‘‘highly congested regions’’.The value in the cell represents the number of trajectories over a time window of 2 h.
The number of times a trajectory crosses other trajectories is relevant for designing an indicator for an RBT’s tightnesswith respect to surrounding traffic.
The implemented micro-mapping functionality provides information about the number of interactions by trajectory (i.e.,potential concurrence events with H longer than �1200 s are excluded).
Fig. 13 illustrates the number of interactions discretized in groups of 60. As shown, 204 trajectories do not interact withsurrounding traffic, thus boosting the network robustness in the nominal scenario (i.e., lack of uncertainty). It can also benoted that approximately 95% of the trajectories have one or more interactions, thus representing possible candidates forspurring positive or negative domino effects (Krozel et al., 2001).
Fig. 10. Frequency distribution of the number of trajectories mapped per macrocell.
Fig. 11. Spatial distribution of the number of trajectories mapped per macrocell.
J. Nosedal et al. / Transportation Research Part C 44 (2014) 171–184 179
Author's personal copy
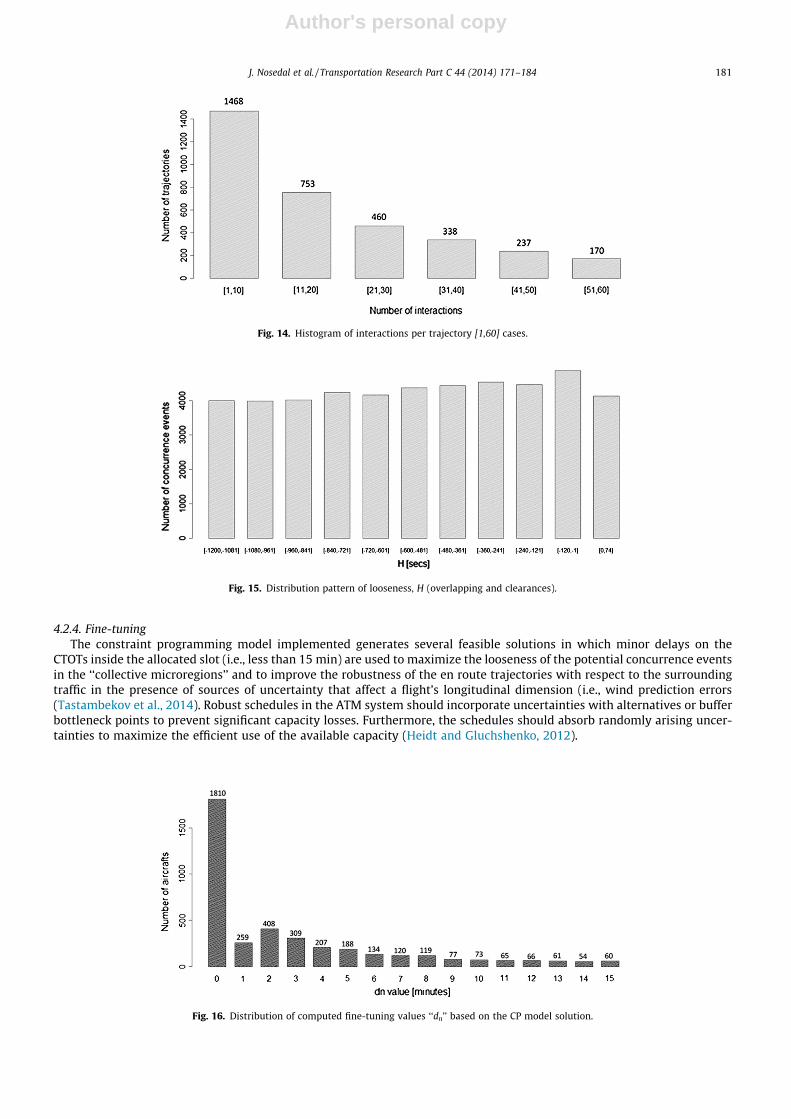
Fig. 14 presents a more detailed analysis of trajectories with fewer than 60 interactions (i.e., rank [1,60]), or 85% of alltrajectories. The densification of certain areas is consistent with an exponential pdf of the number of interactions betweenthe trajectories.
4.2.3. Overlapping and clearancesFig. 15 illustrates the distribution pattern of the H (overlapping and clearances) computed by considering the tightest
concurrence events in the ‘‘collective microregions’’ obtained after the filtering process. The uniform pdf obtained representsthe scenario’s potential to assimilate a ‘‘tightening process’’ by slightly modifying the time dimension of the 4DT (i.e., timestamp offset) and redistributing the overlaps ‘‘absorbing’’ clearances by considering the less constrained events.
Fig. 12. Hot spot identification.
Fig. 13. Histogram of interactions per trajectory.
180 J. Nosedal et al. / Transportation Research Part C 44 (2014) 171–184
Author's personal copy
4.2.4. Fine-tuningThe constraint programming model implemented generates several feasible solutions in which minor delays on the
CTOTs inside the allocated slot (i.e., less than 15 min) are used to maximize the looseness of the potential concurrence eventsin the ‘‘collective microregions’’ and to improve the robustness of the en route trajectories with respect to the surroundingtraffic in the presence of sources of uncertainty that affect a flight’s longitudinal dimension (i.e., wind prediction errors(Tastambekov et al., 2014). Robust schedules in the ATM system should incorporate uncertainties with alternatives or bufferbottleneck points to prevent significant capacity losses. Furthermore, the schedules should absorb randomly arising uncer-tainties to maximize the efficient use of the available capacity (Heidt and Gluchshenko, 2012).
Fig. 14. Histogram of interactions per trajectory [1,60] cases.
Fig. 15. Distribution pattern of looseness, H (overlapping and clearances).
Fig. 16. Distribution of computed fine-tuning values ‘‘dn’’ based on the CP model solution.
J. Nosedal et al. / Transportation Research Part C 44 (2014) 171–184 181
Author's personal copy
Fig. 16 illustrates the CTOTs’ fine-tuning for a particular feasible solution in which 1810 trajectories (45%) can preservetheir RBT and less than 8% require a time offset greater than 9 min to preserve their slot time, while removing any (nominal)predicted interactions. For this particular solution, the minimum clearance obtained in the most constrained events was 46 s.
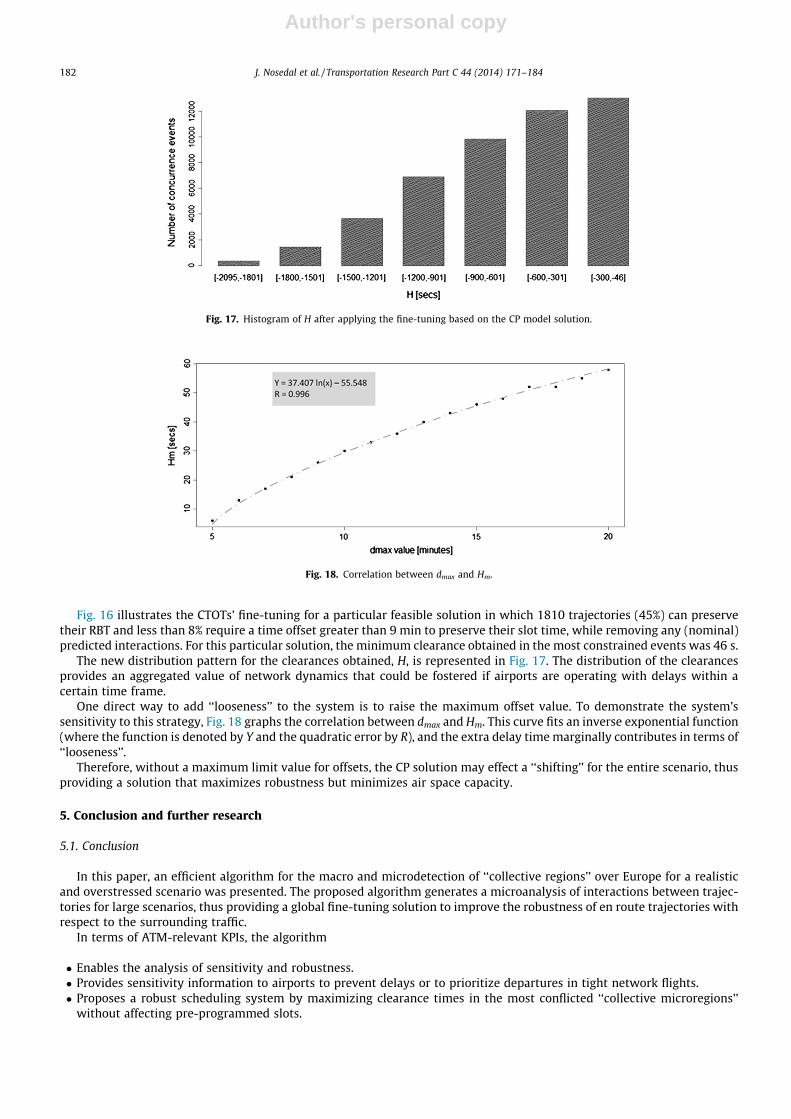
The new distribution pattern for the clearances obtained, H, is represented in Fig. 17. The distribution of the clearancesprovides an aggregated value of network dynamics that could be fostered if airports are operating with delays within acertain time frame.
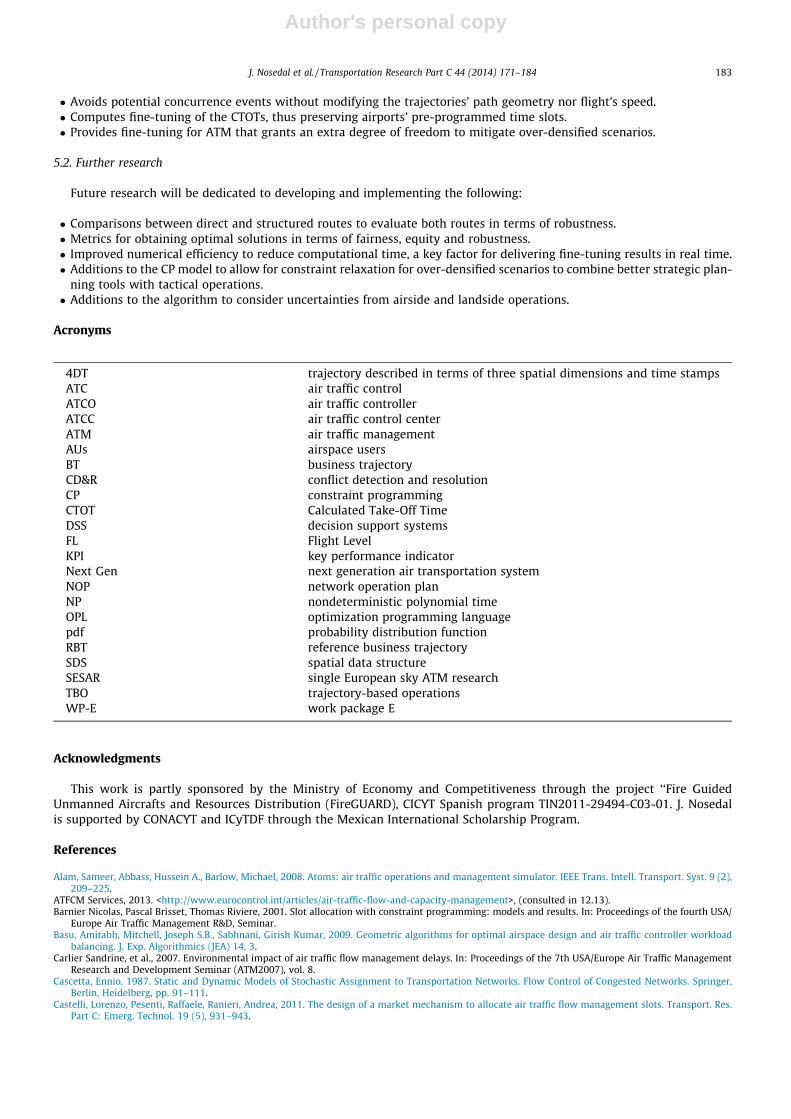
One direct way to add ‘‘looseness’’ to the system is to raise the maximum offset value. To demonstrate the system’ssensitivity to this strategy, Fig. 18 graphs the correlation between dmax and Hm. This curve fits an inverse exponential function(where the function is denoted by Y and the quadratic error by R), and the extra delay time marginally contributes in terms of‘‘looseness’’.
Therefore, without a maximum limit value for offsets, the CP solution may effect a ‘‘shifting’’ for the entire scenario, thusproviding a solution that maximizes robustness but minimizes air space capacity.
5. Conclusion and further research
5.1. Conclusion
In this paper, an efficient algorithm for the macro and microdetection of ‘‘collective regions’’ over Europe for a realisticand overstressed scenario was presented. The proposed algorithm generates a microanalysis of interactions between trajec-tories for large scenarios, thus providing a global fine-tuning solution to improve the robustness of en route trajectories withrespect to the surrounding traffic.
In terms of ATM-relevant KPIs, the algorithm
� Enables the analysis of sensitivity and robustness.� Provides sensitivity information to airports to prevent delays or to prioritize departures in tight network flights.� Proposes a robust scheduling system by maximizing clearance times in the most conflicted ‘‘collective microregions’’
without affecting pre-programmed slots.
Fig. 17. Histogram of H after applying the fine-tuning based on the CP model solution.
Fig. 18. Correlation between dmax and Hm.
182 J. Nosedal et al. / Transportation Research Part C 44 (2014) 171–184
Author's personal copy
� Avoids potential concurrence events without modifying the trajectories’ path geometry nor flight’s speed.� Computes fine-tuning of the CTOTs, thus preserving airports’ pre-programmed time slots.� Provides fine-tuning for ATM that grants an extra degree of freedom to mitigate over-densified scenarios.
5.2. Further research
Future research will be dedicated to developing and implementing the following:
� Comparisons between direct and structured routes to evaluate both routes in terms of robustness.� Metrics for obtaining optimal solutions in terms of fairness, equity and robustness.� Improved numerical efficiency to reduce computational time, a key factor for delivering fine-tuning results in real time.� Additions to the CP model to allow for constraint relaxation for over-densified scenarios to combine better strategic plan-
ning tools with tactical operations.� Additions to the algorithm to consider uncertainties from airside and landside operations.
Acronyms
4DT trajectory described in terms of three spatial dimensions and time stampsATC air traffic controlATCO air traffic controllerATCC air traffic control centerATM air traffic managementAUs airspace usersBT business trajectoryCD&R conflict detection and resolutionCP constraint programmingCTOT Calculated Take-Off TimeDSS decision support systemsFL Flight LevelKPI key performance indicatorNext Gen next generation air transportation systemNOP network operation planNP nondeterministic polynomial timeOPL optimization programming languagepdf probability distribution functionRBT reference business trajectorySDS spatial data structureSESAR single European sky ATM researchTBO trajectory-based operationsWP-E work package E
Acknowledgments
This work is partly sponsored by the Ministry of Economy and Competitiveness through the project ‘‘Fire GuidedUnmanned Aircrafts and Resources Distribution (FireGUARD), CICYT Spanish program TIN2011-29494-C03-01. J. Nosedalis supported by CONACYT and ICyTDF through the Mexican International Scholarship Program.
References
Alam, Sameer, Abbass, Hussein A., Barlow, Michael, 2008. Atoms: air traffic operations and management simulator. IEEE Trans. Intell. Transport. Syst. 9 (2),209–225.
ATFCM Services, 2013. <http://www.eurocontrol.int/articles/air-traffic-flow-and-capacity-management>, (consulted in 12.13).Barnier Nicolas, Pascal Brisset, Thomas Riviere, 2001. Slot allocation with constraint programming: models and results. In: Proceedings of the fourth USA/
Europe Air Traffic Management R&D, Seminar.Basu, Amitabh, Mitchell, Joseph S.B., Sabhnani, Girish Kumar, 2009. Geometric algorithms for optimal airspace design and air traffic controller workload
balancing. J. Exp. Algorithmics (JEA) 14, 3.Carlier Sandrine, et al., 2007. Environmental impact of air traffic flow management delays. In: Proceedings of the 7th USA/Europe Air Traffic Management
Research and Development Seminar (ATM2007), vol. 8.Cascetta, Ennio, 1987. Static and Dynamic Models of Stochastic Assignment to Transportation Networks. Flow Control of Congested Networks. Springer,
Berlin, Heidelberg, pp. 91–111.Castelli, Lorenzo, Pesenti, Raffaele, Ranieri, Andrea, 2011. The design of a market mechanism to allocate air traffic flow management slots. Transport. Res.
Part C: Emerg. Technol. 19 (5), 931–943.
J. Nosedal et al. / Transportation Research Part C 44 (2014) 171–184 183
Author's personal copy
Cplex, 2010. IBM ILOG. 12.2 User’s Manual.Delahaye Daniel, et al., 1994. Genetic algorithms for partitioning air space. In: Artificial Intelligence for Applications, Proceedings of the Tenth Conference on
IEEE.Delahaye Daniel, et al., 2005. Airspace congestion smoothing by multi-objective genetic algorithm. In: Proceedings of the 2005 ACM symposium on Applied
computing, ACM.Djokic, Jelena, Lorenz, Bernd, Fricke, Hartmut, 2010. Air traffic control complexity as workload driver. Transport Res. Part C: Emerg. Technol. 18 (6), 930–
936.European Commission Memo 13/666, 2013. European Commission invests €600 million in new research to unblock congestion in Europe’s airspace.Ferguson, J. et al, 2013. Estimating domestic US airline cost of delay based on European model. Transp. Res. Part C 33, 311–323.Flener Pierre, Justin Pearson, 2012. Automatic Airspace Sectorisation: A Survey.Flener, Pierre et al, 2007. Air-traffic complexity resolution in multi-sector planning. J. Air Transport Manage. 13, 323–328.Glover, C. et al, 2013. Stochastic optimization models for ground delay program planning with equity–efficiency tradeoffs. Transp. Res. Part C 33, 196–202.Heidt Andreas, Olga Gluchshenko, 2012. From uncertainty to robustness and system’s resilience in ATM: a case-study. In: Air Transport and Operations:
Proceedings of the Third International Air Transport and Operations Symposium. IOS Press.Bruce, Janson N., Robles, Juan, 1993. Dynamic traffic assignment with arrival time costs. Transport. Traffic Theory.Kim, A. et al, 2013. A framework for the assessment of collaborative en route resource allocation strategies. Transp. Res. Part C 33, 324–339.Kopardekar, P., Bilimoria, K., Sridhar, B., 2007. Initial concepts for dynamic airspace configuration. In: 7th AIAA Aviation Technology, Integration and
Operations Conference (ATIO), Belfast, Northern Ireland.Korn Bernd, et al., 2006. 4D Trajectory management in the extended TMA: coupling AMAN and 4D FMS for optimized approach trajectories. In: Proceedings
of the ICAS 2006 Conference, Hamburg, Germany.Krozel Jimmy, et al., 2001. System performance characteristics of centralized and decentralized air traffic separation strategies. In: Fourth USA/Europe Air
Traffic Management Research and Development Seminar.Kumar, Vipin., 1992. Algorithms for constraint-satisfaction problems: a survey. AI Mag. 13 (1), 32.Lee Keumjin, et al., 2007. Air traffic complexity: an input–output approach. In: Proceedings of the American Control Conference. USA.Lu, Huapu, Shi, Ye, 2007. Complexity of public transport networks. Tsinghua Sci. Technol. 12 (2), 204–213.Margellos Kostas, John Lygeros, 2012. Toward 4-D trajectory management in air traffic control: a study based on Monte Carlo simulation and reachability
analysis, pp. 1–1.Maugis Lionnel, 1996. Mathematical programming for the air traffic flow management problem with en-route capacities. In: Proceedings of the 14th
Triennial World Conference of the International Federation of Operational Research Societies.Milano Michela, 2012. Principles and Practice of Constraint Programming.Nagurney, Anna, 1998. Network Economics: A Variational Inequality Approach, vol. 10. Springer.Netjasov, F. et al, 2013. Framework for airspace planning and design based on conflict risk assessment Part 3: conflict risk assessment model for airspace
operational and current day planning. Transp. Res. Part C 32, 31–47.Next Gen program, 2013. <http://www.faa.gov/nextgen/>, (consulted in 12.13).Peeta, Srinivas, Ziliaskopoulos, Athanasios K., 2001. Foundations of dynamic traffic assignment: the past, the present and the future. Networks Spat. Econ. 1
(3-4), 233–265.Piera, M. et al, 2014. Causal simulation models for facing third millennium air transport sustainability. Simul. Trans. Soc. Model. Simul. Int. 90 (2), 162–170.Prandini, Maria et al, 2011. Toward air traffic complexity assessment in new generation air traffic management systems. IEEE Trans. Intell. Transp. Syst. 12.3,
809–818.Prot, D. et al, 2014. A 4D-sequencing approach for air traffic management. Eur. J. Oper. Res..Pyrgiotis, Nikolas, Malone, Kerry M., Odoni, Amedeo, 2013. Modelling delay propagation within an airport network. Transport. Res. Part C: Emerg. Technol.
27, 60–75.Ruiz Sergio, Piera, M.A., Ranieri, A., Martinez, R., 2012. A computational efficient conflict detection and resolution through spatial data structures. In: Proc.
5th International Conference on Research in Air Transportation, ICRAT 2012, University of California (Berkeley).Ruiz, Sergio et al, 2013. A medium term conflict detection and resolution system for terminal maneuvering area based on spatial data structures and 4D
trajectories. Transport. Res. Part C: Emerg. Technol. 26, 396–417.Ruiz, Sergio et al, 2013. Relational time-space data structure to enable strategic de-confliction with a global scope in the presence of a large number of 4D
trajectories. J. Aerospace Oper. 2, 53–78.Ruiz, Sergio et al, 2014. Strategic de-confliction in the presence of a large number of 4D trajectories using a causal modeling approach. Transp. Res. Part C 39,
129–147.Sesar program, 2013. <http://www.ec.europa.eu/transport/modes/air/sesar/>, (consulted in 12.13).Stream, 2013. Strategic Trajectory de-confliction to Enable seamless Aircraft conflict Management, Eurocontrol WP-E project. <www.hala-sesar.net/
stream>, (consulted in 12.13).Tang, Jiangjun et al, 2012. A multi-objective approach for dynamic airspace sectorization using agent based and geometric models. Transport. Res. Part C:
Emerg. Technol. 21.1, 89–121.Tastambekov, K. et al, 2014. Aircraft trajectory forecasting using local functional regression in Sobolev space. Transp. Res. Part C 39, 1–22.Team, R. Development Core, 2013. R: A language and environment for statistical computing. R Foundation for Statistical Computing, Vienna, Austria, ISBN 3-
900051-07-0. url: <http://www.R-project.org, 2005>.Trandac, Huy, Baptiste, Philippe, Duong, Vu, 2005. Airspace sectorization with constraints. RAIRO-Oper. Res. 39 (02), 105–122.Zenios, S., 1991. Network based models for air traffic control. Eur. J. Oper. Res. 50, 166–178.Zi Xiao, C. et al, 2013. A new concept of occupancy: dynamic time occupancy. Transp. Res. Part C 31, 51–61.
184 J. Nosedal et al. / Transportation Research Part C 44 (2014) 171–184