Embed Size (px)
Citation preview
Author's personal copy
Icarus 198 (2008) 7–18
Contents lists available at ScienceDirect
Icarus
www.elsevier.com/locate/icarus
Searching for high alumina mare basalts using Clementine UVVIS andLunar Prospector GRS data: Mare Fecunditatis and Mare Imbrium
Georgiana Y. Kramer a,b,∗, Bradley L. Jolliff c, Clive R. Neal b
a Bear Fight Center, 22 Fiddler’s Rd, Winthrop, WA 98862, USAb Department of Civil Engineering and Geological Sciences, University of Notre Dame, IN 46556, USAc Department of Earth and Planetary Sciences, Washington University, St. Louis, MO 63130, USA
a r t i c l e i n f o a b s t r a c t
Article history:Received 19 February 2008Revised 24 May 2008Available online 4 July 2008
Keywords:Moon, surface
In the context of sample evidence alone, the high-alumina (HA) basalts appear to be an unique, andrare variety of mare basalt. In addition to their distinct chemistry, radiometric dating reveals thesebasalts to be among the oldest sampled mare basalts. Yet, HA basalts were sampled by four missionsspanning a lateral range of ∼2400 km, with ages demonstrating that aluminous volcanism lasted at least1 billion years. This evidence suggests that HA basalts may be a widespread phenomenon on the Moon.Knowing the distribution of HA mare basalts on the lunar surface has significance for models of the originand the evolution of the Lunar Magma Ocean. Surface exposures of HA basalts can be detected withcompositional remote sensing data from Lunar Prospector Gamma Ray Spectrometer and Clementine.We searched the lunar surface for regions of interest (ROIs) that correspond to the intersection of threecompositional constraints taken from values of sampled HA basalts: 12–18 wt% FeO, 1.5–5 wt% TiO2, and0–4 ppm Th. We then determined the “true” (unobscured by regolith) composition of basalt units byanalyzing the rims and proximal ejecta of small impacts (0.4–4 km in diameter) into the mare surfaceof these ROIs. This paper focuses on two ROIs that are the best candidates for sources of sampled HAbasalts: Mare Fecunditatis, the landing site of Luna 16; and northern Mare Imbrium, hypothesized originof the Apollo 14 HA basalts. We demonstrate our technique’s ability for delineating discrete basalt unitsand determining which is the best compositional match to the HA basalts sampled by each mission. Weidentified two units in Mare Fecunditatis that spectrally resemble HA basalts, although only one unit(Iltm) is consistent with the compositional and relative age of the Luna 16 HA samples. Northern MareImbrium also reveals two units that are within the compositional constraints of HA basalts, with one(Iltm) best matching the composition of the basalts sampled by Apollo 14.
© 2008 Elsevier Inc. All rights reserved.
1. Introduction
The Soviet Luna 16 and American Apollo 14 sample return mis-sions brought to Earth the vast majority of high-alumina (HA) marebasalts in the sample collection, although at least one HA basaltfrom each of Apollo 12 and Apollo 16 have also been identified(Nyquist et al., 1981; Zeigler et al., 2006). They are an importantsubset of the mare basalt sample collection for several reasons,most importantly their relatively high abundance of Al2O3 (∼11–16 wt% Al2O3) compared to other mare basalts (7–11 wt% Al2O3)(Albee et al., 1972; Grieve et al., 1972; Helmke and Haskin, 1972;Ridley, 1975; Kurat et al., 1976; Ma et al., 1979; Shervais et al.,1985; Dickinson et al., 1985; Neal et al., 1988). This unique chem-
* Corresponding author at: Bear Fight Center, 22 Fiddler’s Rd, Winthrop, WA98862, USA.
E-mail address: [email protected] (G.Y. Kramer).
istry and mineralogy describe a petrogenesis different from othermare basalts in that their sources contained a significant amountof plagioclase (e.g., Ridley, 1975; Neal and Kramer, 2006). This inturn has broader implications on the efficiency of plagioclase sep-aration in the Lunar Magma Ocean (LMO) (Taylor and Jakes, 1974;Snyder et al., 1992; Shearer and Papike, 1999) and evolution of thelunar mantle.
Some of the HA basalts sampled by Apollo 14 represent theoldest mare basalt eruptions (∼4.25 Ga) (e.g., Dasch et al., 1987),predating the main sequence of mare volcanism that filled thegreat lunar basins. The combined Apollo 14 and Luna 16 samplecollection demonstrates that the duration of aluminous mare vol-canism lasted at least 1 billion years (e.g., Nyquist et al., 1981;Dasch et al., 1987; Nyquist and Shih, 1992; Snyder et al., 2000;Cohen et al., 2001). Aluminous basalt fragments have been sam-pled from regions separated by ∼2400 km. Their range in age,location, and variation in geochemistry suggests that HA basaltsmay be more common than previously thought. They may be a
0019-1035/$ – see front matter © 2008 Elsevier Inc. All rights reserved.doi:10.1016/j.icarus.2008.06.009
Author's personal copy
8 G.Y. Kramer et al. / Icarus 198 (2008) 7–18
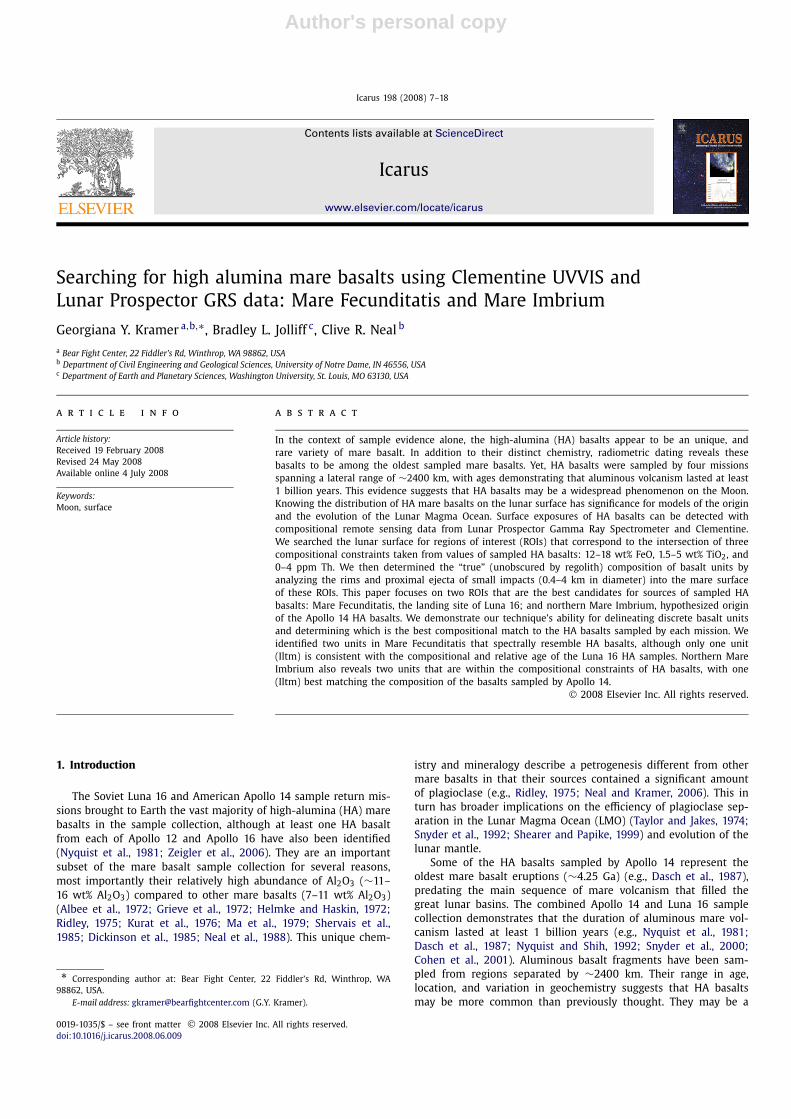
Fig. 1. Clementine 750 nm base map at 1 km resolution. White areas depict inter-section of compositional constraints based on HA sample data: 12–18 wt% FeO, 1–5 wt% TiO2, and 0–4 ppm Th. FeO compositional data based on algorithms of Luceyet al. (2000b) and Wilcox et al. (2005) from Clementine data at 100 m/pixel. TiO2
compositional data from algorithm of Lucey et al. (2000b) from Clementine dataat 250 m/pixel. Th data from LP-GRS (Prettyman et al., 2002) at half degree/pixelresolution. Numbers correspond to ROIs identified in Table 1.
significant component of ancient basalts and could be related tocryptomare (Schultz and Spudis, 1979; Hawke et al., 2005a, 2005b).
Knowing the extent of aluminous basaltic volcanism would beanother step toward understanding the nature and history of theMoon. The aluminous nature of these basalts results from one ofthree scenarios:
(1) Assimilation of the anorthositic crust by a (low-alumina) marebasalt magma,
(2) Mixing of (low-alumina) mare basalt with anorthositic crustby impact-induced melt, or
(3) Plagioclase retained in the source.
Neal and Kramer (2006) addressed all three scenarios, with focuson a model of the petrogenesis of the Apollo 14 HA basalts. Theirconclusions favored scenario 3, and provided evidence againstscenarios 1 and 2 (see also Finnila et al., 1994; Ridley, 1975;Warren et al., 1997; Hagerty et al., 2005). Thus, the evidence forplagioclase retained in the source of the HA basalts implies thatplagioclase flotation was inefficient during the differentiation ofthe LMO, and that some plagioclase remains within the uppermostlunar mantle. Another, although less likely scenario of an Al-richsource, is from spinel or garnet in the source. In this case, thebasalts must be derived from much greater depths (i.e., >500 kmfor garnet). Spinel could be the aluminous phase between 250 and500 km within the lunar mantle (Neal, 2001).
In a previous paper (Kramer et al., 2008), we described amethod for identifying potential HA basalt exposures on the lu-nar surface using Clementine multispectral and Lunar Prospectorgamma-ray spectrometer (LP-GRS) data. Compositional parame-ters for the Moon-wide search were based on known compositionsfrom HA basalt samples and were used to map the distribution ofHA basalts globally (12–18 wt% FeO, 1.5–5 wt% TiO2, and 0–4 ppmTh, Fig. 1, Table 1). Selected regions of interest (ROIs) were moreclosely evaluated using high-resolution (100 m/pixel) FeO andTiO2 compositional data derived from the Clementine multispec-tral camera. In our previous work, we characterized the marebasalt units of two of these ROIs: Mare Moscoviense and MareNectaris, and concluded that each basin contained at least onebasalt unit consistent with a HA composition (see Kramer et al.,2008). The current paper focuses on two other ROIs highlighted inFig. 1: Northern Mare Imbrium (Sinus Iridum and South of Plato)and Mare Fecunditatis. They were selected because they are thelikeliest candidates for the source of the HA basalts sampled byApollo 14 and Luna 16.
Table 1ROIs highlighted by compositional constraints
ROI Lat Lon
1 Apollo (center) 36S 153W2 Apollo (lower between rings) 43S 155W3 Oppenheimer 46S 168W4 Bose 55S 167W5 Leibnitz 39S 179E6 Von Karmen 46S 174E7 Chretien 45S 161E8 Poincaré 58S 162E9 Jules Verne 35S 146E
10 Mare Ingenii 34S 168E11 Mare Moscoviense 27N 146E12 Tsiolkovskiy 20S 129E13 Mare Australe (areas) 42S 90E14 Mare Smythii 2N 89E15 Mare Marginis 14N 87E16 Lomonosov 28N 98E17 Lacus Spei 43N 65E18 Mare Crisium 18N 60E19 Mare Fecunditatis 3S 51E20 Mare Nectaris 16S 35E21 Mare Tranquillitatis 9N 31E22 Mare Serenitatis 25N 19E23 South of Plato 43N 13W24 Sinus Iridum 44N 30W25 E. Sinus Roris 44N 64W26 W. Proc (Struve) 20N 74W27 Grimaldi 6S 68W28 Cruger 17S 67W29 Humorum 23S 40W30 Palus Epidemiarum 31S 32W31 Pitatus 30S 13W32 Lacus Excellentiae 35S 42W33 Lacus Excellentiae West 43S 56W34 Mare Orientale 20S 95W
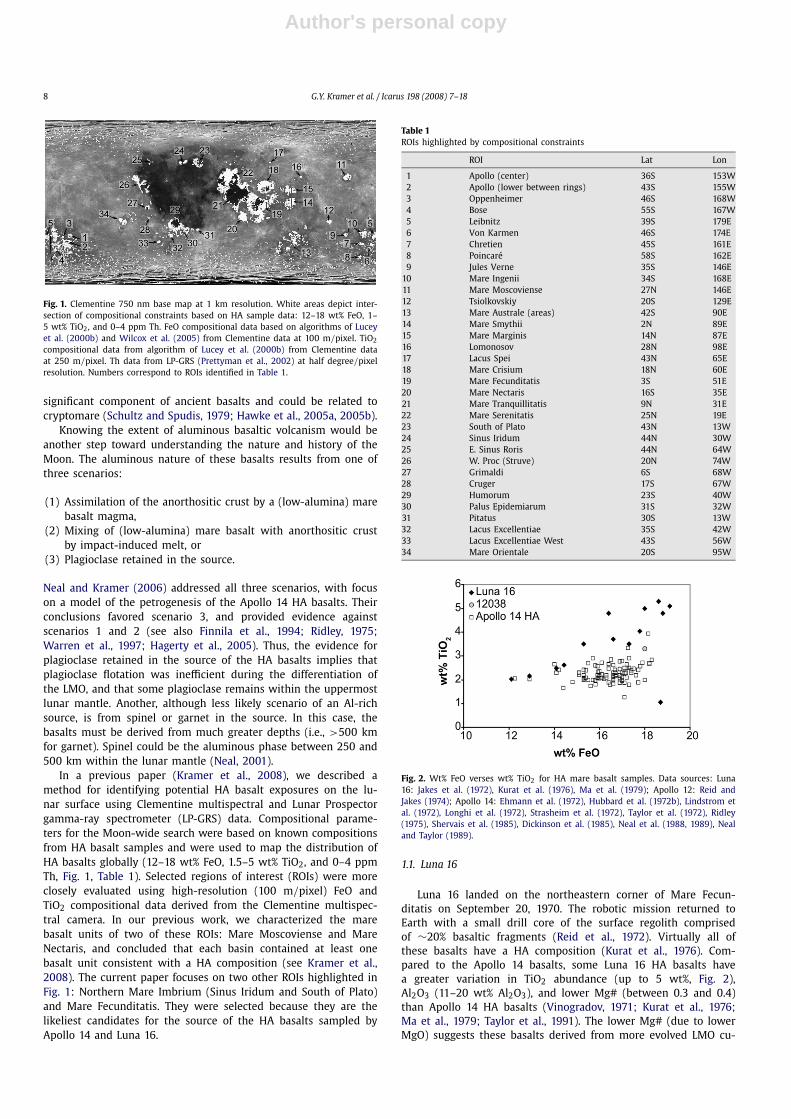
Fig. 2. Wt% FeO verses wt% TiO2 for HA mare basalt samples. Data sources: Luna16: Jakes et al. (1972), Kurat et al. (1976), Ma et al. (1979); Apollo 12: Reid andJakes (1974); Apollo 14: Ehmann et al. (1972), Hubbard et al. (1972b), Lindstrom etal. (1972), Longhi et al. (1972), Strasheim et al. (1972), Taylor et al. (1972), Ridley(1975), Shervais et al. (1985), Dickinson et al. (1985), Neal et al. (1988, 1989), Nealand Taylor (1989).
1.1. Luna 16
Luna 16 landed on the northeastern corner of Mare Fecun-ditatis on September 20, 1970. The robotic mission returned toEarth with a small drill core of the surface regolith comprisedof ∼20% basaltic fragments (Reid et al., 1972). Virtually all ofthese basalts have a HA composition (Kurat et al., 1976). Com-pared to the Apollo 14 basalts, some Luna 16 HA basalts havea greater variation in TiO2 abundance (up to 5 wt%, Fig. 2),Al2O3 (11–20 wt% Al2O3), and lower Mg# (between 0.3 and 0.4)than Apollo 14 HA basalts (Vinogradov, 1971; Kurat et al., 1976;Ma et al., 1979; Taylor et al., 1991). The lower Mg# (due to lowerMgO) suggests these basalts derived from more evolved LMO cu-
Author's personal copy
Searching for HA basalts 9
mulates than did the Apollo 14 HA basalts (Kurat et al., 1976). Luna16 HA basalts have a greater abundance of light REE comparedto the heavy REE, resulting in a slightly bow-shaped chondrite-normalized rare earth element (REE) profile (Taylor et al., 1991).Radiometric ages of the Luna 16 basalts indicate at least threeeruptive episodes occurring between 3.42 and 3.15 Ga (Hunekeet al., 1972; Cadogen and Turner, 1977; Fernandes et al., 2000;Cohen et al., 2001), erupting contemporaneously with other, low-alumina mare basalts. The unique chemistry and proportions ofparticle types in the Luna 16 regolith sample suggests the sourcematerial was derived from local areas (Hubbard et al., 1972a), andthus implies that at least a portion of Mare Fecunditatis is domi-nated by aluminous mare basalts.
1.2. Apollo 14
In February, 1971, Apollo 14 returned to Earth with a collec-tion of samples from the Fra Mauro formation, a promontory inOceanus Procellarum that marks the eastern boundary of MareCognitum. Fra Mauro is formed of ejecta deposits from the Im-brium impact (∼3.85 Ga) (Wilhelms, 1987). Among the samplescollected during this mission were several HA mare basalts. Theycame predominately in the form of clasts in breccia 14321 (e.g.,Grieve et al., 1975; Duncan et al., 1975), although there are twoHA specimens that are not part of any breccia, samples 14053and 14072 (Papanastassiou and Wasserburg, 1971; El Goresy et al.,1972). The Apollo 14 HA basalts, therefore, are probably not indige-nous to that region, but rather originated from the Imbrium regionprior to basin formation.
All of the Apollo 14 HA basalts are low-Ti (1.5–4 wt% TiO2,Fig. 2) and exhibit relatively minor variation in major elementchemistry. Other relevant major-element oxide abundances of HAbasalts sampled by this mission are: 13–19 wt% FeO, 11–16 wt%Al2O3, and Mg# between 0.4 and 0.55. Major element chem-istry suggests this collection could be modeled by simple, closed-system fractional crystallization (Dickinson et al., 1985). How-ever, there are two features of this collection that complicate thematter of their petrogenesis, and require a more complex ex-planation than simple fractional crystallization: (1) most Apollo14 HA basalts are light rare earth element (LREE) enriched tovarying degrees; and (2) they vary substantially in their incom-patible trace element abundance, demonstrating an eight-fold in-crease between the lowest and highest abundances. Radiomet-ric ages indicate at least three, and possibly four distinct agesranging between 3.9 and 4.3 Ga, which predate and are con-tiguous with the beginning of extensive mare volcanism, whichmarks the upper Imbrian (∼3.9 Ga) (Papanastassiou and Wasser-burg, 1971; Taylor et al., 1983; Dasch et al., 1987; Wilhelms, 1987;Shih and Nyquist, 1989a, 1989b). Modeling of their trace el-ement compositions implicates KREEP as a component in thesource (Hughes et al., 1990) and in some cases during ascentand crystallization (Neal et al., 1988). Isotopic and trace ele-ment data are consistent with the age groups, indicating thatthe Apollo 14 HA basalts were derived from trace-element dis-tinct source regions, and at different times (Neal and Kramer,2006).
2. Data and analysis
The reader is referred to Kramer et al. (2008) for a detailedexplanation of the methodology. A brief summary is given here.The method uses compositional remote sensing data constrainedby known sample compositions to find regions on the lunar surfacewhere HA mare basalts appear to have erupted. Three data sets areused to achieve this end:
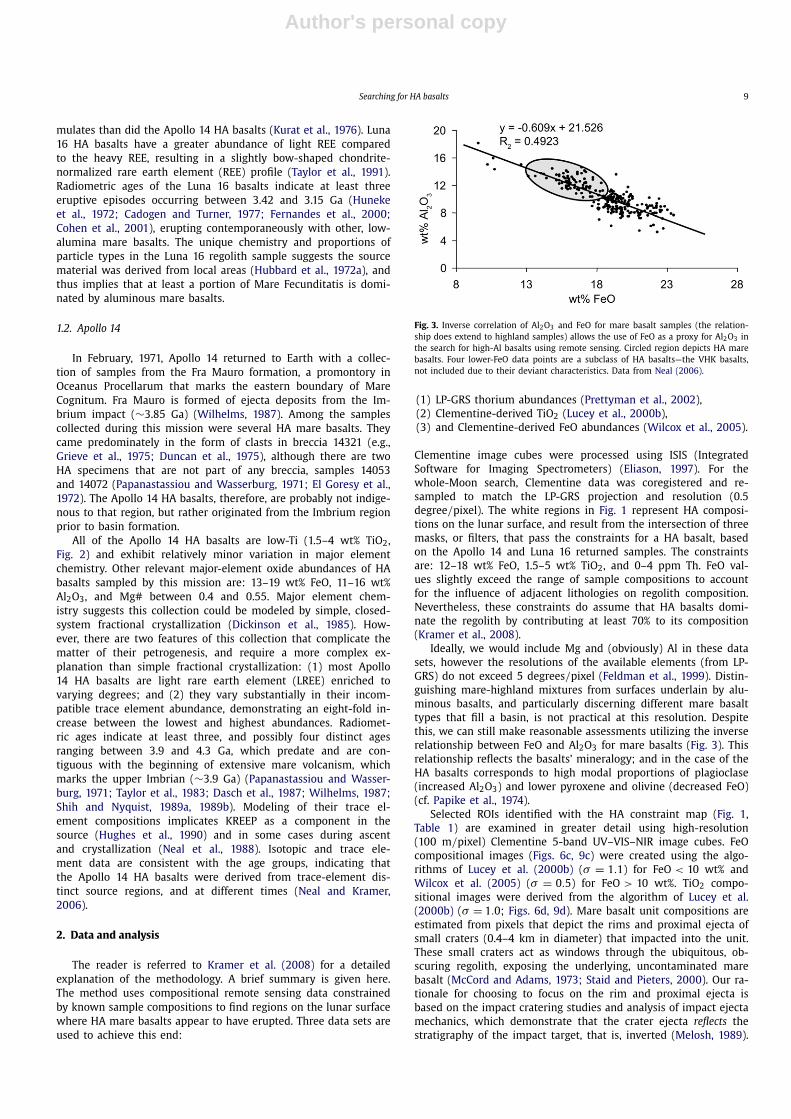
Fig. 3. Inverse correlation of Al2O3 and FeO for mare basalt samples (the relation-ship does extend to highland samples) allows the use of FeO as a proxy for Al2O3 inthe search for high-Al basalts using remote sensing. Circled region depicts HA marebasalts. Four lower-FeO data points are a subclass of HA basalts—the VHK basalts,not included due to their deviant characteristics. Data from Neal (2006).
(1) LP-GRS thorium abundances (Prettyman et al., 2002),(2) Clementine-derived TiO2 (Lucey et al., 2000b),(3) and Clementine-derived FeO abundances (Wilcox et al., 2005).
Clementine image cubes were processed using ISIS (IntegratedSoftware for Imaging Spectrometers) (Eliason, 1997). For thewhole-Moon search, Clementine data was coregistered and re-sampled to match the LP-GRS projection and resolution (0.5degree/pixel). The white regions in Fig. 1 represent HA composi-tions on the lunar surface, and result from the intersection of threemasks, or filters, that pass the constraints for a HA basalt, basedon the Apollo 14 and Luna 16 returned samples. The constraintsare: 12–18 wt% FeO, 1.5–5 wt% TiO2, and 0–4 ppm Th. FeO val-ues slightly exceed the range of sample compositions to accountfor the influence of adjacent lithologies on regolith composition.Nevertheless, these constraints do assume that HA basalts domi-nate the regolith by contributing at least 70% to its composition(Kramer et al., 2008).
Ideally, we would include Mg and (obviously) Al in these datasets, however the resolutions of the available elements (from LP-GRS) do not exceed 5 degrees/pixel (Feldman et al., 1999). Distin-guishing mare-highland mixtures from surfaces underlain by alu-minous basalts, and particularly discerning different mare basalttypes that fill a basin, is not practical at this resolution. Despitethis, we can still make reasonable assessments utilizing the inverserelationship between FeO and Al2O3 for mare basalts (Fig. 3). Thisrelationship reflects the basalts’ mineralogy; and in the case of theHA basalts corresponds to high modal proportions of plagioclase(increased Al2O3) and lower pyroxene and olivine (decreased FeO)(cf. Papike et al., 1974).
Selected ROIs identified with the HA constraint map (Fig. 1,Table 1) are examined in greater detail using high-resolution(100 m/pixel) Clementine 5-band UV–VIS–NIR image cubes. FeOcompositional images (Figs. 6c, 9c) were created using the algo-rithms of Lucey et al. (2000b) (σ = 1.1) for FeO < 10 wt% andWilcox et al. (2005) (σ = 0.5) for FeO > 10 wt%. TiO2 compo-sitional images were derived from the algorithm of Lucey et al.(2000b) (σ = 1.0; Figs. 6d, 9d). Mare basalt unit compositions areestimated from pixels that depict the rims and proximal ejecta ofsmall craters (0.4–4 km in diameter) that impacted into the unit.These small craters act as windows through the ubiquitous, ob-scuring regolith, exposing the underlying, uncontaminated marebasalt (McCord and Adams, 1973; Staid and Pieters, 2000). Our ra-tionale for choosing to focus on the rim and proximal ejecta isbased on the impact cratering studies and analysis of impact ejectamechanics, which demonstrate that the crater ejecta reflects thestratigraphy of the impact target, that is, inverted (Melosh, 1989).
Author's personal copy
10 G.Y. Kramer et al. / Icarus 198 (2008) 7–18
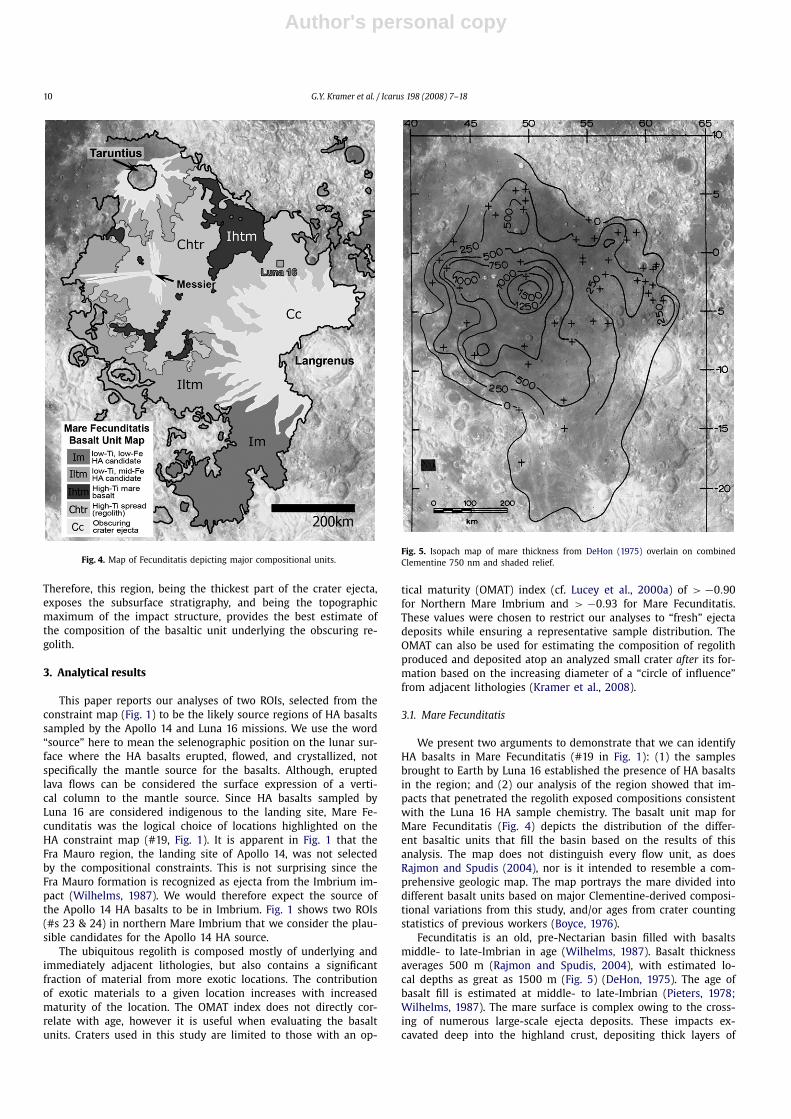
Fig. 4. Map of Fecunditatis depicting major compositional units.
Therefore, this region, being the thickest part of the crater ejecta,exposes the subsurface stratigraphy, and being the topographicmaximum of the impact structure, provides the best estimate ofthe composition of the basaltic unit underlying the obscuring re-golith.
3. Analytical results
This paper reports our analyses of two ROIs, selected from theconstraint map (Fig. 1) to be the likely source regions of HA basaltssampled by the Apollo 14 and Luna 16 missions. We use the word“source” here to mean the selenographic position on the lunar sur-face where the HA basalts erupted, flowed, and crystallized, notspecifically the mantle source for the basalts. Although, eruptedlava flows can be considered the surface expression of a verti-cal column to the mantle source. Since HA basalts sampled byLuna 16 are considered indigenous to the landing site, Mare Fe-cunditatis was the logical choice of locations highlighted on theHA constraint map (#19, Fig. 1). It is apparent in Fig. 1 that theFra Mauro region, the landing site of Apollo 14, was not selectedby the compositional constraints. This is not surprising since theFra Mauro formation is recognized as ejecta from the Imbrium im-pact (Wilhelms, 1987). We would therefore expect the source ofthe Apollo 14 HA basalts to be in Imbrium. Fig. 1 shows two ROIs(#s 23 & 24) in northern Mare Imbrium that we consider the plau-sible candidates for the Apollo 14 HA source.
The ubiquitous regolith is composed mostly of underlying andimmediately adjacent lithologies, but also contains a significantfraction of material from more exotic locations. The contributionof exotic materials to a given location increases with increasedmaturity of the location. The OMAT index does not directly cor-relate with age, however it is useful when evaluating the basaltunits. Craters used in this study are limited to those with an op-
Fig. 5. Isopach map of mare thickness from DeHon (1975) overlain on combinedClementine 750 nm and shaded relief.
tical maturity (OMAT) index (cf. Lucey et al., 2000a) of > −0.90for Northern Mare Imbrium and > −0.93 for Mare Fecunditatis.These values were chosen to restrict our analyses to “fresh” ejectadeposits while ensuring a representative sample distribution. TheOMAT can also be used for estimating the composition of regolithproduced and deposited atop an analyzed small crater after its for-mation based on the increasing diameter of a “circle of influence”from adjacent lithologies (Kramer et al., 2008).
3.1. Mare Fecunditatis
We present two arguments to demonstrate that we can identifyHA basalts in Mare Fecunditatis (#19 in Fig. 1): (1) the samplesbrought to Earth by Luna 16 established the presence of HA basaltsin the region; and (2) our analysis of the region showed that im-pacts that penetrated the regolith exposed compositions consistentwith the Luna 16 HA sample chemistry. The basalt unit map forMare Fecunditatis (Fig. 4) depicts the distribution of the differ-ent basaltic units that fill the basin based on the results of thisanalysis. The map does not distinguish every flow unit, as doesRajmon and Spudis (2004), nor is it intended to resemble a com-prehensive geologic map. The map portrays the mare divided intodifferent basalt units based on major Clementine-derived composi-tional variations from this study, and/or ages from crater countingstatistics of previous workers (Boyce, 1976).
Fecunditatis is an old, pre-Nectarian basin filled with basaltsmiddle- to late-Imbrian in age (Wilhelms, 1987). Basalt thicknessaverages 500 m (Rajmon and Spudis, 2004), with estimated lo-cal depths as great as 1500 m (Fig. 5) (DeHon, 1975). The age ofbasalt fill is estimated at middle- to late-Imbrian (Pieters, 1978;Wilhelms, 1987). The mare surface is complex owing to the cross-ing of numerous large-scale ejecta deposits. These impacts ex-cavated deep into the highland crust, depositing thick layers of
Author's personal copy
Searching for HA basalts 11
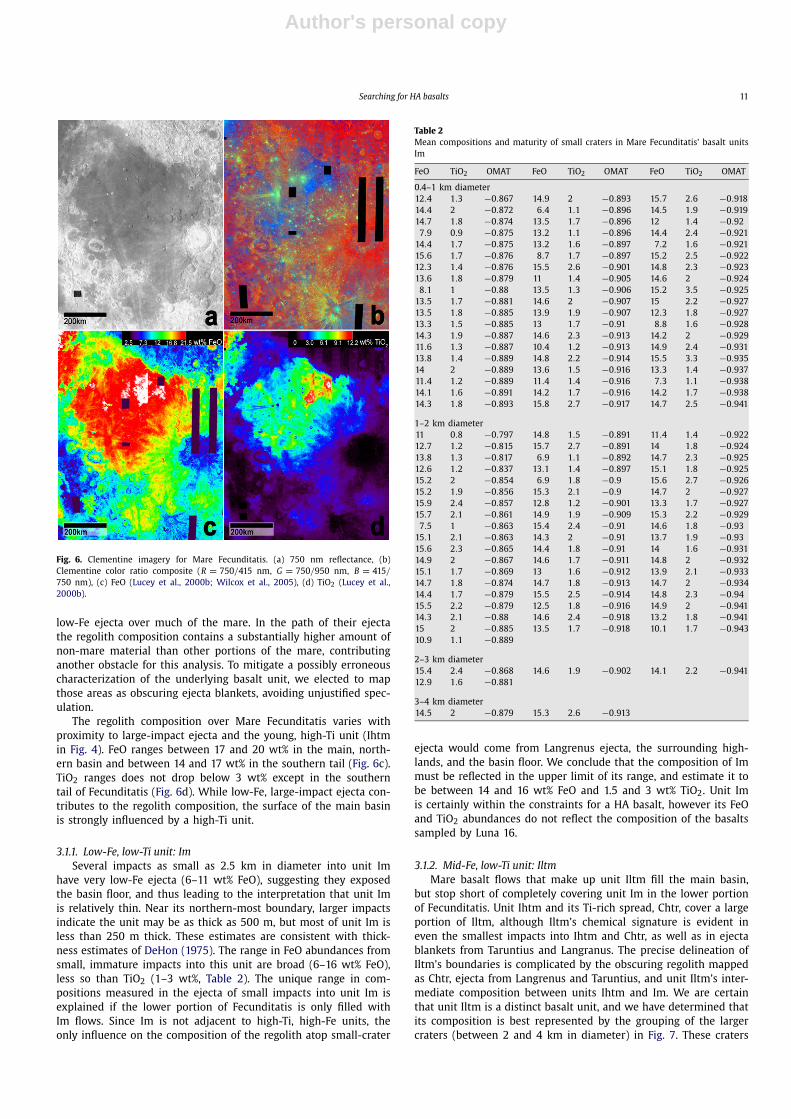
Fig. 6. Clementine imagery for Mare Fecunditatis. (a) 750 nm reflectance, (b)Clementine color ratio composite (R = 750/415 nm, G = 750/950 nm, B = 415/
750 nm), (c) FeO (Lucey et al., 2000b; Wilcox et al., 2005), (d) TiO2 (Lucey et al.,2000b).
low-Fe ejecta over much of the mare. In the path of their ejectathe regolith composition contains a substantially higher amount ofnon-mare material than other portions of the mare, contributinganother obstacle for this analysis. To mitigate a possibly erroneouscharacterization of the underlying basalt unit, we elected to mapthose areas as obscuring ejecta blankets, avoiding unjustified spec-ulation.
The regolith composition over Mare Fecunditatis varies withproximity to large-impact ejecta and the young, high-Ti unit (Ihtmin Fig. 4). FeO ranges between 17 and 20 wt% in the main, north-ern basin and between 14 and 17 wt% in the southern tail (Fig. 6c).TiO2 ranges does not drop below 3 wt% except in the southerntail of Fecunditatis (Fig. 6d). While low-Fe, large-impact ejecta con-tributes to the regolith composition, the surface of the main basinis strongly influenced by a high-Ti unit.
3.1.1. Low-Fe, low-Ti unit: ImSeveral impacts as small as 2.5 km in diameter into unit Im
have very low-Fe ejecta (6–11 wt% FeO), suggesting they exposedthe basin floor, and thus leading to the interpretation that unit Imis relatively thin. Near its northern-most boundary, larger impactsindicate the unit may be as thick as 500 m, but most of unit Im isless than 250 m thick. These estimates are consistent with thick-ness estimates of DeHon (1975). The range in FeO abundances fromsmall, immature impacts into this unit are broad (6–16 wt% FeO),less so than TiO2 (1–3 wt%, Table 2). The unique range in com-positions measured in the ejecta of small impacts into unit Im isexplained if the lower portion of Fecunditatis is only filled withIm flows. Since Im is not adjacent to high-Ti, high-Fe units, theonly influence on the composition of the regolith atop small-crater
Table 2Mean compositions and maturity of small craters in Mare Fecunditatis’ basalt unitsIm
FeO TiO2 OMAT FeO TiO2 OMAT FeO TiO2 OMAT
0.4–1 km diameter12.4 1.3 −0.867 14.9 2 −0.893 15.7 2.6 −0.91814.4 2 −0.872 6.4 1.1 −0.896 14.5 1.9 −0.91914.7 1.8 −0.874 13.5 1.7 −0.896 12 1.4 −0.92
7.9 0.9 −0.875 13.2 1.1 −0.896 14.4 2.4 −0.92114.4 1.7 −0.875 13.2 1.6 −0.897 7.2 1.6 −0.92115.6 1.7 −0.876 8.7 1.7 −0.897 15.2 2.5 −0.92212.3 1.4 −0.876 15.5 2.6 −0.901 14.8 2.3 −0.92313.6 1.8 −0.879 11 1.4 −0.905 14.6 2 −0.924
8.1 1 −0.88 13.5 1.3 −0.906 15.2 3.5 −0.92513.5 1.7 −0.881 14.6 2 −0.907 15 2.2 −0.92713.5 1.8 −0.885 13.9 1.9 −0.907 12.3 1.8 −0.92713.3 1.5 −0.885 13 1.7 −0.91 8.8 1.6 −0.92814.3 1.9 −0.887 14.6 2.3 −0.913 14.2 2 −0.92911.6 1.3 −0.887 10.4 1.2 −0.913 14.9 2.4 −0.93113.8 1.4 −0.889 14.8 2.2 −0.914 15.5 3.3 −0.93514 2 −0.889 13.6 1.5 −0.916 13.3 1.4 −0.93711.4 1.2 −0.889 11.4 1.4 −0.916 7.3 1.1 −0.93814.1 1.6 −0.891 14.2 1.7 −0.916 14.2 1.7 −0.93814.3 1.8 −0.893 15.8 2.7 −0.917 14.7 2.5 −0.941
1–2 km diameter11 0.8 −0.797 14.8 1.5 −0.891 11.4 1.4 −0.92212.7 1.2 −0.815 15.7 2.7 −0.891 14 1.8 −0.92413.8 1.3 −0.817 6.9 1.1 −0.892 14.7 2.3 −0.92512.6 1.2 −0.837 13.1 1.4 −0.897 15.1 1.8 −0.92515.2 2 −0.854 6.9 1.8 −0.9 15.6 2.7 −0.92615.2 1.9 −0.856 15.3 2.1 −0.9 14.7 2 −0.92715.9 2.4 −0.857 12.8 1.2 −0.901 13.3 1.7 −0.92715.7 2.1 −0.861 14.9 1.9 −0.909 15.3 2.2 −0.929
7.5 1 −0.863 15.4 2.4 −0.91 14.6 1.8 −0.9315.1 2.1 −0.863 14.3 2 −0.91 13.7 1.9 −0.9315.6 2.3 −0.865 14.4 1.8 −0.91 14 1.6 −0.93114.9 2 −0.867 14.6 1.7 −0.911 14.8 2 −0.93215.1 1.7 −0.869 13 1.6 −0.912 13.9 2.1 −0.93314.7 1.8 −0.874 14.7 1.8 −0.913 14.7 2 −0.93414.4 1.7 −0.879 15.5 2.5 −0.914 14.8 2.3 −0.9415.5 2.2 −0.879 12.5 1.8 −0.916 14.9 2 −0.94114.3 2.1 −0.88 14.6 2.4 −0.918 13.2 1.8 −0.94115 2 −0.885 13.5 1.7 −0.918 10.1 1.7 −0.94310.9 1.1 −0.889
2–3 km diameter15.4 2.4 −0.868 14.6 1.9 −0.902 14.1 2.2 −0.94112.9 1.6 −0.881
3–4 km diameter14.5 2 −0.879 15.3 2.6 −0.913
ejecta would come from Langrenus ejecta, the surrounding high-lands, and the basin floor. We conclude that the composition of Immust be reflected in the upper limit of its range, and estimate it tobe between 14 and 16 wt% FeO and 1.5 and 3 wt% TiO2. Unit Imis certainly within the constraints for a HA basalt, however its FeOand TiO2 abundances do not reflect the composition of the basaltssampled by Luna 16.
3.1.2. Mid-Fe, low-Ti unit: IltmMare basalt flows that make up unit Iltm fill the main basin,
but stop short of completely covering unit Im in the lower portionof Fecunditatis. Unit Ihtm and its Ti-rich spread, Chtr, cover a largeportion of Iltm, although Iltm’s chemical signature is evident ineven the smallest impacts into Ihtm and Chtr, as well as in ejectablankets from Taruntius and Langranus. The precise delineation ofIltm’s boundaries is complicated by the obscuring regolith mappedas Chtr, ejecta from Langrenus and Taruntius, and unit Iltm’s inter-mediate composition between units Ihtm and Im. We are certainthat unit Iltm is a distinct basalt unit, and we have determined thatits composition is best represented by the grouping of the largercraters (between 2 and 4 km in diameter) in Fig. 7. These craters
Author's personal copy
12 G.Y. Kramer et al. / Icarus 198 (2008) 7–18
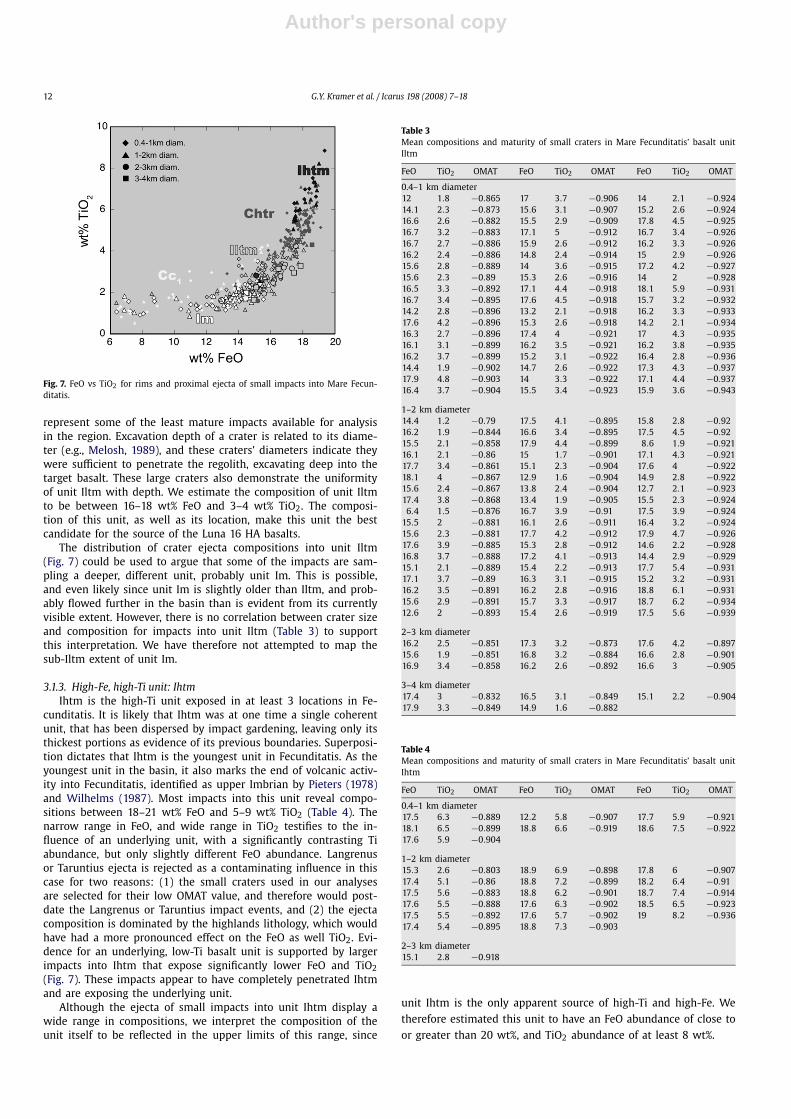
Fig. 7. FeO vs TiO2 for rims and proximal ejecta of small impacts into Mare Fecun-ditatis.
represent some of the least mature impacts available for analysisin the region. Excavation depth of a crater is related to its diame-ter (e.g., Melosh, 1989), and these craters’ diameters indicate theywere sufficient to penetrate the regolith, excavating deep into thetarget basalt. These large craters also demonstrate the uniformityof unit Iltm with depth. We estimate the composition of unit Iltmto be between 16–18 wt% FeO and 3–4 wt% TiO2. The composi-tion of this unit, as well as its location, make this unit the bestcandidate for the source of the Luna 16 HA basalts.
The distribution of crater ejecta compositions into unit Iltm(Fig. 7) could be used to argue that some of the impacts are sam-pling a deeper, different unit, probably unit Im. This is possible,and even likely since unit Im is slightly older than Iltm, and prob-ably flowed further in the basin than is evident from its currentlyvisible extent. However, there is no correlation between crater sizeand composition for impacts into unit Iltm (Table 3) to supportthis interpretation. We have therefore not attempted to map thesub-Iltm extent of unit Im.
3.1.3. High-Fe, high-Ti unit: IhtmIhtm is the high-Ti unit exposed in at least 3 locations in Fe-
cunditatis. It is likely that Ihtm was at one time a single coherentunit, that has been dispersed by impact gardening, leaving only itsthickest portions as evidence of its previous boundaries. Superposi-tion dictates that Ihtm is the youngest unit in Fecunditatis. As theyoungest unit in the basin, it also marks the end of volcanic activ-ity into Fecunditatis, identified as upper Imbrian by Pieters (1978)and Wilhelms (1987). Most impacts into this unit reveal compo-sitions between 18–21 wt% FeO and 5–9 wt% TiO2 (Table 4). Thenarrow range in FeO, and wide range in TiO2 testifies to the in-fluence of an underlying unit, with a significantly contrasting Tiabundance, but only slightly different FeO abundance. Langrenusor Taruntius ejecta is rejected as a contaminating influence in thiscase for two reasons: (1) the small craters used in our analysesare selected for their low OMAT value, and therefore would post-date the Langrenus or Taruntius impact events, and (2) the ejectacomposition is dominated by the highlands lithology, which wouldhave had a more pronounced effect on the FeO as well TiO2. Evi-dence for an underlying, low-Ti basalt unit is supported by largerimpacts into Ihtm that expose significantly lower FeO and TiO2(Fig. 7). These impacts appear to have completely penetrated Ihtmand are exposing the underlying unit.
Although the ejecta of small impacts into unit Ihtm display awide range in compositions, we interpret the composition of theunit itself to be reflected in the upper limits of this range, since
Table 3Mean compositions and maturity of small craters in Mare Fecunditatis’ basalt unitIltm
FeO TiO2 OMAT FeO TiO2 OMAT FeO TiO2 OMAT
0.4–1 km diameter12 1.8 −0.865 17 3.7 −0.906 14 2.1 −0.92414.1 2.3 −0.873 15.6 3.1 −0.907 15.2 2.6 −0.92416.6 2.6 −0.882 15.5 2.9 −0.909 17.8 4.5 −0.92516.7 3.2 −0.883 17.1 5 −0.912 16.7 3.4 −0.92616.7 2.7 −0.886 15.9 2.6 −0.912 16.2 3.3 −0.92616.2 2.4 −0.886 14.8 2.4 −0.914 15 2.9 −0.92615.6 2.8 −0.889 14 3.6 −0.915 17.2 4.2 −0.92715.6 2.3 −0.89 15.3 2.6 −0.916 14 2 −0.92816.5 3.3 −0.892 17.1 4.4 −0.918 18.1 5.9 −0.93116.7 3.4 −0.895 17.6 4.5 −0.918 15.7 3.2 −0.93214.2 2.8 −0.896 13.2 2.1 −0.918 16.2 3.3 −0.93317.6 4.2 −0.896 15.3 2.6 −0.918 14.2 2.1 −0.93416.3 2.7 −0.896 17.4 4 −0.921 17 4.3 −0.93516.1 3.1 −0.899 16.2 3.5 −0.921 16.2 3.8 −0.93516.2 3.7 −0.899 15.2 3.1 −0.922 16.4 2.8 −0.93614.4 1.9 −0.902 14.7 2.6 −0.922 17.3 4.3 −0.93717.9 4.8 −0.903 14 3.3 −0.922 17.1 4.4 −0.93716.4 3.7 −0.904 15.5 3.4 −0.923 15.9 3.6 −0.943
1–2 km diameter14.4 1.2 −0.79 17.5 4.1 −0.895 15.8 2.8 −0.9216.2 1.9 −0.844 16.6 3.4 −0.895 17.5 4.5 −0.9215.5 2.1 −0.858 17.9 4.4 −0.899 8.6 1.9 −0.92116.1 2.1 −0.86 15 1.7 −0.901 17.1 4.3 −0.92117.7 3.4 −0.861 15.1 2.3 −0.904 17.6 4 −0.92218.1 4 −0.867 12.9 1.6 −0.904 14.9 2.8 −0.92215.6 2.4 −0.867 13.8 2.4 −0.904 12.7 2.1 −0.92317.4 3.8 −0.868 13.4 1.9 −0.905 15.5 2.3 −0.9246.4 1.5 −0.876 16.7 3.9 −0.91 17.5 3.9 −0.924
15.5 2 −0.881 16.1 2.6 −0.911 16.4 3.2 −0.92415.6 2.3 −0.881 17.7 4.2 −0.912 17.9 4.7 −0.92617.6 3.9 −0.885 15.3 2.8 −0.912 14.6 2.2 −0.92816.8 3.7 −0.888 17.2 4.1 −0.913 14.4 2.9 −0.92915.1 2.1 −0.889 15.4 2.2 −0.913 17.7 5.4 −0.93117.1 3.7 −0.89 16.3 3.1 −0.915 15.2 3.2 −0.93116.2 3.5 −0.891 16.2 2.8 −0.916 18.8 6.1 −0.93115.6 2.9 −0.891 15.7 3.3 −0.917 18.7 6.2 −0.93412.6 2 −0.893 15.4 2.6 −0.919 17.5 5.6 −0.939
2–3 km diameter16.2 2.5 −0.851 17.3 3.2 −0.873 17.6 4.2 −0.89715.6 1.9 −0.851 16.8 3.2 −0.884 16.6 2.8 −0.90116.9 3.4 −0.858 16.2 2.6 −0.892 16.6 3 −0.905
3–4 km diameter17.4 3 −0.832 16.5 3.1 −0.849 15.1 2.2 −0.90417.9 3.3 −0.849 14.9 1.6 −0.882
Table 4Mean compositions and maturity of small craters in Mare Fecunditatis’ basalt unitIhtm
FeO TiO2 OMAT FeO TiO2 OMAT FeO TiO2 OMAT
0.4–1 km diameter17.5 6.3 −0.889 12.2 5.8 −0.907 17.7 5.9 −0.92118.1 6.5 −0.899 18.8 6.6 −0.919 18.6 7.5 −0.92217.6 5.9 −0.904
1–2 km diameter15.3 2.6 −0.803 18.9 6.9 −0.898 17.8 6 −0.90717.4 5.1 −0.86 18.8 7.2 −0.899 18.2 6.4 −0.9117.5 5.6 −0.883 18.8 6.2 −0.901 18.7 7.4 −0.91417.6 5.5 −0.888 17.6 6.3 −0.902 18.5 6.5 −0.92317.5 5.5 −0.892 17.6 5.7 −0.902 19 8.2 −0.93617.4 5.4 −0.895 18.8 7.3 −0.903
2–3 km diameter15.1 2.8 −0.918
unit Ihtm is the only apparent source of high-Ti and high-Fe. Wetherefore estimated this unit to have an FeO abundance of close toor greater than 20 wt%, and TiO2 abundance of at least 8 wt%.
Author's personal copy
Searching for HA basalts 13
Table 5Mean compositions and maturity of small craters into Chtr in Mare Fecunditatis
FeO TiO2 OMAT FeO TiO2 OMAT FeO TiO2 OMAT
0.4–1 km diameter18.7 5.4 −0.875 18.9 6.4 −0.906 17.3 4.5 −0.91818 4.9 −0.877 16.3 3.7 −0.909 17.1 4.9 −0.91819.1 5.1 −0.877 18.8 8.6 −0.909 17.2 4.5 −0.91815 2.4 −0.881 17.8 5.8 −0.91 17 4.3 −0.9216.8 4 −0.889 17.1 4.3 −0.911 15.4 3.1 −0.92218.2 4.9 −0.889 17.6 6.1 −0.912 16.9 4.7 −0.92216.2 2.6 −0.891 16.6 4.5 −0.914 13.3 2.9 −0.92316.3 3.4 −0.892 16.9 4.4 −0.915 14.2 3.1 −0.92418 4.3 −0.9 17.3 4.8 −0.915 18.4 6.8 −0.92417 4.6 −0.901 18.4 5.1 −0.915 17 5 −0.92418.1 4.4 −0.901 17.8 5.3 −0.915 15.5 3.5 −0.92516.6 4.5 −0.902 17.7 5 −0.916 18.6 6 −0.92517.1 4.4 −0.902 18.2 5.5 −0.916 16.9 4.2 −0.92816.8 4.1 −0.903 13.8 2.3 −0.917 17.5 4.3 −0.9318.1 4.8 −0.903
1–2 km diameter17.3 3.6 −0.852 17.9 4.9 −0.897 18.3 5.6 −0.91617.7 3.7 −0.853 16.3 3.4 −0.902 18.4 4.9 −0.91917.5 3.7 −0.857 18.7 5.9 −0.903 16.3 3.9 −0.91917.9 5.6 −0.884 18.4 5.7 −0.906 15.8 3.6 −0.9215.9 3.8 −0.887 16.4 3 −0.906 17.1 4.6 −0.92218.3 4.3 −0.888 18.5 5.7 −0.907 17.8 5.2 −0.92218 5.3 −0.888 17.9 4.5 −0.908 17.7 5.3 −0.92317.6 4 −0.89 17.2 4.3 −0.912 17.9 5 −0.92418.5 6.1 −0.892 17.8 5.9 −0.912 16.4 3.4 −0.92518.7 6.2 −0.893 17.7 5.5 −0.913 18.3 6 −0.92517.4 4.6 −0.893 17.3 4.2 −0.915 17.6 4.4 −0.9317.9 7.1 −0.895
2–3 km diameter15.2 1.6 −0.739 18.2 5.4 −0.89 18.4 5 −0.90718.3 5.4 −0.853 18.1 5 −0.899 18.2 5.8 −0.92417.7 4.5 −0.855
3–4 km diameter18.6 4.3 −0.851
3.1.4. Distinct regolith compositions: Cc and ChtrOn a map intended to depict mare basalt units, we chose to de-
lineate two distinct portions of the mare because of their decidedimpression on the regolith. If the surface regolith over a locationis displaying such a profound influence from a very composition-ally distinct lithology, then it is introducing too much complexityto make a reasonable assessment of the underlying mare basaltunit. Despite the careful selection of pixels from the rim and prox-imal ejecta of each crater, and limiting analyzed craters to thosewith low maturity, the exposed basalt will always be contaminatedwith new regolith material deposited since the impact event of thecrater under analysis. One cannot ignore the contribution from thesmaller, more frequent impacts, whose crater diameter is belowthan the resolution of Clementine data.
Unit Cc in Fig. 4 depicts the thick ejecta blankets of the Co-pernican-age craters Taruntius, Langrenus and Messier (Wilhelms,1987) (Fig. 4). Small, immature impacts into Cc show a corre-lation between crater size and ejecta composition. Compositionsfrom craters larger than 1 km in diameter plot among the densestgrouping of impacts into unit Iltm, while craters smaller than 1 kmexhibit lower FeO abundances than the grouping representing unitIm (Fig. 7, Table 5). We interpret this correlation as demonstratingthe changing compositions of a vertical column through the low-Fe ejecta blanket of the Copernican craters to the underlying marebasalt unit, Iltm. The crater size required to expose the underlyingmare basalt attests to the thickness of the Langrenus ejecta blan-ket.
Small craters with OMAT parameters > −0.93 into this “unit”consistently expose lower FeO and TiO2 than the composition ofthe surrounding surface, demonstrating that Chtr is mostly super-
Table 6Mean compositions and maturity of small craters into Cc in Mare Fecunditatis
FeO TiO2 OMAT FeO TiO2 OMAT FeO TiO2 OMAT
0.4–1 km diameter6.8 0.8 0.922 12.4 1.3 −0.912 10.4 1.8 −0.935
14.3 1.2 −0.844 7.4 0.9 −0.919 6.6 1.1 −0.93512.5 1.1 −0.86 13.2 2.9 −0.92 7.1 1.6 −0.937
8.6 1 −0.888 11.7 2.5 −0.926 11.6 3 −0.9395.4 0.9 −0.891 14.7 2.3 −0.93 9.3 1.3 −0.941
13.2 1.5 −0.895 10.2 1.7 −0.932 6.7 1.2 −0.94111 1.5 −0.903 16.8 4.1 −0.934 7.3 1.1 −0.9426.8 1.3 −0.905
1–2 km diameter14.8 1.6 −0.818 15 3.3 −0.897 13.9 2.2 −0.92914.8 2.1 −0.881 17.2 4.3 −0.913 15.1 2.1 −0.931
7.8 0.5 −0.881 16.7 3.9 −0.914 8.4 1.5 −0.93216.5 2.5 −0.883 11.5 1.7 −0.916 14.1 2.4 −0.94115 2.5 −0.889 16.3 3.5 −0.921
2–3 km diameter15.5 1.7 −0.846 15 2.3 −0.911
ficial. In several locations even the smallest craters used in theanalysis (400 m) completely penetrate it, and reveal an underly-ing, distinct, lower-Ti basalt. We interpret this as reflecting thecontribution from unit Ihtm to the increased TiO2 abundance ofthe regolith by impact gardening, while the underlying and ad-jacent unit Iltm contributes a lower TiO2 abundance. Ejecta fromLangrenus and Taruntius are not considered responsible for thecontribution of the lower Ti, because there is no correlating changein composition of small crater ejecta with crater diameter, as wasevident in Cc (Fig. 7). Gathered compositions from small craterejecta span the range from 15–19 wt% FeO and 1.5–7 wt% TiO2(Table 6). Based on our analyses of small crater ejecta, we estimatethe range of the composition of the exposed unit to: 15–18 wt%and 3–4.5 wt% TiO2, which is consistent with unit Iltm.
3.2. Northern Mare Imbrium
Impact melt breccias, like those sampled by Apollo 14, are in-terpreted as having formed from the fragmentation of basalticrocks by large impacts. These impacts are also responsible forre-consolidation of the basaltic clasts into breccias, with impactmelt working as the cement. Since the Fra Mauro Formation isformed of ejecta from the impact that formed the Imbrium basin(Wilhelms, 1987), it is not surprising that the formation itself wasnot selected as an ROI using the HA compositional constraints forthe whole Moon (Fig. 1). We would expect the HA mare basaltsource region for the sampled basalts to be either in or near MareImbrium. The method did identify the two small regions in North-ern Imbrium (#s 23 & 24 in Fig. 1, Table 1) as HA basalt candidates.However, the Imbrium basin is now filled with mare basalt flowsthat erupted after the Imbrium event (∼3.8 Ga), which in turn oc-curred after the eruption of the sampled HA basalts. If there wereany flows that survived basin formation, it would be difficult tofind them under hundreds of meters of mare basalt flows thathave since filled the basin. We can assume that HA basalts wereerupted here in the past, thus demonstrating the presence of asource in the region capable of generating aluminous mare basalts.It is reasonable to assume this source was capable of subsequenteruptions, particularly after de-lamination due to basin formation.So while it is unlikely that we would find the flows from whichthe sampled Apollo 14 HA basalts originated, our investigation mayhave located the vicinity of the mantle source of these basalts. Theidentification of HA basalts in the same region from where theApollo 14 basalts originated would also extend the duration of alu-minous volcanism in this region.
Author's personal copy
14 G.Y. Kramer et al. / Icarus 198 (2008) 7–18
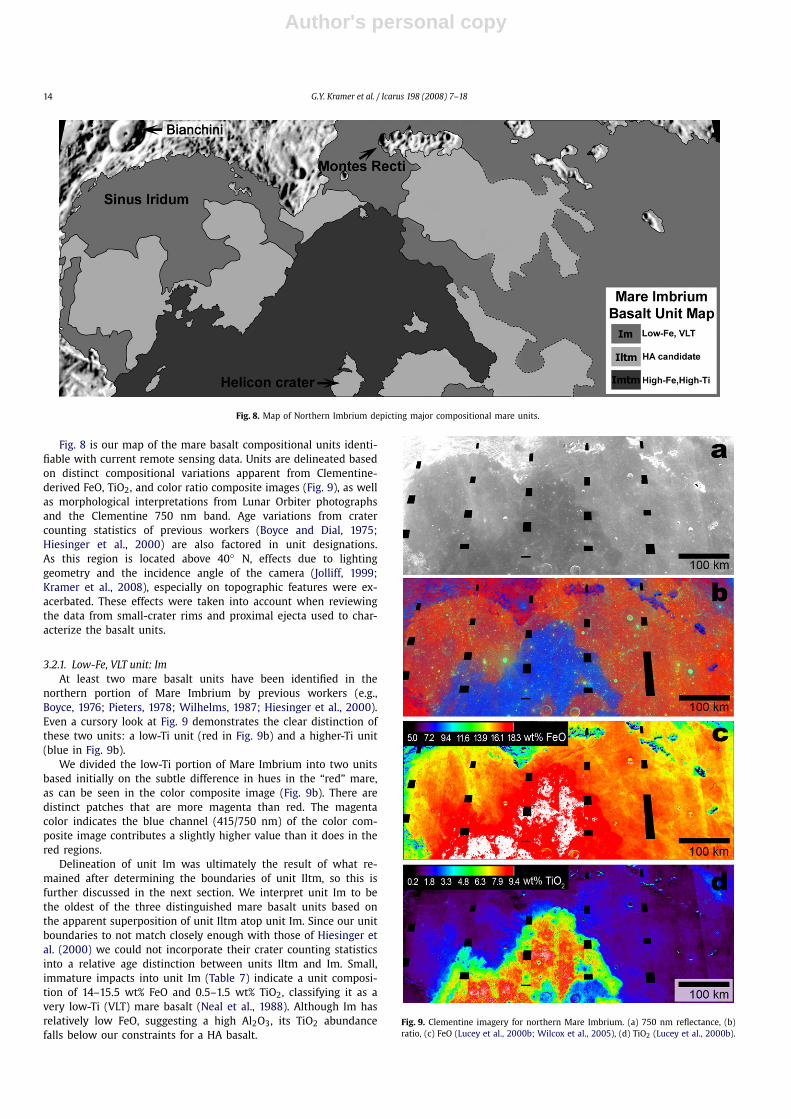
Fig. 8. Map of Northern Imbrium depicting major compositional mare units.
Fig. 8 is our map of the mare basalt compositional units identi-fiable with current remote sensing data. Units are delineated basedon distinct compositional variations apparent from Clementine-derived FeO, TiO2, and color ratio composite images (Fig. 9), as wellas morphological interpretations from Lunar Orbiter photographsand the Clementine 750 nm band. Age variations from cratercounting statistics of previous workers (Boyce and Dial, 1975;Hiesinger et al., 2000) are also factored in unit designations.As this region is located above 40◦ N, effects due to lightinggeometry and the incidence angle of the camera (Jolliff, 1999;Kramer et al., 2008), especially on topographic features were ex-acerbated. These effects were taken into account when reviewingthe data from small-crater rims and proximal ejecta used to char-acterize the basalt units.
3.2.1. Low-Fe, VLT unit: ImAt least two mare basalt units have been identified in the
northern portion of Mare Imbrium by previous workers (e.g.,Boyce, 1976; Pieters, 1978; Wilhelms, 1987; Hiesinger et al., 2000).Even a cursory look at Fig. 9 demonstrates the clear distinction ofthese two units: a low-Ti unit (red in Fig. 9b) and a higher-Ti unit(blue in Fig. 9b).
We divided the low-Ti portion of Mare Imbrium into two unitsbased initially on the subtle difference in hues in the “red” mare,as can be seen in the color composite image (Fig. 9b). There aredistinct patches that are more magenta than red. The magentacolor indicates the blue channel (415/750 nm) of the color com-posite image contributes a slightly higher value than it does in thered regions.
Delineation of unit Im was ultimately the result of what re-mained after determining the boundaries of unit Iltm, so this isfurther discussed in the next section. We interpret unit Im to bethe oldest of the three distinguished mare basalt units based onthe apparent superposition of unit Iltm atop unit Im. Since our unitboundaries to not match closely enough with those of Hiesinger etal. (2000) we could not incorporate their crater counting statisticsinto a relative age distinction between units Iltm and Im. Small,immature impacts into unit Im (Table 7) indicate a unit composi-tion of 14–15.5 wt% FeO and 0.5–1.5 wt% TiO2, classifying it as avery low-Ti (VLT) mare basalt (Neal et al., 1988). Although Im hasrelatively low FeO, suggesting a high Al2O3, its TiO2 abundancefalls below our constraints for a HA basalt.
Fig. 9. Clementine imagery for northern Mare Imbrium. (a) 750 nm reflectance, (b)ratio, (c) FeO (Lucey et al., 2000b; Wilcox et al., 2005), (d) TiO2 (Lucey et al., 2000b).
Author's personal copy
Searching for HA basalts 15
Table 7Mean compositions and maturity of small craters in Northern Mare Imbrium’s basaltunit Im
FeO TiO2 OMAT FeO TiO2 OMAT FeO TiO2 OMAT
0.4–1 km diameter14.2 0.3 −0.696 14.7 0.5 −0.835 16 1.3 −0.85312.9 0.2 −0.703 16 0.6 −0.837 16.6 1.4 −0.85415.3 0.4 −0.745 16.3 0.9 −0.837 16.8 1.1 −0.85515.2 0.4 −0.768 15.1 0.7 −0.837 15.8 0.8 −0.85612.4 0.3 −0.768 14.1 0.5 −0.837 15.4 1 −0.85713.2 0.3 −0.769 16.3 0.6 −0.837 16.5 0.9 −0.85716.8 0.7 −0.778 15.3 0.9 −0.838 15.4 0.6 −0.85715.3 0.9 −0.784 14.8 0.4 −0.838 17.3 1.7 −0.85816 0.7 −0.789 14.8 0.7 −0.838 14 0.8 −0.85816.3 0.8 −0.79 14.9 0.8 −0.838 15.5 0.9 −0.85817.5 0.9 −0.792 16.1 1.5 −0.838 15.5 0.4 −0.85816.6 1 −0.8 15.5 0.9 −0.838 16 1 −0.85916.8 1.1 −0.8 14 0.9 −0.839 14.9 0.6 −0.8616.2 0.8 −0.8 16.1 1.7 −0.84 16.2 1.2 −0.86116.7 0.8 −0.805 14.5 0.7 −0.841 15.3 0.6 −0.86112 0.4 −0.808 15.2 0.6 −0.841 17 2.1 −0.86214.5 1.6 −0.808 16.9 1.3 −0.842 14.1 0.7 −0.86215.7 0.5 −0.81 15 0.6 −0.843 16.7 1.5 −0.86316.2 1 −0.813 15.6 0.8 −0.843 15.8 1.1 −0.86415.7 0.6 −0.813 16.3 1.1 −0.843 16.6 0.9 −0.86514.6 0.4 −0.815 15.8 1.7 −0.843 14.6 0.9 −0.86514.4 0.4 −0.82 16.2 0.9 −0.843 15.4 1.4 −0.86515.3 0.5 −0.821 14.2 0.6 −0.843 17.4 1.4 −0.86614.8 0.5 −0.822 16.6 1 −0.844 17.2 1.5 −0.86614.4 0.4 −0.824 15.9 0.6 −0.844 15.9 1.2 −0.86615.3 0.8 −0.825 16.1 0.8 −0.845 14.4 0.6 −0.86716.1 0.8 −0.825 17.3 1.4 −0.845 15.6 0.8 −0.86915 1.1 −0.826 17.3 1.2 −0.845 16.4 1.8 −0.87116.1 1.4 −0.829 14.7 1 −0.845 14.8 0.8 −0.87117.8 1.6 −0.829 16.7 1.2 −0.846 17.3 2 −0.87616.9 0.9 −0.829 15.8 0.8 −0.846 15.6 1.2 −0.87915.9 0.6 −0.829 14.8 1 −0.847 15.7 0.8 −0.87915.6 1.3 −0.83 16.4 1.1 −0.847 16.1 1.1 −0.8815.3 0.8 −0.831 16.8 1.4 −0.848 16 1.5 −0.88314.9 0.9 −0.832 15.2 0.8 −0.848 17.8 2.7 −0.88516 0.9 −0.832 15.8 0.8 −0.848 15.7 1.1 −0.88516.7 1 −0.833 14.6 0.7 −0.849 14.2 0.8 −0.88615.5 0.8 −0.833 17.3 1.4 −0.851 15.1 0.7 −0.88615.8 0.6 −0.833 15.1 0.9 −0.851 15.7 0.9 −0.88814.8 1.3 −0.834 16.1 0.8 −0.851 16.7 1.3 −0.8915.2 0.8 −0.835 17.5 1.2 −0.852 16.2 1.4 −0.89117.2 1.1 −0.835 16.1 1.2 −0.852 15.5 1 −0.89116.9 0.9 −0.835 16.8 1.2 −0.852 16.2 2.3 −0.899
1–2 km diameter17.6 1.5 −0.688 14.7 0.7 −0.833 16.2 1 −0.86616.3 0.8 −0.787 13.9 0.5 −0.837 16 2.2 −0.86616.1 0.7 −0.8 14.6 0.4 −0.837 17.9 2.1 −0.86817.2 1.1 −0.806 13.7 1 −0.837 17.4 2.1 −0.86813.7 0.8 −0.81 14.9 0.4 −0.84 17.2 1.5 −0.86814.8 0.7 −0.813 16.3 1 −0.845 14.6 0.9 −0.87216.7 1.2 −0.813 14.9 0.8 −0.846 15.5 0.6 −0.87314.3 0.8 −0.814 16.1 1.1 −0.846 15.7 1 −0.87414.6 0.5 −0.815 16.5 1.7 −0.847 14.1 0.9 −0.87413.9 0.4 −0.819 13.4 0.8 −0.852 14.3 0.6 −0.87714.2 0.6 −0.821 13.9 0.8 −0.854 16.1 1.2 −0.87815.4 0.8 −0.826 16.1 2.3 −0.856 15.9 0.7 −0.8914.7 0.8 −0.828 15.4 1 −0.859 13.6 0.6 −0.89215.4 0.9 −0.831 15.9 1.2 −0.861 14.4 0.8 −0.89217.1 1.4 −0.831 15.2 1.1 −0.864 15 1 −0.895
2–3 km diameter15 0.5 −0.8 14.1 0.8 −0.82 14.3 1.2 −0.83314.6 1 −0.801
3–4 km diameter15.8 1.1 −0.826 15.2 1.9 −0.848 15.7 2 −0.86714.9 1.3 −0.847 14.1 0.7 −0.852
3.2.2. Mid-Fe, low-Ti unit: IltmWe initially divided the low-Ti “super-unit” into units Im and
Iltm based on subtle color differences of the mare surface in acolor composite image (Fig. 9b) and TiO2 image (Fig. 9d). Once thusdivided, we could adjust or support these unit delineations from
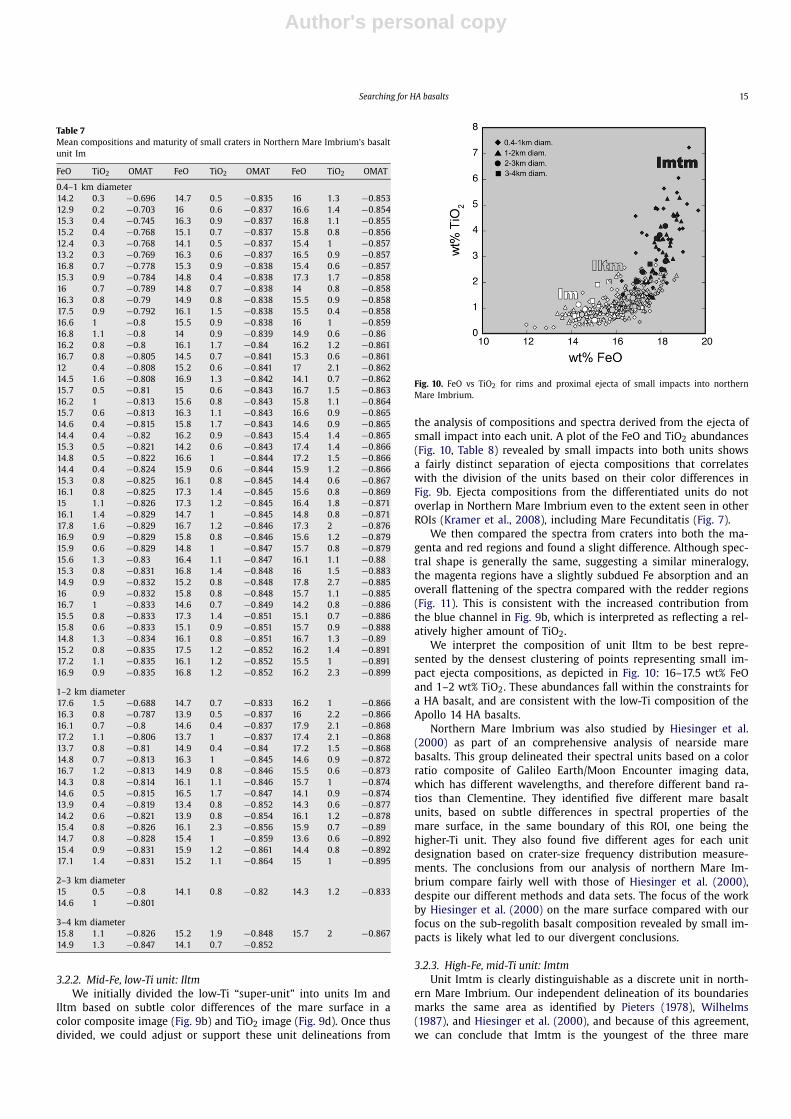
Fig. 10. FeO vs TiO2 for rims and proximal ejecta of small impacts into northernMare Imbrium.
the analysis of compositions and spectra derived from the ejecta ofsmall impact into each unit. A plot of the FeO and TiO2 abundances(Fig. 10, Table 8) revealed by small impacts into both units showsa fairly distinct separation of ejecta compositions that correlateswith the division of the units based on their color differences inFig. 9b. Ejecta compositions from the differentiated units do notoverlap in Northern Mare Imbrium even to the extent seen in otherROIs (Kramer et al., 2008), including Mare Fecunditatis (Fig. 7).
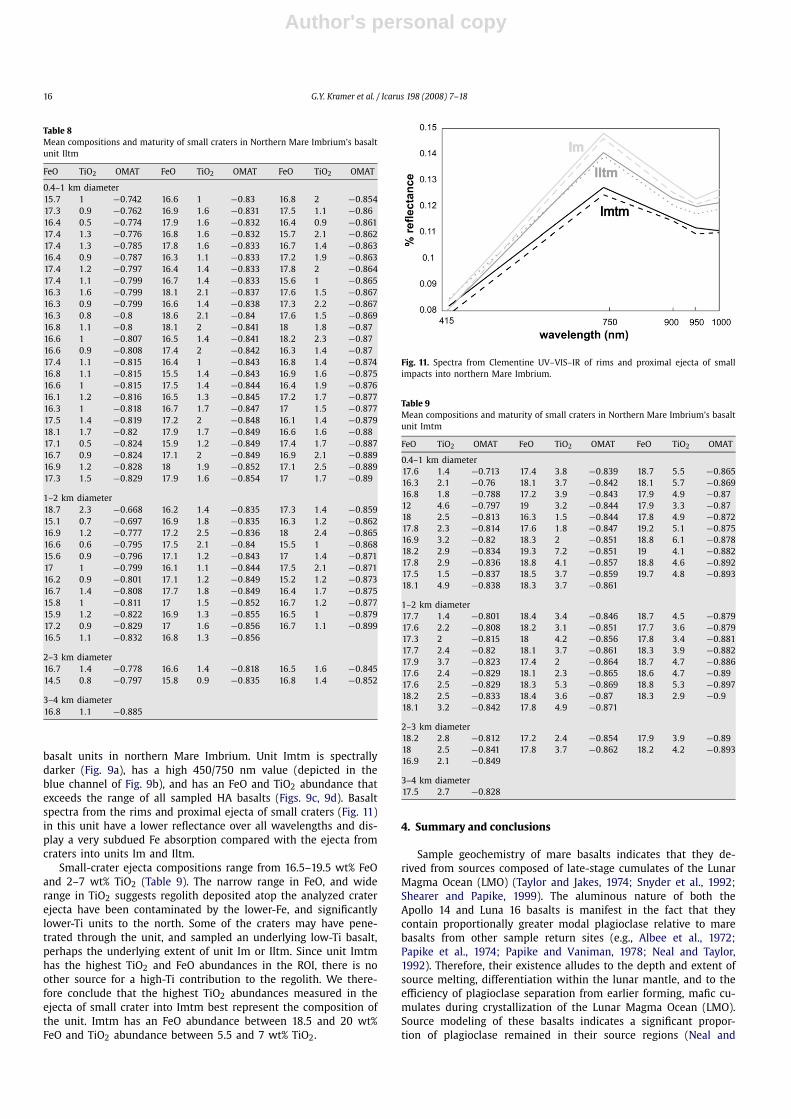
We then compared the spectra from craters into both the ma-genta and red regions and found a slight difference. Although spec-tral shape is generally the same, suggesting a similar mineralogy,the magenta regions have a slightly subdued Fe absorption and anoverall flattening of the spectra compared with the redder regions(Fig. 11). This is consistent with the increased contribution fromthe blue channel in Fig. 9b, which is interpreted as reflecting a rel-atively higher amount of TiO2.
We interpret the composition of unit Iltm to be best repre-sented by the densest clustering of points representing small im-pact ejecta compositions, as depicted in Fig. 10: 16–17.5 wt% FeOand 1–2 wt% TiO2. These abundances fall within the constraints fora HA basalt, and are consistent with the low-Ti composition of theApollo 14 HA basalts.
Northern Mare Imbrium was also studied by Hiesinger et al.(2000) as part of an comprehensive analysis of nearside marebasalts. This group delineated their spectral units based on a colorratio composite of Galileo Earth/Moon Encounter imaging data,which has different wavelengths, and therefore different band ra-tios than Clementine. They identified five different mare basaltunits, based on subtle differences in spectral properties of themare surface, in the same boundary of this ROI, one being thehigher-Ti unit. They also found five different ages for each unitdesignation based on crater-size frequency distribution measure-ments. The conclusions from our analysis of northern Mare Im-brium compare fairly well with those of Hiesinger et al. (2000),despite our different methods and data sets. The focus of the workby Hiesinger et al. (2000) on the mare surface compared with ourfocus on the sub-regolith basalt composition revealed by small im-pacts is likely what led to our divergent conclusions.
3.2.3. High-Fe, mid-Ti unit: ImtmUnit Imtm is clearly distinguishable as a discrete unit in north-
ern Mare Imbrium. Our independent delineation of its boundariesmarks the same area as identified by Pieters (1978), Wilhelms(1987), and Hiesinger et al. (2000), and because of this agreement,we can conclude that Imtm is the youngest of the three mare
Author's personal copy
16 G.Y. Kramer et al. / Icarus 198 (2008) 7–18
Table 8Mean compositions and maturity of small craters in Northern Mare Imbrium’s basaltunit Iltm
FeO TiO2 OMAT FeO TiO2 OMAT FeO TiO2 OMAT
0.4–1 km diameter15.7 1 −0.742 16.6 1 −0.83 16.8 2 −0.85417.3 0.9 −0.762 16.9 1.6 −0.831 17.5 1.1 −0.8616.4 0.5 −0.774 17.9 1.6 −0.832 16.4 0.9 −0.86117.4 1.3 −0.776 16.8 1.6 −0.832 15.7 2.1 −0.86217.4 1.3 −0.785 17.8 1.6 −0.833 16.7 1.4 −0.86316.4 0.9 −0.787 16.3 1.1 −0.833 17.2 1.9 −0.86317.4 1.2 −0.797 16.4 1.4 −0.833 17.8 2 −0.86417.4 1.1 −0.799 16.7 1.4 −0.833 15.6 1 −0.86516.3 1.6 −0.799 18.1 2.1 −0.837 17.6 1.5 −0.86716.3 0.9 −0.799 16.6 1.4 −0.838 17.3 2.2 −0.86716.3 0.8 −0.8 18.6 2.1 −0.84 17.6 1.5 −0.86916.8 1.1 −0.8 18.1 2 −0.841 18 1.8 −0.8716.6 1 −0.807 16.5 1.4 −0.841 18.2 2.3 −0.8716.6 0.9 −0.808 17.4 2 −0.842 16.3 1.4 −0.8717.4 1.1 −0.815 16.4 1 −0.843 16.8 1.4 −0.87416.8 1.1 −0.815 15.5 1.4 −0.843 16.9 1.6 −0.87516.6 1 −0.815 17.5 1.4 −0.844 16.4 1.9 −0.87616.1 1.2 −0.816 16.5 1.3 −0.845 17.2 1.7 −0.87716.3 1 −0.818 16.7 1.7 −0.847 17 1.5 −0.87717.5 1.4 −0.819 17.2 2 −0.848 16.1 1.4 −0.87918.1 1.7 −0.82 17.9 1.7 −0.849 16.6 1.6 −0.8817.1 0.5 −0.824 15.9 1.2 −0.849 17.4 1.7 −0.88716.7 0.9 −0.824 17.1 2 −0.849 16.9 2.1 −0.88916.9 1.2 −0.828 18 1.9 −0.852 17.1 2.5 −0.88917.3 1.5 −0.829 17.9 1.6 −0.854 17 1.7 −0.89
1–2 km diameter18.7 2.3 −0.668 16.2 1.4 −0.835 17.3 1.4 −0.85915.1 0.7 −0.697 16.9 1.8 −0.835 16.3 1.2 −0.86216.9 1.2 −0.777 17.2 2.5 −0.836 18 2.4 −0.86516.6 0.6 −0.795 17.5 2.1 −0.84 15.5 1 −0.86815.6 0.9 −0.796 17.1 1.2 −0.843 17 1.4 −0.87117 1 −0.799 16.1 1.1 −0.844 17.5 2.1 −0.87116.2 0.9 −0.801 17.1 1.2 −0.849 15.2 1.2 −0.87316.7 1.4 −0.808 17.7 1.8 −0.849 16.4 1.7 −0.87515.8 1 −0.811 17 1.5 −0.852 16.7 1.2 −0.87715.9 1.2 −0.822 16.9 1.3 −0.855 16.5 1 −0.87917.2 0.9 −0.829 17 1.6 −0.856 16.7 1.1 −0.89916.5 1.1 −0.832 16.8 1.3 −0.856
2–3 km diameter16.7 1.4 −0.778 16.6 1.4 −0.818 16.5 1.6 −0.84514.5 0.8 −0.797 15.8 0.9 −0.835 16.8 1.4 −0.852
3–4 km diameter16.8 1.1 −0.885
basalt units in northern Mare Imbrium. Unit Imtm is spectrallydarker (Fig. 9a), has a high 450/750 nm value (depicted in theblue channel of Fig. 9b), and has an FeO and TiO2 abundance thatexceeds the range of all sampled HA basalts (Figs. 9c, 9d). Basaltspectra from the rims and proximal ejecta of small craters (Fig. 11)in this unit have a lower reflectance over all wavelengths and dis-play a very subdued Fe absorption compared with the ejecta fromcraters into units Im and Iltm.
Small-crater ejecta compositions range from 16.5–19.5 wt% FeOand 2–7 wt% TiO2 (Table 9). The narrow range in FeO, and widerange in TiO2 suggests regolith deposited atop the analyzed craterejecta have been contaminated by the lower-Fe, and significantlylower-Ti units to the north. Some of the craters may have pene-trated through the unit, and sampled an underlying low-Ti basalt,perhaps the underlying extent of unit Im or Iltm. Since unit Imtmhas the highest TiO2 and FeO abundances in the ROI, there is noother source for a high-Ti contribution to the regolith. We there-fore conclude that the highest TiO2 abundances measured in theejecta of small crater into Imtm best represent the composition ofthe unit. Imtm has an FeO abundance between 18.5 and 20 wt%FeO and TiO2 abundance between 5.5 and 7 wt% TiO2.
Fig. 11. Spectra from Clementine UV–VIS–IR of rims and proximal ejecta of smallimpacts into northern Mare Imbrium.
Table 9Mean compositions and maturity of small craters in Northern Mare Imbrium’s basaltunit Imtm
FeO TiO2 OMAT FeO TiO2 OMAT FeO TiO2 OMAT
0.4–1 km diameter17.6 1.4 −0.713 17.4 3.8 −0.839 18.7 5.5 −0.86516.3 2.1 −0.76 18.1 3.7 −0.842 18.1 5.7 −0.86916.8 1.8 −0.788 17.2 3.9 −0.843 17.9 4.9 −0.8712 4.6 −0.797 19 3.2 −0.844 17.9 3.3 −0.8718 2.5 −0.813 16.3 1.5 −0.844 17.8 4.9 −0.87217.8 2.3 −0.814 17.6 1.8 −0.847 19.2 5.1 −0.87516.9 3.2 −0.82 18.3 2 −0.851 18.8 6.1 −0.87818.2 2.9 −0.834 19.3 7.2 −0.851 19 4.1 −0.88217.8 2.9 −0.836 18.8 4.1 −0.857 18.8 4.6 −0.89217.5 1.5 −0.837 18.5 3.7 −0.859 19.7 4.8 −0.89318.1 4.9 −0.838 18.3 3.7 −0.861
1–2 km diameter17.7 1.4 −0.801 18.4 3.4 −0.846 18.7 4.5 −0.87917.6 2.2 −0.808 18.2 3.1 −0.851 17.7 3.6 −0.87917.3 2 −0.815 18 4.2 −0.856 17.8 3.4 −0.88117.7 2.4 −0.82 18.1 3.7 −0.861 18.3 3.9 −0.88217.9 3.7 −0.823 17.4 2 −0.864 18.7 4.7 −0.88617.6 2.4 −0.829 18.1 2.3 −0.865 18.6 4.7 −0.8917.6 2.5 −0.829 18.3 5.3 −0.869 18.8 5.3 −0.89718.2 2.5 −0.833 18.4 3.6 −0.87 18.3 2.9 −0.918.1 3.2 −0.842 17.8 4.9 −0.871
2–3 km diameter18.2 2.8 −0.812 17.2 2.4 −0.854 17.9 3.9 −0.8918 2.5 −0.841 17.8 3.7 −0.862 18.2 4.2 −0.89316.9 2.1 −0.849
3–4 km diameter17.5 2.7 −0.828
4. Summary and conclusions
Sample geochemistry of mare basalts indicates that they de-rived from sources composed of late-stage cumulates of the LunarMagma Ocean (LMO) (Taylor and Jakes, 1974; Snyder et al., 1992;Shearer and Papike, 1999). The aluminous nature of both theApollo 14 and Luna 16 basalts is manifest in the fact that theycontain proportionally greater modal plagioclase relative to marebasalts from other sample return sites (e.g., Albee et al., 1972;Papike et al., 1974; Papike and Vaniman, 1978; Neal and Taylor,1992). Therefore, their existence alludes to the depth and extent ofsource melting, differentiation within the lunar mantle, and to theefficiency of plagioclase separation from earlier forming, mafic cu-mulates during crystallization of the Lunar Magma Ocean (LMO).Source modeling of these basalts indicates a significant propor-tion of plagioclase remained in their source regions (Neal and
Author's personal copy
Searching for HA basalts 17
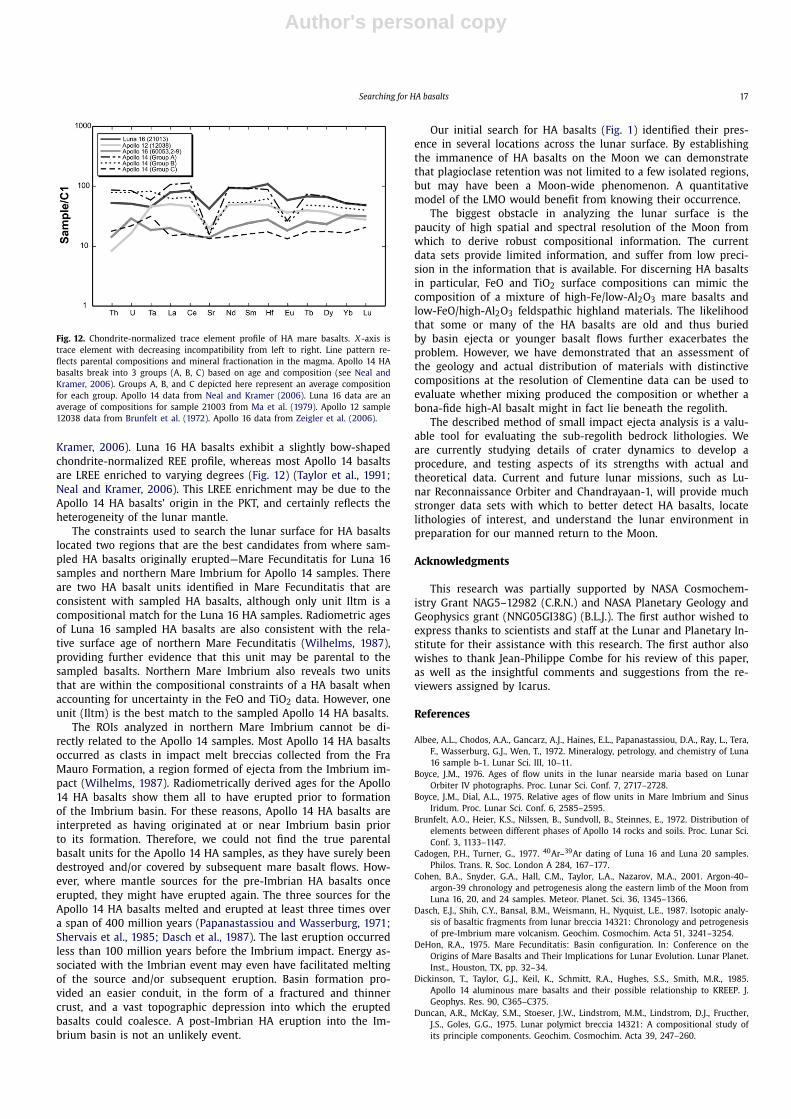
Fig. 12. Chondrite-normalized trace element profile of HA mare basalts. X-axis istrace element with decreasing incompatibility from left to right. Line pattern re-flects parental compositions and mineral fractionation in the magma. Apollo 14 HAbasalts break into 3 groups (A, B, C) based on age and composition (see Neal andKramer, 2006). Groups A, B, and C depicted here represent an average compositionfor each group. Apollo 14 data from Neal and Kramer (2006). Luna 16 data are anaverage of compositions for sample 21003 from Ma et al. (1979). Apollo 12 sample12038 data from Brunfelt et al. (1972). Apollo 16 data from Zeigler et al. (2006).
Kramer, 2006). Luna 16 HA basalts exhibit a slightly bow-shapedchondrite-normalized REE profile, whereas most Apollo 14 basaltsare LREE enriched to varying degrees (Fig. 12) (Taylor et al., 1991;Neal and Kramer, 2006). This LREE enrichment may be due to theApollo 14 HA basalts’ origin in the PKT, and certainly reflects theheterogeneity of the lunar mantle.
The constraints used to search the lunar surface for HA basaltslocated two regions that are the best candidates from where sam-pled HA basalts originally erupted—Mare Fecunditatis for Luna 16samples and northern Mare Imbrium for Apollo 14 samples. Thereare two HA basalt units identified in Mare Fecunditatis that areconsistent with sampled HA basalts, although only unit Iltm is acompositional match for the Luna 16 HA samples. Radiometric agesof Luna 16 sampled HA basalts are also consistent with the rela-tive surface age of northern Mare Fecunditatis (Wilhelms, 1987),providing further evidence that this unit may be parental to thesampled basalts. Northern Mare Imbrium also reveals two unitsthat are within the compositional constraints of a HA basalt whenaccounting for uncertainty in the FeO and TiO2 data. However, oneunit (Iltm) is the best match to the sampled Apollo 14 HA basalts.
The ROIs analyzed in northern Mare Imbrium cannot be di-rectly related to the Apollo 14 samples. Most Apollo 14 HA basaltsoccurred as clasts in impact melt breccias collected from the FraMauro Formation, a region formed of ejecta from the Imbrium im-pact (Wilhelms, 1987). Radiometrically derived ages for the Apollo14 HA basalts show them all to have erupted prior to formationof the Imbrium basin. For these reasons, Apollo 14 HA basalts areinterpreted as having originated at or near Imbrium basin priorto its formation. Therefore, we could not find the true parentalbasalt units for the Apollo 14 HA samples, as they have surely beendestroyed and/or covered by subsequent mare basalt flows. How-ever, where mantle sources for the pre-Imbrian HA basalts onceerupted, they might have erupted again. The three sources for theApollo 14 HA basalts melted and erupted at least three times overa span of 400 million years (Papanastassiou and Wasserburg, 1971;Shervais et al., 1985; Dasch et al., 1987). The last eruption occurredless than 100 million years before the Imbrium impact. Energy as-sociated with the Imbrian event may even have facilitated meltingof the source and/or subsequent eruption. Basin formation pro-vided an easier conduit, in the form of a fractured and thinnercrust, and a vast topographic depression into which the eruptedbasalts could coalesce. A post-Imbrian HA eruption into the Im-brium basin is not an unlikely event.
Our initial search for HA basalts (Fig. 1) identified their pres-ence in several locations across the lunar surface. By establishingthe immanence of HA basalts on the Moon we can demonstratethat plagioclase retention was not limited to a few isolated regions,but may have been a Moon-wide phenomenon. A quantitativemodel of the LMO would benefit from knowing their occurrence.
The biggest obstacle in analyzing the lunar surface is thepaucity of high spatial and spectral resolution of the Moon fromwhich to derive robust compositional information. The currentdata sets provide limited information, and suffer from low preci-sion in the information that is available. For discerning HA basaltsin particular, FeO and TiO2 surface compositions can mimic thecomposition of a mixture of high-Fe/low-Al2O3 mare basalts andlow-FeO/high-Al2O3 feldspathic highland materials. The likelihoodthat some or many of the HA basalts are old and thus buriedby basin ejecta or younger basalt flows further exacerbates theproblem. However, we have demonstrated that an assessment ofthe geology and actual distribution of materials with distinctivecompositions at the resolution of Clementine data can be used toevaluate whether mixing produced the composition or whether abona-fide high-Al basalt might in fact lie beneath the regolith.
The described method of small impact ejecta analysis is a valu-able tool for evaluating the sub-regolith bedrock lithologies. Weare currently studying details of crater dynamics to develop aprocedure, and testing aspects of its strengths with actual andtheoretical data. Current and future lunar missions, such as Lu-nar Reconnaissance Orbiter and Chandrayaan-1, will provide muchstronger data sets with which to better detect HA basalts, locatelithologies of interest, and understand the lunar environment inpreparation for our manned return to the Moon.
Acknowledgments
This research was partially supported by NASA Cosmochem-istry Grant NAG5–12982 (C.R.N.) and NASA Planetary Geology andGeophysics grant (NNG05GI38G) (B.L.J.). The first author wished toexpress thanks to scientists and staff at the Lunar and Planetary In-stitute for their assistance with this research. The first author alsowishes to thank Jean-Philippe Combe for his review of this paper,as well as the insightful comments and suggestions from the re-viewers assigned by Icarus.
References
Albee, A.L., Chodos, A.A., Gancarz, A.J., Haines, E.L., Papanastassiou, D.A., Ray, L., Tera,F., Wasserburg, G.J., Wen, T., 1972. Mineralogy, petrology, and chemistry of Luna16 sample b-1. Lunar Sci. III, 10–11.
Boyce, J.M., 1976. Ages of flow units in the lunar nearside maria based on LunarOrbiter IV photographs. Proc. Lunar Sci. Conf. 7, 2717–2728.
Boyce, J.M., Dial, A.L., 1975. Relative ages of flow units in Mare Imbrium and SinusIridum. Proc. Lunar Sci. Conf. 6, 2585–2595.
Brunfelt, A.O., Heier, K.S., Nilssen, B., Sundvoll, B., Steinnes, E., 1972. Distribution ofelements between different phases of Apollo 14 rocks and soils. Proc. Lunar Sci.Conf. 3, 1133–1147.
Cadogen, P.H., Turner, G., 1977. 40Ar–39Ar dating of Luna 16 and Luna 20 samples.Philos. Trans. R. Soc. London A 284, 167–177.
Cohen, B.A., Snyder, G.A., Hall, C.M., Taylor, L.A., Nazarov, M.A., 2001. Argon-40–argon-39 chronology and petrogenesis along the eastern limb of the Moon fromLuna 16, 20, and 24 samples. Meteor. Planet. Sci. 36, 1345–1366.
Dasch, E.J., Shih, C.Y., Bansal, B.M., Weismann, H., Nyquist, L.E., 1987. Isotopic analy-sis of basaltic fragments from lunar breccia 14321: Chronology and petrogenesisof pre-Imbrium mare volcanism. Geochim. Cosmochim. Acta 51, 3241–3254.
DeHon, R.A., 1975. Mare Fecunditatis: Basin configuration. In: Conference on theOrigins of Mare Basalts and Their Implications for Lunar Evolution. Lunar Planet.Inst., Houston, TX, pp. 32–34.
Dickinson, T., Taylor, G.J., Keil, K., Schmitt, R.A., Hughes, S.S., Smith, M.R., 1985.Apollo 14 aluminous mare basalts and their possible relationship to KREEP. J.Geophys. Res. 90, C365–C375.
Duncan, A.R., McKay, S.M., Stoeser, J.W., Lindstrom, M.M., Lindstrom, D.J., Fructher,J.S., Goles, G.G., 1975. Lunar polymict breccia 14321: A compositional study ofits principle components. Geochim. Cosmochim. Acta 39, 247–260.
Author's personal copy
18 G.Y. Kramer et al. / Icarus 198 (2008) 7–18
Ehmann, W.D., Gillum, D.E., Morgan, J.W., 1972. Oxygen and bulk elemental com-position studies of Apollo 14 and other lunar rocks and soils. Geochim. Cos-mochim. Acta 2, 1149–1160.
El Goresy, A., Taylor, L.A., Ramdohr, P., 1972. Fra Mauro crystalline rocks: Mineral-ogy, geochemistry, and subsolidus reduction of the opaque minerals. Geochim.Cosmochim. Acta 1 (Suppl. 3), 333–349.
Eliason, E.M., 1997. Production of digital image models using the ISIS system. LunarPlanet. Sci. XXVIII, 331–332. Abstract.
Feldman, W.C., Barraclough, B.L., Fuller, K.R., Lawrence, D.J., Maurice, S., Miller, M.C.,Prettyman, T.H., Binder, A.B., 1999. The Lunar Prospector gamma-ray and neu-tron spectrometers. Nucl. Instrum. Methods Phys. Res., Sect. A 422, 562–566.
Fernandes, V.A., Burgess, R., Turner, G., 2000. Laser argon-40–argon-39 age studiesof Dar al Gani 262 meteorite. Meteor. Planet. Sci. 35, 1355–1364.
Finnila, A.B., Hess, P.C., Rutherford, M.J., 1994. Assimilation by lunar mare basalts:Melting of crustal material and dissolution of anorthosite. J. Geophys. Res. 99,14677–14690.
Grieve, R.A.F., McKay, G.A., Weill, D.F., 1972. Microprobe studies of three Luna 16basalt fragments. Earth Planet. Sci. Lett. 13, 233–242.
Grieve, R.A.F., McKay, G.A., Smith, H.D., Weill, D.F., 1975. Lunar polymict breccia14321: A petrographic study. Geochim. Cosmochim. Acta 39, 229–246.
Hagerty, J.J., Shearer, C.K., Papike, J.J., 2005. Trace element characteristics of theApollo 14 high-alumina basalts: Implications for early magmatism on the Moon.Geochim. Cosmochim. Acta 69, 5831–5845.
Hawke, B.R., Gillis, J.J., Giguere, T.A., Blewett, D.T., Lawrence, D.J., Lucey, P.G., Peter-son, C.A., Smith, G.A., Spudis, P.D., Taylor, G.J., 2005a. The earliest mare basalts.Lunar Planet. Sci. XXXVI, 1642. Abstract.
Hawke, B.R., Gillis, J.J., Giguere, T.A., Blewett, D.T., Lawrence, D.J., Lucey, P.G., Smith,G.A., Spudis, P.D., Taylor, G.J., 2005b. Remote sensing and geologic studies ofthe Balmer–Kapteyn region of the Moon. J. Geophys. Res. 110, doi:10.1029/2004JE002383.
Helmke, P.A., Haskin, L.A., 1972. Rare earths and other trace elements in Luna 16soil. Earth Planet. Sci. Lett. 13, 441–443.
Hiesinger, H., Jaumann, R., Neukum, G., Head, J.W., 2000. Ages of mare basalts onthe lunar nearside. J. Geophys. Res. 105 (E12), 29239–29275.
Hubbard, N.J., Gast, P.W., Rhodes, J.M., Bansal, B.M., Weismann, H., 1972a. Nonmarebasalts: Part ii. Proc. Lunar Sci. Conf. 3, 1161–1179.
Hubbard, N.J., Gast, P.W., Rhodes, J.M., Bansal, B.M., Wiesman, H., 1972b. Nonmarebasalts: Part II. Geochim. Cosmochim. Acta 2, 1161–1179.
Hughes, S.S., Neal, C.R., Taylor, L.A., 1990. Petrogenesis of Apollo 14 high alumina(HA) parental basaltic magma. Lunar Planet. Sci. XXI, 540–541. Abstract.
Huneke, J.C., Podosek, F.A., Wasserburg, G.J., 1972. Gas retention and cosmic-rayexposure ages of a basalt fragment from Mare Fecunditatis. Earth Planet. Sci.Lett. 13, 375–383.
Jakes, P., Warner, J., Ridley, W.I., Reid, A.M., Harmon, R.S., Brett, R., Brown, R.W.,1972. Petrology of a portion of the Mare Fecunditatis regolith. Earth Planet. Sci.Lett. 13, 257–271.
Jolliff, B.L., 1999. Clementine UVVIS multispectral data and the Apollo 17 landingsite: What can we tell and how well? J. Geophys. Res. 104 (E6), 14123–14148.
Kramer, G.Y., Neal, C.R., Jolliff, B.L., 2008. Distinguishing high alumina mare basaltsusing Clementine UVVIS and Lunar Prospector GRS data: Mare Moscoviense andMare Nectaris. J. Geophys. Res. 113 (E1), doi:10.1029/2006JE002860.
Kurat, G., Kracher, A., Keil, K., Warner, R., Prinz, M., 1976. Composition and origin ofLuna 16 aluminous mare basalts. Proc. Lunar Sci. Conf. 7, 1301–1321.
Lindstrom, M.M., Duncan, A.R., Fruchter, J.S., McKay, S.M., Stoeser, J.W., Goles, G.G.,Lindstrom, D.J., 1972. Compositional characteristics of some Apollo 14 clasticmaterials. Geochim. Cosmochim. Acta 2, 1201–1214.
Longhi, J., Walker, D., Hays, J., 1972. Petrography and crystallization history of basalts14310 and 14072. Proc. Lunar Sci. Conf. 3, 131–139.
Lucey, P.G., Blewett, D.T., Hawke, B.R., 2000a. Imaging of lunar surface maturity. J.Geophys. Res. 105 (E8), 20377–20386.
Lucey, P.G., Blewett, D.T., Hawke, B.R., 2000b. Lunar iron and titanium abundancealgorithms based on final processing of Clementine ultraviolet–visible images. J.Geophys. Res. 105 (E8), 20297–20305.
Ma, M.S., Schmitt, R.A., Nielsen, R.L., Taylor, G.J., Warner, R.D., Keil, K., 1979. Petro-genesis of Luna 16 aluminous mare basalts. Geophys. Res. Lett. 6, 909–912.
McCord, T.B., Adams, J.B., 1973. Progress in remote optical analysis of lunar surfacecomposition. Moon 7, 453–474.
Melosh, H.J., 1989. Impact Cratering: A Geologic Process. Oxford Univ. Press, NewYork, NY.
Neal, C.R., 2001. Interior of the Moon: The presence of garnet in the primitive deeplunar mantle. J. Geophys. Res. 106, 27865–27885.
Neal, C.R., 2006. Mare basalt database. Supplemental Material to New Views of theMoon. URL: http://www.minsocam.org.
Neal, C.R., Kramer, G.Y., 2006. The petrogenesis of the Apollo 14 high-Al marebasalts. Am. Mineral. 91, 1521–1535.
Neal, C.R., Taylor, L.A., 1989. Metasomatic products of the lunar magma ocean: Therole of KREEP dissemination. Geochim. Cosmochim. Acta 53, 529–541.
Neal, C.R., Taylor, L.A., 1992. Petrogenesis of mare basalts: A record of lunar volcan-ism. Geochim. Cosmochim. Acta 56, 2177–2211.
Neal, C.R., Taylor, L.A., Lindstrom, M.M., 1988. Apollo 14 mare basalt petrogenesis:Assimilation of KREEP-like components by a fractionating magmas. Proc. LunarSci. Conf. 18, 139–153.
Neal, C.R., Taylor, L.A., Patchen, A.D., 1989. High alumina (HA) and very high potas-sium (VHK) basalt clasts from Apollo 14 breccias, part 1: Mineralogy and petrol-ogy: Evidence of crystallization from evolving magmas. Proc. Lunar Sci. Conf. 19,137–145.
Nyquist, L.E., Shih, C.Y., 1992. The isotopic record of lunar volcanism. Geochim. Cos-mochim. Acta 56, 2213–2234.
Nyquist, L.E., Wooden, J.L., Shih, C.Y., Wiesmann, H., Bansal, B.M., 1981. Isotopic andREE studies of lunar basalt 12038: Implications for petrogenesis of aluminousbasalts. Earth Planet. Sci. Lett. 55, 335–355.
Papanastassiou, D.A., Wasserburg, G.A., 1971. Rb–Sr ages of the igneous rocks fromthe Apollo 14 mission and the age of the Fra Mauro formation. Earth Planet. Sci.Lett. 12, 36–48.
Papike, J.J., Vaniman, D.T., 1978. The lunar mare basalt suite. Geophys. Res. Lett. 5(6), 433–436.
Papike, J.J., Bence, A.E., Lindsley, D.H., 1974. Mare basalts from the Taurus–Littrowregion of the Moon. Proc. Lunar Sci. Conf. 5, 471–504.
Pieters, C.M., 1978. Mare basalt types on the front side of the Moon: A summary ofspectral reflectance data. Proc. Lunar Sci. Conf. 9, 2825–2849.
Prettyman, T.H., Feldman, W.C., Lawrence, D.J., McKinney, G.W., Binder, A.B., Elphic,R.C., Gasnault, O.M., Maurice, S., Moore, K.R., 2002. Library least squares analysisof Lunar Prospector gamma-ray spectra. Lunar Planet. Sci. XXXIII, 2012. Abstract.
Rajmon, D., Spudis, P., 2004. Distribution and stratigraphy of basaltic units inmaria Tranquillitatis and Fecunditatis: A Clementine perspective. Meteor. Planet.Sci. 39, 1699–1720.
Reid, A., Jakes, P., 1974. Luna 16 revisited: The case for aluminous mare basalts.Lunar Sci. 13 (2), 627–629. Abstract.
Reid, A., Taylor, G.J., Marvin, U.B.A.W.J., 1972. Luna 16: Relative proportions andpetrologic significance of particles in the soil from Mare Fecunditatis. EarthPlanet. Sci. Lett. 13, 286–298.
Ridley, W.I., 1975. On high-alumina mare basalts. Proc. Lunar Sci. Conf. 6, 131–145.Schultz, P.H., Spudis, P.D., 1979. Evidence for ancient mare volcanism. Proc. Lunar
Sci. Conf. 10, 2899–2918.Shearer, C.K., Papike, J.J., 1999. Magmatic evolution of the Moon. Am. Mineral. 84,
1469–1494.Shervais, J.W., Taylor, L.A., Lindstrom, M.M., 1985. Apollo 14 mare basalts: Petrology
and geochemistry of clasts from consortium breccia 14321. J. Geophys. Res. 90,C375–C395.
Shih, C.Y., Nyquist, L.E., 1989a. Isotopic and chemical constraints on models of alu-minous mare basalts genesis. Lunar Planet. Sci. XX, 1002–1003. Abstract.
Shih, C.Y., Nyquist, L.E., 1989b. Isotopic constraints on the petrogenesis of Apollo 14igneous rocks. In: Taylor, G.J., Warren, P.H. (Eds.), Workshop on Moon in Transi-tion: Apollo 14, KREEP, and Evolved Lunar Rocks, vol. 89-03. Lunar Planet. Inst.,Houston, TX, pp. 128–136.
Snyder, G.A., Taylor, L.A., Neal, C.R., 1992. A chemical model for generating thesources of mare basalts: Combined equilibrium and fractional crystallization ofthe lunar magmasphere. Geochim. Cosmochim. Acta 56, 3809–3823.
Snyder, G.A., Borg, L.E., Nyquist, L.E., Taylor, L.A., 2000. Chronology and isotopic con-straints on lunar evolution. In: Canup, R.M., Righter, K. (Eds.), Origin of Earthand Moon. Lunar Planet. Inst., Houston, pp. 361–395.
Staid, M.I., Pieters, C.M., 2000. Integrated spectral analysis of mare soils and craters:Application to eastern nearside basalts. Icarus 145, 122–139.
Strasheim, A., Jackson, P.F.S., Coetzee, J.H.J., Strelow, F.W.E., Wybenga, F.T., Gricius,A.J., Kokot, M.L., Scott, R.H., 1972. Analysis of lunar samples 14163, 14259, and14321 with isotopic data for 7Li/6Li. Geochim. Cosmochim. Acta 2, 1337–1342.
Taylor, G.J., Warren, P., Ryder, G., Delano, J., Pieters, C., Lofgren, G., 1991. Lunar rocks.In: Heiken, G.H., Vaniman, D.T., French, B.M. (Eds.), Lunar Sourcebook. Cam-bridge Univ. Press, New York, pp. 183–284.
Taylor, L.A., Shervais, J.W., Hunter, R.B., Shih, C.Y., Bansal, B.M., Wooden, J., Nyquist,L.E., Laul, L.C., 1983. Pre-4.2 AE mare basalt volcanism in the lunar highlands.Earth Planet. Sci. Lett. 66, 33–47.
Taylor, S.R., Jakes, P., 1974. The geochemical evolution of the Moon. Proc. Lunar Sci.Conf. 5, 1287–1305.
Taylor, S.R., Kaye, M., Muir, P., Nance, W., Rudowski, R., Ware, N., 1972. Compositionof the lunar uplands: Chemistry of Apollo 14 samples from Fra Mauro. Proc.Lunar Sci. Conf. 3, 1231–1249.
Vinogradov, A.P., 1971. Preliminary data on lunar ground brought to Earth by auto-matic probe “Luna-16”. Proc. Lunar Sci. Conf. 2, 1–16.
Warren, P.H., Kallemeyn, G.W., Kyte, F.T., 1997. Siderophile element evidence indi-cates that Apollo 14 high-Al mare basalts are not impact melts. Lunar Planet.Sci. XXVIII, 1501–1502. Abstract.
Wilcox, B.B., Lucey, P.G., Gillis, J.J., 2005. Mapping iron in the lunar mare: An im-proved approach. J. Geophys. Res. 110 (E11), doi:10.1029/2005JE002512.
Wilhelms, D., 1987. The Geologic History of the Moon. U.S. Geological Survey Pro-fessional Paper 1348. U.S. Geological Survey, Washington, DC.
Zeigler, R.A., Korotev, R.L., Haskin, L.A., Jolliff, B.L., Gillis, J.J., 2006. Petrography andgeochemistry of five new Apollo 16 mare basalts and evidence for post-basindeposition of basaltic material at the site. Meteor. Planet. Sci. 41 (2), 263–284.